Mooring Line Reliability Analysis of Single Point Mooring ...

General rights Copyright and moral rights for the publications made accessible in the public portal are retained by the authors and/or other copyright owners and it is a condition of accessing publications that users recognise and abide by the legal requirements associated with these rights.
• Users may download and print one copy of any publication from the public portal for the purpose of private study or research. • You may not further distribute the material or use it for any profit-making activity or commercial gain • You may freely distribute the URL identifying the publication in the public portal
If you believe that this document breaches copyright please contact us providing details, and we will remove access to the work immediately and investigate your claim.
Downloaded from orbit.dtu.dk on: Jun 13, 2018
Detailed and reduced models of dynamic mooring system
Hansen, Anders Melchior; Kallesøe, Bjarne Skovmose
Published in:Presentations from the Aeroelastic Workshop – latest results from AeroOpt
Publication date:2011
Document VersionPublisher's PDF, also known as Version of record
Link back to DTU Orbit
Citation (APA):Hansen, A. M., & Kallesøe, B. S. (2011). Detailed and reduced models of dynamic mooring system. In M. H.Hansen (Ed.), Presentations from the Aeroelastic Workshop – latest results from AeroOpt Roskilde: DanmarksTekniske Universitet, Risø Nationallaboratoriet for Bæredygtig Energi. (Denmark. Forskningscenter Risoe.Risoe-R; No. 1796(EN)).
Ris
ø-R
-Rep
ort
Presentations from Aeroelastic Workshop 2 – latest results from AeroOpt
Morten Hartvig Hansen (Ed.) Risø-R-1796(EN) October 2011

Author: Morten Hartvig Hansen (Ed.)Title: Presentations from the Aeroelastic Workshop – latest results from AeroOpt Division: Wind Energy Division
Risø-R-1796(EN) October 2011
Abstract (max. 2000 char.):
This report contains the sl ides of th e presentations at the Aeroelastic Workshop held at Risø-DTU for the wind energy industry in Denmark on October 27, 2011. The scientific part of the agenda at this workshop was
• Detailed and reduced models of dy namic mooring system (Anders M. Hansen)
• Bend-twist coupling investigation in HAWC2 (Taeseong Kim)
• Q3UIC – A new aerodynamic airfoil to ol including rotational effects (Néstor R. García)
• Influence of up-scaling on loads, control and aerodynamic modeling (Helge Aa. Madsen)
• Aerodynamic damping of lateral tower vibrations (Bjarne S. Kallesøe)
• Open- and closed-loop aeroservoelastic analysis with HAWCStab2 (Morten H. Hansen)
• Design and test of a th ick, flatback, high-lift multi-element airfoil (Frederik Zahle)
The presented results are mainly obtained in the EUDP project “Aeroelastic Optimization of MW Wind Turbines (AeroOpt)” funded under contract no. 63011-0190.
ISSN 0106-2840 ISBN 978-87-550-3940-7
Contract no.: EUDP 63011-0190 Group's own reg. no.: 1110073
Sponsorship:
Cover :
Pages:192Tables: - References: -
Information Service Department Risø National Laboratory for Sustainable Energy Technical University of Denmark P.O.Box 49 DK-4000 Roskilde Denmark Telephone +45 46774005 [email protected] Fax +45 46774013 www.risoe.dtu.dk

Contents
Preface 4
1 Dynamic mooring systems 5
2 Bend-twist coupling investigation 20
3 Q3UIC – A new aerodynamic airfoil tool 43
4 Influence of up-scaling 68
5 Aerodynamic damping of tower vibrations 89
6 Closed-loop aeroservoelastic analysis 100
7 Thick, flatback, high-lift multi-element airfoil 115
Risø-R-1796(EN) 3

Preface This report contains the slides of the pres entations at the Aeroelastic Workshop held at Risø-DTU for the wind energy industry in Denmark on October 27, 2011. The scientific part of the agenda at this workshop was
• Detailed and reduced models of dynamic mooring system (Anders M. Hansen)
• Bend-twist coupling investigation in HAWC2 (Taeseong Kim)
• Q3UIC – A new aerodynamic airfoil tool including rotational effects (Néstor R. García)
• Influence of up-scaling on loads, control and aerodynamic modeling (Helge Aa. Madsen)
• Aerodynamic damping of lateral tower vibrations (Bjarne S. Kallesøe)
• Open- and closed-loop aeroservoelastic analysis with HAWCStab2 (Morten H. Hansen)
• Design and test of a t hick, flatback, high-lift multi-element airfoil (Frederik Zahle)
The presented results are mainly obtained in the EUDP proje ct “Aeroelastic Optimization of MW Wind Turbines (AeroOpt)” funded under contract no. 63011-0190.
4 Risø-R-1796(EN)

Risø-R-1796(EN) 5
1 Dynamic mooring systems

Detailed and reduced models of dynamic mooring systemAnders M. Hansen and Bjarne S. Kallesøe

27/10/2011Detailed and reduced models of dynamic mooring system2 Risø DTU, Technical University of Denmark
Outline• Introduction• Full dynamic mooring model• Load implications of using full
model compared to existing QS on floating WT.
• Method to extract reduced ODE model.
• What’s in it for You!
From: http://www.statoil.com/en/NewsAndMedia/News/2008/Downloads/StatoilHydro%20Hywind%20English%20presentation.pdf

27/10/2011Detailed and reduced models of dynamic mooring system3 Risø DTU, Technical University of Denmark
Full dynamic model• Element outline
– Elastic bar, 3 DOFs/node– External forces from
• Gravity• Buoyancy• Added mass• Damping (quadratic).
– Non-linear node springs/dampers model bottom contact.
• Discrete mass/buoyancy element• Constraints to couple it all
together• Implemented in external DLL
HAWC2 format• Wave/current forces missing

27/10/2011Detailed and reduced models of dynamic mooring system4 Risø DTU, Technical University of Denmark
Line Animation

27/10/2011Detailed and reduced models of dynamic mooring system5 Risø DTU, Technical University of Denmark
Load implications of using dynamic model compared to existing QS on floating WT.
• Compare extreme and fatigue loads for 3 different model complexities:
– Q-S: Quasi-static model.– M1: Dynamic without delta lines.– M2: Dynamic with delta lines.
• Normal operation.• 5 to 23 m/s in 2 m/s steps.
5
Delta lines
Turbine floatM1
M2
•1200 seconds simulations, skip first 300 seconds for transients
•6 different seeds for wind and waves for each wind speed.

27/10/2011Detailed and reduced models of dynamic mooring system6 Risø DTU, Technical University of Denmark
Blade Loads
6
Extreme Fatigue
All loads are normalized with respect to the quasi-static result.

27/10/2011Detailed and reduced models of dynamic mooring system7 Risø DTU, Technical University of Denmark
Tower Loads
7
Extreme Fatigue
All loads are normalized with respect to the quasi-static result.

27/10/2011Detailed and reduced models of dynamic mooring system8 Risø DTU, Technical University of Denmark
Reduction method
• What does it do and how/where can the result be used– Reduces (and linearises) the full model (with many DOFs) to a set of
ODEs (with few DOFs), capturing only frequency response up to a user specified threshold. The ODEs can be used in, e.g.
• Modal based methods, e.g. HAWCStab2• Distribution to external parties• Simulation models, e.g. HAWC2
0 200 400 600 800 1000 1200 1400 1600 1800 2000-1
-0.5
0
0.5
1Non-dim displacement of interface point
0 200 400 600 800 1000 1200 1400 1600 1800 2000-1
-0.5
0
0.5
1Non-dim force at interface point

27/10/2011Detailed and reduced models of dynamic mooring system9 Risø DTU, Technical University of Denmark
0 200 400 600 800 1000 1200 1400 1600 1800 2000-1
-0.5
0
0.5
1Non-dim displacement of interface point
0 200 400 600 800 1000 1200 1400 1600 1800 2000-1
-0.5
0
0.5
1Non-dim force at interface point
Input/output relation derived from HAWC2 simulations
Mooring model in HAWC2

27/10/2011Detailed and reduced models of dynamic mooring system10 Risø DTU, Technical University of Denmark
Step 0: Target FRF estimated directly from input/output relation.
0 0.05 0.1 0.15 0.2 0.25 0.3 0.35 0.4 0.45 0.510
-4
10-2
100
102
104
Amplitude of displacement/force transfer function
freq/sample freq.
Non
-dim
for
ce a
mpl
itude
[-]
Raw data
0 0.05 0.1 0.15 0.2 0.25 0.3 0.35 0.4 0.45 0.5-300
-200
-100
0
100Phase of displacement/force transfer function
freq/sample freq.
phas
e [d
eg]
Raw data
0 200 400 600 800 1000 1200 1400 1600 1800 2000-1
-0.5
0
0.5
1Non-dim displacement of interface point
0 200 400 600 800 1000 1200 1400 1600 1800 2000-1
-0.5
0
0.5
1Non-dim force at interface point
0 200 400 600 800 1000 1200 1400 1600 1800 2000-1
-0.5
0
0.5
1Non-dim displacement of interface point
0 200 400 600 800 1000 1200 1400 1600 1800 2000-1
-0.5
0
0.5
1Non-dim force at interface point
Impulse response function estimated by least square + FFT
QS-response
QS-response

27/10/2011Detailed and reduced models of dynamic mooring system11 Risø DTU, Technical University of Denmark
Step 1: ID of discrete state space model based on input/output relation.
0 0.05 0.1 0.15 0.2 0.25 0.3 0.35 0.4 0.45 0.5
10-2
100
102
Amplitude of displacement/force transfer function
freq/sample freq.
Non
-dim
for
ce a
mpl
itude
[-]
0 0.05 0.1 0.15 0.2 0.25 0.3 0.35 0.4 0.45 0.5-300
-200
-100
0
100Phase of displacement/force transfer function
freq/sample freq.
phas
e [d
eg]
Raw dataDiscrete model
Raw dataDiscrete model
0 200 400 600 800 1000 1200 1400 1600 1800 2000-1
-0.5
0
0.5
1Non-dim displacement of interface point
0 200 400 600 800 1000 1200 1400 1600 1800 2000-1
-0.5
0
0.5
1Non-dim force at interface point
MATLAB, n4sid

27/10/2011Detailed and reduced models of dynamic mooring system12 Risø DTU, Technical University of Denmark
Step 2: Conversion from discrete state space to continous time.
0 0.05 0.1 0.15 0.2 0.25 0.3 0.35 0.4 0.45 0.5
10-2
100
102
Amplitude of displacement/force transfer function
freq/sample freq.
Non
-dim
for
ce a
mpl
itude
[-]
0 0.05 0.1 0.15 0.2 0.25 0.3 0.35 0.4 0.45 0.5-300
-200
-100
0
100
200Phase of displacement/force transfer function
freq/sample freq.
phas
e [d
eg]
Raw dataDiscrete modelContiuous model
Raw dataDiscrete modelContiuous model
MATLAB, d2c

27/10/2011Detailed and reduced models of dynamic mooring system13 Risø DTU, Technical University of Denmark
Step 3: Modal reduction of NOF states AND similarity transformation – Final form!
0 0.05 0.1 0.15 0.2 0.25 0.3 0.35 0.4 0.45 0.5
10-2
100
102
Amplitude of displacement/force transfer function
freq/sample freq.
Non
-dim
for
ce a
mpl
itude
[-]
0 0.05 0.1 0.15 0.2 0.25 0.3 0.35 0.4 0.45 0.5-300
-200
-100
0
100
200Phase of displacement/force transfer function
freq/sample freq.
phas
e [d
eg]
Raw dataDiscrete modelContiuous modelContinuous, Reduced model
Raw dataDiscrete modelContiuous modelContinuous reduced model
;MAGIC

27/10/2011Detailed and reduced models of dynamic mooring system14 Risø DTU, Technical University of Denmark
So, What’s in it for You ! • The external mooring system DLL will be included in the HAWC2
distribution asap. Source code distribution is still an open issue.• The reduction method (MATLAB m-file) can be forwarded on request –
send an email to [email protected]• The reduction method is general and can be used for other systems than
mooring systems – component models based on experiments, perhaps!?• We can offer to make reduced models on commercial basis.

2 Bend-twist coupling investigation
20 Risø-R-1796(EN)

A New Beam Element in HAWC2 for Investigating Blade Bending-Twist CouplingEffects
Taeseong Kim

Risø DTU, Technical University of DenmarkRisø DTU, Technical University of Denmark
Introduction• All of composite blades have anisotropic material properties due to
different layup angles. • It introduces addtional bending-bending and bending-twist couplings.
27-Otc-2011Aeroelastic Workshop2/22
0deg layup angle
12
45
11
22
33
44
55
6
45
6
12 0
0
x x
y y
z z
x x
x y
x z
F SF SF SM S
S S
MM
S SS
S
εεεκκκ
⎧ ⎫ ⎡ ⎤ ⎧ ⎫⎪ ⎪ ⎢ ⎥ ⎪ ⎪⎪ ⎪ ⎢ ⎥ ⎪ ⎪⎪ ⎪ ⎢ ⎥ ⎪ ⎪⎪ ⎪ ⎪ ⎪= ⎢ ⎥⎨ ⎬ ⎨ ⎬
⎢ ⎥⎪ ⎪ ⎪ ⎪⎢ ⎥⎪ ⎪ ⎪ ⎪⎢ ⎥⎪ ⎪ ⎪ ⎪⎢ ⎥ ⎪ ⎪⎪
− =
−
⎭⎩ ⎭ ⎣
=
⎪ ⎩⎦
11
22
33
44
55
66
x x
y y
z z
x x
x y
x z
F SF SF SM SM SM S
εεεκκκ
⎧ ⎫ ⎡ ⎤ ⎧ ⎫⎪ ⎪ ⎢ ⎥ ⎪ ⎪⎪ ⎪ ⎢ ⎥ ⎪ ⎪⎪ ⎪ ⎢ ⎥ ⎪ ⎪⎪ ⎪ ⎪ ⎪= ⎢ ⎥⎨ ⎬ ⎨ ⎬
⎢ ⎥⎪ ⎪ ⎪ ⎪⎢ ⎥⎪ ⎪ ⎪ ⎪⎢ ⎥⎪ ⎪ ⎪ ⎪⎢ ⎥ ⎪ ⎪⎪ ⎪ ⎩ ⎭⎩ ⎭ ⎣ ⎦
±45deg layup angle

Risø DTU, Technical University of DenmarkRisø DTU, Technical University of Denmark
Couplings
27-Otc-2011Aeroelastic Workshop3/22
• A classical Timoshenko beam model (HAWC2) • Geometric couplings
• The offset between elastic axis and shear center• Sweep blade
Geometric coupling
Structural coupling

Risø DTU, Technical University of DenmarkRisø DTU, Technical University of Denmark
Objective & Method• Objective
• Developing a new beam element which can consider anisotropiccharacteristics
• Implementing a new beam model into HAWC2 • Investigating an effect of a structural coupling
• Method• General FEM approach• 2 nodes element, higher order of the polynomial shape function• Importing a cross-sectional stiffness and a mass information
Aeroelastic Workshop 27-Otc-20114/22

Risø DTU, Technical University of DenmarkRisø DTU, Technical University of Denmark
New structural format• New structural format (-st file format) is introduced for HAWC2 analysis
• Old format
• New format
• Where Exx represents the sectional stiffness matrix element
Aeroelastic Workshop 27-Otc-20115/22

Risø DTU, Technical University of DenmarkRisø DTU, Technical University of Denmark
Results (Case 1)• Case 1: Blasques et al (2011)
• [0°]T Solid square cross section with an arbitrary material
• Purpose: validating whether the new beam model is correctlyimplemented into HAWC2 or not
Aeroelastic Workshop 27-Otc-20116/22

Risø DTU, Technical University of DenmarkRisø DTU, Technical University of Denmark
• Results are exactly identical.
Mode New beam element [Hz] HAWC2 [Hz]
1 2.87262×10⁻³ 2.87262×10⁻³
2 2.87262×10⁻³ 2.87262×10⁻³
3 1.80466×10⁻² 1.80466×10⁻²
4 1.80466×10⁻² 1.80466×10⁻²
5 5.09409×10⁻² 5.09409×10⁻²
6 5.09409×10⁻² 5.09409×10⁻²
Comparisons of the natural frequencies(Case 1)
Aeroelastic Workshop 27-Otc-20117/22

Risø DTU, Technical University of DenmarkRisø DTU, Technical University of Denmark
Results (Case 2)• 5MW RWT• Natural frequency comparisons
• The new data format is obtained from the original structural data.• E11 = kxGA, E22 = kyGA, E33 = EA, …
• Small discrepancies occur due to data converting process.
Aeroelastic Workshop 27-Otc-20118/22

Risø DTU, Technical University of DenmarkRisø DTU, Technical University of Denmark
Results (Case 3)• Objective
• To check a load reduction potential with whole turbine configurationby considering the structural couplings
• 5MW RWT
• Assumptions• Coupling effects are arbitrarily assigned (No real layup angles)• Other stiffness values, diagonal terms, are kept its own values while
coupling effects are assigned.• Same amount of couplings along the blade span• Only flapwise bending – twist coupling is newly added.• Nothing changes !!
• Considered wind speed: 7 m/s
• Wind shear, Turbulence (TI: 0.217), Tower shadow
Aeroelastic Workshop 27-Otc-20119/22

Risø DTU, Technical University of DenmarkRisø DTU, Technical University of Denmark
Results (Case 3)• Producing bending-twist coupling
• Coupling value
Ref.: Lobitz and Veers, ”Aeroelastic Behavior of Twist-Coupled HAWC Blades,” AIAA-98-0029
• Example
1 1BT fE EI GJα α= − ⟨ ⟨
11
22
33
55
0 0 0 0 00 0 0 0 00 0 0 0 0
0 0 0 0
0 0 0 0 0
0 0 0 0
f f
f
EE
E
EI EI GJ
E
EI GJ GJ
α
α
⎡ ⎤⎢ ⎥⎢ ⎥⎢ ⎥⎢ ⎥⎢ ⎥⎢ ⎥⎢ ⎥⎢ ⎥⎣ ⎦
Aeroelastic Workshop 27-Otc-201110/22

Risø DTU, Technical University of DenmarkRisø DTU, Technical University of Denmark
Results (Case 3)• Two examples (1st example case)
• α=-0.05: 1 m flapwise bending (toward tower) results in approximately 0.3deg twist (toward feather) at the blade tip
• Static analysis with only a blade (cantilevered beam)
10-Otc.-2011Monday Meeting11/22

Risø DTU, Technical University of DenmarkRisø DTU, Technical University of Denmark
Results (Case 3)• Two examples (2nd example case)
• α=-0.17: 1 m flapwise bending results in approximately 1deg twist at the blade tip
10-Otc.-2011Monday Meeting12/22

Risø DTU, Technical University of DenmarkRisø DTU, Technical University of Denmark
Results (Case 3)• Blade equivalent fatigue loads comparison (flapwise and edgewise fatigue
loads)• Blue: -0.3deg coupling case• Red: -1 deg coupling case
Aeroelastic Workshop 27-Otc-201113/22

Risø DTU, Technical University of DenmarkRisø DTU, Technical University of Denmark
Results (Case 3)• Blade torsional equivalent fatigue load measured from non-pitching axis
and blade maximum tip deflection comparisons• Blue: -0.3deg coupling case• Red: -1 deg coupling case
Aeroelastic Workshop 27-Otc-201114/22

Risø DTU, Technical University of DenmarkRisø DTU, Technical University of Denmark
Results (Case 3)• Mechanical power (mean value) comparisons
• Blue: -0.3deg coupling case• Red: -1 deg coupling case
Aeroelastic Workshop 27-Otc-201115/22
Risø DTU, Technical University of DenmarkRisø DTU, Technical University of Denmark
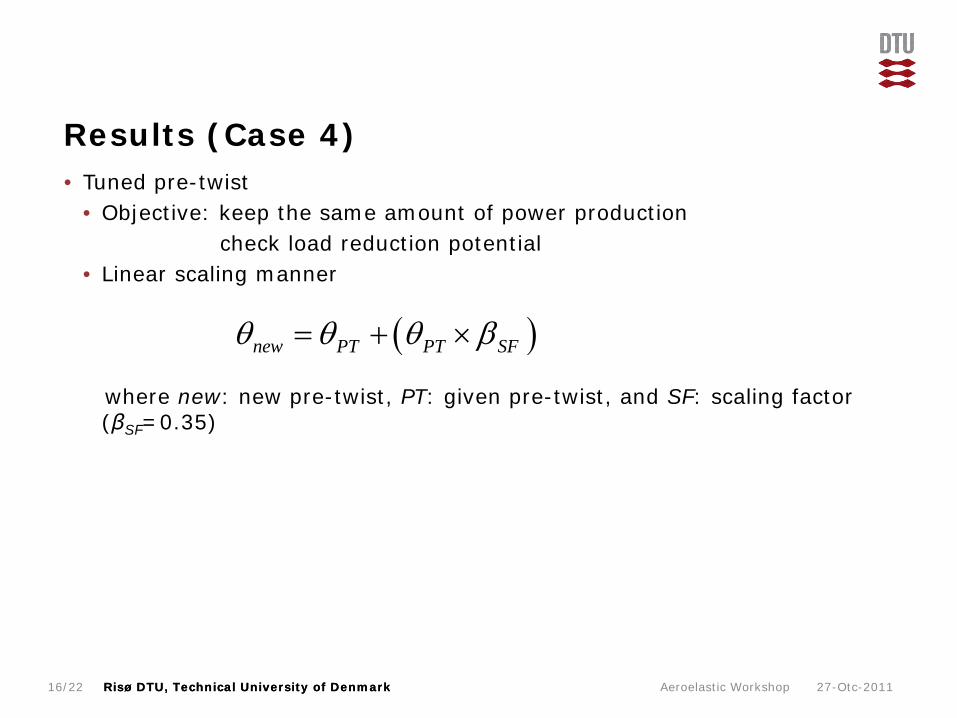
Results (Case 4)• Tuned pre-twist
• Objective: keep the same amount of power productioncheck load reduction potential
• Linear scaling manner
where new: new pre-twist, PT: given pre-twist, and SF: scaling factor (βSF=0.35)
( )new PT PT SFθ θ θ β= + ×
Aeroelastic Workshop 27-Otc-201116/22

Risø DTU, Technical University of DenmarkRisø DTU, Technical University of Denmark
Results (Case 4)• Tuned pre-twist
Monday Meeting
0 10 20 30 40 50 60−14
−12
−10
−8
−6
−4
−2
0
Blade length(m)
Tw
ist
ang
le(d
eg)
Pre−twist distributions
BaselineTuned
Aeroelastic Workshop 27-Otc-201117/22

Risø DTU, Technical University of DenmarkRisø DTU, Technical University of Denmark
Results (Case 4)• Mechanical power (mean value) comparisons
• Blue: -0.3deg coupling case• Red: -1 deg coupling case before tuned• Green: -1 deg coupling case after tuned
Aeroelastic Workshop 27-Otc-201118/22

Risø DTU, Technical University of DenmarkRisø DTU, Technical University of Denmark
Results (Case 4)• Blade equivalent fatigue loads comparison after pre-twist tuned (flapwise
and edgewise fatigue loads)• Blue: -0.3deg coupling case• Red: -1 deg coupling case before tuned• Green: -1 deg coupling case after tuned
Aeroelastic Workshop 27-Otc-201119/22

Risø DTU, Technical University of DenmarkRisø DTU, Technical University of Denmark
Results (Case 4)• Blade torsional equivalent fatigue load measured from non-pitching axis
and blade maximum tip deflection comparisons• Blue: -0.3deg coupling case• Red: -1 deg coupling case before tuned• Green: -1 deg coupling case after tuned
Aeroelastic Workshop 27-Otc-201120/22

Risø DTU, Technical University of DenmarkRisø DTU, Technical University of Denmark
Conclusions
21/22
• A new beam element is successfully developed and implemented intoHAWC2.• The beam element is validated before and after implementation.
• Simple square beam model and 5MW RWT are used for the validations.• A new structural format is introduced for the new beam model.
• Bend-Twist coupling parametric studies are performed. • 5MW RWT• A good potential for load reduction is observed. • Higher couplings produce the reduction of the bending stiffness in the real
world.• Blade re-design process is necessary in order for using bending-twist
coupling blade such as pre-twist along the blade span. • The coupling effects may result in improving wind turbine performances
• Increasing the life time of turbine.• Reduce materials for blade.• Etc.
Aeroelastic Workshop 27-Otc-2011

Risø DTU, Technical University of DenmarkRisø DTU, Technical University of Denmark
Thank you for your attention
22/22

3 Q3UIC – A new aerodynamic airfoil tool
Risø-R-1796(EN) 43

Q3UIC – A new aerodynamic airfoil tool including rotational effects
Néstor Ramos GarcíaJens Nørkær Sørensen
Wen Zhong Shen

PRESENTATION LAYOUT
• INTRODUCTION
• VISCOUS-INVISCID INTERACTION
• COMPUTATIONS AND BENCHMARKINGo STEADY 2D.o UNSTEADY 2D.o STEADY 2D WITH VG.o STEADY QUASI3D
• POTENTIAL DOUBLE WAKE SOLVER
• CONCLUSIONS

INTRODUCTION
• Computer resources are getting morepowerful with the years, but it is stillbehind our limits to realize an active designof wind turbine blades using Navier-Stokessolvers. High cost in computational time.
• Blade Inboard regions are producing morepower than predicted.
• Rotor is producing more power at highangles of attack due to secondary outwardflow, caused by centrifugal pumping.
• Blade-Element Momentum theory is oftenused for the design of wind turbines.Required Input: Lift and Drag forcecoefficients.

• A code has been developed during the last three years that canfit our needs:
– It has to compute accurately steady/unsteady airfoil forces.– It has to be fast in order to use it as a design method.– It has to take into account rotational effects. Centrifugal and
Coriolis forces.
INTRODUCTION
• The code uses the already known concept of UNSTEADY VISCOUS-INVISCID STRONG INTERACTION via transpiration velocity.
• Inviscid flow Unsteady potential flow, panel method.• Viscous flow Quasi 3-D integral BL equations + Closures.

VISCOUS-INVISCID STRONG INTERACTION
• ASSUMPTION OF AN EQUIVALENT FLOW,where the effects of real flow can be added.Transpiration velocity will take into accountthe effects of the real flow in the potentialflow solver.
( ) ( )10
δeeT udxddzuu
dxdv =−= ∫
∞

STEADY VISCOUS INVISCID SOLVER

0 4 8 12 16 200
0.4
0.8
1.2
1.6
2
α
CL
EXPEllipSysXfoilQ3UIC
0 0.5 1-0.2-0.1
00.10.2
x/c
y/c
0 4 8 12 16 200.06
0.08
0.10
0.12
α
CM
EXPEllipSysXfoilQ3UIC
0 4 8 12 16 200
0.05
0.10
0.15
0.20
α
CD
EXPEllipSysXfoilQ3UIC
STEADY VI COMPUTATIONS
FFA‐W3‐211
Re = 1.8x10⁶
Low Speed Wind Tunnel L2000, KTH.

0 4 8 12 16 200
0.4
0.8
1.2
1.6
2
α
CL
EXPEllipSysXfoilQ3UIC
0 0.5 1-0.2-0.1
00.10.2
x/c
y/c
0 4 8 12 16 200
0.4
0.8
1.2
1.6
2
α
CL
EXPEllipSysXfoilQ3UIC
0 0.5 1-0.2-0.1
00.10.2
x/cy/
c
0 4 8 12 16 200
0.4
0.8
1.2
1.6
2
α
CL
EXPEllipSysXfoilQ3UIC
0 0.5 1-0.2-0.1
00.10.2
y/c
STEADY VI, THICKNESS VARIATION
NACA 63‐2xx: 15 %, 18 % and 21 % thickness
Re = 3.0x10⁶
NASAs low‐turbulence pressure tunnel.
Abbott and von Doenhoff, 1959.

STEADY VI, REYNOLDS VARIATION
NACA 4412
N.A.C.A Variable‐Density Wind Tunnel.
Pinkerton, 1938
0000 10 20 300
0.5
1
1.5
2
α
CN
Q3UIC Re 1.8e6Q3UIC Re 3.4e6Q3UIC Re 6.3e6Q3UIC Re 8.2e6EXP Re 1.8e6EXP Re 3.4e6EXP Re 6.3e6EXP Re 8.2e6
0 5 10 15 20 25 300
0.02
0.04
0.06
0.08
0.1
0.12
0.14
0.16
α
CM

UNSTEADY VISCOUS INVISCID SOLVER
SINGLE WAKE

• NACA 0015
• Re = 1.5x10⁶
• kA = 0.1
• αm= 13.37˚ A = 7.55˚
University of Glasgow, G.U AeroReport 9221.
Vorticity formulated NS runninga Spallart Allmaras turbulentmodel. J.N. Sørensen and P.J.Nygreen, Computers & Fluids 30(2001).
Unsteady Viscous‐Inviscid strongcoupling code.
UNSTEADY VISCOUS COMPUTATIONS, SINGLE WAKE
0 5 10 15 200
0.5
1
1.5
2
α
CN
0 5 10 15 20-0.6
-0.4
-0.2
0
α
CT
0 5 10 15 20-0.4
-0.2
0
α
CM
EXPSpalart
0 5 10 15 200
0.5
1
1.5
2
α
CN
0 5 10 15 20-0.6
-0.4
-0.2
0
α
CT
0 5 10 15 20-0.4
-0.2
0
αC
M
EXP
Q3UIC

VG MODELLING

0 0.2 0.4 0.6 0.8 10
1
2
3
4
5x 10⁻³
x/c
CF
PlainVG 0.03c
0 0.2 0.4 0.6 0.8 11
1.2
1.4
1.6
1.8
2
x/c
H
PlainVG 0.03c
VG MODELLING WITH Q3UIC

VG MODELLING WITH Q3UIC
0 0.02 0.04 0.06 0.08 0.1
1
1.4
1.8
2.2
CD
CL
GAW(2) Re 2.2x10⁶
EXP PLAINEXP VG x/c = 0.3Q3UIC PLAINQ3UIC VG x/c = 0.3
0 5 10 15 200
0.05
0.1
0.15
0.2
0.25FFA-W3-241 Re 1.6x10⁶
α
CD
EXP PLAINEXP x/c = 0.2EXP x/c = 0.1Q3UIC PLAINQ3UIC x/c = 0.2Q3UIC x/c = 0.1
0 5 10 15 20 250
0.5
1
1.5
α
CL
FFA-W3-241 Re 1.6x10⁶
EXP PLAINEXP x/c = 0.2EXP x/c = 0.1Q3UIC PLAINQ3UIC x/c = 0.2Q3UIC x/c = 0.1

Q3D STEADY VISCOUS INVISCID SOLVER

• Dimensional variables of interest in rotational study: c, r, Ω , Vw
• In order to proceed with a parametric study of the rotational effects ina wind turbine blade, two variables are defined:
1. The ratio between the chord length and the radial position,
2. The ratio between the rotational speed an the relative velocity,
Where Ω is the blade angular velocity, Urel is defined typically,
The four dimensional variables of interest are reduced to twoadimensional parameters ls & RO, base for our parametric study.
rcls=
relUrRO Ω
=
( )( ) ( )( )22 1'1 wrel VaraU −+Ω+=
QUASI-3D BOUNDARY LAYER EQUATIONS

QUASI-3D BOUNDARY LAYER
0 5 10 150
0.2
0.4
0.6
0.8
1
1.2
1.4
1.6
1.8
2
CL
α
RO = 0.7
2D EXPc/r = 0.1c/r = 0.6c/r = 0.7c/r = 0.8c/r = 0.9
0 5 10 150
0.2
0.4
0.6
0.8
1
1.2
1.4
1.6
1.8
2
α
CL
RO = 0.9
2D EXPc/r = 0.1c/r = 0.6c/r = 0.7c/r = 0.8c/r = 0.9
0 5 10 150
0.2
0.4
0.6
0.8
1
1.2
1.4
1.6
1.8
2C
L
α
RO = 0.6
2D EXPc/r = 0.1c/r = 0.6c/r = 0.7c/r = 0.8c/r = 0.9
0 5 10 150
0.2
0.4
0.6
0.8
1
1.2
1.4
1.6
1.8
2
α
CL
RO = 0.8
2D EXPc/r = 0.1c/r = 0.6c/r = 0.7c/r = 0.8c/r = 0.9

QUASI-3D BOUNDARY LAYER
• Artificial rotor.
• S809 Airfoil.
• Re 1e6.
• R = 10 m.
• Ω = 70 rpm.
• Tip speed ratio,
• QW = 12.20 m/s λ = 6
• QW = 8.14 m/s λ = 9
• QW = 6.11 m/s λ = 12
wQRΩ
=λ
Ω

QUASI-3D BOUNDARY LAYER
0 0.2 0.4 0.6 0.8 10.5
0.7
0.9
1.1
1.3
1.5
1.7
CL
r/R
λ = 6
α = 12α = 8α = 4
0 0.2 0.4 0.6 0.8 10.5
0.7
0.9
1.1
1.3
1.5
1.7
CL
r/R
λ = 12
α = 12α = 8α = 4
0 0.2 0.4 0.6 0.8 10.5
0.6
0.7
0.8
0.9
1
1.1
1.2
x SEP
r/R
λ = 12
α = 12α = 8α = 4
0 0.2 0.4 0.6 0.8 10.5
0.6
0.7
0.8
0.9
1
1.1
1.2
x SEP
r/R
λ = 6
α = 12α = 8α = 4

DOUBLE WAKE POTENTIAL SOLVER

-0.4 -0.2 0 0.2 0.4 0.6
-1
0
1
2
3
4
5
6
7
8
9
10
x
Cp
EXP2wake
-0.5 0 0.5 1 1.5
-0.5
0
0.5
0 0.2 0.4 0.6 0.8 1
-1
0
1
2
3
4
5
6
7
8
9
10
x
Cp
EXP2wake
0 0.5 1-0.1
0
0.1
0.2
0.3
0.4
0 0.2 0.4 0.6 0.8 1
-1
0
1
2
3
4
5
6
7
8
9
10
x
Cp
0 0.5 1-0.1
0
0.1
0.2
0.3
0.4
EXP2wake
DOUBLE WAKE MODEL
0 0.2 0.4 0.6 0.8 1
-1
0
1
2
3
4
5
6
7
8
9
10
x
Cp
EXP2wake
0 0.5 1
0
0.2
0.4
0 20 40 60 800
0.5
1
1.5
2
2.5
α
CD
EXP/CALC SANDIA1WAKE2WAKE
0 20 40 60 800
0.2
0.4
0.6
0.8
1
1.2
1.4
1.6
α
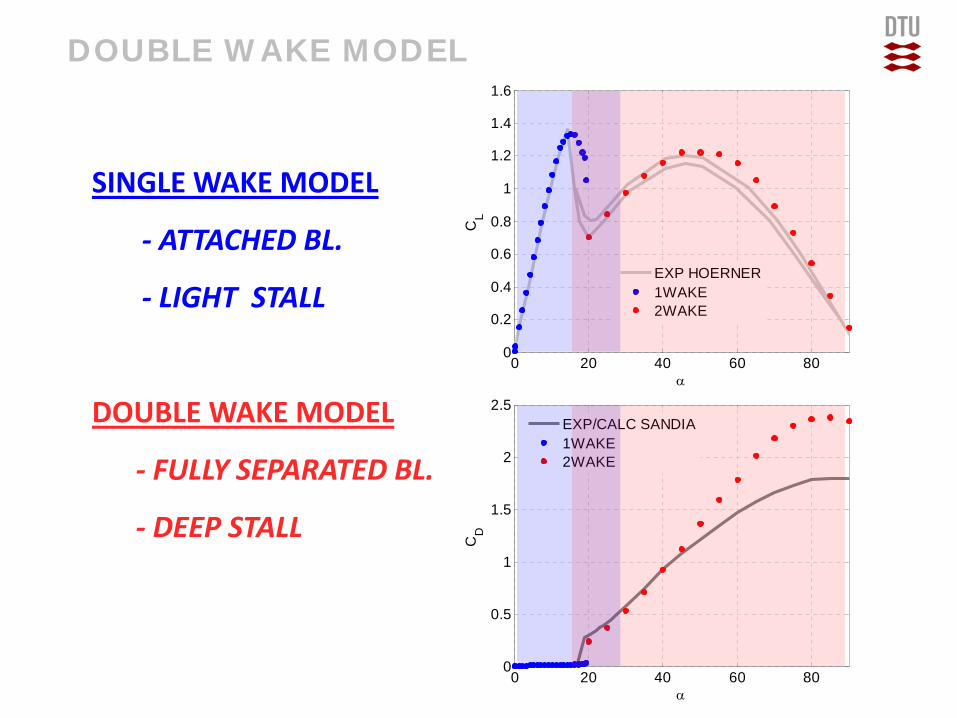
CL
EXP HOERNER1WAKE2WAKE
DOUBLE WAKE MODEL
SINGLE WAKE MODEL
‐ ATTACHED BL.
‐ LIGHT STALL
DOUBLE WAKE MODEL
‐ FULLY SEPARATED BL.
‐ DEEP STALL

CONCLUSIONS
• VISCOUS INVISCID SOLVER IMPLEMENTED
– STEADY 2D – UNSTEADY 2D– STEADY 2D VG– STEADY Q3D
• DOUBLE WAKE POTENTIAL SOLVER IMPLEMENTED
– DEEP STALL CONDITIONS

THANK YOU FOR YOUR ATTENTION.

4 Influence of up-scaling
68 Risø-R-1796(EN)

Influence of up-scaling on loads, control and aerodynamic modelingLoading from turbulence
Helge Aagaard MadsenFlemming RasmussenTorben J. LarsenVasilis Riziotis (NTUA, Greece)
Wind Energy DivisionProgramme of Aeroelastic DesignRisø DTU

Risø DTU, Technical University of DenmarkRisø DTU, Technical University of Denmark Aeroelastic Workshop at Risø DTU, October 27, 2011
The subject
Shear and turbulence in inflow
Ratio between rotor size and the atmospheric boundary layer height and turbulence scales increases

Risø DTU, Technical University of DenmarkRisø DTU, Technical University of Denmark
Rotational sampling of turbulence
3
Do we model the 1p, 2p etc. aerodynamics accurately ?
1p, 2p … variations in induction not modeled in some BEM codes used by industry
The BEM model is based on the Galuert propeller theory -probably not originally intended to be used on rotors of 100m D or more in atmospheric turbulent flow

Risø DTU, Technical University of DenmarkRisø DTU, Technical University of Denmark
Rotational sampling of turbulence
4

Risø DTU, Technical University of DenmarkRisø DTU, Technical University of Denmark
Objectives
Study the influence of up-scaling of rotors
operating in turbulent inflow on:
the aerodynamic loading characteristics
control aspects
aerodynamic and aeroelastic modeling requirements
Presentation at AED meeting, Monday October 25, 2010
5

Risø DTU, Technical University of DenmarkRisø DTU, Technical University of Denmark
Approach
Four turbines with a rotor size of 25m, 50m, 100m and 200m were modeled in
HAWC2aero (no structural dynamics) based on a direct scaling of the 5MW
reference wind turbine rotor. The tip speed was kept constant at 60.5 m/s.
A turbulence box with the dimension of 200m x 200m x 11200m was generated
with number of points equal to 64 x 64 x 4096 and a wind speed of 8 m/s.
A tower height of 120 m was used for all turbines and no wind shear.
A simulation time of 1300 sec. was used and the first 100 sec. excluded.
Only one wind speed at 8 m/s was simulated at a turbulence intensity of 15%.
No turbine speed and pitch control was used.
Presentation at AED meeting, Monday October 25, 2010
6

Risø DTU, Technical University of DenmarkRisø DTU, Technical University of Denmark
Analysis
Rotational sampling of turbulence
Rotor thrust and power
Flapwise blade root moment
Control aspects
Impact on model requirements
Presentation at AED meeting, Monday October 25, 2010
7

Risø DTU, Technical University of DenmarkRisø DTU, Technical University of Denmark
Results – rotational sampling
Presentation at AED meeting, Monday October 25, 2010
8
The rotational sampling of the turbulence concentrates part of the turbulent energy on 1p, 2p etc.
The contribution comes from frequencies below 1p due to the spatial averaging of the turbulence over the rotor area.
The effect will thus increase with increasing rotor size and a considerable part of the total turbulent input for the 200 m rotor is now on 1p

Risø DTU, Technical University of DenmarkRisø DTU, Technical University of Denmark
Results - thrust
Presentation at AED meeting, Monday October 25, 2010
9
Spectra of thrust (normalized with their mean value squared) for the different rotors.
The thrust load input is found on 3p, 6p etc. and the concentrated energy is from frequencies below 3p.

Risø DTU, Technical University of DenmarkRisø DTU, Technical University of Denmark
Results – flapwise moment
Presentation at AED meeting, Monday October 25, 2010
10
Spectra of flapwise moment (normalized with their mean value squared) for the different rotors.
The flapwise load input is found on 1p, 2p, 3p etc. and as for the wind speed the concentrated energy is from frequencies below 1p.

Risø DTU, Technical University of DenmarkRisø DTU, Technical University of Denmark
Results – ratio between std.dev. and mean
Presentation at AED meeting, Monday October 25, 2010
11
The ratio (std.dev./mean) denoted intensity is seen to decrease for the power and thrust and to some degree also for flapwisemoment, due to the spatial averaging of the instantaneous forces over the swept area.

Risø DTU, Technical University of DenmarkRisø DTU, Technical University of Denmark
Results – time trace of thrust
Presentation at AED meeting, Monday October 25, 2010
12
200m rotor
25m rotor

Risø DTU, Technical University of DenmarkRisø DTU, Technical University of Denmark
Results – rotor power
Presentation at AED meeting, Monday October 25, 2010
13
200m rotor
25m rotor

Risø DTU, Technical University of DenmarkRisø DTU, Technical University of Denmark
Results – flapwise moment
Presentation at AED meeting, Monday October 25, 2010
14
200m rotor
25m rotor

Risø DTU, Technical University of DenmarkRisø DTU, Technical University of Denmark
Loads on upscaled wind turbines– full aeroelastic simulations from NTUA
1Hz equivalent loads
pitch controller parameters not tuned
pitch controller parameters tuned
better power quality
reduction of tower moment with increasing size

Risø DTU, Technical University of DenmarkRisø DTU, Technical University of Denmark
Results – control aspects
Presentation at AED meeting, Monday October 25, 2010
16
The influence on control is that a cyclic pitch control system, which alleviates 1p loads, will be relatively more efficient for increasing rotor size.

Risø DTU, Technical University of DenmarkRisø DTU, Technical University of Denmark
Results – impact on aerodynamicmodel requirements
Presentation at AED meeting, Monday October 25, 2010
17

Risø DTU, Technical University of DenmarkRisø DTU, Technical University of Denmark
Results – impact on aerodynamicmodel requirements
Presentation at AED meeting, Monday October 25, 2010
18
Impact on loading: slightly reduced fatt. loading with dynamic induction -- increased impact for e.g. half wake simulations with the Dynamic Wake Meandering model

Risø DTU, Technical University of DenmarkRisø DTU, Technical University of Denmark
Conclusions
Presentation at AED meeting, Monday October 25, 2010
19
The upscaling of rotors has the influence that a bigger and bigger part of the turbulence is concentrated at 1p, 2p and 3p and the energy is taken from the spectrum at frequencies below 1p due to the spatial averaging effect of the rotor
This means that it becomes more important to simulate more accurate the 1p, 2p variations of e.g. induced flow better as a bigger part of the total turbulence is centered on the p´s
The quantities such as power and thrust which are integrated values over the rotor swept area show a decrease in dynamic content relative to the mean value as function of up-scaling due to this filtering effect
Impact on control is that control algorithms directed to reduce 1p loads (cyclic pitch) should be better and better for increased rotor size

Risø DTU, Technical University of DenmarkRisø DTU, Technical University of Denmark
THANK YOU
Presentation at AED meeting, Monday October 25, 2010
20

5 Aerodynamic damping of tower vibrations
Risø-R-1796(EN) 89

Aerodynamic damping of lateral tower vibrations Bjarne S. KallesøeNiels N. SørensenNiels Troldborg

Risø DTU, Technical University of DenmarkRisø DTU, Technical University of Denmark
Outline• Motivation• Aerodynamic damping of lateral rotor oscillations• Aerodynamic damping of lateral tower mode
2

Risø DTU, Technical University of DenmarkRisø DTU, Technical University of Denmark
Motivation• First lateral tower mode is excited by waves in some simulations cases
leading to design giving loads• Aeroelastic codes are based on BEM• BEM predicted the aerodynamic damping of the lateral tower mode to be
very low • It has been questioned if BEM gives the correct aerodynamic forces for
these lateral motions of the rotor • In this work the aerodynamic work on lateral harmonic rotor motions
are computed by both BEM and CFD (full rotor and actuator line)
3

Risø DTU, Technical University of DenmarkRisø DTU, Technical University of Denmark
Computational setup• NREL 5 MW Reference turbine• Pure lateral harmonic motion of the rotor• 1 m amplitude, 0.3 Hz• Three different wind speeds: 6 m/s, 12 m/s and 22 m/s• Computational methods:
• BEM, as implemented in HAWC2 (BEM)• Full rotor CFD in EllipSys3D (CFD)• Actuator line in EllipSys3D (AL)
• Integrating the lateral aerodynamic forces from each blade
4

Risø DTU, Technical University of DenmarkRisø DTU, Technical University of Denmark
Lateral aerodynamic forces
5
-1 -0.5 0 0.5 1-1.5
-1
-0.5
0
0.5
1
1.5
Lateral displacement [m]
Late
ral f
orce
[kN
]
6 m/s
BEMBEM + added massCFDAL -1 -0.5 0 0.5 1
-3
-2
-1
0
1
2
3
Lateral displacement [m]
Late
ral f
orce
[kN
]
12 m/s
-1 -0.5 0 0.5 1
-15
-10
-5
0
5
10
15
Lateral displacement [m]
Late
ral f
orce
[kN
]
22 m/s
6 12 22-50
-40
-30
-20
-10
0
Wind speed [m/s]
Aer
odyn
amic
wor
k [k
J]
BEMBEM + added massCFDAL
Aerodynamic work per cycle

Risø DTU, Technical University of DenmarkRisø DTU, Technical University of Denmark
Aerodynamic work per cycle
• Large relative differences for low wind speeds
• Good agreement for higher wind speeds
• Much smaller aerodynamic work for low wind speed than for high wind speed
• The added mass has no influence on the results!
6
6 12 22-50
-40
-30
-20
-10
0
Wind speed [m/s]
Aer
odyn
amic
wor
k [k
J]
BEMBEM + added massCFDAL

Risø DTU, Technical University of DenmarkRisø DTU, Technical University of Denmark
Relating aerodynamic work to damping
7
0 50 100 150 200
-1
-0.5
0
0.5
1
time [s]
ampl
itude
[m]
Tower top displacement at 22 m/s
6 10 14 18 22
2
4
6
Wind speed [m/s]
Dam
ping
(lo
g.de
crem
ent)
[%]
6 10 14 18 220
20
40
60
80
Aer
odyn
amic
wor
k [k
J]
dampingaerodynamic work
Relation between aero-work and damping

Risø DTU, Technical University of DenmarkRisø DTU, Technical University of Denmark
Aerodynamic damping of pure lateral tower mode
8
6 12 220
1
2
3
4
Wind speed [m/s]
Dam
ping
(lo
g.de
crem
ent)
[%]
BEMBEM + added massCFDAL
6 12 22-50
-40
-30
-20
-10
0
Wind speed [m/s]
Aer
odyn
amic
wor
k [k
J]
BEMBEM + added massCFDAL
• The damping at 6 m/s is so small that the relative large difference between methods are of no particle interest

Risø DTU, Technical University of DenmarkRisø DTU, Technical University of Denmark
Aerodynamic damping of real lateral tower mode
9
-1 -0.5 0 0.5 1
-0.5
0
0.5
Lateral displacement [m]
Long
itudi
nal d
ispl
acem
ent [
m]
6 m/s12 m/s22 m/s
• Longitudinal component in the lateral tower mode• Rotation of the rotor has a large contribution to the damping, this
may be different with a free-free drive train model

Risø DTU, Technical University of DenmarkRisø DTU, Technical University of Denmark
Conclusion• Some differences in lateral aerodynamic forces at low wind speeds• But forces and damping is so low, so differences has no practical
implications• All computational method agree well for higher wind speeds, where force
level is higher• Aerodynamic damping of lateral tower vibrations are low (1-2 %)
10

6 Closed-loop aeroservoelastic analysis
100 Risø-R-1796(EN)

Open- and closed-loop aero-servo-elastic analysis with HAWCStab2Morten Hartvig Hansen and Ivan B. Sønderby
Outline:• Aero-servo-elastic model in HAWCStab2• Example: Tuning of collective and cyclic pitch controllers• Reduced order models from HAWCStab2

2011Aeroelastic Workshop, October 272 Risø DTU, Technical University of Denmark
Aeroelastic model• Nonlinear kinematics based on co-
rotational Timoshenko elements.
• Blade Element Momentum coupled with unsteady aerodynamics based on Leishman-Beddoes.
• Uniform inflow to give a stationary steady state that approximates the mean of the periodic steady state.
• Analytical linearization about the stationary steady state that include the linearized coupling terms from the geometrical nonlinearities.

2011Aeroelastic Workshop, October 273 Risø DTU, Technical University of Denmark
Linear open-loop aeroelastic equations
= elastic and bearing degrees of freedom= aerodynamic state variables= forces due to actuators and wind disturbance
Coupling to structural states
Open-loop first order equations

2011Aeroelastic Workshop, October 274 Risø DTU, Technical University of Denmark
Closed-loop aero-servo-elastic equations
Closed-loop equations
Additional output matrices
Additional (PID) controller states

2011Aeroelastic Workshop, October 275 Risø DTU, Technical University of Denmark
Example: Collective and cyclic pitch controllers
Lead angle,

2011Aeroelastic Workshop, October 276 Risø DTU, Technical University of Denmark
Closed-loop aero-servo-elastic equations
Tuning parameters
Filters andintegrators

2011Aeroelastic Workshop, October 277 Risø DTU, Technical University of Denmark
Lead angle from open-loop analysis
NREL 5 MW turbine28 deg
BW
edge
FW e
dge
Tow
er m
odes

2011Aeroelastic Workshop, October 278 Risø DTU, Technical University of Denmark
Open and closed-loop wind shear response
Filter
pea
k

2011Aeroelastic Workshop, October 279 Risø DTU, Technical University of Denmark
Aero-servo-elastic modes and damping

2011Aeroelastic Workshop, October 2710 Risø DTU, Technical University of Denmark
HAWC2 simulations at 17 m/s with NTM

2011Aeroelastic Workshop, October 2711 Risø DTU, Technical University of Denmark
Cyclic controller induced instability

2011Aeroelastic Workshop, October 2712 Risø DTU, Technical University of Denmark
Validation of transfer functions with HAWC2

2011Aeroelastic Workshop, October 2713 Risø DTU, Technical University of Denmark
Validation of low order models
Methods: “mt” = Modal truncation and “br” = Balanced residualization

2011Aeroelastic Workshop, October 2714 Risø DTU, Technical University of Denmark
Summary• HAWCStab2 can be used for performing open-loop and closed-loop
eigenvalue and frequency-domain analysis of three-bladed turbines:
– Controller equations are still hardcoded. A suitable interface is under consideration, for example based on DLLs as in HAWC2.
– Full order analyses can be performed both inside or outside HAWCStab2 by writing out system matrices for each operation point.
– Reduced order modelling capabilities are currently performed outside HAWCStab2. Automated procedures for obtaining models with desired details will be implemented in HAWCStab2, or in Matlab scripts.
• HAWCStab2 is a common tool for both control engineers and mechanical engineers:
– It can provide first-principle models for model-based controllers.
– It can explain phenomena observed in load simulations.

7 Thick, flatback, high-lift multi-element airfoil
Risø-R-1796(EN) 115

Design and test of a thick, flatback, high-lift multi-elementairfoil
Frederik Zahle, Mac Gaunaa, Christian Bak, Niels N.Sørensen
Wind Energy Division · Risø DTU
27 October 2011

IntroductionThe aim of this work has been to design and test a high lift airfoil for validationof numerical codes.
Airfoil properties
� Two elements: Main airfoil and a slat.
� 40% thick main element, flatback.
� 30% chord slat.
� Lift coefficient > 3
This presentation
� Numerical optimization method used to design the multi-element airfoil.
� Final design and predicted performance of the multi-element airfoil.
� Wind tunnel setup.
� Preliminary comparisons of numerical results and wind tunnelmeasurements.
� Flow visualization.
2 of 42 Frederik Zahle et al.Risø DTU
Design and test of a thick, flatback, high-lift multi-element airfoilAeroelastic Workshop

IntroductionWhy are we interested in high-lift airfoils for the root?
� Madsen et al. showed that the neglection of the rotational effects instandard BEM formulations could potentially lead to designs with a lessthan optimal power production, since the root was not loaded sufficiently.
� Johansen et al. designed a rotor for maximum power production where aCP of 0.515 was achieved.
� This rotor had significantly higher loading towards the root thanconventional rotors.
� Main drawback: Very large root chords.
� Gaunaa et al. explore the subject of high root loading further and showthat at 20% radius the loading should be approx. 1.7 times that of thereference rotor used.
3 of 42 Frederik Zahle et al.Risø DTU
Design and test of a thick, flatback, high-lift multi-element airfoilAeroelastic Workshop

IntroductionWhy multi-element airfoils?
Motivation� One way to achieve high loading is to increase the chord.
� This is not desirable for many reasons: e.g. increased extreme loads,limitations on transport height, material costs.
� Multi-element airfoils can produce high lift coefficients even with thickairfoil sections.
� With very high lift coefficients the chord can be reduced even further,reducing extreme loads.
4 of 42 Frederik Zahle et al.Risø DTU
Design and test of a thick, flatback, high-lift multi-element airfoilAeroelastic Workshop

IntroductionHow to design a multiple element airfoil?
Challenge
� Current in-house airfoil design codes were not adapted to handlemultiple elements.
� Gaunaa et al. used a panel code to optimize the shape of a slatted airfoil.
� Performance subsequently evaluated using 2D CFD.
� Problem: panel code not sufficiently accurate.
� Our choice: Optimization code coupled with the 2D CFD solverEllipsys2D.
5 of 42 Frederik Zahle et al.Risø DTU
Design and test of a thick, flatback, high-lift multi-element airfoilAeroelastic Workshop

MethodDesign Method
Optimization� The optimization method developed for this work was programmed in
Matlab.
� Bounded Nelder-Mead Simplex (fminsearchbnd).
� Ellipsys2D is used to evaluate the cost function.
Cost functionComposed of three factors:
� The function A1 which evaluates the lift-to-drag ratio at the target angleof attack.
� The function A2, which seeks to maximize the lift coefficient at someangle of attack, which the optimizer is free to tune.
� A penalty function which forces the optimizer towards achieving thedesired lift coefficient, Cl,target , at the specified target angle of attack,αtarget .
6 of 42 Frederik Zahle et al.Risø DTU
Design and test of a thick, flatback, high-lift multi-element airfoilAeroelastic Workshop

MethodDesign Method
Cost function
CostFun = −Penalty (A1 + A2) (1)
A1 =Cl(αtarget)
Cd (αtarget)·
1(Cl/Cd )target,ref
· Koptim (2)
A2 =Cl(α)
Cl,maxref· (1− Koptim) (3)
Penalty = exp
(−
(Cl(αtarget)− Cl,target))2
2σpenalty
)(4)
Koptim is a factor which biases the cost function towards either the target liftcoefficient or lift-to-drag ratio.
� In this work there is no target angle of attack. Cl was maximized whileensuring high lift-to-drag ratio at αCl−max -5 deg.
� For each optimization iteration two design evaluations were thus needed.
7 of 42 Frederik Zahle et al.Risø DTU
Design and test of a thick, flatback, high-lift multi-element airfoilAeroelastic Workshop
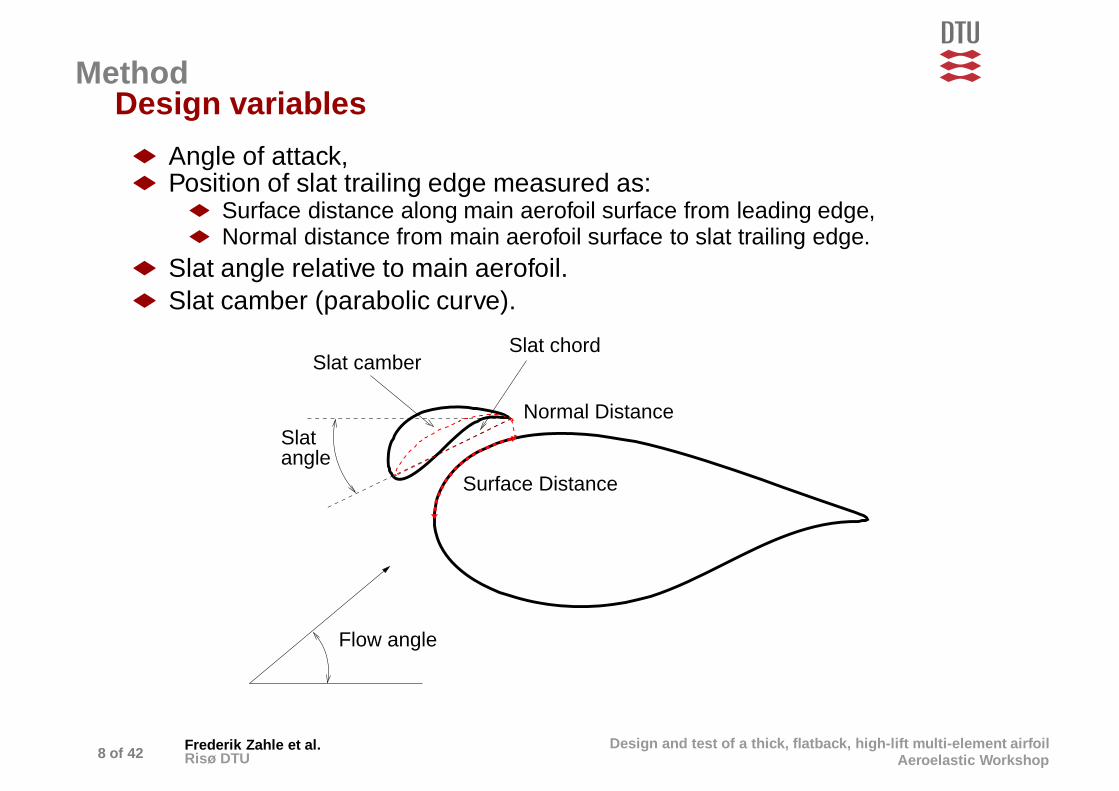
MethodDesign variables
� Angle of attack,� Position of slat trailing edge measured as:
� Surface distance along main aerofoil surface from leading edge,� Normal distance from main aerofoil surface to slat trailing edge.
� Slat angle relative to main aerofoil.
� Slat camber (parabolic curve).
SlatNormal Distance
angle
Flow angle
Surface Distance
Slat chordSlat camber
8 of 42 Frederik Zahle et al.Risø DTU
Design and test of a thick, flatback, high-lift multi-element airfoilAeroelastic Workshop

MethodDesign evaluation using EllipSys2D
Mesh generation of multi-elements has been automized usingBash/fortran/HypGrid2D.
Figure: Typical meshes generated using the automated meshing scripts, left: standardpatched grid, right: overset grid.
9 of 42 Frederik Zahle et al.Risø DTU
Design and test of a thick, flatback, high-lift multi-element airfoilAeroelastic Workshop

MethodOptimization Flowchart
� Communication between Matlab and EllipSys2D was handled from aseries of Bash scripts that read files written by each code.
� Matlab ran in the background, outputting for each optimization step a filecontaining the coordinates of the slat as well as the required angle ofattack.
� EllipSys was executed in parallel for maximum speed, and subsequentlyreturned values of Cl and Cd for the given configuration.
� Optimization was converged in approximately 100 optimizationiterations, i.e. 200 EllipSys2D evaluations. ≈ 10 hours on 19 CPUs.
AOA
Matlab:fminsearchbndCostFun
Bash scriptairfoilshape
File I/O
File I/O
mpirun
grid.X2Dgrid.T2D
HypGridGenerate mesh
EllipSys2DEvaluate design
grid.force
Cl, Cd
10 of 42 Frederik Zahle et al.Risø DTU
Design and test of a thick, flatback, high-lift multi-element airfoilAeroelastic Workshop

ResultsFlaback AirfoilThe present study is based on the FFA-W3-360 aerofoil which was modifiedin the following manner:
� Increased thickness from 36% chord to 40% chord,
� Opening of trailing edge from 3.6% chord to 5.6% chord.
-0.2
-0.1
0
0.1
0.2
0.3
0 0.1 0.2 0.3 0.4 0.5 0.6 0.7 0.8 0.9 1
y/c
[-]
x/c [-]
FFA-W3-360FFA-W3-400
FFA-W3-400FB
11 of 42 Frederik Zahle et al.Risø DTU
Design and test of a thick, flatback, high-lift multi-element airfoilAeroelastic Workshop

ResultsFlaback Airfoil Performance
-0.2 0
0.2 0.4 0.6 0.8
1 1.2 1.4 1.6 1.8
0 5 10 15 20 25
Cl [
-]
Incidence [deg.]
Ell turbEll TI=0.05%
Ell TI=0.1%Ell TI=0.2%Ell TI=0.3% 0
0.2
0.4
0.6
0.8
1
1.2
1.4
1.6
1.8
0.02 0.04 0.06 0.08 0.1
Cl [
-]
Cd [-]
Ell turbEll TI=0.05%Ell TI=0.1%Ell TI=0.2%Ell TI=0.3%
12 of 42 Frederik Zahle et al.Risø DTU
Design and test of a thick, flatback, high-lift multi-element airfoilAeroelastic Workshop

ResultsSlat Optimization
� Chosen slat baseline airfoil: FFA-W3-360.� Chord length relative to main airfoil: 30%.
-0.2-0.15-0.1
-0.05 0
0.05 0.1
0.15 0.2
0 0.2 0.4 0.6 0.8 1
y/c
[-]
x/c [-]
13 of 42 Frederik Zahle et al.Risø DTU
Design and test of a thick, flatback, high-lift multi-element airfoilAeroelastic Workshop

ResultsSlat Optimization
� Four optimizations with different values of koptim were carried out.
0
0.5
1
1.5
2
2.5
3
3.5
0 5 10 15 20 25 30 35
Cl [
-]
Incidence [deg.]
koptim=0.25koptim=0.50koptim=0.75koptim=1.00
Baseline t/c=0.40 FB 0
10
20
30
40
50
60
0 5 10 15 20 25 30 35
L/D
[-]
Incidence [deg.]
koptim=0.25koptim=0.50koptim=0.75koptim=1.00
Baseline t/c=0.40 FB
-0.2-0.1
0 0.1 0.2 0.3
-0.4 -0.2 0 0.2 0.4 0.6 0.8 1
y/c
[-]
x/c [-]
koptim=0.25koptim=0.50
koptim=0.75koptim=1.00
14 of 42 Frederik Zahle et al.Risø DTU
Design and test of a thick, flatback, high-lift multi-element airfoilAeroelastic Workshop

ResultsSlat Optimization - final designKoptim=0.25 optimization yielded the best overall results.
-0.2
-0.1
0
0.1
0.2
0.3
-0.2 0 0.2 0.4 0.6 0.8 1
y/c
[-]
x/c [-]
-0.2
-0.1
0
0.1
0.2
0.3
0 0.1 0.2 0.3 0.4 0.5 0.6 0.7 0.8 0.9 1
y/c
[-]
x/c [-]
15 of 42 Frederik Zahle et al.Risø DTU
Design and test of a thick, flatback, high-lift multi-element airfoilAeroelastic Workshop

ResultsPredicted Slat Performance
2D lift coefficielt and lift to drag ratio as function of incidence for fully turbulentand transitional boundary layers.
0
0.5
1
1.5
2
2.5
3
3.5
4
0 5 10 15 20 25 30 35
Cl [
-]
Incidence [deg.]
Slat turbSlat trans
Baseline turbBaseline tran
0
10
20
30
40
50
60
70
80
0 5 10 15 20 25 30 35
L/D
[-]
Incidence [deg.]
Slat turbSlat trans
Baseline turbBaseline tran
16 of 42 Frederik Zahle et al.Risø DTU
Design and test of a thick, flatback, high-lift multi-element airfoilAeroelastic Workshop

ResultsPredicted Slat PerformanceParameter study
� Using the optimized slat shape a parameter study was carried out todetermine the performance of the slat within the grid shown below.
� For each grid position the slat angle was optimized to minimize the costfunction.
� 42 × 60 = 2520 EllipSys2D simulations.
� All carried out using a coarser grid than for the actual optimization (gridlevel 2).
x
y
0 0.2 0.4 0.6 0.8 1-0.25
-0.2
-0.15
-0.1
-0.05
0
0.05
0.1
0.15
0.2
0.25
0.3
0.35
0.4
17 of 42 Frederik Zahle et al.Risø DTU
Design and test of a thick, flatback, high-lift multi-element airfoilAeroelastic Workshop

ResultsPredicted Slat Performance
Contours of maximum lift coefficient.
x
y
0 0.2 0.4 0.6
-0.05
0
0.05
0.1
0.15
0.2
0.25
0.3
0.35
Cl132.62.21.81.41
17 of 42 Frederik Zahle et al.Risø DTU
Design and test of a thick, flatback, high-lift multi-element airfoilAeroelastic Workshop

ResultsPredicted Slat Performance
Contours of L/D at αClmax .
x
y
0 0.2 0.4 0.6
-0.05
0
0.05
0.1
0.15
0.2
0.25
0.3
0.35L/D1
302622181410
17 of 42 Frederik Zahle et al.Risø DTU
Design and test of a thick, flatback, high-lift multi-element airfoilAeroelastic Workshop

ResultsPredicted Slat Performance
Contours of lift coefficient at αClmax -5 deg.
x
y
0 0.2 0.4 0.6
-0.05
0
0.05
0.1
0.15
0.2
0.25
0.3
0.35
Cl232.62.21.81.41
17 of 42 Frederik Zahle et al.Risø DTU
Design and test of a thick, flatback, high-lift multi-element airfoilAeroelastic Workshop

ResultsPredicted Slat Performance
Contours of L/D at αClmax -5 deg.
x
y
0 0.2 0.4 0.6
-0.05
0
0.05
0.1
0.15
0.2
0.25
0.3
0.35L/D2
353025201510
17 of 42 Frederik Zahle et al.Risø DTU
Design and test of a thick, flatback, high-lift multi-element airfoilAeroelastic Workshop

ResultsPredicted Slat PerformanceContours of velocity magnitude over the isolated main airfoil at 16 deg. AOA.
x
y
0 0.2 0.4 0.6
-0.05
0
0.05
0.1
0.15
0.2
0.25
0.3
0.35
0.4
0.45Vel Magnitude
1.81.521.240.960.680.4
17 of 42 Frederik Zahle et al.Risø DTU
Design and test of a thick, flatback, high-lift multi-element airfoilAeroelastic Workshop

ResultsWhat makes the slat work so well?
� Best performance of the slat was found to be in the region where theflow acceleration over the suction side of the main airfoil was greatest.
� The flow disturbance at the slat TE results in a camber effect ormodification of the local kutta condition, increasing the obtainable lift.
� The low pressure at the slat TE reduces the needed pressure recoveryof the flow over the slat, allowing for much greater suction peaks than onconventional airfoils.
� The suction peak on the main airfoil is completely removed, requiringonly a small pressure recovery for the flow on the main element.
� The airfoil can thus maintain attached flow up to much greater angles ofattack due to these effects and hence produce very high lift.
� The positioning of the slat can thus be narrowed down considerably bystudying the flow over the isolated main airfoil.
18 of 42 Frederik Zahle et al.Risø DTU
Design and test of a thick, flatback, high-lift multi-element airfoilAeroelastic Workshop
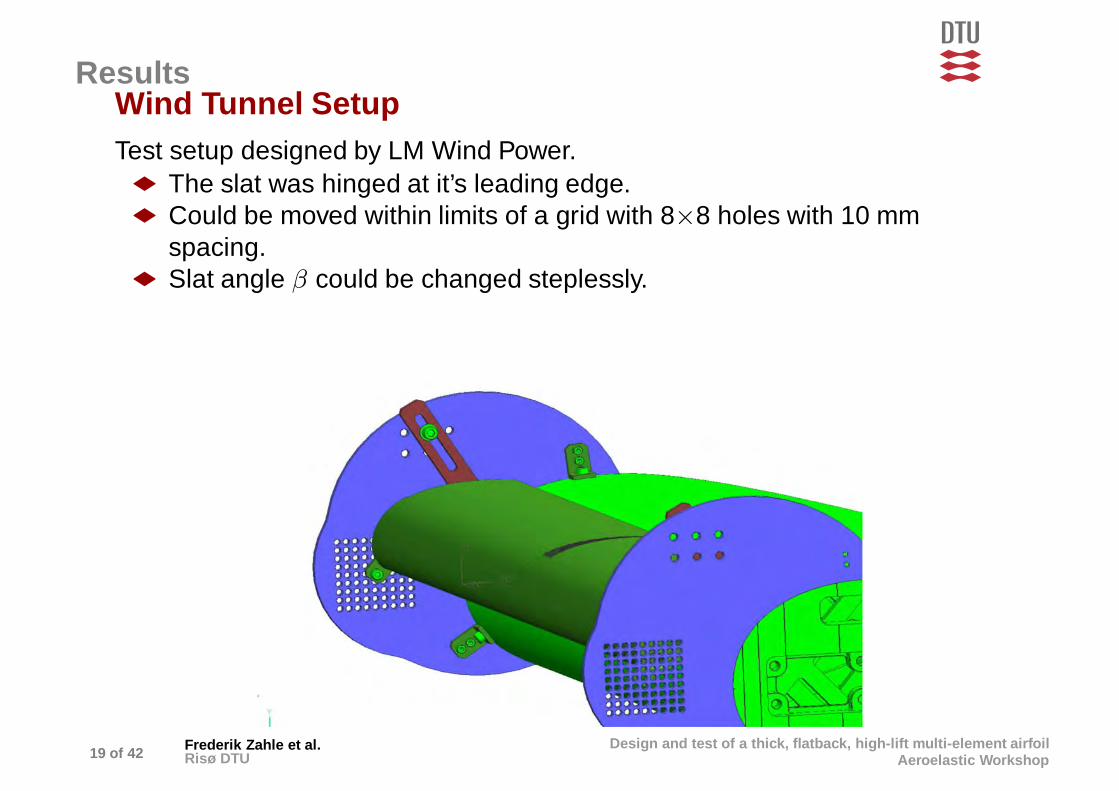
ResultsWind Tunnel SetupTest setup designed by LM Wind Power.
� The slat was hinged at it’s leading edge.� Could be moved within limits of a grid with 8×8 holes with 10 mm
spacing.
� Slat angle β could be changed steplessly.
19 of 42 Frederik Zahle et al.Risø DTU
Design and test of a thick, flatback, high-lift multi-element airfoilAeroelastic Workshop

ResultsWind Tunnel Experiment Plan
Parameter study
� Another parameter study was carried out to determine the performanceof the slat within the test setup grid.
� For each grid position the slat angle was optimized to minimize the costfunction.
� 81 × 60 = 4860 EllipSys2D simulations.
� All carried out using a coarser grid than for the actual optimization (gridlevel 2).
20 of 42 Frederik Zahle et al.Risø DTU
Design and test of a thick, flatback, high-lift multi-element airfoilAeroelastic Workshop

ResultsWind Tunnel Experiment Plan
Parameter study
x
y
-0.3 -0.2 -0.1 0 0.1 0.2 0.3
-0.25
-0.2
-0.15
-0.1
-0.05
0
0.05
0.1
0.15
0.2
0.25
OptimVar-0.5-0.55-0.6-0.65-0.7-0.75-0.8-0.85-0.9-0.95-1
7A5E
1C
3H
7F
20 of 42 Frederik Zahle et al.Risø DTU
Design and test of a thick, flatback, high-lift multi-element airfoilAeroelastic Workshop

ResultsWind Tunnel Experiment Plan
x
y
-0.25 -0.2 -0.15 -0.1 -0.05
-0.05
0
0.05
0.1
OptimVar-0.5-0.55-0.6-0.65-0.7-0.75-0.8-0.85-0.9-0.95-1
7A
5E
1C
3H
7F
20 of 42 Frederik Zahle et al.Risø DTU
Design and test of a thick, flatback, high-lift multi-element airfoilAeroelastic Workshop
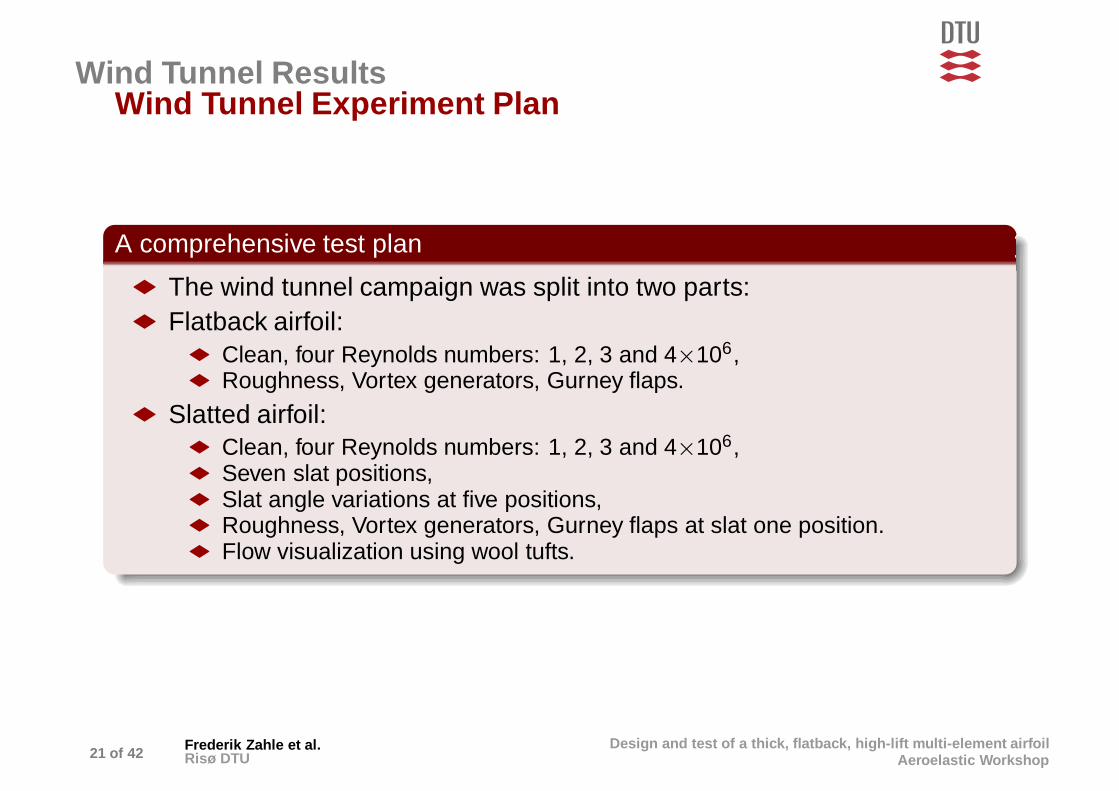
Wind Tunnel ResultsWind Tunnel Experiment Plan
A comprehensive test plan
� The wind tunnel campaign was split into two parts:
� Flatback airfoil:
� Clean, four Reynolds numbers: 1, 2, 3 and 4×10⁶,
� Roughness, Vortex generators, Gurney flaps.
� Slatted airfoil:
� Clean, four Reynolds numbers: 1, 2, 3 and 4×10⁶,
� Seven slat positions,
� Slat angle variations at five positions,
� Roughness, Vortex generators, Gurney flaps at slat one position.
� Flow visualization using wool tufts.
21 of 42 Frederik Zahle et al.Risø DTU
Design and test of a thick, flatback, high-lift multi-element airfoilAeroelastic Workshop

Wind Tunnel ResultsData
Preliminary data!
� The data from the experiment presented here are preliminary and notcorrected for tunnel effects.
� Only selected data will be shown.
� Profile geometries as well as all data will be published and available tothe public.
22 of 42 Frederik Zahle et al.Risø DTU
Design and test of a thick, flatback, high-lift multi-element airfoilAeroelastic Workshop

Wind Tunnel ResultsIsolated flatback airfoilMeasurement sources - lift coefficient
� To measure the lift either the airfoil pressure (AP), the load cell (LC) orthe wall pressure (WP) was used.
� Good agreement up to 5 deg. AOA (except for LC offset).
−20 −15 −10 −5 0 5 10 15 20 25−1
−0.5
0
0.5
1
1.5
2
α [0]
Cl [−
]C
l smooth Re=2⋅106
Surface PressLoad CellWall Press
23 of 42 Frederik Zahle et al.Risø DTU
Design and test of a thick, flatback, high-lift multi-element airfoilAeroelastic Workshop

Wind Tunnel ResultsIsolated flatback airfoilMeasurement sources - drag coefficient
� To measure the drag either the airfoil pressure (AP), the load cell (LC) orthe wake rake (WR) was used.
� Drag behaves as expected for AOA < 5 deg.: CD−AP < CD−WR
� For AOA > 5 deg. AP and LC drag increase drastically.
−20 −15 −10 −5 0 5 10 15 20 250
0.05
0.1
0.15
0.2
0.25
0.3
0.35
α [0]
Cl [−
]
Cd smooth Re=2⋅106
Surface PressLoad CellWake Rake
23 of 42 Frederik Zahle et al.Risø DTU
Design and test of a thick, flatback, high-lift multi-element airfoilAeroelastic Workshop

Wind Tunnel ResultsIsolated flatback airfoilComparison to EllipSys2D
� Variation of TI in EllipSys2D simulations: low TI simulations agree wellwith experiment for AOA < 5 deg.
� For AOA > 5 deg. TI>0.2% apper to be in better agreement.
-0.2 0
0.2 0.4 0.6 0.8
1 1.2 1.4 1.6 1.8
0 5 10 15 20 25
Cl [
-]
Incidence [deg.]
Ell turbEll TI=0.05%Ell TI=0.1%Ell TI=0.2%Ell TI=0.3%
Exp clean
24 of 42 Frederik Zahle et al.Risø DTU
Design and test of a thick, flatback, high-lift multi-element airfoilAeroelastic Workshop

Wind Tunnel ResultsIsolated flatback airfoilComparison to EllipSys2D
� Variation of TI in EllipSys2D simulations: low TI simulations agree wellwith experiment for AOA < 5 deg.
� For AOA > 5 deg. TI>0.2% apper to be in better agreement.
0
0.2
0.4
0.6
0.8
1
1.2
1.4
1.6
1.8
0 0.02 0.04 0.06 0.08 0.1
Cl [
-]
Cd [-]
Ell turbEll TI=0.05%Ell TI=0.1%Ell TI=0.2%Ell TI=0.3%
Exp clean
24 of 42 Frederik Zahle et al.Risø DTU
Design and test of a thick, flatback, high-lift multi-element airfoilAeroelastic Workshop

Wind Tunnel ResultsIsolated flatback airfoil
Variation of Reynolds number - Experimental results only� Increasing Re reduces Cl−max .
−20 −15 −10 −5 0 5 10 15 20 25 30−1
−0.5
0
0.5
1
1.5
2
α [0]
Cl [−
]
Cl smooth cases
Re=1⋅106
Re=2⋅106
Re=3⋅106
Re=4⋅106
25 of 42 Frederik Zahle et al.Risø DTU
Design and test of a thick, flatback, high-lift multi-element airfoilAeroelastic Workshop

Wind Tunnel ResultsIsolated flatback airfoil
Roughness� Roughness tape was mounted at various chordwise positions.
−20 −15 −10 −5 0 5 10 15 20 25−1
−0.5
0
0.5
1
1.5
2
α [0]
Cl [−
]
Cl roughness + VG, Re=2⋅106
SmoothZZ 5%/10%ZZ 2%ZZ 2% VG x/c=30%ZZ 2% VG x/c=20%
26 of 42 Frederik Zahle et al.Risø DTU
Design and test of a thick, flatback, high-lift multi-element airfoilAeroelastic Workshop

Wind Tunnel ResultsIsolated flatback airfoil
Devices� The flatback airfoil was tested with vortex generators and Gurney flaps.
−20 −10 0 10 20 30 40−1
−0.5
0
0.5
1
1.5
2
2.5
3
α [0]
Cl [−
]
Cl smooth. Effects of VG and GF, Re=2⋅106
SmoothVG x/c=30%VG x/c=20%VG x/c=20% GFGFGF DoubleSize
27 of 42 Frederik Zahle et al.Risø DTU
Design and test of a thick, flatback, high-lift multi-element airfoilAeroelastic Workshop

Wind Tunnel ResultsFlatback with slat airfoilReference position 5E
� Variation of TI in EllipSys2D simulations: Lift coefficient vs angle ofattack at the reference position 5E with reference β=-29.35 deg.
� All simulations show on the following slides were carried out withTI=0.2%.
−0.2 0.0 0.2 0.4 0.6 0.8 1.0 1.2
x/c [-]
−0.20
−0.15
−0.10
−0.05
0.00
0.05
0.10
0.15
0.20
0.25
y/c
[-]
Pos = 5E, β = -29.4 deg.
−10 0 10 20 30 40
AOA [deg.]
−0.5
0.0
0.5
1.0
1.5
2.0
2.5
3.0
3.5
4.0
Cl[-]
Pos = 5E, β = -29.35 deg.
EllipSys2D TI=0.1%
EllipSys2D TI=0.2%
EllipSys2D TI=0.3%
EllipSys2D TI=0.35%
Experiment
28 of 42 Frederik Zahle et al.Risø DTU
Design and test of a thick, flatback, high-lift multi-element airfoilAeroelastic Workshop

Wind Tunnel ResultsFlatback with slat airfoilReference position 5EPosition 5E with reference β=-29.35 deg. showing contributions from main,slat and total.
−0.2 0.0 0.2 0.4 0.6 0.8 1.0 1.2
x/c [-]
−0.20
−0.15
−0.10
−0.05
0.00
0.05
0.10
0.15
0.20
0.25
y/c
[-]
Pos = 5E, β = -29.4 deg.
x
y
-0.25 -0.2 -0.15 -0.1 -0.05
-0.05
0
0.05
0.1
OptimVar-0.5-0.55-0.6-0.65-0.7-0.75-0.8-0.85-0.9-0.95-1
7A
5E
1C
3H
7F
−10 0 10 20 30 40
AOA [deg.]
−0.5
0.0
0.5
1.0
1.5
2.0
2.5
3.0
3.5
4.0
Cl[-]
Pos = 5E, β = -29.35 deg.
EllipSys2D total
EllipSys2D main
EllipSys2D slat
Exp total
Exp main
Exp slat
29 of 42 Frederik Zahle et al.Risø DTU
Design and test of a thick, flatback, high-lift multi-element airfoilAeroelastic Workshop

Wind Tunnel ResultsFlatback with slat airfoilReference position 5EPosition 5E with reference β=-29.35 deg. showing contributions from main,slat and total.
−0.2 0.0 0.2 0.4 0.6 0.8 1.0 1.2
x/c [-]
−0.20
−0.15
−0.10
−0.05
0.00
0.05
0.10
0.15
0.20
0.25
y/c
[-]
Pos = 5E, β = -29.4 deg.
x
y
-0.25 -0.2 -0.15 -0.1 -0.05
-0.05
0
0.05
0.1
OptimVar-0.5-0.55-0.6-0.65-0.7-0.75-0.8-0.85-0.9-0.95-1
7A
5E
1C
3H
7F
−10 0 10 20 30 40
AOA [deg.]
−1.0
−0.5
0.0
0.5
1.0
1.5
Cd[-]
Pos = 5E, β = -29.35 deg.
EllipSys2D total
EllipSys2D main
EllipSys2D slat
Exp total
Exp main
Exp slat
Exp wake rake
29 of 42 Frederik Zahle et al.Risø DTU
Design and test of a thick, flatback, high-lift multi-element airfoilAeroelastic Workshop

Wind Tunnel ResultsFlatback with slat airfoilReference position 5EPosition 5E with reference β=-29.35 deg. showing contributions from main,slat and total.
−0.2 0.0 0.2 0.4 0.6 0.8 1.0 1.2
x/c [-]
−0.20
−0.15
−0.10
−0.05
0.00
0.05
0.10
0.15
0.20
0.25
y/c
[-]
Pos = 5E, β = -29.4 deg.
x
y
-0.25 -0.2 -0.15 -0.1 -0.05
-0.05
0
0.05
0.1
OptimVar-0.5-0.55-0.6-0.65-0.7-0.75-0.8-0.85-0.9-0.95-1
7A
5E
1C
3H
7F
−5 0 5 10 15 20 25
AOA [deg.]
0.0
0.1
0.2
0.3
0.4
0.5
0.6
0.7
Cd[-]
Pos = 5E, β = -29.35 deg.
EllipSys2D total
EllipSys2D main
EllipSys2D slat
Exp total
Exp main
Exp slat
Exp wake rake
29 of 42 Frederik Zahle et al.Risø DTU
Design and test of a thick, flatback, high-lift multi-element airfoilAeroelastic Workshop

Wind Tunnel ResultsFlatback with slat airfoilReference position 5EPosition 5E with reference β=-29.35 deg. showing contributions from main,slat and total.
−0.2 0.0 0.2 0.4 0.6 0.8 1.0 1.2
x/c [-]
−0.20
−0.15
−0.10
−0.05
0.00
0.05
0.10
0.15
0.20
0.25
y/c
[-]
Pos = 5E, β = -29.4 deg.
x
y
-0.25 -0.2 -0.15 -0.1 -0.05
-0.05
0
0.05
0.1
OptimVar-0.5-0.55-0.6-0.65-0.7-0.75-0.8-0.85-0.9-0.95-1
7A
5E
1C
3H
7F
−5 0 5 10 15 20
AOA [deg.]
0.00
0.02
0.04
0.06
0.08
0.10
Cd[-]
Pos = 5E, β = -29.35 deg.
EllipSys2D total
EllipSys2D main
EllipSys2D slat
Exp total
Exp main
Exp slat
Exp wake rake
29 of 42 Frederik Zahle et al.Risø DTU
Design and test of a thick, flatback, high-lift multi-element airfoilAeroelastic Workshop

Wind Tunnel ResultsFlatback with slat airfoilReference position 5EPosition 5E with reference β=-29.35 deg. showing contributions from main,slat and total.
−0.2 0.0 0.2 0.4 0.6 0.8 1.0 1.2
x/c [-]
−0.20
−0.15
−0.10
−0.05
0.00
0.05
0.10
0.15
0.20
0.25
y/c
[-]
Pos = 5E, β = -29.4 deg.
x
y
-0.25 -0.2 -0.15 -0.1 -0.05
-0.05
0
0.05
0.1
OptimVar-0.5-0.55-0.6-0.65-0.7-0.75-0.8-0.85-0.9-0.95-1
7A
5E
1C
3H
7F
−0.2 0.0 0.2 0.4 0.6 0.8 1.0
x/c [-]
−2
−1
0
1
2
3
4
5
6
-Cp[-]
Pos = 5E, β = -29.35 deg., AOA = 12 deg.
EllipSys2D
Experiment
29 of 42 Frederik Zahle et al.Risø DTU
Design and test of a thick, flatback, high-lift multi-element airfoilAeroelastic Workshop

Wind Tunnel ResultsFlatback with slat airfoilReference position 5EPosition 5E with reference β=-29.35 deg. showing contributions from main,slat and total.
−0.2 0.0 0.2 0.4 0.6 0.8 1.0 1.2
x/c [-]
−0.20
−0.15
−0.10
−0.05
0.00
0.05
0.10
0.15
0.20
0.25
y/c
[-]
Pos = 5E, β = -29.4 deg.
x
y
-0.25 -0.2 -0.15 -0.1 -0.05
-0.05
0
0.05
0.1
OptimVar-0.5-0.55-0.6-0.65-0.7-0.75-0.8-0.85-0.9-0.95-1
7A
5E
1C
3H
7F
−0.2 0.0 0.2 0.4 0.6 0.8 1.0
x/c [-]
−2
0
2
4
6
8
10
-Cp[-]
Pos = 5E, β = -29.35 deg., AOA = 22 deg.
EllipSys2D
Experiment
29 of 42 Frederik Zahle et al.Risø DTU
Design and test of a thick, flatback, high-lift multi-element airfoilAeroelastic Workshop

Wind Tunnel ResultsFlatback with slat airfoilPosition 7FPosition 7F with reference β=-34.2 deg. showing contributions from main,slat and total.
−0.2 0.0 0.2 0.4 0.6 0.8 1.0 1.2
x/c [-]
−0.20
−0.15
−0.10
−0.05
0.00
0.05
0.10
0.15
0.20
0.25
y/c
[-]
Pos = 7F, β = -34.2 deg.
x
y
-0.25 -0.2 -0.15 -0.1 -0.05
-0.05
0
0.05
0.1
OptimVar-0.5-0.55-0.6-0.65-0.7-0.75-0.8-0.85-0.9-0.95-1
7A
5E
1C
3H
7F
−20 −10 0 10 20 30 40
AOA [deg.]
−0.5
0.0
0.5
1.0
1.5
2.0
2.5
3.0
3.5
Cl[-]
Position 7F β=-34.2 deg.
EllipSys2D total
EllipSys2D main
EllipSys2D slat
Exp total
Exp main
Exp slat
30 of 42 Frederik Zahle et al.Risø DTU
Design and test of a thick, flatback, high-lift multi-element airfoilAeroelastic Workshop

Wind Tunnel ResultsFlatback with slat airfoilPosition 7FPosition 7F with reference β=-34.2 deg. showing contributions from main,slat and total.
−0.2 0.0 0.2 0.4 0.6 0.8 1.0 1.2
x/c [-]
−0.20
−0.15
−0.10
−0.05
0.00
0.05
0.10
0.15
0.20
0.25
y/c
[-]
Pos = 7F, β = -34.2 deg.
x
y
-0.25 -0.2 -0.15 -0.1 -0.05
-0.05
0
0.05
0.1
OptimVar-0.5-0.55-0.6-0.65-0.7-0.75-0.8-0.85-0.9-0.95-1
7A
5E
1C
3H
7F
−0.2 0.0 0.2 0.4 0.6 0.8 1.0
x/c [-]
−2
−1
0
1
2
3
4
5
6
-Cp[-]
Pos = 7F, β = -34.2 deg., AOA = 12 deg.
EllipSys2D
Experiment
30 of 42 Frederik Zahle et al.Risø DTU
Design and test of a thick, flatback, high-lift multi-element airfoilAeroelastic Workshop

Wind Tunnel ResultsFlatback with slat airfoilPosition 7FPosition 7F with reference β=-34.2 deg. showing contributions from main,slat and total.
−0.2 0.0 0.2 0.4 0.6 0.8 1.0 1.2
x/c [-]
−0.20
−0.15
−0.10
−0.05
0.00
0.05
0.10
0.15
0.20
0.25
y/c
[-]
Pos = 7F, β = -34.2 deg.
x
y
-0.25 -0.2 -0.15 -0.1 -0.05
-0.05
0
0.05
0.1
OptimVar-0.5-0.55-0.6-0.65-0.7-0.75-0.8-0.85-0.9-0.95-1
7A
5E
1C
3H
7F
−0.2 0.0 0.2 0.4 0.6 0.8 1.0
x/c [-]
−2
0
2
4
6
8
10
-Cp[-]
Pos = 7F, β = -34.2 deg., AOA = 22 deg.
EllipSys2D
Experiment
30 of 42 Frederik Zahle et al.Risø DTU
Design and test of a thick, flatback, high-lift multi-element airfoilAeroelastic Workshop

Wind Tunnel ResultsFlatback with slat airfoilPosition 7APosition 7A with reference β=-29.4 deg. showing contributions from main,slat and total.
−0.4 −0.2 0.0 0.2 0.4 0.6 0.8 1.0 1.2
x/c [-]
−0.20−0.15−0.10−0.050.000.050.100.150.200.25
y/c
[-]
Pos = 7A, β = -29.4 deg.
x
y
-0.25 -0.2 -0.15 -0.1 -0.05
-0.05
0
0.05
0.1
OptimVar-0.5-0.55-0.6-0.65-0.7-0.75-0.8-0.85-0.9-0.95-1
7A
5E
1C
3H
7F
−20 −10 0 10 20 30 40
AOA [deg.]
−0.5
0.0
0.5
1.0
1.5
2.0
2.5
3.0
3.5
Cl[-]
Position 7A β=-29.4 deg.
EllipSys2D total
EllipSys2D main
EllipSys2D slat
Exp total
Exp main
Exp slat
31 of 42 Frederik Zahle et al.Risø DTU
Design and test of a thick, flatback, high-lift multi-element airfoilAeroelastic Workshop

Wind Tunnel ResultsFlatback with slat airfoilPosition 7APosition 7A with reference β=-29.4 deg. showing contributions from main,slat and total.
−0.4 −0.2 0.0 0.2 0.4 0.6 0.8 1.0 1.2
x/c [-]
−0.20−0.15−0.10−0.050.000.050.100.150.200.25
y/c
[-]
Pos = 7A, β = -29.4 deg.
x
y
-0.25 -0.2 -0.15 -0.1 -0.05
-0.05
0
0.05
0.1
OptimVar-0.5-0.55-0.6-0.65-0.7-0.75-0.8-0.85-0.9-0.95-1
7A
5E
1C
3H
7F
−0.2 0.0 0.2 0.4 0.6 0.8 1.0
x/c [-]
−2
−1
0
1
2
3
4
5
6
-Cp[-]
Pos = 7A, β = -29.4 deg., AOA = 12 deg.
EllipSys2D
Experiment
31 of 42 Frederik Zahle et al.Risø DTU
Design and test of a thick, flatback, high-lift multi-element airfoilAeroelastic Workshop

Wind Tunnel ResultsFlatback with slat airfoilPosition 7APosition 7A with reference β=-29.4 deg. showing contributions from main,slat and total.
−0.4 −0.2 0.0 0.2 0.4 0.6 0.8 1.0 1.2
x/c [-]
−0.20−0.15−0.10−0.050.000.050.100.150.200.25
y/c
[-]
Pos = 7A, β = -29.4 deg.
x
y
-0.25 -0.2 -0.15 -0.1 -0.05
-0.05
0
0.05
0.1
OptimVar-0.5-0.55-0.6-0.65-0.7-0.75-0.8-0.85-0.9-0.95-1
7A
5E
1C
3H
7F
−0.2 0.0 0.2 0.4 0.6 0.8 1.0
x/c [-]
−2
0
2
4
6
8
10
-Cp[-]
Pos = 7A, β = -29.4 deg., AOA = 22 deg.
EllipSys2D
Experiment
31 of 42 Frederik Zahle et al.Risø DTU
Design and test of a thick, flatback, high-lift multi-element airfoilAeroelastic Workshop

Wind Tunnel ResultsFlatback with slat airfoilPosition 1CPosition 1C with reference β=-23.7 deg. showing contributions from main,slat and total.
−0.2 0.0 0.2 0.4 0.6 0.8 1.0 1.2
x/c [-]
−0.2
−0.1
0.0
0.1
0.2
0.3
y/c
[-]
Pos = 1C, β = -23.7 deg.
x
y
-0.25 -0.2 -0.15 -0.1 -0.05
-0.05
0
0.05
0.1
OptimVar-0.5-0.55-0.6-0.65-0.7-0.75-0.8-0.85-0.9-0.95-1
7A
5E
1C
3H
7F
−20 −10 0 10 20 30 40 50
AOA [deg.]
−1.0
−0.5
0.0
0.5
1.0
1.5
2.0
2.5
3.0
3.5
Cl[-]
Position 1C β=-23.7 deg.
EllipSys2D total
EllipSys2D main
EllipSys2D slat
Exp total
Exp main
Exp slat
32 of 42 Frederik Zahle et al.Risø DTU
Design and test of a thick, flatback, high-lift multi-element airfoilAeroelastic Workshop

Wind Tunnel ResultsFlatback with slat airfoilPosition 1CPosition 1C with reference β=-23.7 deg. showing contributions from main,slat and total.
−0.2 0.0 0.2 0.4 0.6 0.8 1.0 1.2
x/c [-]
−0.2
−0.1
0.0
0.1
0.2
0.3
y/c
[-]
Pos = 1C, β = -23.7 deg.
x
y
-0.25 -0.2 -0.15 -0.1 -0.05
-0.05
0
0.05
0.1
OptimVar-0.5-0.55-0.6-0.65-0.7-0.75-0.8-0.85-0.9-0.95-1
7A
5E
1C
3H
7F
−0.2 0.0 0.2 0.4 0.6 0.8 1.0
x/c [-]
−2
−1
0
1
2
3
4
5
6
7
-Cp[-]
Pos = 1C, β = -23.7 deg., AOA = 12 deg.
EllipSys2D
Experiment
32 of 42 Frederik Zahle et al.Risø DTU
Design and test of a thick, flatback, high-lift multi-element airfoilAeroelastic Workshop

Wind Tunnel ResultsFlatback with slat airfoilPosition 1CPosition 1C with reference β=-23.7 deg. showing contributions from main,slat and total.
−0.2 0.0 0.2 0.4 0.6 0.8 1.0 1.2
x/c [-]
−0.2
−0.1
0.0
0.1
0.2
0.3
y/c
[-]
Pos = 1C, β = -23.7 deg.
x
y
-0.25 -0.2 -0.15 -0.1 -0.05
-0.05
0
0.05
0.1
OptimVar-0.5-0.55-0.6-0.65-0.7-0.75-0.8-0.85-0.9-0.95-1
7A
5E
1C
3H
7F
−0.2 0.0 0.2 0.4 0.6 0.8 1.0
x/c [-]
−2
0
2
4
6
8
10
-Cp[-]
Pos = 1C, β = -23.7 deg., AOA = 22 deg.
EllipSys2D
Experiment
32 of 42 Frederik Zahle et al.Risø DTU
Design and test of a thick, flatback, high-lift multi-element airfoilAeroelastic Workshop

Wind Tunnel ResultsFlatback with slat airfoilPosition 3HPosition 3H with reference β=-29.4 deg. showing contributions from main,slat and total.
−0.2 0.0 0.2 0.4 0.6 0.8 1.0 1.2
x/c [-]
−0.20
−0.15
−0.10
−0.05
0.00
0.05
0.10
0.15
0.20
0.25
y/c
[-]
Pos = 3H, β = -25.6 deg.
x
y
-0.25 -0.2 -0.15 -0.1 -0.05
-0.05
0
0.05
0.1
OptimVar-0.5-0.55-0.6-0.65-0.7-0.75-0.8-0.85-0.9-0.95-1
7A
5E
1C
3H
7F
−20 −10 0 10 20 30 40
AOA [deg.]
−1.0
−0.5
0.0
0.5
1.0
1.5
2.0
2.5
3.0
Cl[-]
Position 3H β=-25.6 deg.
EllipSys2D total
EllipSys2D main
EllipSys2D slat
Exp total
Exp main
Exp slat
33 of 42 Frederik Zahle et al.Risø DTU
Design and test of a thick, flatback, high-lift multi-element airfoilAeroelastic Workshop

Wind Tunnel ResultsFlatback with slat airfoilPosition 3HPosition 3H with reference β=-29.4 deg. showing contributions from main,slat and total.
−0.2 0.0 0.2 0.4 0.6 0.8 1.0 1.2
x/c [-]
−0.20
−0.15
−0.10
−0.05
0.00
0.05
0.10
0.15
0.20
0.25
y/c
[-]
Pos = 3H, β = -25.6 deg.
x
y
-0.25 -0.2 -0.15 -0.1 -0.05
-0.05
0
0.05
0.1
OptimVar-0.5-0.55-0.6-0.65-0.7-0.75-0.8-0.85-0.9-0.95-1
7A
5E
1C
3H
7F
−0.2 0.0 0.2 0.4 0.6 0.8 1.0
x/c [-]
−2
−1
0
1
2
3
4
5
6
7
-Cp[-]
Pos = 3H, β = -25.6 deg., AOA = 12 deg.
EllipSys2D
Experiment
33 of 42 Frederik Zahle et al.Risø DTU
Design and test of a thick, flatback, high-lift multi-element airfoilAeroelastic Workshop

Wind Tunnel ResultsFlatback with slat airfoilPosition 3HPosition 3H with reference β=-29.4 deg. showing contributions from main,slat and total.
−0.2 0.0 0.2 0.4 0.6 0.8 1.0 1.2
x/c [-]
−0.20
−0.15
−0.10
−0.05
0.00
0.05
0.10
0.15
0.20
0.25
y/c
[-]
Pos = 3H, β = -25.6 deg.
x
y
-0.25 -0.2 -0.15 -0.1 -0.05
-0.05
0
0.05
0.1
OptimVar-0.5-0.55-0.6-0.65-0.7-0.75-0.8-0.85-0.9-0.95-1
7A
5E
1C
3H
7F
−0.2 0.0 0.2 0.4 0.6 0.8 1.0
x/c [-]
−2
0
2
4
6
8
10
-Cp[-]
Pos = 3H, β = -25.6 deg., AOA = 22 deg.
EllipSys2D
Experiment
33 of 42 Frederik Zahle et al.Risø DTU
Design and test of a thick, flatback, high-lift multi-element airfoilAeroelastic Workshop

Wind Tunnel ResultsFlatback with slat airfoilPosition 5E changing the slat angle β.
� 2D CFD predicts best performance for β=-29.35 deg.
−0.2 0.0 0.2 0.4 0.6 0.8 1.0 1.2
x/c [-]
−0.2
−0.1
0.0
0.1
0.2
0.3
y/c
[-]
Pos = 5E, β variations
beta=-27.4 deg.
beta=-29.4 deg.
beta=-36.4 deg.
beta=-39.4 deg.
x
y
-0.25 -0.2 -0.15 -0.1 -0.05
-0.05
0
0.05
0.1
OptimVar-0.5-0.55-0.6-0.65-0.7-0.75-0.8-0.85-0.9-0.95-1
7A
5E
1C
3H
7F
−15 −10 −5 0 5 10 15 20 25 30
AOA [deg.]
−0.5
0.0
0.5
1.0
1.5
2.0
2.5
3.0
3.5
4.0
Cl[-]
Pos = 5E, β variations
EllipSys2D beta=-27.4 deg.
EllipSys2D beta=-29.6 deg.
EllipSys2D beta=-35.35 deg.
EllipSys2D beta=-39.4 deg.
34 of 42 Frederik Zahle et al.Risø DTU
Design and test of a thick, flatback, high-lift multi-element airfoilAeroelastic Workshop

Wind Tunnel ResultsFlatback with slat airfoilPosition 5E changing the slat angle β.
� 2D CFD predicts best performance for β=-29.35 deg.
� Experimental results show an increasing maximum lift coefficient fordecreasing β.
−0.2 0.0 0.2 0.4 0.6 0.8 1.0 1.2
x/c [-]
−0.2
−0.1
0.0
0.1
0.2
0.3
y/c
[-]
Pos = 5E, β variations
beta=-27.4 deg.
beta=-29.4 deg.
beta=-36.4 deg.
beta=-39.4 deg.
x
y
-0.25 -0.2 -0.15 -0.1 -0.05
-0.05
0
0.05
0.1
OptimVar-0.5-0.55-0.6-0.65-0.7-0.75-0.8-0.85-0.9-0.95-1
7A
5E
1C
3H
7F
−10 0 10 20 30 40 50
AOA [deg.]
−1
0
1
2
3
4
5
Cl[-]
Pos = 5E, β variations
Exp beta=-27.4 deg.
Exp beta=-29.6 deg.
Exp beta=-35.4 deg.
Exp beta=-39.4 deg.
34 of 42 Frederik Zahle et al.Risø DTU
Design and test of a thick, flatback, high-lift multi-element airfoilAeroelastic Workshop

Wind Tunnel ResultsFlatback with slat airfoilPosition 5E changing the slat angle β.
� 2D CFD predicts best performance for β=-29.35 deg.
� Experimental results show an increasing maximum lift coefficient fordecreasing β.
−0.2 0.0 0.2 0.4 0.6 0.8 1.0 1.2
x/c [-]
−0.2
−0.1
0.0
0.1
0.2
0.3
y/c
[-]
Pos = 5E, β variations
beta=-27.4 deg.
beta=-29.4 deg.
beta=-36.4 deg.
beta=-39.4 deg.
x
y
-0.25 -0.2 -0.15 -0.1 -0.05
-0.05
0
0.05
0.1
OptimVar-0.5-0.55-0.6-0.65-0.7-0.75-0.8-0.85-0.9-0.95-1
7A
5E
1C
3H
7F
−20 −10 0 10 20 30 40
AOA [deg.]
−1
0
1
2
3
4
Cl[-]
Pos = 5E, β = -35.4 deg.
EllipSys2D total
EllipSys2D main
EllipSys2D slat
Exp total
Exp main
Exp slat
34 of 42 Frederik Zahle et al.Risø DTU
Design and test of a thick, flatback, high-lift multi-element airfoilAeroelastic Workshop

Wind Tunnel ResultsFlatback with slat airfoilPosition 5E changing the slat angle β.
� 2D CFD predicts best performance for β=-29.35 deg.
� Experimental results show an increasing maximum lift coefficient fordecreasing β.
−0.2 0.0 0.2 0.4 0.6 0.8 1.0 1.2
x/c [-]
−0.2
−0.1
0.0
0.1
0.2
0.3
y/c
[-]
Pos = 5E, β variations
beta=-27.4 deg.
beta=-29.4 deg.
beta=-36.4 deg.
beta=-39.4 deg.
x
y
-0.25 -0.2 -0.15 -0.1 -0.05
-0.05
0
0.05
0.1
OptimVar-0.5-0.55-0.6-0.65-0.7-0.75-0.8-0.85-0.9-0.95-1
7A
5E
1C
3H
7F
−20 −10 0 10 20 30 40 50
AOA [deg.]
−1
0
1
2
3
4
5
Cl[-]
Pos = 5E, β = -39.4 deg.
EllipSys2D total
EllipSys2D main
EllipSys2D slat
Exp total
Exp main
Exp slat
34 of 42 Frederik Zahle et al.Risø DTU
Design and test of a thick, flatback, high-lift multi-element airfoilAeroelastic Workshop

Wind Tunnel ResultsFlatback with slat airfoil2D Tunnel Effects
� 2D simulations were carried out using a wind tunnel setup withsymmetry conditions on top and bottom walls.
� 2D simulations with same airfoil grids but with outer mesh boundariesplaced 30c away from airfoil made for comparison.
35 of 42 Frederik Zahle et al.Risø DTU
Design and test of a thick, flatback, high-lift multi-element airfoilAeroelastic Workshop

Wind Tunnel ResultsFlatback with slat airfoil2D Tunnel Effects
� Lift coefficient increases in a tunnel configurations.
� Drag coefficient is largely unchanged.
� 2D tunnel effects cannot explain the discrepancies seen betweensimulations and measurements.
0.5
1
1.5
2
2.5
3
3.5
4
0 5 10 15 20 25 30 35
Cl [
-]
Incidence [deg.]
TunnelNo tunnel
36 of 42 Frederik Zahle et al.Risø DTU
Design and test of a thick, flatback, high-lift multi-element airfoilAeroelastic Workshop

Wind Tunnel ResultsFlatback with slat airfoil2D Tunnel Effects
� Lift coefficient increases in a tunnel configurations.
� Drag coefficient is largely unchanged.
� 2D tunnel effects cannot explain the discrepancies seen betweensimulations and measurements.
0
0.1
0.2
0.3
0.4
0.5
0.6
0.7
0.8
0 5 10 15 20 25 30 35
Cd
[-]
Incidence [deg.]
TunnelNo tunnel
36 of 42 Frederik Zahle et al.Risø DTU
Design and test of a thick, flatback, high-lift multi-element airfoilAeroelastic Workshop

Wind Tunnel ResultsFlow Visualization3D surface flow
� Flow visualization using tufts revealed 3D effects caused by wall effectseven at low AOA.
� Below picture is from AOA=22 deg.
37 of 42 Frederik Zahle et al.Risø DTU
Design and test of a thick, flatback, high-lift multi-element airfoilAeroelastic Workshop

Wind Tunnel ResultsFlow Visualization3D surface flow
� 3D CFD simulations by Niels N. Sørensen on an FB-3500-1750 flatbackairfoil show similar trends when comparing simulations with and withoutwalls.
� Below picture is from AOA=19 deg.
38 of 42 Frederik Zahle et al.Risø DTU
Design and test of a thick, flatback, high-lift multi-element airfoilAeroelastic Workshop

Wind Tunnel ResultsFlow Visualization
Wind Tunnel Condensation Trails
� Running the wind tunnel at 100 m/s (Re = 4e6) resulted in condensationtrails forming on the suction surface of the slat and main element.
� The very low pressure coefficients (Cp=-9) resulted in the vapourcondensation threshold being reached.
39 of 42 Frederik Zahle et al.Risø DTU
Design and test of a thick, flatback, high-lift multi-element airfoilAeroelastic Workshop

Wind Tunnel ResultsFlow Visualization
High angle of attack flow re-attachment
� Using wool tufts to visualize the surface flow patterns we observed thatthe flow seemingly did not separate on the mail airfoil even for angles ofattack up to 50 deg.
� We knew the flow was stalled, but why did it appear to be attached?
<animation: not included>
40 of 42 Frederik Zahle et al.Risø DTU
Design and test of a thick, flatback, high-lift multi-element airfoilAeroelastic Workshop

Wind Tunnel ResultsFlow Visualization
2D CFD particle tracking simulation
� A 2D CFD simulation was carried out at 40 deg. incidence with particlesseeded upstream of the airfoil.
� In the animation it is clearly seen that particles remain attached to thesurface of the main airfoil.
<animation: http://www.youtube.com/watch?v=3oal5Mohq9g>
40 of 42 Frederik Zahle et al.Risø DTU
Design and test of a thick, flatback, high-lift multi-element airfoilAeroelastic Workshop

ConclusionsConclusions
Optimization method for multi-element airfoils� Method has been implemented to optimize the shape of a multi-element
airfoil.
� Mesh generation has shown to be very robust.
� On a cluster, optimization with 5 design variables required approx. 10hrs.
41 of 42 Frederik Zahle et al.Risø DTU
Design and test of a thick, flatback, high-lift multi-element airfoilAeroelastic Workshop

ConclusionsConclusions
Optimization method for multi-element airfoils
Design of a high lift, thick, flatback, multi-element airfoil
� A 40% flatback and 30% slat airfoil was designed that was predicted tohave a Cl−max =3.4.
� Less roughness sensitivity than flatback airfoil alone.
� Extensive parameter study carried out to map the performance of theslat at different positions.
41 of 42 Frederik Zahle et al.Risø DTU
Design and test of a thick, flatback, high-lift multi-element airfoilAeroelastic Workshop

ConclusionsConclusions
Optimization method for multi-element airfoils
Design of a high lift, thick, flatback, multi-element airfoil
Wind Tunnel Campaign
� The multi-element airfoil was tested in the LM Wind Power wind tunnel.
� Comprehensive test matrix, data still being processed.
� Generally good agreement for lift (AP) and drag (WR).
� Comparison of AP and WP revealed what is believed to be severe 3Deffects.
� Flow visualization confirmed this.
� The AP drag and WR drag were in very poor agreement.
41 of 42 Frederik Zahle et al.Risø DTU
Design and test of a thick, flatback, high-lift multi-element airfoilAeroelastic Workshop

ConclusionsFuture Work
EUDP application in collaboration with Siemens and LM
� WP1: Design and validation of new thick airfoils.
� WP2: Identification of 2D/3D thick airfoil data.
� WP3: Identification of the standstill problem using aeroelastic 3D CFD.
� WP4: Identification of the importance of elastic couplings in theaeroelatic behaviour of wind turbine blades
42 of 42 Frederik Zahle et al.Risø DTU
Design and test of a thick, flatback, high-lift multi-element airfoilAeroelastic Workshop

ConclusionsFuture Work
EUDP application in collaboration with Siemens and LM
� WP1: Design and validation of new thick airfoils.
� WP2: Identification of 2D/3D thick airfoil data.
� WP3: Identification of the standstill problem using aeroelastic 3D CFD.
� WP4: Identification of the importance of elastic couplings in theaeroelatic behaviour of wind turbine blades
Thank you for listening :-)
42 of 42 Frederik Zahle et al.Risø DTU
Design and test of a thick, flatback, high-lift multi-element airfoilAeroelastic Workshop

Risø DTU is the National Laboratory for Sustainable Energy. Our research focuses on development of energy technologies and systems with minimal effect on climate, and contributes to innovation, education and policy. Risø has large experimental facilities and interdisciplinary research environments, and includes the national centre for nuclear technologies.
Risø DTU National Laboratory for Sustainable Energy Technical University of Denmark Frederiksborgvej 399 PO Box 49 DK-4000 Roskilde Denmark Phone +45 4677 4677 Fax +45 4677 5688 www.risoe.dtu.dk