
Destination brand Cape Town & Western Cape: an …2)2015_july-nov.pdf · assessment of...
20
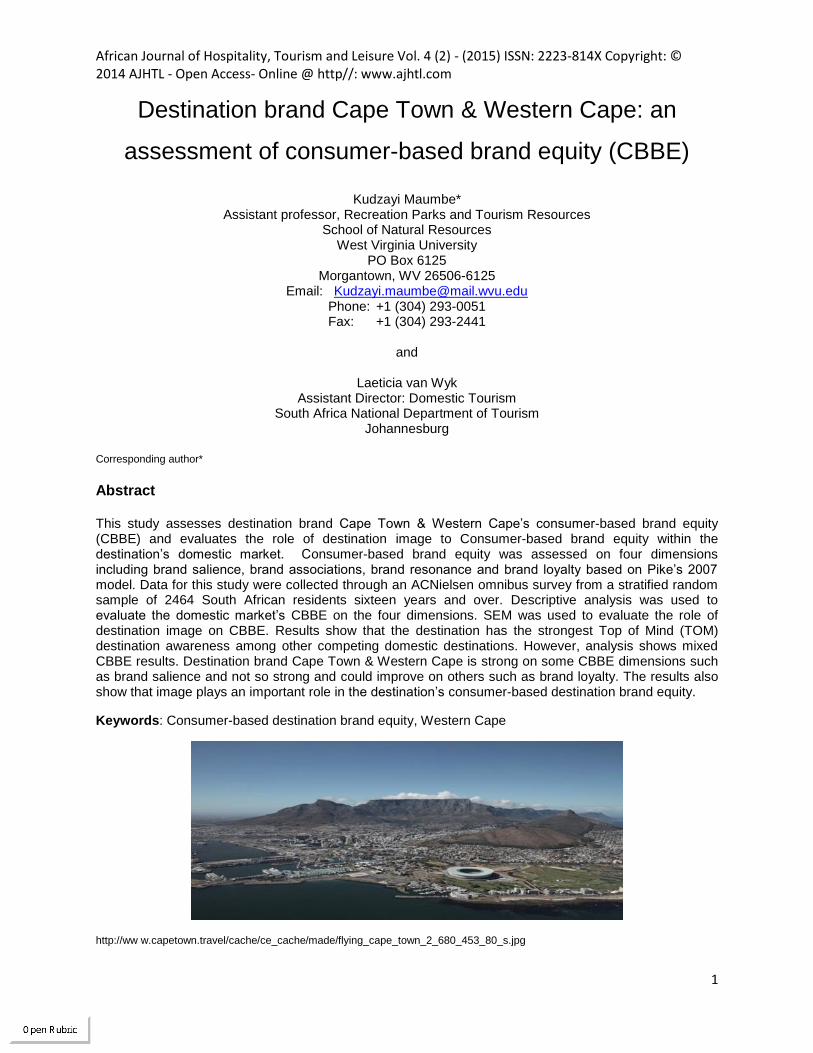
African Journal of Hospitality, Tourism and Leisure Vol. 4 (2) - (2015) ISSN: 2223-814X Copyright: © 2014 AJHTL - Open Access- Online @ http//: www.ajhtl.com 1 Destination brand Cape Town & Western Cape: an assessment of consumer-based brand equity (CBBE) Kudzayi Maumbe* Assistant professor, Recreation Parks and Tourism Resources School of Natural Resources West Virginia University PO Box 6125 Morgantown, WV 26506-6125 Email: [email protected] Phone: +1 (304) 293-0051 Fax: +1 (304) 293-2441 and Laeticia van Wyk Assistant Director: Domestic Tourism South Africa National Department of Tourism Johannesburg Corresponding author* Abstract This study assesses destination brand Cape Town & Western Cape’s consumer-based brand equity (CBBE) and evaluates the role of destination image to Consumer-based brand equity within the destination’s domestic market. Consumer-based brand equity was assessed on four dimensions including brand salience, brand associations, brand resonance and brand loyalty based on Pike’s 2007 model. Data for this study were collected through an ACNielsen omnibus survey from a stratified random sample of 2464 South African residents sixteen years and over. Descriptive analysis was used to evaluate the domestic market’s CBBE on the four dimensions. SEM was used to evaluate the role of destination image on CBBE. Results show that the destination has the strongest Top of Mind (TOM) destination awareness among other competing domestic destinations. However, analysis shows mixed CBBE results. Destination brand Cape Town & Western Cape is strong on some CBBE dimensions such as brand salience and not so strong and could improve on others such as brand loyalty. The results also show that image plays an important role in the destination’s consumer-based destination brand equity. Keywords: Consumer-based destination brand equity, Western Cape http://ww w.capetown.travel/cache/ce_cache/made/flying_cape_town_2_680_453_80_s.jpg
Transcript of Destination brand Cape Town & Western Cape: an …2)2015_july-nov.pdf · assessment of...
African Journal of Hospitality, Tourism and Leisure Vol. 4 (2) - (2015) ISSN: 2223-814X Copyright: © 2014 AJHTL - Open Access- Online @ http//: www.ajhtl.com
1
Destination brand Cape Town & Western Cape: an
assessment of consumer-based brand equity (CBBE)
Kudzayi Maumbe* Assistant professor, Recreation Parks and Tourism Resources
School of Natural Resources West Virginia University
PO Box 6125 Morgantown, WV 26506-6125
Email: [email protected] Phone: +1 (304) 293-0051 Fax: +1 (304) 293-2441
and
Laeticia van Wyk
Assistant Director: Domestic Tourism South Africa National Department of Tourism
Johannesburg
Corresponding author*
Abstract This study assesses destination brand Cape Town & Western Cape’s consumer-based brand equity (CBBE) and evaluates the role of destination image to Consumer-based brand equity within the destination’s domestic market. Consumer-based brand equity was assessed on four dimensions including brand salience, brand associations, brand resonance and brand loyalty based on Pike’s 2007 model. Data for this study were collected through an ACNielsen omnibus survey from a stratified random sample of 2464 South African residents sixteen years and over. Descriptive analysis was used to evaluate the domestic market’s CBBE on the four dimensions. SEM was used to evaluate the role of destination image on CBBE. Results show that the destination has the strongest Top of Mind (TOM) destination awareness among other competing domestic destinations. However, analysis shows mixed CBBE results. Destination brand Cape Town & Western Cape is strong on some CBBE dimensions such as brand salience and not so strong and could improve on others such as brand loyalty. The results also show that image plays an important role in the destination’s consumer-based destination brand equity.
Keywords: Consumer-based destination brand equity, Western Cape
http://ww w.capetown.travel/cache/ce_cache/made/flying_cape_town_2_680_453_80_s.jpg
African Journal of Hospitality, Tourism and Leisure Vol. 4 (2) - (2015) ISSN: 2223-814X Copyright: © 2014 AJHTL - Open Access- Online @ http//: www.ajhtl.com
2
Introduction
Destination brand Cape Town & Western Cape was launched in 2004 with the establishment of Cape Town Routes Unlimited (CTRU), the then Provincial Destination Marketing Organization (DMO). The mandate of the DMO was to market the Western Cape Province as a premier tourism destination both domestic and abroad. Brand Cape Town & Western Cape is the province’s overall brand supported by six regional brands representing the six tourism regions of the Western Cape Province. The main and regional brands were established at the same time to enhance the destination’s image and more importantly, to present a single and consistent image of the destination in both the domestic and global markets. The domestic tourism market is important to the South African tourism industry as it accounts for about 79% of the country’s total tourism volume; 23- 27% of total tourism expenditure and about 3% of GDP (South African Tourism (SAT), 2011). While international tourism accounts for the majority of tourism expenditure in the Western Cape Province, domestic tourism is just as important for the province’s tourism sector accounting for about R3.3b from four million domestic trips a year (SAT, 2011). The main domestic tourism source markets for the Western Cape Province include: the Western Cape itself, Gauteng, the Eastern Cape and KwaZulu Natal (KZN). The Western Cape is marketed under six themes representing the whole destination’s identity including: Good Food and Wine; Cosmopolitan Vibe; Body, Mind & Spirit; Outdoor Active; Natural Scenic Beauty; Rich Culture and Heritage. With the growing importance of the domestic market to the province’s tourism industry coupled with increasing competition among different domestic destinations, it became important for destination management to evaluate the effectiveness of the destination brand in
enhancing overall destination competitiveness in relation to other domestic destinations. Also, since the launch of the destination and regional brands in 2004 no studies had been done to assess the effectiveness of the destination brand. This study, therefore, sought to assess the effectiveness of destination brand Cape Town & Western Cape in the domestic market, through the customer/consumer-based brand equity approach. The specific objectives of the study were to:
Assess destination brand Cape Town & Western Cape’s consumer-based destination brand equity (CBBE) on four dimensions including:
o Destination brand salience
o Destination brand associations
o Destination brand resonance
o And destination brand loyalty
Evaluate the role of destination image in consumer-based destination brand equity.
Literature review Destination branding Ritchie & Ritchie (1998, p. 103) define a destination brand as a name, logo, work mark or other graphic that both identifies and differentiates a destination. A destination brand also conveys the promise of memorable travel experiences uniquely associated with the destination, as well as serves to consolidate and reinforce the recollection of pleasurable memories of the destination experience. While branding of consumer goods and services has been widely studied, branding of destinations has mostly been limited and narrowly equated to logos and taglines (Blain et al., 2005). As
African Journal of Hospitality, Tourism and Leisure Vol. 4 (2) - (2015) ISSN: 2223-814X Copyright: © 2014 AJHTL - Open Access- Online @ http//: www.ajhtl.com
3
illustrated by Ritchie & Ritchie’s (1998) definition, destination branding goes far beyond just logos and taglines. A destination brand should serve two major roles. First, is selection, the extent to which the destination is selected by potential visitors over others; second is recollection, the ease, frequency and strength of recall of the destination experience (Ritchie & Crouch, 2003, p. 200). According to Ritchie & Crouch (2003, p. 200) in-order to fulfill the selection role a destination brand should achieve five functions including: identification, the degree to which the destination brand is recognized among others; differentiation, the destination shouldn’t be confused with others; anticipation, generate desire to visit; expectation and reassurance. For the recollection role, the destination brand should achieve two functions: consolidation, tie together the memories of the destination experience; and reinforcement, cement a consolidated and coherent memory of the destination experience. The main focus of most previous research on destination branding has been on destination image (Baluglo & McCleary, 1999; Echtner & Ritchie, 1993; Mackay & Fesenmaier, 2000; Sirgy & Su, 2000), but more have also focused on other components of destination branding including brand personality (Aaker, 1997; Eckinci & Hosany, 2006; Henderson, 2000; Murphy, Moscardo & Benckendorff, 2007; Santos, 2004); brand equity (Boo, Busser & Baluglo, 2009; Konecnik & Gartner, 2007); destination brand awareness, brand quality, brand value, and brand loyalty (Boo et al., 2009; Hackinson, 2004). While image studies are widely represented in literature, destination image, according to Cai (2002) is not branding as it lacks the critical link of brand identity. Brand identity is the supply-side perspective of the brand concept, while brand image is defined as the demand driven perspective on a destination’s brand (Konecnik & Go, 2008). Consumers build image of a destination in their minds according to the brand identity projected by
the destination while the destination enhances or modifies their identity based on their understanding of the destination’s image in the consumers’ minds (Qu et al., 2011). This study includes both identity and image elements. While both components are critical in destination branding, current literature is overwhelmingly biased towards image studies and not as much on identity. Even more scarce is literature on destination brand performance evaluation. This study, therefore, evaluates the performance of destination brand Cape Town & the Western Cape, through consumer-based brand equity. The study also seeks to assess the role of image on consumer-based destination brand equity given the abundancy of destination image research.
Destination brand performance evaluation Evaluation of brand performance is critical for management to understand the impact of the brand in enhancing destination image and attracting visitors. Ritchie & Crouch assert that a destination brand’s effectiveness should be assessed based on the brand’s ability to meet the previously discussed seven selection and recollection roles that a destination brand should fulfill. They suggest different methods that can be applied to evaluate the brand’s effectiveness on each of the seven functions. Kaplanidou & Vogt (2003) identify several indicators of destination brand success or failure including: brand name awareness, visitors’ perceptions, visitors’ opinions and attitudes, brand loyalty and travel behaviors. Recently research on destination brand performance has focused on brand equity, specifically consumer-based brand equity (CBBE). The brand equity concept consists of two dimensions: brand strength and brand value. Brand strength comes from consumers’ perspectives and behaviors while brand value depends on brand managers’ ability to leverage the strength to
African Journal of Hospitality, Tourism and Leisure Vol. 4 (2) - (2015) ISSN: 2223-814X Copyright: © 2014 AJHTL - Open Access- Online @ http//: www.ajhtl.com
4
achieve and sustain premium prices, superior profits and lowered risks (Srivastava & Shocker 1991). Brand equity, therefore, has been seen from two different perspectives including financial and consumer-based. The financial asset value of a brand is an outcome of the consumer-based brand equity, since the value that customers place in a brand is the driving force behind increasing financial gains (Lassar, Mittal & Sharma, 1995). Overall, brand equity comes from the greater confidence that consumers have in a brand in relation to its competitors. The confidence then translates into loyalty and consumers’ willingness to pay a price premium for the brand (Lassar et al., 1995). Consumer-based brand equity, therefore, is “the overall utility that the consumer associates to the use and consumption of the brand: including associations expressing both functional and symbolic utilities,” (Vazquez, Del Rio & Iglesias, 2002, p. 28). It occurs when the consumer is familiar with the brand and has favorable, strong and unique brand associations in memory (Kamakura & Russell, 1993). Identifying and defining brand equity is one thing, evaluating and measuring it, is another. Several methods have been suggested and researched to measure brand equity. Acker (1996) developed what he termed the Brand Equity Ten, representing four dimensions of brand equity: loyalty, perceived quality, associations and awareness. The brand equity ten measures are categorized into five: loyalty measures, perceived quality/leadership measures, associations/differentiation measures, awareness measures and market behavior measures. Loyalty measures include price premium and satisfaction/loyalty; perceived quality measures include perceived quality and leadership; association measures are perceived value, brand personality and organizational associations; awareness measure is simply brand awareness; market behavior measures include market share and price and distribution indices (Aaker,
1996, p. 105). Martin and Brown (1990) identified five dimensions of brand equity: perceived quality, perceived value, image, trustworthiness and commitment. Based on their research on consumer goods (televisions and watches) Lassar et al. (1995) concluded that consumer-based brand equity consists of five dimensions: performance, value, social image, trustworthiness and commitment. Keller (1993) suggests two methods to measure consumer-based brand equity: the indirect approach that measures brand knowledge including brand awareness and image; and the direct approach that measures the impact of brand knowledge on consumer responses to marketing programs. Keller’s methods to evaluate brand equity is based on his definition of consumer-based brand equity that it is the differential effect of brand knowledge on consumer responses to the brand’s marketing efforts. Consumer responses to marketing include: perceptions, preferences and behavior. Pappu, Quester & Cooksey (2005) confirmed a four dimension (brand awareness, brand association, perceived quality and brand loyalty) measure of consumer-based brand equity on their research on automobile brands. While all these methods include different factors to measure consumer-based brand equity, they are all consistent on a few things that are critical to brand equity: value that the brand brings to consumers, brand awareness and associations. Consumers have to be aware of the brand, also the brand has to have strong, unique and favorable associations in the consumer’s mind for it to be included in the consideration set. While research on destination branding has been going on since the early 90s not much has been done to track the effectiveness of destination brands. Assessing the effectiveness of destination brands is more complex than that for consumer goods because financial returns, including price premiums, the most common measures of effectiveness of consumer goods brands
African Journal of Hospitality, Tourism and Leisure Vol. 4 (2) - (2015) ISSN: 2223-814X Copyright: © 2014 AJHTL - Open Access- Online @ http//: www.ajhtl.com
5
are not very practical measures for effectiveness of tourism destination brands. While some researchers (Kaplanidou & Vogt, 2003; Ritchie & Crouch, 2003) have suggested several methods to evaluate brand performance, consumer-based brand equity research has not been widely applied to destination brand assessment. It has been used more on consumer goods and services than it has been on destination brands. A few researchers (Boo, Busser & Baluglo, 2009; Lee & Back, 2008; Pike, 2007; Pike et al., 2010) have applied the concept of consumer-based brand equity to evaluate tourism destination/place brands. Pike’s (2007) Australia study to evaluate the effectiveness of the “Take time to discover Bundaberg Coral Isles and County,” brand was one of the earliest applications of consumer-based brand equity to tourism destination brands. Pike drew from earlier studies: consumer-based brand equity studies by Aaker (1991; 1996) and Keller (1993; 1998); and the hierarchy of effects model by Lavidge & Steiner (1961). Pike (2007) evaluated the destination’s brand effectiveness on four dimensions: brand salience, brand associations, brand resonance and brand loyalty in a hierarchy of effects format, with brand salience as the foundation of the hierarchy and loyalty as the highest level of the hierarchy. Konecnick and Gartner’s (2007) model of creating brand equity included four dimensions: awareness, image, quality and loyalty. While these don’t depart too far from other dimensions from previous research, Konecnick and Gartner (2007) considered image as the core of a brand which devolves into dimensions as the destination’s name becomes well known. Their findings showed that, while all the four dimensions are important for a destination’s CBBE, image is the overall most important dimension of CBBE. Following Konecnick & Gartner’s findings, in a later study investigating the relationships among CBBE dimensions, Pike et al. (2009) replaced two earlier CBBE dimensions (brand associations and brand resonance) with
brand image and perceptions of quality. The findings showed that brand salience is important for brand equity and significantly and positively impacts brand image, brand’s perceived quality and brand loyalty. Boo, Busser & Baluglo (2009) added additional dimensions: brand value and brand experience. However, the relevance of the brand value dimension was questionable as it didn’t significantly relate to the other important dimensions such as awareness and brand quality. While literature shows a diversity of methods and dimensions to measure CBBE, there seems to be consensus that all these factors are important to a destination brand’s CBBE. Also, some factors seem consistent such as awareness, image, quality and loyalty. This study evaluates CBBE for destination brand Cape Town & Western Cape based on Pike’s 2007 model. The study evaluates four CBBE dimensions including brand salience, associations, resonance and loyalty. The study goes further to investigate the role of image in CBBE based on the argument that image is the core of branding and most important dimension of destination brand equity (Cai, 2002; Konecnick & Gartner, 2007; Pike et al., 2007).
Conceptual background This study has two main goals: to evaluate destination brand Cape Town & Western Cape’s CBBE and also investigate the role of image on CBBE. The first goal is based on Pike’s (2007) model of CBBE. Pike argues that brand salience, representing the strength of the destination’s presence in the consumer’s mind is the foundation of the CBBE hierarchy constituting of brand salience, brand associations, brand resonance and brand loyalty at the top of the hierarchy. Brand associations represent anything that the brand is linked to in consumer’s memory, while brand resonance represents the consumers’ willingness to engage the brand (Pike, 2007). Brand loyalty, measured by repeat visitation and
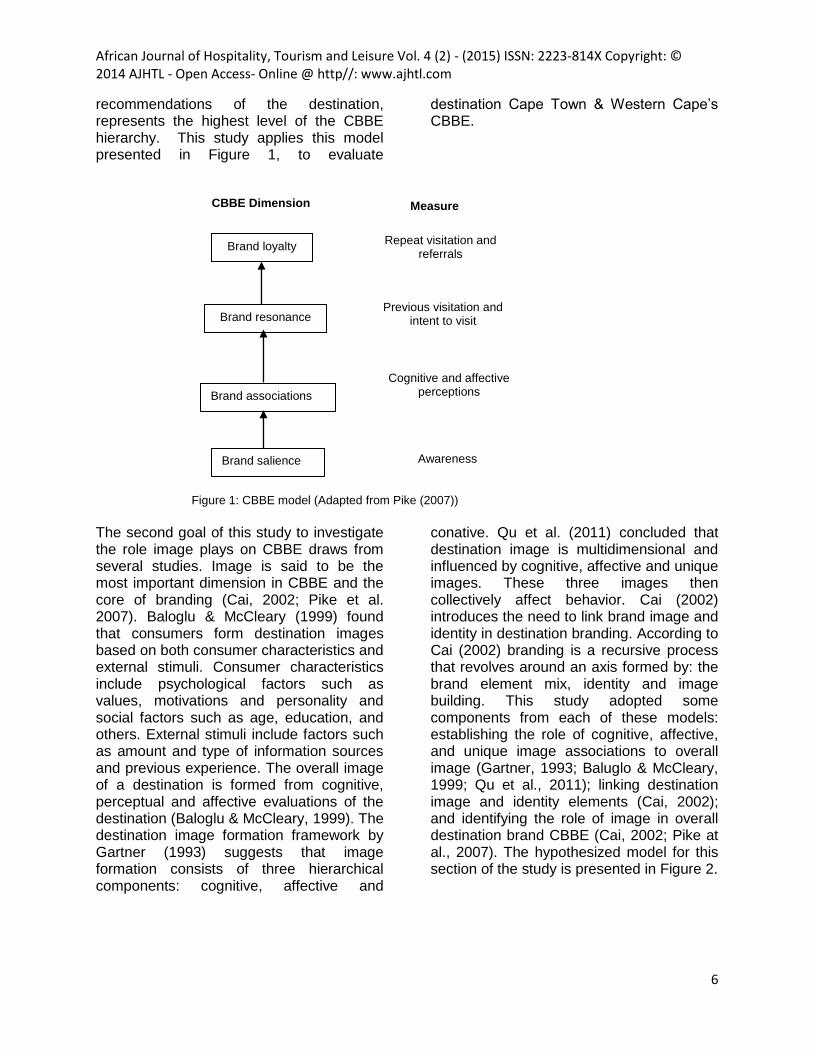
African Journal of Hospitality, Tourism and Leisure Vol. 4 (2) - (2015) ISSN: 2223-814X Copyright: © 2014 AJHTL - Open Access- Online @ http//: www.ajhtl.com
6
recommendations of the destination, represents the highest level of the CBBE hierarchy. This study applies this model presented in Figure 1, to evaluate
destination Cape Town & Western Cape’s CBBE.
Figure 1: CBBE model (Adapted from Pike (2007))
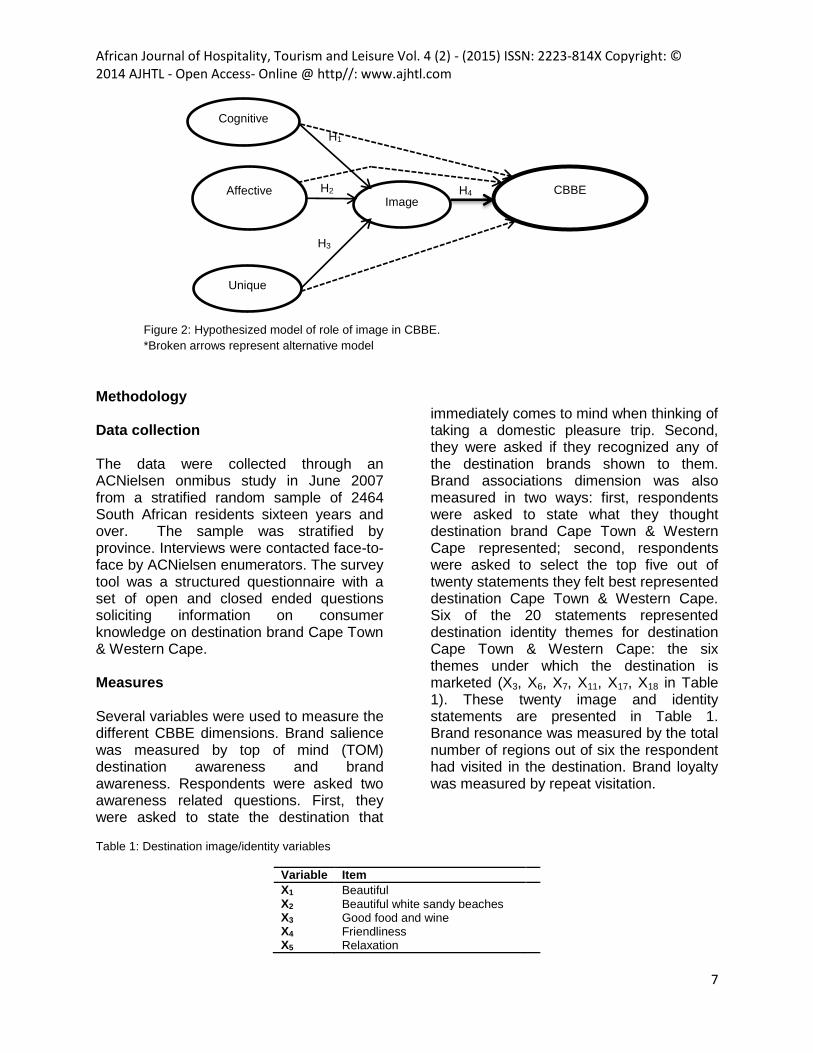
The second goal of this study to investigate the role image plays on CBBE draws from several studies. Image is said to be the most important dimension in CBBE and the core of branding (Cai, 2002; Pike et al. 2007). Baloglu & McCleary (1999) found that consumers form destination images based on both consumer characteristics and external stimuli. Consumer characteristics include psychological factors such as values, motivations and personality and social factors such as age, education, and others. External stimuli include factors such as amount and type of information sources and previous experience. The overall image of a destination is formed from cognitive, perceptual and affective evaluations of the destination (Baloglu & McCleary, 1999). The destination image formation framework by Gartner (1993) suggests that image formation consists of three hierarchical components: cognitive, affective and
conative. Qu et al. (2011) concluded that destination image is multidimensional and influenced by cognitive, affective and unique images. These three images then collectively affect behavior. Cai (2002) introduces the need to link brand image and identity in destination branding. According to Cai (2002) branding is a recursive process that revolves around an axis formed by: the brand element mix, identity and image building. This study adopted some components from each of these models: establishing the role of cognitive, affective, and unique image associations to overall image (Gartner, 1993; Baluglo & McCleary, 1999; Qu et al., 2011); linking destination image and identity elements (Cai, 2002); and identifying the role of image in overall destination brand CBBE (Cai, 2002; Pike at al., 2007). The hypothesized model for this section of the study is presented in Figure 2.
Cognitive and affective perceptions
Repeat visitation and referrals
Previous visitation and intent to visit
Awareness Brand salience
Brand loyalty
Brand associations
Brand resonance
CBBE Dimension Measure
African Journal of Hospitality, Tourism and Leisure Vol. 4 (2) - (2015) ISSN: 2223-814X Copyright: © 2014 AJHTL - Open Access- Online @ http//: www.ajhtl.com
7
Figure 2: Hypothesized model of role of image in CBBE.
*Broken arrows represent alternative model
Methodology Data collection The data were collected through an ACNielsen onmibus study in June 2007 from a stratified random sample of 2464 South African residents sixteen years and over. The sample was stratified by province. Interviews were contacted face-to-face by ACNielsen enumerators. The survey tool was a structured questionnaire with a set of open and closed ended questions soliciting information on consumer knowledge on destination brand Cape Town & Western Cape. Measures Several variables were used to measure the different CBBE dimensions. Brand salience was measured by top of mind (TOM) destination awareness and brand awareness. Respondents were asked two awareness related questions. First, they were asked to state the destination that
immediately comes to mind when thinking of taking a domestic pleasure trip. Second, they were asked if they recognized any of the destination brands shown to them. Brand associations dimension was also measured in two ways: first, respondents were asked to state what they thought destination brand Cape Town & Western Cape represented; second, respondents were asked to select the top five out of twenty statements they felt best represented destination Cape Town & Western Cape. Six of the 20 statements represented destination identity themes for destination Cape Town & Western Cape: the six themes under which the destination is marketed (X3, X6, X7, X11, X17, X18 in Table 1). These twenty image and identity statements are presented in Table 1. Brand resonance was measured by the total number of regions out of six the respondent had visited in the destination. Brand loyalty was measured by repeat visitation.
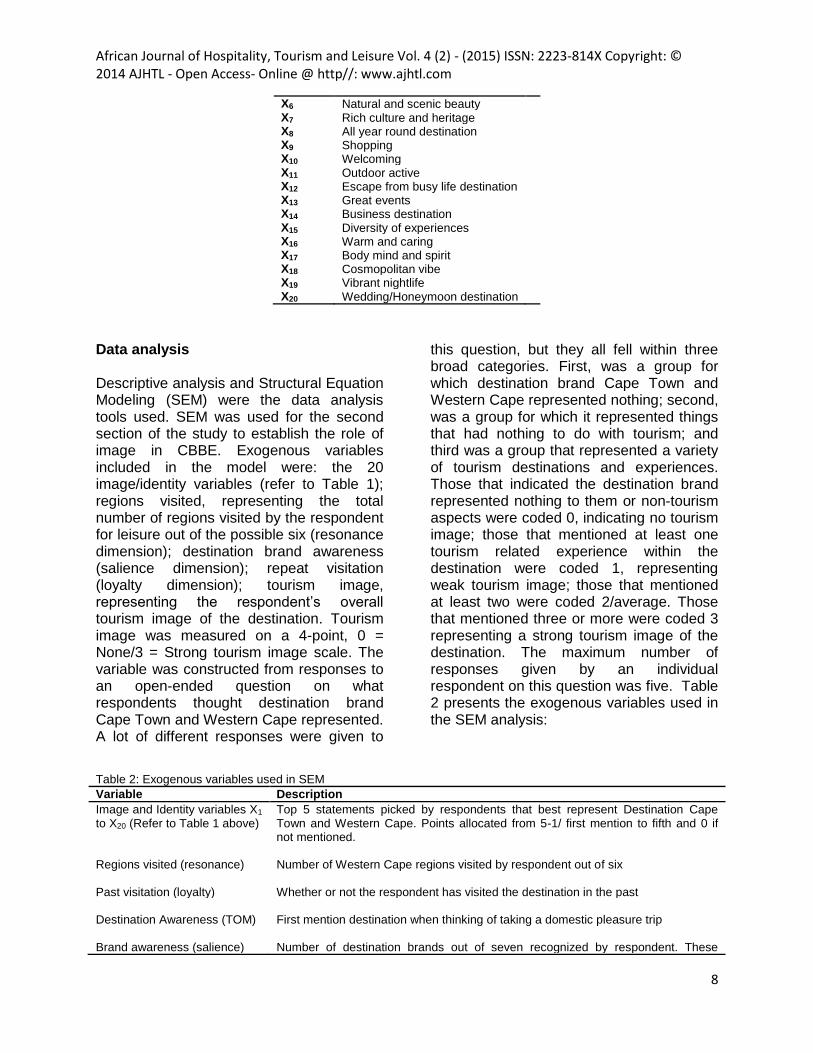
Table 1: Destination image/identity variables
Variable Item
X1 Beautiful X2 Beautiful white sandy beaches X3 Good food and wine X4 Friendliness X5 Relaxation
H4 Image
Cognitive
Affective
Unique
H2
H1
H3
CBBE
African Journal of Hospitality, Tourism and Leisure Vol. 4 (2) - (2015) ISSN: 2223-814X Copyright: © 2014 AJHTL - Open Access- Online @ http//: www.ajhtl.com
8
X6 Natural and scenic beauty X7 Rich culture and heritage X8 All year round destination X9 Shopping X10 Welcoming X11 Outdoor active X12 Escape from busy life destination X13 Great events X14 Business destination X15 Diversity of experiences X16 Warm and caring X17 Body mind and spirit X18 Cosmopolitan vibe X19 Vibrant nightlife X20 Wedding/Honeymoon destination
Data analysis Descriptive analysis and Structural Equation Modeling (SEM) were the data analysis tools used. SEM was used for the second section of the study to establish the role of image in CBBE. Exogenous variables included in the model were: the 20 image/identity variables (refer to Table 1); regions visited, representing the total number of regions visited by the respondent for leisure out of the possible six (resonance dimension); destination brand awareness (salience dimension); repeat visitation (loyalty dimension); tourism image, representing the respondent’s overall tourism image of the destination. Tourism image was measured on a 4-point, 0 = None/3 = Strong tourism image scale. The variable was constructed from responses to an open-ended question on what respondents thought destination brand Cape Town and Western Cape represented. A lot of different responses were given to
this question, but they all fell within three broad categories. First, was a group for which destination brand Cape Town and Western Cape represented nothing; second, was a group for which it represented things that had nothing to do with tourism; and third was a group that represented a variety of tourism destinations and experiences. Those that indicated the destination brand represented nothing to them or non-tourism aspects were coded 0, indicating no tourism image; those that mentioned at least one tourism related experience within the destination were coded 1, representing weak tourism image; those that mentioned at least two were coded 2/average. Those that mentioned three or more were coded 3 representing a strong tourism image of the destination. The maximum number of responses given by an individual respondent on this question was five. Table 2 presents the exogenous variables used in the SEM analysis:
Table 2: Exogenous variables used in SEM
Variable Description
Image and Identity variables X1 to X20 (Refer to Table 1 above)
Top 5 statements picked by respondents that best represent Destination Cape Town and Western Cape. Points allocated from 5-1/ first mention to fifth and 0 if not mentioned.
Regions visited (resonance)
Number of Western Cape regions visited by respondent out of six
Past visitation (loyalty)
Whether or not the respondent has visited the destination in the past
Destination Awareness (TOM) Brand awareness (salience)
First mention destination when thinking of taking a domestic pleasure trip Number of destination brands out of seven recognized by respondent. These
African Journal of Hospitality, Tourism and Leisure Vol. 4 (2) - (2015) ISSN: 2223-814X Copyright: © 2014 AJHTL - Open Access- Online @ http//: www.ajhtl.com
9
include one mother and six regional brand logos. Tourism image
Respondents’ overall tourism image of the destination, measured on a 4 point scale: 0-3, where: 0 =None and 3 = strong tourism image
Results and discussion Descriptives 2646 interviews were achieved, 50.1% were male and 49.9% were female. About 50% of the respondents were under the age of 34 years. The respondents were about evenly distributed among four different South African languages including: Sotho, Nguni, English and Afrikaans. Gauteng Province had the single highest percentage (35.5%) of respondents, followed by Kwa Zulu Natal
(20.2%) and the Western Cape (16.1%). About 60% of the respondents belonged to Living Standards Measure (LSM) six and higher. LSM is a tool that measures standard of living in South Africa through evaluation of assets and wealth. There are 10 LSM categories ranging from 1 (lowest) to 10 (highest). Respondents had visited an average of two Western Cape regions within the past year and recognized an average of two destination brands. More descriptive results are presented in Table 3.
Table 3: Descriptive information
Variable Frequency (n=2464) Percent (n=2464)
Gender
Age Monthly Income
LSM
Male 1234 50.1 Female 1230 49.9
16-24 25-34 35-49 50+ R8 000+ R4 000-R7 999 R800-R3 999 R1-R799 1-3 4 5 6 7 8 9 10
780 477 602 605 748 723 881 112 128 245 337 581 381 303 307 182
31.7 19.4 24.4 24.6 30.4 29.3 35.8 4.5 5.2 9.9 13.7 23.6 15.5 12.3 12.5 7.4
Province Gauteng Kwa Zulu Natal Western Cape Eastern Cape Free State Mpumalanga/Limpopo N.West/N.Cape
873 498 397 217 170 158 151
35.4 20.2 16.1 8.8 6.9 6.4 6.1
Brand salience
African Journal of Hospitality, Tourism and Leisure Vol. 4 (2) - (2015) ISSN: 2223-814X Copyright: © 2014 AJHTL - Open Access- Online @ http//: www.ajhtl.com
10
Destination awareness Results showed that Cape Town had the highest TOM destination awareness among the top five competing domestic destinations with Durban following closely in second place. Cape Town, therefore, is the top destination that immediately comes to mind when respondents think of taking a domestic pleasure trip. The top five competing domestic destinations and their TOM destination awareness results are:
Cape Town 28.5% Durban 24% Johannesburg 5.2% Mpumalanga 4.9% Port Elizabeth 2.4%
Provincially the Western Cape (37%) leads all the other provinces in TOM destination awareness for domestic pleasure trips followed by KwaZulu Natal (29.9%) in second place. Figure 3 represents TOM destination awareness by province. Results show that destination brand Cape Town and the Western Cape has greater CBBE than the rest of the destinations on brand salience. Considering that the number of destinations a visitor will consider during the decision making process is limited to four (Woodside & Sherrell, 1977), being at the top of the pack secures destination Cape Town and Western Cape’s spot in the consideration set, implying Cape Town and the Western Cape is at the top of consumers’ minds when they think of taking a domestic pleasure trip.
Figure 3: TOM destination awareness by province (n = 2464)
Brand awareness Destination brand awareness results demonstrated the strength of destination brand Cape Town & Western Cape’s brand salience as did the destination awareness results. About a third (34%) of the
respondents recognized the destination brand logo, while over half (56.7%) recognized Cape Town’s regional destination brand. This is impressive considering that the destination brands were only about four years old at the time of the
37
29.9
7.1
5.7
5.7
2.5
2.3
0.9
0.2
0 5 10 15 20 25 30 35 40
Western Cape
KwaZulu Natal
Gauteng
Mpumalanga
Eastern Cape
Northwest
Limpopo
Free State
Northern Cape
% of respondents (n=2464)
Pro
vin
ce
African Journal of Hospitality, Tourism and Leisure Vol. 4 (2) - (2015) ISSN: 2223-814X Copyright: © 2014 AJHTL - Open Access- Online @ http//: www.ajhtl.com
11
study. Table 4 represents the destination’s brand awareness results.
Table 4: Destination and regional brand awareness
Region Brand logo % of respondents recognizing the brand logo (n=2464)
Cape Town & Western Cape (Mother brand)
34
Cape Town (city)
56.7
Cape Garden Route
26.7
Cape Winelands
23.7
Cape West Coast
23
Cape Karoo
22.2
Cape Overberg
14.4
Cape Town’s regional brand was the most recognized (56.7%) of all destination brands, followed by the mother brand (34%). About 33% of the respondents didn’t recognize any of the brands. Brand Association Brand associations represent the image that consumers have about the brand. They represent anything that the destination is linked with in consumers’ memory (Pike, 2007). An open-ended question asking
respondents what they thought the destination brand represented yielded mixed results. A total of less than a third (28%) either didn’t know what it represented or indicated that it represented nothing or other non-tourism related stuff. About 12% thought it represented the city of Cape Town’s municipal brand. About a third (31%) mentioned positive tourism related activities and experiences including, but not limited to: peaceful and tranquil; good weather; fun and exciting; relaxing; nature; great beaches and some specific tourism
African Journal of Hospitality, Tourism and Leisure Vol. 4 (2) - (2015) ISSN: 2223-814X Copyright: © 2014 AJHTL - Open Access- Online @ http//: www.ajhtl.com
12
attractions. No negative associations were mentioned. The respondents either didn’t know the brand enough to have any associations or knew the brand and had positive associations with it. The second measure of brand associations revealed good brand associations for destination brand Cape Town & Western Cape. Analysis of the destination identity and image statements showed that the domestic market views destination Cape Town & Western Cape mostly as just beautiful; beautiful white sandy beaches; Good food and wine; friendly and relaxing (refer to Table 5). In bold are the destination identity themes. Three of the six destination identity themes were in the top ten (Good food and wine, natural and scenic beauty, rich culture and heritage). However, outdoor active was also in the top ten of those that had visited the destination. Two of the six identity themes (Body, mind and spirit; and cosmopolitan vibe) were in the bottom five, suggesting some inconsistencies between the destination identity and image on these two themes. While beautiful was the overall
leading image, good food and wine led among those that had visited the destination, followed by beautiful white sand beaches. Beautiful and relaxing, led among those that had not visited the destination (Refer to Table 5). Mean score comparisons between those that had visited the destination and those that had not revealed very significant differences existed for all (p ‹ .001), but two (body, mind & spirit; and warm & caring) of the 20 brand association statements. Scores for those that had visited the destination were consistently higher than for those that hadn’t visited the destination demonstrating that experiencing the destination reinforces the positive associations. Unfortunately, however, the scores for the other two items (body, mind & spirit; and warm & caring) were both low implying that those that had visited and those that hadn’t, both agreed that the destination is neither a warm and caring nor a body, mind and spirit type destination.
Table 5: Destination image in the domestic market by whether or not they have visited the destination
Item % of respondents, overall
% of respondents who have been to the destination
% of respondents who haven’t been to the destination
Beautiful 32.7 45.9 26
Beautiful white sandy Beaches 29.3 47.9 19
Good food and wine 28.1 50.1 17.1
Friendliness 25.9 37.6 20
Relaxation 25.1 31.9 21.7
Natural and scenic beauty 24.1 41.9 15.3
Rich culture and heritage 18.2 30.8 11.9
All year round destination 17.5 29 11.7
Shopping 14.2 19.6 11.4
Welcoming 13.8 18.3 11.5
Outdoor active 13.2 22.2 8.8
Escape from busy life destination 13 19 10
Great events 12.7 15.3 11.4
Business destination 11.9 15.3 10.2
Diversity of experiences 10.8 17.8 7.3
Warm and caring 10.5 10.7 10.32
African Journal of Hospitality, Tourism and Leisure Vol. 4 (2) - (2015) ISSN: 2223-814X Copyright: © 2014 AJHTL - Open Access- Online @ http//: www.ajhtl.com
13
Body mind and spirit 10.2 11.9 9.6
Cosmopolitan vibe 7.9 14.4 4.6
Vibrant nightlife 7.5 12.5 4.9
Wedding/Honeymoon destination 6.7 8.4 5.9
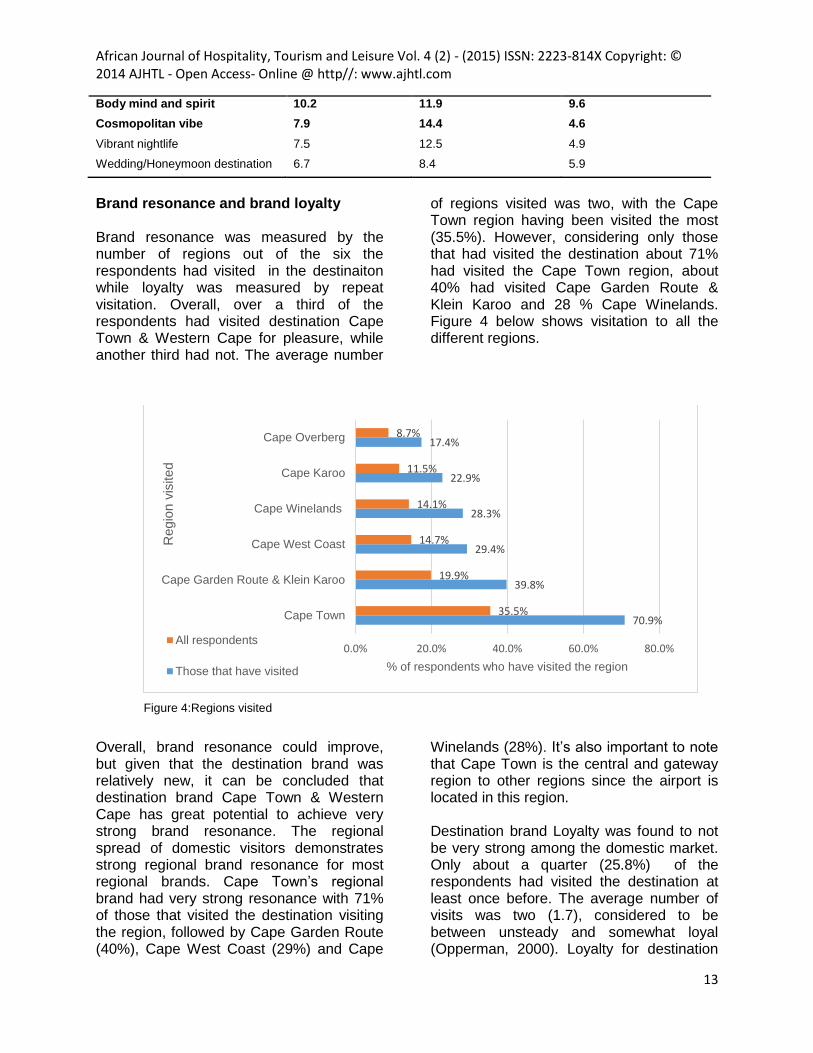
Brand resonance and brand loyalty Brand resonance was measured by the number of regions out of the six the respondents had visited in the destinaiton while loyalty was measured by repeat visitation. Overall, over a third of the respondents had visited destination Cape Town & Western Cape for pleasure, while another third had not. The average number
of regions visited was two, with the Cape Town region having been visited the most (35.5%). However, considering only those that had visited the destination about 71% had visited the Cape Town region, about 40% had visited Cape Garden Route & Klein Karoo and 28 % Cape Winelands. Figure 4 below shows visitation to all the different regions.
Figure 4:Regions visited
Overall, brand resonance could improve, but given that the destination brand was relatively new, it can be concluded that destination brand Cape Town & Western Cape has great potential to achieve very strong brand resonance. The regional spread of domestic visitors demonstrates strong regional brand resonance for most regional brands. Cape Town’s regional brand had very strong resonance with 71% of those that visited the destination visiting the region, followed by Cape Garden Route (40%), Cape West Coast (29%) and Cape
Winelands (28%). It’s also important to note that Cape Town is the central and gateway region to other regions since the airport is located in this region. Destination brand Loyalty was found to not be very strong among the domestic market. Only about a quarter (25.8%) of the respondents had visited the destination at least once before. The average number of visits was two (1.7), considered to be between unsteady and somewhat loyal (Opperman, 2000). Loyalty for destination
70.9%
39.8%
29.4%
28.3%
22.9%
17.4%
35.5%
19.9%
14.7%
14.1%
11.5%
8.7%
0.0% 20.0% 40.0% 60.0% 80.0%
Cape Town
Cape Garden Route & Klein Karoo
Cape West Coast
Cape Winelands
Cape Karoo
Cape Overberg
% of respondents who have visited the region
Regio
n v
isited
All respondents
Those that have visited
African Journal of Hospitality, Tourism and Leisure Vol. 4 (2) - (2015) ISSN: 2223-814X Copyright: © 2014 AJHTL - Open Access- Online @ http//: www.ajhtl.com
14
Cape Town and Western Cape could be improved within the domestic market.
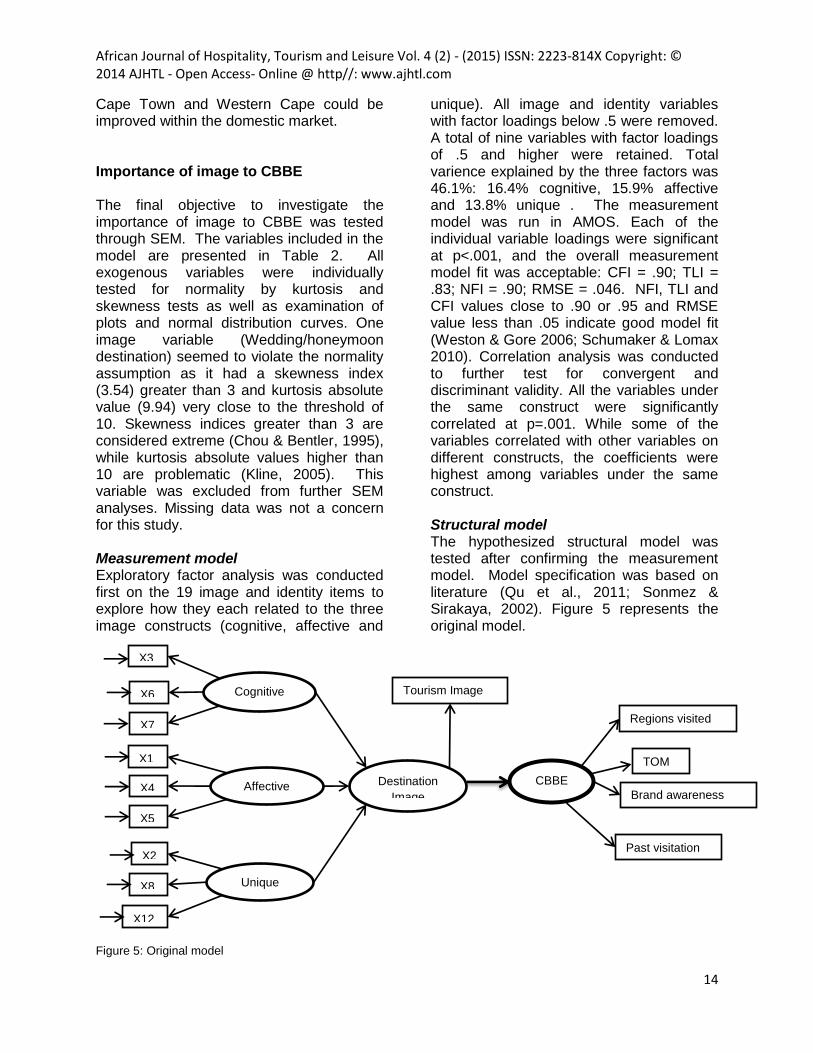
Importance of image to CBBE The final objective to investigate the importance of image to CBBE was tested through SEM. The variables included in the model are presented in Table 2. All exogenous variables were individually tested for normality by kurtosis and skewness tests as well as examination of plots and normal distribution curves. One image variable (Wedding/honeymoon destination) seemed to violate the normality assumption as it had a skewness index (3.54) greater than 3 and kurtosis absolute value (9.94) very close to the threshold of 10. Skewness indices greater than 3 are considered extreme (Chou & Bentler, 1995), while kurtosis absolute values higher than 10 are problematic (Kline, 2005). This variable was excluded from further SEM analyses. Missing data was not a concern for this study. Measurement model Exploratory factor analysis was conducted first on the 19 image and identity items to explore how they each related to the three image constructs (cognitive, affective and
unique). All image and identity variables with factor loadings below .5 were removed. A total of nine variables with factor loadings of .5 and higher were retained. Total varience explained by the three factors was 46.1%: 16.4% cognitive, 15.9% affective and 13.8% unique . The measurement model was run in AMOS. Each of the individual variable loadings were significant at p<.001, and the overall measurement model fit was acceptable: CFI = .90; TLI = .83; NFI = .90; RMSE = .046. NFI, TLI and CFI values close to .90 or .95 and RMSE value less than .05 indicate good model fit (Weston & Gore 2006; Schumaker & Lomax 2010). Correlation analysis was conducted to further test for convergent and discriminant validity. All the variables under the same construct were significantly correlated at p=.001. While some of the variables correlated with other variables on different constructs, the coefficients were highest among variables under the same construct. Structural model The hypothesized structural model was tested after confirming the measurement model. Model specification was based on literature (Qu et al., 2011; Sonmez & Sirakaya, 2002). Figure 5 represents the original model.
Figure 5: Original model
Destination
Image
Cognitive
Affective
Unique
CBBE
Regions visited
Brand awareness
Tourism Image
X7
X1
X4
X5
X6
X3
X2
X8
X12
Past visitation
TOM
African Journal of Hospitality, Tourism and Leisure Vol. 4 (2) - (2015) ISSN: 2223-814X Copyright: © 2014 AJHTL - Open Access- Online @ http//: www.ajhtl.com
15
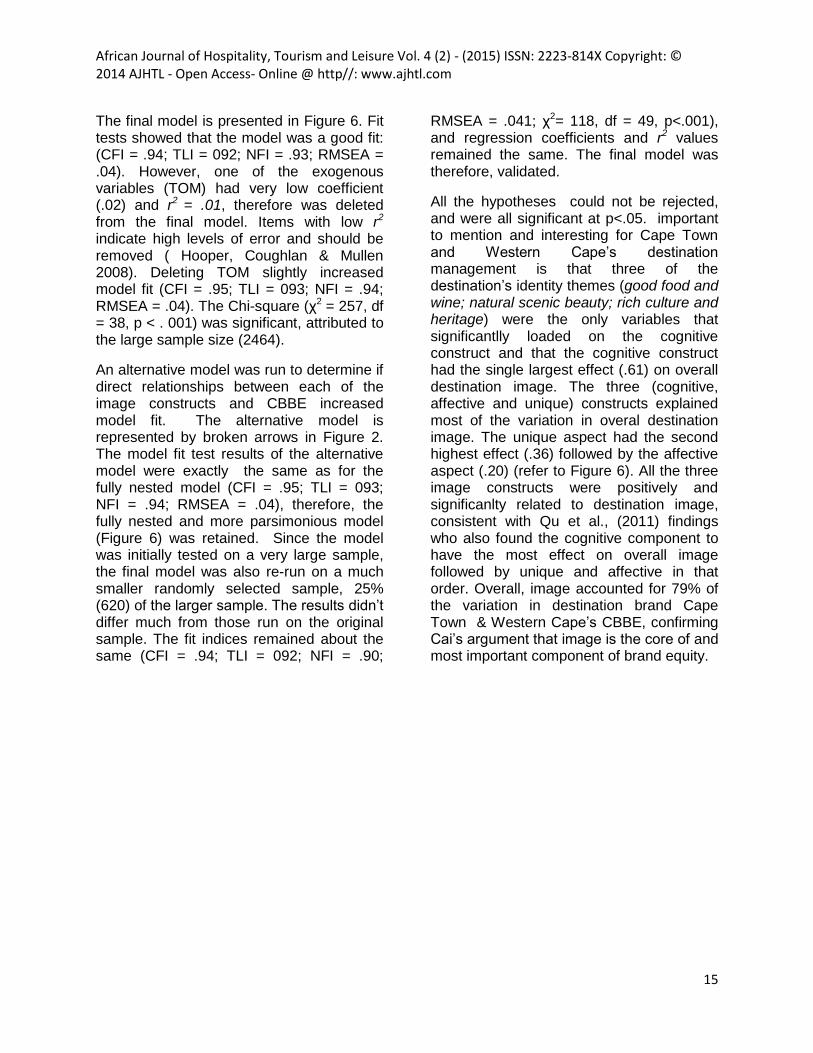
The final model is presented in Figure 6. Fit tests showed that the model was a good fit: (CFI = .94; TLI = 092; NFI = .93; RMSEA = .04). However, one of the exogenous variables (TOM) had very low coefficient (.02) and r2 = .01, therefore was deleted from the final model. Items with low r2 indicate high levels of error and should be removed ( Hooper, Coughlan & Mullen 2008). Deleting TOM slightly increased model fit (CFI = .95; TLI = 093; NFI = .94; RMSEA = .04). The Chi-square (χ2 = 257, df = 38, p < . 001) was significant, attributed to the large sample size (2464).
An alternative model was run to determine if direct relationships between each of the image constructs and CBBE increased model fit. The alternative model is represented by broken arrows in Figure 2. The model fit test results of the alternative model were exactly the same as for the fully nested model (CFI = .95; TLI = 093; NFI = .94; RMSEA = .04), therefore, the fully nested and more parsimonious model (Figure 6) was retained. Since the model was initially tested on a very large sample, the final model was also re-run on a much smaller randomly selected sample, 25% (620) of the larger sample. The results didn’t differ much from those run on the original sample. The fit indices remained about the same (CFI = .94; TLI = 092; NFI = .90;
RMSEA = .041; χ2= 118, df = 49, p<.001), and regression coefficients and r2 values remained the same. The final model was therefore, validated.
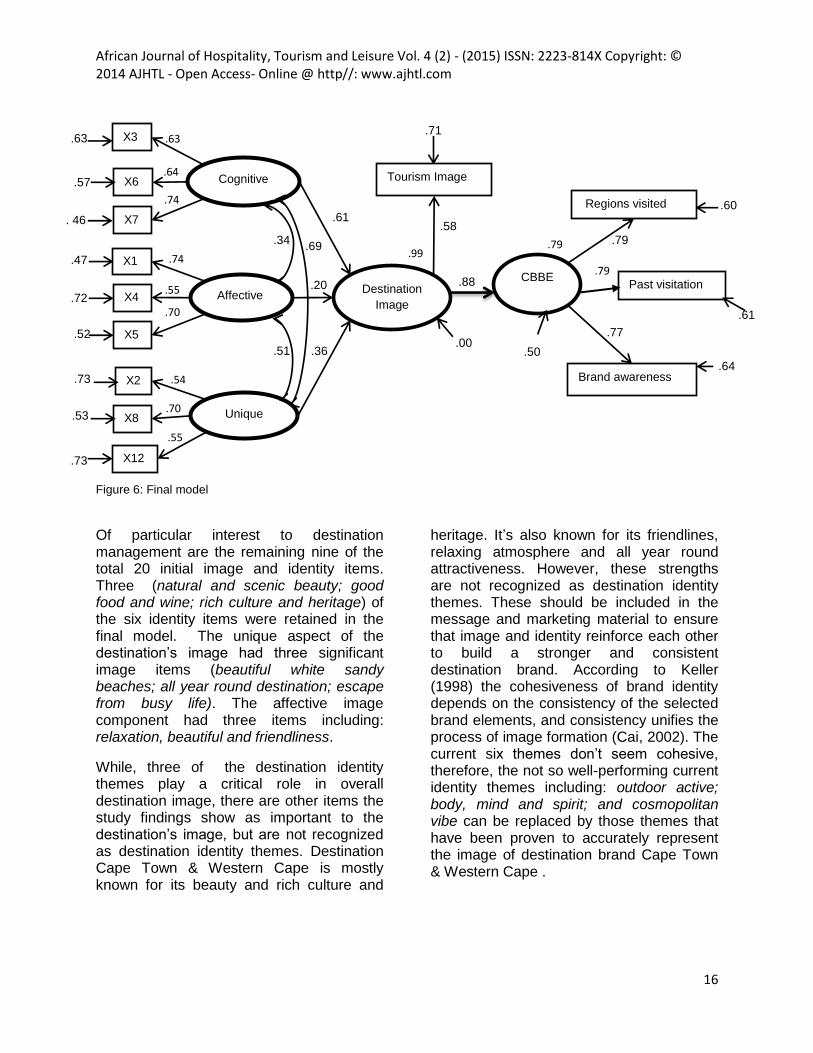
All the hypotheses could not be rejected, and were all significant at p<.05. important to mention and interesting for Cape Town and Western Cape’s destination management is that three of the destination’s identity themes (good food and wine; natural scenic beauty; rich culture and heritage) were the only variables that significantlly loaded on the cognitive construct and that the cognitive construct had the single largest effect (.61) on overall destination image. The three (cognitive, affective and unique) constructs explained most of the variation in overal destination image. The unique aspect had the second highest effect (.36) followed by the affective aspect (.20) (refer to Figure 6). All the three image constructs were positively and significanlty related to destination image, consistent with Qu et al., (2011) findings who also found the cognitive component to have the most effect on overall image followed by unique and affective in that order. Overall, image accounted for 79% of the variation in destination brand Cape Town & Western Cape’s CBBE, confirming Cai’s argument that image is the core of and most important component of brand equity.
African Journal of Hospitality, Tourism and Leisure Vol. 4 (2) - (2015) ISSN: 2223-814X Copyright: © 2014 AJHTL - Open Access- Online @ http//: www.ajhtl.com
16
Figure 6: Final model
Of particular interest to destination management are the remaining nine of the total 20 initial image and identity items. Three (natural and scenic beauty; good food and wine; rich culture and heritage) of the six identity items were retained in the final model. The unique aspect of the destination’s image had three significant image items (beautiful white sandy beaches; all year round destination; escape from busy life). The affective image component had three items including: relaxation, beautiful and friendliness.
While, three of the destination identity themes play a critical role in overall destination image, there are other items the study findings show as important to the destination’s image, but are not recognized as destination identity themes. Destination Cape Town & Western Cape is mostly known for its beauty and rich culture and
heritage. It’s also known for its friendlines, relaxing atmosphere and all year round attractiveness. However, these strengths are not recognized as destination identity themes. These should be included in the message and marketing material to ensure that image and identity reinforce each other to build a stronger and consistent destination brand. According to Keller (1998) the cohesiveness of brand identity depends on the consistency of the selected brand elements, and consistency unifies the process of image formation (Cai, 2002). The current six themes don’t seem cohesive, therefore, the not so well-performing current identity themes including: outdoor active; body, mind and spirit; and cosmopolitan vibe can be replaced by those themes that have been proven to accurately represent the image of destination brand Cape Town & Western Cape .
.63
.64
.74
.74
.55
.70
.54
.70
.55
.99 .79
.79
.61
.88 Destination
Image
Cognitive
Affective
Unique
.20
0
.61
.36
CBBE
Regions visited
Brand awareness
Tourism Image
X7
X1
X4
X5
X6
X3
X2
X8
X12
.58 .79
.77
.50 .00
.63
.57
.47
. 46
.73
.72
.52
.73
.53
.71
.60
.64
.69 .34
.51
Past visitation
African Journal of Hospitality, Tourism and Leisure Vol. 4 (2) - (2015) ISSN: 2223-814X Copyright: © 2014 AJHTL - Open Access- Online @ http//: www.ajhtl.com
17
Conclusions and implications This study sought to assess CBBE for Cape Town & Western Cape and establish the role of destination image to CBBE. The findings highlight the important elements for the destination’s image as well as demonstrated the importance of destination image to destination’s brand equity. The findings of this study have management implications for Cape Town & Western Cape. First, the results validate the importance of three identity themes in overall destination image and brand equity, but also highlight the irrelevance of the other three identity themes. Results show that three of the identity themes (Outdoor active, Cosmopolitan vibe and Body, mind and spirit) are inconsistent with the destination’s strengths and image, therefore should either be completely removed or replaced with more relevant themes. Destination identity should emphasize the destination’s natural and scenic beauty; rich culture and heritage, good food and wine and relaxing atmosphere to which visitors can escape and get away from busy lives. Cape Town is known for its rich heritage given that it is the nation’s ‘mother city’ as well as the home of Robben Island prison in which Nelson Mandela, the first democratically elected President was imprisoned along with several other political prisoners for many years. However, other items have been proved to be as important to the destination’s image and should be added to the identity themes list under which the destination is marketed. Brand identity projected by the destination help consumers build image, but image also helps modify and enhance identity (Qu et al., 2011). Destination management should, therefore, capitalize on all destination strengths and modify existing destination identity to be consistent with the image. Second, the findings also suggest that the cognitive image component has the most effect on overall destination image followed by unique and affective components in that order. The destination’s marketing material
should also highlight these cognitive and unique aspects in the marketing messages. Third, destination management should streamline the number of brands for the destination to reduce confusion in the market. Results showed that about a third (33%) of the respondents didn’t recognize any of the destination and regional brands. The destination has a total of seven destination brands including the overall mother destination brand and six regional brands. In addition the city of Cape Town has its own municipal brand, while the DMO also has its own corporate brand. All these brands cause confusion in the customers’ minds and potentially weaken and/or fragment the destination brand. The results show that only Cape Town’s regional brand achieved brand awareness above 50%. This proposed brand streamlining can be achieved by concentrating on destination-wide cooperative branding emphasizing common attributes and strengths. Cai (2002) concluded that cooperative brand across several communities results in stronger destination identity. It also saves resources as different communities pull their marketing resources together to promote a common theme and goal. Overall, destination Cape Town and Western Cape has a lot of strengths: strong brand salience; good and positive associations and strong regional brand resonance. However, to build an even stronger destination brand and reach the top of the CBBE hierarchy (loyalty) according to Pike’s model, destination management should focus on increasing repeat visitation and positive word of mouth recommendations. They also need to concentrate on the destination’s strengths and emphasize brand elements that unify the destination to build and sustain a strong destination brand that is easily and widely recognized.
African Journal of Hospitality, Tourism and Leisure Vol. 4 (2) - (2015) ISSN: 2223-814X Copyright: © 2014 AJHTL - Open Access- Online @ http//: www.ajhtl.com
18
References
Aaker, D. (1991). Managing Brand Equity, Free Press, New York. Aaker, D. (1996). Measuring brand equity across products and markets, California Management Review, Vol. 38(3),102-120. Aaker, J.L. (1997). Dimensions of brand personality, Journal of Marketing Research, Vol. 34, 347-356. Baluglo, S. & McCleary, A.W. (1999). A model of destination image formation, Annals of Tourism Research, Vol. 26(4), 868-897. Blain, C.B., Levy, S.E. & Ritchie, J.R.B. (2005). Destination Branding: Insight and practices from destination management organizations. Journal of Travel Research, Vol. 43(4), 328-338. Boo, S., Busser, J. & Baluglo, S. (2009). A model of consumer-based brand equity and its application to multiple destinations. Tourism Management, Vol. 30, 219-231. Cai, L.A. (2002). Cooperative branding for rural destinations. Annals of Tourism Research, Vol. 29(3), 720-742. Chou, C P & Bentler, P.M. (1995). Estimates and tests in structural equation modeling, in Structural equation modeling: Concepts, issues and applications, ed RH Hoyle, 37-55. Sage, Thousand Oaks, CA. Echtner, M. & Ritchie, J.R.B. (1993). The Measurement of destination image: An empirical Assessment. Journal of Travel Research, Vol. 31(4), 3-13. Eckinsi, Y., & Hosany, S. (2006). Destination personality: An application of brand personality to tourism destinations. Journal of Travel Research, Vol. 45,127-139.
Gartner, W.C. (1993). Image formation process, 191-215. In Uysal M. & Fesenmaier D. R., eds. Communication and Channel Systems in Tourism Marketing. Haworth Press, New York. Hankinson, G. (2004). Relational network brands: towards a conceptual model of place brands. Journal of Vacation Marketing, Vol. 10(2), 109-129. Henderson, J.C. (2000). Selling places: The new Asia-Singapore brand. Journal of Tourism Studies, Vol. 11(1), 36-44. Hooper, D., Coughlan, J. & Mullen, M. (2008). Structural modeling: Guidelines for determining model fit. Electronic Journal of Business Methods, Vol. 6(1), 53-60. Kamakura, W.A., & Russell, G.J. (1993). Measuring brand value with scanner data. International Journal of Research in Marketing, Vol. 10, 9-22. Kapferer, J. (1998). Strategic Brand Management. Kogan Page, London. Kaplanidou, K., & Vogt, C. (2003). Destination branding: Concept and measurement. Travel Michigan and Michigan State University, Department of Park, Recreation and Tourism Resources, 1-7. Keller, K.L. (1993). Conceptualizing, measuring, and managing consumer-based brand Equity. Journal of Marketing, Vol. 57(1), 1-22. Keller, K.L. (1998). Strategic brand management: Building, measuring and managing brand equity. Prentice Hall, Upper Saddle River, NJ. Kline, R.B. (2005). Principles and practice of structural equation modeling, 2nd ed. Guilford, New York.
African Journal of Hospitality, Tourism and Leisure Vol. 4 (2) - (2015) ISSN: 2223-814X Copyright: © 2014 AJHTL - Open Access- Online @ http//: www.ajhtl.com
19
Konecnik, M., & Gartner, C.W. (2007). Consumer-based brand equity for a destination. Annals of Tourism Research, Vol. 34(2), 400-421. Konecnick, M. & Gartner, C.G. (2007). Customer-based brand equity for a destination. Annals of Tourism Research, Vol. 34(2), 400-421. Konecnick, M., & Go, F. (1998). Tourism destination brand identity: The case of Slovenia. Brand Management, Vol. 15(3), 177-189. Lee, J. & Back, K. (2008). Attendee-based brand equity. Tourism Management, Vol. 29, 331-344. Lassar, W., Mittal, B., & Sharma, A. (1995). Measuring consumer-based brand equity. Journal of Consumer Marketing, Vol. 12(4), 11-19. Lavidge, R.J., & Steiner, G.A. (1961). A model for predictive measurements of advertising Effectiveness. Journal of Marketing, Vol. 25, 59-62. Mackay, K. J., & Fesenmaier, D.R. (2000). An exploration of cross-cultural destination image Assessment. Journal of Travel Research, Vol. 38(4), 417-423. Martin, G.S., & Brown, T.J. (1990). In search of brand equity: the conceptualization and measurement of the brand impression construct. Marketing theory and applications, Vol. 2(1), 431-438. Murphy, L., Moscardo, G., & Benckerndorff, P. (2007). Using brand personality to differentiate regional tourism destinations. Journal of Travel Research, Vol. 46, 5-14. Oppermann, M. (2000). Tourism destination loyalty. Journal of Travel Research, Vol. 39(1), 78- 84.
Qu, H., Kim, L.H., & Im, H.H. (2011). A model of destination branding: Integrating the concepts of branding and destination image. Tourism Management, Vol. 32, 465-476. Pappu, R., Quester, P.G., & Cooksey, R.W. (2005). Consumer-based brand equity: improving the measurement-empirical evidence’, Journal of Product & Brand Management, Vol. 14(3), 143-154.
Pike, S. (2007). Consumer-based brand equity for destinations: Practical DMO performance Measures. Journal of Travel & Tourism Marketing, Vol. 22(1), 51-61. Pike, S., Bianchi, C., Kerr, G., & Patti, C. (2010). Consumer-based brand equity for Australia as a long-haul tourism destination in an emerging market. International Marketing Review, Vol. 27(4), 434-449. Ritchie, R.B., & Crouch, G.I. (2003). The competitive destination. Cambridge, MA: CABI. Ritchie, J.R.B., & Ritchie, R.J.B. (1998). The branding of tourism destinations: Past achievements and future challenges. Paper presented at the 1998 Annual Congress of the International Association of Scientific Experts in Tourism. Marrakech, Morocco. Santos, C.A. (2004). Framing Portugal representational dynamics. Annals of Tourism Research, Vol. 31(1), 122-138. Schumaker, R.E., & Lomax, R.G. (2010). A beginner’s guide to structural equation modeling, 3rd Edn. Routledge, New York. Sonmez, S., & Sirakaya, E. (2002). A distorted destination image: The case of Turkey. Journal of Travel Research, Vol. 41, 185-196. South African Tourism (SAT). (2011). Highlights of tourism’s performance in 2010. Available from:
African Journal of Hospitality, Tourism and Leisure Vol. 4 (2) - (2015) ISSN: 2223-814X Copyright: © 2014 AJHTL - Open Access- Online @ http//: www.ajhtl.com
20
http://www.southafrica.net/sat/content/en/za/research-home. Sirgy, M. J., & Su, C. (2000). Destination Image, Self-congruity, and travel behavior: Toward an integrative model. Journal of Travel Research, Vol. 38(4), 340-352. Srivastava, R.K., & Shocker, A.D. (1991). Brand Equity: A perspective on its meaning and Measurement. Marketing Science Institute Working Paper Series, Report no. 91-124, Cambridge, MA.
Vazquez, R., Rio, A.B., & Iglesias, V. (2002). Consumer-based brand equity: Development and validation of a measurement instrument. Journal of Marketing Management, Vol. 18, 27-48. Weston, R., & Gore, P.A. (2006). A brief guide to structural equation modeling. The Counseling Psychologist, Vol. 34(5), 719-751. Woodside, A.G., & Sherrell, D. (1977). Traveler evoked, inept and inert sets of vacation Destinations. Journal of Travel Research, Vol. 16(1), 14-18.


![Colorado School of Mines...2008/10/10 · Guide to the Kansas gold mines at Pike’s Peak [Archives; F782.P63 M8]. The illustrated miners’ hand-book and guide to Pike’s Peak [Archives;](https://static.fdocuments.net/doc/165x107/5f5f81a57f3a41270876dc8b/colorado-school-of-mines-20081010-guide-to-the-kansas-gold-mines-at-pikeas.jpg)


