Desorption of Hydrogen from Palladium Plating - …infohouse.p2ric.org/ref/28/27290.pdf ·...
12
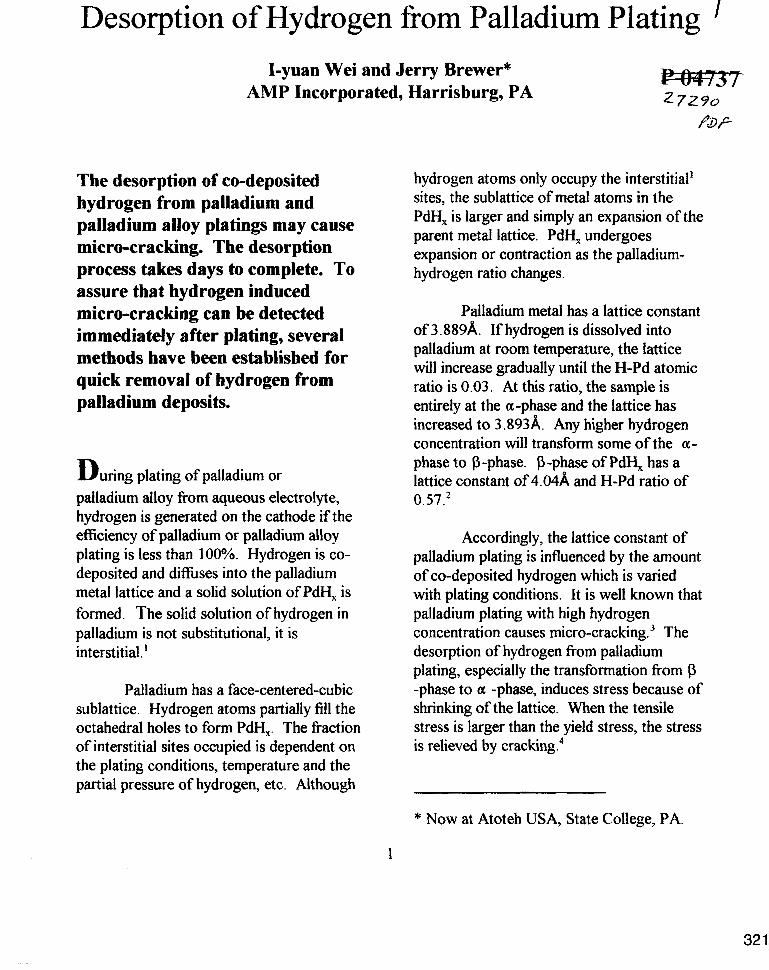
Desorption of Hydrogen fkom Palladium Plating I-yuan Wei and Jerry Brewer* AMP Incorporated, Harrisburg, PA The desorption of eo-deposited hydrogen from palladium and palladium alloy platings may cause micro-cracking. The desorption process takes days to complete. To assure that hydrogen induced micro-cracking can be detected immediately after plating, several methods have been established for quick removal of hydrogen from palladium deposits. During plating of palladium or palladium alloy from aqueous electrolyte, hydrogen is generated on the cathode if the efficiencyof palladium or palladium alloy plating is less than 100%. Hydrogen is co- deposited and diffises into the palladium metal lattice and a solid solution of PdH, is formed. The solid solution of hydrogen in palladium is not substitutional, it is interstitial. ’ Palladium has a face-centered-cubic sublattice. Hydrogen atoms partially fill the octahedral holes to form PdH,. The fraction of interstitial sites occupied is dependent on the plating conditions, temperature and the partial pressure of hydrogen, etc. Although hydrogen atoms only occupy the interstitial’ sites, the sublattice of metal atoms in the PdH, is larger and simply an expansion of the parent metal lattice. PdH, undergoes expansion or contraction as the palladium- hydrogen ratio changes. Palladium metal has a lattice constant of 3.889A. If hydrogen is dissolved into palladium at room temperature, the lattice will increase gradually until the H-Pd atomic ratio is 0.03. At this ratio, the sample is entirely at the a-phase and the lattice has increased to 3.893k Any higher hydrogen concentration will transform some of the a- phase to p-phase. P-phase of PdY, has a lattice constant of 4.048( and H-Pd ratio of 0.57.2 Accordingly, the lattice constant of palladium plating is influenced by the amount of co-deposited hydrogen which is varied with plating conditions. It is well known that palladium plating with high hydrogen concentration causes micro-~racking.~ The desorption of hydrogen from palladium plating, especially the transformation from p -phase to a -phase, induces stress because of shrinking of the lattice. When the tensile stress is larger than the yield stress, the stress is relieved by ~ r a c k i n g . ~ * Now at Atoteh USA, State College, PA. 1 32 1
Transcript of Desorption of Hydrogen from Palladium Plating - …infohouse.p2ric.org/ref/28/27290.pdf ·...
Desorption of Hydrogen fkom Palladium Plating I-yuan Wei and Jerry Brewer*
AMP Incorporated, Harrisburg, PA
The desorption of eo-deposited hydrogen from palladium and palladium alloy platings may cause micro-cracking. The desorption process takes days to complete. To assure that hydrogen induced micro-cracking can be detected immediately after plating, several methods have been established for quick removal of hydrogen from palladium deposits.
During plating of palladium or palladium alloy from aqueous electrolyte, hydrogen is generated on the cathode if the efficiency of palladium or palladium alloy plating is less than 100%. Hydrogen is co- deposited and diffises into the palladium metal lattice and a solid solution of PdH, is formed. The solid solution of hydrogen in palladium is not substitutional, it is interstitial. ’
Palladium has a face-centered-cubic sublattice. Hydrogen atoms partially fill the octahedral holes to form PdH,. The fraction of interstitial sites occupied is dependent on the plating conditions, temperature and the partial pressure of hydrogen, etc. Although
hydrogen atoms only occupy the interstitial’ sites, the sublattice of metal atoms in the PdH, is larger and simply an expansion of the parent metal lattice. PdH, undergoes expansion or contraction as the palladium- hydrogen ratio changes.
Palladium metal has a lattice constant of 3.889A. If hydrogen is dissolved into palladium at room temperature, the lattice will increase gradually until the H-Pd atomic ratio is 0.03. At this ratio, the sample is entirely at the a-phase and the lattice has increased to 3.893k Any higher hydrogen concentration will transform some of the a- phase to p-phase. P-phase of PdY, has a lattice constant of 4.048( and H-Pd ratio of 0.57.2
Accordingly, the lattice constant of palladium plating is influenced by the amount of co-deposited hydrogen which is varied with plating conditions. It is well known that palladium plating with high hydrogen concentration causes micro-~racking.~ The desorption of hydrogen from palladium plating, especially the transformation from p -phase to a -phase, induces stress because of shrinking of the lattice. When the tensile stress is larger than the yield stress, the stress is relieved by ~racking.~
* Now at Atoteh USA, State College, PA.
1
32 1
The diffusion constant of hydrogen in palladium at room temperature is about 5.4 x IO-’ cm S - I . At this high difision rate, the transit time of a change in concentration of hydrogen across 2.5 micrometers (100 microinches) palladium foil is about 20 ms. However, it is our experience that residual hydrogen may not be completely desorbed from palladium platings for days if not months. Presumably, the trace impurities in the deposit and/or surface conditions hinders the diffusion process. Therefore, hydrogen induced micro-cracking may or may not be occurring immediately after plating.
Micro-cracking may cause poor adhesion, poor wear and high porosity. Good adhesion, high wear durability and zero or low porosity are important performance requirements for electrical or electronic connectors. It is obvious that an acceleration method for removing hydrogen from palladium deposits is needed for production control.
Experimental
current and potential for the experiments performed in this study was an EG&G PARC model 1 73 potentiostat/galvanostat. Experiments involving constant potential used the model 173 with an EG&G PARC model 179 digital coulometer plug in module. Cyclic voltammetry experiments used the model 173 with an EG&G PARC model 175 universal programmer and a model RE0074 X-Y recorder. The test cell for both types of experiments was an EG&G PARC model KO047 corrosion cell with a model 178 electrometer probe and 178/4 1 filter. The samples used in this study were prepared on copper research test paddles
The instrument used to control both
with effective surface areas of 10 cm2.
All samples were prepared in the same general manner. The surface is first degreased in alkaline cleaner, deionized water rinsed, electropolished in 10% sulfbric acid and rinsed again. For constant potential coulometry the samples are air dried and weighed on Sartorius model 2472 analytical balance. For cyclic voltammetry tests this step is not performed. The sample is then plated in a palladium strike bath at room temperature for 45 seconds at 1 A/dm2. The sample is deionized water rinsed, then plated in a proprietary palladium bath. It is plated at a desired current density for the calculated time to achieve a thickness of 1.9 micrometers (75 microinches). The sample, when removed from the palladium bath, is deionized water rinsed and air dried. The solution used in the KO047 corrosion cell for all experiments performed was 1N sodium hydroxide. All potentials reported in this study are versus the saturated calomel electrode (SCE).
The vacuum extraction experiments were performed in a Precision Scientific Company Thelco model 19 vacuum oven. This provided a pressure of 62 mm of mercury. A Hybrid Technology Corporation Phase Four Vapor Phase Reflow system was used for the vapor phase desorption experiments. The system used 3M Fluorinert Electronic liquid FC-70. It raises the temperature of the part to 215’C.
Results Constant Potential Coulometry for the Determination of the H:Pd Atomic Ratio
The samples for this were weighed before palladium plating. They were plated
2
322
in the palladium strike bath at room temperature for 45 seconds at I amp/dm2. The plating conditions of the palladium bath were varied to illustrate how plating conditions, particularly bath temperature and current density, could affect the amount of hydrogen in the deposit.
The palladium bath was tested at 20°C at 1,2 and 3 A/dm2. The bath temperature was then raised to 6OoC, and samples plated at 1, 3, 6 and 10 A/dm2. The bath temperature was then elevated to 75°C and tested at 1, 3,6 and 9 A/dm2. All samples are plated to a thickness of 1.9 micrometers and three samples are plated at each current density. After each sample is palladium plated, it is placed in the KO047 corrosion cell and anodized for 15 minutes at +0.750 volts. The total number of coulombs passed during this time is recorded using the model 179 digital coulometer. M e r anodization, the sample is removed, deionized water rinsed, air dried and weighed. From the number of coulombs passed and the weight of palladium plated, the atomic ratio of hydrogen to palladium can be calculated.
The data obtained fiom this experiment is shown in Table 1. The data shows the average H:Pd atomic ratio of the three samples at each current density.
Cyclic Voltammetry
technique involves measuring the corrosion potential of a sample in 1N sodium hydroxide and then inducing a scan of the potential fiom 100 mv more negative of the corrosion potential to a potential 1 volt more positive than the corrosion potential and then back again while measuring the current
The procedure employed for this
carried by the cell. This cycle is repeated a minimum of five times. The model 175 universal programer was used to scan the potential during the experiment. The model 173 potentiostatlgalvanostat with the model 3 76 logarithmic current converter plug-in module was used to measure the corrosion potential and to measure the current during the potential scan. The model RE0074 X-Y recorder was used to record the scan.
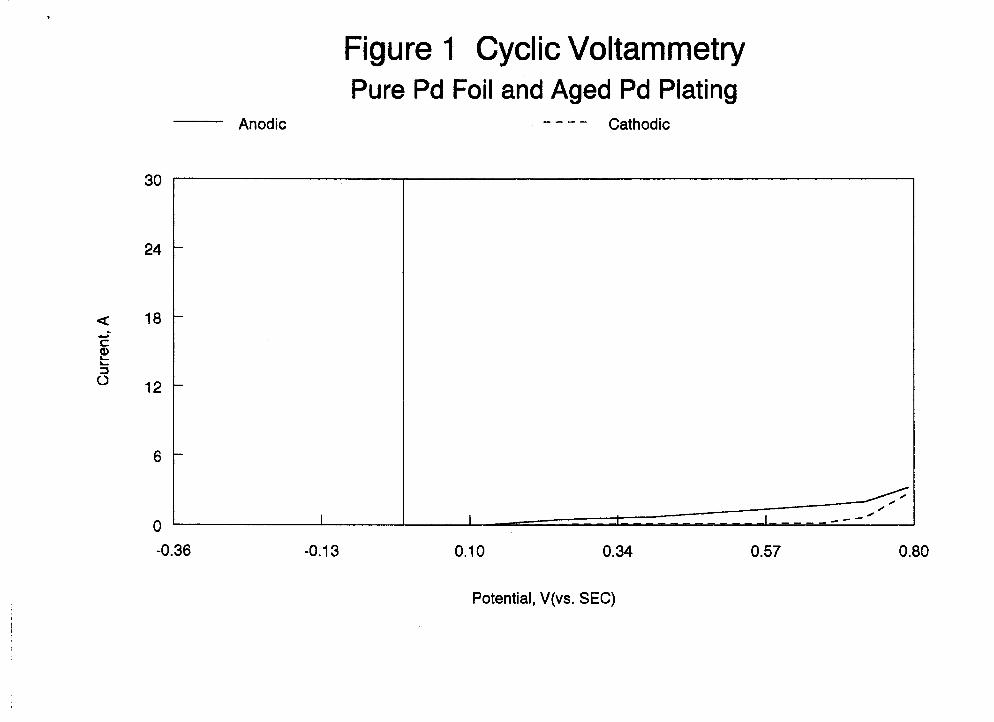
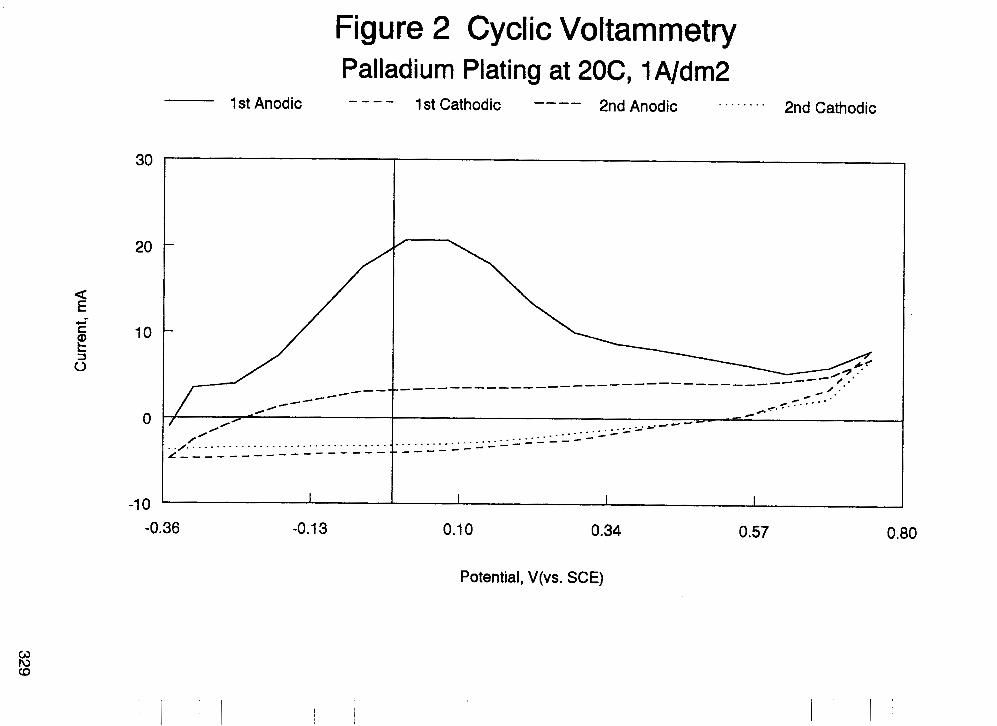
When this technique was used on a sample of pure palladium metal, no current was observed flowing in the cell. The scan can be seen in Figure 1. No current can be seen until the onset of oxygen evolution above +0.650 volts. The same result was obtained when this technique was used with a palladium plated part that was two years old. In both of these samples we did not expect to find hydrogen and the scan support this expectation. In the previous section it was found that the palladium surface with the highest amount of hydrogen present had been plated in the palladium bath at 20°C and 1 Aldm'. The cyclic scan of a sample plated under these conditions is seen in Figure 2. This scan shows a large amount of current carried during the first anodic scan and then less and less current with each subsequent scan until the current becomes virtually zero.
The results obtained here show that this technique can be used to determine the presence of hydrogen in a plated deposit. As the sample is anodized, it is observed that less and less hydrogen remains. This fits in exactly with the results from the procedure used to determine the H:Pd atomic ratio. From this point in our experimental work, the cyclic voltammogram was used as our test procedure to determine if other procedures had klly removed the hydrogen
3
323
in the deposit.
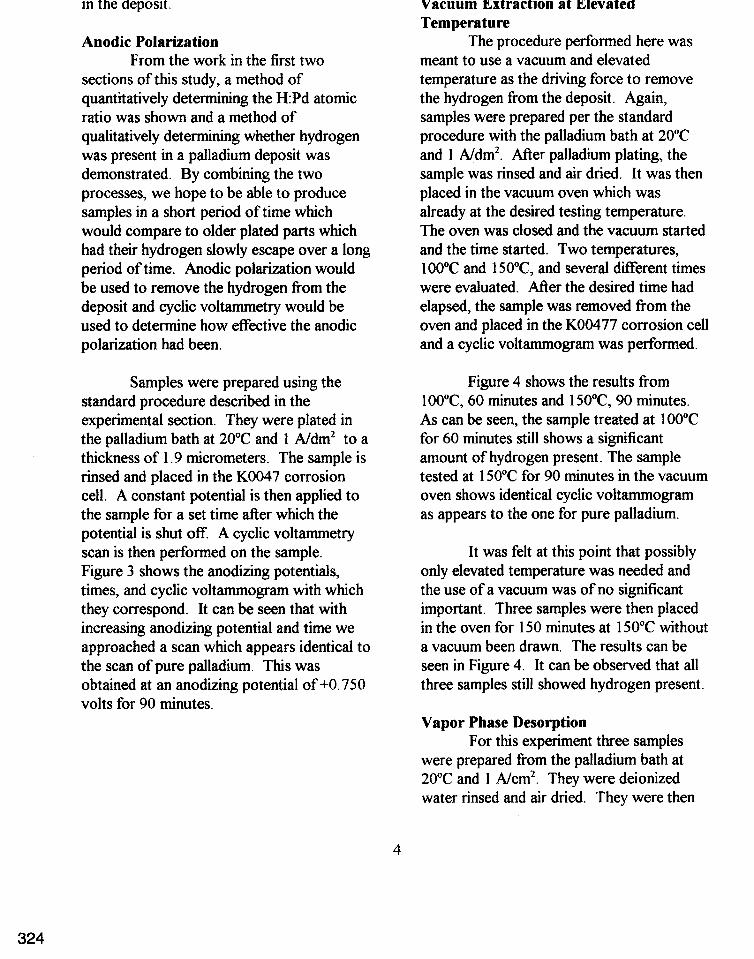
Anodic Polarization
sections of this study, a method of quantitatively determining the H:Pd atomic ratio was shown and a method of qualitatively determining whether hydrogen was present in a palladium deposit was demonstrated. By combining the two processes, we hope to be able to produce samples in a short period of time which would compare to older plated parts which had their hydrogen slowly escape over a long period of time. Anodic polarization would be used to remove the hydrogen from the deposit and cyclic voltammetry would be used to determine how effective the anodic polarization had been.
From the work in the first two
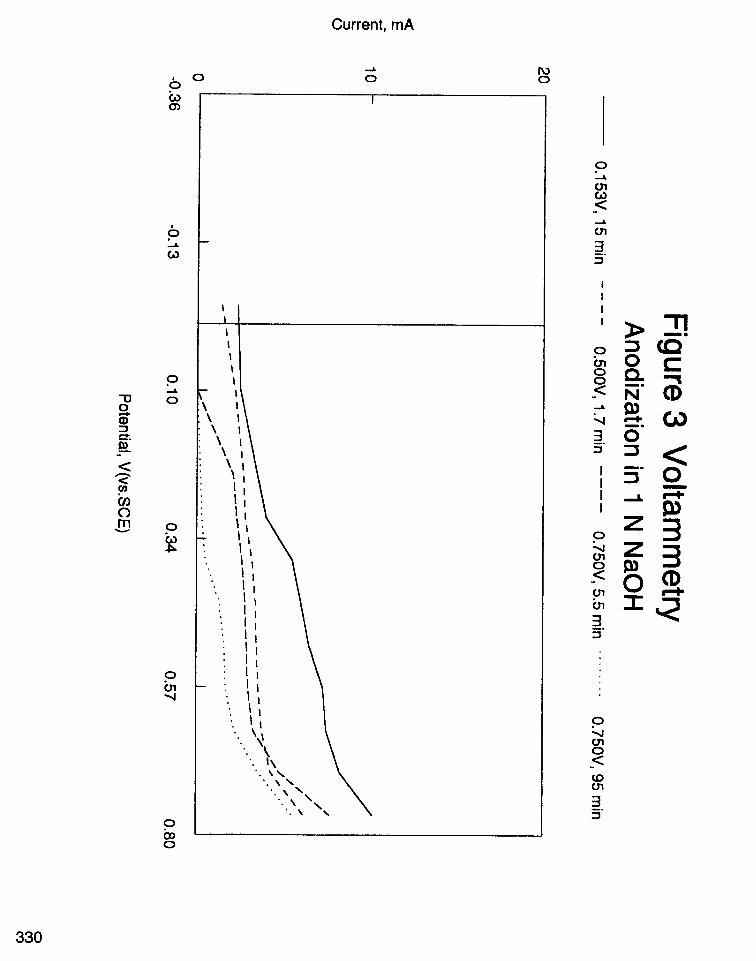
Samples were prepared using the standard procedure described in the experimental section. They were plated in the palladium bath at 20°C and 1 A/dm2 to a thickness of 1.9 micrometers. The sample is rinsed and placed in the KO047 corrosion cell. A constant potential is then applied to the sample for a set time after which the potential is shut off A cyclic voltammetry scan is then performed on the sample. Figure 3 shows the anodizing potentials, times, and cyclic voltammogram with which they correspond. It can be seen that with increasing anodizing potential and time we approached a scan which appears identical to the scan of pure palladium. This was obtained at an anodizing potential of +O. 750 volts for 90 minutes.
Vacuum Extraction at Elevated Temperature
The procedure performed here was meant to use a vacuum and elevated temperature as the driving force to remove the hydrogen from the deposit. Again, samples were prepared per the standard procedure with the palladium bath at 20°C and 1 A/dm2. After palladium plating, the sample was rinsed and air dried. It was then placed in the vacuum oven which was already at the desired testing temperature. The oven was closed and the vacuum started and the time started. Two temperatures, 100°C and 15O"C, and several different times were evaluated. After the desired time had elapsed, the sample was removed from the oven and placed in the KO0477 corrosion cell and a cyclic voltammogram was performed.
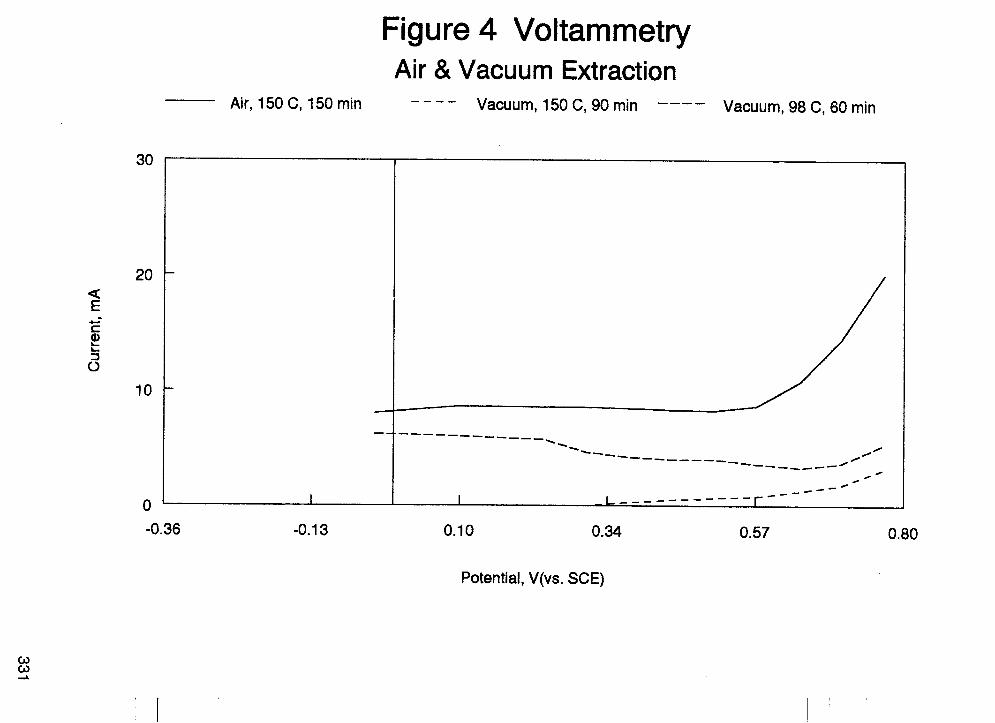
Figure 4 shows the results from lOO"C, 60 minutes and 1 50"C, 90 minutes. As can be seen, the sample treated at 100°C for 60 minutes still shows a significant amount of hydrogen present. The sample tested at 150°C for 90 minutes in the vacuum oven shows identical cyclic voltammogram as appears to the one for pure palladium.
It was felt at this point that possibly only elevated temperature was needed and the use of a vacuum was of no significant important. Three samples were then placed in the oven for 150 minutes at 150°C without a vacuum been drawn. The results can be seen in Figure 4. It can be observed that all three samples still showed hydrogen present.
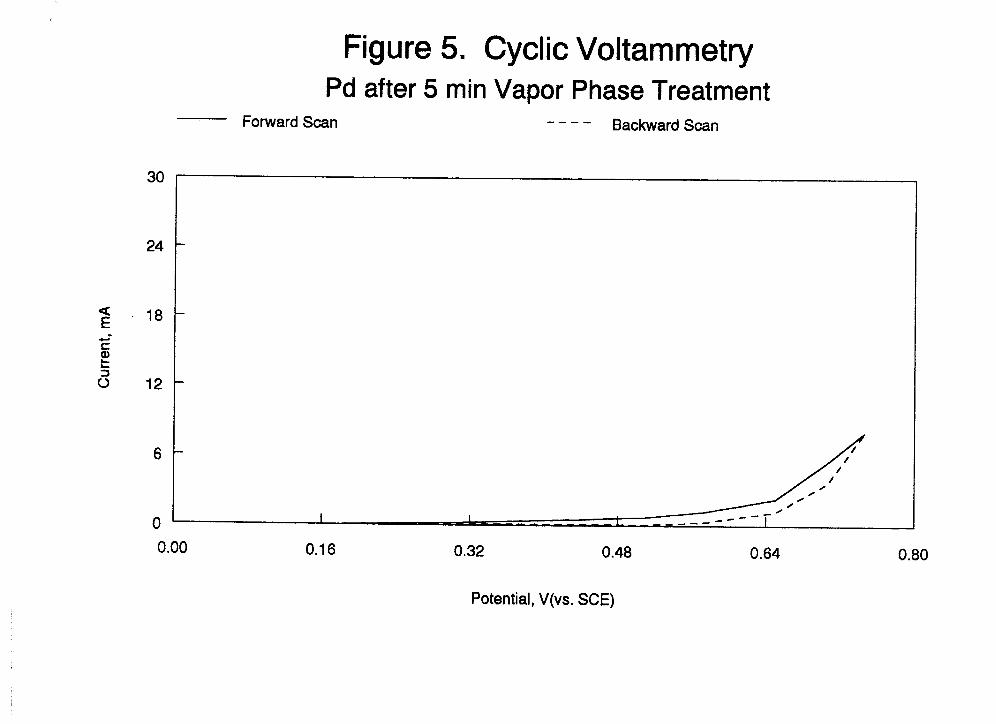
Vapor Phase Desorption For this experiment three samples
were prepared from the palladium bath at 20°C and 1 A/cm2. They were deionized water rinsed and air dried. They were then
4
324
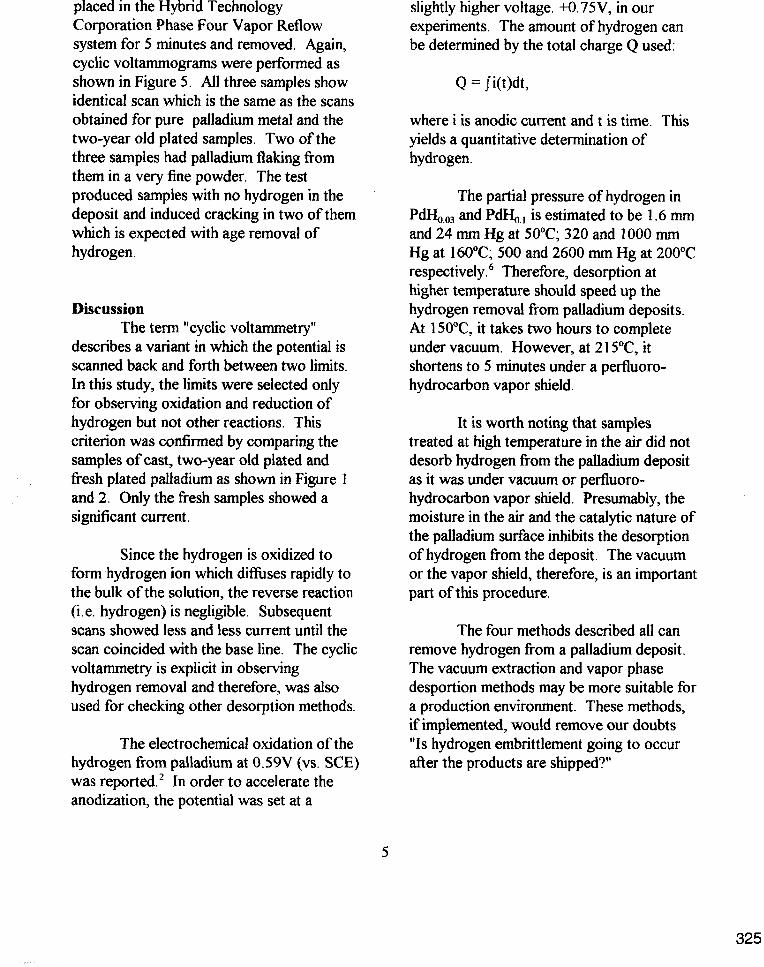
placed in the Hybrid Technology Corporation Phase Four Vapor Reflow system for 5 minutes and removed. Again, cyclic voltammograms were performed as shown in Figure 5 . All three samples show identical scan which is the same as the scans obtained for pure palladium metal and the two-year old plated samples. Two of the three samples had palladium flaking from them in a very fine powder. The test produced samples with no hydrogen in the deposit and induced cracking in two of them which is expected with age removal of hydrogen.
Discussion
describes a variant in which the potential is scanned back and forth between two limits. In this study, the limits were selected only for observing oxidation and reduction of hydrogen but not other reactions. This criterion was confirmed by comparing the samples of cast, two-year old plated and fresh plated palladium as shown in Figure 1 and 2. Only the fresh samples showed a significant current.
The term "cyclic voltammetry"
Since the hydrogen is oxidized to form hydrogen ion which diffises rapidly to the bulk of the solution, the reverse reaction (i.e. hydrogen) is negligible. Subsequent scans showed less and less current until the scan coincided with the base line. The cyclic voltammetry is explicit in observing hydrogen removal and therefore, was also used for checking other desorption methods.
The electrochemical oxidation of the hydrogen from palladium at 0.59V (vs. SCE) was reported.2 In order to accelerate the anodization, the potential was set at a
slightly higher voltage. +0.75V, in our experiments. The amount of hydrogen can be determined by the total charge Q used:
Q = ji(t)dt,
where i is anodic current and t is time. This yields a quantitative determination of hydrogen.
The partial pressure of hydrogen in Pd€&,, and Pdh , , is estimated to be I .6 mm and 24 mm Hg at 50°C; 320 and 1000 mm Hg at 160°C; 500 and 2600 mm Hg at 200°C respectively.6 Therefore, desorption at higher temperature should speed up the hydrogen removal from palladium deposits. At 150aC, it takes two hours to complete under vacuum. However, at 21 5"C, it shortens to 5 minutes under a perfluoro- hydrocarbon vapor shield.
It is worth noting that samples treated at high temperature in the air did not desorb hydrogen from the palladium deposit as it was under vacuum or perfluoro- hydrocarbon vapor shield. Presumably, the moisture in the air and the catalytic nature of the palladium surface inhibits the desorption of hydrogen from the deposit. The vacuum or the vapor shield, therefore, is an important part of this procedure.
The four methods described all can remove hydrogen from a palladium deposit. The vacuum extraction and vapor phase desportion methods may be more suitable for a production environment. These methods, if implemented, would remove our doubts "Is hydrogen embrittlement going to occur after the products are shipped?"
5
325
Conclusions
study provide four methods for the accelerated removal of hydrogen from palladium plated samples. Namely,
The experiments performed in this
1. Cyclic voltammetry in 1N NaOH from -0.1 to 1 .O V (vs. SCE).
2 . Anodic polarization at +0.750V (vs. SCE) in IN NaOH for 2 hours.
3. Vacuum extraction at 150°C for 2 hours.
4. Vapor phase desorption at 2 15°C for 5 minutes.
The four procedures produced samples with insignificant content of hydrogen in newly plated palladium deposit equivalent to pure palladium metal or palladium plated samples with an age of two years. All samples used here were entirely palladium plated parts, mixed potential considerations recommend that the first two procedures, cyclic voltammetry and anodic polarization, are not suitable for selectively plated parts.
Some of these methods have been in use since 1985 and have contributed in delivering billions of electronic contacts without any concern of delayed microcracking and have been proved to be useful tools for providing consistent microcracking-free products.
References
1. D. G. Westlake, C.B. Satterthwaite and J. H. Weaver, Physics Today Nov. ( I 978) P. 32.
2. H. D. Hedrich and Ch. J. Raub, Metalloberflaeche 31, 512 (1977).
3. Ch. J. Raub, Platinum Metals Rev., 26, 158 ( 1 982).
4. Unpublished results. 5. "Hydrogen in Metals 11", ed. G. Alefeld
and J. Voelkl, Springer Verlag (1978), p. 145.
6. F. A. Lewis, "The Palladium Hydrogen System", Academic Press, London, (1 967), P. 14.
6
326
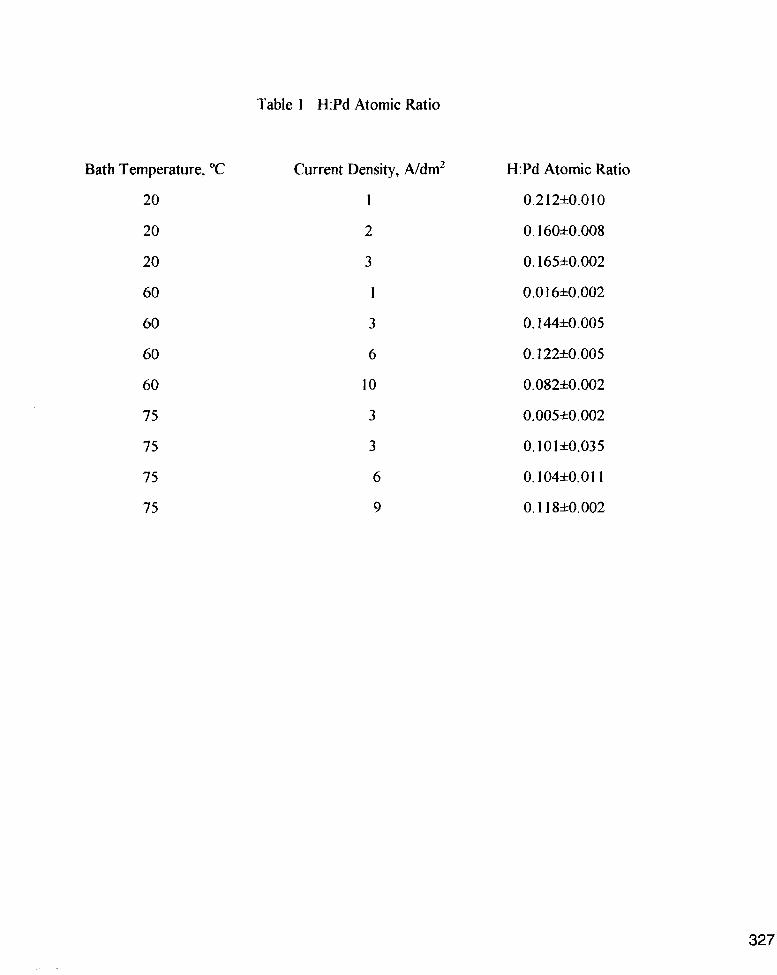
Table 1 H:Pd Atomic Ratio
Bath Temperature, "C
20
20
20
60
60
60
60
75
75
75
75
Current Density, Ndm2
1
2
3
I
3
6
10
3
3
6
9
H:Pd Atomic Ratio
0.2 1 2*0 .o 1 0
0.16o.Lt0.008
0.165zt0.002
0.016*0.002
0.144zt0.005
0. I22*0.005
0.082*0.002
0.005*0.002
0.101*0.035
0.104+0.01 I
0.1 18*0.002
327
30
24
a 18 .. C
t Q) t
12
6
0
Anodic
Figure 1 Cyclic Voltammetry Pure Pd Foil and Aged Pd Plating
Cathodic - - - -
-0.36 -0.1 3 0.10 0.34 0.57 0.80
Potential, V(vs. SEC)
30
20
10
0
-1 0
1st Anodic
Figure 2 Cyclic Voltammetry Palladium Plating at 20C, 1A/dm2
. . . . . . . . 1st Cathodic ---- 2nd Anodic 2nd Cathodic - - - -
_/---
a//
./ ................................. ........
........................ _ _ _ _ _ - - - - - - e _ - - -
-0.36 -0.13 0.1 0 0.34
Potential, V(vs. SCE)
0.57 0.80
I I I
Current, mA
0
P
0
-l in
P (x, 0
A 0 R,
0
P A m "2 2 m
P
(D m
330
Air, 150 C, 150 min
30
20 a E
p!
- c S
L
5 10
Figure 4 Voltammetry Air & Vacuum Extraction
Vacuum, 150 C, 90 min ---- Vacuum, 98 C, 60 min - - - -
/
I
-0.36 -0.1 3 0.1 0 0.34
Potential, V(vs. SCE)
0.57 0.80
I I I I
: I
24
a 18 E
I 5 0 12
c- c
Figure 5. Cyclic Voltammetry
-
-
-
Pd after 5 min Vapor Phase Treatment Backward Scan - _ - - Forward Scan
30
0.00 0.1 6 0.32 0.48 0.64 0.80
Potential, V(vs. SCE)