Desktop Support Peer Group Sample Benchmark from … · · 2018-02-27Sample report only. ......
198
Company XYZ Peer Group Desktop Support Benchmark Company X Y Z Company X Y Z
Transcript of Desktop Support Peer Group Sample Benchmark from … · · 2018-02-27Sample report only. ......

Company XYZPeer Group Desktop Support Benchmark
CompanyX Y ZCompanyX Y Z

Company XYZ Desktop Support BenchmarkSample report only. Data is not accurate.
1
Report Contents Project Overview and Objectives Page 2
Industry Background Page 34
Performance Benchmarking Summary Page 49
Best Practices Process Assessment Page 75
Interview Themes and Quotes Page 89
Conclusions and Recommendations Page 102
Detailed Benchmarking Comparisons Page 125 Cost Metrics Page 126
Productivity Metrics Page 133
Service Level Metrics Page 146
Quality Metrics Page 155
Technician Metrics Page 162
Ticket Handling Metrics Page 175
Workload Metrics Page 182
About MetricNet Page 191
© MetricNet, LLC, www.metricnet.com

Project Overview and Objectives
2

Company XYZ Desktop Support BenchmarkSample report only. Data is not accurate.
Project Objectives
Review and assess the performance of the Company XYZ Desktop
Support function
Benchmark the performance of Company XYZ Desktop Support
against a peer group of comparable desktop support organizations
Conduct a best-practices process assessment
Recommend strategies to improve and optimize performance
Achieve world-class levels of support
Maximize customer satisfaction
3© MetricNet, LLC, www.metricnet.com

Company XYZ Desktop Support BenchmarkSample report only. Data is not accurate.
4© MetricNet, LLC, www.metricnet.com
Benchmarking Approach
Module 1: Company XYZ Baselining / Data Collection
Module 2: Benchmarking and Gap Analysis
Module 3: Balanced Scorecard
Module 4: Best Practices Process Assessment
Module 5: Strategies for Optimized Performance
Module 6: Report Development and Presentation of Results
Company XYZ Desktop Support BenchmarkSample report only. Data is not accurate.
5
Module 1: Company XYZ Baselining/Data Collection
Core Topics
Project Kickoff
Data Collection
Interviews
© MetricNet, LLC, www.metricnet.com

Company XYZ Desktop Support BenchmarkSample report only. Data is not accurate.
Project Kickoff Meeting
6© MetricNet, LLC, www.metricnet.com
Key Objectives: Project Kickoff Meeting
• Introduce the MetricNet and Company XYZ project teams
• Discuss the project schedule
• Discuss the data collection process
• Answer questions about the project
Company XYZ

Company XYZ Desktop Support BenchmarkSample report only. Data is not accurate.
7
Data Collection
© MetricNet, LLC, www.metricnet.com
Company XYZ Desktop Support BenchmarkSample report only. Data is not accurate.
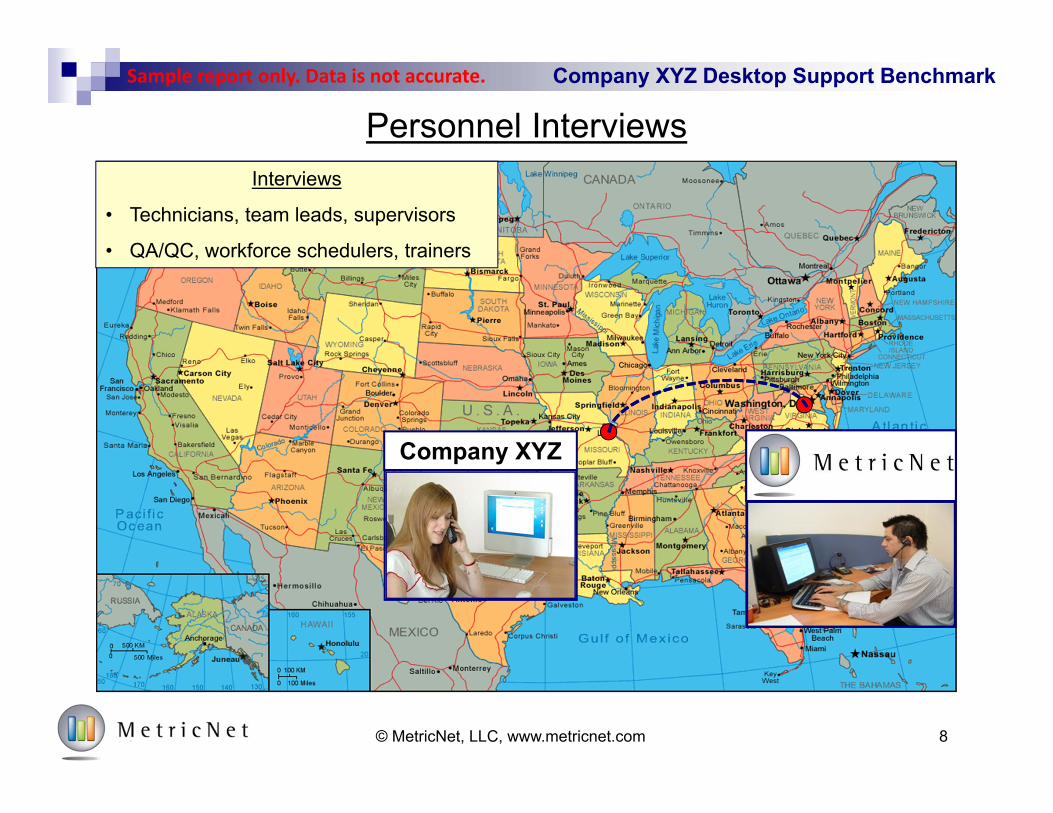
Personnel Interviews
8© MetricNet, LLC, www.metricnet.com
Interviews
• Technicians, team leads, supervisors
• QA/QC, workforce schedulers, trainers
Company XYZ

Company XYZ Desktop Support BenchmarkSample report only. Data is not accurate.
Module 2: Benchmarking and Gap Analysis
Core Topics
Peer Group Selection
Benchmarking Comparison
Gap Analysis
© MetricNet, LLC, www.metricnet.com 9

Company XYZ Desktop Support BenchmarkSample report only. Data is not accurate.
Benchmarking Peer Group Selection
Read MetricNet’s whitepaper on Benchmarking Peer Group Selection. Go to www.metricnet.com to get your copy!
10© MetricNet, LLC, www.metricnet.com
IDEAL PEER GROUP
Scope
Complexity
Scale
Geography

Company XYZ Desktop Support BenchmarkSample report only. Data is not accurate.
Dynamic Peer Group Selection
Scope
Complexity
Scale
Geography
Scope refers to the services offered by Desktop Support. The broader the scope of services offered, the broader the skill set required by the technicians. As scope increases, so too does the cost of providing support. Desktop Support selected for benchmarking comparison must be comparable in the scope of services offered.
Volume refers to the number of contacts handled by Desktop Support. Virtually everything in Desktop Support is subject to scale economies. This is particularly true when it comes to the volume of contacts handled. The approximate scale effect for volume is 5%. What this means is that every time the number of transactions doubles, you should expect to see the cost per contact decline by 5%. For this reason, it is important to select benchmarking peer groups that are similar in scale.
The complexity of transactions handled will influence the handle time, and hence the cost per transaction. For example, a password reset is a simple transaction that takes very little time, and costs very little to resolve. By contrast, an inquiry for a complex application like SAP takes much longer and costs much more to resolve. MetricNet uses a proprietary algorithm to determine a weighted complexity index based upon the mix of transactions handled by Desktop Support. The companies chosen for a benchmarking peer group will have similar complexity factors.
The main factor that is affected by geography is cost; specifically labor cost. Since labor accounts for 65% of help desk operating expense, it is important to benchmark help desks that have a common geography. Even within a particular geography, wage rates can differ significantly, so MetricNet makes adjustments to ensure that each Desktop Support in a benchmarking peer group is normalized to the same wage rate.
© MetricNet, LLC, www.metricnet.com 11

Company XYZ Desktop Support BenchmarkSample report only. Data is not accurate.
12
Key Questions How is your Desktop Support
group performing? How does your Desktop Support
group compare to other comparable support groups?
What are the strengths and weaknesses of your support organization?
What are the areas of improvement for your Desktop Support group?
How can you enhance Desktop Support performance and achieve world-class status?
DesktopSupport Benchmark
Gap Analysis
Improvement Recommendations
RealizedPerformance Gains
Company XYZ Desktop
Support Data
Desktop Support Benchmark: Key Questions Answered
© MetricNet, LLC, www.metricnet.com
MetricNet’s Database of Process and
Performance Indicators

Company XYZ Desktop Support BenchmarkSample report only. Data is not accurate.
13
Performance of Benchmarking Peer
Group
Determine How Best in Class Achieve
Superiority
Adopt Selected Practices of
Best in Class
Build a Sustainable Competitive Advantage
The ultimate objective of
benchmarking
The Benchmarking Methodology
© MetricNet, LLC, www.metricnet.com
Read MetricNet’s whitepaper on Desktop Support Benchmarking. Go to www.metricnet.com to receive your copy!
COMPARECompany XYZ
Desktop Support Performance
Company XYZ Desktop Support BenchmarkSample report only. Data is not accurate.
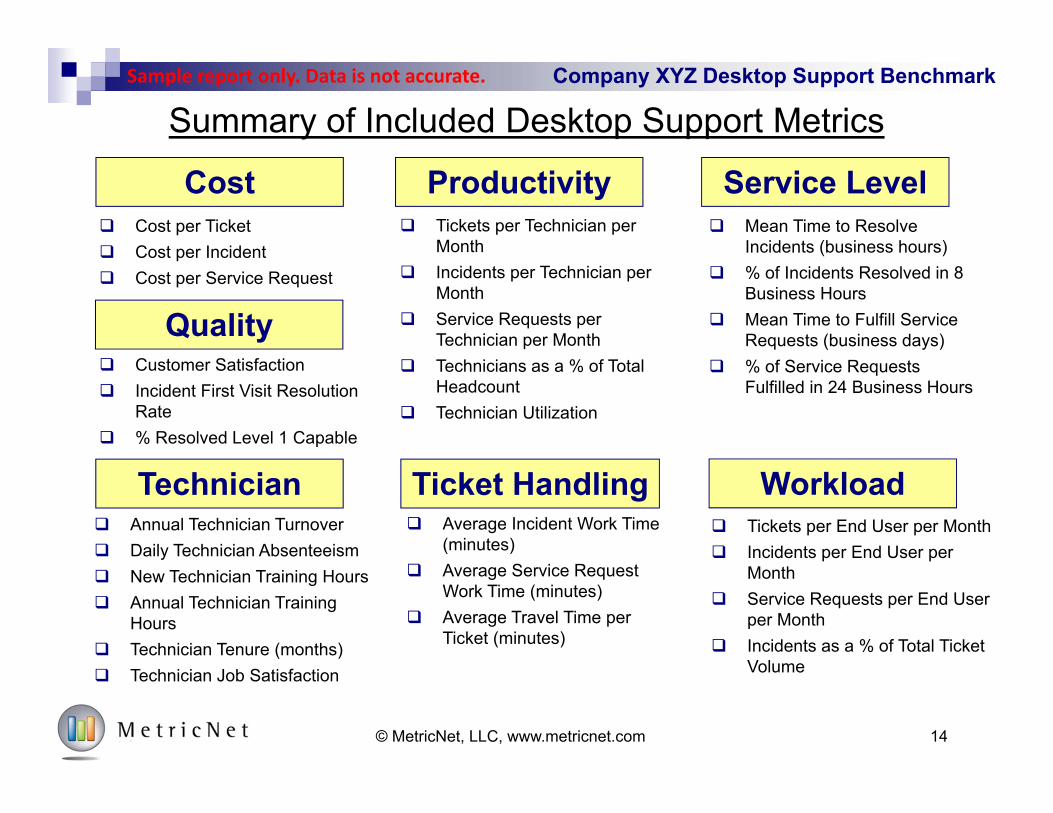
Summary of Included Desktop Support Metrics
© MetricNet, LLC, www.metricnet.com 14
Cost per Ticket Cost per Incident Cost per Service Request
Cost Productivity Service Level
Quality
Technician
Mean Time to Resolve Incidents (business hours)
% of Incidents Resolved in 8 Business Hours
Mean Time to Fulfill Service Requests (business days)
% of Service Requests Fulfilled in 24 Business Hours
Tickets per Technician per Month
Incidents per Technician per Month
Service Requests per Technician per Month
Technicians as a % of Total Headcount
Technician Utilization
Customer Satisfaction Incident First Visit Resolution
Rate % Resolved Level 1 Capable
Annual Technician Turnover Daily Technician Absenteeism New Technician Training Hours Annual Technician Training
Hours Technician Tenure (months) Technician Job Satisfaction
Average Incident Work Time (minutes)
Average Service Request Work Time (minutes)
Average Travel Time per Ticket (minutes)
Ticket Handling Workload Tickets per End User per Month Incidents per End User per
Month Service Requests per End User
per Month Incidents as a % of Total Ticket
Volume

Company XYZ Desktop Support BenchmarkSample report only. Data is not accurate.
15© MetricNet, LLC, www.metricnet.com
Benchmarking KPI Performance SummaryAverage Min Median Max
Cost per Ticket $83.67 $90.67 $64.49 $85.46 $139.02Cost per Incident $63.61 $65.18 $45.72 $64.95 $92.33Cost per Service Request $156.70 $143.53 $97.16 $142.16 $194.98Tickets per Technician per Month 80.6 65.4 49.3 64.6 82.0Incidents per Technician per Month 63.2 44.6 20.7 39.6 74.3Service Requests per Technician per Month 17.4 20.8 6.1 22.2 39.1Technicians as a % of Total Headcount 85.0% 80.3% 65.3% 82.7% 89.0%Technician Utilization 58.5% 57.6% 48.2% 56.3% 66.9%Mean Time to Resolve Incidents (business hours) 16.10 8.89 4.53 7.93 17.30% of Incidents Resolved in 8 Business Hours 41.9% 49.1% 24.5% 50.6% 65.7%Mean Time to Fulfill Service Requests (business days) 5.58 5.15 3.08 5.28 6.78% of Service Requests Fulfilled in 24 Business Hours 51.0% 38.3% 17.9% 41.4% 63.5%Customer Satisfaction 91.4% 79.8% 49.8% 84.2% 92.1%Incident First Visit Resolution Rate 82.8% 70.8% 51.4% 70.2% 89.0%% Resolved Level 1 Capable 24.5% 21.4% 8.5% 22.3% 36.9%Annual Technician Turnover 26.7% 35.9% 11.8% 33.7% 80.1%Daily Technician Absenteeism 4.5% 5.4% 1.5% 4.9% 12.0%New Technician Training Hours 60 49 0 46 126Annual Technician Training Hours 10 14 0 3 65Technician Tenure (months) 43.6 43.7 13.3 35.4 102.5Technician Job Satisfaction 84.6% 86.8% 73.8% 87.3% 98.5%Average Incident Work Time (minutes) 43.7 46.4 43.7 45.5 54.3Average Service Request Work Time (minutes) 107.6 112.7 106.2 112.5 119.7Average Travel Time per Ticket (minutes) 9.1 9.0 7.2 9.0 11.7Tickets per End User per Month 0.31 0.39 0.19 0.36 0.82Incidents per End User per Month 0.24 0.26 0.07 0.26 0.61Service Requests per End User per Month 0.07 0.12 0.02 0.13 0.22Incidents as a % of Total Ticket Volume 78.5% 66.3% 35.6% 66.2% 92.2%
Productivity
Metric Type Key Performance Indicator (KPI) Company XYZ
Peer Group Statistics
Cost
Service Level
Quality
Technician
Ticket Handling
Workload

Company XYZ Desktop Support BenchmarkSample report only. Data is not accurate.
16
Cost vs. Quality for Company XYZ Desktop Support
© MetricNet, LLC, www.metricnet.com
Company XYZDesktop Support
Global Database
Lower CostCost (Efficiency)
Qua
lity
(Effe
ctiv
enes
s)
Higher Cost
Lower Quality
Higher Quality
Top QuartileEfficient and Effective
Lower Quartile
Middle QuartilesEffective but not Efficient
Middle QuartilesEfficient but not Effective

Company XYZ Desktop Support BenchmarkSample report only. Data is not accurate.
17
Module 3: Balanced Scorecard
© MetricNet, LLC, www.metricnet.com
Core Topics
Metrics Selection
Metric Weightings
Scorecard Construction

Company XYZ Desktop Support BenchmarkSample report only. Data is not accurate.
Company XYZ Desktop Support Balanced Scorecard
Step 1Eight critical performance metrics have been selected for the scorecard.
Step 3For each performance metric, the highest and lowest performance levels in the benchmark are recorded.
Step 4Your actual performance for each metric is recorded in this column.
Step 5Your score for each metric is then calculated:
(worst case - actual performance) ÷ (worst case
– best case) × 100
Step 6Your balanced score for each metric is calculated:
metric score × weighting
Step 2Each metric has been weighted according to its relative importance.
18© MetricNet, LLC, www.metricnet.com
Worst Case Best CaseCost per Incident 15.0% $92.33 $45.72 $63.61 61.6% 9.2%Cost per Service Request 15.0% $194.98 $97.16 $156.70 39.1% 5.9%Customer Satisfaction 20.0% 49.8% 92.1% 91.4% 98.3% 19.7%Incident First Visit Resolution Rate 10.0% 51.4% 89.0% 82.8% 83.5% 8.3%Technician Utilization 10.0% 48.2% 66.9% 58.5% 55.1% 5.5%% of Incidents Resolved in 8 Business Hours 10.0% 24.5% 65.7% 41.9% 42.3% 4.2%% of Service Requests Fulfilled in 24 Business Hours 10.0% 17.9% 63.5% 51.0% 72.6% 7.3%Technician Job Satisfaction 10.0% 73.8% 98.5% 84.6% 43.7% 4.4%
Balanced Score 100.0% N/A N/A N/A N/A 64.5%
Performance Metric Metric Weighting
Performance Range Your Actual Performance
Balanced ScoreMetric Score
Company XYZ Desktop Support BenchmarkSample report only. Data is not accurate.
19© MetricNet, LLC, www.metricnet.com
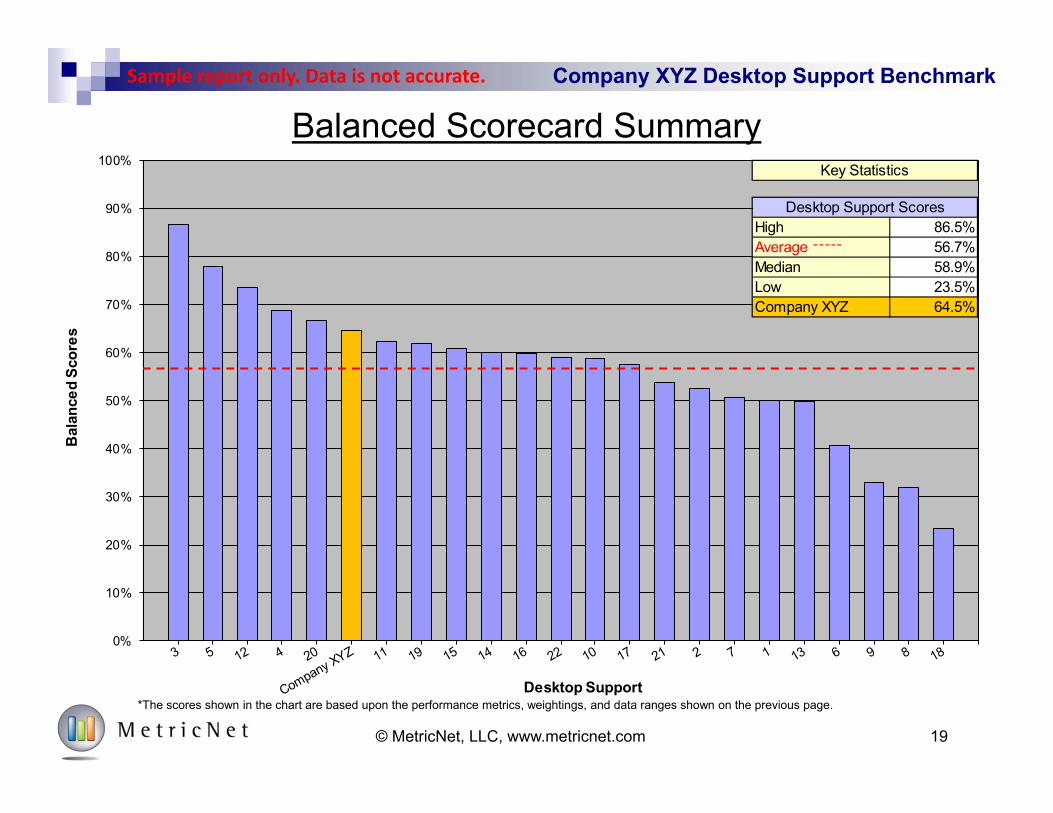
Balanced Scorecard Summary
0%
10%
20%
30%
40%
50%
60%
70%
80%
90%
100%
Bal
ance
d Sc
ores
Desktop Support
High 86.5%Average ־־־־־ 56.7%Median 58.9%Low 23.5%Company XYZ 64.5%
Key Statistics
Desktop Support Scores
*The scores shown in the chart are based upon the performance metrics, weightings, and data ranges shown on the previous page.

Company XYZ Desktop Support BenchmarkSample report only. Data is not accurate.
*Sample Only
40%
45%
50%
55%
60%
65%
70%
75%
80%
85%
Jan Feb Mar Apr May Jun Jul Aug Sep Oct Nov Dec
Bala
nced
Sco
re
12 Month Average Monthly Score
20© MetricNet, LLC, www.metricnet.com
The Scorecard Can be Updated Monthly

Company XYZ Desktop Support BenchmarkSample report only. Data is not accurate.
Module 4: Best Practices Process Assessment
Core Components
Company XYZ Self-Assessment
MetricNet Maturity Ranking
Process Assessment Rollup
© MetricNet, LLC, www.metricnet.com 21
Company XYZ Desktop Support BenchmarkSample report only. Data is not accurate.
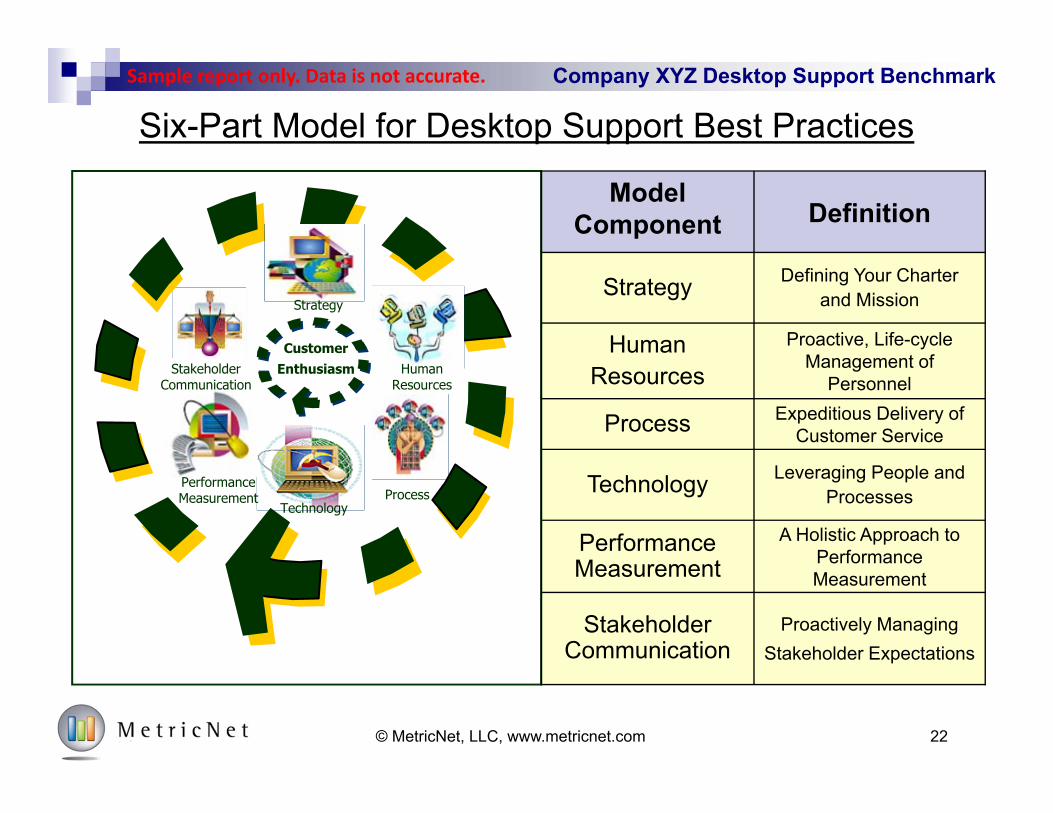
Six-Part Model for Desktop Support Best Practices
Proactively Managing Stakeholder Expectations
Stakeholder Communication
A Holistic Approach to Performance Measurement
Performance Measurement
Leveraging People and ProcessesTechnology
Expeditious Delivery of Customer ServiceProcess
Proactive, Life-cycle Management of
Personnel
HumanResources
Defining Your Charter and MissionStrategy
DefinitionModel
Component
Customer Enthusiasm
Strategy
Human Resources
ProcessTechnology
PerformanceMeasurement
Stakeholder Communication
22© MetricNet, LLC, www.metricnet.com

Company XYZ Desktop Support BenchmarkSample report only. Data is not accurate.
Ranking Explanation
1 No Knowledge of the Best Practice.
2 Aware of the Best Practice, but not applying it.
3 Aware of the Best Practice, and applying at a rudimentary level.
4 Best Practice is being effectively applied.
5 Best Practice is being applied in a world-class fashion.
Best Practices Evaluation Criteria
23© MetricNet, LLC, www.metricnet.com
Company XYZ Desktop Support BenchmarkSample report only. Data is not accurate.
24© MetricNet, LLC, www.metricnet.com
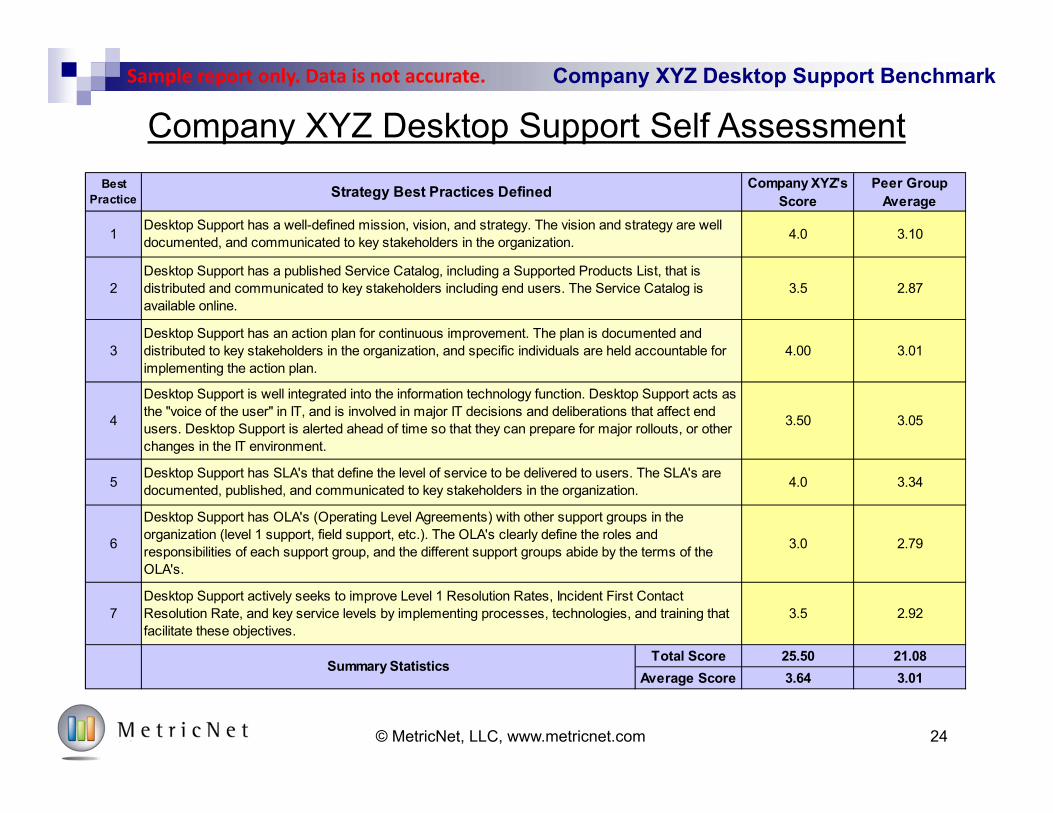
Company XYZ Desktop Support Self AssessmentBest
PracticeCompany XYZ's
ScorePeer Group
Average
1 4.0 3.10
2 3.5 2.87
3 4.00 3.01
4 3.50 3.05
5 4.0 3.34
6 3.0 2.79
7 3.5 2.92
Total Score 25.50 21.08Average Score 3.64 3.01
Strategy Best Practices Defined
Desktop Support has a well-defined mission, vision, and strategy. The vision and strategy are well documented, and communicated to key stakeholders in the organization.
Desktop Support has a published Service Catalog, including a Supported Products List, that is distributed and communicated to key stakeholders including end users. The Service Catalog is available online.
Desktop Support has an action plan for continuous improvement. The plan is documented and distributed to key stakeholders in the organization, and specific individuals are held accountable for implementing the action plan.
Desktop Support is well integrated into the information technology function. Desktop Support acts as the "voice of the user" in IT, and is involved in major IT decisions and deliberations that affect end users. Desktop Support is alerted ahead of time so that they can prepare for major rollouts, or other changes in the IT environment.
Desktop Support has SLA's that define the level of service to be delivered to users. The SLA's are documented, published, and communicated to key stakeholders in the organization.
Desktop Support has OLA's (Operating Level Agreements) with other support groups in the organization (level 1 support, field support, etc.). The OLA's clearly define the roles and responsibilities of each support group, and the different support groups abide by the terms of the OLA's.
Desktop Support actively seeks to improve Level 1 Resolution Rates, Incident First Contact Resolution Rate, and key service levels by implementing processes, technologies, and training that facilitate these objectives.
Summary Statistics

Company XYZ Desktop Support BenchmarkSample report only. Data is not accurate.
25© MetricNet, LLC, www.metricnet.com
Best Practices Process Assessment Summary
3.643.85
3.413.10
3.29 3.253.01
2.79 2.81 2.84 2.822.62
0.0
0.5
1.0
1.5
2.0
2.5
3.0
3.5
4.0
4.5
Aver
age
Scor
e
Company XYZ Peer Group

Company XYZ Desktop Support Benchmark
0%
10%
20%
30%
40%
50%
60%
70%
80%
90%
100%
0% 10% 20% 30% 40% 50% 60% 70% 80% 90% 100%
Bal
ance
d Sc
ore
Process Assessment Score
Process Maturity vs. Scorecard Performance
26© MetricNet, LLC, www.metricnet.com
Company XYZGlobal Database
Average = 56.7% Aver
age
= 45
.1%
Wor
ld-C
lass
= 7
5%
Process Assessment Score 60.4%
Balanced Score 64.5%
Company XYZ Performance

Company XYZ Desktop Support BenchmarkSample report only. Data is not accurate.
Module 5: Strategies for Optimized Performance
Core Components
Conclusions and Recommendations
Roadmap for World-Class Performance
© MetricNet, LLC, www.metricnet.com 27

Company XYZ Desktop Support BenchmarkSample report only. Data is not accurate.
Conclusions and Recommendations
Conclusions and Recommendations fall into six
categories
1. Strategy
2. Human Resource Management
3. Call Handling Processes and Procedures
4. Technology
5. Performance Measurement and Management
6. Stakeholder Communication
© MetricNet, LLC, www.metricnet.com 28

Company XYZ Desktop Support BenchmarkSample report only. Data is not accurate.
A Summary of the Major KPI Correlations
© MetricNet, LLC, www.metricnet.com 29
Cost per Ticket Customer Satisfaction
Technician Utilization
FVR (Incidents)
Technician Satisfaction
Coaching Career Path Training Hours
SLs: MTTR
Work/Travel Time
Techs/Total FTE’s
Absenteeism/Turnover
% Resolved Level 1 Capable
Scheduling Efficiency
Service Levels: MTTR

Company XYZ Desktop Support BenchmarkSample report only. Data is not accurate.
Performance Targets will be Established
© MetricNet, LLC, www.metricnet.com 30
Performance Metric Current Company XYZ Performance Target Performance
% Resolved Level 1 Capable 24.5% 20.0%
Mean Time to Resolve Incidents (business hours) 16.10 10.00
% of Incidents Resolved in 8 Business Hours 41.9% 55.0%
Annual Technician Training Hours 10 20
Technician Job Satisfaction 84.6% 90.0%
Balanced Score 64.5% 69.8%
Achieving the performance targets recommended above would increase the Company XYZ Desktop Support Balanced Score from 64.5% to 69.8%, and would elevate Company XYZ from 6th place to 4th
place on the Balanced Scorecard.
Company XYZ Desktop Support BenchmarkSample report only. Data is not accurate.
Module 6: Report Development and Presentation of Results
Core Topics
Report Development
Presentation of Benchmarking Results
© MetricNet, LLC, www.metricnet.com 31

Company XYZ Desktop Support BenchmarkSample report only. Data is not accurate.
32
Write Benchmarking Report
© MetricNet, LLC, www.metricnet.com

Company XYZ Desktop Support BenchmarkSample report only. Data is not accurate.
Presentation of Results
33© MetricNet, LLC, www.metricnet.com
Company XYZ
MetricNet will present the results of the benchmark in a live GoToMeeting.

Industry Background
34

Company XYZ Desktop Support BenchmarkSample report only. Data is not accurate.
28 Years of IT Service and Support Benchmarking Data
More than 3,700 Benchmarks
Global Database
30 Key Performance Indicators
More than 70 Industry Best Practices
35© MetricNet, LLC, www.metricnet.com

Company XYZ Desktop Support BenchmarkSample report only. Data is not accurate.
Then and Now: The Evolution of Desktop Support
Desktop Support KPI’s
North American Averages1988 2014
Monthly Desktop Tickets per User 0.53 0.78
Cost per Ticket $29 $62Average Incident
Work Time (min:sec) 17:40 32:15
Incidents Resolved on First Contact 74% 68%
% Resolved Level 1 Capable 54% 22%
Starting Technician Salaries (current dollars) $37,050 $43,627
Desktop Cost per User per Year $184 $580
36© MetricNet, LLC, www.metricnet.com

Company XYZ Desktop Support Benchmark
Tickets, Incidents, and Service Requests
Tickets
Incidents Service Requests
Incident Volume + Service Request Volume = Ticket Volume
Unplanned work that requires a physical touch to a device Hardware break/fix Device failure Connectivity failure
Planned work that requires a physical touch to one or more devices Move/Add/Change Hardware or software
upgrade Device refresh Device set-up
© MetricNet, LLC, www.metricnet.com 37

Company XYZ Desktop Support BenchmarkSample report only. Data is not accurate.
Characteristics of World-Class Desktop Support
Desktop Support consistently exceeds customer expectations Result is high levels of customer satisfaction (> 93%) MTTR is below average for Incidents and Service Requests
< 0.7 days for Incidents < 3.8 days for Service Requests
Costs are managed at or below industry average levels Cost per Ticket, per Incident, and per Service Request is below average Minimizes Total Cost of Ownership (TCO)
Desktop Support follows industry best practices Industry best practices are defined and documented Desktop Support follows industry best practices
Every transaction adds value A positive customer experience Drives a positive view of IT overall
© MetricNet, LLC, www.metricnet.com 38

Company XYZ Desktop Support Benchmark
Cost per Ticket HigherLower
Higher BEST-IN-CLASS PERFORMANCE CURVE
BELOW-AVERAGEPERFORMANCE CURVE
World-Class Desktop Support Defined
World-Class Desktop Support
“Average” Desktop Support
© MetricNet, LLC, www.metricnet.com 39

Company XYZ Desktop Support BenchmarkSample report only. Data is not accurate.
The Paradox of IT Support
Less than 5% of all IT spending is allocated to end-user support Service desk, desktop support,
field support
This leads many to erroneously assume that there is little upside opportunity in IT support
The result is that most support organizations are managed with the goal of minimizing costs
But the most effective support strategies focus on maximizing valueCorporate IT Spending Breakdown
4%
96%: Non support functions
End-User Support
Application Development
Application Maintenance
Network Operations
Mainframe and midrange Computing
Desktop Computing
Contract Services (e.g., disaster recovery)
40© MetricNet, LLC, www.metricnet.com

Company XYZ Desktop Support BenchmarkSample report only. Data is not accurate.
World-Class Desktop Support: Three Sources of Leverage
World-Class Desktop Support organizations recognize and exploit three unique sources of leverage:
1. Minimizing Total Cost of Ownership (TCO)
2. Improving End-User Productivity
3. Driving a Positive View of Corporate IT
41© MetricNet, LLC, www.metricnet.com

Company XYZ Desktop Support BenchmarkSample report only. Data is not accurate.
Support Level Cost per Ticket
Vendor
Level 2: Desktop Support
Field Support
Level 3 IT(apps, networking, NOC, etc.)
Level 1: Service Desk
$599
$221
$104
$69
$22
42© MetricNet, LLC, www.metricnet.com
Cost of Resolution: North American Averages

Company XYZ Desktop Support BenchmarkSample report only. Data is not accurate.
43© MetricNet, LLC, www.metricnet.com
Support Level
VendorField3210-1
$599$221$104$69$22$2$0Vendor Support
Field SupportIT SupportDesktop
SupportService
DeskSelf HelpIncident Prevention
Shift-Left Cost Reduction Strategies

Company XYZ Desktop Support BenchmarkSample report only. Data is not accurate.
The Tao of SPOC (Single Point of Contact)
User CommunityLevel 1
Service Desk
Desktop Support
Field Support
Level 2 IT Support
Vendor Support
44© MetricNet, LLC, www.metricnet.com

Company XYZ Desktop Support BenchmarkSample report only. Data is not accurate.
The Tao of SPOC (Continued)
Key SPOC Principles Enterprise takes an end-to-end view of
user support User/Customer has a single point of
contact for all IT-related incidents, questions, problems, and work requests
The Level 1 Service Desk is the SPOC Level 1 is responsible for:
Ticket triage Resolution at Level 1 if possible Effective handoffs to n level support Resolution coordination and facilitation Ticket closure
Desktop “Drive-bys”, “Fly-bys”, and “Snags” are strongly discouraged
45© MetricNet, LLC, www.metricnet.com

Company XYZ Desktop Support BenchmarkSample report only. Data is not accurate.
SPOC Support Reduces Total Cost of Ownership
0%
5%
10%
15%
20%
25%
30%
35%
40%
% R
esol
ved
Leve
l 1 C
apab
le
% Resolved Level 1 Capable with SPOC % Resolved Level 1 Capable without SPOC
Average = 22.8%
Average = 15.3%
46© MetricNet, LLC, www.metricnet.com
Company XYZ Desktop Support BenchmarkSample report only. Data is not accurate.
0
10
20
30
40
50
60
70
0 1 2 3 4 5
Prod
uctiv
e Ho
urs
Lost
per
Em
ploy
ee p
er Y
ear
Performance Quartile n = 60
47© MetricNet, LLC, www.metricnet.com
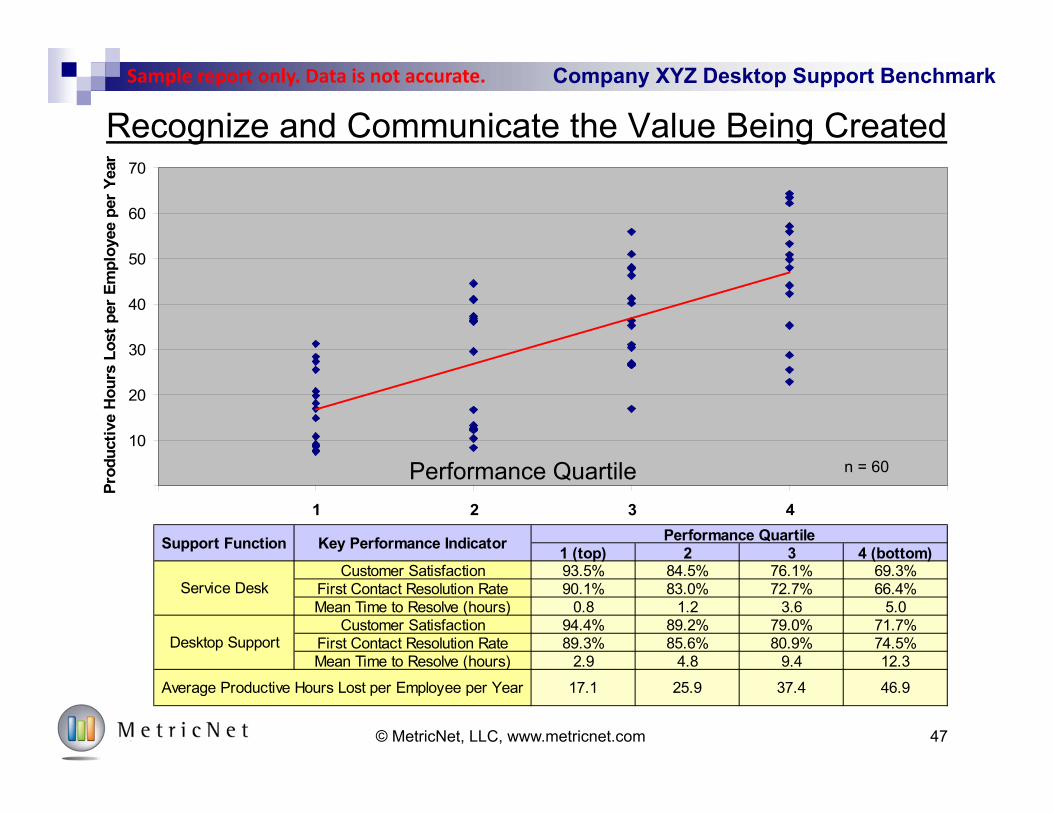
1 (top) 2 3 4 (bottom)Customer Satisfaction 93.5% 84.5% 76.1% 69.3%
First Contact Resolution Rate 90.1% 83.0% 72.7% 66.4%Mean Time to Resolve (hours) 0.8 1.2 3.6 5.0
Customer Satisfaction 94.4% 89.2% 79.0% 71.7%First Contact Resolution Rate 89.3% 85.6% 80.9% 74.5%Mean Time to Resolve (hours) 2.9 4.8 9.4 12.3
Service Desk
Desktop Support
Performance QuartileSupport Function Key Performance Indicator
37.4 46.9Average Productive Hours Lost per Employee per Year 17.1 25.9
Recognize and Communicate the Value Being Created

Company XYZ Desktop Support BenchmarkSample report only. Data is not accurate.
84%
47%
31% 29%22%
19%
8%
0%
10%
20%
30%
40%
50%
60%
70%
80%
90%
Service Desk DesktopSupport
NetworkOutages
VPN Training EnterpriseApplications
DesktopSoftware
Factors Contributing to IT Customer Satisfaction
% S
ayin
g Ve
ry Im
port
ant
n = 1,044 Global large cap companies Survey type: multiple choice 3 responses allowed per survey
84% cited the service desk as a very important factor in their overall satisfaction with corporate IT 47% cited desktop support as a very important factor in their overall satisfaction with corporate IT
Support Drives Customer Satisfaction for All of IT
48© MetricNet, LLC, www.metricnet.com

Performance Benchmarking Summary
49

Company XYZ Desktop Support BenchmarkSample report only. Data is not accurate.
Company XYZ Desktop Support Overview
50© MetricNet, LLC, www.metricnet.com
Incidents
Service Requests
Total Tickets
Desktop Support Technician Level 1 6.0 Trouble Ticket System ServiceNow
Desktop Support Technician Level 2 2.0 Automatic Call Distributor (ACD) Avaya
Desktop Support Technician Level 3 0.5 Workforce Mgmt/Scheduling Software Ultimate Software UltiPro
Ticket Quality 0.5 Interactive Voice Response (IVR) Avaya
Manager 1.0 Knowledge Management System ServiceNow
Total 10.0 Remote Control Software LogMeIn Rescue Tech Console
Other technology Toggl Timer
End Users Supported 2,209
FTE Personnel Headcount Technology Profile
Annual Operating Expense $687,595
Average Monthly Ticket Volume
537
148
685
Desktop Support Locations St. Louis, MO
Hours of Operation 7 AM – 5 PM, Monday – Friday
Data Time Period January 2017 – December 2017

Company XYZ Desktop Support BenchmarkSample report only. Data is not accurate.
© MetricNet, LLC, www.metricnet.com 51
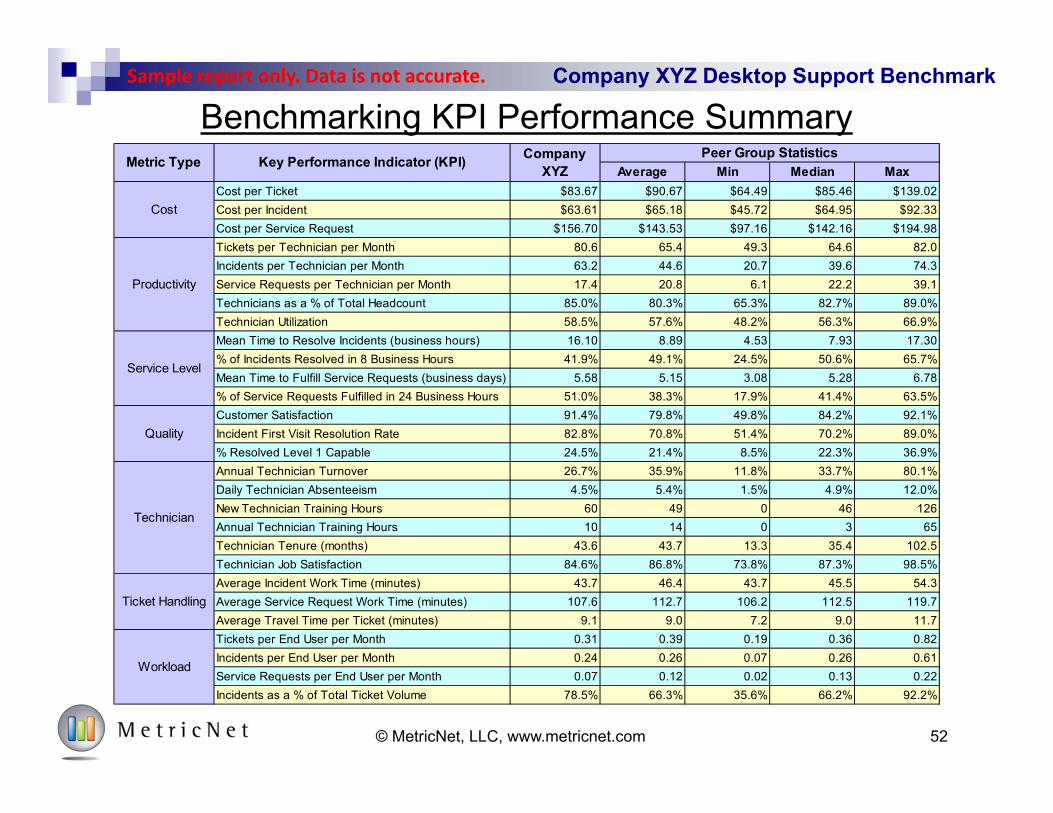
Summary of Included Desktop Support Metrics
Cost per Ticket Cost per Incident Cost per Service Request
Cost Productivity Service Level
Quality
Technician
Mean Time to Resolve Incidents (business hours)
% of Incidents Resolved in 8 Business Hours
Mean Time to Fulfill Service Requests (business days)
% of Service Requests Fulfilled in 24 Business Hours
Tickets per Technician per Month
Incidents per Technician per Month
Service Requests per Technician per Month
Technicians as a % of Total Headcount
Technician Utilization
Customer Satisfaction Incident First Visit Resolution
Rate % Resolved Level 1 Capable
Annual Technician Turnover Daily Technician Absenteeism New Technician Training Hours Annual Technician Training
Hours Technician Tenure (months) Technician Job Satisfaction
Average Incident Work Time (minutes)
Average Service Request Work Time (minutes)
Average Travel Time per Ticket (minutes)
Ticket Handling Workload Tickets per End User per Month Incidents per End User per
Month Service Requests per End User
per Month Incidents as a % of Total Ticket
Volume
Company XYZ Desktop Support BenchmarkSample report only. Data is not accurate.
52© MetricNet, LLC, www.metricnet.com
Benchmarking KPI Performance SummaryAverage Min Median Max
Cost per Ticket $83.67 $90.67 $64.49 $85.46 $139.02Cost per Incident $63.61 $65.18 $45.72 $64.95 $92.33Cost per Service Request $156.70 $143.53 $97.16 $142.16 $194.98Tickets per Technician per Month 80.6 65.4 49.3 64.6 82.0Incidents per Technician per Month 63.2 44.6 20.7 39.6 74.3Service Requests per Technician per Month 17.4 20.8 6.1 22.2 39.1Technicians as a % of Total Headcount 85.0% 80.3% 65.3% 82.7% 89.0%Technician Utilization 58.5% 57.6% 48.2% 56.3% 66.9%Mean Time to Resolve Incidents (business hours) 16.10 8.89 4.53 7.93 17.30% of Incidents Resolved in 8 Business Hours 41.9% 49.1% 24.5% 50.6% 65.7%Mean Time to Fulfill Service Requests (business days) 5.58 5.15 3.08 5.28 6.78% of Service Requests Fulfilled in 24 Business Hours 51.0% 38.3% 17.9% 41.4% 63.5%Customer Satisfaction 91.4% 79.8% 49.8% 84.2% 92.1%Incident First Visit Resolution Rate 82.8% 70.8% 51.4% 70.2% 89.0%% Resolved Level 1 Capable 24.5% 21.4% 8.5% 22.3% 36.9%Annual Technician Turnover 26.7% 35.9% 11.8% 33.7% 80.1%Daily Technician Absenteeism 4.5% 5.4% 1.5% 4.9% 12.0%New Technician Training Hours 60 49 0 46 126Annual Technician Training Hours 10 14 0 3 65Technician Tenure (months) 43.6 43.7 13.3 35.4 102.5Technician Job Satisfaction 84.6% 86.8% 73.8% 87.3% 98.5%Average Incident Work Time (minutes) 43.7 46.4 43.7 45.5 54.3Average Service Request Work Time (minutes) 107.6 112.7 106.2 112.5 119.7Average Travel Time per Ticket (minutes) 9.1 9.0 7.2 9.0 11.7Tickets per End User per Month 0.31 0.39 0.19 0.36 0.82Incidents per End User per Month 0.24 0.26 0.07 0.26 0.61Service Requests per End User per Month 0.07 0.12 0.02 0.13 0.22Incidents as a % of Total Ticket Volume 78.5% 66.3% 35.6% 66.2% 92.2%
Productivity
Metric Type Key Performance Indicator (KPI) Company XYZ
Peer Group Statistics
Cost
Service Level
Quality
Technician
Ticket Handling
Workload

Company XYZ Desktop Support BenchmarkSample report only. Data is not accurate.
KPI Gap Summary
53© MetricNet, LLC, www.metricnet.com
Cost per Ticket $83.67 $90.67 7.7%Cost per Incident $63.61 $65.18 2.4%Cost per Service Request $156.70 $143.53 -9.2%Tickets per Technician per Month 80.6 65.4 23.2%Incidents per Technician per Month 63.2 44.6 41.8%Service Requests per Technician per Month 17.4 20.8 -16.4%Technicians as a % of Total Headcount 85.0% 80.3% 5.9%Technician Utilization 58.5% 57.6% 1.6%Mean Time to Resolve Incidents (business hours) 16.10 8.89 -81.1%% of Incidents Resolved in 8 Business Hours 41.9% 49.1% -14.6%Mean Time to Fulfill Service Requests (business days) 5.58 5.15 -8.4%% of Service Requests Fulfilled in 24 Business Hours 51.0% 38.3% 33.3%Customer Satisfaction 91.4% 79.8% 14.6%Incident First Visit Resolution Rate 82.8% 70.8% 16.9%% Resolved Level 1 Capable 24.5% 21.4% -14.2%Annual Technician Turnover 26.7% 35.9% 25.6%Daily Technician Absenteeism 4.5% 5.4% 16.4%New Technician Training Hours 60 49 22.6%Annual Technician Training Hours 10 14 -29.9%Technician Tenure (months) 43.6 43.7 -0.3%Technician Job Satisfaction 84.6% 86.8% -2.5%Average Incident Work Time (minutes) 43.7 46.4 5.9%Average Service Request Work Time (minutes) 107.6 112.7 4.5%Average Travel Time per Ticket (minutes) 9.1 9.0 -0.6%Tickets per End User per Month 0.31 0.39 19.6%Incidents per End User per Month 0.24 0.26 8.6%Service Requests per End User per Month 0.07 0.12 41.0%Incidents as a % of Total Ticket Volume 78.5% 66.3% 18.3%
Performance Gap
Cost
Workload
Metric Type Key Performance Indicator (KPI) Company XYZ Peer Average
Productivity
Service Level
Quality
Technician
Ticket Handling

Company XYZ Desktop Support BenchmarkSample report only. Data is not accurate.
54© MetricNet, LLC, www.metricnet.com
KPI Gap Ranking
Incidents per Technician per Month 63.2 44.6 41.8%Service Requests per End User per Month 0.07 0.12 41.0%% of Service Requests Fulfilled in 24 Business Hours 51.0% 38.3% 33.3%Annual Technician Turnover 26.7% 35.9% 25.6%Tickets per Technician per Month 80.6 65.4 23.2%New Technician Training Hours 60 49 22.6%Tickets per End User per Month 0.31 0.39 19.6%Incidents as a % of Total Ticket Volume 78.5% 66.3% 18.3%Incident First Visit Resolution Rate 82.8% 70.8% 16.9%Daily Technician Absenteeism 4.5% 5.4% 16.4%Customer Satisfaction 91.4% 79.8% 14.6%Incidents per End User per Month 0.24 0.26 8.6%Cost per Ticket $83.67 $90.67 7.7%Technicians as a % of Total Headcount 85.0% 80.3% 5.9%Average Incident Work Time (minutes) 43.7 46.4 5.9%Average Service Request Work Time (minutes) 107.6 112.7 4.5%Cost per Incident $63.61 $65.18 2.4%Technician Utilization 58.5% 57.6% 1.6%Technician Tenure (months) 43.6 43.7 -0.3%Average Travel Time per Ticket (minutes) 9.1 9.0 -0.6%Technician Job Satisfaction 84.6% 86.8% -2.5%Mean Time to Fulfill Service Requests (business days) 5.58 5.15 -8.4%Cost per Service Request $156.70 $143.53 -9.2%% Resolved Level 1 Capable 24.5% 21.4% -14.2%% of Incidents Resolved in 8 Business Hours 41.9% 49.1% -14.6%Service Requests per Technician per Month 17.4 20.8 -16.4%Annual Technician Training Hours 10 14 -29.9%Mean Time to Resolve Incidents (business hours) 16.10 8.89 -81.1%
Key Performance Indicator (KPI) Company XYZ Peer Average Performance Gap

Company XYZ Desktop Support BenchmarkSample report only. Data is not accurate.
55© MetricNet, LLC, www.metricnet.com
Quartile Rankings: Cost and Productivity Metrics
(Top) (Bottom)
Cost per Ticket$64.49 $78.36 $85.46 $99.78
Cost MetricQuartile
12 3
$78.36 $85.46 $99.78
4
$83.67
Company XYZ
Performance
$139.02
Cost per Incident$45.72 $57.65 $64.95 $71.72
$57.65 $64.95 $71.72 $92.33$63.61
Cost per Service Request$97.16 $124.81 $142.16 $159.26
$124.81 $142.16 $159.26 $194.98$156.70
(Top) (Bottom)
Tickets per Technician per Month82 73 65 59
Productivity MetricQuartile
12 3
73 65 59
4
81
Company XYZ
Performance
49
Incidents per Technician per Month74 55 40 35
55 40 35 2163
17Service Requests per Technician per Month39 26 22 16
Technician Utilization66.9% 62.6% 56.3% 53.9%
62.6% 56.3% 53.9% 48.2%58.5%
26 22 16 6
Technicians as a % of Total Headcount89.0% 84.7% 82.7% 76.4%
84.7% 82.7% 76.4% 65.3%85.0%

Company XYZ Desktop Support BenchmarkSample report only. Data is not accurate.
56© MetricNet, LLC, www.metricnet.com
Quartile Rankings: Service Level and Quality Metrics
Service Level MetricQuartile Company
XYZ Performance
12 3
4
Mean Time to Resolve Incidents (business hours)
4.53 6.23 7.93 10.40
6.23 7.93 10.40 17.30
(Top) (Bottom)
16.10
41.9%55.9% 50.6% 45.4% 24.5%
% of Incidents Resolved in 8 Business Hours65.7% 55.9% 50.6% 45.4%
Mean Time to Fulfill Service Requests (business days)
3.08 4.40 5.28 5.94
4.40 5.28 5.94 6.785.58
% of Service Requests Fulfilled in 24 Business Hours
63.5% 49.5% 41.4% 22.8%
49.5% 41.4% 22.8% 17.9%51.0%
(Top) (Bottom)
Customer Satisfaction92.1% 87.5% 84.2% 77.3%
Quality MetricQuartile
12 3
87.5% 84.2% 77.3%
4
91.4%
Company XYZ
Performance
49.8%
Incident First Visit Resolution Rate89.0% 77.1% 70.2% 63.3%
77.1% 70.2% 63.3% 51.4%82.8%
% Resolved Level 1 Capable8.5% 16.6% 22.3% 25.6%
16.6% 22.3% 25.6% 36.9%24.5%

Company XYZ Desktop Support BenchmarkSample report only. Data is not accurate.
57© MetricNet, LLC, www.metricnet.com
Quartile Rankings: Technician Metrics
Technician MetricQuartile Company
XYZ Performance
12 3
4
Annual Technician Turnover11.8% 24.6% 33.7% 43.8%
24.6% 33.7% 43.8% 80.1%
(Top) (Bottom)
26.7%
4.5%2.9% 4.9% 7.3% 12.0%
Daily Technician Absenteeism1.5% 2.9% 4.9% 7.3%
New Technician Training Hours126 83 46 7
83 46 7 060
10Annual Technician Training Hours65 26 3 0
Technician Tenure (months)102.5 54.0 35.4 29.2
54.0 35.4 29.2 13.343.6
26 3 0 0
Technician Job Satisfaction98.5% 91.1% 87.3% 82.8%
91.1% 87.3% 82.8% 73.8%84.6%

Company XYZ Desktop Support BenchmarkSample report only. Data is not accurate.
58© MetricNet, LLC, www.metricnet.com
Quartile Rankings: Ticket Handling and Workload Metrics
(Top) (Bottom)
Average Incident Work Time (minutes)43.7 44.4 45.5 47.7
Ticket Handling MetricQuartile
12 3
44.4 45.5 47.7
4
43.7
Company XYZ
Performance
54.3
Average Service Request Work Time (minutes)106.2 109.4 112.5 116.6
109.4 112.5 116.6 119.7107.6
Average Travel Time per Ticket (minutes)7.2 8.1 9.0 9.9
8.1 9.0 9.9 11.79.1
Workload MetricQuartile Company
XYZ Performance
12 3
4
Tickets per End User per Month0.19 0.29 0.36 0.51
0.29 0.36 0.51 0.82
(Top) (Bottom)
0.31
0.240.16 0.26 0.34 0.61
Incidents per End User per Month0.07 0.16 0.26 0.34
Service Requests per End User per Month0.02 0.09 0.13 0.15
0.09 0.13 0.15 0.220.07
Incidents as a % of Total Ticket Volume92.2% 77.8% 66.2% 55.4%
77.8% 66.2% 55.4% 35.6%78.5%

Company XYZ Desktop Support BenchmarkSample report only. Data is not accurate.
59© MetricNet, LLC, www.metricnet.com
Desktop Support Balanced Scorecard: An Overview
The Desktop Support balanced scorecard employs a methodology that provides you with a single, all-inclusive measure of your Desktop Support performance.
It combines cost, productivity, quality, service level, and technician metrics into an overall performance indicator of your Desktop Support.
Your Desktop Support score will range between 0 and 100%, and can be compared directly to the scores of other Desktop Support Groups in the benchmark.
By computing your overall score on a monthly or quarterly basis, you can track and trend your performance over time.
Charting and tracking your Desktop Support balanced score is an ideal way to ensure continuous improvement in Desktop Support!

Company XYZ Desktop Support BenchmarkSample report only. Data is not accurate.
Company XYZ Desktop Support Balanced Scorecard
60© MetricNet, LLC, www.metricnet.com
Step 1Eight critical performance metrics have been selected for the scorecard.
Step 3For each performance metric, the highest and lowest performance levels in the benchmark are recorded.
Step 4Your actual performance for each metric is recorded in this column.
Step 5Your score for each metric is then calculated:
(worst case - actual performance) ÷ (worst case
– best case) × 100
Step 6Your balanced score for each metric is calculated:
metric score × weighting
Step 2Each metric has been weighted according to its relative importance.
Worst Case Best CaseCost per Incident 15.0% $92.33 $45.72 $63.61 61.6% 9.2%Cost per Service Request 15.0% $194.98 $97.16 $156.70 39.1% 5.9%Customer Satisfaction 20.0% 49.8% 92.1% 91.4% 98.3% 19.7%Incident First Visit Resolution Rate 10.0% 51.4% 89.0% 82.8% 83.5% 8.3%Technician Utilization 10.0% 48.2% 66.9% 58.5% 55.1% 5.5%% of Incidents Resolved in 8 Business Hours 10.0% 24.5% 65.7% 41.9% 42.3% 4.2%% of Service Requests Fulfilled in 24 Business Hours 10.0% 17.9% 63.5% 51.0% 72.6% 7.3%Technician Job Satisfaction 10.0% 73.8% 98.5% 84.6% 43.7% 4.4%
Balanced Score 100.0% N/A N/A N/A N/A 64.5%
Performance Metric Metric Weighting
Performance Range Your Actual Performance
Balanced ScoreMetric Score

Company XYZ Desktop Support BenchmarkSample report only. Data is not accurate.
61© MetricNet, LLC, www.metricnet.com
Scorecard KPI Performance Spectrum
61.6%
39.1%
98.3%
83.5%
83.5%
55.1%
42.3%
43.7%
64.5%
0% 10% 20% 30% 40% 50% 60% 70% 80% 90% 100%
Cost/Incident
Cost/Svc. Request
Customer Sat.
Incident FVR
Tech Utilization
% IncidentsResolved in 8 Hrs
% Requests Fulfilledin 24 Hrs
Tech Satisfaction
Balanced Score
Best KPI PerformanceWorst KPI Performance

Company XYZ Desktop Support BenchmarkSample report only. Data is not accurate.
62© MetricNet, LLC, www.metricnet.com
Balanced Scorecard Summary
0%
10%
20%
30%
40%
50%
60%
70%
80%
90%
100%
Bal
ance
d Sc
ores
Desktop Support
High 86.5%Average ־־־־־ 56.7%Median 58.9%Low 23.5%Company XYZ 64.5%
Key Statistics
Desktop Support Scores

Company XYZ Desktop Support BenchmarkSample report only. Data is not accurate.
63© MetricNet, LLC, www.metricnet.com
Peer Group Scorecard Summary Data
The next two pages illustrate the benchmarking peer
group performance for each KPI in the scorecard
Page 64 ranks each Desktop Support group from best
performer (Desktop Support #3) to worst performer
(Desktop Support #18) based upon their balanced scores
Page 65 ranks each KPI in the scorecard from best (top
row) to worst (bottom row)

Company XYZ Desktop Support BenchmarkSample report only. Data is not accurate.
64© MetricNet, LLC, www.metricnet.com
Scorecard Performance Rankings
Overall Ranking
Desktop Support Number
Cost per Incident
Cost per Service Request
Customer Satisfaction
Incident First Visit
Resolution Rate
Technician Utilization
% of Incidents Resolved in 8
Business Hours
% of Service Requests
Fulfilled in 24 Business Hours
Technician Job
Satisfaction
Total Balanced
Score1 3 $45.72 $97.16 90.4% 89.0% 65.1% 50.9% 31.8% 95.6% 86.5%2 5 $51.32 $110.38 85.0% 81.8% 64.2% 48.5% 49.7% 87.7% 77.9%3 12 $52.58 $115.49 86.7% 73.5% 64.7% 48.6% 41.4% 87.3% 73.6%4 4 $58.38 $140.74 90.7% 75.2% 54.9% 54.1% 63.5% 81.3% 68.7%5 20 $65.89 $154.52 84.2% 79.9% 54.0% 59.4% 49.2% 97.6% 66.6%6 Company XYZ $63.61 $156.70 91.4% 82.8% 58.5% 41.9% 51.0% 84.6% 64.5%7 11 $58.55 $119.24 83.9% 75.1% 61.4% 52.2% 26.8% 77.6% 62.2%8 19 $48.97 $110.93 67.3% 62.8% 66.9% 62.2% 19.4% 84.3% 61.8%9 15 $59.03 $127.70 80.8% 70.2% 56.3% 44.9% 32.2% 93.1% 60.9%10 14 $72.82 $161.82 88.3% 69.7% 52.6% 59.4% 55.2% 90.1% 60.0%11 16 $77.59 $170.85 87.0% 79.0% 53.6% 45.9% 56.2% 98.5% 59.8%12 22 $65.73 $139.36 92.1% 83.3% 50.3% 52.6% 22.6% 84.6% 58.9%13 10 $56.91 $121.92 65.0% 60.7% 64.5% 50.2% 44.3% 87.6% 58.6%14 17 $70.61 $131.15 77.6% 67.7% 56.8% 54.1% 49.0% 85.1% 57.4%15 21 $67.07 $142.16 80.7% 72.4% 53.8% 31.5% 34.1% 96.1% 53.7%16 2 $55.81 $130.57 60.3% 71.4% 63.9% 50.6% 18.6% 88.0% 52.6%17 7 $75.74 $170.42 80.1% 65.9% 58.7% 58.1% 61.8% 73.8% 50.7%18 1 $64.95 $149.34 85.4% 61.8% 55.1% 49.1% 21.5% 84.0% 50.0%19 13 $61.73 $149.87 77.0% 67.7% 59.4% 57.7% 17.9% 78.3% 49.8%20 6 $92.33 $194.98 85.9% 63.7% 54.2% 65.7% 20.4% 90.0% 40.6%21 9 $70.30 $153.97 57.1% 61.1% 54.9% 28.7% 44.2% 81.6% 32.9%22 8 $86.65 $167.57 88.1% 63.0% 52.1% 24.5% 23.1% 77.6% 32.0%23 18 $76.99 $184.27 49.8% 51.4% 48.2% 38.5% 45.8% 92.0% 23.5%
Average $65.18 $143.53 79.8% 70.8% 57.6% 49.1% 38.3% 86.8% 56.7%Max $92.33 $194.98 92.1% 89.0% 66.9% 65.7% 63.5% 98.5% 86.5%Min $45.72 $97.16 49.8% 51.4% 48.2% 24.5% 17.9% 73.8% 23.5%
Median $64.95 $142.16 84.2% 70.2% 56.3% 50.6% 41.4% 87.3% 58.9%
Key Statistics
Scorecard Metrics

Company XYZ Desktop Support BenchmarkSample report only. Data is not accurate.
65© MetricNet, LLC, www.metricnet.com
KPI Scorecard Data in Rank Order
Cost per Incident
Cost per Service Request
Customer Satisfaction
Incident First Visit Resolution
RateTechnician Utilization
% of Incidents Resolved in 8
Business Hours
% of Service Requests Fulfilled in
24 Business HoursTechnician Job
SatisfactionTotal Balanced
ScoreCompany XYZ $63.61 $156.70 91.4% 82.8% 58.5% 41.9% 51.0% 84.6% 64.5%
Ranking 11 17 2 3 10 19 5 14 6Quartile 2 3 1 1 2 4 1 3 1
1 $45.72 $97.16 92.1% 89.0% 66.9% 65.7% 63.5% 98.5% 86.5%2 $48.97 $110.38 91.4% 83.3% 65.1% 62.2% 61.8% 97.6% 77.9%3 $51.32 $110.93 90.7% 82.8% 64.7% 59.4% 56.2% 96.1% 73.6%4 $52.58 $115.49 90.4% 81.8% 64.5% 59.4% 55.2% 95.6% 68.7%5 $55.81 $119.24 88.3% 79.9% 64.2% 58.1% 51.0% 93.1% 66.6%6 $56.91 $121.92 88.1% 79.0% 63.9% 57.7% 49.7% 92.0% 64.5%7 $58.38 $127.70 87.0% 75.2% 61.4% 54.1% 49.2% 90.1% 62.2%8 $58.55 $130.57 86.7% 75.1% 59.4% 54.1% 49.0% 90.0% 61.8%9 $59.03 $131.15 85.9% 73.5% 58.7% 52.6% 45.8% 88.0% 60.9%
10 $61.73 $139.36 85.4% 72.4% 58.5% 52.2% 44.3% 87.7% 60.0%11 $63.61 $140.74 85.0% 71.4% 56.8% 50.9% 44.2% 87.6% 59.8%12 $64.95 $142.16 84.2% 70.2% 56.3% 50.6% 41.4% 87.3% 58.9%13 $65.73 $149.34 83.9% 69.7% 55.1% 50.2% 34.1% 85.1% 58.6%14 $65.89 $149.87 80.8% 67.7% 54.9% 49.1% 32.2% 84.6% 57.4%15 $67.07 $153.97 80.7% 67.7% 54.9% 48.6% 31.8% 84.6% 53.7%16 $70.30 $154.52 80.1% 65.9% 54.2% 48.5% 26.8% 84.3% 52.6%17 $70.61 $156.70 77.6% 63.7% 54.0% 45.9% 23.1% 84.0% 50.7%18 $72.82 $161.82 77.0% 63.0% 53.8% 44.9% 22.6% 81.6% 50.0%19 $75.74 $167.57 67.3% 62.8% 53.6% 41.9% 21.5% 81.3% 49.8%20 $76.99 $170.42 65.0% 61.8% 52.6% 38.5% 20.4% 78.3% 40.6%21 $77.59 $170.85 60.3% 61.1% 52.1% 31.5% 19.4% 77.6% 32.9%22 $86.65 $184.27 57.1% 60.7% 50.3% 28.7% 18.6% 77.6% 32.0%23 $92.33 $194.98 49.8% 51.4% 48.2% 24.5% 17.9% 73.8% 23.5%
Average $65.18 $143.53 79.8% 70.8% 57.6% 49.1% 38.3% 86.8% 56.7%Max $92.33 $194.98 92.1% 89.0% 66.9% 65.7% 63.5% 98.5% 86.5%Min $45.72 $97.16 49.8% 51.4% 48.2% 24.5% 17.9% 73.8% 23.5%
Median $64.95 $142.16 84.2% 70.2% 56.3% 50.6% 41.4% 87.3% 58.9%
Scorecard Metrics

Company XYZ Desktop Support BenchmarkSample report only. Data is not accurate.
66© MetricNet, LLC, www.metricnet.com
Scorecard Metrics: Cost per Incident
$0.00
$10.00
$20.00
$30.00
$40.00
$50.00
$60.00
$70.00
$80.00
$90.00
$100.00
Cos
t per
Inci
dent
Desktop Support
High $92.33Average ־־־־־ $65.18Median $64.95Low $45.72Company XYZ $63.61
Key Statistics
Cost per Incident

Company XYZ Desktop Support BenchmarkSample report only. Data is not accurate.
67© MetricNet, LLC, www.metricnet.com
Scorecard Metrics: Cost per Service Request
$0.00
$25.00
$50.00
$75.00
$100.00
$125.00
$150.00
$175.00
$200.00
$225.00
Cos
t per
Ser
vice
Req
uest
Desktop Support
High $194.98Average ־־־־־ $143.53Median $142.16Low $97.16Company XYZ $156.70
Key Statistics
Cost per Service Request

Company XYZ Desktop Support BenchmarkSample report only. Data is not accurate.
68© MetricNet, LLC, www.metricnet.com
Scorecard Metrics: Customer Satisfaction
30.0%
40.0%
50.0%
60.0%
70.0%
80.0%
90.0%
100.0%
Cus
tom
er S
atis
fact
ion
Desktop Support
High 92.1%Average ־־־־־ 79.8%Median 84.2%Low 49.8%Company XYZ 91.4%
Key Statistics
Customer Satisfaction

Company XYZ Desktop Support BenchmarkSample report only. Data is not accurate.
69© MetricNet, LLC, www.metricnet.com
Scorecard Metrics: Incident First Visit Resolution Rate
0.0%
10.0%
20.0%
30.0%
40.0%
50.0%
60.0%
70.0%
80.0%
90.0%
100.0%
Inci
dent
Firs
t Vis
it R
esol
utio
n R
ate
Desktop Support
High 89.0%Average ־־־־־ 70.8%Median 70.2%Low 51.4%Company XYZ 82.8%
Key Statistics
Incident First Visit Resolution Rate

Company XYZ Desktop Support BenchmarkSample report only. Data is not accurate.
70© MetricNet, LLC, www.metricnet.com
Scorecard Metrics: Technician Utilization
40.0%
45.0%
50.0%
55.0%
60.0%
65.0%
70.0%
Tech
nici
an U
tiliz
atio
n
Desktop Support
High 66.9%Average ־־־־־ 57.6%Median 56.3%Low 48.2%Company XYZ 58.5%
Key Statistics
Technician Utilization

Company XYZ Desktop Support BenchmarkSample report only. Data is not accurate.
71© MetricNet, LLC, www.metricnet.com
Scorecard Metrics: % of Incidents Resolved in 8 Business Hrs
0.0%
10.0%
20.0%
30.0%
40.0%
50.0%
60.0%
70.0%
% o
f Inc
iden
ts R
esol
ved
in 8
Bus
ines
s H
ours
Desktop Support
High 65.7%Average ־־־־־ 49.1%Median 50.6%Low 24.5%Company XYZ 41.9%
Key Statistics
% of Incidents Resolved in 8 Business Hours

Company XYZ Desktop Support BenchmarkSample report only. Data is not accurate.
72© MetricNet, LLC, www.metricnet.com
Scorecard Metrics: % of Service Requests Fulfilled in 24 Business Hrs
0.0%
10.0%
20.0%
30.0%
40.0%
50.0%
60.0%
70.0%
% o
f Ser
vice
Req
uest
s Fu
lfille
d in
24
Bus
ines
s H
ours
Desktop Support
High 63.5%Average ־־־־־ 38.3%Median 41.4%Low 17.9%Company XYZ 51.0%
Key Statistics
% of Service Requests Fulfilled in 24 Business Hours
Company XYZ Desktop Support BenchmarkSample report only. Data is not accurate.
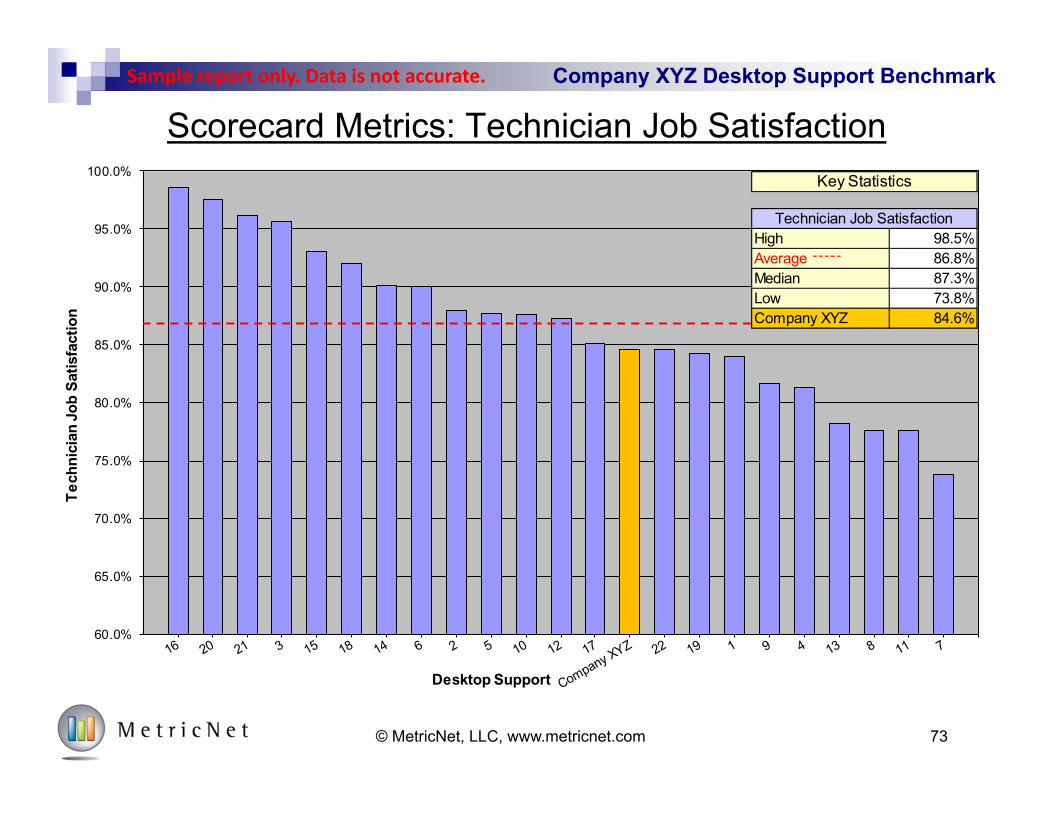
73© MetricNet, LLC, www.metricnet.com
Scorecard Metrics: Technician Job Satisfaction
60.0%
65.0%
70.0%
75.0%
80.0%
85.0%
90.0%
95.0%
100.0%
Tech
nici
an J
ob S
atis
fact
ion
Desktop Support
High 98.5%Average ־־־־־ 86.8%Median 87.3%Low 73.8%Company XYZ 84.6%
Key Statistics
Technician Job Satisfaction

Company XYZ Desktop Support BenchmarkSample report only. Data is not accurate.
74
Cost vs. Quality for Company XYZ Desktop Support
© MetricNet, LLC, www.metricnet.com
Company XYZDesktop Support
Global Database
Lower CostCost (Efficiency)
Qua
lity
(Effe
ctiv
enes
s)
Higher Cost
Lower Quality
Higher Quality
Top QuartileEfficient and Effective
Lower Quartile
Middle QuartilesEffective but not Efficient
Middle QuartilesEfficient but not Effective

75
Best Practices Process Assessment

Company XYZ Desktop Support BenchmarkSample report only. Data is not accurate.
Six-Part Model for Desktop Support Best Practices
76© MetricNet, LLC, www.metricnet.com
Proactively Managing Stakeholder Expectations
Stakeholder Communication
A Holistic Approach to Performance Measurement
Performance Measurement
Leveraging People and ProcessesTechnology
Expeditious Delivery of Customer ServiceProcess
Proactive, Life-cycle Management of
Personnel
HumanResources
Defining Your Charter and MissionStrategy
DefinitionModel
Component
Customer Enthusiasm
Strategy
Human Resources
ProcessTechnology
PerformanceMeasurement
Stakeholder Communication

Company XYZ Desktop Support BenchmarkSample report only. Data is not accurate.
Ranking Explanation
1 No Knowledge of the Best Practice.
2 Aware of the Best Practice, but not applying it.
3 Aware of the Best Practice, and applying at a rudimentary level.
4 Best Practice is being effectively applied.
5 Best Practice is being applied in a world-class fashion.
Best Practices Evaluation Criteria
77© MetricNet, LLC, www.metricnet.com

Company XYZ Desktop Support BenchmarkSample report only. Data is not accurate.
78
MetricNet Has Defined 72 Desktop Support Best Practices
7 Best Practices
Strategy Process
Performance Measurement
Human Resources
CommunicationTechnology
14 Best Practices
16 Best Practices 13 Best Practices
10 Best Practices 12 Best Practices
Total Score from 72 to 360 (converted to scale of 0% to 100%) The lowest score possible on the Best Practices Process Assessment is 72:
Maturity Level 1 X 72 Best Practices = 72 (0%) The highest score possible on the Best Practices Process Assessment is 360:
Maturity Level 5 X 72 Best Practices = 360 (100%)
© MetricNet, LLC, www.metricnet.com

Company XYZ Desktop Support BenchmarkSample report only. Data is not accurate.
Strategy: 7 Best Practices
79© MetricNet, LLC, www.metricnet.com
Best Practice
Company XYZ's Score
Peer Group Average
1 4.0 3.10
2 3.5 2.87
3 4.00 3.01
4 3.50 3.05
5 4.0 3.34
6 3.0 2.79
7 3.5 2.92
Total Score 25.50 21.08Average Score 3.64 3.01
Summary Statistics
Desktop Support has an action plan for continuous improvement. The plan is documented and distributed to key stakeholders in the organization, and specific individuals are held accountable for implementing the action plan.
Desktop Support is well integrated into the information technology function. Desktop Support acts as the "voice of the user" in IT, and is involved in major IT decisions and deliberations that affect end users. Desktop Support is alerted ahead of time so that they can prepare for major rollouts, or other changes in the IT environment.
Desktop Support has SLA's that define the level of service to be delivered to users. The SLA's are documented, published, and communicated to key stakeholders in the organization.
Desktop Support has OLA's (Operating Level Agreements) with other support groups in the organization (level 1 support, field support, etc.). The OLA's clearly define the roles and responsibilities of each support group, and the different support groups abide by the terms of the OLA's.
Desktop Support actively seeks to improve Level 1 Resolution Rates, Incident First Contact Resolution Rate, and key service levels by implementing processes, technologies, and training that facilitate these objectives.
Strategy Best Practices Defined
Desktop Support has a well-defined mission, vision, and strategy. The vision and strategy are well documented, and communicated to key stakeholders in the organization.
Desktop Support has a published Service Catalog, including a Supported Products List, that is distributed and communicated to key stakeholders including end users. The Service Catalog is available online.

Company XYZ Desktop Support BenchmarkSample report only. Data is not accurate.
Human Resources: 13 Best Practices
80© MetricNet, LLC, www.metricnet.com
Best Practice
Company XYZ's Score
Peer Group Average
1 4.50 3.05
2 4.0 3.26
3 3.5 2.78
4 3.5 2.67
5 3.0 1.79
6 3.0 2.27
7 3.0 2.18
8 5.0 2.11
9 4.0 3.12
10 3.0 2.44
11 4.0 3.15
12 4.5 2.77
13 5.0 4.72
Total Score 50.00 36.31Average Score 3.85 2.79
Summary Statistics
Technicians have quantifiable performance goals (for First Visit Resolution, customer satisfaction, number of tickets handled per month, etc.), and are held accountable for achieving their goals on a monthly basis.
Technicians are eligible for incentives and rewards based upon performance. These could include monetary incentives such as annual bonuses, or other incentives such as time off work, gift certificates, etc.
Technician performance goals are linked to and aligned with overall Desktop Support goals and performance targets.
Technician job-satisfaction surveys are conducted at least once per year, and the results of the surveys are used to manage and improve technician morale.
Formal performance reviews are scheduled and completed for all personnel at least once annually.
Technician training classes and curricula are specifically designed to maximize customer satisfaction and the number of user incidents resolved on first contact, and to minimize the Mean Time to Resolve.
Individual technician training plans are clearly defined, documented, and regularly updated.
Desktop Support has a formalized, documented technician career path. Technicians are made aware of their career-advancement opportunities, and are encouraged to proactively manage their careers. Technicians are coached at least once yearly on their career path and career-advancement options.
Technicians have the opportunity to advance their careers in at least two ways: by improving their technical and customer service skills, and by improving their management and supervisory skills.
Technicians are coached by their supervisors in one-on-one sessions on a monthly basis. Logged tickets are reviewed, and the supervisors provide specific suggestions to each technician on how to improve performance.
Human Resources Best Practices Defined
Desktop Support has a formalized and documented recruiting process for filling vacancies. Job requirements are well defined, and candidates are tested for both technical skills and customer-service soft skills.
New hires go through a formal training curriculum, including technical and customer-service skills, and are required to pass a proficiency exam before independently handling customer incidents and service requests.
Veteran technicians (more than 6 months of experience) have access to training opportunities to improve their skill set, job performance, and the overall performance of the Desktop Support team. Veteran technicians are required to complete a minimum number of refresher training hours each year.

Company XYZ Desktop Support BenchmarkSample report only. Data is not accurate.
Process: 16 Best Practices
81© MetricNet, LLC, www.metricnet.com
Best Practice
Company XYZ's Score
Peer Group Average
1 4.0 3.88
2 3.5 4.02
3 4.0 2.90
4 3.5 3.16
5 4.0 2.74
6 4.0 2.88
7 4.5 3.41
8 2.0 2.07
9 2.0 2.04
10 3.5 2.55
11 3.0 2.99
12 3.0 2.95
13 4.5 2.47
14 4.0 2.25
15 3.0 2.00
16 2.0 2.69Total Score 54.50 45.00
Average Score 3.41 2.81
Desktop Support has a mature workforce scheduling process that achieves high technician utilization, while maintaining reasonable service levels.
Desktop Support has an effective, ongoing process for projecting future workload and staffing requirements.
Desktop Support conducts periodic root-cause analysis (RCA) on the user contact profile to eliminate problems at their source.
Summary Statistics
Desktop Support has a formal, rapid notification and correction process that is activated when a service level has been breached, whether at Desktop Support, or at some other support level.Desktop Support has contingency plans to handle sudden, unexpected spikes in contact volume. These could include having supervisors and other indirect personnel handle incoming calls during a call spike.
Desktop Support has contingency plans to handle both short- and long-term interruptions in service delivery.Desktop Support has a well defined service planning and readiness process that works closely with both internal engineering groups and vendors, and continues through product field testing and pre-release. This process enables Desktop Support to train for and prepare for supporting new products and services in the IT environment.Desktop Support has a formal knowledge-management process that facilitates the acquisition, qualification, review, approval, and distribution of knowledge into a knowledgebase.
Escalation points are well defined and documented. These include other support groups (Level 3 support, Field Support, etc.), and individuals to whom tickets may be escalated.Rules for ticket escalation and transfer are well defined and documented. Technicians know when and where to transfer or route a ticket if they are unable to assist the user.Indirect contact channels, including email, voicemail, and fax are treated with the same priority as live phone calls and chat sessions. The work queues from these channels are integrated, or worked in parallel.
Incoming contacts are assigned a severity code based upon the number of users impacted, and the urgency of the incident.System alarms notify the Desktop Support team when a service level has been breached, whether at Desktop Support, or at another support level within the organization.
Process Best Practices Defined
Desktop Support is part of an end-to-end support process, where Level 1 Support acts as the Single Point of Contact (SPOC) for user support.Customers are offered a range of access options to Desktop Support, including live voice, voicemail, email, web chat, self service, fax, and walk-in.Ticket handling processes are standardized, documented, and available online. With few exceptions, the standards are followed by Desktop Support technicians.

Company XYZ Desktop Support BenchmarkSample report only. Data is not accurate.
Technology: 10 Best Practices
82© MetricNet, LLC, www.metricnet.com
Best Practice
Company XYZ's Score
Peer Group Average
1 4.0 4.49
2 4.0 3.21
3 4.5 2.77
4 5.0 4.05
5 3.0 3.76
6 3.5 3.02
7 3.0 1.44
8 1.0 1.29
9 2.0 1.59
10 1.0 2.80
Total Score 31.00 28.42Average Score 3.10 2.84
Desktop Support has a multi-year plan for an integrated technology strategy.
Desktop Support utilizes a capital investment justification process based on ROI, and reports on post-installation ROI as part of this process.
Summary Statistics
Desktop Support has an effective tool that allows technicians to proxy into a user's computer, take control of the computer, and remotely perform diagnostics and problem solving (such as Tivoli, Bomgar, GoTo Assist). The tool increases remote resolution rates, and reduces resolution times.
Desktop Support has an automated password reset (APR) capability that dramatically reduces the number of password resets that must be performed manually by Desktop Support technicians.
Desktop Support has an effective, integrated self-service portal that is available to all users. The self-service portal provides information, FAQ's, and solutions to problems that are more complex than simple password resets. The tool includes a direct link to Desktop Support technicians. Users are aware of the self-service portal, and usage rates are continuously increasing.
The ticket management system can track and monitor the skill levels of Desktop Support team technicians based on closed tickets by product and/or service code.
Desktop Support uses technology alerts/alarms to notify the Desktop Support team or perform self-healing scripts when a customer or system issue is proactively identified.
Technology Best Practices Defined
Desktop Support has a full-featured ticket management system that facilitates effective incident tracking, service-level compliance, reporting, and root-cause analysis.
Desktop Support has a comprehensive knowledge-management tool that facilitates effective knowledge capture and reuse. Technicians are able to quickly find solutions to user problems by searching the knowledgebase. Solutions for the vast majority of user problems and questions can be found in the knowledgebase.
The Desktop Support knowledgebase is used continuously by all Desktop Support technicians, and results in higher First Contact Resolution rates and lower resolution times (MTTR).

Company XYZ Desktop Support BenchmarkSample report only. Data is not accurate.
Performance Measurement: 14 Best Practices
83© MetricNet, LLC, www.metricnet.com
Best Practice
Company XYZ's Score
Peer Group Average
1 2.0 2.54
2 4.5 4.12
3 3.0 2.91
4 3.0 2.19
5 2.0 1.60
6 4.0 2.81
7 2.0 3.17
8 3.5 2.28
9 4.0 3.36
10 3.5 2.96
11 4.0 2.73
12 3.5 3.10
13 3.5 2.79
14 3.5 2.95
Total Score 46.00 39.51Average Score 3.29 2.82
Desktop Support tracks the Mean Time to Resolve (MTTR), and the percentage of tickets resolved within 24, 48, and 72 hours.
Summary Statistics
Desktop Support conducts event-driven customer surveys, whereby the results of customer-satisfaction surveys can be linked back to a specific ticket and to a specific technician handling the ticket.
Desktop Support measures are used holistically and diagnostically to identify performance gaps in Desktop Support performance, and to prescribe actions that will improve performance.
Desktop Support conducts benchmarking at least once per year.
Desktop Support team KPI's are used to establish "stretch" goals.
Desktop Support understands key correlations and cause/effect relationships between the various KPI's. This enables the Desktop Support team to achieve desired performance goals by leveraging and driving the underlying "causal" metrics.
First Level Resolution is measured, recorded, and tracked on an ongoing basis.
Technician Utilization is measured, recorded, and tracked on an ongoing basis.
Technician Job Satisfaction is measured, recorded, and tracked.
Desktop Support maintains a balanced scorecard that provides a single, all-inclusive measure of Desktop Support performance.
Desktop Support tracks the number of tickets that are resolved by Desktop Support, but that could have been resolved by Level 1 Support.
Performance Measurement Best Practices Defined
Cost per Ticket is measured, recorded, and tracked on an ongoing basis.
Customer Satisfaction is measured, recorded, and tracked on an ongoing basis.
The First Visit Resolution rate for incidents is measured, recorded, and tracked on an ongoing basis.

Company XYZ Desktop Support BenchmarkSample report only. Data is not accurate.
Communication: 12 Best Practices
84© MetricNet, LLC, www.metricnet.com
Best Practice
Company XYZ's Score
Peer Group Average
1 3.5 3.42
2 2.5 2.82
3 3.0 2.13
4 2.0 2.05
5 3.0 2.60
6 3.0 2.94
7 3.5 3.17
8 3.0 2.99
9 4.0 2.19
10 3.0 1.85
11 4.0 2.33
12 4.5 2.99
Total Score 39.00 31.48Average Score 3.25 2.62
Summary Statistics
The value added by the Desktop Support team is communicated to key managers in IT, and expectations are formally established regarding Desktop Support team roles and responsibilities.
Desktop Support tracks the number of training-related contacts it receives, and provides feedback to user groups within the organization on training areas that could help to reduce Desktop Support contact volumes.
Desktop Support provides training aids to users that enable them use Desktop Support more effectively. These could include log-in screens with the Desktop Support phone number, chat windows that can be clicked to initiate a real-time chat session, mouse pads imprinted with the Desktop Support IVR menu, etc.
Desktop Support transmits outbound messages to users announcing major system and network outages, thereby alerting users about potential problems in the IT environment. These proactive messages help to reduce contact volumes during incidents that impact a large number of users.
Desktop Support meets frequently with user groups, and holds "informational briefings" to educate users on supported products and services, hours of operation, training opportunities, tips for getting the most benefit from Desktop Support, etc.
Desktop Support meets frequently with other IT managers, and is an integral part of key decisions made within IT. Desktop Support plays the role of "voice of the user" within IT.
IT is required to deliver a "turnover package" to the Desktop Support team for all changes that will impact the user environment. This could include application updates, new desktop software, etc. The turnover package is designed to prepare the Desktop Support team to provide support to users in the affected areas.
Customers are told what to expect on resolution time when their ticket is escalated or if a call-back is required.
Desktop Support monitors all tickets, including those that are escalated, until ticket closure.
Communication Best Practices Defined
Desktop Support maintains active communication with all stakeholder groups, including Desktop Support employees, IT managers, company managers outside of IT, and customers.
Desktop Support has a formal communications schedule, and provides customized content for each stakeholder group.
Desktop Support has established User Group Liaisons who represent different groups within the user community. Desktop Support meets periodically with the liaisons to learn about user concerns and questions, and to communicate Desktop Support services, plans, and initiatives.

Company XYZ Desktop Support BenchmarkSample report only. Data is not accurate.
85© MetricNet, LLC, www.metricnet.com
*An average score of 4.0 or above is required in each component of the Best Practices Model to achieve Best Practices Certification.
Best Practices Process Assessment Summary
Best Practices Component
Number of Success Factors
Company XYZ's Average Score
Average Peer Group Score
Strategy 7 3.64 3.01
Human Resources 13 3.85 2.79
Process 16 3.41 2.81
Technology 10 3.10 2.84
Performance Measurement 14 3.29 2.82
Communication 12 3.25 2.62
Total Score 246.0 201.8Percentage Score 60.4% 45.1%

Company XYZ Desktop Support BenchmarkSample report only. Data is not accurate.
86© MetricNet, LLC, www.metricnet.com
Best Practices Process Assessment Summary
3.643.85
3.413.10
3.29 3.253.01
2.79 2.81 2.84 2.822.62
0.0
0.5
1.0
1.5
2.0
2.5
3.0
3.5
4.0
4.5
Aver
age
Scor
e
Company XYZ Peer Group

Company XYZ Desktop Support BenchmarkSample report only. Data is not accurate.
Overall Process Assessment Scores
87© MetricNet, LLC, www.metricnet.com
60.4%
0%
10%
20%
30%
40%
50%
60%
70%
80%
90%
100%
Tota
l Pro
cess
Ass
essm
ent
Scor
es
High 91.9%Average ־־־־־ 45.1%Median 41.9%Low 7.4%Company XYZ 60.4%World-Class ־־־־־ 75.0%
Key Statistics
Total Process Assessment Score

Company XYZ Desktop Support BenchmarkSample report only. Data is not accurate.
88© MetricNet, LLC, www.metricnet.com
Process Maturity vs. Scorecard Performance
0%
10%
20%
30%
40%
50%
60%
70%
80%
90%
100%
0% 10% 20% 30% 40% 50% 60% 70% 80% 90% 100%
Bal
ance
d Sc
ore
Process Assessment Score
Company XYZGlobal Database
Average = 56.7% Aver
age
= 45
.1%
Wor
ld-C
lass
= 7
5%
Process Assessment Score 60.4%
Balanced Score 64.5%
Company XYZ Performance

Interview Themes and Quotes
89

Company XYZ Desktop Support BenchmarkSample report only. Data is not accurate.
90© MetricNet, LLC, www.metricnet.com
MetricNet Conducted 7 Desktop Support Interviews
Company XYZ Interviewees Roles
Aaron Bender Desktop Support Manager
Christopher Drummond Level 3 Technician
Eric Fletcher Level 2 Technician
Georgia Hansen Level 2 Technician
Irma Jasper Level 1 Technician
Kermit Lefkin Level 1 Technician
Marvin Noonan Level 1 Technician

Company XYZ Desktop Support BenchmarkSample report only. Data is not accurate.
91© MetricNet, LLC, www.metricnet.com
Key Themes from Desktop Support Interviews The interviewees agreed that desktop support staffing is adequate to handle the
workload most of the time.
Most interviewees said that team morale is fairly good.
Most interviewees agreed that the new-hire training process is excellent.
The interviewees said they would like to see Company XYZ provide additional opportunities for ongoing training.
Most interviewees agreed that communication is strong within the desktop support team, but that communication from other IT groups needs improvement.
The interviewees agreed that the team’s process maturity and documentation have been rapidly improving.
Most interviewees considered the technology they use as adequate, though several would like more customization of the ticketing system.

Company XYZ Desktop Support BenchmarkSample report only. Data is not accurate.
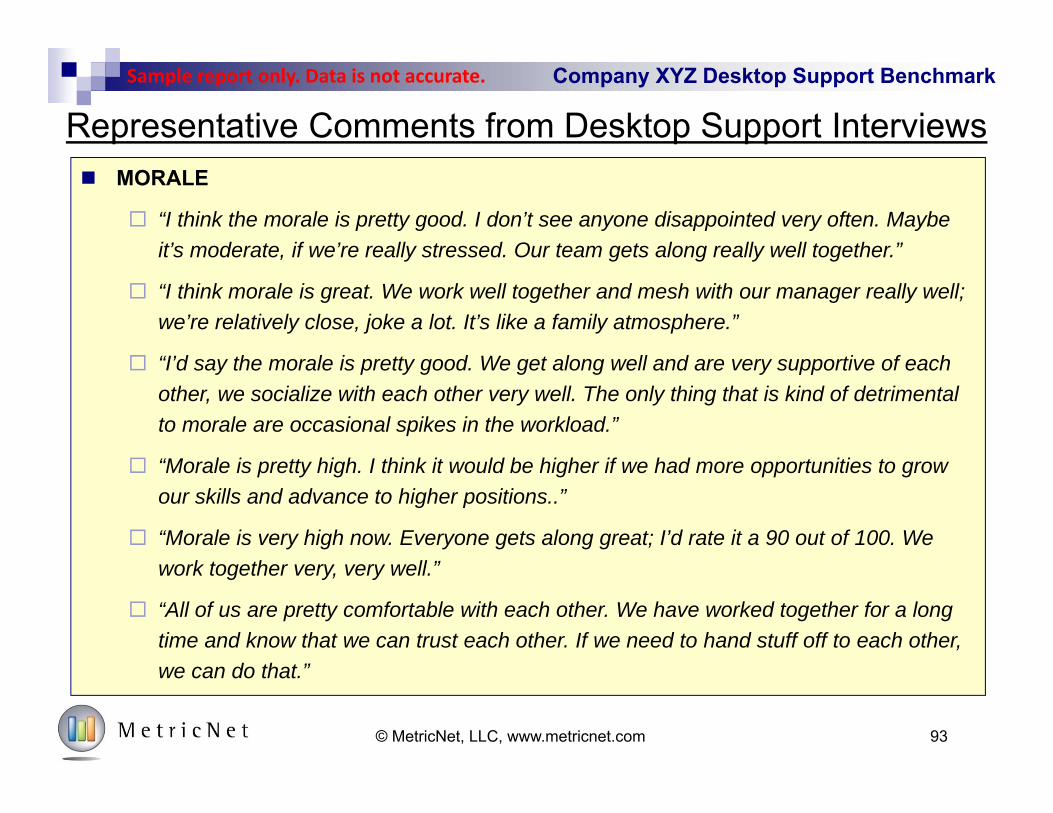
92© MetricNet, LLC, www.metricnet.com
Representative Comments from Desktop Support Interviews STAFFING
“The staffing is adequate. Sometimes when a technician is in a meeting the tickets get backed up a bit, but that’s definitely not the norm.”
“Our technicians work very hard and are usually able to keep up with the workload quite well. The scheduling changes we implemented recently have helped a lot.
“The number of technicians is definitely sufficient. Some weeks can be bad if multiple technicians are out for training, but normally we don’t feel that we’re struggling to get things done.”
“The number of technicians is enough to manage the everyday workload. One more technician would be helpful during spikes.”
“Right now, when we’re trying to do things like training, things get a little tight. I think we’ve generally got enough technicians to cover the tickets, but sometimes it’s hard to cover all the bases, especially when someone is sick or is working on special projects. If something special comes out, there is not a lot of margin.”
Company XYZ Desktop Support BenchmarkSample report only. Data is not accurate.
93© MetricNet, LLC, www.metricnet.com
Representative Comments from Desktop Support Interviews MORALE
“I think the morale is pretty good. I don’t see anyone disappointed very often. Maybe it’s moderate, if we’re really stressed. Our team gets along really well together.”
“I think morale is great. We work well together and mesh with our manager really well; we’re relatively close, joke a lot. It’s like a family atmosphere.”
“I’d say the morale is pretty good. We get along well and are very supportive of each other, we socialize with each other very well. The only thing that is kind of detrimental to morale are occasional spikes in the workload.”
“Morale is pretty high. I think it would be higher if we had more opportunities to grow our skills and advance to higher positions..”
“Morale is very high now. Everyone gets along great; I’d rate it a 90 out of 100. We work together very, very well.”
“All of us are pretty comfortable with each other. We have worked together for a long time and know that we can trust each other. If we need to hand stuff off to each other, we can do that.”

Company XYZ Desktop Support BenchmarkSample report only. Data is not accurate.
94© MetricNet, LLC, www.metricnet.com
Representative Comments from Desktop Support Interviews TRAINING
“I think the new-hire training process works well. We have a checklist of what the new technicians need to know, and a test at the end of training to make sure they know it. We’ve added some new technicians recently, and they were up to speed in two to four weeks.”
“The initial training was very thorough for me.”
“I think the initial training works very well; we have it pretty well spelled out in our training guide, even by timeline, what topics to cover when. Everyone who has gone through training seems very satisfied with it.”
“I think the training is pretty good, though there is room for improvement. Easily 90% of the work we do is really well documented now, which has been super helpful for new technicians.”
“Our new-hire training program is a work in progress, but the most recent hire we had was ready in two weeks with very few questions.”
“Ongoing training is provided sometimes. And personal skill development is usually encouraged, even if it means time away from regular job duties.”

Company XYZ Desktop Support BenchmarkSample report only. Data is not accurate.
95© MetricNet, LLC, www.metricnet.com
Representative Comments from Desktop Support Interviews TRAINING (continued)
“There are opportunities for ongoing training. But I don’t know that we get that as often as we like because of how busy we are. Training is provided when it’s needed, but there’s not time for training throughout the year.”
“I would like to see Company XYZ provide us with more training courses that would help us to keep up better with new technologies.”
“They offer the ability to take certification training and such, but the path to it is very unclear. Most of us want training to move on to the next thing, and they offer that, but no one really knows how.”
“There is a decent amount of training that the company offers. We can sign up for some training on the company website. We get that about twice a year—more would be helpful. I would like to see more, maybe PowerShell training.”
“Some training on Apple devices would be very useful.”

Company XYZ Desktop Support BenchmarkSample report only. Data is not accurate.
96© MetricNet, LLC, www.metricnet.com
Representative Comments from Desktop Support Interviews PERFORMANCE METRICS & GOALS
“We have some team performance goals. We also have some individual goals, but those are more broad career development goals.”
“With the way we’ve been using our ticketing system, it’s really hard to get good metrics off of it. There is a general expectation for first contact, stale tickets, etc., but it’s really hard to define with our current setup.”
“We have helpful feedback from our manager in the one-on-one reviews with him. Those happen every quarter.”
CAREER ADVANCEMENT
“There is some opportunity. It seems as if the people who do the hiring like to hire from within.”
“There are a number of opportunities for career advancement. Sometimes they may need someone with specific experience that we can’t get in this role, but with probably 30-40% of the jobs that get posted, they are willing to train for the role. They give us the opportunity to move upward if we so desire.”

Company XYZ Desktop Support BenchmarkSample report only. Data is not accurate.
97© MetricNet, LLC, www.metricnet.com
Representative Comments from Desktop Support Interviews MANAGEMENT
“Our management is great. All the processes are important to our manager, and I think that makes things run very smoothly, low stress. Everyone is involved in decisions, and we get to take on a lot of projects.”
“Our manager is willing to always take feedback, and really takes it and does something with it.”
COMMUNICATION
“Our best strength in general is our teamwork; in handing things off and communicating we do really well.”
“Internal communication is a big strength. The technicians transfer knowledge within the team. If a technician has a question, whoever knows the answer will assist.”
“Internal communication is good, but with communication from other teams within IT is not so good.”

Company XYZ Desktop Support BenchmarkSample report only. Data is not accurate.
98© MetricNet, LLC, www.metricnet.com
Representative Comments from Desktop Support Interviews COMMUNICATION (continued)
“There is some organizational improvement that we could make—when working with other teams, sometimes things aren’t communicated like they should be.”
“Within the team, communication is a strength; within the company as a whole, not so much. The team is very focused on sharing knowledge. Our manager makes sure that new policies are sent out by email.”
“It would help a lot to be included more in discussions with other groups. It seems like a lot of our complaints to other departments about accommodating us seem to fall on deaf ears.”
“Sometimes things that get escalated to us don’t have all the information there when we get it. Maybe a standardized way for the information to be presented to us would be helpful.”
“We are trying to create a better information flow of communication about what is happening on server or network or infrastructure teams, that kind of stuff; there is not really a lot of information right now.”

Company XYZ Desktop Support BenchmarkSample report only. Data is not accurate.
99© MetricNet, LLC, www.metricnet.com
Representative Comments from Desktop Support Interviews PROCESSES
“We do really well with continuous improvement. We are always encouraged to document things and improve things.”
“The knowledgebase is built up to where people can come in and pick up the work after less training than we used to need.”
“I’d say that our knowledgebase is not the best I’ve ever seen out there, but it gives the basics of what we need to do.”
“Desktop support is always looking at ways to make the experience better for the user. They are very proactive, always making processes better and more streamlined.”
“We’ve focused a lot of effort in the last year on improving processes and documenting them in the knowledgebase. We’ve assigned scheduled times each week for some of the technicians to focus on that. That’s been a big help to us.”
“Our processes run very well, and we have processes documented for almost everything.”

Company XYZ Desktop Support BenchmarkSample report only. Data is not accurate.
100© MetricNet, LLC, www.metricnet.com
Representative Comments from Desktop Support Interviews PROCESSES (continued)
“One of the challenges we are running into with the continuous improvement process we’ve been doing, is getting other teams on board to work with us to improve the way they do things.”
“There is still some improvement we can do in documentation. But we have most of our processes documented, and if we find something that is not we document it as soon as possible. That is one of the priorities of our team.”
“I’d rate us maybe an eight on our process maturity, and a nine on the documentation of our processes. Nearly everything we do is on the knowledgebase.”
WORK ENVIRONMENT
“Our work space should ideally be larger, but that is a limitation of the building we’re in right now.”
“It would be nice to have a bigger and more ventilated workspace.”

Company XYZ Desktop Support BenchmarkSample report only. Data is not accurate.
101© MetricNet, LLC, www.metricnet.com
Representative Comments from Desktop Support Interviews TECHNOLOGY
“The technology is absolutely adequate. Plenty of tools to do all aspects of our job.”
“The tools we have are definitely adequate. I think there is still some room for improvement with the ticketing system. It’s not as customized for our processes as it could be.”
“I like our tools, for the most part. Some aspects of the ticketing system could be improved to make our work more efficient.
“We’d like to be more focused on SLAs, but with our software it’s hard to tell how long we’ve had a ticket. We’re improving our metrics and how we track them, so soon that will hopefully be much better.”
“The remote-access tool is a little clunky and slow. Otherwise, most of our tools work well.”

102
Conclusions and Recommendations

Company XYZ Desktop Support BenchmarkSample report only. Data is not accurate.
103© MetricNet, LLC, www.metricnet.com
Notable Strengths
Cost per Ticket is lower than average compared to the benchmarking peer group
Customer Satisfaction is in the top quartile
Technician Utilization is better than average compared to the benchmarking peer group This is a key driver behind Company XYZ’s low Cost per Ticket
Incident First Visit Resolution Rate is in the top quartile This is a key driver behind Company XYZ’s high Customer Satisfaction
% of Service Requests Fulfilled in 24 Business Hours is above average
Some technician metrics are better than average Annual Turnover and Daily Absenteeism are low
New-hire training hours are above average
The end-user environment at Company XYZ generates fewer desktop support tickets per user than the benchmarking peer group
Company XYZ scored well above average on the best practices process assessment
Company XYZ scored 6th out of 23 desktop support groups on the Balanced Scorecard Top quartile performance overall!
Company XYZ Desktop Support has some notable strengths
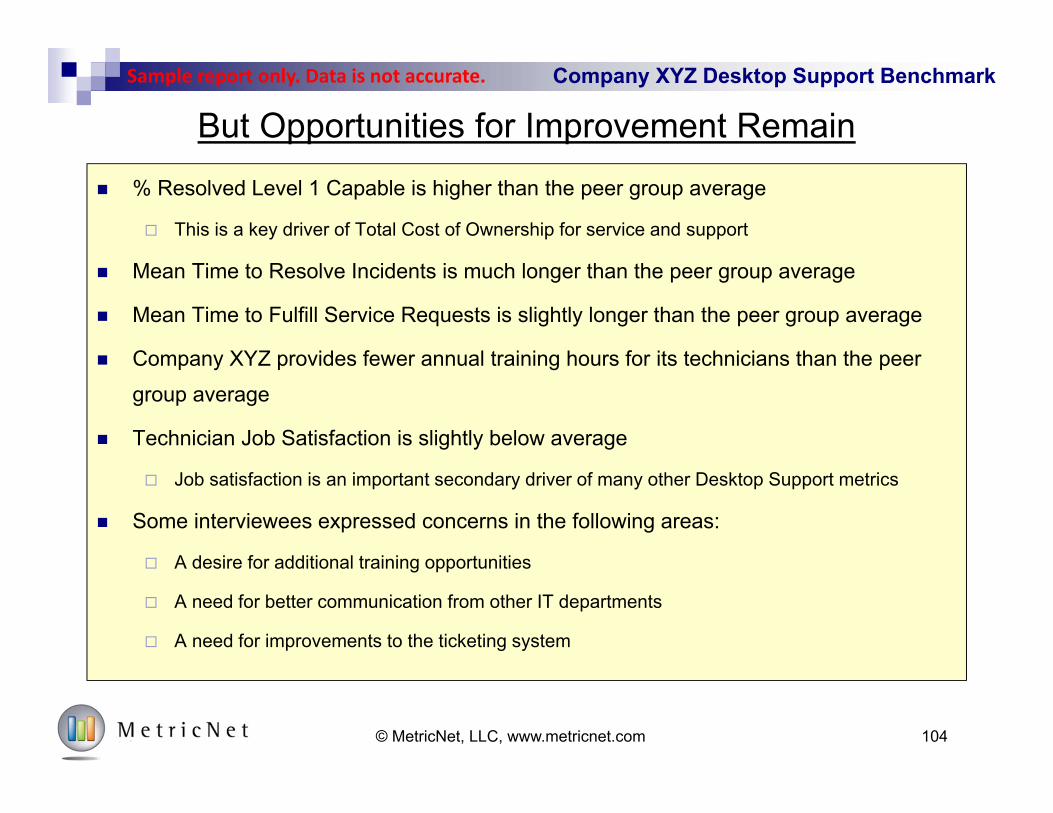
Company XYZ Desktop Support BenchmarkSample report only. Data is not accurate.
104© MetricNet, LLC, www.metricnet.com
But Opportunities for Improvement Remain % Resolved Level 1 Capable is higher than the peer group average
This is a key driver of Total Cost of Ownership for service and support
Mean Time to Resolve Incidents is much longer than the peer group average
Mean Time to Fulfill Service Requests is slightly longer than the peer group average
Company XYZ provides fewer annual training hours for its technicians than the peer group average
Technician Job Satisfaction is slightly below average
Job satisfaction is an important secondary driver of many other Desktop Support metrics
Some interviewees expressed concerns in the following areas:
A desire for additional training opportunities
A need for better communication from other IT departments
A need for improvements to the ticketing system
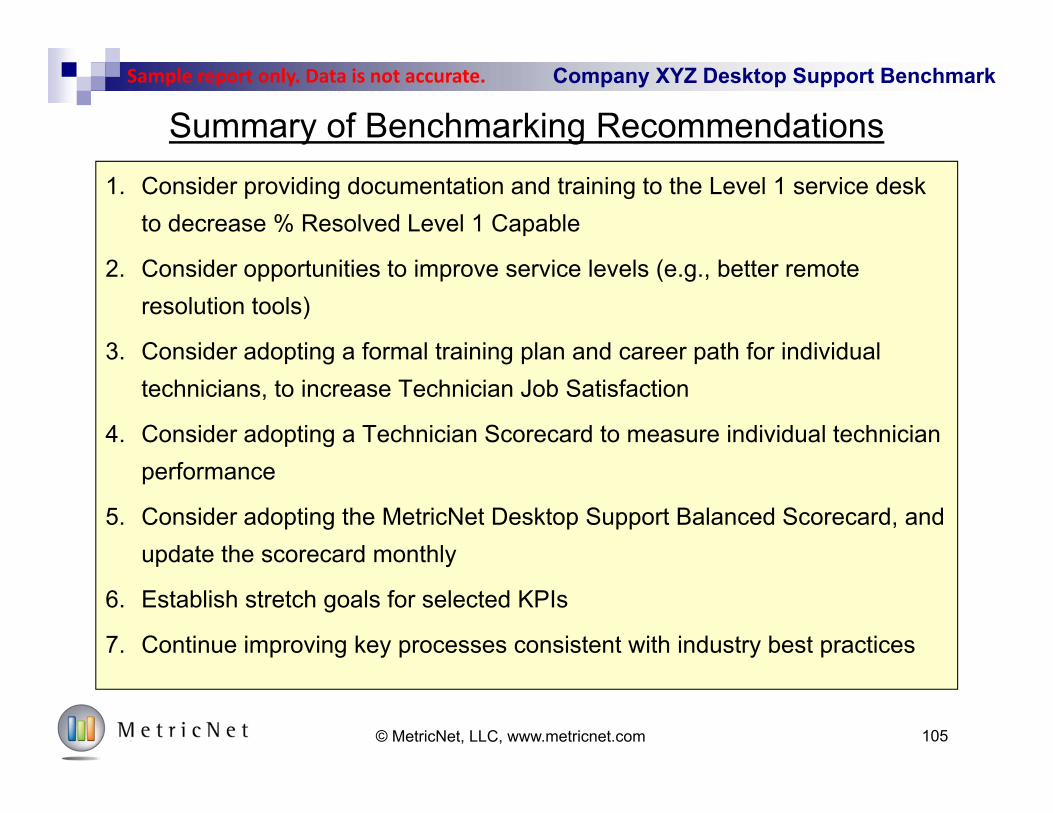
Company XYZ Desktop Support BenchmarkSample report only. Data is not accurate.
105
Summary of Benchmarking Recommendations1. Consider providing documentation and training to the Level 1 service desk
to decrease % Resolved Level 1 Capable
2. Consider opportunities to improve service levels (e.g., better remote resolution tools)
3. Consider adopting a formal training plan and career path for individual technicians, to increase Technician Job Satisfaction
4. Consider adopting a Technician Scorecard to measure individual technician performance
5. Consider adopting the MetricNet Desktop Support Balanced Scorecard, and update the scorecard monthly
6. Establish stretch goals for selected KPIs
7. Continue improving key processes consistent with industry best practices
© MetricNet, LLC, www.metricnet.com

Company XYZ Desktop Support BenchmarkSample report only. Data is not accurate.
% Resolved Level 1 Capable Impacts TCO
106© MetricNet, LLC, www.metricnet.com
Support Level
VendorField3210-1
$599$221$104$69$22$2$0Vendor Support
Field SupportIT SupportDesktop
SupportService
DeskSelf HelpIncident Prevention

Company XYZ Desktop Support BenchmarkSample report only. Data is not accurate.
Incident MTTR vs. Customer Satisfaction
107© MetricNet, LLC, www.metricnet.com

Company XYZ Desktop Support BenchmarkSample report only. Data is not accurate.
0%
10%
20%
30%
40%
50%
60%
70%
80%
90%
100%
30% 40% 50% 60% 70% 80% 90% 100%
Technician Satisfaction
Cust
omer
Sat
isfa
ctio
nTechnician Job Satisfaction vs. Customer Satisfaction
108© MetricNet, LLC, www.metricnet.com

Company XYZ Desktop Support BenchmarkSample report only. Data is not accurate.
Managing Technician Morale and Job Satisfaction
109© MetricNet, LLC, www.metricnet.com
Cost per Ticket Customer Satisfaction
Technician Utilization
FVR (Incidents)
Technician Satisfaction
Coaching Career Path Training Hours
SLs: MTTR
Work/Travel Time
Techs/Total FTE’s
Absenteeism/Turnover
% Resolved Level 1 Capable
Scheduling Efficiency
Service Levels: MTTR

Company XYZ Desktop Support BenchmarkSample report only. Data is not accurate.
Training Hours Drive Technician Job Satisfaction
40%
50%
60%
70%
80%
90%
100%
0 20 40 60 80 100 120 140
Annual Technician Training Hours
Tech
nici
an S
atis
fact
ion
110© MetricNet, LLC, www.metricnet.com

Company XYZ Desktop Support BenchmarkSample report only. Data is not accurate.
40%
50%
60%
70%
80%
90%
100%
Average = 72.3%
Average = 80.7%
Career Path Also Drives Job Satisfaction
Job Satisfaction with career path Job Satisfaction without career path
Tech
nici
an J
ob S
atis
fact
ion
111© MetricNet, LLC, www.metricnet.com

Company XYZ Desktop Support BenchmarkSample report only. Data is not accurate.
Step 1Eight critical performance metrics have been selected for the scorecard.
Step 3For each performance metric, the highest and lowest performance levels in the organization are recorded.
Step 4The tech’s performance for each metric is recorded in this column.
Step 5The tech’s score for each metric is then calculated:
(worst case - actual performance) ÷ (worst case
– best case) × 100
Step 6The balanced score for each metric is calculated:
metric score × weighting
Step 2Each metric has been weighted according to its relative importance.
Individual Performance Accountability: Technician Scorecard
112© MetricNet, LLC, www.metricnet.com
Worst Case Best CaseCustomer Satisfaction 20.0% 67.0% 94.0% 83.0% 59.3% 11.9%Incident First Visit Resolution Rate 20.0% 38.0% 84.0% 61.0% 50.0% 10.0%Incidents Closed this Month 15.0% 19.9 76.9 59.8 70.0% 10.5%Service Requests Fulfilled this Month 15.0% 15.6 42.2 28.5 48.5% 7.3%Unplanned Absenteeism 7.5% 22.0% 0.0% 2.8% 87.3% 6.5%Teamwork 7.5% 1 5 3.5 62.5% 4.7%Initiative 7.5% 1 5 5.0 100.0% 7.5%Mentoring 7.5% 1 5 4.5 87.5% 6.6%
Total 100.0% N/A N/A N/A N/A 64.9%
Balanced ScoreTechnician Performance Metric Metric
WeightingPerformance Range Your Actual
PerformanceMetric Score

Company XYZ Desktop Support BenchmarkSample report only. Data is not accurate.
Monthly Technician Performance Postings
113© MetricNet, LLC, www.metricnet.com
Aug Jul Jun May Apr Mar18 1 92.8% 92.1% 90.3% 89.3% 84.6% 92.2% 90.2%23 2 91.5% 88.5% 83.2% 94.0% 93.7% 90.8% 90.3%21 3 91.0% 86.8% 85.2% 78.5% 80.5% 68.2% 81.7%17 5 83.8% 84.4% 90.2% 86.5% 77.8% 63.9% 81.1%12 6 82.0% 73.6% 81.9% 72.1% 84.8% 87.9% 80.4%19 7 77.4% 66.6% 53.3% 56.3% 56.6% 39.0% 58.2%16 8 65.8% 47.4% 22.7% 38.4% 26.0% 73.0% 45.6%22 9 64.9% 66.5% 70.1% 56.9% 40.9% 72.7% 62.0%20 10 63.1% 62.8% 54.5% 45.9% 41.7% 62.7% 55.1%28 11 57.4% 42.1% 32.3% 71.6% 60.3% 54.2% 53.0%31 13 48.3% 34.9% 61.0% 52.8% 48.7% 51.6% 49.6%32 14 46.1% 66.7% 82.9% 82.1% 74.5% 62.3% 69.1%25 15 41.7% 45.5% 19.3% 40.3% 32.4% 30.4% 34.9%30 17 37.4% 28.4% 50.1% 48.1% 68.0% 49.8% 47.0%26 18 36.0% 52.3% 57.1% 52.9% 66.4% 54.1% 53.1%24 19 34.2% 21.4% 19.3% 65.7% 48.9% 44.4% 39.0%29 20 31.9% 43.2% 33.1% 28.3% 29.7% 31.0% 32.9%
61.7% 59.0% 58.0% 62.3% 59.7% 60.5% 60.2%
Technician Number
Monthly Ranking
Monthly Scorecard Performance Six-Month Average
Monthly Average

Company XYZ Desktop Support BenchmarkSample report only. Data is not accurate.
Consider Adopting the MetricNet Balanced Scorecard
114© MetricNet, LLC, www.metricnet.com
Step 1Eight critical performance metrics have been selected for the scorecard.
Step 3For each performance metric, the highest and lowest performance levels in the benchmark are recorded.
Step 4Your actual performance for each metric is recorded in this column.
Step 5Your score for each metric is then calculated:
(worst case - actual performance) ÷ (worst case
– best case) × 100
Step 6Your balanced score for each metric is calculated:
metric score × weighting
Step 2Each metric has been weighted according to its relative importance.
Worst Case Best CaseCost per Incident 15.0% $92.33 $45.72 $63.61 61.6% 9.2%Cost per Service Request 15.0% $194.98 $97.16 $156.70 39.1% 5.9%Customer Satisfaction 20.0% 49.8% 92.1% 91.4% 98.3% 19.7%Incident First Visit Resolution Rate 10.0% 51.4% 89.0% 82.8% 83.5% 8.3%Technician Utilization 10.0% 48.2% 66.9% 58.5% 55.1% 5.5%% of Incidents Resolved in 8 Business Hours 10.0% 24.5% 65.7% 41.9% 42.3% 4.2%% of Service Requests Fulfilled in 24 Business Hours 10.0% 17.9% 63.5% 51.0% 72.6% 7.3%Technician Job Satisfaction 10.0% 73.8% 98.5% 84.6% 43.7% 4.4%
Balanced Score 100.0% N/A N/A N/A N/A 64.5%
Performance Metric Metric Weighting
Performance Range Your Actual Performance
Balanced ScoreMetric Score

Company XYZ Desktop Support BenchmarkSample report only. Data is not accurate.
*Sample Only
40%
45%
50%
55%
60%
65%
70%
75%
80%
85%
Jan Feb Mar Apr May Jun Jul Aug Sep Oct Nov Dec
Bala
nced
Sco
re
12 Month Average Monthly Score
115© MetricNet, LLC, www.metricnet.com
And Update the Scorecard Monthly
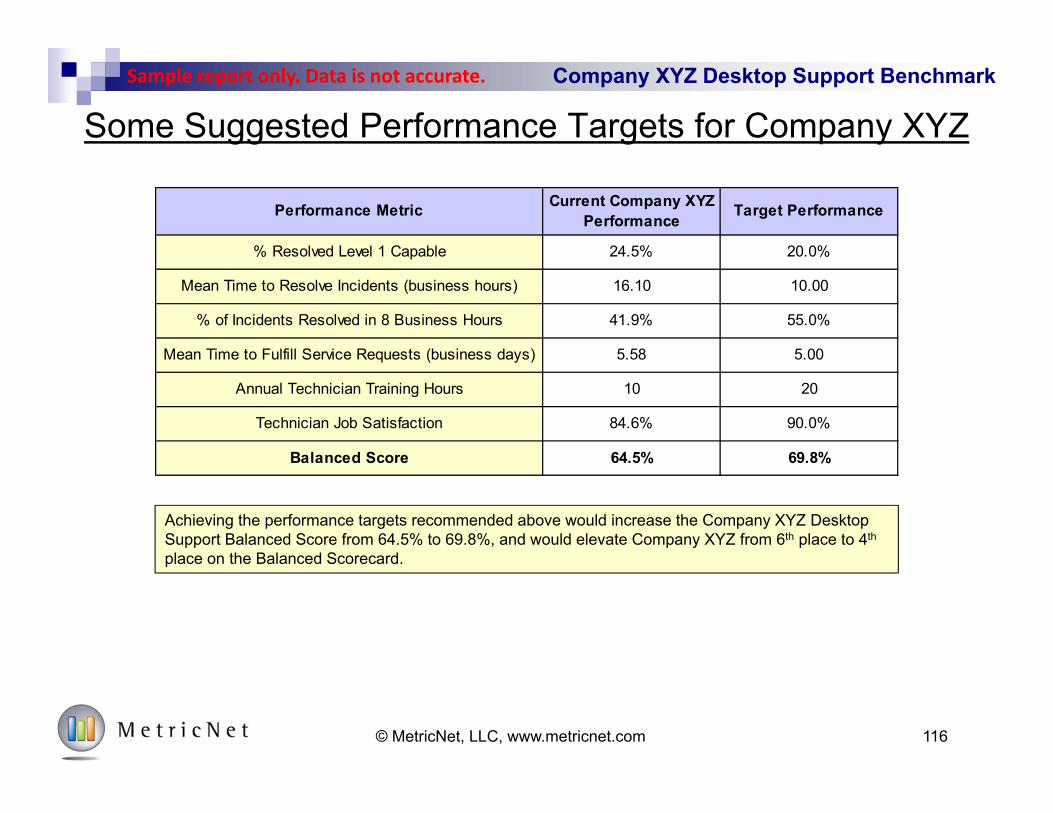
Company XYZ Desktop Support BenchmarkSample report only. Data is not accurate.
Some Suggested Performance Targets for Company XYZ
© MetricNet, LLC, www.metricnet.com 116
Performance Metric Current Company XYZ Performance Target Performance
% Resolved Level 1 Capable 24.5% 20.0%
Mean Time to Resolve Incidents (business hours) 16.10 10.00
% of Incidents Resolved in 8 Business Hours 41.9% 55.0%
Mean Time to Fulfill Service Requests (business days) 5.58 5.00
Annual Technician Training Hours 10 20
Technician Job Satisfaction 84.6% 90.0%
Balanced Score 64.5% 69.8%
Achieving the performance targets recommended above would increase the Company XYZ Desktop Support Balanced Score from 64.5% to 69.8%, and would elevate Company XYZ from 6th place to 4th
place on the Balanced Scorecard.

Company XYZ Desktop Support BenchmarkSample report only. Data is not accurate.
Cause and Effect for Desktop Support KPIs
© MetricNet, LLC, www.metricnet.com 117
Cost per Ticket Customer Satisfaction
Technician Utilization
FVR (Incidents)
Technician Satisfaction
Coaching Career Path Training Hours
SLs: MTTR
Work/Travel Time
Techs/Total FTE’s
Absenteeism/Turnover
% Resolved Level 1 Capable
Scheduling Efficiency
Service Levels: MTTR
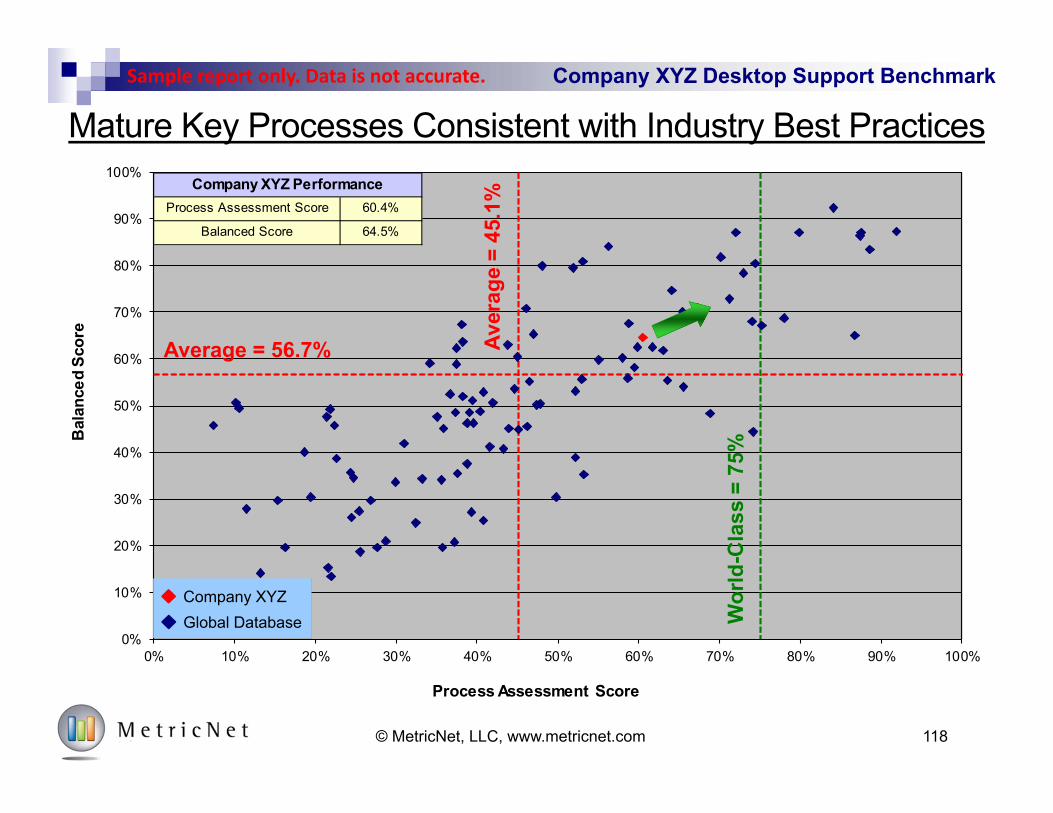
Company XYZ Desktop Support BenchmarkSample report only. Data is not accurate.
118© MetricNet, LLC, www.metricnet.com
Mature Key Processes Consistent with Industry Best Practices
0%
10%
20%
30%
40%
50%
60%
70%
80%
90%
100%
0% 10% 20% 30% 40% 50% 60% 70% 80% 90% 100%
Bal
ance
d Sc
ore
Process Assessment Score
Company XYZGlobal Database
Average = 56.7% Aver
age
= 45
.1%
Wor
ld-C
lass
= 7
5%
Process Assessment Score 60.4%
Balanced Score 64.5%
Company XYZ Performance

Company XYZ Desktop Support BenchmarkSample report only. Data is not accurate.
119© MetricNet, LLC, www.metricnet.com
Best Practice Focus Areas: Strategy
Company XYZ's Score
4.0
4.00
4.0
3.5
3.50
3.5
3.0
Strategy Best Practices Defined
Desktop Support has OLA's (Operating Level Agreements) with other support groups in the organization (level 1 support, field support, etc.). The OLA's clearly define the roles and responsibilities of each support group, and the different support groups abide by the terms of the OLA's.
Desktop Support has a well-defined mission, vision, and strategy. The vision and strategy are well documented, and communicated to key stakeholders in the organization.
Desktop Support has an action plan for continuous improvement. The plan is documented and distributed to key stakeholders in the organization, and specific individuals are held accountable for implementing the action plan.
Desktop Support has SLA's that define the level of service to be delivered to users. The SLA's are documented, published, and communicated to key stakeholders in the organization.
Desktop Support is well integrated into the information technology function. Desktop Support acts as the "voice of the user" in IT, and is involved in major IT decisions and deliberations that affect end users. Desktop Support is alerted ahead of time so that they can prepare for major rollouts, or other changes in the IT environment.
Desktop Support has a published Service Catalog, including a Supported Products List, that is distributed and communicated to key stakeholders including end users. The Service Catalog is available online.
Desktop Support actively seeks to improve Level 1 Resolution Rates, Incident First Contact Resolution Rate, and key service levels by implementing processes, technologies, and training that facilitate these objectives.

Company XYZ Desktop Support BenchmarkSample report only. Data is not accurate.
120© MetricNet, LLC, www.metricnet.com
Best Practice Focus Areas: Human ResourcesCompany XYZ's
Score
5.0
5.0
4.50
4.5
4.0
4.0
4.0
3.5
3.5
3.0
3.0
3.0
3.0Technicians are eligible for incentives and rewards based upon performance. These could include monetary incentives such as annual bonuses, or other incentives such as time off work, gift certificates, etc.
Technicians have quantifiable performance goals (for First Visit Resolution, customer satisfaction, number of tickets handled per month, etc.), and are held accountable for achieving their goals on a monthly basis.
Formal performance reviews are scheduled and completed for all personnel at least once annually.
Desktop Support has a formalized and documented recruiting process for filling vacancies. Job requirements are well defined, and candidates are tested for both technical skills and customer-service soft skills.
Technician job-satisfaction surveys are conducted at least once per year, and the results of the surveys are used to manage and improve technician morale.
Technicians have the opportunity to advance their careers in at least two ways: by improving their technical and customer service skills, and by improving their management and supervisory skills.
Technician performance goals are linked to and aligned with overall Desktop Support goals and performance targets.
Veteran technicians (more than 6 months of experience) have access to training opportunities to improve their skill set, job performance, and the overall performance of the Desktop Support team. Veteran technicians are required to complete a minimum number of refresher training hours each year.
Desktop Support has a formalized, documented technician career path. Technicians are made aware of their career-advancement opportunities, and are encouraged to proactively manage their careers. Technicians are coached at least once yearly on their career path and career-advancement options.
Technician training classes and curricula are specifically designed to maximize customer satisfaction and the number of user incidents resolved on first contact, and to minimize the Mean Time to Resolve.
Individual technician training plans are clearly defined, documented, and regularly updated.
Human Resources Best Practices Defined
Technicians are coached by their supervisors in one-on-one sessions on a monthly basis. Logged tickets are reviewed, and the supervisors provide specific suggestions to each technician on how to improve performance.
New hires go through a formal training curriculum, including technical and customer-service skills, and are required to pass a proficiency exam before independently handling customer incidents and service requests.
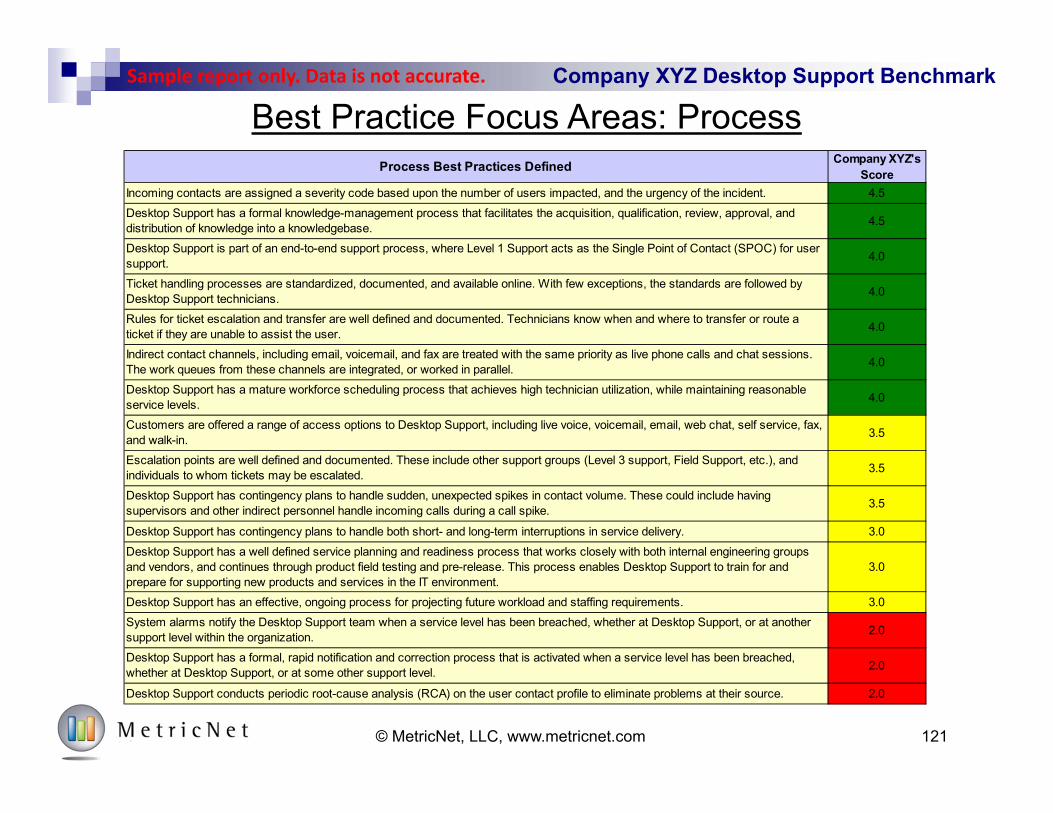
Company XYZ Desktop Support BenchmarkSample report only. Data is not accurate.
121© MetricNet, LLC, www.metricnet.com
Best Practice Focus Areas: ProcessCompany XYZ's
Score4.5
4.5
4.0
4.0
4.0
4.0
4.0
3.5
3.5
3.5
3.0
3.0
3.0
2.0
2.0
2.0
Escalation points are well defined and documented. These include other support groups (Level 3 support, Field Support, etc.), and individuals to whom tickets may be escalated.
Desktop Support has a mature workforce scheduling process that achieves high technician utilization, while maintaining reasonable service levels.Customers are offered a range of access options to Desktop Support, including live voice, voicemail, email, web chat, self service, fax, and walk-in.
Desktop Support has a formal knowledge-management process that facilitates the acquisition, qualification, review, approval, and distribution of knowledge into a knowledgebase.
Desktop Support conducts periodic root-cause analysis (RCA) on the user contact profile to eliminate problems at their source.
Desktop Support has contingency plans to handle both short- and long-term interruptions in service delivery.Desktop Support has a well defined service planning and readiness process that works closely with both internal engineering groups and vendors, and continues through product field testing and pre-release. This process enables Desktop Support to train for and prepare for supporting new products and services in the IT environment.Desktop Support has an effective, ongoing process for projecting future workload and staffing requirements.
Desktop Support has contingency plans to handle sudden, unexpected spikes in contact volume. These could include having supervisors and other indirect personnel handle incoming calls during a call spike.
System alarms notify the Desktop Support team when a service level has been breached, whether at Desktop Support, or at another support level within the organization.Desktop Support has a formal, rapid notification and correction process that is activated when a service level has been breached, whether at Desktop Support, or at some other support level.
Process Best Practices Defined
Incoming contacts are assigned a severity code based upon the number of users impacted, and the urgency of the incident.
Indirect contact channels, including email, voicemail, and fax are treated with the same priority as live phone calls and chat sessions. The work queues from these channels are integrated, or worked in parallel.
Rules for ticket escalation and transfer are well defined and documented. Technicians know when and where to transfer or route a ticket if they are unable to assist the user.
Ticket handling processes are standardized, documented, and available online. With few exceptions, the standards are followed by Desktop Support technicians.
Desktop Support is part of an end-to-end support process, where Level 1 Support acts as the Single Point of Contact (SPOC) for user support.

Company XYZ Desktop Support BenchmarkSample report only. Data is not accurate.
122© MetricNet, LLC, www.metricnet.com
Best Practice Focus Areas: TechnologyCompany XYZ's
Score
5.0
4.5
4.0
4.0
3.5
3.0
3.0
2.0
1.0
1.0Desktop Support utilizes a capital investment justification process based on ROI, and reports on post-installation ROI as part of this process.
Desktop Support has an effective, integrated self-service portal that is available to all users. The self-service portal provides information, FAQ's, and solutions to problems that are more complex than simple password resets. The tool includes a direct link to Desktop Support technicians. Users are aware of the self-service portal, and usage rates are continuously increasing.
The ticket management system can track and monitor the skill levels of Desktop Support team technicians based on closed tickets by product and/or service code.
Desktop Support has a multi-year plan for an integrated technology strategy.
Desktop Support has an effective tool that allows technicians to proxy into a user's computer, take control of the computer, and remotely perform diagnostics and problem solving (such as Tivoli, Bomgar, GoTo Assist). The tool increases remote resolution rates, and reduces resolution times.
The Desktop Support knowledgebase is used continuously by all Desktop Support technicians, and results in higher First Contact Resolution rates and lower resolution times (MTTR).
Desktop Support has a full-featured ticket management system that facilitates effective incident tracking, service-level compliance, reporting, and root-cause analysis.
Desktop Support uses technology alerts/alarms to notify the Desktop Support team or perform self-healing scripts when a customer or system issue is proactively identified.
Desktop Support has a comprehensive knowledge-management tool that facilitates effective knowledge capture and reuse. Technicians are able to quickly find solutions to user problems by searching the knowledgebase. Solutions for the vast majority of user problems and questions can be found in the knowledgebase.
Desktop Support has an automated password reset (APR) capability that dramatically reduces the number of password resets that must be performed manually by Desktop Support technicians.
Technology Best Practices Defined

Company XYZ Desktop Support BenchmarkSample report only. Data is not accurate.
123© MetricNet, LLC, www.metricnet.com
Best Practice Focus Areas: Performance MeasurementCompany XYZ's
Score4.5
4.0
4.0
4.0
3.5
3.5
3.5
3.5
3.5
3.0
3.0
2.0
2.0
2.0Desktop Support maintains a balanced scorecard that provides a single, all-inclusive measure of Desktop Support performance.
Technician Utilization is measured, recorded, and tracked on an ongoing basis.
Customer Satisfaction is measured, recorded, and tracked on an ongoing basis.
Desktop Support understands key correlations and cause/effect relationships between the various KPI's. This enables the Desktop Support team to achieve desired performance goals by leveraging and driving the underlying "causal" metrics.
Cost per Ticket is measured, recorded, and tracked on an ongoing basis.
Desktop Support tracks the Mean Time to Resolve (MTTR), and the percentage of tickets resolved within 24, 48, and 72 hours.
Desktop Support conducts benchmarking at least once per year.
Desktop Support tracks the number of tickets that are resolved by Desktop Support, but that could have been resolved by Level 1 Support.
Desktop Support conducts event-driven customer surveys, whereby the results of customer-satisfaction surveys can be linked back to a specific ticket and to a specific technician handling the ticket.
First Level Resolution is measured, recorded, and tracked on an ongoing basis.
The First Visit Resolution rate for incidents is measured, recorded, and tracked on an ongoing basis.
Desktop Support team KPI's are used to establish "stretch" goals.
Desktop Support measures are used holistically and diagnostically to identify performance gaps in Desktop Support performance, and to prescribe actions that will improve performance.
Performance Measurement Best Practices Defined
Technician Job Satisfaction is measured, recorded, and tracked.

Company XYZ Desktop Support BenchmarkSample report only. Data is not accurate.
124© MetricNet, LLC, www.metricnet.com
Best Practice Focus Areas: CommunicationCompany XYZ's
Score
4.5
4.0
4.0
3.5
3.5
3.0
3.0
3.0
3.0
3.0
2.5
2.0Desktop Support meets frequently with user groups, and holds "informational briefings" to educate users on supported products and services, hours of operation, training opportunities, tips for getting the most benefit from Desktop Support, etc.
The value added by the Desktop Support team is communicated to key managers in IT, and expectations are formally established regarding Desktop Support team roles and responsibilities.
Customers are told what to expect on resolution time when their ticket is escalated or if a call-back is required.
Desktop Support provides training aids to users that enable them use Desktop Support more effectively. These could include log-in screens with the Desktop Support phone number, chat windows that can be clicked to initiate a real-time chat session, mouse pads imprinted with the Desktop Support IVR menu, etc.
Desktop Support maintains active communication with all stakeholder groups, including Desktop Support employees, IT managers, company managers outside of IT, and customers.
Desktop Support tracks the number of training-related contacts it receives, and provides feedback to user groups within the organization on training areas that could help to reduce Desktop Support contact volumes.
Communication Best Practices Defined
Desktop Support transmits outbound messages to users announcing major system and network outages, thereby alerting users about potential problems in the IT environment. These proactive messages help to reduce contact volumes during incidents that impact a large number of users.
Desktop Support has a formal communications schedule, and provides customized content for each stakeholder group.
Desktop Support has established User Group Liaisons who represent different groups within the user community. Desktop Support meets periodically with the liaisons to learn about user concerns and questions, and to communicate Desktop Support services, plans, and initiatives.
IT is required to deliver a "turnover package" to the Desktop Support team for all changes that will impact the user environment. This could include application updates, new desktop software, etc. The turnover package is designed to prepare the Desktop Support team to provide support to users in the affected areas.
Desktop Support meets frequently with other IT managers, and is an integral part of key decisions made within IT. Desktop Support plays the role of "voice of the user" within IT.
Desktop Support monitors all tickets, including those that are escalated, until ticket closure.

125
Detailed Benchmarking Comparisons

Cost Metrics
126

Company XYZ Desktop Support BenchmarkSample report only. Data is not accurate.
127© MetricNet, LLC, www.metricnet.com
Cost Metrics: Cost per Ticket
Cost per Ticket is one of the most important Desktop Support metrics. It is a measure of how efficiently your organization conducts its business. A higher-than-average Cost per Ticket is not necessarily a bad thing, particularly if accompanied by higher-than-average quality levels. Conversely, a low Cost per Ticket is not necessarily good, particularly if low cost is achieved by sacrificing quality or service levels. Every Desktop Support organization should track and trend Cost per Ticket on a monthly basis.
Cost per Ticket is the total annual operating expense of Desktop Support divided by the annual number of tickets handled by Desktop Support. Operating expense includes all employee salaries, overtime pay, benefits, and incentive compensation, plus all contractor, facilities, telecom, desktop computing, software licensing, training, travel, office supplies, and miscellaneous expenses.
Definition
Why it’s Important
Key CorrelationsCost per Ticket is strongly correlated with the following metrics: Cost per Incident Cost per Service Request Technician Utilization Incident First Visit Resolution Rate
Average Incident Work Time Average Service Request Work Time Average Travel Time per Ticket Incidents as a % of Total Ticket Volume
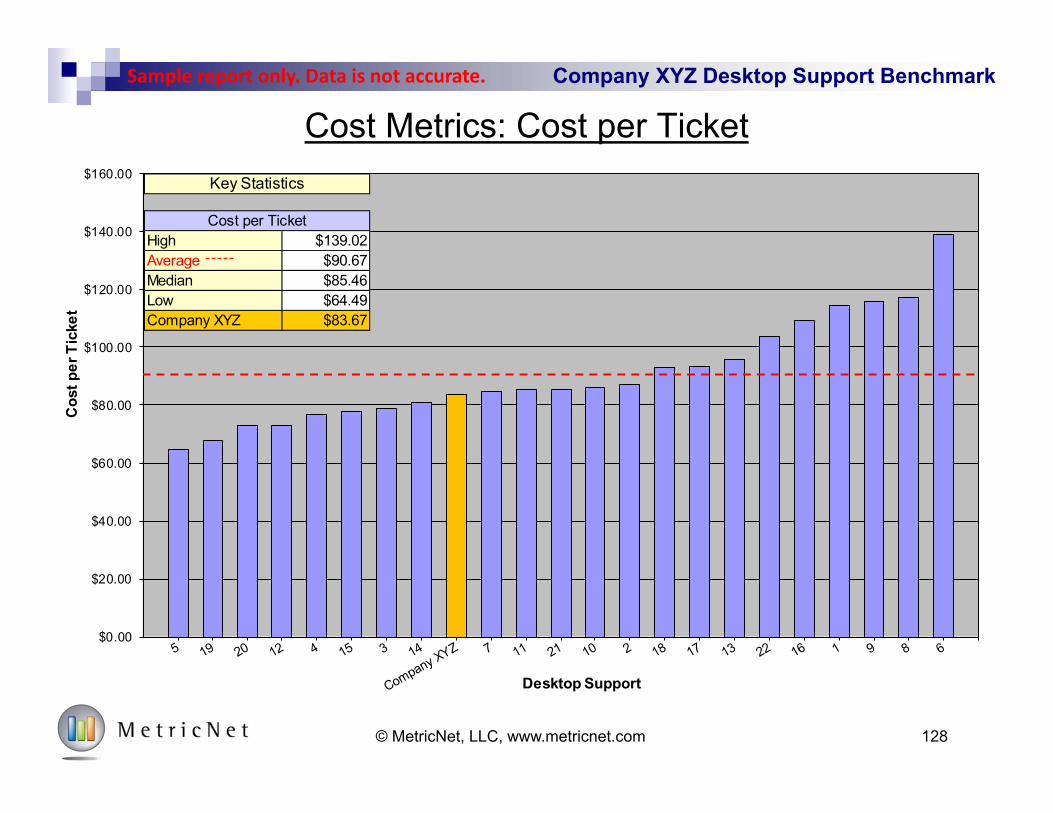
Company XYZ Desktop Support BenchmarkSample report only. Data is not accurate.
128© MetricNet, LLC, www.metricnet.com
Cost Metrics: Cost per Ticket
$0.00
$20.00
$40.00
$60.00
$80.00
$100.00
$120.00
$140.00
$160.00
Cos
t per
Tic
ket
Desktop Support
High $139.02Average ־־־־־ $90.67Median $85.46Low $64.49Company XYZ $83.67
Key Statistics
Cost per Ticket

Company XYZ Desktop Support BenchmarkSample report only. Data is not accurate.
129© MetricNet, LLC, www.metricnet.com
Cost Metrics: Cost per Incident
Cost per Incident is strongly correlated with the following metrics: Cost per Ticket Cost per Service Request Technician Utilization Incident First Visit Resolution Rate
Definition
Why it’s Important
Key Correlations
Cost per Incident is one of the most important Desktop Support metrics. It is one of the key components of Cost per Ticket (the other being Cost per Service Request). A higher-than-average Cost per Incident is not necessarily a bad thing, particularly if accompanied by higher-than-average quality levels. Conversely, a low Cost per Incident is not necessarily good, particularly if low cost is achieved by sacrificing quality or service levels. Every Desktop Support organization should track and trend Cost per Incident on a monthly basis.
Cost per Incident is the total annual operating expense of Desktop Support, multiplied by the incident workload as a percentage of total workload, then divided by the annual incident volume. Incident workload equals the annual incident volume multiplied by Average Incident Work Time (in other words, the total time spent handling incidents in a year). Likewise, total workload equals the annual ticket volume multiplied by the average ticket handle time. Operating expense includes all employee salaries, overtime pay, benefits, and incentive compensation, plus all contractor, facilities, telecom, desktop computing, software licensing, training, travel, office supplies, and miscellaneous expenses.
Average Incident Work Time Average Travel Time per Ticket Incidents as a % of Total Ticket Volume

Company XYZ Desktop Support BenchmarkSample report only. Data is not accurate.
Cost Metrics: Cost per Incident
130© MetricNet, LLC, www.metricnet.com
$0.00
$10.00
$20.00
$30.00
$40.00
$50.00
$60.00
$70.00
$80.00
$90.00
$100.00
Cos
t per
Inci
dent
Desktop Support
High $92.33Average ־־־־־ $65.18Median $64.95Low $45.72Company XYZ $63.61
Key Statistics
Cost per Incident

Company XYZ Desktop Support BenchmarkSample report only. Data is not accurate.
131© MetricNet, LLC, www.metricnet.com
Cost Metrics: Cost per Service RequestDefinition
Why it’s Important
Key Correlations
Cost per Service Request is one of the most important Desktop Support metrics. It is one of the key components of Cost per Ticket (the other being Cost per Incident). A higher-than-average Cost per Service Request is not necessarily a bad thing, particularly if accompanied by higher-than-average quality levels. Conversely, a low Cost per Service Request is not necessarily good, particularly if low cost is achieved by sacrificing quality or service levels. Every Desktop Support organization should track and trend Cost per Service Request on a monthly basis.
Cost per Service Request is the total annual operating expense of Desktop Support, multiplied by the service-request workload as a percentage of total workload, then divided by the annual service-request volume. Service-request workload equals the annual service-request volume multiplied by Average Service Request Work Time (in other words, the total time spent handling service requests in a year). Likewise, total workload equals the annual ticket volume multiplied by the average ticket handle time. Operating expense includes all employee salaries, overtime pay, benefits, and incentive compensation, plus all contractor, facilities, telecom, desktop computing, software licensing, training, travel, office supplies, and miscellaneous expenses.
Cost per Service Request is strongly correlated with the following metrics: Cost per Ticket Cost per Incident Technician Utilization
Average Service Request Work Time Average Travel Time per Ticket Incidents as a % of Total Ticket Volume
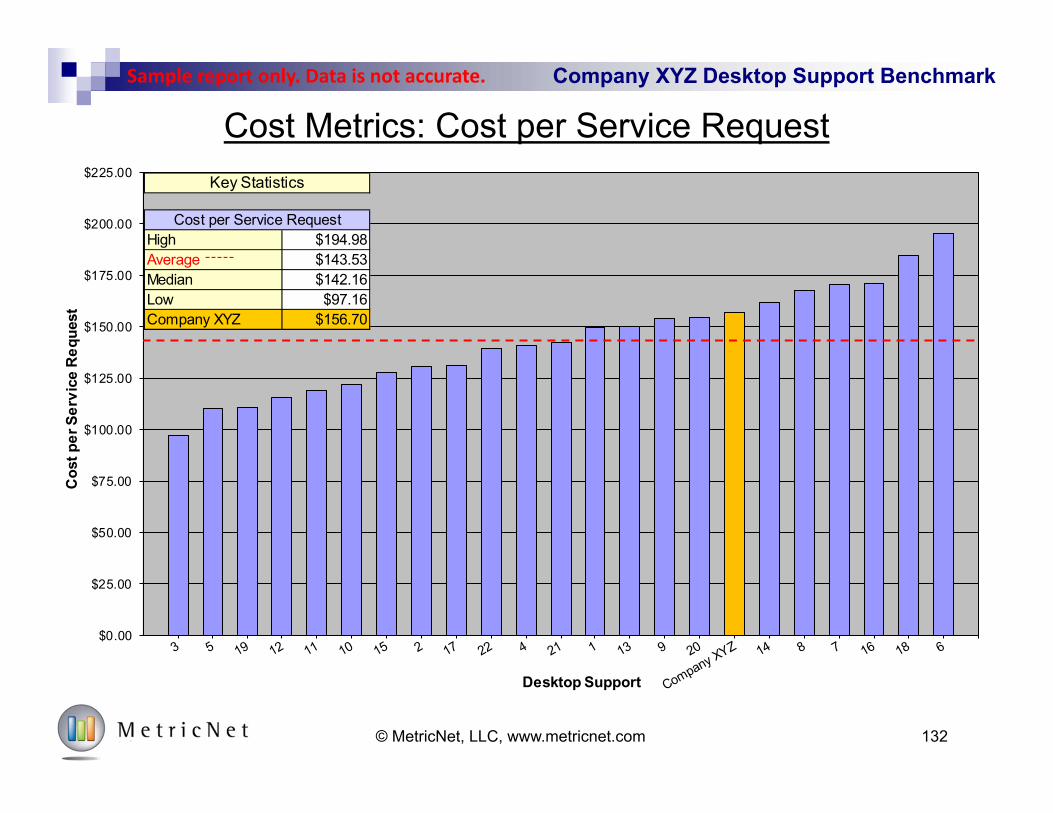
Company XYZ Desktop Support BenchmarkSample report only. Data is not accurate.
132© MetricNet, LLC, www.metricnet.com
Cost Metrics: Cost per Service Request
$0.00
$25.00
$50.00
$75.00
$100.00
$125.00
$150.00
$175.00
$200.00
$225.00
Cos
t per
Ser
vice
Req
uest
Desktop Support
High $194.98Average ־־־־־ $143.53Median $142.16Low $97.16Company XYZ $156.70
Key Statistics
Cost per Service Request

Productivity Metrics
133

Company XYZ Desktop Support BenchmarkSample report only. Data is not accurate.
134© MetricNet, LLC, www.metricnet.com
Productivity Metrics: Tickets per Technician per Month
Tickets per Technician per Month is strongly correlated with the following metrics: Technician Utilization Average Incident Work Time Average Service Request Work Time Average Travel Time per Ticket
Tickets per Technician per Month is an important indicator of technician productivity. A low number could indicate low Technician Utilization, poor scheduling efficiency or schedule adherence, or a higher-than-average ticket work time. Conversely, a high number of tickets per technician may indicate high Technician Utilization, good scheduling efficiency and schedule adherence, or a lower-than-average ticket work time. Every Desktop Support organization should track and trend this metric on a monthly basis.
Tickets per Technician per Month is the average monthly ticket volume divided by the average Full Time Equivalent (FTE) technician headcount. Ticket volume includes both incidents and service requests. Technician headcount is the average FTE number of employees and contractors handling Desktop Support tickets.
Definition
Why it’s Important
Key Correlations
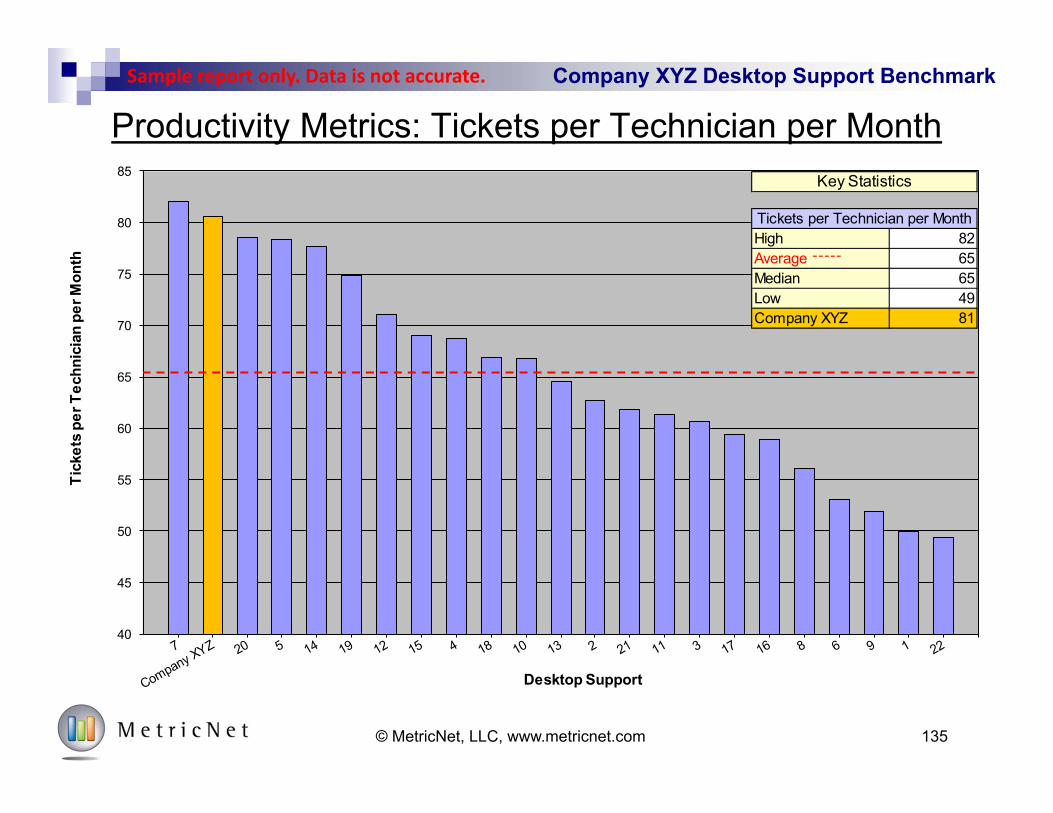
Company XYZ Desktop Support BenchmarkSample report only. Data is not accurate.
135© MetricNet, LLC, www.metricnet.com
Productivity Metrics: Tickets per Technician per Month
40
45
50
55
60
65
70
75
80
85
Tick
ets
per T
echn
icia
n pe
r Mon
th
Desktop Support
High 82Average ־־־־־ 65Median 65Low 49Company XYZ 81
Key Statistics
Tickets per Technician per Month

Company XYZ Desktop Support BenchmarkSample report only. Data is not accurate.
136© MetricNet, LLC, www.metricnet.com
Productivity Metrics: Incidents per Technician per Month
Incidents per Technician per Month is strongly correlated with the following metrics: Technician Utilization Average Incident Work Time Average Travel Time per Ticket Incidents as a % of Total Ticket Volume
Incidents per Technician per Month is an important indicator of technician productivity. A low number could indicate low Technician Utilization, poor scheduling efficiency or schedule adherence, or a higher-than-average incident work time. Conversely, a high number of incidents per technician may indicate high Technician Utilization, good scheduling efficiency and schedule adherence, or a lower-than-average incident work time. Every Desktop Support organization should track and trend this metric on a monthly basis.
Incidents per Technician per Month is the average monthly incident volume divided by the average Full Time Equivalent (FTE) technician headcount. Technician headcount is the average FTE number of employees and contractors handling Desktop Support tickets.
Definition
Why it’s Important
Key Correlations

Company XYZ Desktop Support BenchmarkSample report only. Data is not accurate.
137© MetricNet, LLC, www.metricnet.com
Productivity Metrics: Incidents per Technician per Month
0
10
20
30
40
50
60
70
80
Inci
dent
s pe
r Tec
hnic
ian
per M
onth
Desktop Support
High 74Average ־־־־־ 45Median 40Low 21Company XYZ 63
Key Statistics
Incidents per Technician per Month

Company XYZ Desktop Support BenchmarkSample report only. Data is not accurate.
138© MetricNet, LLC, www.metricnet.com
Productivity Metrics: Service Requests per Tech per Month
Service Requests per Technician per Month is strongly correlated with the following metrics: Technician Utilization Average Service Request Work Time Average Travel Time per Ticket Incidents as a % of Total Ticket Volume
Service Requests per Technician per Month is an important indicator of technician productivity. A low number could indicate low Technician Utilization, poor scheduling efficiency or schedule adherence, or a higher-than-average service request work time. Conversely, a high number of service requests per technician may indicate high Technician Utilization, good scheduling efficiency and schedule adherence, or a lower-than-average service request work time. Every Desktop Support organization should track and trend this metric on a monthly basis.
Service Requests per Technician per Month is the average monthly service request volume divided by the average Full Time Equivalent (FTE) technician headcount. Technician headcount is the average FTE number of employees and contractors handling Desktop Support tickets.
Definition
Why it’s Important
Key Correlations

Company XYZ Desktop Support BenchmarkSample report only. Data is not accurate.
139© MetricNet, LLC, www.metricnet.com
Productivity Metrics: Service Requests per Tech per Month
0
5
10
15
20
25
30
35
40
45
Serv
ice
Req
uest
s pe
r Tec
hnic
ian
per M
onth
Desktop Support
High 39Average ־־־־־ 21Median 22Low 6Company XYZ 17
Key Statistics
Service Requests per Technician per Month
Company XYZ Desktop Support BenchmarkSample report only. Data is not accurate.
140© MetricNet, LLC, www.metricnet.com
Productivity Metrics: Technicians as a % of Total Headcount
Technicians as a % of Total Headcount is strongly correlated with the following metrics: Cost per Ticket Cost per Incident Cost per Service Request
Definition
Why it’s Important
Key Correlations
The technician headcount as a percentage of total Desktop Support headcount is an important measure of management and overhead efficiency. Since non-technicians include both management and non-management personnel (such as supervisors and team leads, QA/QC, trainers, etc.), this metric is not a pure measure of management span of control. But it is a more useful metric than management span of control because the denominator of this ratio takes into account all personnel that are not directly engaged in customer-support activities.
This metric is the average Full Time Equivalent (FTE) technician headcount divided by the average total Desktop Support headcount. It is expressed as a percentage, and represents the percentage of total Desktop Support personnel who are engaged in direct customer-support activities. Headcount includes both employees and contractors.
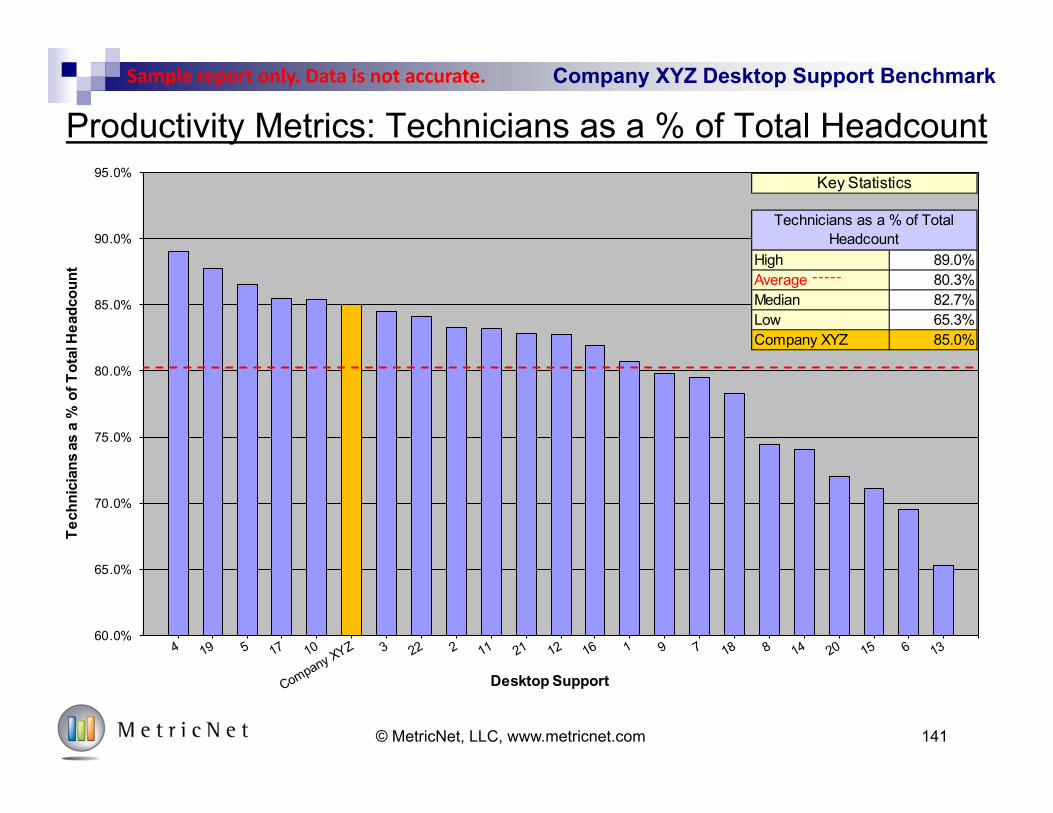
Company XYZ Desktop Support BenchmarkSample report only. Data is not accurate.
© MetricNet, LLC, www.metricnet.com
Productivity Metrics: Technicians as a % of Total Headcount
141
60.0%
65.0%
70.0%
75.0%
80.0%
85.0%
90.0%
95.0%
Tech
nici
ans
as a
% o
f Tot
al H
eadc
ount
Desktop Support
High 89.0%Average ־־־־־ 80.3%Median 82.7%Low 65.3%Company XYZ 85.0%
Key Statistics
Technicians as a % of Total Headcount

Company XYZ Desktop Support BenchmarkSample report only. Data is not accurate.
142© MetricNet, LLC, www.metricnet.com
Productivity Metrics: Technician Utilization
Technician Utilization is strongly correlated with the following metrics: Tickets per Technician per Month Incidents per Technician per Month Service Requests per Technician per Month Cost per Ticket Cost per Incident Cost per Service Request
Definition
Why it’s Important
Key Correlations
Technician Utilization is the single most important indicator of technician productivity. It measures the percentage of time that the average technician is in “work mode,” and is independent of ticket work time or complexity.
Technician Utilization is the average time that a technician spends handling both incidents and service requests per month, divided by the number of business hours in a given month. (See the more thorough definition on the next page.)

Company XYZ Desktop Support BenchmarkSample report only. Data is not accurate.
Technician Utilization Defined
Technician Utilization is a measure of technicians’ actual ticket work time and travel time in a month, divided by the technicians’ total time at work during the month.
It takes into account both incidents and service requests handled by the technicians.
But the calculation for Technician Utilization does not make adjustments for sick days, holidays, training time, project time, or idle time.
By calculating Technician Utilization in this way, all Desktop Support organizations worldwide are measured in exactly the same way, and can therefore be directly compared for benchmarking purposes.
© MetricNet, LLC, www.metricnet.com 143
TechnicianUtilization
(Average number of incidents handled per technician per month) X (Average Incident Work Time) +(Average number of service requests handled per technician per month) X (Average Service Request Work Time) +
(Average number of tickets handled per technician per month) X (Average Travel Time per Ticket)
(Average number of days worked in a month) X (Number of work hours in a day) X (60 minutes/hour)=

Company XYZ Desktop Support BenchmarkSample report only. Data is not accurate.
Example: Desktop Support Technician Utilization
Incidents per Technician per Month = 60 Service Requests per Technician per Month = 24 Average Tickets per Technician per Month = 84 Average Incident Work Time = 32 minutes Average Service Request Work Time = 59 minutes Average Travel Time per Ticket = 41 minutes
144© MetricNet, LLC, www.metricnet.com
TechnicianUtilization
(60 incidents per month) X (32 minutes) + (24 service requests per month) X (59 minutes) +
(84 tickets per month) X (41 minutes)
(21.5 work days per month) X (7.5 work hours per day) X (60 minutes/hour)
70.1%TechnicianUtilization
= =

Company XYZ Desktop Support BenchmarkSample report only. Data is not accurate.
© MetricNet, LLC, www.metricnet.com
Productivity Metrics: Technician Utilization
145
40.0%
45.0%
50.0%
55.0%
60.0%
65.0%
70.0%
Tech
nici
an U
tiliz
atio
n
Desktop Support
High 66.9%Average ־־־־־ 57.6%Median 56.3%Low 48.2%Company XYZ 58.5%
Key Statistics
Technician Utilization

Service Level Metrics
146

Company XYZ Desktop Support BenchmarkSample report only. Data is not accurate.
147© MetricNet, LLC, www.metricnet.com
Service Level Metrics: Mean Time to Resolve Incidents
Mean Time to Resolve Incidents is strongly correlated with the following metrics: Customer Satisfaction Average Incident Work Time Average Travel Time per Ticket % of Incidents Resolved in 8 Business Hours
Service levels, including the MTTR for incidents, are a key driver of Customer Satisfaction with Desktop Support.
Mean Time to Resolve Incidents is the average number of business hours that elapse from the time an incident is reported until the time the incident is closed. Non-business hours are excluded from the calculation. For example, if an incident is reported at 3:00 p.m. on Tuesday, and the ticket is closed at 3:00 p.m. on Wednesday, the mean time to resolve (MTTR) will be 8 hours, not 24 hours.
Definition
Why it’s Important
Key Correlations

Company XYZ Desktop Support BenchmarkSample report only. Data is not accurate.
148© MetricNet, LLC, www.metricnet.com
Service Level Metrics: Mean Time to Resolve Incidents
0.0
2.0
4.0
6.0
8.0
10.0
12.0
14.0
16.0
18.0
20.0
Mea
n Ti
me
to R
esol
ve In
cide
nts
(hou
rs)
Desktop Support
High 17.30Average ־־־־־ 8.89Median 7.93Low 4.53Company XYZ 16.10
Key Statistics
Mean Time to Resolve Incidents (business hours)

Company XYZ Desktop Support BenchmarkSample report only. Data is not accurate.
149© MetricNet, LLC, www.metricnet.com
% of Incidents Resolved in 8 Business Hours is strongly correlated with the following metrics: Customer Satisfaction Average Incident Work Time Average Travel Time per Ticket Mean Time to Resolve Incidents
Service levels, including the % of Incidents Resolved in 8 Business Hours, are a key driver of Customer Satisfaction with Desktop Support.
The % of Incidents Resolved in 8 Business Hours is fairly self-explanatory. For example, an incident that is reported at 1:00 p.m. on Friday will be resolved in 8 business hours if the ticket is closed by 1:00 p.m. on the following Monday.
Definition
Why it’s Important
Key Correlations
Service Level Metrics: % of Incidents Resolved in 8 Business Hours

Company XYZ Desktop Support BenchmarkSample report only. Data is not accurate.
150© MetricNet, LLC, www.metricnet.com
0.0%
10.0%
20.0%
30.0%
40.0%
50.0%
60.0%
70.0%
% o
f Inc
iden
ts R
esol
ved
in 8
Bus
ines
s H
ours
Desktop Support
High 65.7%Average ־־־־־ 49.1%Median 50.6%Low 24.5%Company XYZ 41.9%
Key Statistics
% of Incidents Resolved in 8 Business Hours
Service Level Metrics: % of Incidents Resolved in 8 Business Hours

Company XYZ Desktop Support BenchmarkSample report only. Data is not accurate.
151© MetricNet, LLC, www.metricnet.com
Service Level Metrics: Mean Time to Fulfill Service Requests
Mean Time to Fulfill Service Requests is strongly correlated with the following metrics: Customer Satisfaction Average Service Request Work Time Average Travel Time per Ticket % of Service Requests Resolved in 24 Business Hours
Service levels, including the MTTF for service requests, are a key driver of Customer Satisfaction with Desktop Support.
Mean Time to Fulfill Service Requests is the average number of business days that elapse from the time a service request is logged until the time the service request is completed. Non-business days are excluded from the calculation. For example, if a service request is logged at 3:00 p.m. on Friday, and the ticket is closed at 3:00 pm on the following Tuesday, the mean time to fulfill (MTTF) will be 2 days, not 4 days.
Definition
Why it’s Important
Key Correlations

Company XYZ Desktop Support BenchmarkSample report only. Data is not accurate.
152© MetricNet, LLC, www.metricnet.com
Service Level Metrics: Mean Time to Fulfill Service Requests
0.0
1.0
2.0
3.0
4.0
5.0
6.0
7.0
8.0
Mea
n Ti
me
to F
ulfil
l Ser
vice
Req
uest
s (d
ays)
Desktop Support
High 6.78Average ־־־־־ 5.15Median 5.28Low 3.08Company XYZ 5.58
Key Statistics
Mean Time to Fulfill Service Requests (business days)
Company XYZ Desktop Support BenchmarkSample report only. Data is not accurate.
153© MetricNet, LLC, www.metricnet.com
% of Service Requests Fulfilled in 24 Business Hours is strongly correlated with the following metrics: Customer Satisfaction Average Service Request Work Time Average Travel Time per Ticket Mean Time to Fulfill Service Requests
Service levels, including the % of Service Requests Fulfilled in 24 Business Hours, are a key driver of Customer Satisfaction with Desktop Support.
The % of Service Requests Fulfilled in 24 Business Hours is fairly self-explanatory. For example, a service request that is logged at 1:00 p.m. on Friday will be fulfilled in 24 business hours if the ticket is closed by 1:00 p.m. on the following Wednesday.
Definition
Why it’s Important
Key Correlations
Service Level Metrics: % of Service Requests Fulfilled in 24 Business Hrs

Company XYZ Desktop Support BenchmarkSample report only. Data is not accurate.
154© MetricNet, LLC, www.metricnet.com
Service Level Metrics: % of Service Requests Fulfilled in 24 Business Hrs
0.0%
10.0%
20.0%
30.0%
40.0%
50.0%
60.0%
70.0%
% o
f Ser
vice
Req
uest
s Fu
lfille
d in
24
Bus
ines
s H
ours
Desktop Support
High 63.5%Average ־־־־־ 38.3%Median 41.4%Low 17.9%Company XYZ 51.0%
Key Statistics
% of Service Requests Fulfilled in 24 Business Hours

Quality Metrics
155

Company XYZ Desktop Support BenchmarkSample report only. Data is not accurate.
156© MetricNet, LLC, www.metricnet.com
Quality Metrics: Customer Satisfaction
Customer Satisfaction is strongly correlated with the following metrics: Incident First Visit Resolution Rate Mean Time to Resolve Incidents Mean Time to Fulfill Service Requests
Definition
Why it’s Important
Key Correlations
Customer Satisfaction is the single most important measure of Desktop Support quality. Any successful Desktop Support organization will have consistently high Customer Satisfaction ratings. Some Desktop Support managers are under the impression that a low Cost per Ticket may justify a lower level of Customer Satisfaction. But this is not true. MetricNet’s research shows that even Desktop Support organizations with a very low Cost per Ticket can achieve consistently high Customer Satisfaction ratings.
Customer Satisfaction is the percentage of customers who are either satisfied or very satisfied with their Desktop Support experience. This metric can be captured in a numbers of ways, including follow-up calls, email surveys that are automatically sent out by the trouble ticket system, postal surveys, etc.

Company XYZ Desktop Support BenchmarkSample report only. Data is not accurate.
157© MetricNet, LLC, www.metricnet.com
Quality Metrics: Customer Satisfaction
30.0%
40.0%
50.0%
60.0%
70.0%
80.0%
90.0%
100.0%
Cus
tom
er S
atis
fact
ion
Desktop Support
High 92.1%Average ־־־־־ 79.8%Median 84.2%Low 49.8%Company XYZ 91.4%
Key Statistics
Customer Satisfaction

Company XYZ Desktop Support BenchmarkSample report only. Data is not accurate.
158© MetricNet, LLC, www.metricnet.com
Quality Metrics: Incident First Visit Resolution Rate
Incident First Visit Resolution Rate is strongly correlated with the following metrics: Customer Satisfaction New Technician Training Hours Annual Technician Training Hours Average Incident Work Time
Incident First Visit Resolution Rate is one of the biggest drivers of Customer Satisfaction. A high Incident First Visit Resolution Rate is almost always associated with high levels of Customer Satisfaction. Desktop Support groups that emphasize training (i.e., high training hours for new and veteran technicians) and have good technology tools generally enjoy a higher-than-average Incident First Visit Resolution Rate.
Incident First Visit Resolution Rate is the percentage of incidents that are resolved on the first visit to the customer. Incidents that require a second visit, or are otherwise unresolved on the first visit for any reason, do not qualify for Incident First Visit Resolution.
Definition
Why it’s Important
Key Correlations

Company XYZ Desktop Support BenchmarkSample report only. Data is not accurate.
159© MetricNet, LLC, www.metricnet.com
Quality Metrics: Incident First Visit Resolution Rate
0.0%
10.0%
20.0%
30.0%
40.0%
50.0%
60.0%
70.0%
80.0%
90.0%
100.0%
Inci
dent
Firs
t Vis
it R
esol
utio
n R
ate
Desktop Support
High 89.0%Average ־־־־־ 70.8%Median 70.2%Low 51.4%Company XYZ 82.8%
Key Statistics
Incident First Visit Resolution Rate

Company XYZ Desktop Support BenchmarkSample report only. Data is not accurate.
160© MetricNet, LLC, www.metricnet.com
Quality Metrics: % Resolved Level 1 Capable
% Resolved Level 1 Capable is strongly correlated with the following metrics: Average Incident Work Time Tickets per User per Month Incidents per User per Month
Tickets resolved by Desktop Support that could have been resolved by the Level 1 Service Desk represent defects. Since the cost of resolution is typically much higher at Desktop Support than it is for Level 1 support, every ticket that is unnecessarily escalated by Level 1 to Desktop Support incurs unnecessary costs. To minimize Total Cost of Ownership (TCO) for end-user support, the % Resolved Level 1 Capable should be as low as possible.
% Resolved Level 1 Capable is the percentage of tickets resolved by Desktop Support that could have been resolved by the Level 1 Service Desk. This metric is generally tracked by sampling tickets after the fact to determine the percentage that could have been resolved at Level 1, or by having the Desktop Support technician check a box when closing a ticket, to indicate that the ticket could have been resolved at Level 1.
Definition
Why it’s Important
Key Correlations

Company XYZ Desktop Support BenchmarkSample report only. Data is not accurate.
161© MetricNet, LLC, www.metricnet.com
Quality Metrics: % Resolved Level 1 Capable
0.0%
5.0%
10.0%
15.0%
20.0%
25.0%
30.0%
35.0%
40.0%
% R
esol
ved
Leve
l 1 C
apab
le
Desktop Support
High 36.9%Average ־־־־־ 21.4%Median 22.3%Low 8.5%Company XYZ 24.5%
Key Statistics
% Resolved Level 1 Capable

Technician Metrics
162

Company XYZ Desktop Support BenchmarkSample report only. Data is not accurate.
163© MetricNet, LLC, www.metricnet.com
Technician Metrics: Annual Technician Turnover
Annual Technician Turnover is strongly correlated with the following metrics: Daily Technician Absenteeism Annual Technician Training Hours Customer Satisfaction Incident First Visit Resolution Rate Cost per Ticket Technician Job Satisfaction
Definition
Why it’s Important
Key Correlations
Technician turnover is costly. Each time a technician leaves the organization, a new technician needs to be hired to replace the outgoing technician. This results in costly recruiting, hiring, and training expenses. Additionally, it is typically several weeks or even months before a technician is fully productive, so there is lost productivity associated with technician turnover as well. High technician turnover is generally associated with low technician morale in a Desktop Support organization.
Annual Technician Turnover is the average percentage of technicians that leave Desktop Support, for any reason (voluntarily or involuntarily), in a year.
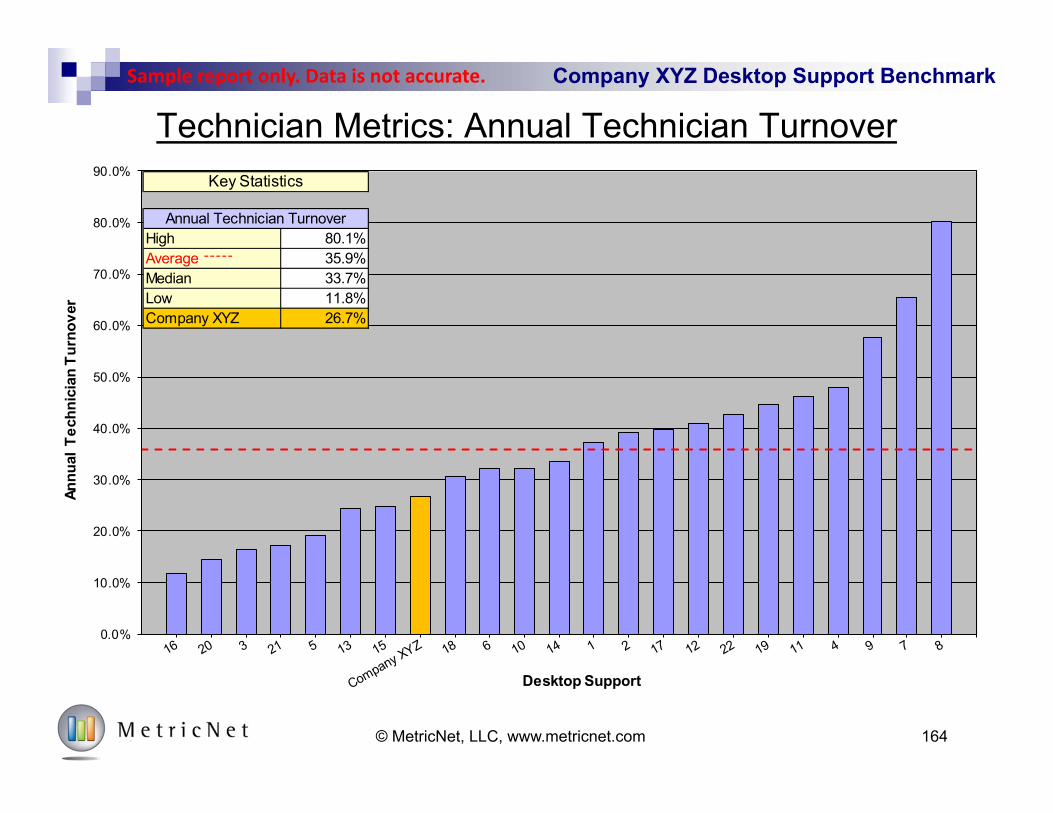
Company XYZ Desktop Support BenchmarkSample report only. Data is not accurate.
164© MetricNet, LLC, www.metricnet.com
Technician Metrics: Annual Technician Turnover
0.0%
10.0%
20.0%
30.0%
40.0%
50.0%
60.0%
70.0%
80.0%
90.0%
Annu
al T
echn
icia
n Tu
rnov
er
Desktop Support
High 80.1%Average ־־־־־ 35.9%Median 33.7%Low 11.8%Company XYZ 26.7%
Key Statistics
Annual Technician Turnover

Company XYZ Desktop Support BenchmarkSample report only. Data is not accurate.
165© MetricNet, LLC, www.metricnet.com
Technician Metrics: Daily Technician Absenteeism
Daily Technician Absenteeism is strongly correlated with the following metrics: Annual Technician Turnover Technician Job Satisfaction Technician Utilization Cost per Ticket Tickets per Technician per Month
Definition
Why it’s Important
Key Correlations
High Technician Absenteeism is problematic because it makes it difficult for a Desktop Support organization to schedule resources efficiently. High absenteeism can severely harm Desktop Support’s operating performance and increase the likelihood that service-level targets will be missed. Mean Time to Resolve Incidents and Mean Time to Fulfill Service Requests will typically suffer when absenteeism is high. Also, chronically high absenteeism is often a sign of low technician morale.
Daily Technician Absenteeism is the average percentage of technicians with an unexcused absence on any given day. It is calculated by dividing the average number of unexcused absent technicians per day by the average total number of technicians per day that are scheduled to be at work.

Company XYZ Desktop Support BenchmarkSample report only. Data is not accurate.
166© MetricNet, LLC, www.metricnet.com
Technician Metrics: Daily Technician Absenteeism
0.0%
1.0%
2.0%
3.0%
4.0%
5.0%
6.0%
7.0%
8.0%
9.0%
10.0%
11.0%
12.0%
13.0%
Dai
ly T
echn
icia
n Ab
sent
eeis
m
Desktop Support
High 12.0%Average ־־־־־ 5.4%Median 4.9%Low 1.5%Company XYZ 4.5%
Key Statistics
Daily Technician Absenteeism

Company XYZ Desktop Support BenchmarkSample report only. Data is not accurate.
167© MetricNet, LLC, www.metricnet.com
Technician Metrics: New Technician Training Hours
New Technician Training Hours are strongly correlated with the following metrics: Incident First Visit Resolution Rate Customer Satisfaction Average Incident Work Time Average Service Request Work Time Technician Job Satisfaction
Definition
Why it’s Important
Key Correlations
New Technician Training Hours are strongly correlated with Customer Satisfaction and Incident First Visit Resolution Rate, especially during a technician’s first few months on the job. The more training that new technicians receive, the higher that Customer Satisfaction and Incident First Visit Resolution will typically be. This, in turn, has a positive effect on other performance metrics. Perhaps most importantly, training levels strongly impact technician morale—technicians who receive more training typically have higher levels of job satisfaction.
The name of this metric is somewhat self-explanatory. New Technician Training Hours is the number of training hours (including classroom, computer-based training, self-study, shadowing, being coached, and on-the-job training) that a new technician receives before he or she is allowed to handle Desktop Support tickets independently.

Company XYZ Desktop Support BenchmarkSample report only. Data is not accurate.
168© MetricNet, LLC, www.metricnet.com
Technician Metrics: New Technician Training Hours
0
10
20
30
40
50
60
70
80
90
100
110
120
130
140
New
Tec
hnic
ian
Trai
ning
Hou
rs
Desktop Support
High 126Average ־־־־־ 49Median 46Low 0Company XYZ 60
Key Statistics
New Technician Training Hours

Company XYZ Desktop Support BenchmarkSample report only. Data is not accurate.
169© MetricNet, LLC, www.metricnet.com
Technician Metrics: Annual Technician Training Hours
Annual Technician Training Hours are strongly correlated with the following metrics: Incident First Visit Resolution Rate Customer Satisfaction Average Incident Work Time Average Service Request Work Time Technician Job Satisfaction
Definition
Why it’s Important
Key Correlations
Annual Technician Training Hours are strongly correlated with Incident First Visit Resolution Rate and Customer Satisfaction. Perhaps most importantly, training levels strongly impact technician morale—technicians who receive more training typically have higher levels of job satisfaction.
Annual Technician Training Hours is the average number of training hours (including classroom, computer-based training, self-study, shadowing, etc.) that a technician receives on an annual basis. This number includes any training hours that a technician receives that are not part of the technician’s initial (new-technician) training. But it does not include routine team meetings, shift handoffs, or other activities that do not involve formal training.

Company XYZ Desktop Support BenchmarkSample report only. Data is not accurate.
170© MetricNet, LLC, www.metricnet.com
Technician Metrics: Annual Technician Training Hours
0
10
20
30
40
50
60
70
Annu
al T
echn
icia
n Tr
aini
ng H
ours
Desktop Support
High 65Average ־־־־־ 14Median 3Low 0Company XYZ 10
Key Statistics
Annual Technician Training Hours

Company XYZ Desktop Support BenchmarkSample report only. Data is not accurate.
171© MetricNet, LLC, www.metricnet.com
Technician Metrics: Technician Tenure
Technician Tenure is a measure of technician experience. Almost every metric related to Desktop Support cost and quality is impacted by the level of experience the technicians have.
Technician Tenure is the average number of months that each technician has worked in a particular Desktop Support organization.
Technician tenure is strongly correlated with the following metrics:
Cost per Ticket Customer Satisfaction Incident First Visit
Resolution Rate
Annual Technician Turnover Technician Training Hours Technician Coaching Hours
Technician Job Satisfaction Average Incident Work Time Average Service Request Work
Time
Definition
Why it’s Important
Key Correlations

Company XYZ Desktop Support BenchmarkSample report only. Data is not accurate.
172© MetricNet, LLC, www.metricnet.com
Technician Metrics: Technician Tenure (months)
0.0
10.0
20.0
30.0
40.0
50.0
60.0
70.0
80.0
90.0
100.0
110.0
Tech
nici
an T
enur
e (m
onth
s)
Desktop Support
High 102.5Average ־־־־־ 43.7Median 35.4Low 13.3Company XYZ 43.6
Key Statistics
Technician Tenure (months)

Company XYZ Desktop Support BenchmarkSample report only. Data is not accurate.
173© MetricNet, LLC, www.metricnet.com
Technician Metrics: Technician Job Satisfaction
Technician Job Satisfaction is strongly correlated with the following metrics: Annual Technician Turnover Daily Technician Absenteeism Technician Training Hours Technician Coaching Hours
Definition
Why it’s Important
Key Correlations
Technician Job Satisfaction is a proxy for technician morale. And morale, while difficult to measure, affects performance on almost every metric in Desktop Support. High-performance Desktop Support organizations almost always have high levels of Technician Job Satisfaction. A Desktop Support organization can control and improve its performance on this metric through training, coaching, and career pathing.
Technician Job Satisfaction is the percentage of technicians in a Desktop Support organization who are either satisfied or very satisfied with their jobs.
Customer Satisfaction Incident First Visit Resolution Rate Average Incident Work Time Average Service Request Work Time Cost per Ticket

Company XYZ Desktop Support BenchmarkSample report only. Data is not accurate.
174© MetricNet, LLC, www.metricnet.com
Technician Metrics: Technician Job Satisfaction
60.0%
65.0%
70.0%
75.0%
80.0%
85.0%
90.0%
95.0%
100.0%
Tech
nici
an J
ob S
atis
fact
ion
Desktop Support
High 98.5%Average ־־־־־ 86.8%Median 87.3%Low 73.8%Company XYZ 84.6%
Key Statistics
Technician Job Satisfaction

Ticket Handling Metrics
175

Company XYZ Desktop Support BenchmarkSample report only. Data is not accurate.
176© MetricNet, LLC, www.metricnet.com
Ticket Handling Metrics: Average Incident Work Time
Average Incident Work Time is strongly correlated with the following metrics: Cost per Incident Incidents per Technician per Month Incident First Visit Resolution Rate
Incident Work Time is one of the basic units of work in Desktop Support. Average Incident Work Time, therefore, represents the amount of labor required to complete one unit of work.
Average Incident Work Time is the average time (in minutes) that a technician spends to resolve an incident. This does not include travel time to and from the customer, or time between visits if multiple visits are required to the user’s desktop to resolve an incident. It includes only the time that a technician spends actually working on an incident.
Definition
Why it’s Important
Key Correlations

Company XYZ Desktop Support BenchmarkSample report only. Data is not accurate.
177© MetricNet, LLC, www.metricnet.com
Ticket Handling Metrics: Average Incident Work Time
30.0
35.0
40.0
45.0
50.0
55.0
60.0
Aver
age
Inci
dent
Wor
k Ti
me
(min
utes
)
Desktop Support
High 54.3Average ־־־־־ 46.4Median 45.5Low 43.7Company XYZ 43.7
Key Statistics
Average Incident Work Time (minutes)

Company XYZ Desktop Support BenchmarkSample report only. Data is not accurate.
178© MetricNet, LLC, www.metricnet.com
Average Service Request Work Time is strongly correlated with the following metrics: Cost per Service Request Service Requests per Technician per Month
Service Request Work Time is one of the basic units of work in Desktop Support. Average Service Request Work Time, therefore, represents the amount of labor required to complete one unit of work.
Average Service Request Work Time is the average time (in minutes) that a technician spends to fulfill a service request. This does not include travel time to and from the customer, or time between visits if multiple visits are required to fulfill a service request. It includes only the time that a technician spends actually fulfilling a service request.
Definition
Why it’s Important
Key Correlations
Ticket Handling Metrics: Average Service Request Work Time

Company XYZ Desktop Support BenchmarkSample report only. Data is not accurate.
179© MetricNet, LLC, www.metricnet.com
Ticket Handling Metrics: Average Service Request Work Time
100.0
105.0
110.0
115.0
120.0
125.0
Aver
age
Serv
ice
Req
uest
Wor
k Ti
me
(min
utes
)
Desktop Support
High 119.7Average ־־־־־ 112.7Median 112.5Low 106.2Company XYZ 107.6
Key Statistics
Average Service Request Work Time (minutes)

Company XYZ Desktop Support BenchmarkSample report only. Data is not accurate.
180© MetricNet, LLC, www.metricnet.com
Ticket Handling Metrics: Average Travel Time per Ticket
Average Travel Time per Ticket is strongly correlated with the following metrics: Cost per Ticket Incidents per Technician per Month Service Requests per Technician per Month
Unlike the Level 1 Service Desk, where support is provided remotely, Desktop Support, by definition, requires onsite support. Getting to and from the site of a ticket can be very time consuming and will affect the number of tickets that a technician can handle in a day or a month. This, in turn, affects the staffing level required in the Desktop Support organization.
Average Travel Time per Ticket is the average round-trip travel time to get to and from the site of a user or device being serviced. In a high-density user environment (e.g., a high-rise office building) the Average Travel Time per Ticket will typically be less than 20 minutes. By contrast, in a more distributed user environment (e.g., field or campus locations), the Average Travel Time per Ticket will be correspondingly longer.
Definition
Why it’s Important
Key Correlations

Company XYZ Desktop Support BenchmarkSample report only. Data is not accurate.
181© MetricNet, LLC, www.metricnet.com
Ticket Handling Metrics: Average Travel Time per Ticket
3.0
4.0
5.0
6.0
7.0
8.0
9.0
10.0
11.0
12.0
13.0
Aver
age
Trav
el T
ime
per T
icke
t (m
inut
es)
Desktop Support
High 11.7Average ־־־־־ 9.0Median 9.0Low 7.2Company XYZ 9.1
Key Statistics
Average Travel Time per Ticket (minutes)

Workload Metrics
182

Company XYZ Desktop Support BenchmarkSample report only. Data is not accurate.
183© MetricNet, LLC, www.metricnet.com
Workload Metrics: Tickets per End User per Month
Tickets per End User per Month is strongly correlated with the following metrics: Incidents per End User per Month Service Requests per End User per Month
The number of Tickets per End User per Month will drive the workload, and hence the staffing for a Desktop Support organization. Desktop Support staffing decisions should be based on this metric, rather than on the number of end users being supported.
Tickets per End User per Month measures the volume of Desktop Support work generated by a given user population. The number of Tickets per End User per Month can vary dramatically from one organization to another, driven by factors such as the age of devices being supported, the number of laptop computers, the number of other mobile devices, the location of users (office, home, field), and myriad other factors.
Definition
Why it’s Important
Key Correlations

Company XYZ Desktop Support BenchmarkSample report only. Data is not accurate.
184© MetricNet, LLC, www.metricnet.com
Workload Metrics: Tickets per End User per Month
0.00
0.10
0.20
0.30
0.40
0.50
0.60
0.70
0.80
0.90
Tick
ets
per E
nd U
ser p
er M
onth
Desktop Support
High 0.82Average ־־־־־ 0.39Median 0.36Low 0.19Company XYZ 0.31
Key Statistics
Tickets per End User per Month

Company XYZ Desktop Support BenchmarkSample report only. Data is not accurate.
185© MetricNet, LLC, www.metricnet.com
Workload Metrics: Incidents per End User per Month
Incidents per End User per Month is strongly correlated with the following metrics: Tickets per End User per Month
The number of Incidents per End User per Month is a major workload driver, and will therefore have a strong impact on staffing decisions for Desktop Support.
Incidents per End User per Month is a key measure of the volume of Desktop Support work generated by a given user population. The number of Incidents per End User per Month can vary dramatically from one organization to another, driven by factors such as the age of devices being supported, the number of laptop computers, the number of other mobile devices, the location of users (office, home, field), and myriad other factors.
Definition
Why it’s Important
Key Correlations

Company XYZ Desktop Support BenchmarkSample report only. Data is not accurate.
186© MetricNet, LLC, www.metricnet.com
Workload Metrics: Incidents per End User per Month
0.00
0.05
0.10
0.15
0.20
0.25
0.30
0.35
0.40
0.45
0.50
0.55
0.60
0.65
Inci
dent
s pe
r End
Use
r per
Mon
th
Desktop Support
High 0.61Average ־־־־־ 0.26Median 0.26Low 0.07Company XYZ 0.24
Key Statistics
Incidents per End User per Month

Company XYZ Desktop Support BenchmarkSample report only. Data is not accurate.
187© MetricNet, LLC, www.metricnet.com
Workload Metrics: Service Requests per End User per Month
Service Requests per End User per Month is strongly correlated with the following metrics: Tickets per End User per Month
The number of Service Requests per End User per Month is a major workload driver, and will therefore have a strong impact on staffing decisions for Desktop Support.
Service Requests per End User per Month is a key measure of the volume of Desktop Support work generated by a given user population. The number of Service Requests per End User per Month can vary dramatically from one organization to another, driven by factors such as the number of move/add/change requests, the age of devices being supported, the frequency of device refreshes, the location of users (office, home, field), and myriad other factors.
Definition
Why it’s Important
Key Correlations

Company XYZ Desktop Support BenchmarkSample report only. Data is not accurate.
188© MetricNet, LLC, www.metricnet.com
Workload Metrics: Service Requests per End User per Month
0.00
0.02
0.04
0.06
0.08
0.10
0.12
0.14
0.16
0.18
0.20
0.22
0.24
Serv
ice
Req
uest
s pe
r End
Use
r per
Mon
th
Desktop Support
High 0.22Average ־־־־־ 0.12Median 0.13Low 0.02Company XYZ 0.07
Key Statistics
Service Requests per End User per Month
Company XYZ Desktop Support BenchmarkSample report only. Data is not accurate.
189© MetricNet, LLC, www.metricnet.com
Workload Metrics: Incidents as a % of Total Ticket Volume
Incidents as a % of Total Ticket Volume is strongly correlated with the following metrics: Cost per Ticket Tickets per Technician per Month
Incidents are generally unplanned work (e.g., device break/fix), while the majority of service requests are planned work (e.g., move/add/change). Incidents as a % of Total Ticket Volume therefore measures the percentage of Desktop Support work that is made up of unplanned work (incidents).
Incidents as a % of Total Ticket Volume is a fairly self-explanatory metric. It indicates the mix of work (incidents vs. service requests) handled by a Desktop Support organization. Most Desktop Support organizations receive more incidents than service requests. Since incidents are generally less costly to resolve than service requests, the higher that Incidents as a % of Total Ticket Volume is, the lower the Cost per Ticket will be.
Definition
Why it’s Important
Key Correlations

Company XYZ Desktop Support BenchmarkSample report only. Data is not accurate.
190© MetricNet, LLC, www.metricnet.com
Workload Metrics: Incidents as a % of Total Ticket Volume
0.0%
10.0%
20.0%
30.0%
40.0%
50.0%
60.0%
70.0%
80.0%
90.0%
100.0%
Inci
dent
s as
a %
of T
otal
Tic
ket V
olum
e
Desktop Support
High 92.2%Average ־־־־־ 66.3%Median 66.2%Low 35.6%Company XYZ 78.5%
Key Statistics
Incidents as a % of Total Ticket Volume

About MetricNet:Your Benchmarking Partner
191

Company XYZ Desktop Support BenchmarkSample report only. Data is not accurate.
Your Project Manager: Jeff Rumburg
Co-Founder and Managing Partner, MetricNet, LLC
Winner of the 2014 Ron Muns Lifetime Achievement Award
Former CEO, The Verity Group
Former Vice President, Gartner
Founder of the Service Desk Benchmarking Consortium
Author of A Hands-On Guide to
Competitive Benchmarking
Harvard MBA, Stanford MS
192© MetricNet, LLC, www.metricnet.com

Company XYZ Desktop Support BenchmarkSample report only. Data is not accurate.
Benchmarking is MetricNet’s Core Business
Call Centers
Telecom
Information Technology
Satisfaction
Customer Service Technical Support Telemarketing/Telesales Collections
Service Desk Desktop Support Field Support
Price Benchmarking
Customer Satisfaction Employee Satisfaction
193© MetricNet, LLC, www.metricnet.com

Company XYZ Desktop Support BenchmarkSample report only. Data is not accurate.
28 Years of IT Service and Support Benchmarking Data
194© MetricNet, LLC, www.metricnet.com
More than 3,700 Benchmarks
Global Database
30 Key Performance Indicators
More than 70 Industry Best Practices

Company XYZ Desktop Support BenchmarkSample report only. Data is not accurate.
Meet a Sampling of Our Clients
MetricNet Conducts benchmarking for Desktop Support groups worldwide, and across virtually every industry sector.
195© MetricNet, LLC, www.metricnet.com

Company XYZ Desktop Support BenchmarkSample report only. Data is not accurate.
196
www.metricnet.com 703.992.8160 [email protected]
You Can Reach MetricNet…

Thank You!
CompanyX Y ZCompanyX Y Z