Desk Study - Climate Change
66
UNDP/GEF project Reducing transboundary degradation in the Kura Ara(k)s river basin Desk Study - Climate Change
Transcript of Desk Study - Climate Change
UNDP/GEF project Reducing transboundary degradation in the Kura Ara(k)s river basin
Desk Study - Climate Change

- 2 -
UNDP/GEF PROJECT
REDUCING TRANSBOUNDARY DEGRADATION IN THE
KURA ARA(K)S RIVER BASIN
Desk Study - Climate Change
Tbilisi, Georgia – Baku, Azerbaijan – Yerevan, Armenia
September 2013

- 3 -
DESK STUDY 2 CLIMATE CHANGE The Climate Change Desk Study for the Kura Ara(k)s river basin, executed in the framework of the UNDP/GEF project “Reducing transboundary degradation in the Kura Ara(k)s river basin” focuses on providing an update overview of available understanding on issues of climate change in the Kura Ara(k)s basin. The information presented in the Climate Change Desk Study primarily is based on the three countries’ Second National Communications (SNC) to the United Nations Framework Convention on Climate Change (UNFCCC), prepared under the guidance of the responsible Ministries in Armenia, Azerbaijan and Georgia in 2009-2010. The Climate Change Desk Study provides the background baseline information towards analysing priority environmental issues as influenced by the cross-cutting issue of climate change that are transboundary in nature. The assessment of the impacts (both environmental and socio-economic) of climate change issues, and the identification of institutional, legal and policy issues that need to be addressed, is integrated in the Updated Transboundary Diagnostic Analysis (TDA). The Updated TDA as comprehensive analysis of transboundary issues provides a factual basis for the formulation of recommended options in the Strategic Action Program (SAP) towards improving the environmental situation and ensuring the sustainable development of the Kura Ara(k)s River Basin. The views presented in this document do not necessarily coincide with or represent the views of the United Nations (UN), the United Nations Development Program (UNDP), the United Nations Office for Project Services (UNOPS), the Global Environment Facility (GEF), or of the project countries Armenia, Azerbaijan, Georgia, but is the sole view of the authors and contributors to this report. Colophon
Project title Reducing transboundary degradation in the Kura Ara(k)s river basin
Financing Global Environment Facility
Implementing Agency UNDP United Nations Development Programme
Executing Agency UNOPS United Nations Office for Project Services
Chief Technical Advisor / Project Coordinator
Dr Mary M. Matthews
Report Editors Harald J.L. Leummens & Mary M. Matthews
Lead Author Tim Hannan
Contributions Tamuna Gugushvili, Farda Imanov, Medea Inashvili, Tigran Kalantaryan, Sahib Khalilov, Harald Leummens, Mary Matthews, Hamlet Melkonyan.
Suggested citation Hannan T., Leummens H.J.L. & Matthews M.M., 2013. Desk study – Climate Change. UNDP/GEF project “Reducing transboundary degradation in the Kura Ara(k)s river basin”, Tbilisi-Baku-Yerevan, 2013, 66 pp.

- 4 -
TABLE OF CONTENTS 1 INTRODUCTION ........................................................................................................................ 6 2 HYDROLOGY & CLIMATE OF THE SOUTH CAUCASUS ....................................................... 7 3 METHODS OF ANALYSIS ....................................................................................................... 11 4 CLIMATE CHANGE IN ARMENIA ........................................................................................... 12
4.1 Geographical and socio-economic characteristics ............................................................ 12 4.2 Climate .............................................................................................................................. 12 4.3 Resources ......................................................................................................................... 14 4.4 Extreme climate related events ......................................................................................... 17 4.5 Observed changes in climate ............................................................................................ 18 4.6 Forecast climate change impacts ...................................................................................... 22 4.7 Summary of impacts and adaptation ................................................................................. 26 4.8 General considerations for adaptation ............................................................................... 28
5 CLIMATE CHANGE IN AZERBAIJAN .................................................................................... 29 5.1 Geographical and socio-economic characteristics ............................................................ 29 5.2 Climate .............................................................................................................................. 30 5.3 Resources ......................................................................................................................... 30 5.4 Extreme climate related events ......................................................................................... 33 5.5 Observed changes in climate ............................................................................................ 34 5.6 Forecast of climate change impacts .................................................................................. 36 5.7 Summary of impacts and adaptation ................................................................................. 37
6 CLIMATE CHANGE IN GEORGIA ........................................................................................... 41 6.1 Geographical and socio-economic characteristics ............................................................ 41 6.2 Climate .............................................................................................................................. 41 6.3 Resources ......................................................................................................................... 42 6.4 Extreme climate related events ......................................................................................... 46 6.5 Observed changes in climate ............................................................................................ 47 6.6 Forecast climate change impacts ...................................................................................... 48 6.7 Summary of risks, impacts and adaptation measures in DTR ........................................... 54 6.8 National considerations for meeting the climate change challenge ................................... 55
7 SUMMARY FOR THE KURA ARA(K)S BASIN ....................................................................... 56 7.1 Background to climate change impacts ............................................................................. 56 7.2 Summary of climate change indicators .............................................................................. 57 7.3 Recent climate change ...................................................................................................... 57 7.4 Forecast changes in climate .............................................................................................. 58 7.5 Summary of climate change impacts and adaptation ........................................................ 59 7.6 Conclusions ....................................................................................................................... 63
8 LITERATURE ........................................................................................................................... 65

- 5 -
LIST OF ABBREVIATIONS AND ACRONYMS
ADB Asian Development Bank AM Armenia AM-MNP Ministry of Nature Protection of Armenia ArmStat Armenian Statistical Service of Republic of Armenia AZ Azerbaijan AZ-MA Ministry of Agriculture of Azerbaijan AZ-MENR Ministry of Ecology and Natural Resources of Azerbaijan AZ-NWS Azerbaijan National Water Strategy AzerStat State Statistical Committee of the Republic of Azerbaijan BCM Billion cubic meters CENN Caucasus Environmental NGO Network CRM Climate Risk Management DTR Dedoplistskaro Region (of Georgia) EBRD European Bank for Reconstruction and Development FAO United Nations Food & Agricultural Organization FNC First National Communication GCM Global Circulation Model GDP Gross Domestic Product GeoStat National Statistics office of Georgia GE Georgia GEF Global Environment Facility GE-MEnNR Ministry of Energy and Natural Resources of Georgia GE-MEPNR Ministry of Environment Protection and Natural Resources of Georgia GFDRR Global Facility for Disaster Reduction and Recovery GHG Greenhouse Gas GSL Global Sea Level GWh GigaWatt hours HPP Hydropower plant HTC Hydrothermal Coefficient IMF International Monetary Fund IPCC International Panel on Climate Change IRSWR Internal Renewable Surface Water Resources ITC Faculty of Geo-Information Science and Earth Observation, University of Twente JSC Joint Stock Company KWth Kilo Watt hour MCM Million cubic meters MW Megawatt NEA National Environment Agency of Georgia NGO Non-Governmental Organization PA Protected Area PPP Public Private Partnership / Purchasing Power Parity SAP Strategic Action program SIDA Swedish International Development Cooperation Agency SNC Second National Communication TB Transboundary TDA Transboundary Diagnostic Analysis UNDP United Nations Development Program UNFCCC United Nations Framework Convention on Climate Change UNOPS United Nations Office for Project Services USAID United States Agency for International Development WB World Bank WEAP Water Evaluation and Planning

- 6 -
1 INTRODUCTION This document is the Climate Change Desk Study prepared as part of the Transboundary Diagnostic Analysis (TDA) for the UNDP/GEF project “Reducing Transboundary Degradation in the Kura Ara(k)s River Basin”. Unless otherwise stated, information in this document, with the exception of the maps which have been prepared by the project, is based on the Second National Communications (SNC) to the UN Framework Convention on Climate Change (UNFCCC), prepared by each of Armenia, Azerbaijan and Georgia in 2010. While the SNCs for each country cover a wide range of topics related to climate change, such as emissions and emission reduction targets, the underlying document focuses on climate change impacts on water resources and transboundary water resources management. The document discusses each country’s vulnerability to climate change with regard to water resources and the potential for adaptation to the impacts of climate change. For further information and deeper treatment of the subjects, the reader is referred to the relevant SNC documents. Each of the chapters related to the three SNC documents opens with a brief synopsis of the topographic and climatic conditions of the country, plus a short treatment of the socioeconomic situation as well as a section on resources in the country. These are important to the assessment of climate change because of the impacts on the economy from climate change and the types of adaptation approaches that may be taken. The final chapter brings the three countries back together to discuss the changing climate and its impacts on the Kura Ara(k)s Basin.

- 7 -
2 HYDROLOGY & CLIMATE OF THE SOUTH CAUCASUS The Kura Ara(k)s River Basin covers 190,190 km2 and is shared by 5 countries, as indicated in Table 2.1. The basin share of the UNDP/GEF Kura Ara(k)s project countries Armenia, Azerbaijan and Georgia is 65.4%. Figure 2.1 shows a map of the Kura Ara(k)s river basin with its key features - countries, cities, rivers and forest areas indicated. Table 2.1 Country shares of the Kura Ara(k)s Basin.
Country Total country surface in 2010 (km2)*
Country surface area in basin (km2) ** % of country % of basin
Armenia 29,740 29,740 100.0 15.6 Azerbaijan 86,600 60,020 69.3 31.6
Georgia 69,700 34,560 49.6 18.2 Turkey 783,560 28,790 3.7 15.1
Iran 1,745,150 37,080 2.1 19.5
Total 2,714,750 190,190 7.0 100.0
Notes: * Source: World Bank (2012); ** Source: FAO (2009) Figure 2.1 Map of the South Caucasus outlining the Kura Ara(k)s river basin.
Note: Prepared by the UNDP/GEF Kura Ara(k)s project (2012).
Ara(k)s
Ara(k)s

- 8 -
With a length of 1,515 km the Kura river is the main water course in the South Caucasus, and the main water artery of the Kura Ara(k)s basin. The river originates in eastern Turkey and flows through Georgia and Azerbaijan before entering the Caspian Sea at Neftchala (Azerbaijan). The Ara(k)s river is the main tributary of the Kura river, it has a length of 1,070 km, and also starts in eastern Turkey. Flowing downstream, it forms the border between Turkey and Armenia, Armenia and Iran and Azerbaijan and Iran before meeting the Kura river near Sabirabad (Azerbaijan). Numerous large, medium and small tributaries enter the Kura or Ara(k)s rivers in Georgia, Armenia and Azerbaijan, including transboundary (TB) ones, the main of which include:
• In Georgia: Paravani, Potskhovistskali, Liakhvi, Aragvi, Debed-Khrami (TB Armenia). • In Armenia: Akhuryan (TB: Turkey), Hrazdan, Arpa (TB: Azerbaijan), Vorotan/Bazarchay (TB:
Azerbaijan), Voghji/Okhchu (TB: Azerbaijan). • In Azerbaijan: Debed-Khrami (TB: from Armenia through Georgia), Aghstev/Agstafachay (TB:
Armenia), Tavush/Tovuz (TB: Armenia), Alazani/Ghanik (TB: Georgia), Iori/Qabirri (TB: Georgia). Hydrological records directly downstream of the confluence of the Kura and Ara(k)s Rivers (Surra Hydrological Station, Azerbaijan) show a mean annual flow of 15.45 BCM over the period 1950 to 2010. Abstractions for irrigation and other uses have significantly lowered the natural flow volume compared to natural conditions. It has been estimated that the average annual runoff of the Kura Ara(k)s river at Surra under undisturbed conditions was 26.5 BCM, as evidenced by monthly measurements from the period 1937-1945. Under natural conditions, between 47% and 58% of the annual flow occurs during the spring season, resulting largely from melting snow from the winter, providing for a very seasonal flow regime. Inter-annual variation is also high, with annual flows ranging from 6.2 BCM to 25.6 BCM at the Surra hydrological station between 1950 and 2010. The South Caucasus region is characterized by a predominantly mountainous environment, with the highly varied topography ranging from high mountain peaks up to 5,500 GSL, to upland and lowland plains, to sea coasts making up both the northwest and southeast boundaries, with the Caspian Sea at about -27 meters below GSL. Most of the region is above 1,000 GSL. The location between the Black Sea and the Caspian Sea and its mountain topography are the main controls of the climate of the region. The climate - temperatures and precipitation - varies considerably across the South Caucasus region, affected by elevation as well as by the moderating effects of the Black and Caspian Seas. The Greater Caucasus range protects the region from colder air descending from the north. Precipitation shows a regional trend of increased wetness in the northwest, near the Black Sea coast, decreasing gradually toward the southeast approaching the Caspian Sea coast. Figure 2.2 shows the mean annual temperature across the South Caucasus region, while Figure 2.3 shows the mean annual precipitation. Considering the region in more detail from northwest to southeast, the Black Sea coastal zone is characterized by a humid subtropical climate. The mean annual temperature is 15°C, with extremes ranging from -15°C in December to +45°C in July. The Black Sea influences the climate of western Georgia, providing for mild winters, hot summers and abundant precipitation, which varies from 600 mm in the coastal lowlands to 1,500 mm - 2,500 mm annually in the mountainous and high mountainous areas. Moving eastward through Georgia, the inter-mountain upland plains are dry continental, with an alpine climate at higher elevations. Mean annual temperature is 11°C to 13°C on the plains, and 2°C to 7°C in the mountains. Minimum temperatures reach -25°C on the plains and -36°C in the mountains. In the very high mountains (such as the slopes of Mount Kazbegi) the absolute temperatures range from +42°C to -42°C. Mean annual precipitation is 300 to 800 mm on the plains and 800 to 1,200 mm in the mountains.

- 9 -
Figure 2.2 Spatial variation in mean annual temperature in the Kura Ara(k)s basin countries Armenia, Azerbaijan and Georgia.
Source: ZOI (2011).
Figure 2.3 Spatial variation in mean annual precipitation in the Kura Ara(k)s basin countries
Armenia, Azerbaijan and Georgia.
Source: ZOI (2011).

- 10 -
Throughout the Armenian part of the basin the climate is equally varied, with climatic zones ranging from arid subtropical to cold high-mountain. The country mean annual temperature is 5.5°C, ranging from 12°C - 14°C in the upland plains & valleys to below zero above 2,500 GSL. Summers in Armenia are temperate, with a mean July temperature of 16.7°C. The central Ararat Valley however is much hotter, with mean summer temperatures of 24°C to 26°C, and absolute maximum temperatures reaching 43°C. Winters are cold, with January having a mean temperature of -6.7°C and an absolute minimum temperature of -42°C. Winters in the northeastern and southeastern parts of the country are more temperate. The mean annual precipitation in Armenia is 592 mm, declining to 200 to 250 mm in the most arid zones of the Ararat Valley and the southern Meghri region. In the Ararat Valley the average monthly precipitation during summer does not exceed 36 mm. The high mountain regions are wetter, with mean annual precipitation in the range of 1,000 mm. For Azerbaijan, the country mean annual temperature is 13°C, highly variable across the country and seasons. In the Great Caucasus mountains of the northern Kura Ara(k)s basin, as well as the mountains of the Lesser Caucasus, the climate is typical temperate mountainous, with mean annual temperatures ranging from 2°C to 4°C, and absolute minima and maxima reaching -42°C and +42°C, respectively. At altitudes above 2,500 m the mean annual temperature typically falls below 0°C. The upland plains of western Azerbaijan are dry and subtropical, showing mean annual temperatures of 11°C-13°C. Summers are warm, with mean July temperatures varying between 15°C-20°C, and winters are cold, with mean January temperatures between -4°C and -7°C. Further east, in the lowland plains of Azerbaijan between the confluence of the Kura and Ara(k)s rivers and the Caspian Sea, the mean annual temperature reaches 15°C-16°C. Winters are generally warm, with January temperatures around 0°C, and summers hot, with average temperatures near 22°C. The country mean annual precipitation for Azerbaijan is 1,200 mm but, as with temperature, precipitation has high spatial and seasonal variability, with monthly amounts ranging from 23 mm in June to 218 mm in September. Precipitation in Azerbaijan’s Greater Caucasus range varies between 1,200-2,000 mm, of which much falls as snow in winter months and, at the highest elevation, may not completely melt during the summer, causing the formation of glaciers. In the Lesser Caucasus precipitation varies between 800-1,200 mm, reducing further to 300-800 mm annually in the upland plains of western Azerbaijan, to a low of 200-350 mm in the eastern Kura Ara(k)s lowland plains and the Absheron peninsula. Precipitation in the Azerbaijan Kura Ara(k)s lowlands accounts for only 15% to 50% of potential evapotranspiration, providing for dry-steppe and semi-desert landscapes and making irrigation a necessity for agricultural production.

- 11 -
3 METHODS OF ANALYSIS The analysis presented in this document is adapted from the three SNC documents to the UNFCCC which were submitted by each of Armenia, Azerbaijan and Georgia in 2009 and 2010. The analyses of the changing climate as presented in all three of the SNCs were based on a similar method, though there were some differences in approach due to national priorities and differences in climatic and topographic conditions. As a first step, the climate (mainly temperature and precipitation) of the last several decades (depending on the length of record) was analyzed to determine trends in the data that may indicate that climate change is already ongoing. Secondly, the period 1961 to 1990 was analyzed using simple statistical properties of mean, standard deviation, etc. for temperature, precipitation and wind direction. Accordingly, the average climatic conditions for the defined ‘baseline period’ were obtained, and accepted as a ‘climatic norm’. Subsequently, identical climate statistics for the period 1991 to the most recent data available (2005 to 2008) were analyzed, after which the two time periods were compared to conclude on any possible statistically significant differences between the two periods. The countries diverted in the years selected for inclusion in the ‘baseline period’: Azerbaijan and Armenia considered the years 1961 to 1990, while Georgia defined the years 1955 to 1970 as the ‘baseline period’. Also the countries varied in the number of years considered for the characterization of the ‘most recent period’: Armenia applied a time-series approach with individual years compared to the ‘baseline period’, while Azerbaijan and Georgia averaged a number of recent years, being 1991-2000 and 1990-2005 respectively. Finally, MAGICC/SCENGEN (5.3v2) computer software was used for developing climate change scenarios. The software allows averaging the output of several Global Circulation Models (GCMs) to assess global warming, which is considered more robust than using the individual results of only one GCM. Results of scenario analyses were average for the time periods 2021-2050 and 2070-2100 for Armenia and Azerbaijan, while Georgia used a variable approach for different parameters analyzed, but all typically considering 2100 as final date. Scenario analyses were completed for temperature and precipitation, while occasionally also wind speed & direction were included. Other approaches were used to assess impacts on humidity and related factors such as evaporation and evapotranspiration, water resources, and others. The following chapters summarize the results of the climate change analysis in each of the countries, immediately relevant to climate change impacts in the Kura Ara(k)s Basin. The final chapter summarizes the results to elaborate on the overall impacts for the basin as well as potential adaptation approaches.

- 12 -
4 CLIMATE CHANGE IN ARMENIA The Republic of Armenia ratified the UNFCCC in 1993. Since that time Armenia has been fully engaged with the process as a non-Annex I Party member, and participates in international cooperation and regional programs related to climate change. The First National Communication of the Republic of Armenia was prepared and submitted to the Fourth Conference of Parties to the Convention in 1998 while the SNC was submitted in 2010. 4.1 Geographical and socio-economic characteristics Armenia is the most mountainous country of the South Caucasus Republics, characterized by a complex relief and varied natural conditions. More than 90% of its land area is located above 1,000 m GSL, and the average country altitude is 1,800 GSL (FAO, 2006). About 40% of the country is located at elevations exceeding 2,000 GSL, and only 3% of the country lies below 650 meters (USAID, 2009). The highest point, the top of mount Aragats, is 4,095 m while the lowest point is at 380 m in the southeast where the River Araks flows out of Meghri gorge (FAO, 2006). Land use distribution for 2011 shows agricultural lands at 69.8%, forested land at 11.5%, protected natural areas at 10.2%, water surfaces at 0.9%, settlements, industries, communications, transport and other civil infrastructure at 5.4% and others at 2.2%. Despite the relatively small area of forest and protected area, Armenia has rich biodiversity with more than 100 species per square kilometer. Following a growth in the years immediately after the break-up of the Soviet Union, between 1993 and 2003 the population of the Republic of Armenia has been declining, due to a combination of emigration and low birth rates (natural growth of population per thousand people declined from 15.6 in 1990 to 3.2 in 2006). Since 2004 the population started slowly to increase, up to 3,274,300 in 2011 (data provided by National Experts). The average population density is 110 persons per km2, although large variations occur due to the mountainous terrain as well as the varying level of economic development. It ranges from a maximum of 686 persons per km2 at elevations below 1,000 GSL to a minimum of 22 persons per km2 at elevations above 2,000 GSL. In 2011, 65% of the population was classified as urban and the remaining 35% as rural. Following the transition period after the economic decline of the early 1990s, Armenia reached a state of economic stability and growth. Yearly economic growth in the period 1995 to 2000 averaged 5.4%, to increase to 12.4% between 2001 and 2006. Related to the global economic recession since 2008, in 2009 Armenia’s economy showed a strongly negative growth, to rebound to 4.4% in 2011, exceeding the global average for advanced economies. Based on the National Statistics Service of the Republic of Armenia, Armenia's gross domestic product (GDP) in 2011 was estimated at $US 10.14 billion, with a per capita GDP of $US 3,102 (ArmStat, 2012). The sectoral contribution to the GDP in 2011 was: industrial production (including construction) at 35.6%, agriculture at 17.2% and services at 47.2% (ArmStat, 2012). 4.2 Climate The complex mountainous terrain of Armenia creates great variation in climates across the country, ranging from arid subtropical to cold high mountainous. Climate conditions predominantly are moderate, with summers cool or warm, and winters cold or humid (figure 4.1). High fluctuations in annual and daily temperatures are characteristic of the climate in Armenia. While the average annual temperature for the country is 5.5°C, this varies from 12 to 14°C in Alaverdi and Meghri to below zero at altitudes above 2,500 m. Summer in Armenia is temperate, with the country’s average July temperature at 16.7°C, varying from about 22–26°C in the lowlands of the Ararat valley, to 16–20°C in the mid-mountainous zones, to being below 10°C in the highland zone. Absolute maximal temperature ranges from 42°C to 20°C. Large daily temperature

- 13 -
fluctuations occur in summer in the Ararat valley where the air temperature rises to +42°C in day-time, and falls to +20°C at night. Winters are cold, and January is the coldest month, with an average country temperature of -6.7°C. Depending on altitude and peculiarities of relief, the January mean daily temperature ranges between +1° and -13°C, absolute minima range from -20°C to -45°C (FAO, 2006; AM-MNP, 2010). Figure 4.1 Climate zones in Armenia.
Map source: The Acopian Center for the Environment, American University of Armenia. In USAID (2009). The average annual precipitation for the country is 592 mm. The most arid zones are the Ararat Valley and the Meghri region, where the average annual precipitation does not exceed 300 mm. The maximum amounts of precipitation are recorded in high mountainous areas in the central part of the country, around 1,000 mm per year (figure 4.2). The highest precipitation is observed between May and June. The distribution of snow cover is also unequal. In the foothill zone of the Ararat valley a stable snow cover is not observed every year and its height does not exceed 10 cm, whereas in the highlands the duration of a stable snow cover is 5–6 months and its height reaches 2 m (FAO, 2006; AM-MNP, 2010). Solar radiation, the most important climate factor, is very intense. At noon in the Ararat valley, each cm2 of the surface receives on average 1.46 calories of heat per minute. The intensity of solar energy increases in line with the increase in altitude. At 3,000 m it increases to 1.54 cal/cm2. The annual duration of sunlight in the Ararat valley and Sevan basin reaches about 3,000 hours; in the mid-mountainous forest areas of the north – about 2,000 hours (FAO, 2006). The relief greatly affects the duration and the features of the seasons. The frost-free period in the lowlands and the foothills is more than 220 days, in mid-mountainous areas about 150 days, and in highland zones 60 days. The longest season in the lowland regions is summer (4–5 months), in mid-mountains the seasons coincide with calendar seasons, while in the highlands winter lasts for six months (FAO, 2006).

- 14 -
Figure 4.2 Precipitation zones in Armenia.
Map source: The Acopian Center for the Environment, American University of Armenia. In USAID (2009). Analyzing the water balance of Armenia as a whole, mean annual precipitation for the period 1961 to 1990 is 17.6 BCM, while total evapotranspiration amounted to 10.5 BCM, resulting in a total river runoff in the country of 7.1 BCM. Accordingly, evapotranspiration represents 60% of total precipitation. Evapotranspiration is not explicitly assessed in the climate change reports. Meanwhile, annual evaporation losses from Lake Sevan in the period 1961 to 1990 were 1.076 BCM. Considering the other components of the water balance - 457 million cubic meters (MCM) in precipitation and 758 MCM in runoff flowing into the lake - evaporative losses represent 89% of total input. 4.3 Resources 4.3.1 Surface Water All rivers in Armenia are tributaries of the main rivers of the South Caucasus - the Araks and the Kura, with about 74% of Armenia part of the Araks river basin and 24% of the Kura river basin (FAO, 2009). The main tributaries discharging to the Araks river are Akhuryan, Metsamor, Hrazdan, Azat, Vedi, Arpa, Vorotan, Vokhchi, Mehgri. The main tributaries discharging to the Kura river are Debed, Aghstev, Hakhum, Tavush, Khndzorut (UNDP/SIDA, 2005). Armenia is both an upstream and a downstream riparian state. The Araks is the main river in Armenia, entering Armenia from Turkey. The Araks initially forms the border between Turkey and Armenia and, further downstream, between the Islamic Republic of Iran and Armenia, before flowing into Azerbaijan. In Armenia some 9,500 mainly small- and medium-sized rivers occur, with a total length of 23,000 km, all joining either the Kura or Araks river. Out of that number 379 rivers are around 10–100 km long, and seven, namely the

- 15 -
Akhuryan (186 km), Debed (176 km), Vorotan (178 km), Hrazdan (146 km), Aghstev (121 km), Arpa (128 km) and Metsamor-Kasakh, are longer than 100 km (FAO, 2009).The river network density varies from 0 to 2.5 km/km2. The inflow from Turkey from the Akhuryan and Araks combined is estimated at 2.51 BCM/year, based on average monthly observations at the Surmalu hydrological station for the period 1964-2010. Total outflow from tributaries to the Kura – via Georgia or Azerbaijan - is estimated at 1.33 BCM annually, and to the Araks at 6.60 BCM/year (FAO, 2009) for a total outflow from Armenia of 7.93 BCM. Located in Armenia, Lake Sevan is by far the largest lake in the Kura Ara(k)s basin but it also constitutes the single most important water resources ‘structure’. In its natural state it covered 1,416 km2 and stored a volume of 58.5 BCM. The average annual runoff through the rivers in its catchment area is 720 MCM, while on average an additional 50 MCM enters the lake as subsurface inflow. At present Lake Sevan covers an area of 1,276 km2 and stores a volume of almost 38 BCM. 4.3.2 Major Water Resources Infrastructure Lake Sevan is the largest lake in the region but it also constitutes the single most important water resources ‘structure’ in Armenia. The decision to develop the lake as a water resource - by building the Hrazdan river hydroelectric cascade and an irrigation system for 80,000 ha in the Ararat Valley, in parallel to developing 1,000 km2 of lands for agriculture on the former lake bed following the drop in the lake’s water level - resulted in major damage to the lake. By the start of the 21st century the lake level had decreased more than 19 meters while the volume was reduced by 44% to 33 BCM. Attempts to restore the lake’s water resources included:
• Constructing the Kechut Reservoir close to Jermuk city, combined with a 48.97 km long tunnel to bring annually 250 MCM of water from the Arpa River water to Lake Sevan, which started operation in 1983.
• Building the new reservoirs of Aparan (90 MCM) and Azat (70 MCM), which combined with the Mkhchian and Ranchpar large pump stations served as a substitute for Lake Sevan water to irrigate the Ararat Valley.
• Limiting discharges from the lake to 160 MCM annually for irrigation purposes. • Building a second tunnel, 18km in length, to divert 160 MCM of water from the Spandaryan Reservoir
on the Vorotan River. This tunnel however was never put into operation because of the importance of the Vorotan water resources for the Vorotan Cascade of hydro power plants, which also serve the nuclear power plant operation in winter season.
So far, lake restoration has not been successful, but consideration continues to be given to restoring Lake Sevan as a strategic resource. There are many other dams and reservoirs in Armenia, the most important of which are listed in table 4.1 below. Lakes in Armenia have a total storage volume of 1.35 BCM. 4.3.3 Groundwater In Armenia, the available fresh groundwater resources are assessed at about 11 mln m3/day (127 m3/s), equal to about 4 km3/year. The annual strategic subsurface water resource is estimated as 1,100 mln m3. Secured usable resources of groundwater from 34 deposits in Armenia total 102.27 m3/s (3.2 km3/year), used for drinking, irrigation and other economic purposes (UNDP/GEF, 2007). Other estimates range from 1.0 km3 (AM-MNP, 2006) to 4.3 km3, of which 1.4 km3 enters the rivers as subsurface drainage (FAO, 2009) and 1.6 km3 through springs (Harutyunyan, 2012). The transboundary groundwater inflow to Armenia is assessed at 1.2 km3, the transboundary groundwater outflow at 1.1 km3 (Harutyunyan, 2012). 4.3.4 Energy In Armenia, total in-country energy production in 2011 amounted to 7,432.7 GWh. As Georgia, Armenia is a net energy exporter, about 15% of the total production, while the remaining – 6,351.0 GWh – is used in the country. The production of electricity is rather equally divided over the nuclear power station, hydropower plants, and thermal power plants. Thermal and nuclear power generation are both water consumers, though recycling is common. Hydropower is not a significant water consumer, but hydropower plants, even micro-hydropower, are often very damaging to the river environment.

- 16 -
Table 4.1 Major Reservoirs in Armenia.
Reservoir Purpose Height (m) Total Storage Volume (MCM)
Akhuryan Irrigation 59.00 510.00 Spandaryan Energy 83.00 257.00
Arpilich Irrigation/Energy 16.00 105.00 Tolors Energy 69.00 96.80 Aparan Irrigation 50.60 91.00
Azat Irrigation 77.00 70.00 Joghaz Irrigation 60.00 43.80 Her-Her Energy 71.50 26.00 Kechout Irrigation 48.00 23.00 Karnout Irrigation 34.50 22.60 Shamb Energy 41.00 13.60
Hakhoum Irrigation 46.00 12.00 Mantash Irrigation 30.40 8.20 Sevaberd Irrigation 42.00 6.00 Tavshud Irrigation 37.00 6.00 Khalavar Irrigation 31.00 5.50 Metsavan Irrigation 7.00 5.40 Tavoush Irrigation 42.40 5.30
Sarnakhpiur Irrigation 29.20 5.00 Vardakar Irrigation 16.20 5.00 Yerevan Irrigation 28.00 4.80
Kaps Irrigation 12.00 4.00 Aknalich Irrigation 4.50 3.90 Aygedzor Irrigation 36.00 3.50
Angechakot Irrigation 35.00 3.40 David-Beck Irrigation 41.20 3.20
Zangakatun (Sovietashen) Irrigation 35.60 1.40 Getik Irrigation 7.00 1.30
Gegardalich Irrigation 13.80 1.20 Tsilkar Irrigation 13.00 1.20
Hatsashen Irrigation 7.30 1.10 Kakavadzor 2 Irrigation 33.40 1.10
HPPs in Armenia produce 33% of the country’s yearly needs, equal to about 2,450 GWh, while the potential of hydro-power is estimated at 21,800 GWh: large and medium rivers – 18,600 GWh; small rivers – 3,200 GWh (Armhydroenergyproject JSC, 2008). To increase the portion of electricity generated by hydropower, related to a future decommissioning of the nuclear power plant, a significant expansion of HPPs is envisioned. In 2012 the construction of the Meghri HPP (130 MW; 800 GWh) was initiated on the Araks River. Also the Government of Armenia is conducting negotiations with the World Bank on financing feasibility studies and the construction of two other large HPPs - Shnogh HPP (75 MW; 300 GWh) on the Debed River; and Loriberd HPP (66 MW; 200 GWh) on the Dzoraget River. In 2011, in total 115 small HPPs were operational, with an installed capacity of about 158 MW, producing about 520 GWh electricity. Licenses for another 88 SHPPs (177 MW; 637 GWh) are issued, and the further expansion with 108 SHPPs (134 MW) is under consideration (AM-MENR, 2012). Future growth in energy demands will require an expansion of power production and, with rising fuel costs and the initiatives to reduce greenhouse gasses (GHGs), hydropower is a likely source as long as there are sufficient water resources, and environmental conditions allow using them.

- 17 -
4.3.5 Agriculture About 70% of Armenia – 2,077,000 ha - is agricultural land, including arable & perennial crops, hay-lands as well as natural pastures. Arable lands cover 21.6% of all agricultural lands, of which 36.2% was left fallow in 2011 (ArmStat, 2012). Arable lands are used for cereals (55.0%), forage crops (23.2%), potato (10.0%) and vegetables (8.7%). Agriculture in Armenia is dominated by household farming, providing 96.9% of the gross output in 2011 (ArmStat, 2012), from on average 0.14 ha arable land per capita. Commercial farmers are involved in livestock farming (95.5%), predominantly poultry. In 2011, agriculture provided 17.2% of the GDP and employed 38.9% of the economically active population (ArmStat, 2012). Of agricultural lands, 7.4% is irrigated, or 156,400 ha (Harutyunyan, 2012), down from 280,000 ha in the early 1990s, mainly due to issues on land privatization and financial difficulties to cover maintenance costs (WB, 2007). Despite this, irrigated agriculture provides about 80% of the total revenue generated by agriculture in Armenia, equal to almost 14% of GDP, and is therefore an important part of the economy. Dryland farming in Armenia is considered to be very high risk farming, due to the fragmented mountainous terrain, active exogenous processes, and inadequate level of moisture. In addition, as a result of the non-rational use of land resources, around 80% of land plots are characterized by desertification processes and various levels of land degradation. Agriculture suffers from huge losses due to dangerous climatic phenomena, the frequency and duration of which have increased during the last decades. 4.3.6 Forestry Forest land in Armenia is 343,100 ha, or 11.5% of the total land area (ArmStat, 2012), about 288,000 of which are actually covered by forests (FAO, 2006). Forest areas are found in fragmented patches, mainly on steep slopes at elevations between 550 and 2,400 GSL. The majority of the forest areas (62.5%) are found in the northeast of the country. Mass cutting of trees for energy during the energy crises in the 1990s had serious negative impacts on forests and forestry. Afforestation and reforestation efforts have been ongoing since 1998, regenerating 21,500 ha between 1998 and 2006. 4.4 Extreme climate related events Armenia is one of the most disaster-prone countries in the southern Caucasus. The country is vulnerable to disasters due to both natural hazards, including earthquakes, droughts, floods, landslides, avalanches, mudslides, strong winds, snowstorms, frost and hail; and technological hazards, including transport and industrial accidents (GFDRR, 2010). The present report focusses on water-related extreme climate events – floods and drought, based on the Armenia Climate Risk Management (CRM) Report (UNDP, 2010). 4.4.1 Flooding Armenia rivers discharge between 55% and 70% of the annual water volume during spring, during the snowmelt period. The mountain environment and the steep slopes of river channels provides for rapid runoff and high rates of flow often to become floods. Accordingly seasonal, damaging flooding is a feature observed in many parts of Armenia, particularly in the Ara(k)s, Hrazdan, and Aghstev river basins. When snowmelt is coincident with rainfall, the risk and magnitude of both flooding and mudflow increases dramatically. April to August is typically the most dangerous period for floods, and flooding appears to have increased over the last several decades due to deforestation and urbanization. In some regions, such as the Meghri and Vedi river basins, and near Goris flash floods occur once every two to three years. Large floods in 2004 caused an estimated damage of US$10 million, while the 2005 flooding is estimated at US$5 million. The single flood event of June 1997 affected 7,000 people and caused an economic loss of US$8 million. The average annual loss due to floods is estimated at $US 0.7 million (GFDRR, 2010). More than half of Armenia is susceptible to mudflow, especially the medium-altitude mountainous areas, but also the cities of Yerevan and Kapan. Between 2004-2007 mudflows damaged some 200 settlements and 600 sites on main transportation routes (WB, 2009). The GFDRR estimates that mudflow damages during this period amounted to US$5.7 to 7.1 million (GFDRR, 2010).

- 18 -
4.4.2 Droughts Drought hazard is significant in Armenia. Among the recent events, the 2000-2001 drought affected 297,000 people and reportedly caused damage of $100 million (GFDRR, 2010), with precipitation 28% below normal for the summer period and 65% below the annual norm. Summer temperatures were 2.2oC to 6oC above average. River flow decreased by 40% to 50%, and the August to September runoff was 31% less than the previous year. As a result, 88% of the farming communities suffered damages. Wheat and barley harvests reduced by 27%, and 60% of fodder crops and grasses were lost, causing a shortage of seed and feed. As much as 54,000 ha of mountain grasslands were destroyed and pasture productivity decreased by 48%. The population in the rural areas (35% of the population) needed food assistance. Chronic malnutrition increased among children to 22%, and drinking water supply between May and September decreased by 35%. Considering that agriculture accounts for 17.2% of the GDP and that over half of the population depends directly on agriculture for their livelihoods, the 2000-2001 drought resulted in a 2.7% loss of the total GDP and 10.1% of the agricultural sector’s contribution to the GDP. Meanwhile, the cost of relief operations amounted to US$90 million. The impact of that drought period was felt for several years more. The meteorological drought ended in 2002 as the precipitation returned to normal, but the impacts, including low river flows as well as the socio-economic impact continued through 2003. The drought increased vulnerability to other natural hazards, such as the loss of soil moisture and increased vulnerability to floods and mudflows. The spread of pests also contributed to the longevity of the impacts of the drought. Overall, the average annual loss due to droughts is estimated at US$6 million (GFDRR, 2010). Drought also reduces hydroelectric power production, constituting 33% of total electricity production, as river flows reduce and water is diverted to irrigation and other, more immediate uses. 4.5 Observed changes in climate 4.5.1 Temperature Figure 4.3 shows the annual air temperature in Armenia from 1929 to 2007 presented as deviations from the mean established for the period 1961-1990. It is apparent from Figure 4.3 that after 1994 all deviations are positive, showing an obvious warmer period. The 10 year running mean shown on the figure confirms the sudden trend upwards starting in the mid-1990s. The linear trend indicates that an upward movement in mean annual temperatures has been ongoing over a longer period already. The trend line indicates an increase in the mean annual temperature of 0.85°C over the 78 year period. Figure 4.3 Armenia - deviations of average annual air temperature (1929 to 2007) from the
average value for 1961-1990.
Source: Armenia Second National Communication to the UNFCCC (2010).

- 19 -
Much of the increase in average annual temperature is caused by an increase during the summer months. Comparing Figure 4.4 and Figure 4.5 shows that a positive trend is largely observed in summer months (June, July, August), a trend which is absent in the winter months (December, January, February). Also mean summer temperatures appear to have increased more rapidly than the average annual temperature over the times series concerned. During the last 15 years summer deviations from the average summer temperature for 1961-1990 were positive, with summers having been extremely hot in 1998, 2000 and 2006, with the summer of 2006 recorded as the hottest ever in Armenia for the entire period 1929-2007. The observation that climate change resulted largely in temperature increases in the summer has the implication that the growing season is impacted. Significantly higher temperatures during the summer result in higher evapotranspiration rates, meaning a greater potential for crop water stress in rain-fed areas, and higher water demands in irrigated areas. Figure 4.4 Deviations of summer temperatures (1934 to 2008) from average values for 1961-1990.
Source: Armenia Second National Communication to the UNFCCC (2010).
Figure 4.5 Deviations of winter temperatures (1935 to 2007) from average values for 1961-1990.
Source: Armenia Second National Communication to the UNFCCC (2010).

- 20 -
4.5.2 Precipitation Figure 4.6 shows the deviations of the average annual country precipitation from the average observed for the period 1961-1990. It is apparent that precipitation has been largely below the mean since 1980. Mean annual precipitation across the country as a whole has declined by 6% over the last 80 years, but the geographical distribution of these changes is very uneven. The northeastern and central (Ararat Valley) regions have become more arid, while the southern and northwestern areas and the Lake Sevan basin showed an increase in precipitation. Figure 4.6 Armenia - deviations of average annual precipitation (1935 to 2007) from the average
values for 1961-1990.
Source: Armenia Second National Communication to the UNFCCC (2010).
Precipitation falling as snow, an important composite of total annual river flow, was also analyzed. Comparing the statistics for 1961 to 1990 with those of the 1991 to 2006 period shows a declining trend for this parameter, predominantly noted (20-70 mm) at altitudes above 1,700-1,800 GSL. However, some areas of the country, notably the Dzoraget, Meghri and the Lake Sevan basins, show some increase in precipitation in the form of snow. 4.5.3 Extreme events Monitoring of extreme hydro-meteorological events showed that in recent decades the intensity and frequency of hazardous meteorological phenomena has increased. Figure 4.7 presents the observed annual frequency of the selected extreme events frost, hail, heavy rainfall and strong winds - during the period 1975 to 2006, each of which showed a trend of increased occurrence. Figure 4.7a show the number of frosts per year increasing over the whole of the study period by 1.2 additional cases per year. A separate trend analysis shows that this value increases to 1.8 cases per year for the last 20 years.

- 21 -
Figure 4.7 Number of annual extreme hydro-meteorological events in Armenia for 1975-2010.
Frost
Hail
Strong winds
Heavy rain
Source: Armenia Second National Communication to the UNFCCC (2010). 4.5.4 Water resources A comparison of river flows was made for the periods of 1961-1990 and 1991-2006, based on annual volumetric data from 33 observation points on 28 rivers. The analysis shows that river flows increased for some rivers, and decreased for others. Rivers showing an increase in annual discharge, albeit mainly a small one (less than 3%), are located mainly in the eastern and northeastern part of the country, where precipitation is also showing an increasing trend. They include the Dzoraget, Tavush, Kirants and Vedi Rivers as well as the middle and lower basins of the Hrazdan and Kasakh Rivers and the eastern and western rivers of the Lake Sevan basin. For the other rivers of the country declining trends of the flow are observed, in the order of 3-5%. Table 4.2 provides details for selected rivers. Insufficient data were available to execute a similar analysis for groundwater. In the majority of the rivers in Armenia, the maximum flow has shown a 3-5% declining trend, except for Aghstev, Hrazdan, Marmarik and Dzknaget Rivers, where a very small increase in the maximum flow is observed. Declining trends in minimum flow were observed in Voghji-Kapan, Vorotan-Vorotan, Azat-Garni observation points - up to 3% per year. In Dzoraget, Tavush, Karjakhbyur, Vardenis, Gavaraget, Bakh tak, Argiji and Meghri Rivers the decline is very small. Relatively small rising trends of the minimum flow are noted in Pambak, Aghstev, Marmarik, Masrik, Martuni and Arpa Rivers.
0
20
40
60
80
100
120
140
1970 1975 1980 1985 1990 1995 2000 2005 2010
0 5
10 15 20 25 30 35 40 45 50
1970 1975 1980 1985 1990 1995 2000 2005 2010
0 5
10 15 20 25 30 35 40 45
1970 1975 1980 1985 1990 1995 2000 2005 2010
0 5
10 15 20 25 30 35 40 45
1970 1975 1980 1985 1990 1995 2000 2005 2010

- 22 -
Table 4.2 Comparison of the average annual river flows for 1961-1990 and 1991-2006.
River & observation point
Average flow (MCM)
1961-1990 1991-2006 Changes
m3 %
Pambak-Tumanyan 336.1 385.2 49.1 14.6 Debed-Ayrum 1063.4 1045.2 -18.0 -1.7 Aghstev-Dilijan 107.1 99.7 -7.4 -6.9
Akhuryan-Akhurik 225.8 255.2 29.4 13.0 Hrazdan-Hrazdan 243.4 254.6 11.2 4.6
Argiji-Verin Getashen 192.3 180.8 -11.5 -6.0 Masrik-Tsovak 102.2 106.0 3.8 3.7 Arpa-Jermuk 168.3 163.0 -5.3 -3.1
Meghriget-Meghri 93.8 80.9 -12.9 -13.8 Voghji-Kapan 379.6 255.8 -123.8 -32.6
Source: Armenia Second National Communication to the UNFCCC (2010). 4.6 Forecast climate change impacts 4.6.1 Climate change scenarios Climate change forecasts were made based on the A2 and B2 standard climate change scenarios. The scenarios define the expected growth in GHGs, which in turn determine the rate of change of the climate. A2 and B2 are generally considered the most likely scenarios. The A2 climate change scenario is considered the most likely, though not the most optimistic. It is characterized by:
• A world of independently operating, self-reliant nations. • A continuously increasing population. • Regionally oriented economic development.
The B2 scenarios assume a world more divided, but also more ecologically friendly, characterized by:
• A continuously increasing population, but at a slower rate than in A2. • The emphasis on local rather than global solutions to economic, social and environmental stability. • Intermediate levels of economic development. • Less rapid and more fragmented technological change than in other scenarios.
The forecasted impacts of the selected scenarios are described for a number of climate parameters in the following sections. 4.6.2 Temperature For Armenia, both GCMs forecast significant and continuous increases in temperature, as does also the combined mean from the GCMs. All GCMs indicate significant warming throughout the year, though the increase in temperature is predicted to be somewhat higher in the summer months. Climate change modeling for Armenia for mean annual temperatures is shown in Table 4.3 for the A2 and B2 climate scenarios. The A2 is a more severe scenario, but even under the B2 scenario forecast temperature increases are on the order of 1°C by 2030, 3°C by 2070 and 5°C by 2100 across the country.

- 23 -
Table 4.3 Changes in annual average country temperature in Armenia according to the MAGICC/ SCENGEN model under the IPCC scenarios A2 and B2.
Temperature increase (°C)
Year A2 B2
2030 1.1-1.2 1.0-1.1
2070 3.2-3.4 2.9-3.0
2100 5.3-5.7 4.8-5.1
Table 4.4 Changes in annual average country precipitation in Armenia according to the MAGICC/ SCENGEN model under the IPCC scenarios A2 and B2.
Precipitation change (%)
Year A2 B2
2030 -2 to -6 -2 to -6
2070 -6 to -17 -3 to -15
2100 -10 to -27 -8 to -24
The MAGICC/SCENGEN model has a relatively low spatial resolution and the results are averaged over the entire territory of Armenia. To obtain more in-depth information with increased spatial resolution, the A2 scenario was additionally investigated using the PRECIS model. The PRECIS results were similar to those of the MAGICC/SCENGEN model. In summary, a continuous increase in temperature is expected to be observed in Armenia, with more significant increases predicted for the spring and summer months, at 5-7oC. In the western and central regions of the country, particularly in the Ararat Valley, still higher temperature rises are expected, while in the southern Syunyats Uplands the increase in temperature is envisioned to be more moderate. 4.6.3 Precipitation For Armenia, both GCMs forecast a decrease in precipitation for the 21st century, under both the A2 and B2 climate change scenarios, as shown in Table 4.4. The two scenarios are fairly similar in the magnitude of rainfall reduction, with A2 slightly more severe in the later years. Equal to the temperature analysis, the A2 scenario was investigated further using the PRECIS model for precipitation. This allowed obtaining a greater spatial resolution to look at variations across the country. Table 4.5 shows the results of the PRECIS analysis. The PRECIS results show a great variation in predicted future changes across the country, ranging from positive (increase in precipitation) to negative changes. In summary, for 2030 the precipitation changes vary from +15% to -13% depending on the area of the country. The northeast and east tend to be areas with increased precipitation. Snow cover is also important for Armenia as it forms a significant portion of river flow during the main high flow period of the year. The models forecast a decrease in the volume of precipitation in the form of snow amounts to 7-11% by 2030, 16-20% by 2070 and 20-40% by 2100, compared to the average for 1961-1990. The biggest changes will be recorded at altitudes of 1,700-1,800 meters and higher, which are the main areas of river flow formation. While not specifically analyzed, changes in temperature and in precipitation both impact evaporation and transpiration. As both parameters are predicted to show increased rates, this will result in increased losses from reservoirs, lakes and bare soils, as well as increased water use by plants, both natural vegetation and crops. Increased crop water use will also increase water demands for irrigation.

- 24 -
Table 4.5 Deviations of future seasonal and annual precipitation (%) compared to the average for 1961-1990, according to PRECIS model under the A2 scenario.
Region Winter Spring Summer Autumn Annual
2030 North east 7 2 -9 7 3 East shore Lake Sevan -7 -4 -9 -2 -8 West shore Lake Sevan 7 4 -5 5 4 Shirak -11 -11 -7 -4 -8 Aparan-Hrazdan -11 -7 -11 -7 -9 Ararat valley -13 -9 -13 -9 -11 Vayk -11 -11 -9 4 -7 Syunik 15 11 5 15 11 Aragatz 11 11 2 13 9 Armenia -3 -3 -7 1 -3
2070 North east 15 4 -18 15 7 East shore Lake Sevan -15 -7 -18 -4 -11 West shore Lake Sevan 15 11 -11 11 6 Shirak -21 -21 -15 7 -16 Aparan-Hrazdan -21 -15 -21 -15 -18 Ararat valley -25 -18 -25 -18 -22 Vayk -22 -22 -18 7 -13 Syunik 29 22 11 29 22 Aragatz 22 22 4 -25 18 Armenia -5 -5 -14 3 -6
2100 North east 20 5 -25 20 10 East shore Lake Sevan -20 -10 -25 -5 -15 West shore Lake Sevan 20 10 -15 15 10 Shirak -30 -30 -20 -10 -22 Aparan-Hrazdan -30 -20 -30 -20 -25 Ararat valley -35 -25 -35 -25 -30 Vayk -30 -30 -25 10 -18 Syunik 40 30 15 40 30 Aragatz 30 30 5 35 35 Armenia -7 -8 -19 3 -9
Source: Armenia Second National Communication to the UNFCCC (2010). 4.6.4 Water resources Climate change forecasts for river flow in Armenia show a reduction of 6.7% by 2030, 14.5% by 2070 and 24.4% by 2100 compared to the baseline period of 1961-1990, as shown in Table 4.6. Lake Sevan is the most important water body in Armenia, being the largest lake in the region and providing irrigation water to a large portion of the irrigated lands in Armenia, while also serving as source for domestic and industrial water supplies. Climate change forecasts indicate at significant changes to the water balance of Lake Sevan, with severe consequences for the lake and the water users who rely on it. Table 4.7 shows the changing water balance of Lake Sevan due to climate change. Table 4.8 takes table 4.7 a step further into a water balance.

- 25 -
Table 4.6 Forecast changes in total river flow.
Year Flow (MCM) Changes in Flow
MCM % Deviation 1961-1990 4,994.4 0.0 0.0
2030 4,660.9 -333.5 -6.7 2070 4,269.9 -724.5 -14.5 2100 3,777.6 -1,216.8 -24.4
Source: Armenia Second National Communication to the UNFCCC (2010). Table 4.7 Forecasted changes in the Lake Sevan water balance.
Year Precipitation Evaporation Surface Flow
MCM % Deviation MCM % Deviation MCM % Deviation 1961-1990 457 1076 758
2030 449 -1.7 1158 +7.6 665 -12.2 2070 445 -2.6 1192 +9.7 559 -26.3 2100 436 -4.6 1268 +17.8 449 -40.7
Source: Armenia Second National Communication to the UNFCCC (2010). Table 4.8 Water balance for Lake Sevan with climate change.
Year Inputs (MCM) Outputs (MCM) Balance (MCM) 1961-1990 1215 1076 139
2030 1114 1158 -44 2070 1004 1192 -188 2100 885 1268 -383
Source: Armenia Second National Communication to the UNFCCC (2010). In table 4.8 the “Balance” column is the amount of water available for use, such as flows into the Hrazdan river for environmental flows, irrigation and the hydroelectric cascade, as well as municipal and industrial water supply. Currently (based on the 1960-1990 scenario) there are 139 MCM of water annually available. Under climate change conditions, the water balance is negative by 2030 and becomes more extremely so as time and the impacts of climate change progress. Modeling the forecast of water balance elements changes for the entire country shows that the river flow in Armenia, compared to the average for 1961-1990, will decrease by 0.48 BCM by 2030, 1.03 BCM - by 2070 and 1.73 BCM - by 2100 (table 4.9). Table 4.9 Water balance elements of Armenia’s water resources and their forecasted changes.
Year Precipitation (BCM) Evaporation (BCM) River flow (BCM) 1991-2006 17.60 10.50 7.10
2030 17.29 10.67 6.62 (-6.8%) 2070 16.83 10.76 6.07 (-14.5%) 2100 16.26 10.89 5.37 (-24.4%)
Source: Armenia Second National Communication to the UNFCCC (2010).

- 26 -
4.7 Summary of impacts and adaptation 4.7.1 Agriculture Anticipated future climate change will add additional high risks to Armenia’s agricultural sector, a sector already depending on irrigation for most of its production, in a country where the fragmented mountainous terrain does not lend itself easily to expanding irrigation on a large scale. Analyses show that as a result of climate change, soil humidity in Armenia will decline by 10-30%, crop moisture availability will decline by 7-13%, and the overall water deficit of the land will increase by 25-30%. Accordingly, rain-fed farming in the foothills and lower mountains of Armenia will become more vulnerable. Based on scenarios to 2030, a yield decline for the main agriculture crops is forecasted - 9-13% for cereals, 7-14% for vegetables, 8-10% for potato and 5-8% for fruits. An overall 4-10% yield decrease is also forecasted for the pasture grasslands, increasing to 19-22% for the most valuable pastures in the sub-alpine and alpine zones. In summary, anticipated climate change will result in less water available for irrigation, in increased evapotranspiration rates and related higher water volumes per unit of production, in reduced soil moisture and the increased potential for soil degradation. All of these are phenomena which have already been observed over the last few decades. The overall increased drought hazards, both in irrigation as well as in dry-land farming, will increase the risks to farmers and to the country’s food security. To adapt to consequences of climate change, the SNC recommends the following adaptation measures:
• Select and introduce more drought- and heat-resistant species and hybrids, including protecting and disseminating traditional local species best adapted to drought and heat.
• Expand the use of high mountain pastures and reduce their relative per unit loads. • Redesign crop rotation pattern to accommodate for declining soil fertility. • Shift farming to areas with more moisture. • Apply water saving irrigation technologies. • Introduce crop species and varieties better resistant to diseases and pests. • Implement hail and flood protection measures. • Ensure early warning on extreme hydro-meteorological events. • Revise the vaccination practice of livestock.
4.7.2 Biological diversity and natural ecosystems Climate change is envisioned to result in the expansion of desert, semi desert and arid sparse forest areas, due to a vertical upward shift of their current upper limits, at the expense of the subsequent following ecosystem. Also an upward shift of steppe ecosystems – the most common ecosystem in the country, occurring between 1,000-2,400 m. – is predicted, by 250 to 300 m, as a result of which their area will shrink significantly. Also meadow ecosystems, characteristically occurring in Armenia’s relative moist high mountain zone above 2,000 m, are envisioned to decrease in area, as precipitation is forecasted to decrease and any further upward shifting is not possible. Considering the plasticity and flexibility of ecosystems, it can be envisioned that any of them is capable to expand to new areas, to form new habitats characterized by a new structure and species composition than at present. With climate change, more than 17,000 hectares of forest (5-5.5%) may disappear due to growing conditions becoming less favorable for forests. Worsening sanitary conditions, mass outbreaks of diseases and pests and larger risk of forest fires can have additional negative impacts on forest ecosystems. On the other hand, an upward shifting of the upper forest boundaries could be envisioned, related to improving climatic conditions. However, the current intensive use in the sub-alpine meadow zone may hamper any successful establishment of trees and forests at higher altitudes. In order to mitigate the consequences of climate change on natural ecosystems, the SNC recommends implementing the following measures:

- 27 -
• Enforce grazing norms and rules in areas used as pastures and grasslands. • Properly zone Protected Areas to account for the natural shifting of ecosystems upwards by 200-
250 m., including establishing proper buffer zones to improve their adaptation capacity. • Establish regular monitoring of flora and fauna, re-assess risks at a regular basis and incorporate
recommendations in decision making on establishing and expanding PAs. • Restore degraded forest ecosystems and improve their adaptation capacity - reforest 5,000
hectares of degraded forest areas and create 600 hectares of agricultural forest protection zones during the period of 2009-2020.
• In order to control the development of forest pests and diseases, organize regular forest phyto-sanitary control studies and implement integrated measures, such as treating forests from the air.
4.7.3 Settlements and infrastructure Extreme weather events are characteristic to Armenia. They cause significant damage to Armenia's population, economy and infrastructure. More than 2,500 landslide-prone areas have been identified in the country, covering a total surface area of 1,221 km2 (4.1% of the country), and 233 out of the total 931 communities in Armenia have already suffered damages from landslides. In more than 100 of the damaged communities landslides are especially active and have caused damages to hundreds of residential houses, communication lines and vital objects. About 3.2% of the motorway network and 0.5% of the railway network have also suffered damages. Additionally, extensive areas in Armenia are prone to mudflows, with the damage caused between 1994 and 2007 assessed at over US$17.5 million. Meanwhile, flooding caused additional damages for more than US$41 mln. The following measures are recommended by the SNC to reduce risks of damages from landslides, mudflows and floods:
Landslides: • Design and construct dams and reservoirs protecting settlements and infrastructure. • Regularly clean the river beds, widen or heighten the banks and reinforce them. • Create water collection and water drainage constructions or improve the existing ones. • Plant forests or other vegetation on the slopes, as well as carry out terracing, fencing or netting. • Strictly control and regulate irrigation and site development licenses.
Mudflows, floods and spring inundations: • Conduct “phyto-melioration” (plant trees, shrubs, grasses) in river basins characterized by frequent
mudflows and floods, and construct anti-mudflow and anti-flood barriers. • Install automatic warning observation points and mudflow observation points; develop modern
methods of short term and long term forecasting of floods, mudflows and spring inundations. • Revitalize snow packs.
4.7.4 Human health Climatic conditions in the most densely populated areas of Armenia are very intense in July and August. The population suffers from heat stress, and anticipated climate change will further increase the risk of heat and sunstroke. More frequent heat waves can also be expected, further aggravating discomfort. Climate change is expected to increase the risks of vector borne diseases: cholera, plague, tularemia, malaria, acute intestinal infections as well as a number of other diseases. Also the risks increase that diseases currently unknown in Armenia will emerge, entering from neighboring countries, such as Crimean-Congo fever, West Nile fever, Sindis fever and Tyagin fever. In order to prevent and mitigate the consequences of climate change on the population's health, comprehensive social, behavioral, sanitary, preventive and administrative measures need to be taken.

- 28 -
4.8 General considerations for adaptation In order to support the improvement of overall water resources management in Armenia, several projects were implemented with the financial assistance of international organizations during the last decade. While to some extent the implemented measures have promoted the adaptation of water resources to climate change, implemented measures so far have been insufficient and not yet adequate, and accordingly it is necessary to continue measures for stronger resilience building. In three main categories the following measures are envisioned to further mitigate the consequences of envisioned climate change:
1) Accurate assessment of water reserves: • Refurbish, modernize and streamline the hydrological observation network. • Re-establish the monitoring of floods, mud flows, snow water content and other characteristics of
snow cover. • Re-establish the monitoring of groundwater. • Prepare a new reference data book on water resources. • Develop water and water system balances for individual river basins. • Improve methodologies to assess the natural flow regime to better understand water resources
availability.
2) Technological improvements: • Improve river flow regulation by increasing the volumes of existing reservoirs and constructing new
reservoirs. • Reduce losses in the irrigation and domestic water supply systems through repairs of the systems
and pipelines. • Accumulate moisture (water) in irrigated fields through storage of snow or snow melt water. • Replenish moisture through early spring sowing of crops in rows, deepening irrigation ditches and
using polyethylene covers. • Use advanced agro-technical measures and irrigation methods (drip & subsurface irrigation, pivot &
sprinkler irrigation, subsurface drip-pipe and mole irrigation). • Introduce water saving technologies.
3) Institutional reforms:
• Develop procedures for taking climate change factors into account during the assessment of water demand.
• Introduce legal, economic and administrative incentives for reducing leakages from drinking water and irrigation water systems, and to promote water saving.
• Introduce water saving technologies. • Initiate legislative changes to promote water saving. • Develop procedures for defining the priorities of water use by priority sectors considering climate
change impacts in river basin management plans.

- 29 -
5 CLIMATE CHANGE IN AZERBAIJAN The Republic of Azerbaijan ratified the UNFCCC in 1995 and joined the Kyoto Protocol in 2000 with a view to supporting initiatives towards mitigating climate change impacts. In order to facilitate the implementation of the Convention, by a resolution of the President of Azerbaijan the State Commission on Climate Change was established in 1997, the members of which include representatives of all related institutions and ministries. The first National Communication was prepared in 1998-2000 and submitted to the Fourth Conference of Parties of the UNFCCC. Azerbaijan submitted the Second National Communication in 2010. 5.1 Geographical and socio-economic characteristics The Republic of Azerbaijan covers an area of 86,600 km2. The main geographical features of Azerbaijan are the Caspian Sea forming its eastern boundary, the Greater Caucasus mountains to the north, forming the largest part of Azerbaijan’s border with Russia, the Lesser Caucasus mountains to the southwest, forming the border with Armenia, and the Talysh Mountains in the extreme southeast, part of the border with Iran. Ringed by mountains, the central part of the country is occupied by the Kura Ara(k)s lowland plain, largely in use for agriculture. The highest elevations occur in the Greater Caucasus, with peaks well above 4,000 GSL, and the lowest at the Caspian Sea coast, in the range of -27 GSL. Two rivers dominate the country, the Kura river entering Azerbaijan in the northwest from Georgia, and the Ara(k)s, entering from Armenia in the southwest and forming part of Azerbaijan’s border with Iran. The Kura and Ara(k)s meet in central Azerbaijan before flowing into the Caspian Sea. Key transboundary tributaries to the Kura river include the Debed/Khrami (TB: Armenia and Georgia), the Agstafachay/Aghstev (TB: Armenia), the Ganikh/Alazani (TB: Georgia), and the Qabirri/Iori (TB: Georgia). Transboundary tributaries to the Ara(k)s river include the Arpa, Bazarchay/Vorotan, Okhchu/Voghji (all TB: Armenia). Azerbaijan’s population has grown steadily and has reached 9.235 million people (2011), showing an annual growth rate of just over 1.0%. Of the total population, about 53% lives in urban areas. The economy is driven mainly by oil and gas production, but related industry such as chemicals and petrochemicals also contributes, as do textile production and the agro-industry. Industry (including oil and gas and related industries) contributed 62.2% of GDP, services (part of which are oil and gas related) contributed 32.3% and agriculture 5.5%. The GDP in 2011 was equal to US$63.4 billion, while the GDP per capita at purchasing power parity (PPP) reached US$7,003. Following years of double digit economic growth, the rate of growth slowed in 2010-2011 because oil production capacity had reached its peak. The agricultural sector consists mostly of cereals, fodder crops, vegetables, potatoes, fruit & berries, and market garden crops (AzerStat, 2011). Of the overall land area of 8.6 million ha, 55% is considered fit for cultivation. The climate of Azerbaijan, especially on the central Kura Ara(k)s Plain, is largely dry, requiring irrigation for agriculture. At present about 1.43 million ha are equipped for irrigation, but the impacts of inappropriate land tenure, poor irrigation management, including the deterioration of the irrigation infrastructure, as well as soil salinization resulting from ineffective drainage and overuse of water have affected a significant part of these (FAO, 2009). In 2011, 5.75 BCM of water were used for irrigation, 72% of the total water intake in Azerbaijan (AzerStat, 2012). Azerbaijan faces some challenging environmental problems, notably the pollution of the rivers with wastewater from local as well as transboundary sources, emissions of harmful substances and greenhouse gases from industrial plants and vehicles, improper disposal of solid municipal and industrial waste, including hazardous wastes, depletion of flora & fauna diversity, and a decline in forests and other natural ecosystems. The country’s soil cover has degraded as a result of wind and water erosion, soil salinity, waterlogging, chemical pollution and other processes associated with human activity. Erosion has affected some 3.7 million ha, of which 1.2 million ha of land are damaged by salinity from poor irrigation practice.

- 30 -
About 4,500 species of higher plants and 18,000 fauna species are found in the country, but human activities, including unregulated grazing of sheep and cattle, harvesting of rare and medicinal herbs by local communities and firms, poaching, and logging for firewood, have led to the depletion of biodiversity. Forests cover 11% of the country, but although statistics are unavailable, forest resources are assessed to have been affected by widespread subsistence logging for heating, a consequence of the shortages of gas and other sources of energy in rural regions. 5.2 Climate Azerbaijan generally has a mild and favorable climate. The mean annual temperature for Azerbaijan as a whole is 13°C but it is highly variable across the country. Elevation has the greatest influence on temperature, with cooler areas at higher elevations and warmer ones in the lower areas and near the sea coast. In the Great Caucasus mountains of the northern Kura Ara(k)s basin, as well as the mountains of the Lesser Caucasus, the climate is typical temperate mountainous, with mean annual temperatures ranging from 2°C to 4°C, and absolute minima and maxima reaching -42°C and +42°C, respectively. At altitudes above 2,500 m the mean annual temperature typically falls below 0°C. The upland plains of western Azerbaijan are dry and subtropical, showing mean annual temperatures of 11°C-13°C. Summers are warm, with mean July temperatures varying between 15°C-20°C, and winters are cold, with mean January temperatures between -4°-7°C. Further east, in the lowland plains of Azerbaijan between the confluence of the Kura and Ara(k)s rivers and the Caspian Sea, the mean annual temperature reaches 15°C-16°C. Winters are generally warm, with January temperatures around 0°C, and summers hot, with average temperatures near 22°C, and extremes over 30°C. Mean annual precipitation is 1,200 mm averaged across the country but, as with temperature, precipitation has high spatial and seasonal variability, with monthly amounts ranging from 23 mm in June to 218 mm in September. Precipitation is also influenced by elevation, overlain by a trend of decreasing wetness from the northwest towards the southeast, approaching the Caspian Sea coast. Precipitation in the Greater Caucasus range varies between 1,200-2,000 mm, of which much falls as snow in winter months and, at the highest elevation, may not completely melt during the summer, causing the formation of glaciers. In the Lesser Caucasus precipitation varies between 800-1,200 mm, reducing further to an annual 300-800 mm on the upland plains of western Azerbaijan, to a low of 200-350 mm in the eastern Kura Ara(k)s lowland plains. Data on evaporation and evapotranspiration have not been obtained. However, it is important to note that in many of Azerbaijan’s agricultural regions the annual rainfall amounts to only 15% to 50% of potential evapotranspiration, which ranges from 1,000 mm to 2,000 mm annually. This shows the need for irrigation in agriculture, as well as the potential impact of any increases in evapotranspiration rates on any future agricultural productivity. 5.3 Resources 5.3.1 Surface water In total Azerbaijan counts 8,350 rivers, distributed over 3 main river basins - the Kura basin, the Ara(k)s basin and rivers directly flowing to the Caspian Sea (AZ-MENR, 2012), creating an average river network density of 0.36 km/km2 (ADB, 2008). There are 21 transboundary rivers flowing into Azerbaijan. The main ones are the Ganikh/Alazani River, the Debed/Khrami, and the Qabirri/Iori from Georgia, the Astara from Iran, and the Agstafachay/Aghstev, Arpachay/Arpa, Bazarchay/Vorotan and Okhchu/Voghji as well as smaller tributaries from Armenia, all tributaries of the Kura and Ara(k)s Rivers. But the Kura and Ara(k)s rivers dominate as the largest and most important rivers from a water resources perspective. Of the overall Kura river length of 1,515 km, about 900 km are located on the territory of Azerbaijan. The Kura river’s annual average volumetric discharge upstream of the confluence with the Ara(k)s river is 11.45 BCM, while the mean annual volumetric flow for the Ara(k)s River upstream of the confluence with the Kura is 4.33 BCM, for a total of 15.45 BCM for the rivers combined downstream of the confluence near Sabiribad,

- 31 -
all for the period of intensive human water withdrawal 1950-2010. The average total Internally Renewable Surface Water Resources (IRSWR) in Azerbaijan amounts to 10.3 km3, of which 7.2 km3 is attributed to the Kura Ara(k)s basin (Rustamov & Kashkay, 1989). The overall estimated average annual surface water volume entering Azerbaijan from upstream countries amounts to 19.15 km3 (Hannan et al., 2013). Accordingly, in total 26.35 km3 of surface water is available in the Azerbaijan section of the Kura Ara(k)s basin, while the total water resources of Azerbaijan are estimated at about 39 BCM. Of this amount, total groundwater reserves are estimated at 8.8 BCM, of which, 4.35 BCM constitutes the base flow in the rivers, leaving only 4.45 BCM as a separate resource, as also confirmed by the groundwater Reserves Commission (AZ-NWS, 2011). The Kura and Ara(k)s Rivers provide about half of the drinking water and 60% of the irrigation water in Azerbaijan. As presented above, the main issue with surface water resources for Azerbaijan is that some 70-85% of available surface water resources originate from neighboring countries: on average 11.45 BCM from Georgia, 7.50 BCM from the Islamic Republic of Iran and 6.89 BCM from Armenia. The Samur River, with a mean annual discharge volume of 2.36 BCM, forms the border between Azerbaijan and the Russian Federation. While the Kura and Ara(k)s rivers enter Azerbaijan from Georgia and Armenia, both originate in Turkey. Additionally, Iran shares the Ara(k)s with Azerbaijan, the river forming part of their international border. As such, transboundary waters and associated uncertainties with regard to total available water resources are a major concern for Azerbaijan. The country’s total IRSWR are estimated at only 10.30 BCM annually (Rustamov & Kashkay, 1989). An additional concern is that surface water entering Azerbaijan already contains a pollution load. There are nearly 450 lakes – fresh and saline - in Azerbaijan, covering a total surface area of 394 km2, of which only 10 have a surface area exceeding 5 km2. The largest lake is Lake Sarisu, located in the Kura Ara(k)s lowlands, with a surface area of 65.7 km2 and a storage capacity of 59.1 MCM. Lake Jandargol/Jandara (12.5 km2; 54,280 m3) is a transboundary lake with Georgia (AZ-NWS, 2011). 5.3.2 Major water resources infrastructure Throughout Azerbaijan more than 140 reservoirs were constructed, mostly to serve irrigation and hydropower purposes (table 5.1). Dual or multi-purpose reservoirs in the Kura Ara(k)s basin include the Mingechevir, Shamkir, Yenikend, and Varvara Reservoir on the Kura, the Ara(k)s and Khudafarin Reservoir on the Ara(k)s river. Currently the overall storage capacity of water reservoirs in Azerbaijan is about 20.6 km3, mainly stored in reservoirs exceeding 100 mln m3. Of the stored volume, 12.4 km3 is useable, by far the greatest usable storage capacity in the Kura Ara(k)s basin. Reservoirs cover a surface area of 877 km2. The total capacity of hydroelectric power generation installed is exceeds 1,000 MW (AZ-NWS, 2011). Table 5.1 Major Reservoirs of Azerbaijan.
Reservoir Year Total storage
capacity (mln. m3)
Useable storage capacity (mln m3)
Dam height
(m)
Capacity (MW)
Mingechevir 1953 16,000 7,400 80 371 Shamkir 1983 2,400 1,425 70 380
Araz 1971 1,350 1,150 34 22 Serseng 1976 560 500 125 50 Yenikend 2000 158 136 24 150
Jeyranbatan 1958 186 150 Agstafachay 1969 120 109 52
Vaykhir 2005 100 71 5 Varvara 1952 62 10 12 17
Khanbulanchay 1976 52 45 64
Total 20,718 10,925 995
Source: Mammadov (2012); AZ-MENR (2012).
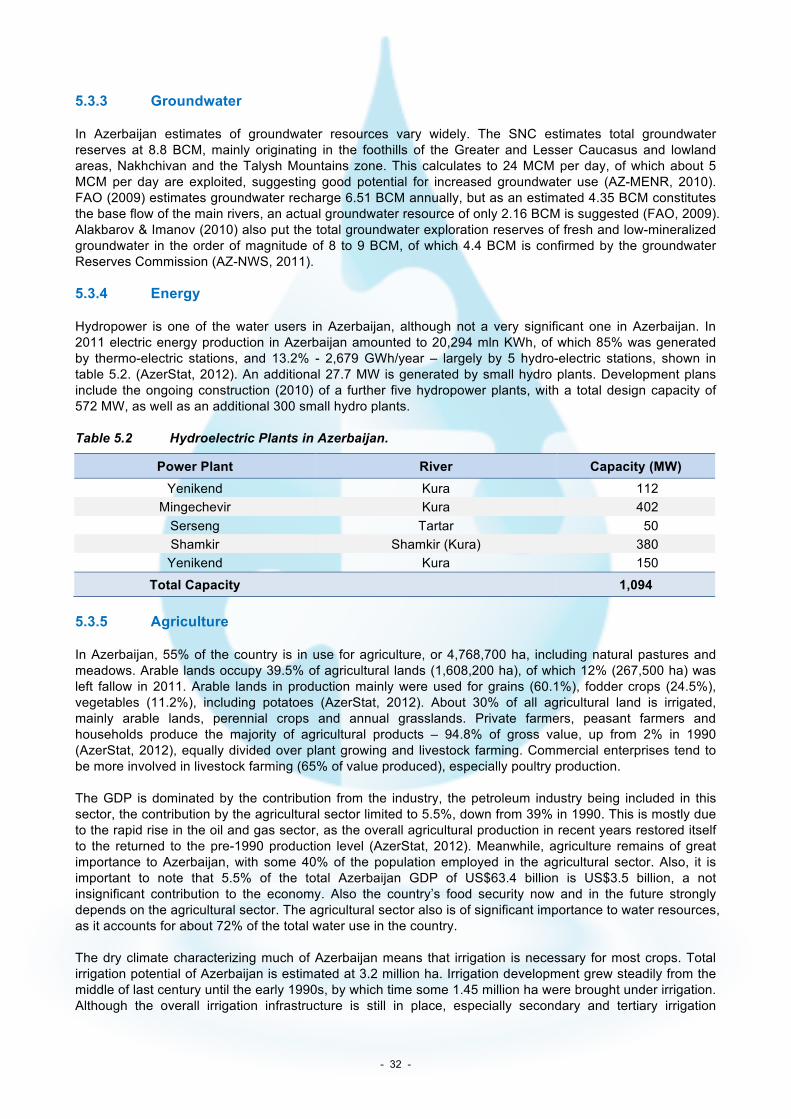
- 32 -
5.3.3 Groundwater In Azerbaijan estimates of groundwater resources vary widely. The SNC estimates total groundwater reserves at 8.8 BCM, mainly originating in the foothills of the Greater and Lesser Caucasus and lowland areas, Nakhchivan and the Talysh Mountains zone. This calculates to 24 MCM per day, of which about 5 MCM per day are exploited, suggesting good potential for increased groundwater use (AZ-MENR, 2010). FAO (2009) estimates groundwater recharge 6.51 BCM annually, but as an estimated 4.35 BCM constitutes the base flow of the main rivers, an actual groundwater resource of only 2.16 BCM is suggested (FAO, 2009). Alakbarov & Imanov (2010) also put the total groundwater exploration reserves of fresh and low-mineralized groundwater in the order of magnitude of 8 to 9 BCM, of which 4.4 BCM is confirmed by the groundwater Reserves Commission (AZ-NWS, 2011). 5.3.4 Energy Hydropower is one of the water users in Azerbaijan, although not a very significant one in Azerbaijan. In 2011 electric energy production in Azerbaijan amounted to 20,294 mln KWh, of which 85% was generated by thermo-electric stations, and 13.2% - 2,679 GWh/year – largely by 5 hydro-electric stations, shown in table 5.2. (AzerStat, 2012). An additional 27.7 MW is generated by small hydro plants. Development plans include the ongoing construction (2010) of a further five hydropower plants, with a total design capacity of 572 MW, as well as an additional 300 small hydro plants. Table 5.2 Hydroelectric Plants in Azerbaijan.
Power Plant River Capacity (MW) Yenikend Kura 112
Mingechevir Kura 402 Serseng Tartar 50 Shamkir Shamkir (Kura) 380 Yenikend Kura 150
Total Capacity 1,094 5.3.5 Agriculture In Azerbaijan, 55% of the country is in use for agriculture, or 4,768,700 ha, including natural pastures and meadows. Arable lands occupy 39.5% of agricultural lands (1,608,200 ha), of which 12% (267,500 ha) was left fallow in 2011. Arable lands in production mainly were used for grains (60.1%), fodder crops (24.5%), vegetables (11.2%), including potatoes (AzerStat, 2012). About 30% of all agricultural land is irrigated, mainly arable lands, perennial crops and annual grasslands. Private farmers, peasant farmers and households produce the majority of agricultural products – 94.8% of gross value, up from 2% in 1990 (AzerStat, 2012), equally divided over plant growing and livestock farming. Commercial enterprises tend to be more involved in livestock farming (65% of value produced), especially poultry production. The GDP is dominated by the contribution from the industry, the petroleum industry being included in this sector, the contribution by the agricultural sector limited to 5.5%, down from 39% in 1990. This is mostly due to the rapid rise in the oil and gas sector, as the overall agricultural production in recent years restored itself to the returned to the pre-1990 production level (AzerStat, 2012). Meanwhile, agriculture remains of great importance to Azerbaijan, with some 40% of the population employed in the agricultural sector. Also, it is important to note that 5.5% of the total Azerbaijan GDP of US$63.4 billion is US$3.5 billion, a not insignificant contribution to the economy. Also the country’s food security now and in the future strongly depends on the agricultural sector. The agricultural sector also is of significant importance to water resources, as it accounts for about 72% of the total water use in the country. The dry climate characterizing much of Azerbaijan means that irrigation is necessary for most crops. Total irrigation potential of Azerbaijan is estimated at 3.2 million ha. Irrigation development grew steadily from the middle of last century until the early 1990s, by which time some 1.45 million ha were brought under irrigation. Although the overall irrigation infrastructure is still in place, especially secondary and tertiary irrigation

- 33 -
channels have degraded due to the lack of maintenance. Due to the overuse of water and ineffective drainage systems, during the years more than 600,000 ha of irrigated lands became degraded, mostly affected by salinization resulting from increased groundwater levels (FAO, 2009) – 10% severely saline, 22% moderately saline, and 68% slightly saline (AZ-MA, 2012). Further degradation is ongoing as no mediation or rehabilitation is being implemented. An additional estimated 600,000 ha of steppe and semi-desert dryland also are affected by salinization, mainly the South-East Shirvan, Salyan and the Shirvan steppes. 5.3.6 Forestry The decline and degradation of forested areas is often cited as an issue of great importance in Azerbaijan. The decline is due to the shortage of other fuel sources through the 1990s driving rural people to harvest wood for fuels, a practice still continuing today. However, official statistics show that forests cover did not change since 1990, with forests in 2011 forests covering about 12% of Azerbaijan, or about 1,021,000 ha (AzerStat, 2012), of which an assessed 820,000 ha are located in the Kura Ara(k)s river basin (AZ-MENR, 2010), Meanwhile, the program "On forest restoration and expansion", developed by the AZ-MENR for the implementation and approved by Presidential Decree in February 2003, calls for the restoration of forests and reforestation in all regions for a total 69,700 ha between 2003 and 2008. The Tugai floodplain forests of Azerbaijan are a particular environmental concern. Their decline is attributed to a combination of changes in river flow regimes, due to discharge regulation and dike constructions, logging trees for fuel and other uses, and overgrazing. Initiatives have now started on investigating the needs to restore Tugai forests. From a water resources perspective, loss of forest cover changes the hydrological characteristics of the watershed, with an increase in surface runoff leading rapidly to an increase in soil erosion, higher sediment loads in rivers, affecting in turn reservoirs’ sedimentation rates, reducing their useful lives. Increased runoff rates also lead to higher flood peaks and an increased potential for flooding. 5.4 Extreme climate related events 5.4.1 Flooding Flooding frequently occurs in many parts of Azerbaijan, mostly on the southern slopes of the Greater Caucasus and the mountainous zone of Nakhchivan. While reliable information on floods and flood damages is sporadic, some evidence is available to quantify the frequency and impacts of flooding. Floods may occur in any season. In the Greater and Lesser Caucasus, floods occur mainly late in spring, typically generated by a combination of rainfall and snowmelt. In the lower reaches of the larger rivers, the Kura and Ara(k)s, floods commonly are associated with more regional storm events which may occur in any season of the year, but which are more common in late summer and early autumn. Perhaps the worst single flood event in Azerbaijan in recent years occurred in May 2010, when intense rainfall in the Kura Ara(k)s river basin caused major flooding in Azerbaijan, with the river rising to its highest level in 100 years, causing dam breaks and flooding in many riparian towns and villages. The hardest hit areas included the districts of Sabirabad, Imishli, and Saatli, near the confluence of the Kura and Ara(k)s rivers. The event affected as many as 70,000 people, with tens of thousands of homes destroyed and 50,000 hectares of farmland inundated. The average annual economic loss due to floods has been estimated to vary between US$5.7 mln (GFDDR, 2010) and US$18-25 mln (AZ-MENR, 2010). Table 5.3 indicates the scale of flood risk and damage in Azerbaijan. Mudflows associated with flooding are an added concern because they bring additional, usually permanent damages to the affected areas. Mudflows are mainly phenomena of the upper catchments where steep slopes result in the high velocity flows needed to carry high sediment loads. These are very damaging to property and to agricultural land because of the difficulty and cost of removing the mud, stone, rocks and other debris associated with it. The additional density of the flow also damages and destroys structures where water alone may not. Mudflows have increased over the last few decades because of erosion from increasingly deforested and otherwise degraded areas of the watershed.

- 34 -
Table 5.3 Recent Floods in Azerbaijan.
Date People affected Economic damage (*1,000 $US) 04-May-10 70,000 n/a 21-Sep-09 5,000 n/a 16-Apr-03 31,500 55,000 05-Jun-97 75,000 25,000 05-Oct-95 6,000 4,000 21-Oct-95 2,800 n/a 15-Jun-95 1,650,000 5,500
Deforestation is one of the contributing factors to flooding, as it reduces the natural ability of the watershed to absorb rain and snowmelt water, to release that water slowly into rivers. The hydraulic forces of the floods themselves cause erosion of the banks and floodplains, further amplifying the force and amount of mudflows. Much of the Kura River floodplain, especially the area downstream of the confluence with the Ara(k)s River is considered a high hazard area for floods, especially when peak flows from the Kura and the Ara(k)s coincide in the lower Kura basin. Anecdotal evidence indicates that before the construction of Mingechevir Reservoir (1953) and Shamkir Reservoir (1982) floods occurred yearly during the snowmelt period in spring, inundating large areas of agricultural land and settlements on the floodplain. The reservoirs apparently reduced flood peaks downstream, reducing the frequency of damaging flood events. Flooding additionally was reduced following the construction of flood protection works along the downstream part of the Kura river. Currently, there are some 1,800 km of flood protection structures, built by the Joint Stock Company “Azerbaijan Amelioration and Water Management”. 5.4.2 Drought Although drought has not led to loss of life in Azerbaijan, as floods and other natural disasters have, they have had a strong economic loss impact. The severe drought of 2000 is estimated to have caused economic losses of about US$100 mln. The average annual economic loss is estimated at US$6 mln (GFDRR, 2010). Drought also affects power production. Hydroelectric power constitutes about 15% of total electricity production in Azerbaijan, and drought periods reduce total energy output as river flows reduce and water is diverted to irrigation and other, more immediate uses. 5.5 Observed changes in climate 5.5.1 Temperature and precipitation The initial climate change analysis determined whether any changes could be inferred from monitoring data on current climate conditions compared to the past. As per standardized approach from the UNFCCC, the ‘baseline period’ of 1961-1990 was compared with the current data, the period 1991-2000. Temperature and precipitation data from 28 meteorological stations across the country, obtained from the National Hydrometeorology Department of AZ-MENR, were used by the Climate Change and Ozone Center to analyze average annual temperature and precipitation differences in seven regions (Table 5.4 and Table 5.5). Overall, it was concluded that while a notable variation among different regions was observed, Azerbaijan’s average country temperatures appear to have risen 0.5°C. Also the analysis showed that the rate of temperature rise has increased - while the rise in mean annual temperature over the 30-year period 1961-1990 was 0.34°C, the rise over the 10-year period 1991-2000 was 0.41°C, which is a factor 3 change in the rate of temperature rise. These findings are consistent with the results from climate modeling. Table 5.5 presents the unit of percentage change in precipitation in the regions. Comparing average precipitation for the same periods as for temperature shows an overall decline across the country, varying from 1.2% to 17.7%, with an average decrease in precipitation of 9.8%.

- 35 -
Table 5.4 Differences in mean annual temperature, comparing the periods 1961-1990 and 1991-2000.
Temperature Difference (°C)
Region Low High Mean
Kura-Ara(k)s Plain -1.12 +1.91 +0.49
Guba-Khachmaz -1.16 +1.72 +0.48
Shaki-Zagatela -1.26 +1.63 +0.48
Ganja-Gazhakh +1.1 +1.84 +0.74
Lankaran-Astara -1.10 +1.37 +0.43
Nakhchivan -2.07 +1.78 +0.47
Mean -0.71 1.71 0.52
Table 5.5 Differences in mean annual precipitation, 1961-1990 and 1991-2000.
Precipitation Difference (%)
Region B2
Kura-Ara(k)s Plain -14.3
Guba-Khachmaz -2.6
Shaki-Zagatela -6.4
Ganja-Gazhakh -17.7
Lankaran-Astara -1.2
Nakhchivan -17.1
Mean -9.8
5.5.3 Extreme events In the framework of preparing the SNC to the UNFCCC in 2010, an analysis on changes in flood frequency between 1966 and 2010 was completed. The results, presented in figure 5.1, show a dramatic increase in flood frequency in recent years. Probably also other variables other than climate change play a role, but the strength of the trend shows that the risk of flooding and expected damage deserves serious consideration for the future. Figure 5.1 Observed numbers of flood events per year in Azerbaijan, 1966-2010.
0
5
10
15
20
25
30
1966
1968
1970
1972
1974
1976
1978
1980
1982
1984
1986
1988
1990
1992
1994
1996
1998
2000
2002
2004
2006
2008
2010

- 36 -
5.6 Forecast of climate change impacts The assessment of future climate conditions was based on the standardized procedure as defined by the UNFCCC, using the PRECIS model developed by the UK Hadley Centre for Climate Change. Scenarios were defined for Azerbaijan based on a variety of emission scenarios determined from current GCMs, IPCC recommendations and the Hadley Centre’s experience with PRECIS modeling in the region. The present ECHAM4 data were selected as boundary conditions for the period 1961 to 2100 according to the A2 GCM scenario. The assessment was made for three periods based on the boundary conditions of:
• 1961 to 1990 (‘baseline climate period’) • 2020 to 2050 • 2070 to 2100
The model was verified against global information from the Climate Research Unit for 1961-1990. While there were differences in some areas, the baseline period climate was accurately simulated. 5.6.1 Temperature Modeling results of forecasted future temperature conditions showed an anticipated average annual temperature increase for the period 2021-2050 for Azerbaijan as a whole to be 1.5°C to 1.6°C, while in the coastal zone and in the western Nakhchivan the increase could be as much as 1.7°C. The rate of temperature increase in this first half of the century could be about 0.3°C per decade, which is consistent with the observed temperature rise of 0.4°C in the period 1990-2000. For the period 2070-2100 the mean annual temperatures are modeled to rise by 3°C to 6°C for most of the country, compared with the baseline period 1960-1990. In Nakhchivan the increase is predicted to be larger, 5.4°C to 5.7°C. Also the maximum temperatures are predicted to rise, by 2°C to 7°C. As current maxima vary between 44°C and 46°C, this indicates at maxima of 47°C to 53°C in the period 2070-2100. 5.6.2 Precipitation The same modeling exercise as described above also resulted in estimates of changes in precipitation. Precipitation is forecasted to increase by 10% to 20% during the period 2021-2050, compared with the baseline period 1961-1990, varying from 0 to 10% in Nakhchivan to 20% in the eastern part of the country. No areas of the country show a decrease in precipitation. Under this scenario the difference between precipitation and potential evaporation will increase from 0.4 to 1.2 mm per day – indicating a precipitation surplus over crop water needs - for the whole of the Kura Ara(k)s basin. For the period 2070-2100, precipitation is forecast to rise between 20% and 80% from west to east across the country. However, doubts have been expressed on the accuracy of this particular model, especially as the analysis of past climate changes between 1960 and 2010 in fact shows a decline in precipitation. 5.6.3 Water resources The impact of climate change on water resources was estimated in the First National Communication (AZ-MENR, 1999). Surface water resources are projected to reduce by 23% between 2021 and 2050, reducing to 22.5 BCM annually, with the estimated annual water shortage to amount to 4.0 BCM. In the period 2071-2100, annual water resources are modeled to reduce further to 20.7 BCM, or 29% lower than the average annual amount for the baseline period. Accordingly, annual water shortages will worsen to 10.3 BCM. The conclusions on the forecasted decline in water resources do not coincide with predicted large increases in precipitation across Azerbaijan, as discussed above. Analysts have raised doubts over the applicability of the PRECIS model to the regions, as other models have indicated a future 15-20% reduction of water resources, also confirmed by analyses of long term trends in precipitation and run off by regional specialists. As obviously uncertainties are large, changes will need to be monitored and the forecasts to be updated as time progresses.

- 37 -
Glaciers, mostly found in the Gusarchay Basin in the Greater Caucasus, are a contributor to the overall water resources of Azerbaijan. Over the last 110 years their surface area has decreased from 4.9 km2 to 2.4 km2 and the rate of decline will accelerate as temperatures increase. Their loss will have a major impact on the water resources of the country. 5.7 Summary of impacts and adaptation 5.7.1 Water resources The sectors of agriculture, hydropower and municipal water supply will be the most vulnerable to changes in water resources availability in the future. Already at present periods of water scarcity are observed, mostly due to large amounts used for irrigation, in the amount of 10 to 12 BCM annually. Although the area under irrigation has declined in the last 20 years, it may be expected that the sector will expand again in future, driven by increased populations, rising food demands in combination with climate change. Anticipated climate change impacts on agriculture – the rise in temperature and likely reduction in precipitation - will express themselves in the form of retarding the expansion of irrigated agriculture, in parallel decreasing the potential for rain-fed agriculture. In addition, likely also crop yield reductions associated with periods of water shortage during the growing season may be observed. For the hydro-energy sector, anticipated declines in river flows will result in reductions in energy production, by as much as 20%. As demands are envisioned to increase, the reductions will have to be made up by the development of some other source of energy generation. To mitigate impending climate change effect on water resources, the SNC proposed the following envisioned adaptation measures:
• Reducing water losses in water management infrastructure and improve water use efficiency. • Introduction of additional sources of water. • Use of hydrologic cycle water, including groundwater. • Regulation of flows. • Taking protective engineering measures in streambeds of lakes and rivers against floods. • Building small HPPs on mountain rivers and constructing new water impoundments. • Building small HPPs on existing irrigation channels. • Clean-up of river channels, etc.
5.7.2 Agriculture Agriculture is the economic sector most dependent on climate conditions. Climate change scenarios forecast for 2021-2050 an increase in the 10°C daily mean temperature sum – the accumulated daily average temperatures >10°C - between 100oC and 700°C, compared with the 1960-1990 ‘baseline period’, while the total number of days with mean average temperature >10°C will increase between 10 and 35 days. Equally, for the period 2071-2100 the total 10°C temperature sum may increase by 110°C-1,500°C , and the overall number of days >10°C increase between 25-80 days, to occur across the country. As a result, the upper boundaries of temperature zones may shift upwards in elevation, by 150-300 m in the 2021-2050 period, and a further 450-950 m in the 2070-2100 period. This shifting may partly counter the increasingly difficult agricultural conditions in the lowlands. The forecasted increase in overall temperatures may have a positive impact on agriculture in general. In theory, agricultural lands lost to the negative impacts of climate change may be made up for in lands becoming suitable for arable farming in the mountain zone, but, actual benefits will strongly depend on soil quality, slope and water availability. In terms of moisture availability, even today most of the country suffers from insufficient precipitation and its uneven distribution over the year, a problem for most crops and the reason why most agriculture is irrigated.

- 38 -
Analyses of envisioned future changes in moisture and evapotranspiration and their impact on agriculture were executed as part of the FNC to the UNFCCC, also based on PRECİS 1.4 scenario analysis model. Results showed that evaporation is forecast to rise by 15% in the 2021-2050 period compared with the baseline period, but that the impact on increased soil moisture deficit will be partly countered by the predicted simultaneous 10-20% increase in precipitation. As a result, the soil moisture deficit during the vegetation period is forecasted to reduce by 85-260 mm compared to the baseline period. Equally for the 2071-2100 period the increase in air temperature and evapotranspiration will be offset by the forecasted increase in precipitation, 20-40% in most irrigated areas, decreasing the annual moisture deficit by 40-180 mm and the vegetation period moisture deficit by 20-100 mm. These changes are envisioned to have the following impact on specific crops:
• Better cotton varieties can be grown (4-5% increase productivity), but more irrigation is needed. • Winter wheat cropping will benefit and the area under cultivation could be expanded. More early
harvests could allow a second or even third annual crop, such as forage, melons, vegetables etc., allowing increasing productivity. The applicability of this scheme will depend on water supply, as irrigation will be required. Wheat cultivation may also be possible at higher elevations, depending on the suitability of the land for irrigation as well as the quality of soils.
• Vineyards may also be able to move upslope by 200-450 vertical meters, potentially expanding the cultivable area. Also crop yields may improve, and harvest risks decline. The harvest is expected to rise by a factor 4 to 5, and the level of sugar in grape juice by 2-3% in the period 2021-2050, and 6-7% in the 2070-2100 period. A slight rise (1%) in acidity is also expected.
• Productivity of winter pastures will improve, but their area likely decline, due to the envisioned increase in area suitable for arable farming as well as increased soil erosion, due to a decrease in forests and overgrazing. Based only on climate conditions pasture productivity is predicted to increase, as grass growth will be more rapid, but only by an estimated 2-3%.
• The spring grazing period will be extended in duration, as snow will disappear earlier, with non-grazing days in the period 2021-2050 decreasing to zero at typical elevations for spring grazing.
• Summer grazing is not expected to change, as increased temperatures and rainfall will not likely overcome other anthropogenic pressures.
To mitigate the adverse effects of climate change, the SNC proposes the following adaptation measures:
• Selection and introduction of drought-resistant and high-productive winter wheat varieties. • Selection and introduction of heat-loving, drought resistant, highly productive cotton varieties. • Restore and expand vineyards, by planting new vineyards on mountain terraces. • Restore conventional tea plantation, create new plantations on suitable lands. • Continue and expand measures to prevent soil erosion and salinity. • Apply water-saving technologies in irrigated agriculture. • Develop and implement government programs to facilitate the increased manufacturing of competitive
products in processing plants for agricultural products. • Create small village processing plants, to reduce post-harvest losses in susceptible products. • Improve and expand existing storages (warehouse, refrigerators) to reduce post-harvest losses.
5.7.3 Human health Anticipated climate change has potential impacts on human health, through changing living conditions, increasing incidences of diseases as well as the consequences of extreme weather events and floods. During summer, extremely hot weather has become the norm in Azerbaijan, with ‘heat islands’ in Baku and other large cities exacerbating the problem. Between April and September of the years 2003-2006 a temperature rise of 1.5°C in Baku resulted in an increase in the number of calls for first aid by 21.5%. Complaints related to blood, respiratory and neural diseases increased by 34.1%, 22.8% and 19.9%, respectively. While compared to European capitals, the general mortality rate in Baku is not high (3.4‰), but some diseases like myocardial infarction and stroke increased by 26% and 56%, respectively. If effective adaptation measures are not taken, the increase in blood, respiratory and neural diseases is forecasted to

- 39 -
continue in 2021-2050, and in 2071-2100 they might significantly increase. The expected rise in the population of elderly people in the cities like Baku will make the problem worse. Adaptation measures against extreme hot weather may include:
• Enhancing the emergency response capabilities in the health service systems. • Taking account of heat island effects in climate change adaptation in urban planning. • Greening cities and their surroundings more rapidly, to counter heat island effects. • Installing air conditioning systems in buildings and vehicles. • Improving compliance with construction standards related to the environment. • Enhancing the extreme hot weather warning system. • Educating the public on proper behavior during hot weather and first aid response to sunstroke.
Azerbaijan has areas of malaria and its incidence will increase with rising temperatures. There remains the potential for reducing or even eliminating the disease through the following adaptation measures:
• Improve the malaria control system; adopt programs on observation, prophylaxis & control. • Enhance clinical and laboratory diagnosis, and ensuring the supply of effective medicines. • Prognosis of possible epidemics, enhancement of early warning systems and elaboration of a plan on
the prevention of epidemics. • Implementation of measures on combating infection-transmitting anopheles mosquitoes. • Active involvement of communities in prevention campaigns in malaria-affected or potential malaria
zones, and education of the community on prophylactic measures. • Implementation of actions on preventing the transmission of malaria from other countries.
General acute gastrointestinal infections rank first among infectious and parasitic diseases, with annually over 11,000 people in Azerbaijan suffering from them. Transmission mainly depends on the quality of water and food products, both of which are at risk due to climate change, as water shortages increase pollution loads while higher temperatures increase risks of food spoiling. Although these diseases were in decline for a long period, a recent resurgence has been observed, due to rising air temperatures, poor-quality drinking water, flooding of settlements and deterioration of sewerage systems. Adaptation measures against water and food borne diseases include:
• Strengthening the water quality control system, water purification & water quality enhancement. • Increasing flood preparedness and mitigation. • Continuation of actions on the quality improvement of drinking water supply. • Strengthening control over compliance with regulations on the storage of food products. • Enhancement of public awareness on sanitary issues.
With reference to gaps in knowledge about climate change impacts on public health it should be noted that existing studies do not encompass all sectors, and that available data is mainly of qualitative nature. Therefore there is a need for thorough research in all health-related areas, aiming to obtain more quantitative data. 5.7.4 Public awareness and education in climate change issues The importance of public education and awareness raising in developing a better understanding and knowledge of climate change has become accepted. This is the case in climate change mitigation, in terms of public responses to reduction of GHGs in their country, and in adaptation, so the public understands what may need to be done and what changes need to be made in order to adapt to climate change impacts. Environmental subjects including those related to climate change have been included in primary, middle, middle technical and higher educational schools. Specialists in climate studies are appointed in the Geography Department of Baku State University and the science of climate change is being taught.

- 40 -
Environmental sciences and protection programs are also offered in other universities and institutes, particularly in technical universities and institutes. Discussion of climate change issues at higher international fora also has raised interest in this topic in Azerbaijan. Climate change issues are addressed in nearly all mass media, and AZ-MENR specialists and NGO representatives have solicited ideas and proposals from the public to address the problem. There remains a need to carry out a variety of education and awareness raising activities in climate change in Azerbaijan, including:
• Ensuring continuous environmental education (particularly on climate change) throughout all stages of education.
• Adapting the technical capacity to contemporary needs. • Establishing environmental laboratories. • Developing human resources to enhance environmental education at middle schools. • Creating a resources database by expanding access to computers and internet. • Organizing training to upgrade the level of experts’ knowledge on climate change and preparation of
programs, manuals and visual facilities. • Providing regular access to information for the public, to officials and institutions responsible for
decision making on climate change issues. • Translating text of conventions, guidelines, resolutions, and major publications in the field of climate
change into the Azeri language.

- 41 -
6 CLIMATE CHANGE IN GEORGIA Georgia ratified the UN Framework Convention on Climate Change (UNFCCC) in 1994 and became engaged with the Kyoto Protocol in 1999. As a first step towards implementing its obligations under the UNFCCC, Georgia prepared the First National Communication and submitted it in 1999 (Government of Georgia, 1999). Since then a number of projects have been implemented in the country, aimed at studying various aspects of climate change and preparing for mitigation and adaptation proposals. Between 2006 and 2009, Georgia prepared its SNC to the UNFCCC, which was submitted in 2010. In the process, a national GHG inventory was undertaken, future climate change scenarios were developed and the vulnerability of different ecosystems and economic sectors to current and expected climate change was assessed. Adaptation projects were prepared along with the planning of GHG abatement measures, and a number of activities in raising public awareness were conducted. Based on the assessments and results presented in the SNC, as well as other past and ongoing projects in Georgia, short and long term climate change strategies have been prepared. The strategies do not yet cover the whole territory of the country, but are focused on the Priority Regions selected by Georgia during the stocktaking exercise. 6.1 Geographical and socio-economic characteristics Georgia is situated in southeastern Europe, on the eastern shores of the Black Sea, covering a total surface area of 69,700 km2. The country is largely mountainous, with 54% of its territory above 1,000 GSL while peaks reach well over 4,000 GSL. The mountain environment underlies the variety in Georgia’s climate zones, from humid subtropical lowlands and wetlands, through moist and dry upland plains, steppes and semi-deserts to highland alpine areas covered by forests and glaciers. Like other former Soviet republics, the population has declined since independence due to a high rate of migration (4.36 per 1,000 capita). The population reached its peak of 5.5 million in 1992, after which the population declined to 4.38 million in 2008. In subsequent years 2009-2011 the population growth rate on average was 0.7%. The capital city, Tbilisi, has 1.172 million inhabitants in 2011. Other important cities with more than 100,000 inhabitants include (in decreasing order of size): Kutaisi, Zugdidi, Gori, Marneuli, Batumi, and Rustavi (GeoStat, 2012). Large industrial enterprises are mainly concentrated in these urban areas. Also like other former Soviet republics, Georgia’s economy has gone through a significant transition over the last two decades. The economy of Georgia declined markedly through the 1990s, due to the loss of much of its industry, agriculture and services. Conditions started to improve only after reforms launched in 1997, and intensified following the Rose revolution in 2003. According to the IMF, the flow of private capital investment into the country increased by a factor of 4.6 between 2004 and 2007 amounting to US$2.3 billion, providing significant support to Georgia’s economic revival. Good growth and diversification have characterized the economy since 2003, with an average 10% real growth of the annual GDP in the years 2004-2007, reaching its peak growth level of 12.3% in 2007. Despite the global economic crisis, Georgia’s economy grew by 2.3% in 2008, rebounding to 7% GDP real growth in 2011. The 2011 GDP is reported as US$14,438.5 mln (GeoStat, 2012), with the per capita GDP at US$3,215.4. Agriculture contributes about 9% to the GDP, industry 35% and services 64%, including tourism, one of the fastest growing sectors of the Georgian economy. 6.2 Climate There are two main climatic zones in Georgia, roughly separating the eastern and western parts of the country along the Likhi Ridge. Within these main zones climate conditions still are very diverse, largely conditioned by the heterogeneous topography. The Greater Caucasus Mountain Range plays an important role in moderating Georgia's climate, protecting the country against the penetration of colder air masses from the north. The Lesser Caucasus Mountains partially protect the country from the influence of dry and hot air masses from the south.

- 42 -
The Black Sea coastal zone and much of western Georgia are located within the northern periphery of the humid subtropical zone, exhibiting mild winters, hot summers and abundant precipitation. The climate of the region varies significantly with elevation and while much of the lowland areas of western Georgia are relatively warm throughout the year, the foothills and mountainous areas of both the Greater and Lesser Caucasus Mountains experience cool, wet summers and snowy winters, often exceeding 2 meters in many regions. The average annual temperature in the coastal zone is 14 to 15°C, with extremes ranging from -15oC to +45oC, and the annual precipitation varies between 1,500 mm and 2,500 mm. The mean annual temperatures in western Georgia’s mountain and high mountain zones vary from 6-10°C to 2-4°C, with absolute minima reaching -30°C and -35°C respectively. Annual precipitation ranges from 1,000 to 4,500 mm but in most of the region between 1,200 mm and 2,000 mm is observed. The precipitation tends to be uniformly distributed throughout the year, although rainfall can be particularly heavy during the autumn months. The Adjara Autonomous Region in southwest Georgia is the wettest region of the Caucasus, with the Mt. Mtirala rainforest south of Kobuleti receiving as much as 4,500 mm of precipitation per year. The prevalent climate in eastern Georgia is drier, ranging from arid sub-tropical in the lowlands to alpine in the mountainous regions. The region's weather patterns are influenced by dry, Caspian air masses from the east as well as by humid, Black Sea air masses from the west. As in western Georgia, elevation plays an important differentiating role in establishing local climate conditions, with the alpine zone above 1,500 GSL considerably colder than the lower lying areas, characterized by a dry subtropical climate. The regions above 2,000 GSL frequently experience frost even during the summer months. The mean annual temperature is 11-13°C on the plains, and 2-7°C in the mountains. The absolute minima are -25°C and -36°C respectively. In the high mountains (the slopes of Mount Kazbegi), the maxima and minima of +42°C and -42°C have been observed. The penetration of humid air masses from the Black Sea is often blocked by the Likhi Ridge separating the eastern and western regions of Georgia. Annual precipitation in the east is considerably less than in western Georgia. The mean annual precipitation ranges from 400-600 mm on the upland plains, to 800-1,200 mm in the mountains, with the wettest periods generally occurring during spring and autumn (GE-MEPNR, 2009). 6.3 Resources 6.3.1 Surface water Georgia has an abundance of fresh water resources - rivers, lakes and springs, due to the country’s mountainous territory and the abundance of precipitation. The country mean annual precipitation is 1,338 mm, the mean annual precipitation volume 93.3 km3, equal to an annual amount of renewable per capita fresh water resources from precipitation of 14,000 m3 (GE-MEPNR, 2009). There are over 26,000 rivers with total channel length of some 60,000 km, 99.5% of which are rivers with a length less than 25 km, largely short mountain rivers with an average length of 2.3 km. There are very few rivers with a long channel length or large basin size - only 273 rivers are more than 25 km long (GE-MEPNR, 2009). Rivers in Georgia have good potential for all types of water uses, especially hydropower development and fisheries because of high channel slopes and high flow velocity. In terms of transboundary waters, Georgia is both an upstream and a downstream riparian, as water flows into Georgia from Turkey (the Kura and Potskhovi rivers) and Armenia (the Debed river), and flows out of Georgia – directly into the Black Sea, or indirectly into the Caspian Sea via Russia (the Terek and Andiyskoye rivers) or Azerbaijan (the Kura, Alazani and Iori rivers). Georgia's territory can be divided in two main hydrological regions: the Black Sea basin and the Caspian Sea basin. The annual mean total flow of the river network in Georgia is approximately 61 km3, generated in upstream Turkey and Armenia (8.3 km3) as well as within the country (52.7 km3) (GE-MEPNR, 2009). The Black Sea Basin is significantly richer in water resources, with about 75% of the country’s total internal renewable surface water resources (IRSWR) generated there (Hannan et al., 2013); Most of the Western Georgia rivers have their origins in the mountains of the Greater Caucasus and flow into the Black Sea. The largest of these is the Rioni, with an annual runoff of 12.6 BCM. Other large rivers in this region include the Enguri (5.9 BCM), the Chorokhi (8.9 BCM), the Kodori (4.1 BCM), the Supsa (1.4 BCM), the Bzib (3.0 BCM), and others.

- 43 -
The largest river in the Caspian Sea basin within Georgia is the Kura river which originates in Turkey, crosses Georgia and flows into the Mingechevir Reservoir in Azerbaijan. The average discharge of the Kura river between 1970-2010 amounts to 6.2 BCM (Data provided by National Experts, 2012). Two rivers originating in the mountains of the Greater Caucasus within Georgia also flow into the Mingechevir Reservoir in Azerbaijan: the Alazani (3.5 BCM) and the Iori (0.1 BCM). Other important rivers of Eastern Georgia are the Liakhvi (1.4 BCM), the Khrami (1.0 BCM) and the Aragvi (1.4 BCM). There are 860 predominantly small lakes (<1 km2) in Georgia, covering a total surface area of 175 km2 and containing a total volume of 400 mln m3. Large lakes in Georgia’s Kura basin include Lake Paravani, having the biggest surface area, 37.5 km2, and Lake Tabatskuri, containing the largest volume of water – 0.22 km3 (GE-MEPNR, 2009). Some lakes in the Kura basin of Georgia are transboundary – Lake Kartsakhi (26.3 km2) with Turkey, Lake Jandara/Jandargol (12.5 km2; 54,280 MCM) with Azerbaijan. In Georgia, 44 artificial water reservoirs were constructed to support hydro-energy generation, irrigation and municipal water supply, covering a total surface area of 163 km2 and storing a total water volume of about 3.3 mln m3, of which 2.2 mln m3 is useable (Tvalchrelidze et al., 2011). Of all reservoirs, 35 are located in Georgia’s part of the Caspian Sea basin, storing a total volume of 1.70 BCM, the remaining 8 reservoirs are located in the Black sea basin, storing 1,47 BCM (GE-MEPNR, 2010). The total reservoir volume is about 1.0 BCM, with usable storage of 782 MCM. On the territory of Georgia 734 glaciers occur, having an assessed total surface area of 511 km2. Glaciers have accumulated 30 km3 of ice, of which on average 5% participates in the annual water circulation, or 1.5 km3 (GE-MEPNR, 2009). There are more than 250,000 ha of wetlands - 220,000 ha in Western Georgia and 31,000 in Eastern Georgia. The total water resources stored in wetlands are estimated at 35 BCM. As such, the Georgia SNC (GE MEPNR, 2009) estimates the country’s total water resources at just over 100 BCM, river resources included, but this cannot be considered annually renewable, as it includes over-year lake & wetlands storage. Considering only the Kura Ara(k)s Basin, the in-country surface water resources are estimated to be in the order of 18 BCM, including stored, non-renewable resources in wetlands, lakes and reservoirs. 6.3.2 Groundwater In Georgia, fresh groundwater resources within the Kura catchment area total about 22 MCM/day (255 m3/sec), or 8 BCM/year, of which about 50% originates in the Greater Caucasus, 25% in the Lesser Caucasus, and 25% in the Kura depression. Over 70% of the resources are concentrated exclusively in high mountain areas and are difficult to use technically and financially (UNDP/GEF, 2007). Other sources state that it is assumed that only about one third of the “known” groundwater resources have been surveyed in detail, and that total groundwater resources are estimated to be 18 BCM (GE-MEPNR, 2010), with 67% in Western Georgia and 33% in Eastern Georgia. Over one hundred fresh groundwater aquifers have been mapped in Georgia. They are distributed unevenly within the hydrogeological regions of the country, with more than half associated with the southern slopes of the main Greater Caucasus range. 6.3.3 Water consumption In 2011, total water abstraction in Georgia measured 2,012.3 MCM, of which 381.1 MCM from groundwater sources, or 18.9% (GE-MEPNR, 2010). Direct water consumption in the country totaled 1,044.7 MCM, divided over the sectors agriculture, fisheries & forestry – 247.7 MCM (23.7%), industry – 357.9 MCM (34.3%) and municipal & drinking purposes – 439.2 MCM (42.0%), while an additional volume of 20,557.9 MCM was indirectly non-consumptively used by the hydropower sector (GE-MENRP, 2013). Direct consumption in the Kura Ara(k)s basin part in 2011 reached 884.2 MCM, divided over the sectors agriculture, fisheries & forestry – 216.3 MCM (24.5%), industry – 303.0 MCM (34.3%) and municipal & drinking purposes – 364.9 MCM (41.3%), while an additional 5,381.8 MCM is non-consumptively used by the hydropower sector (GE-MENRP, 2013).

- 44 -
Comparing the country and basin data, it is also clear that irrigation exclusively takes place inside the Kura Ara(k)s section in Georgia, while the non-consumptive use for hydropower generation is by far higher in the Black Sea basin. Table 6.1 Water Use in Georgia by Sector (BCM) 2000 to 2010.
Purpose 2001 2002 2003 2004 2005 2006 2007 2008 2009 2010
Municipal water supply 0.39 0.39 0.40 0.37 0.38 0.39 0.41 0.41 0.43 0.46 Industry 0.15 0.25 0.17 0.19 0.21 0.36 0.26 0.33 0.28 0.21 Irrigation 0.27 0.12 0.22 0.17 0.09 0.14 0.10 0.06 0.05 0.06 HPP 14.72 30.11 23.92 17.97 47.70 24.68 30.96 28.95 32.54 29.94 Fisheries - - - - - - - - 0.04 0.06
TOTAL 15.52 30.87 24.71 18.70 48.37 25.57 31.72 29.76 33.34 30.73
Source Ministry of Environment Protection of Georgia, Reports on Water Use in Georgia, 2000-2010 http://aarhus.ge/index.php?page=118&lang=eng.
Hydropower is not generally considered a consumer of water, but it does alter the natural flow regime of rivers. In addition to potential harmful environmental impacts, there may be conflicts between hydro production and agricultural production as irrigation and hydro production both expand, and seasonal demands vary significantly. 6.3.4 Energy Considering the lack of significant oil & gas reserves, hydropower is the only domestic energy resource in Georgia available in abundant amounts. The country’s total hydropower potential is estimated at 80 TWh, with an economically viable potential of 27 TWh. At present only approximately 25% of the economically viable hydropower resources are being exploited. (SEEC, 2007), Other sources state the total hydropower potential of rivers in Georgia as 50 TWh/year, still offering sufficient opportunities to completely supply the internal demand as well as to provide significantly to the export market. In 2009-2010, total electricity generated – 85% from hydropower, 15% from thermal & import - of Georgia amounted to 9,300 GWh, already exceeded internal demand by 15%, exported to neighboring countries Armenia, Azerbaijan, Russia and Turkey. Only about 20% of all hydropower energy is generated in the Georgian section of the Kura-Ara(k)s basin. Following the energy crisis after the disruption of the Soviet Union and the need for Georgia to import electricity, significant investments in the first decade of the 21st century - in power generation, transmission and distribution – were made. Consequently, the electricity supply has been significantly improved and from a net importer Georgia became a net exporter of electricity. Total power generated in Georgia amounted to 10,046 GWh in 2010, of which 9,368 GWh (93%) were generated by hydropower plants, predominantly small HPPs, and the remaining 679 GWh (7%) by thermal power plants. The average annual growth rate in hydropower production from 2004 to 2010 amounted to 6.7% (EBRD, 2012). According to the Ministry of Energy and Natural Resources (GE-MEnNR, 2012), Georgia is currently exploiting only 18% of its hydro resource potential. The ministry estimates that 300 of the approximately 26,000 rivers in Georgia have significant potential for energy production, their total annual potential capacity is assess at 15,000 MW, and the average annual production at 50 bln. KWh. Current investment activities in hydropower total around US$2.4 billion, envisioned to increase production by about 3,000 MW, or an assessed 9 bln KWth/year (GE-MEnNR, 2012). Meanwhile, additionally proposed projects are estimated to provide over 22,000 MW of capacity, required investment over US$40 billion, which would be privately funded. Implementation of these projects would make Georgia the world’s second largest hydropower producer. Georgia's reliance on hydropower leaves the country vulnerable to climatic fluctuations, which could require imports to meet seasonal shortages, but also opens the possibility of export during wetter conditions. Future

- 45 -
impacts of climate change can be minimized, as Georgia still has the potential to increase hydro-generated power, through refurbishing existing facilities, as well as constructing new hydropower plants. Georgian natural gas consumption was 1.8 BCM in 2007, supplied by Russia. In recent years Georgia has been able to eliminate its dependency on imports from Russia, due to increased hydroelectricity production, and the availability of natural gas sources from Azerbaijan. In addition, all Russian gas exports to Armenia pass through the Georgian pipeline system and Georgia takes 10% of that gas as a transit fee. While most of Georgia’s energy comes from hydropower, it is also rich in other renewable energy resources, including wind, solar, geothermal and biomass. With the exception of biomass, these resources are still waiting to be developed. Wind energy has been estimated to potentially provide 5 GWh of electricity. There are some reserves of geothermal energy as well, but these are rarely used. Georgia is a partner country of the EU INOGATE energy program, which has four key topics: enhancing energy security; convergence of member state energy markets on the basis of EU internal energy market principles; supporting sustainable energy development; and attracting investment for energy projects of common and regional interest. 6.3.5 Forests In Georgia, in 2011 forests covered 2,772,000 ha, or 39.8% of the country. The largest part – 98% - occurs in mountain areas, while only 2% occurs in upland plains, while the largest majority of all forests are of natural origin. Geographically the majority of the forests occur in western Georgia. Forest cover types include coniferous forests (16.0%), broadleaf forests (83.6%), hardwood forests (70.5%) and lightwood forests (10.9%) (GE-MEnNR, 2012). In 2010, legal logging equaled about 697,000 m3 (GeoStat, 2012). In 2009, registered and prosecuted violations valued almost 40,000 m3, of which about 30,000 m3 in the Kura basin, which is believed to be only a fraction of total violations of logging regulations. Reforestation in 2010 was completed on 1,700 ha, largely (1,110 ha) by means of planting and sowing (GeoStat, 2012). 6.3.6 Agriculture In Georgia, 43.7% of the country is considered agricultural, including natural pasture-‐lands and meadows, or 3,045,900 ha (USAID, 2011). In 2011, however, only 1/3 of the nation’s arable land is in active use, or 281,000 ha, of which about 180,000 ha are located in the Kura basin (GeoStat, 2012), while the rest accounts for natural grazing lands, about 1.8 mln ha (USAID, 2011). Traditional agricultural crops include cereals and leguminous crops, potatoes, grapes, fruit and vegetables of many kinds, while cattle and sheep breeding are equally important. Approximately 9% of the Georgian GDP (2011) is generated by the agriculture sector, and about 55% of the total labor force is employed in agriculture, though much of this is subsistence farming, as only 1.5% of the labor force is formally employed by commercial farms. According to the 2004 Agricultural Census, households owned in average 1.32 ha land, which consisted of 2-3 land plots with a size of about 0.45 ha each, obtained in ownership after the 1993 land reforms. Land plots with the area of less than 5 ha constitute 98.4% of total agricultural holdings, while only holdings with land area more than 5 ha can be regarded as commercially viable. Agriculture in Georgia is dominated by family holdings, with only 2.7% of sown areas managed by commercial enterprises, mainly wheat and oats, while for permanent crops – fruits, grapes, citrus – their contribution drops to 0.8%, except for tea (45%) (GeoStat, 2012). In livestock farming this division is comparable, with commercial enterprises mainly being involved in poultry production (about 30%) (GeoStat, 2012). Of all farmers, 80% produces for self-consumption. Meanwhile the farming population is aging, with 75% of farms operated by persons older than 45, and 36% by persons older than 65 (GeoStat, 2007). As other sectors of the economy, the Georgian agricultural sector declined through the 1990s. Since the break-up of the Soviet Union, the area used for agriculture as well as the number of livestock held by farmers gradually decreased to about 40% of the 1990 values, having stabilized only in recent years (USAID, 2011). Sown areas declined by nearly 35% and livestock numbers (cattle, pigs, sheep) by 50%. Sown areas rose between 1995 and 2000, and then started to decline again. In 2010 the sown area constituted 40% of the 1990 level. The immediate decline in livestock numbers after 1990 followed by a period of expansion until

- 46 -
2004 but then moved into another phase of decline. Presently livestock numbers constitute 42% of the pre-independence level – 1.1 mln heads of cattle, 105,000 pigs, 630,000 sheep and goats, 6.4 mln heads of poultry. To this contributed outbreak of African swine fever in 2007 as well as increased exports of sheep and cattle to the Middle East and neighboring countries of Azerbaijan and Armenia (USAID, 2011). Comparing agricultural productivity in Georgia with neighboring as well as top producer countries for vegetable, potato and bean shows that yields per hectare in Georgia are near the lowest for all crops except garlic and beans, the yields of which are average. Equal relative low yields/ha are shown for fruits, nuts, citrus and berries as well as grains and oilseeds. Only hazelnut yields Georgia are comparable to the yield in Turkey, the world’s leading producer (USAID, 2011). The primary reasons for low productivity are believed to include the low use of mineral fertilizers and pesticides and the unreliable irrigation network (USAID, 2011). 6.3.7 Irrigation and drainage Potential irrigable area in Georgia is estimated at 725,000 ha, with a long history of irrigation development. At the beginning of the twentieth century, the total irrigated area in Georgia was about 112,000 ha, which rose to 500,000 ha in the beginning of the 1980s, mainly located in the more arid eastern part of the country. During the 1990s, irrigation areas significantly declined, from 386,000 ha in 1988 to about 160,000 ha during the severe drought of 2000, when all pumping schemes (143,000 ha) were out of order (USAID, 2011). Despite rehabilitation programs on irrigation and drainage scheme carried out by the Georgian Government in the following years, the Georgian Ministry of Agriculture for 2011 estimates the total area under actual irrigation in Georgia at 24,000 ha. Irrigated lands are largely located in eastern Georgia, in the Kura Ara(k)s river basin. Most irrigation water originates from rivers. Groundwater is generally not used for irrigation in Georgia. The main irrigation technology is surface irrigation. Of the irrigation schemes installed in the past, many are large, with the largest ones: the upper Alazani (41,100 ha), the lower Alazani (29,200 ha), the upper Samgori (28,100 ha), and the lower Samgori (29,200 ha). There is no private irrigation in Georgia, all irrigation schemes are managed by the State through its Department of Melioration and Water Resources. Though irrigation remains the responsibility of the State, the land irrigated can be owned either by private farmers or by the State but leased to farmers, cooperatives or agro-firms. Irrigation is estimated to use about 15% of total water resources. 6.4 Extreme climate related events 6.4.1 Flooding Flood events are frequent in Georgia. The 1987 flood on the Lower Rioni River caused inundation of a vast territory including human settlements for a long period of time resulting in some casualties and huge damage to the local agricultural sector. In 1997, the flood events in the Tbilisi-Gori-Kvemo-Kartli region killed 7 people, affected 500 others and incurred a reported economic loss of US$29.5 million. In June 2005, the flood in the Mtsketa-Tianeti region killed 1 person, affected 51 others and caused an economic loss of US$2 million. On 13 May 2012, the flood in Tbilisi killed five people and caused several million dollars in damages. An overview is presented in table 6.2. 6.4.2 Drought Droughts are observed across almost all of Georgia, although droughts are more frequent and pronounced in central and eastern Georgia - the Shida Kartli and Kvemo Kartli regions, in Kakheti, and Zemo Imereti. Except for the Zemo Imereti region, these most drought-prone regions are located in the Kura river basin. An overview of the length of drought periods in recent years is presented in figure 6.1. The most severe drought was in the Kakheti- Kvemo-Kartli region in the year 2000, affected 696,000 people and caused an economic loss of US$200 mln. Of all natural disasters, droughts have affected the largest number of people. Between 1995 and 2008, drought damage to agriculture totaled US$250 mln (CENN/ITC, 2012).

- 47 -
Figure 6.1 Duration of annual drought periods in Georgia between 1960 and 2009.
Source: GE-MEPNR (2010).
Table 6.2 Overview of recorded floods and droughts in Georgia in the period 1995-2010.
Year flooding Drought Number of events Impact (mln US$) Duration (months) Impact (mln US$)
1995 4 2.0 0 0 1996 11 17.8 1.5 10.6 1997 12 23.8 2.0 16.3 1998 2 1.3 1.0 3.8 1999 8 19.1 0 0 2000 2 1.3 6.0 187.5 2001 4 2.6 2.5 13.1 2002 16 49.2 0 0 2003 6 2.7 0 0 2004 10 12.8 0 0 2005 20 50.0 0 0 2006 8 9.4 1.5 3.1 2007 7 25.2 0 0 2008 16 23.8 0 0 2009 20 18.8 1.5 3.8 2010 18 12.9 3.5 28.1 Total 164 272.3 1.5 266.3
Source: CENN/ITC (2012).
6.5 Observed changes in climate The Georgian SNC to the UNFCCC assessed climate change by region, as western Georgia is climatically so different from Eastern Georgia. The document also highlights “Priority Regions” to show impacts of climate change: (1) Black Sea coast; (2) Kvemo Svaneti; and (3) Dedoplistskaro (GE-MEPNR, 2009). The assessments of observed changes in climate were based on comparing the periods of 1955-1970 and 1990-2005. Trends of mean annual air temperature, mean annual precipitation and the ‘moistening regime’
0
0.5
1
1.5
2
2.5
3
3.5
4
4.5
5
5.5
6
6.5
7 19
60
1962
1964
1966
1968
1970
1972
1974
1976
1978
1980
1982
1984
1986
1988
1990
1992
1994
1996
1998
2000
2002
2004
2006
2008
Dur
atio
n of
dro
ught
(mon
ths)

- 48 -
were investigated. To describe the ‘moistening regime’, the indicator of the hydrothermal coefficient (HTC) was used. HTC is derived from precipitation and temperature data and relates to evapotranspiration but is less data intensive. These analyses were based on meteorological observations provided by the Georgian National Environment Agency (NEA), which is the agency responsible for the meteorological network in Georgia. Only the Dedoplistskaro region is located in the Kura Ara(k)s basin, but the other regions are noted for sake of completeness. Climate change features in the Priority Regions was analyzed based on three meteorological stations, at Poti, on the Black Sea Coast, at Lentskhi in Kvemo Svaneti and in Dedoplistskaro in that region. Table 6.3 provides the comparison of the basic meteorological statistics. Table 6.3 indicates an overall increase in temperature in each Priority Region: 0.2°C on the Black Sea Coast, 0.4°C in Kvemo Svaneti and 0.6°C in Dedoplistskaro. Considering temperature extremes, the absolute minima increased by 3.0°C, 0.7°C and 0.0°C respectively, showing a decreasing trend moving eastward across the country. The absolute maxima also increased, by 1.6°C, 0.5°C and 2.1°C, respectively, showing a more significant change in the extreme west and extreme east of the country compared with more central regions. Precipitation in the Priority Regions also increased, by 13%, 8% and 6%, respectively. The Black Sea coast shows an especially significant rise in precipitation, while the eastern region, already quite dry, has less of an increase. Table 6.3 Comparison of meteorological statistics 1955-1970 with 1990-2005.
Priority region (meteorological station)
Average mean annual air
temperature by period (°C)
Average annual sum of precipitation by period
(mm)
Average air temperature - absolute
minima (°C)
Average air temperature - absolute
maxima (°C) HTC
I II II-I I II II-I (%) I II II-I (%) I II II-I (%) II-I (%)
Black Sea coast (Poti) 14.4 14.6 0.2 1837 2078 241
(13%) -13.0 -10.0 3.0 33.8 35.4 1.6
+0.6 (20%)
Kvemo Svaneti (Lentekhi) 9.6 10.0 0.4 1256 1360 104
(8%) -14.5 -13.8 0.7 34.7 35.2 0.5
+0.6 (28%)
Dedoplistskaro Region (Dedoplistskaro)
10.6 11.2 0.6 586 622 36
(6%) -11.5 -11.5 0.0 32.7 34.8 2.1
-0.2 (-15%)
Note: Designation of periods: I – 1955-1970; II – 1990-2005. The ‘moistening regime’ HTC, increased by 20% in the Black Sea coast region, 28% in the western Kvemo Svaneti area and declined by 15% in the Dedoplistskaro region of Eastern Georgia in the 1990-2005 period as compared to the 1955-1970 period. 6.6 Forecast climate change impacts 6.6.1 General assessment To forecast expected climate changes in the 21st century, several options based on the PRECIS model were assessed for air temperature and precipitation only. Other models (WEAP Water Evaluation and Planning and CropWat) were used to analyze other parameters (wind velocity, solar radiation, humidity, etc.). As standard IPCC procedure, the period 1961-1990 was used as the baseline against which forecasts for the future were made. The models were therefore initially tested on that period to ensure they adequately represented the climate parameters in Georgia. For the analysis, data from 9 meteorological stations in Western Georgia and 11 in East Georgia were used, evenly distributed across Georgia and reflecting the variation in the country’s climate features. Temperature and precipitation were assessed to the year 2100 using three global climate models HadAM3P, ECHAM4

- 49 -
(A2 scenario) and MAGICC/SCENGEN for western Georgia and eastern Georgia separately, and for the Priority Regions. These were then run through several model exercises to determine the best fit for Georgia. The final climate change scenario in Georgia is based on the averaged values obtained from the three models. For the selection of reliable baseline values, the data taken from the SCENGEN database (1961-1990) were averaged with the observed data, carried out for the same period of time at 20 hydro-meteorological stations. The results of the analysis are shown in Table 6.4. Table 6.4 Modeled changes in temperature and precipitation to 2100.
Spring Summer Autumn Winter Annual T
(°C) P
(mm) T
(°C) P
(mm) T
(°C) P
(mm) T
(°C) P
(mm) T
(°C) P
(mm) Western Georgia
Baseline period 7.9 281 18.5 348 9.7 391 -2.3 377 9.1 1197 Anticipated change 4.6 -40 5.6 -88 3.4 -53 3.6 104 3.5 -70
2100 12.4 241 24.1 260 13.0 338 1.4 481 12.6 1127 Eastern Georgia
Baseline period 9.3 158 20.5 170 11.6 126 1.0 85 11.3 570 Anticipated change 4.6 -65 5.9 -72 4.1 -45 4.5 -29 4.1 -83
2100 13.9 93 26.4 98 15.7 81 5.5 56 15.4 487 The conclusion from Table 6.4 is that in both Western and Eastern Georgia up to the year 2100 an increase in mean annual temperature of 3 to 5oC is expected, accompanied by an annual decrease in precipitation of some 6 to 15%. The change will be more severe in summer, when both the temperature increase and precipitation decrease trends are greater than in other seasons. From an impact perspective, higher temperatures and reduced precipitation will reduce river flows and water resources in general. This will mean that future water-dependent socio-economic development will be confronted with lower water availability. Water quality is expected to deteriorate; as the higher temperatures drive organic and chemical processes and the reduced water flow increases concentration of pollutants. 6.6.2 Assessment of the Dedoplistskaro region The SNC for Georgia analyzes in detail the climate change issues in the three Priority Regions. For this study, the only region located in the Kura Ara(k)s basin – Dedoplistskaro - will be presented. The Dedoplistskaro region (DTR) in the east of Georgia covers an area of 2,532 km2 with elevations ranging from 400 to 600 GSL. The region is characterized by several rivers and their valleys, mostly tributaries of the Alazani or Iori Rivers. The region is dry and is under threat of desertification, which is why it was selected as one of the Priority Regions for Georgia’s SNC. In 2011 the population of the DTR amounted to 30,600 people, settled in one town (24% urban population) and 14 villages (76% rural population). Compared to the 1989 census, some 6,000 people left the region as a result of the worsening of socio-economic conditions, caused by the disintegration of the established systems of agricultural production, deterioration of the irrigation systems, and rising unemployment. The dominant sector of the DTR economy is agriculture, in which 94% of population is engaged. In 2001-2005 the region produced on average 32% of the wheat, and 13% of the wine and meat purveyed in the whole Kakheti region. The DTR has fertile land and extensive pastures. Agricultural arable land is 57,500 ha, of which 35,000 ha are cultivated, 21,150 ha are fallow, in use as rangelands and hayfields, and 1,350 ha are occupied by perennials. Additionally, winter pastures amount to a total of 131,400 ha, towards a total surface area of agricultural land of 188,900 ha, or about 75% of the total DTR territory.

- 50 -
However, DTR is scarce in water resources and precipitation. It has hot summers, with temperatures reaching 35-40°C, which in combination with long dry periods often results in drought. The region is highly vulnerable to climate change, with major impacts because it is also an important agricultural area. Three climatic zones are distinguished in the DTR:
• Temperate dry subtropical (steppe) climate with moderately cold winters and hot summers. • Transient climate from dry subtropical to temperate humid subtropical with moderately cold winters
and hot summers. • Temperate humid climates with hot summers and moderately cold winters.
Forests occupy 3,360 ha of the DTR, making up only 1.3% of the total area, mainly located in the northern part of the territory, in the Vashlovani Reserve and in meadows along the rivers Alazani and Iori. Extensive forest shelter belts (1,770 ha in 1988) were planted to protect the arable lands from wind erosion, but they have been mostly cut down as a result of the energy crisis in the 1990s. Now the DTR faces an urgent need to restore the wind breaks to protect crops and soils from the strong winds which are becoming more and more intense and frequent. The surface water resources include those of two rivers, the Iori and Alazani, plus some small lakes, the majority of which are saline. The mean annual volume of flow of the Iori River is 0.1 BCM annually (GE-MEPNR, 2009). Following the construction of two large reservoirs and a number of irrigation systems, the mean annual discharge of the river in its downstream section decreased from 10.7 m3/sec to 2.6 m3/sec, while the discharge in the headwater region almost did not change. For the Alazani River, comparing the mean annual discharge for the periods 1955-1970 and 1996-2005 indicates an increase in discharge in the lower part of the river by about 7%, from 104 m3/sec to 111 m3/s, corresponding to a mean growth in runoff of 1-2% per decade. Groundwater resources of the DTR are also scarce and their overall amount does not exceed 4.5-5.0 m3/s. A shortage of water has always been the main factor hampering the development of the DTR economy. At present, the deterioration of the irrigation systems has resulted in only 2% of arable land being irrigated. Agriculture is therefore highly vulnerability to drought. Accordingly, the poverty level in DTR is 18% higher than the mean value for the whole Kakheti region, which is significantly better provided with water. A number of Protected Areas have been established in the DTR: Vashlovani National Park (25,114 ha), which includes the Vashlovani Strict Nature Reserve (10,142 ha) and three Natural Monuments, as well as the Chachuna Managed Nature Reserve (5,200 ha). The total area occupied by these Protected Areas (30,552 ha) makes up 12% of the DTR territory. These areas have the greatest variety of flora and fauna. 6.6.3 Recent climate change in DTR Recent ongoing climate change in DTR was assessed by comparing the 1990-2005 period with the 1955-1970. Summary results for temperature are presented in Table 6.5, showing a rise in mean annual temperature of 0.6°C between the two periods. The largest increases in temperature are observed between July and October, which is the middle and latter part of the growing season. Table 6.5 Recent changes in average monthly temperature in DTR by month (°C).
Period I II III IV V VI VII VIII XI X XI XII Annual
1955 – 1970 (I) 0.4 1.0 3.6 9.6 15.4 18.9 21.6 21.3 16.5 10.7 6.0 2.1 10.6
1990 – 2005 (II) 0.2 0.6 4.4 10.5 14.7 19.6 22.9 22.8 18.0 12.2 6.2 2.1 11.2
Difference (II)-(I) -0.2 -0.4 0.8 0.9 -0.7 0.7 1.3 1.5 1.5 1.5 0.2 0.0 0.6 Precipitation changes between the two periods are presented in table 6.6, showing an increase in mean annual precipitation of 6%. However, precipitation during the main part of the growing season is shown to decline significantly, up to 46% in July. This decrease will have a major impact on agricultural production.

- 51 -
Table 6.6 Recent changes in precipitation in DTR by month (mm).
Period I II III IV V VI VII VIII XI X XI XII Annual
1955 – 1970 (I) 21 23 47 61 85 78 58 54 57 50 27 25 586
1990 – 2005 (II) 20 30 56 74 96 93 31 41 58 49 46 28 622
Difference (II)-(I) -1 7 9 13 11 15 -27 -13 1 -1 19 3 36 The Moistening Regime Index HTC in table 6.7, also shows decreased values in the growing season. Table 6.7 Recent changes in HTC in DTR by month during growing season.
Period Apr May Jun Jul Aug Sept Oct Annual
1955 – 1970 (I) 1.7 1.8 1.4 0.9 0.8 1.1 1.4 1.3
1990 – 2005 (II) 1.2 2.1 1.6 0.4 0.6 1.1 1.1 1.1
Difference (II)-(I) -0.5 0.3 0.2 -0.5 -0.2 0.0 -0.3 -0.2 In summary, DTR is already becoming hotter and drier, making agriculture more difficult and the demands for irrigation greater. This conclusion is confirmed by the analysis of droughts completed for the same periods. The duration and frequency of drought has increased over the last decades, as is shown on Table 6.8. Table 6.8 Recent changes in drought frequency and duration in DTR.
Period Average annual duration of drought period (days)
Mean frequency of drought period recurrence per year
1952 – 1965 54 0.5 1969 – 1975 37 0.7 1976 – 1985 54 0.9 1986 – 1995 52 0.8 1998 – 2007 72 1.0
6.6.4 Forecast climate change in DTR Within the context of the forecasts for eastern Georgia for 2100, similar assessments were made for the DTR on the basis of the HADAM3P version of the PRECIS model, for the A2 world development scenario. In summary, the mean annual air temperature in Dedoplistskaro is forecasted to increase by 4.1°C by 2100, to a mean annual temperature of 15.4°C. Total mean annual precipitation will remain at the present level of 606 mm. There will be a slight decrease (about 3%) in relative humidity, and virtually unchanged wind speed. The HTC for 2100, based on the forecasted mean temperature increase of 5°C, and a 90 mm decline of precipitation during the vegetation period, will reduce by 0.4 from its present value of 1.1 down to 0.7. This will result in an already arid climate becoming even dryer, with corresponding consequences to natural landscapes as well as agricultural production. On the other hand, the forecast warming will affect the duration of the vegetation period, which could increase from its present 196 days up to 235-240 days. 6.6.5 Climate change impacts on water resources The WEAP system of models was used to assess impacts of forecast climate changes on the hydrological regime of the two main rivers in the DTR, the Alazani and Iori. Their water resources have been used intensively for crop and pasture irrigation. The WEAP model was validated against observed river flow for

- 52 -
1951-1965 for the Alazani and 1964-1990 for the Iori. Relief of rivers catchments, geological structure, soil types and vegetation cover were used as input values into the WEAP model along with the PRECIS results. The summary results for the Alazani River - average annual flow in MCM, averaged over 30 year periods - are shown in Table 6.9, indicating that the mean annual runoff will decline by 8.5%, based on precipitation varying only slightly, but temperatures rising substantially, by over 5°C towards the end of the century. Table 6.9 Alazani river forecast changes in total runoff due to climate change.
Time period Mean annual T (°C) Precipitation (mm) Total annual runoff (MCM)
1951 – 1980 3.3 2,240 459.7 2071 – 2100 8.4 2,205 420.2
Change 5.1 -1.5% -8.5% To understand the impact of the decrease in river flows an analysis was carried out on three hypothetical scenarios, combining a decrease in river flow with increased demands in agricultural and other sectors. The defined scenarios assume that river runoff decreases by 10, 30 and 50%, combined with human water demands increasing by the same percentages. The results show that only in the most extreme case of runoff declining by 50% and irrigation demands increasing by 50% the Alazani river would fail to meet demands. This shows that the Alazani has sufficient water resources to meet water demands, except under an extreme and unrealistic scenario. An equal analysis was completed for the Iori River - average annual flow in MCM, averaged over 30 year periods - the summary results of which are presented in Table 6.10. The table indicates that the mean annual runoff will decline by 11% based on precipitation varying only slightly, but temperatures rising substantially, by over 5°C by the end of the century. Table 6.10 Iori river forecast changes in total runoff due to climate change.
Time period Mean annual T (°C) Precipitation (mm) Total annual runoff (MCM)
1964 – 1990 6.3 1,323 361.3 2071 – 2100 11.4 1,335 321.5
Change 5.1 1% -11% An analysis using the same three hypothetical scenarios, combining decreases in river flow with increases in agricultural (or other) demands, were carried out for the Iori River. Results show that in contrast to the Alazani River, the Iori River cannot meet demands even under the least severe scenario of a 10% decline in river flows with a 10% increase in water demands. Given that the estimated decrease is greater than 10% (11%), this raises some concern: while the Alazani will be able to meet the water demands in DTR under conditions expected from climate change, the Iori River will not. With both rivers also being transboundary, concerns on anticipated changes in river discharge are of importance, as both rivers flow into Azerbaijan and especially the Alazani being an important part of Azerbaijan’s total water resources. Consideration will need to be given to how both Georgia and Azerbaijan will respond to the impacts of climate change in this transboundary context. 6.6.6 Climate change impacts on agriculture and land fertility Land degradation is already a major problem in DTR, expected to worsen with climate change. Specific problems include soils salinization, erosion, and loss of topsoil & fertility, due to strong winds and insufficient moisture content, exacerbated by the loss of the windbreak trees as well as overgrazing by cattle and sheep. These aspects are envisioned to worsen with the expected reduced precipitation during the growing season, the significant rise in temperatures and in wind speeds, which will lead to increased evapotranspiration and greater plant stress. Unless some adaptation interventions are put into effect, likely more land will be abandoned as it becomes too difficult to farm, due to an increase in desertification processes which are already a feature of the DTR.

- 53 -
The impact of climate change on agricultural water deficits was analyzed for specific reference crops, based on the model CropWat. The reference period (1960 to 2005) and the forecasting period (2021 to 2100) were divided into 15 year blocks to better represent changes. Envisioned climate changes impacts are based on the same results developed by the PRECIS model as discussed above. The results of the water deficit analysis are shown in Table 6.11. Table 6.11 Forecast climate change induced agricultural water deficits.
Crop Water deficit (mm)
1960 - 1975 1976 - 1990 1991 - 2005 2021 - 2035 2036 - 2050 2071 - 2085 2086 - 2100
Winter wheat 163 147 133 185 181 215 236 Sunflower 229 243 249 230 239 247 293 Pastures 296 292 288 320 326 225 364
For the reference period 1960-2005 calculations show the annual deficit of water for winter wheat, sunflower and pasture to be equal to 25%, 33% and 48% respectively. The analysis of future water deficits shows that by the end of this century, on average, wheat is lacking almost half of the water needed, and sunflower even more. Accordingly, climate change adaptation interventions will be needed to reduce these water deficits, in the form of increased irrigation. Increased irrigation withdrawals from the rivers will, of course, have impacts on river flows, both in DTR and in downstream Azerbaijan. 6.6.7 Climate change impacts on Protected Areas and natural landscapes As has already been noted, Protected Areas (PAs) cover an important part of the DTR. Expected climate change impacts could turn a significant part of the DTR territory into subtropical arid steppes, covered by vegetation typical to semi-deserts and desert, with a related impoverishment of biodiversity. There are also anthropogenic causes of damage to natural landscapes, mainly overgrazing, deforestation, poor pasture management (such as burning pasture and stubble), cultivation of pastures and riparian forests, and overuse of water resources. Overgrazing has already affected about 80% of the DTR pastures, threatening a number of areas with desertification. Envisioned adaptation interventions to restore natural landscapes in the DTR include rehabilitation of wind belts which, along with protecting soils from erosion, promote the preservation of local fauna. Natural landscapes could also be enriched by plantation groves that could promote both the preservation of biodiversity while providing the local population with firewood, thus protecting windbreaks from illegal cutting. There is an important additional benefit for using Protected Areas in monitoring climatic change impacts on flora and fauna. As PAs are characterized by little to no anthropogenic impact, observed changes in vegetation cover and fauna could serve as an indicator of climate change. A good example of this is that in the last decade, new species such as porcupine and land rabbit are becoming familiar to the region, apparently due to migration from the hot and arid areas of Pakistan and Iran. At the same time in many places in the DTR populations of pheasant are disappearing. These observed processes may indicate ongoing desertification processes. The Protected Areas in the DTR also include several centuries–old specimens of Pistachio trees, Juniper, Black Poplar trees, and other rare plants, which provide valuable information on the variability of the regional climate over the past centuries. The protected areas in the DTR also have the potential of supporting an increase in tourism to the region. As such, ensuring the continuation of the protected areas will be important to diversifying the economy of DTR.

- 54 -
6.7 Summary of risks, impacts and adaptation measures in DTR Georgia’s SNC summarizes the anticipated risks in the DTR as follows:
• According to the forecasts, the air temperature will increase and air humidity index will decrease. These changes in climatic parameters will accelerate wind erosion and extend the duration of droughts. This process will be accompanied by unchanged or even declining rainfall during the growing season, resulting in increased soil erosion.
• The fertility of agricultural lands and pastures will further decrease due to increasing erosion and increasing water deficit.
• Water deficit for wheat will probably increase by a further 73% which will affect its quality and especially its nutritional value. A further 17% increase of water deficit is predicted for sunflower, and 29% for pastures.
• Abandonment of lands by the population (farmers) and a rise in unemployment and poverty. • Increase in the number of ecological migrants, and consequently depopulation of the region. • High risk for an increase of malaria cases due to rising temperatures. • Degradation of endemic species of flora and migration of endemic species of fauna. • Decrease in the number of migrating birds and a change in their kinds.
The Georgian SNC proposes ideas for climate change adaptation, distinguishing short-term and long-term measures. Short term adaptation measures include:
• Establishment of a public awareness program, to ensure information reaches the local population and farmers on the ongoing processes related to climate change and their economic implications.
• Sustainable provision to the local population of renewable energy resources (biogas, solar energy, energy efficient wood stoves, biomass).
• Facilitating the local private sector to participate in renewable energy supply projects (such as biomass and firewood) and particularly in PPP (Public Private Partnership) programs.
• Maximum utilization of solar energy in the framework of the Poverty Alleviation Program. • Assessment and application of the hydropower potential of the Alazani River. • Establishment of plantation forests (fast-growing tree species, having high thermal capacity and soil
rehabilitation properties) on degraded lands. • Rehabilitating degraded arable lands & pastures using traditional methods (gypsum, irrigation) and
providing farmers with modern technologies for land cultivation and management. • Mobilization of farmers and village communities, through pilot projects such as the establishment of
forests for energy, rehabilitation of windbreaks, pasture management, etc. • Creation of a climate change monitoring system to track changes in soil, flora, and fauna, etc. For this
a protected area has been selected, free from anthropogenic impact, to easily link observed changes with climate change.
Long term adaptation measures include:
• Restoration of central windbreaks (60 m width) and branches (10 m width). • Cost-effective restoration of irrigation systems only for areas of greatest need. • Rehabilitation of central irrigation canals in the framework of a Regional Infrastructure Development
Program. • Rehabilitation of village irrigation canals (through mobilization of local people, programs such as
Poverty Alleviation, etc.

- 55 -
6.8 National considerations for meeting the climate change challenge In addition to the above proposals for adaptation interventions in the DTR, several obstacles hamper adaptation to climate change and meeting the challenges of climate change as well as Georgia’s responsibilities to the UNFCCC. Obstacles:
• Lack of national experts in climate change issues. • Poor or missing information for analysis. • Poor information sharing among agencies. • Insufficient research. • Poor public and official interest in climate change issues. • Environmental protection is not a priority for the country.
Capacity needs:
• Training of local experts for various sectors: on-the-job training, expert certification, etc. • Fellowship programs - university students actively participating in climate change analysis, such as
during the preparation of the communications to the UNFCCC. • Participation of students in exchange programs on climate-related subjects. • Maximum involvement of national experts in various international programs. • Improvement of data and compliance with international standards. • Assessment of financial losses caused by changes in climate, which will help boost understanding of
the seriousness of the situation at all levels. There were also recommendations for national programs to increase public awareness and education for both mitigation of and adaptation to climate change.

- 56 -
7 SUMMARY FOR THE KURA ARA(K)S BASIN 7.1 Background to climate change impacts The Kura Ara(k)s Basin covers an area of 190,190 km2, including the areas of the basin in Turkey and Iran. Table 7.1 shows the division of the basin over the riparian countries. Table 7.1 Country shares of the Kura Ara(k)s basin.
Country Total country surface in 2010 (km2)*
Country surface area in basin (km2) ** % of country % of basin
Armenia 29,740 29,740 100.0 15.6 Azerbaijan 86,600 60,020 69.3 31.6
Georgia 69,700 34,560 49.6 18.2 Turkey 783,560 28,790 3.7 15.1
Iran 1,745,150 37,080 2.1 19.5
Total 2,714,750 190,190 7.0 100.0
Notes: * Source: World Bank (2012); ** Source: FAO (2009). In 2011 the population of the Kura Ara(k)s river basin amounted to 11.2 mln people, including the whole population of Armenia, and large portions of Azerbaijan and Georgia, as shown in Table 7.2. The urban population of Armenia and Georgia is higher than that of the Kura Ara(k)s part of Azerbaijan, with many smaller cities and towns included in the urban classification. Overall, the rural and urban populations in the basin are in balance. Table 7.2 The Kura Ara(k)s river basin population.
Armenia Azerbaijan Georgia Total / Average
Total population 3,274,300 5,222,600 2,724,700 11,221,600 % country population 100.0 56.6 60.6 66.0 % of basin population 29.2 46.5 24.3 100.0 Total rural population 1,159,849 3,311,128 1,088,900 5,559,877
Total urban population 2,114,451 1,911,472 1,640,700 5,666,623 % urban population 64.6 36.6 60.1 50.5 % rural population 35.4 63.4 39.9 49.5
Population density (pers./km2) 110 87 79 90 Agriculture plays an extremely important role in the economies and the livelihoods of all three countries and the basin. In Armenia agriculture contributes 17.2% to a GDP of US$10.14 billion, equal to an economic value of US$1.743 billion. In Azerbaijan agriculture comprises only 5.5 % of GDP, but with a national GDP of US$63.40 billion, agriculture has a value of US$3.5 billion. In Georgia agriculture contributes 9.3% to a GDP of US$14.44 billion, for a total value of US$1.3 billion. About 39% of Armenians, 38% of Azerbaijanis and 55% of Georgians are employed in agriculture. The figure for Azerbaijan and Georgia are for the country as a whole, as no such statistics were available for the Kura Ara(k)s basin part of the country. For Azerbaijan the percentage of the population in the Kura Ara(k)s basin employed in agriculture is probably higher, as the basin does not include the two major cities. For Georgia this figure may be lower, as the capital Tbilisi and several other large cities are located in the Kura basin part of the country The importance of agriculture is noted here because of its unequal large share of water resources use and the fact that it is the sector of the economy most vulnerable to climate change.

- 57 -
Hydropower is also an important sector of the economy. It supplies 33% of the energy supply of Armenia, 13.2% of supply of Azerbaijan and 85% of Georgia’s energy supply. Initiatives to reduce GHG emissions will raise interest in new hydropower development in all three countries. Georgia, with a large hydropower potential, has prepared plans to significantly expand hydropower development for export. Climate change will reduce the potential for expansion. Development of new hydropower will also create conflicts with other sectors, especially irrigation as well as biological diversity and natural ecosystems. 7.2 Summary of climate change indicators Table 7.3 summarizes the current climatic conditions of the Kura Ara(k)s Basin countries. It is easily seen that Azerbaijan is the warmest country of the three, and that Armenia is the driest. Armenia also has the lowest water resource, though Azerbaijan is also very low if only internal renewable water resources are considered. Agriculture as a percentage of GDP is lowest in Azerbaijan, but the highest actual economic value because of its higher GDP. Azerbaijan has the largest area under irrigation, which is not surprising given its dry climate. Azerbaijan also has the lowest contribution to total power production from HPPs, which is related to its oil and gas economy. Flood damages are also greatest in Azerbaijan. Drought risk is the same in Armenia and Azerbaijan and, though quantification is not available for Georgia, drought in the eastern region is noted in the SNC as a regular and damaging concern. Table 7.3 A summary of current climate related statistics.
Indicator Armenia Azerbaijan Georgia
Mean annual temperature (°C) 5.5 13.0 7.0 Mean annual rainfall (mm) 592 1200 2,000
Internal renewable surface water resources n/a 5.96 56.4 Total surface water (BCM) 6.80 39.0 65.4 Reservoir capacity (BCM) 1.35 10.92 2.2
Groundwater (BCM) 4.0 8.8 18.0 Power from hydro (%) 33.0 13.2 85.0
GDP from agriculture (%) 17.2 5.5 9.3 Value of agriculture (billion US$) 1.74 3.49 1.34 Total agricultural land (mln ha) 2.07 4.77 3.05
Irrigated area (ha) 156,400 1,424,400 24,000 Forested area (% of total land) 11.5 11.8 39.8
Flood damages (mln US$ per year) 0.7 5.7 to 25.0 17.0 Mudflow damages (US$ per year) 7.1 n/a 0.7
Annual drought damages (mln US$ per year) 6.0 6.0 18
Notes: Statistics in this table are for each country, as specific Kura Ara(k)s Basin values are not available. 7.3 Recent climate change Table 7.4 compares the recent changes in climate by country in the Kura Ara(k)s Basin. The whole region has experienced temperature increases between 0.5°C and 1°C in the last decades of the 20th century. Armenia and Georgia both note that summer temperatures, important because of the growing season, have risen at a faster rate than mean annual temperatures.

- 58 -
Table 7.4 Regional comparison of recent changes in climate.
Indicator Armenia Azerbaijan Georgia
Change in mean annual temperature (°C) 0.85 0.52 0.60 Change in summer temperature (°C) 1.0 n/a 1.5 Change in mean annual precipitation (%) -6.0 -9.8 +6.0 Changes in river flow variable* n/a n/a Changes in groundwater yield n/a n/a n/a
Changes in flooding n/a large increase in frequency n/a
Changes in drought frequency (%) n/a n/a 50
Notes: * “variable” indicates changes in river flow are both positive and negative depending on area of the country. Statistics for Azerbaijan are for the whole country, as specific Kura Ara(k)s Basin values are not available; statistics for Georgia are for east Georgia, more representative for the Kura Ara(k)s basin than Georgia as a whole; n/a – not available.
Precipitation is more variable across the region, with a rise in Georgia, and becoming negative through Armenia and more greatly negative through Azerbaijan, indicating a northwest to southeast trend in declining precipitation. Only Armenia presented changes in river flow and these were variable through the country, with some rivers showing increases in flow and others decreases. Groundwater is included in the table to highlight the fact that groundwater information is lacking in all three countries. Groundwater has great potential across the region to augment surface water resources but is generally underutilized because of institutional and information issues. Both Azerbaijan and Georgia have indicated increases in flood frequency. Flooding appears to be a greater problem in Azerbaijan, driving more attention to flood assessments. While drought is listed as a concern in all three countries, only Georgia has quantified changes in recent decades. 7.4 Forecast changes in climate Table 7.5 below compares forecast climate change among the three countries in the region. Table 7.5 Regional comparison of forecast changes in climate.
Indicator Armenia Azerbaijan East
Georgia
2030 2070 2100 2021 to 2050 2070 to 2100 2100
Change in mean annual temperature (°C) 1.1 to 1.2 3.2 to 3.4 5.3 to 5.7 1.5 to 1.6 3.0 to 6.0 4.6
Change in mean annual precipitation (%) -2 to -6 -6 to -17 -10 to -27 +10 to +20 +20 to +80 -15
Change in precipitation as snow (%) -7 to -11 -16 to -20 -20 to -40 n/a n/a n/a
Change in river flow (%) -6.7 -14.5 -24.4 -22.5 -20.7 -8.5
Changes in groundwater yield n/a n/a n/a n/a n/a n/a
Note: statistics for whole countries, as specific Kura Ara(k)s Basin values are not available; n/a – not available.

- 59 -
The time periods used in the forecasts are slightly different for each country, but the end date of 2100 is the same. Across the region temperatures will rise by 5°C to 6°C through this century. The forecasts for precipitation are much more variable. Decreases in precipitation of between 10% and 27% forecast for 2100 in Armenia, but Georgia shows no significant change, while for Azerbaijan a rise in precipitation of between 20% and 80% is predicted. It is unlikely that such a pattern across the region will become a reality because the variability is too large. In fact, the SNC for Azerbaijan does raise doubts about this forecast, and it is widely accepted that the GCMs are better at forecasting temperature changes than precipitation changes. Armenia is the only country that has considered climate change impacts on snow, and the forecasts show an even greater reduction in precipitation as snow. This is not surprising as most of the annual precipitation does fall in winter as snow. Forecast changes in river flow show a significant reduction. For Armenia a decline in river flows of almost 25% by 2100 is predicted. East Georgia also shows a decline in river flows of 8.5% based mainly on increased evapotranspiration, and Azerbaijan also shows a significant decline in river flows of more than 20%, even during the 2021 to 2050 period, further worsening toward 2100. Forecasts for changes in groundwater yield were not made in any of the three countries. Further exploration, study and analysis of the current groundwater situation will be necessary before reasonable climate change related forecasts can be made. 7.5 Summary of climate change impacts and adaptation Table 7.6, on the following pages, shows the various climate change impacts each of the three considered riparian countries expects, and the corresponding adaptation actions proposed. The table shows that most of the impacts are comparable between the countries. 7.5.1 Reduction of agricultural production The whole region shows decreases in agricultural potential, mainly driven by higher temperatures, resulting in increased evapotranspiration and plant stress. As a result, irrigation demands are increasing both in existing schemes as well as requiring new developments. Greater potential for drought is also a concern, listed in both Armenia and Georgia. It is not mentioned in the SNC from Azerbaijan, but this is likely to be an omission rather than any real consideration that increased drought risk will not be a factor. Adaptation actions are also similar: rehabilitate existing schemes to reduce water losses and increase irrigation efficiency, introduce new crop varieties that are less water demanding and hardier to heat and dryness, and improve agricultural processes themselves to minimize losses, especially post-harvest losses which are a well-known problem in the region. 7.5.2 Reduction in hydropower potential Only Azerbaijan raises the issue of reduced hydropower production, though with hydropower production being important across the basin, and with reductions in river flow expected across the basin, it is likely that the potential for hydropower production will decline across the basin accordingly. 7.5.3 Reduction in biological diversity and ecosystem health Reduction in biological diversity and ecosystem health is a common theme. The expansion of desert and semi-desert conditions, of steppe environments and the loss of forests are impacts raised by each country. Reduced biological diversity as an explicit impact is raised only by Georgia, but it is implied in each country. In terms of adaptation, all countries specifically propose to restore forests as an adaptation measure. To protect forests, Georgia also proposes to ensure providing alternative fuel supplies to rural areas. Armenia and Georgia propose to develop and enforce grazing rules, reducing overgrazing damage and allowing forests (re)growth. Armenia proposes to improve zoning laws for PAs and pest control in forest areas.

- 60 -
Table 7.6 Summary of climate change impacts and proposed adaptation.
Armenia Azerbaijan Georgia
Agriculture and Irrigation
Impacts Rainfed agriculture more vulnerable ✔ ✔ Reduced crop yields ✔ ✔ Reduced ability to expand irrigated area ✔ ✔ ✔ Less water available for irrigation ✔ ✔ Increased evapotranspiration ✔ ✔ ✔ Decline in soil moisture ✔ ✔ ✔ Increased potential for soil degradation ✔ ✔ ✔ Greater potential for drought ✔ ✔ Reduced food security ✔ ✔ ✔ Adaptation Reduce losses in water systems ✔ Rehabilitate irrigation schemes ✔ ✔ Develop new irrigation schemes ✔ ✔ Develop new water sources ✔ ✔ Develop groundwater ✔ ✔ Improve regulation of river flows ✔ ✔ New, tougher crops ✔ ✔ Shift farms to areas with more moisture ✔ Apply water saving technologies ✔ ✔ Measures to reduce post-harvest losses ✔ ✔ Hail and flood protection measures ✔ Improve animal husbandry ✔ ✔
Hydropower Production
Impacts Loss of production ✔ Adaptation Develop small HPP ✔
Biological Diversity
Impacts Expansion of desert, semi-desert ✔ ✔ ✔ Expansion of steppe environments ✔ ✔ Loss of forests ✔ ✔ ✔ Reduced biological diversity ✔ ✔ ✔ Adaptation Develop and enforce grazing norms ✔ ✔ Improve zoning of protected areas ✔ Restore degraded forest ecosystems ✔ ✔ ✔ Ensure alternative energy sources ✔ ✔ Improve forest pest control ✔

- 61 -
Table 7.6 Summary of climate change impacts and proposed adaptation (cont’d).
Armenia Azerbaijan Georgia
Settlements and Infrastructure
Impacts Increased risk of flooding ✔ Increased risk of mudflows ✔ loss of livelihoods, outmigration ✔ ✔ Adaptation New infrastructure for flood protection ✔ ✔ River channel management ✔ ✔ Plant new forests and reforest ✔ Develop early warning systems ✔ Enhance emergency response measures ✔ ✔ Green cities ✔ ✔
Human Health
Impacts Heat stress and other related issues ✔ ✔ ✔ Increased vector borne diseases ✔ Increased water borne diseases ✔ ✔ ✔ Adaptation Public awareness and education ✔ ✔ Other social behavior modification ✔ ✔ Improve labs and medicine supply ✔ ✔ Early warning systems for disease ✔ ✔ Improve water quality ✔ ✔
7.5.4 Risks to settlements and infrastructure In terms of settlements, Armenia explicitly raises the issues of increased risks for flooding and mudflows, but while Azerbaijan does not, flood protection is proposed as needed for adaptation. Georgia states that outmigration from rural areas is a likely impact, especially in the east where desertification will lead to loss of livelihoods. Adaptation to reduce flood risk is proposed in both Armenia and Azerbaijan, by means of building new flood protection infrastructure and managing river channels. Armenia proposes reforestation and planting new forests as a flood protection measure. Armenia also proposes to develop early warning systems, while Azerbaijan proposes emergency response measures, which are closely related. In Georgia, increased flooding is not raised as an impact, and no proposals for improvement of flood management are made. 7.5.5 Human health Heat stress and issues related to increased temperatures are raised in all three countries, especially for urban environments. The increase in vector borne diseases as a result of increased temperatures is raised by Armenia, but the increase in water borne diseases is a concern across the region. Georgia does not propose specific adaptation actions. Armenia and Azerbaijan both propose better public awareness and education on health related topics and suggest forms of social behavior modification. Azerbaijan goes further into improving labs and access to medicines, early warning systems for disease outbreaks and, most notably, improving water quality.

- 62 -
7.5.6 Institutional adaptation measures In the SNC to the UNFCCC each country also proposes a number of suitable institutional adaptation measures, to improve the management of the issues concerned. These are summarized in Table 7.7. It is apparent from the table that information, from monitoring through analysis to dissemination of information is an important adaptation measure throughout the region. Specific flood-related monitoring and information is proposed in Armenia and Azerbaijan, where a rise in flood risk is expected. Improving public awareness of climate change issues is raised in both Azerbaijan and Georgia. Creating a specific climate change monitoring system, including targeting changes in vegetation and in biodiversity, is proposed by Georgia only. Technological aspects of institutional adaptation measures are aimed at irrigation improvements to minimize losses in systems, while minimizing system losses in municipal infrastructure is also proposed in Armenia and Azerbaijan. Improved cropping and irrigation technologies to increase plant tolerance and increase water use efficiencies are proposed in Armenia and Azerbaijan, countries where irrigation is most important. Legal and administrative adaptation measures are also proposed. Georgia and Azerbaijan stress increased capacity of human resources, and Azerbaijan adds translating technical documents into local language for greater access to knowledge by professionals. Incorporating climate change into plans and designs, or in other words, climate change mainstreaming, is proposed in both Armenia and Azerbaijan. Table 7.7 Proposed adaptation measures.
Type of Measure Armenia Azerbaijan Georgia
Information Improve monitoring and information management ✔ ✔ ✔ Improve monitoring of floods ✔ ✔ Improve monitoring of groundwater ✔ ✔ Improve water resources assessment ✔ ✔ ✔ Public awareness of climate change issues ✔ ✔ ✔ Create climate change monitoring system ✔ ✔ ✔
Technological Increase volumes of reservoirs and build new ones ✔ Rehabilitate irrigation schemes ✔ ✔ ✔ Reduce losses in irrigation systems ✔ ✔ Reduce losses in domestic systems ✔ ✔ Adopt rainwater and snow harvesting ✔ Adapt cropping to new climate ✔ ✔ Improve irrigation technologies ✔ ✔ Legal and Administrative Incorporate climate change into plans and designs ✔ ✔ Introduce economic instruments for loss reduction ✔ Introduce water saving technologies ✔ ✔ Introduce legislation for water saving ✔ Develop priorities for water sectors ✔ Build human resources capacities ✔ ✔ ✔ Translate important documents into local languages ✔ ✔
Source: countries SCNs to the UNFCCC.

- 63 -
7.6 Conclusions 7.6.1 Impacts The impacts of climate change bring significant risks for the future across the region and the Kura Ara(k)s river basin in particular. The climate change forecasts for all three South Caucasus countries show important impacts on water resources. Based primarily on the forecast increase in air temperature, evaporation and evapotranspiration rates are also expected to increase. Further, while precipitation is highly variable throughout the region, most of the area of the basin is expected to experience a general decrease in precipitation. Combined, the impact of higher temperatures and decreased precipitation will result in a reduction in river flows and therefore in the available water resources of the basin. No analysis has been carried out on the impacts on groundwater, mainly because the current groundwater reserves are not well understood, but increased evaporation and evapotranspiration combined with reduced rainfall will likely lead to reduced rates of recharge to the aquifers and therefore lower groundwater yields. At the same time, the higher temperatures and the resulting evapotranspiration rates will drive increased water demands for all water users, but most importantly for irrigated agriculture. All three countries of the Kura Ara(k)s basin have significant areas under irrigation, but the greatest impact is expected in Azerbaijan, having the largest area of land under irrigation. Extreme climate related events of flooding and drought are expected to increase both in severity and frequency. Flooding is a greater risk in Azerbaijan than in either Georgia or Armenia, but these countries also suffer significant losses from flooding. All three countries are at risk of drought. Even Georgia, with the highest level of precipitation in the region, has areas which are prone to drought. The stress on these areas will greatly increase due to climate change. Biological diversity and natural ecosystems, already at risk from the unregulated development and (over)use of natural resources, will suffer greater stress as a result of climate change. This includes expansion of desert and semi desert areas as well as the loss of forest area. Significant changes will also occur in the composition and structure of ecosystems. There may be some upward shift in forests due to rising temperatures opening up higher elevations to forest vegetation, but this will be a longer process without human intervention such as tree planting. Soils and topography will also limit the potential for vertical expansion. Loss of forest cover impacts the water resources themselves, increasing runoff, flooding and sediment loads in rivers, and reducing the useful lives of reservoirs. The tugai floodplain forests are of particular concern in Azerbaijan. Aquatic environments and wetlands will also decline. Loss of wetlands will reduce the natural ability of aquatic systems to purify themselves and to improve water quality. This also leads to a reduction in aquatic ecosystems’ biodiversity, while increasing the need for costly water treatment for human use. Water quality, which is not raised directly as concern in any of the SNC documents, will also decrease. Increased air temperature inevitably leads to increased water temperature and decreased river flows means a lesser ability for water systems to dilute pollutants. As noted above, the reduction or loss of terrestrial as well as aquatic ecosystems will also have a negative water quality impact. Human health is also a main climate change concern. Heat stress, especially in cities, is noted in both the Azerbaijan and Armenia SNC documents. Vector borne diseases such as malaria are also expected to increase with rising temperatures. Referring back to reduced water quality, water borne diseases will also increase, unless specific attention is paid to sanitation and to improved water quality. From a transboundary waters perspective the most immediate consideration for the region is that less water will be entering across the border from their upstream neighbors, both as a direct consequence of reduced river flows due to lower precipitation and higher evaporation & evapotranspiration, and as an indirect consequence of climate driven increases in water demands of their upstream neighbors. Within this project, Azerbaijan is thought of as the downstream riparian, but also both Georgia and Armenia are downstream riparian areas of other countries not participating in this project.
- 64 -
7.6.2 Transboundary coordination for better adaptation There are many common adaptation proposals across the region, and many lend themselves to cooperation and mutual support, especially in terms of the transboundary issues in the Kura Ara(k)s river basin. Coordinated and even cooperative management of both water quantity and water quality could be easily coordinated, as has been demonstrated by several regional projects already. There is good potential for cost saving through shared information. Through such cooperative action, also common ideas for adaptation to decreased river flows and decreased water quality may present themselves. Capacity building in the various institutions involved would also benefit from coordination and cooperation. Common approaches to education in water resources management would benefit each country by reducing costs and creating a common language for adaptation to climate change. Aspects of the legal framework can also benefit from transboundary cooperation, especially in adopting existing international transboundary water management related conventions. Improving irrigation technologies, improved crop types and other aspects of agriculture can also benefit from regional cooperation, as research & development costs and experiences can be easily shared. Perhaps most importantly, transboundary water management in terms of both quality and quantity will be a benefit to all countries of the region, as it leads to shared benefits from the common resources and an increased ability to adapt to the impacts of climate change in the Kura Ara(k)s River Basin.

- 65 -
8 LITERATURE
ADB Asian Development Bank, 2008. Republic of Azerbaijan: supporting river basin and flood management planning project. Technical Assistance Consultant’s report, project number 3508102 (TA 4301), January 2008, 184 pp.
Alakbarov A. & F. Imanov, 2010. Transboundary aquifers of Azerbaijan: current conditions, challenges and mitigation possibilities. In: UNESCO-IHP-ISARM & PCCP Programs 2010. Proceedings of the ISARM 2010 International Conference “Transboundary Aquifers: Challenges and New Directions”. Paris.
AM-MENR, 2012. Ministry of Energy and Natural Resources, http://www.minenergy.am/
AM-MNP Ministry of Nature Protection of the Republic of Armenia, 2010. Second National Communication on Climate Change – a report under the United Nations Framework Convention on Climate Change, Republic of Armenia, Ministry of Nature Protection, Yerevan, Armenia, 2010, 134 pp.
Armhydroenergyproject CJSC, 2008. The update of the existing scheme for small hydropower stations of the Republic of Armenia. Renewable Energy Project GEF-TF-056211, Renewable Resources and Energy Efficiency Fund of Armenia, Yerevan 2008, 440 pp.
ArmStat, 2012. Statistical Yearbook of Armenia - 2011. National Statistical Service of the Republic of Armenia, Yerevan 2012, 624 pp.
AZ-NWS, 2011. Azerbaijan Republic National Water Strategy Draft 2011. Baku, 119 pp.
AZ-MA Ministry of Agriculture of Azerbaijan, 2012. www.agro.gov.az
AZ-MENR Ministry of Ecology and Natural Resources of the Republic of Azerbaijan, 1999. First National Communication to the UNFCCC. Baku, 1999, 88 pp.
AZ-MENR, 2010. Fourth National Report to the United Nations Convention on Biodiversity Conservation: Azerbaijan. 167 pp.
AZ-MENR Ministry of Ecology and Natural Resources of the Republic of Azerbaijan, 2010. Second National Communication to the United Nations Framework Convention on Climate Change, Ministry of Ecology and Natural Resources of Azerbaijan, Baku, 2010, 85 pp.
AzerStat, 2012. Statistical Yearbook of Azerbaijan 2012. State Statistical Committee of the Republic of Azerbaijan, Baku, 2012.
CENN/ITC, 2012. Atlas of natural hazards and risks of Georgia. Caucasus Environmental NGO Network / Faculty of Geo-Information Science and Earth Observation ITC, University of Twente, the Netherlands, 2012, Tbilisi, April 2012, 124 pp.
EBRD, 2012. Small Hydropower in Georgia and Armenia, Paravani HPP, Draft Strategic Environmental and Social Assessment, Tbilisi, 2012, 237 pp.
FAO, 2006. Country pasture/forage resources profile, FAO, Rome, 22 pp.
FAO, 2009. Irrigation in the Middle East region in figures – Aquastat survey 2008. FAO Water Reports No. 34, 2009, 423 pp.
GE-MEPNR Ministry of Environment Protection and Natural Resources of Georgia, 2009. Second National Communication to the UNFCCC, Ministry of Environment Protection and Natural Resources of Georgia Tbilisi, Georgia, 2009, 240 pp.
GE-MEPNR Ministry of Environment & Natural Resources of Georgia, 2010. National Report on the State of the Environment of Georgia 2007-2009.Tbilisi, December 2010, 207 pp.
GE-MEnNR Ministry of Energy and natural Resources, 2012. www.menr.gov.ge
GeoStat, 2007. First National Agricultural Census of Georgia. National Statistics Office of Georgia. www.geostat.ge.
GeoStat, 2012. Statistical Yearbook of Georgia, 2011. National Statistics Service of Georgia, Tbilisi, 2012, 280 pp.
Government of Georgia, 1999. Georgia’s Initial national communication under the United Nations Framework Convention on Climate Change. Tbilisi, Georgia, 1999, 138 pp.
GFDRR Global Facility for Disaster Reduction and Recovery, 2010. Central Asia and Caucasus Disaster Risk Management Initiative (CAC DRMI) - Risk Assessment for Central Asia and Caucasus Desk Study Review, 172 pp.
Hannan T., Leummens H.J.L. & Matthews M.M., 2013. Desk study – Hydrology. UNDP/GEF project “Reducing transboundary degradation in the Kura Ara(k)s river basin”, Tbilisi-Baku-Yerevan, 2013, 31 pp.
Harutyunyan L., 2012. UNDP/GEF Kura Ara(k)s Project National Expert on IWRM for Armenia – expert opinion.
Mammadov A., 2012. UNDP/GEF Kura Ara(k)s Project National Expert on Hydropower for Azerbaijan – expert opinion.

- 66 -
Rustamov S.G. & R.M. Kashkay, 1989. Water resources of the Azerbaijan SSR. Baku, 1989.
SEEC South East Europe Consultants, 2007. Georgia: Strategic Environmental Assessment of Power Sector Development. South East Europe Consultants Ltd., Final report, December 2007, 252 pp.
Tvalchrelidze A., V. Papava & A. Silagadze, 2011. Georgia’s social and economic development program. International Foundation for Sustainable Development, Open Society Georgia Foundation, Tbilisi, 2011, 242 pp.
UNDP United Nations Development Program, 2010. Armenia draft Climate Risk Management (CRM) Report.
UNDP/GEF, 2007. TDA Thematic Report - Groundwater resources of the Kura Aras River Basin. UNDP/GEF RER/03/G41/A/1G/31: Reducing Trans-boundary Degradation of the Kura-Aras River Basin, pp. 58.
UNDP/Sida, 2005. Preliminary background analysis of the Kura Aras river basin in Armenia. Technical Report, UNDP/Sida project “Reducing trans-boundary degradation of the Kura Araks river basin”, Yerevan, Armenia, 136 pp.
USAID, 2009. Biodiversity analysis update for Armenia. 196 pp.
USAID 2011. Analytical foundations assessment – agriculture (rural productivity) sector assessment, 161 pp.
World Bank, 2007. Integrating Environment into Agriculture and Forestry - Progress and Prospects in Eastern Europe and Central Asia, Volume II, Armenia Country Review.
World bank, 2009. Disaster risk reduction and emergency management in Armenia. Global facility for Disaster Risk Reduction and Recovery, “Armenia: Institutional arrangements for disaster risk management and reduction”, October 2009, World bank Europe and Central Asia Region, 59 pp.
World Bank, 2012. http://databank.worldbank.org/data/home.aspx
ZOI Environment Network, 2011. Climate change in the South Caucasus – a visual synthesis. Geneva, Switzerland, 60 pp.


![Climate Change and Security in Africa - iisd.org · Climate Change and Security in Africa] 1 Acknowledgements This desk-based report was produced with the financial support of the](https://static.fdocuments.net/doc/165x107/5b895aad7f8b9abf5c8da03e/climate-change-and-security-in-africa-iisdorg-climate-change-and-security.jpg)