
DeSimone SI R3
15
1 Supporting Information Accurate Random Coil Chemical Shifts from an Analysis of Loop Regions in Native States of Proteins Alfonso De Simone † , Andrea Cavalli † , Shang-Te Danny Hsu † , Wim Vranken ‡ and Michele Vendruscolo † †Department of Chemistry, University of Cambridge, Lensfield Road, Cambridge CB2 1EW, UK ‡ European Bioinformatics Institute, Wellcome Trust Genome Campus, Cambridge CB10 1SD, UK Database of protein structures and chemical shifts The process of combining information from PDB coordinate files and chemical shift data from the BMRB is similar to the one described previously 1 , except that only entries for which the BMRB sequence and the number of chains exactly matches the information from the PDB were retained. In case of multiple matches, only the X-ray structure with the best resolution (if available) or the closest matching NMR structure was withheld. The chemical shift values were then corrected for incorrect referencing (method to be published). This resulted in a set of 1772 BMRB/PDB entries that were written out as PDB-format like coordinate files with information about secondary structure and the reported chemical shift values added in additional columns. Dataset of experimental random coil chemical shifts The weights for the correction factors in Eq. 1 in the main text have been calibrated by using a dataset of random coil chemical shifts determined experimentally. Among the chemical shift datasets reported in the BMRB we selected five datasets measured in conditions that minimize the amount of residual structure. These datasets are: ddFLN5 2 (BMRB code: 15814), GED of dynamin denatured in 9.7M urea 3 (BMRB code: 15867), GED of dynamin denatured in 6M GuHCl 4 (BMRB code: 15868), SUMO from Drosophila melanogaster denatured in 8M urea 5 (BMRB code: 15473), Azotobacter vinelandii apoflavodoxin denatured in 6M 6 (BMRB code: 15474). These measurements were conducted at the same pH 5.5 conditions. For acid denatured states, two additional sets of experimental RCCS have been selected. These are: Ubiquitin in 8M Urea at pH 2 7 (BMRB code: 4375) and cold shock protein A (CspA) in 6M Urea at pH 2.7 8 (BMRB code: 4108). Fitting of the CamCoil parameters The parameters δ iA 0 in Eq. 1 in the main text, which represent residue-specific contributions, were calculated as averages over atoms of type i in residues of type A in flexible loops in the database of 1772 BMRB/PDB proteins described in the section “Database of protein structures and chemical shifts” above. Similarly, the parameters δ iBA 1 and δ iCA 1 , which represent the contributions from the flanking residues (of types B
Transcript of DeSimone SI R3

1
Supporting Information
Accurate Random Coil Chemical Shifts from an Analysis of Loop Regions in Native States of Proteins
Alfonso De Simone†, Andrea Cavalli†, Shang-Te Danny Hsu†, Wim Vranken‡ and Michele Vendruscolo†
†Department of Chemistry, University of Cambridge, Lensfield Road, Cambridge CB2 1EW, UK ‡European Bioinformatics Institute, Wellcome Trust Genome Campus, Cambridge CB10 1SD, UK
Database of protein structures and chemical shifts The process of combining information from PDB coordinate files and chemical shift data from the BMRB is similar to the one described previously1, except that only entries for which the BMRB sequence and the number of chains exactly matches the information from the PDB were retained. In case of multiple matches, only the X-ray structure with the best resolution (if available) or the closest matching NMR structure was withheld. The chemical shift values were then corrected for incorrect referencing (method to be published). This resulted in a set of 1772 BMRB/PDB entries that were written out as PDB-format like coordinate files with information about secondary structure and the reported chemical shift values added in additional columns. Dataset of experimental random coil chemical shifts The weights for the correction factors in Eq. 1 in the main text have been calibrated by using a dataset of random coil chemical shifts determined experimentally. Among the chemical shift datasets reported in the BMRB we selected five datasets measured in conditions that minimize the amount of residual structure. These datasets are: ddFLN52 (BMRB code: 15814), GED of dynamin denatured in 9.7M urea3 (BMRB code: 15867), GED of dynamin denatured in 6M GuHCl4 (BMRB code: 15868), SUMO from Drosophila melanogaster denatured in 8M urea5 (BMRB code: 15473), Azotobacter vinelandii apoflavodoxin denatured in 6M 6 (BMRB code: 15474). These measurements were conducted at the same pH 5.5 conditions. For acid denatured states, two additional sets of experimental RCCS have been selected. These are: Ubiquitin in 8M Urea at pH 27 (BMRB code: 4375) and cold shock protein A (CspA) in 6M Urea at pH 2.78 (BMRB code: 4108). Fitting of the CamCoil parameters The parameters
€
δiA0 in Eq. 1 in the main text, which represent residue-specific contributions, were calculated as averages over atoms of type i in residues of type A in flexible loops in the database of 1772 BMRB/PDB proteins described in the section “Database of protein structures and chemical shifts” above. Similarly, the parameters
€
δiBA1 and
€
δiCA1 , which represent the contributions from the flanking residues (of types B

2
and C, respectively), were calculated as averages of residue pairs in the same flexible loops. The weights α were optimized using the dataset of five unstructured proteins, which was described in the section “Dataset of experimental random coil chemical shifts” above, by minimizing the differences between the experimental and calculated chemical shifts. We initially determined the weights α individually for each of the five proteins in the dataset; since the results were quite similar (Fig. S2) we then simultaneously optimized all the five proteins together (Fig. 2). Next-nearest-neighbours corrections In addition to Eq. 1 in the main text, which takes into account nearest-neighbour effects, and following Schwarzinger et al.9, we also examined the effects of the next-nearest-neighbour residues
(S1) In this formula, the terms
€
δiDA2 and
€
δiAE2 represent the contributions due to amino acids D and E, which are two positions away along the sequence (to the left and to the right, respectively) from the amino acid A in which the atom i of interest belong. Fitting of the CamCoil LFP parameters We implemented a variant of CamCoil method to predict the values of the chemical shifts in the loops of native states of proteins, which is called CamCoil LFP (Loops of Folded Proteins). In this case, also the weights α, in addition to the parameters
€
δiA0 ,
€
δiBA1 and
€
δiCA1 , were fitted by using the dataset of 1772 BMRB/PDB proteins described in the section “Database of protein structures and chemical shifts”. We tested the method by removing from the database 10% of the data to employ as cross validation test (Fig. S9). The remaining 90% of the database has been used for fitting the parameters.
€
δ iARC = δ iA
0 +α i−δ iBA1 +α i
+δ iAC1 +α i
−−δ iDA2 +α i
++δ iAE2
3
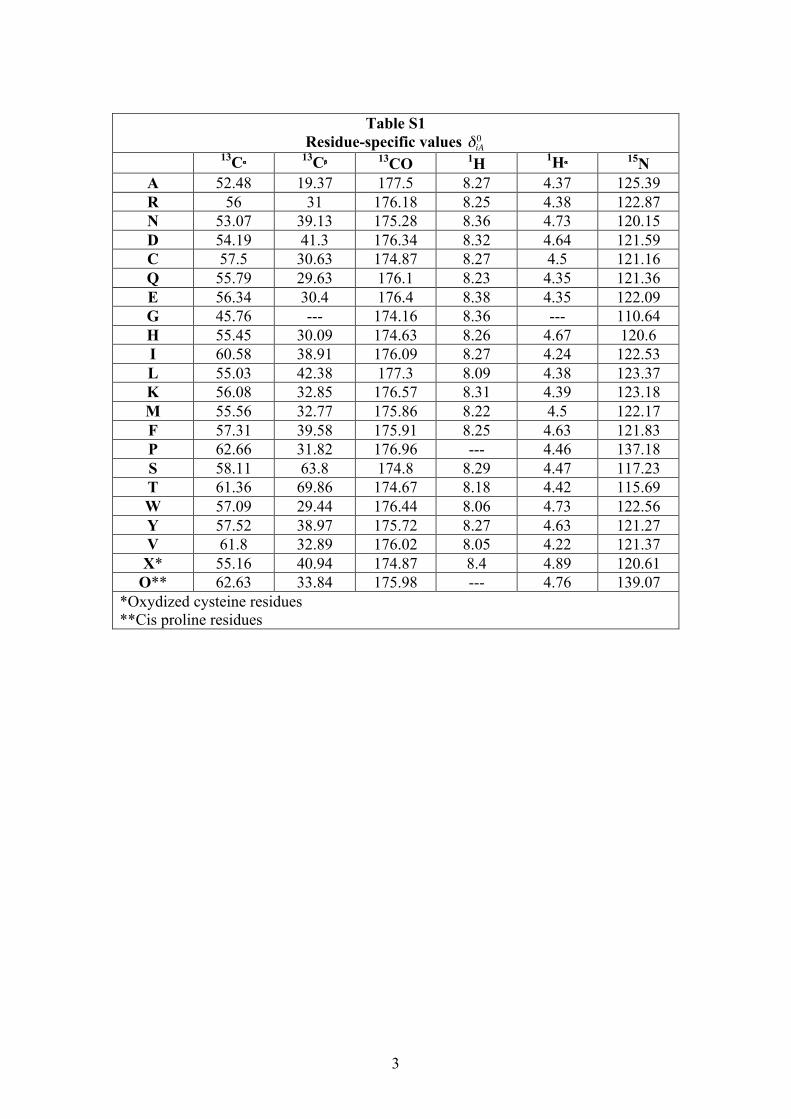
Table S1
Residue-specific values
€
δiA0 13Cα 13Cβ 13CO 1H 1Hα 15N
A 52.48 19.37 177.5 8.27 4.37 125.39 R 56 31 176.18 8.25 4.38 122.87 N 53.07 39.13 175.28 8.36 4.73 120.15 D 54.19 41.3 176.34 8.32 4.64 121.59 C 57.5 30.63 174.87 8.27 4.5 121.16 Q 55.79 29.63 176.1 8.23 4.35 121.36 E 56.34 30.4 176.4 8.38 4.35 122.09 G 45.76 --- 174.16 8.36 --- 110.64 H 55.45 30.09 174.63 8.26 4.67 120.6 I 60.58 38.91 176.09 8.27 4.24 122.53 L 55.03 42.38 177.3 8.09 4.38 123.37 K 56.08 32.85 176.57 8.31 4.39 123.18 M 55.56 32.77 175.86 8.22 4.5 122.17 F 57.31 39.58 175.91 8.25 4.63 121.83 P 62.66 31.82 176.96 --- 4.46 137.18 S 58.11 63.8 174.8 8.29 4.47 117.23 T 61.36 69.86 174.67 8.18 4.42 115.69 W 57.09 29.44 176.44 8.06 4.73 122.56 Y 57.52 38.97 175.72 8.27 4.63 121.27 V 61.8 32.89 176.02 8.05 4.22 121.37 X* 55.16 40.94 174.87 8.4 4.89 120.61
O** 62.63 33.84 175.98 --- 4.76 139.07 *Oxydized cysteine residues **Cis proline residues

4
Table S2
Weight factors for the pairwise correction terms in CamCoil 13Cα 13Cβ 13CO 1H 1Hα 15N
€
α i−− 0.04 0.08 0.00 0.10 0.06 0.10
€
α i− 0.20 0.20 0.00 0.18 0.28 0.74
€
α i+ 0.52 0.38 0.60 0.18 0.28 0.14
€
α i++ 0.10 0.10 0.26 0.04 0.02 0.12
5
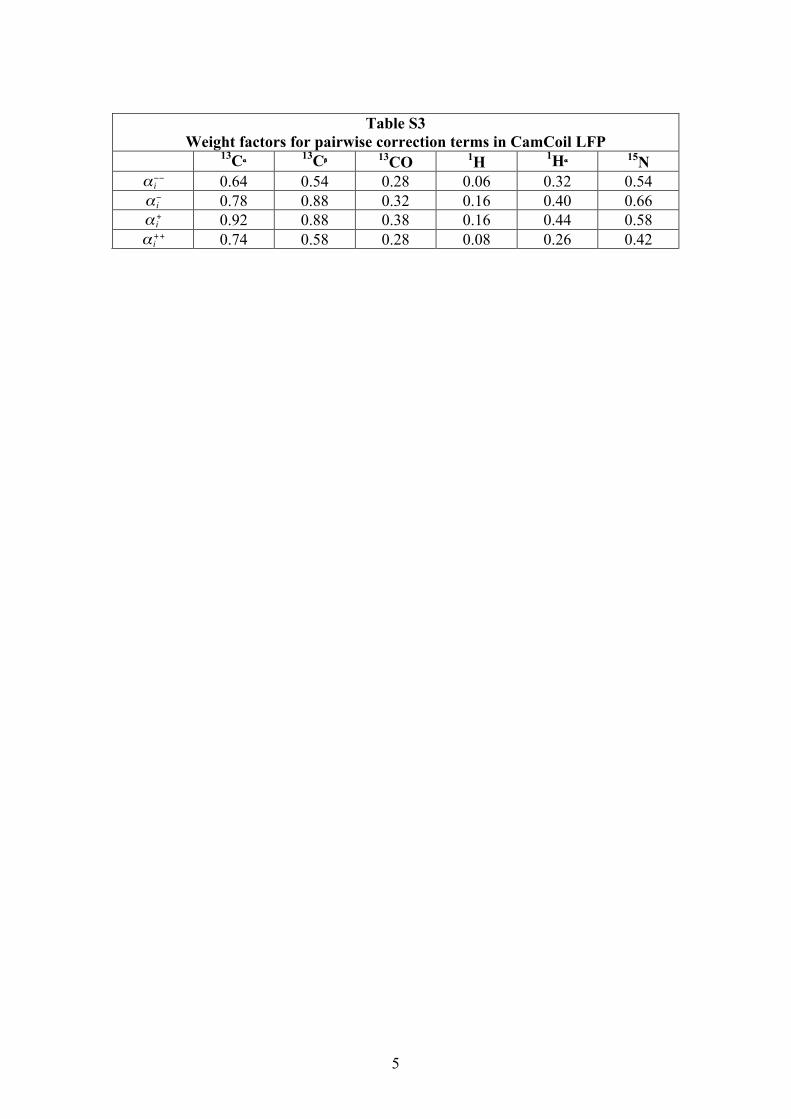
Table S3
Weight factors for pairwise correction terms in CamCoil LFP 13Cα 13Cβ 13CO 1H 1Hα 15N
€
α i−− 0.64 0.54 0.28 0.06 0.32 0.54
€
α i− 0.78 0.88 0.32 0.16 0.40 0.66
€
α i+ 0.92 0.88 0.38 0.16 0.44 0.58
€
α i++ 0.74 0.58 0.28 0.08 0.26 0.42

6
Figure S1. Distribution of S2 order parameters in the loop residues in the database of 1772 BMRB/PDB proteins. In addition to the absence of secondary structure, the selection criteria for the CamCoil database included a flexibility above a threshold value S2 = 0.5, using the S2 order parameter estimated with the RCI method10.

7
Figure S2. Root mean square (RMS) distance surfaces as a function of the parameters
€
α i− and
€
α i+; we illustrate these surfaces in the case of 13Cα chemical shifts. The RMS
distances define the agreement of experimental chemical shifts and CamCoil random coil chemical shifts. The surfaces are calculated for different proteins, but are very similar and reveal consistent locations for the minima: A) ddFLN5 (BMRB code: 15814). B) SUMO from Drosophila melanogaster in 8M urea (BMRB code: 15473). C) GED of dynamin in 9.7M urea (BMRB code: 15867). D) GED of dynamin in 6M GuHCl (BMRB code: 15868). E) Azotobacter vinelandii apoflavodoxin in 6M GuHCl (BMRB code: 15474).

8
Figure S3. Example of the agreement between experimental chemical shifts with the random coil chemical shifts determined in this work; for illustrative purposes we present the case of ddFLN5. A) 13Cα, R= 0.9989, RMS= 0.236 ppm. B) 13Cβ, R= 0.9997, RMS= 0.283 ppm. C) 13CO, R= 0.9388, RMS= 0.352 ppm. D) 1H, R= 0.7392, RMS= 0.077 ppm. E) 1Hα, R=0.9748, RMS= 0.037 ppm. F) 15N, R= 0.9907, RMS= 0.621 ppm.

9
Figure S4 Average RMS distance for the five experimental sets of chemical shifts that we considered in this work. Errorbars indicate standard deviations. Red and green bars refer to the CamCoil and the Schwarzinger et al.11 methods, respectively. In both cases, we present results relative to the residue-specific values
€
δiA0 without corrections from the neighbours.

10
Figure S5. Comparison of the residue-specific
€
δiA0 values from the CamCoil and the Schwarzinger et al.9, 11 methods. A) 13Cα; B) 13Cβ; C) 15N; D) 13CO; E) 1Hα; F) 1H.

11
Figure S6. Average RMS for the five experimental sets of chemical shifts that we considered in this work. Errorbars indicate standard deviations. Red and green bars refer to the CamCoil method with and without correction factors, respectively.

12
Figure S7. Distribution of the pH values at which the NMR measurements were carried out for the proteins in the database from which CamCoil parameters have been determined; the average pH is 6.1.
13
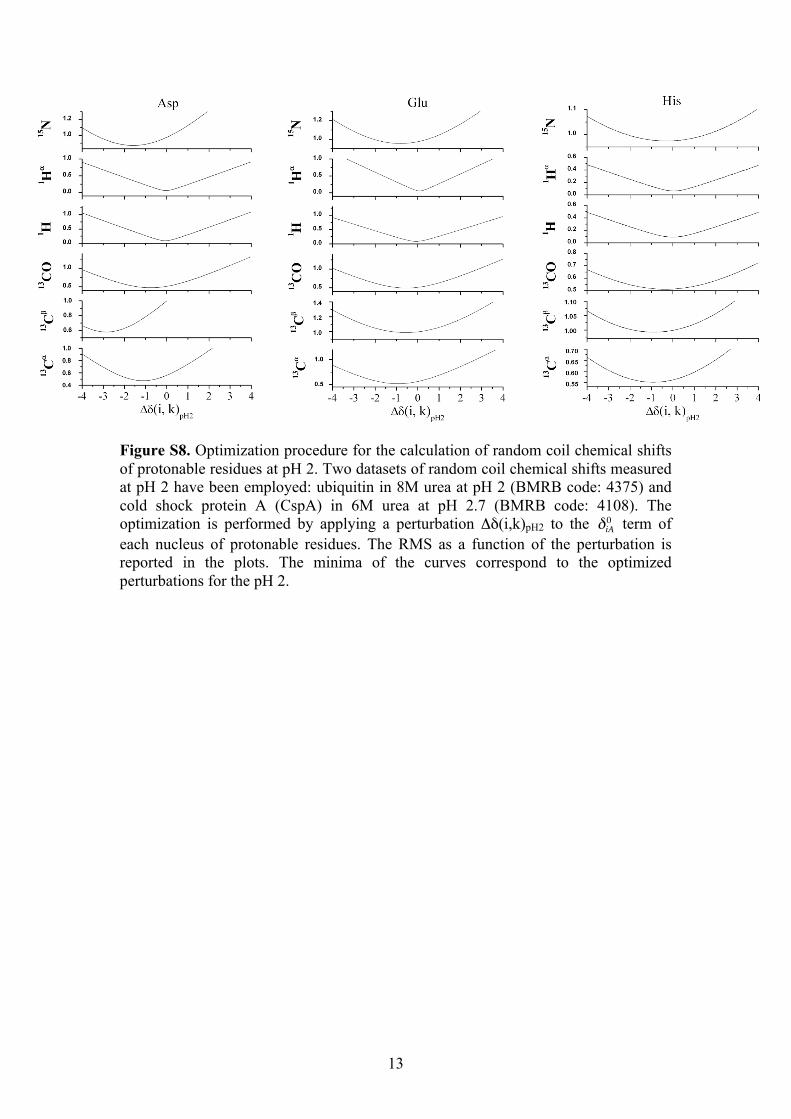
Figure S8. Optimization procedure for the calculation of random coil chemical shifts of protonable residues at pH 2. Two datasets of random coil chemical shifts measured at pH 2 have been employed: ubiquitin in 8M urea at pH 2 (BMRB code: 4375) and cold shock protein A (CspA) in 6M urea at pH 2.7 (BMRB code: 4108). The optimization is performed by applying a perturbation Δδ(i,k)pH2 to the
€
δiA0 term of each nucleus of protonable residues. The RMS as a function of the perturbation is reported in the plots. The minima of the curves correspond to the optimized perturbations for the pH 2.
14
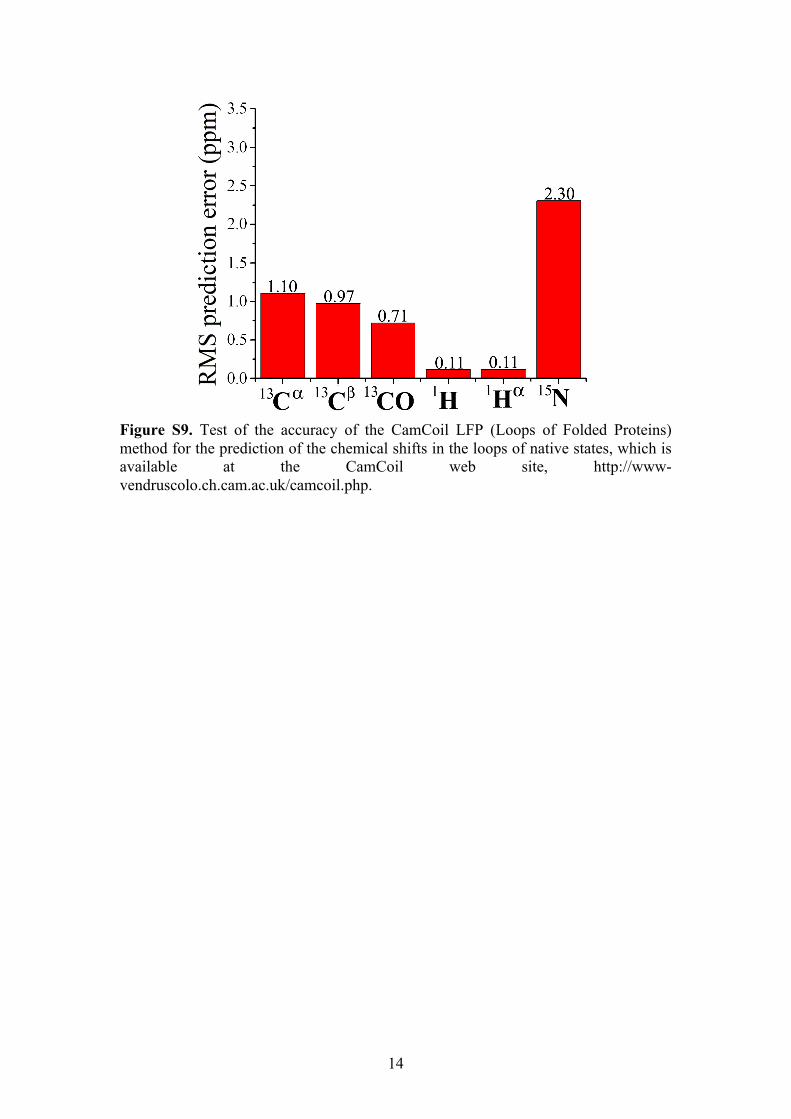
Figure S9. Test of the accuracy of the CamCoil LFP (Loops of Folded Proteins) method for the prediction of the chemical shifts in the loops of native states, which is available at the CamCoil web site, http://www-vendruscolo.ch.cam.ac.uk/camcoil.php.

15
References (1) Vranken, W. F.; Rieping, W. BMC Struct. Biol. 2009, 9. (2) Hsu, S. T. D.; Cabrita, L. D.; Fucini, P.; Dobson, C. M.; Christodoulou, J. J. Mol. Biol. 2009, 388, 865-879. (3) Chugh, J.; Sharma, S.; Hosur, R. V. Arch. Bioch. Bioph. 2009, 481, 169-176. (4) Chugh, J.; Sharma, S.; Hosur, R. V. Biochemistry 2007, 46, 11819-11832. (5) Kumar, D.; Kumar, A.; Misra, J. R.; Chugh, J.; Sharma, S.; Hosur, R. V. Biomol. NMR Assign. 2008, 2, 13-15. (6) Nabuurs, S. M.; Westphal, A. H.; van Mierlo, C. P. M. J. Am. Chem. Soc. 2008, 130, 16914-16920. (7) Peti, W.; Smith, L. J.; Redfield, C.; Schwalbe, H. J. Biomol. NMR 2001, 19, 153-165. (8) Alexandrescu, A. T.; Rathgeb-Szabo, K. J. Biomol. NMR 1998, 11, 461-462. (9) Schwarzinger, S.; Kroon, G. J. A.; Foss, T. R.; Chung, J.; Wright, P. E.; Dyson, H. J. J. Am. Chem. Soc. 2001, 123, 2970-2978. (10) Berjanskii, M. V.; Wishart, D. S. Nucl. Acids Res. 2007, 35, W531-W537. (11) Schwarzinger, S.; Kroon, G. J. A.; Foss, T. R.; Wright, P. E.; Dyson, H. J. J. Biomol. NMR 2000, 18, 43-48.


![COMPUTER ORGANIZATION & ARCHITECTURE · mov r3, h r3 m [h] add r3, g r3 r3+m [g] div r1, r3 r1 r1/r3 mov x, r1 m[x] r1 page 4 of 16 knreddy computer organization and architecture.](https://static.fdocuments.net/doc/165x107/6144b5c334130627ed50859a/computer-organization-architecture-mov-r3-h-r3-m-h-add-r3-g-r3-r3m-g.jpg)