

DESIGNING HEALTH in VIRGINIA: VIRGINIA as the … HEALTH in VIRGINIA: VIRGINIA as the HEALTHIEST...
22
1 DESIGNING HEALTH in VIRGINIA: VIRGINIA as the HEALTHIEST STATE IN THE NATION Marissa J. Levine, MD, MPH State Health Commissioner
-
Upload
nguyenduong -
Category
Documents
-
view
213 -
download
0
Transcript of DESIGNING HEALTH in VIRGINIA: VIRGINIA as the … HEALTH in VIRGINIA: VIRGINIA as the HEALTHIEST...
1
DESIGNING HEALTH in VIRGINIA:
VIRGINIA as the HEALTHIEST
STATE IN THE NATION
Marissa J. Levine, MD, MPH
State Health Commissioner

2
VIRGINIA’S PLAN FOR WELL BEING:
AN APPROACH

3
Plan For Well-Being Components
• Vision
• Data Driven/Evidence Based
• Process for Improvement
• Regional/Local Focus

4
Vision:
Virginia is the Healthiest State in
the Nation

5
Well Being Components: Data Driven
Statewide focus on agreed upon well-being metrics
for Virginia – metric alignment
Specific focus on metrics that quantify Virginian’s
investment in children’s well being = Strong Start
Other metrics focused on:
• Health/Disease Burden (Mortality, Morbidity metrics)
• Cost Burden

7

8
Well Being Components: Process/System Design
Standardized Local/Regional Community Health
Assessment
Design a process of coordinated action resulting
from assessments/metrics and informed by
evidence
Continual evaluation and reevaluation to ensure
improvement in health and well being

9
http://www.nap.edu/read/19402/chapter/1

10
Framework for Well-Being in Virginia
Strong Start for
Children
Physical Wellness
Emotional Wellness
Aging Well
Preventive
Actions Quality
Healthcare
Healthy, Connected Community
Well-Being

11
Plan for Well Being Metrics HEALTHY, CONNECTED COMMUNITIES
Consumer Opportunity Profile
Economic Opportunity Profile
Percent of the Commonwealth Connected via a Statewide
Health Information Exchange
STRONG START FOR CHILDREN
Teen Pregnancy Rate
Preterm Birth Rate
Thriving Infant Rate
Childhood Obesity/Overweight Rate
Percentage of Children in Kindergarten Not Meeting PALS
K Benchmarks and Requiring Literacy Interventions
Percent of Third Graders Who Passed the SOL Third Grade
Reading Assessment
QUALITY HEALTHCARE
Avoidable Hospital Stays
Percent of Adults Who Report Having a
Regular Healthcare Provider
Percent of Hospitals Meeting Virginia’s Goal for
Prevention of Hospital-onset Clostridium difficile
Infections
Cost of Healthcare
PREVENTIVE ACTIONS
Percent of Children Aged 19-35 Months Who Received the
Recommended Vaccines
Percent of Girls/Boys Aged 13-17 Who Received Three Doses of
Human Papilloma Virus (HPV) Vaccine
Percent of Adults 18 Years and Older Who Received an Annual
Influenza Vaccination
Percent of Females Aged 50 to 74 Years Who Received Breast
Cancer Screening
Percent of Adults Aged 50 to 75 Years Who Received Colorectal
Cancer Screening
Percent of Virginian Adults (18 years old and up) Who Report
Using Tobacco
WELL BEING: PHYSICAL & EMOTIONAL WELLNESS; AGING WELL
Percent of Adults Who Reported One or More Days of Poor Health
That Kept Them from Doing Usual Activities
Percent of Adults Who Did Not Participate In Any Physical
Activities Other Than Their Regular Job during the Past 30 Days
Rate of Injury Hospitalization
Rate of Mental Health and Substance Use Disorder Hospitalization
in Adults
Life Expectancy

Healthy, Connected Communities
Short Horizon Metrics Long Horizon Metrics
Consumer Opportunity Profile
Full Health Opportunity Index
• Includes environmental issues
• Add measure of social capital,
connectedness to index
Economic Opportunity Profile
Percent of the Commonwealth
Providers Connected via a
Statewide Health Information
Exchange
• Broadband and cell phone
connectivity/coverage
• Other connectivity metrics
13
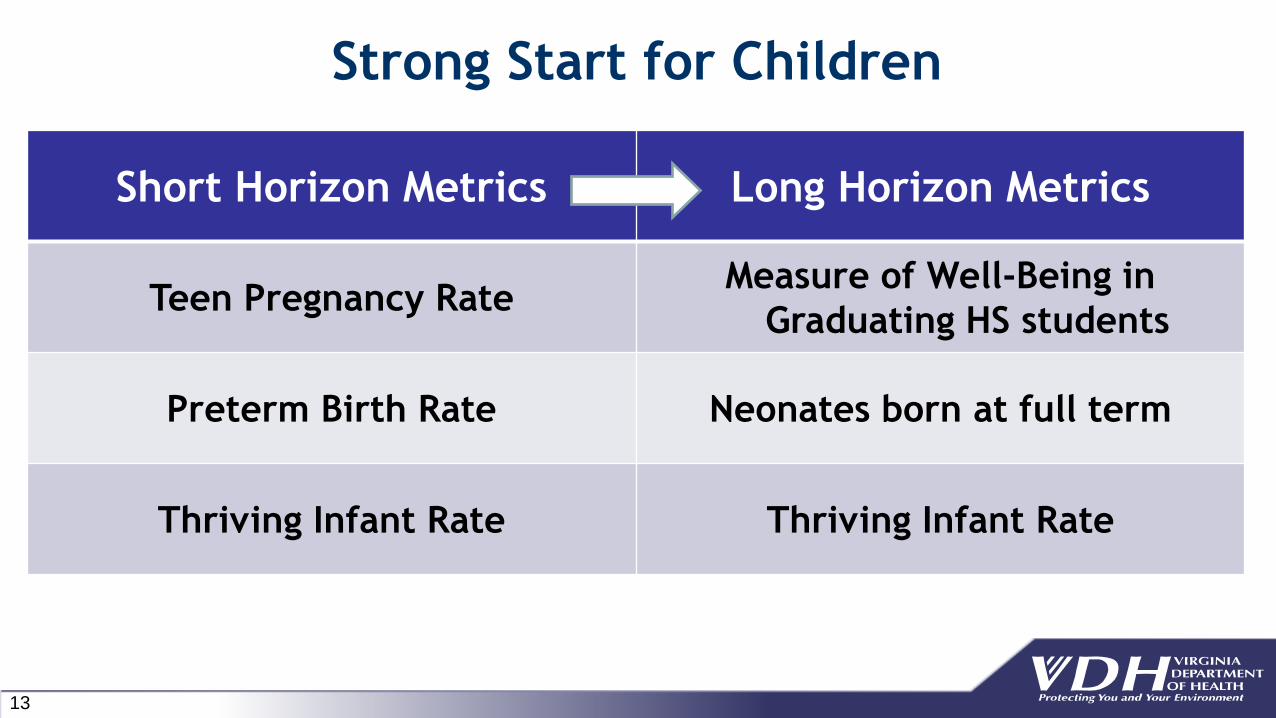
Strong Start for Children
Short Horizon Metrics Long Horizon Metrics
Teen Pregnancy Rate Measure of Well-Being in
Graduating HS students
Preterm Birth Rate Neonates born at full term
Thriving Infant Rate Thriving Infant Rate

14
Strong Start for Children
Short Horizon Metrics Long Horizon Metrics
Childhood Overweight/Obesity
Rates
Source: YRBS Self Report or School Reports
Children At Healthy Weight at
Key Milestones
Percent of Children in Fall of
Kindergarten Not Meeting PALS
K Benchmarks
Percent Attaining Kindergarten
Reading Benchmarks
Percent of Third Graders Who
Passed the SOL Reading
Assessment
Same

15
Quality Healthcare
Short Horizon Metrics Long Horizon Metrics
Avoidable Hospitalization Rate Metric related to accessibility of
appropriate care when needed
Percent of Adults Who Report
Having a Regular Healthcare
Provider Source: BRFSS Self Report
Percent of people in an integrated
health home (medical, behavioral,
dental)
Percent of Hospitals Meeting
Virginia’s Goal for Prevention of
Hospital-onset Clostridium
difficile Infections
Evolving healthcare safety metric

16
Quality Healthcare
Short Horizon Metrics Long Horizon Metrics
Per capita healthcare
expenditure (Total cost)
•Trending inpatient and outpatient
costs comparatively
•Capture health care spending relative
to income (measure of burden)

17
Preventive Actions
Short Horizon Metrics Long Horizon Metrics
Percent of Two-Year Olds with
Up-to-date Immunizations Percent of Population
without vaccine-
preventable disease
Percent of Adolescents Fully
Vaccinated Against HPV
Percent of Adults Vaccinated
Against Influenza

18
Short Horizon Metrics Long Horizon Metrics
Percent of Adults Who Use
Tobacco Source: BRFSS Self Report
Percent of Population Free of
Lung Cancer/Tobacco related
illness
Percent of Adults Screened for
Colorectal Cancer Source: BRFSS Self Report
Percent of Population Free of
Colorectal Cancer
Percent of Females Screened for
Breast Cancer Source: BRFSS Self Report
Percent of Population Free of
Breast Cancer
Preventive Actions

19
Well Being
Short Horizon Metrics Long Horizon Metrics
Percent of Adults Who Report
Poor Health Kept Them from
Usual Activities Source: BRFSS Self Report
Percent of Population Reporting
Health and Well-Being
Percent of Adults Who Did Not
Participate in any Physical
Activities Other than Their
Regular Job Source: BRFSS Self Report
Percent of Adults Who are
Physically Fit

20
Well Being
Short Horizon Metrics Long Horizon Metrics
Rate of Injury Hospitalization by Age Group
Life Expectancy at Birth Disability Adjusted Life Years (DALYs);
Measure Of Functional Well-Being in
Older Adults
Rate of Mental Health and
Substance Use Disorder
Hospitalization in Adults
Percent of Population reporting no
behavioral health/substance use issues
impacting daily functioning

21

22
Healthiest State in the Nation
Imagine with me as we envision a Virginia that is
the healthiest state
Our collective vision and aligned efforts are the
only ways to get there
Thank you for all you do for the people of Virginia


