The designing of bracing connections in Tekla Structures ...

DESIGNING FOOD STRUCTURES ── to enhance sensory responses ──
Ana Carolina Mosca

Thesis committee Thesis supervisor Prof. dr. ir. Martinus A. J. S. van Boekel Professor of Product Design and Quality Management Wageningen University, Wageningen, NL Thesis co-supervisors Dr. Markus A. Stieger Assistant Professor, Division of Human Nutrition Wageningen University, Wageningen, NL Dr. ir. Fred van de Velde Group Leader Ingredient Technology Nizo Food Research, Ede, NL Other members Prof. dr. Erik van der Linden, Wageningen University, Wageningen, NL Prof. dr. E. Allen Foegeding, North Carolina State University, Raleigh, USA Dr. Christian Salles, INRA, Dijon, FR Dr. Johanneke L.H.C. Busch, Unilever R&D, Vlaardingen, NL This research was conducted under the auspices of the Graduate School of Food Technology, Agrobiotechnology, Nutrition and Health Sciences (VLAG).

DESIGNING FOOD STRUCTURES ── to enhance sensory responses ──
Ana Carolina Mosca
Thesis
submitted in fulfillment of the requirements for the degree of doctor at Wageningen University
by the authority of the Rector Magnificus Prof. dr. M.J. Kropff, in the presence of the
Thesis Committee appointed by the Academic Board to be defended in public
on Thursday 10 May 2012 at 11 a.m. in the Aula

Ana Carolina Mosca Designing food structures to enhance sensory responses, 164 pages. Thesis, Wageningen University, Wageningen, NL (2012) With references, with summaries in Dutch and English ISBN 978-94-6173-247-7

ABSTRACT
Background and Aim
The current overconsumption of sugar, salt and fat has been linked to the incidence of health problems. For this reason, it is necessary to decrease the intake of these food components. In the context of reducing the contents of sugar, salt and fat in food products while maintaining sensorial quality, the aim of this thesis was to identify and understand the factors that affect the perception of taste and fat-related sensory attributes in semi-solid foods. To achieve this aim, the relationship between the spatial distribution of sucrose, the mechanical properties of semi-solid gels and the perception of taste was investigated in detail. In addition, the relationship between the spatial distribution of fat and the perception of fat-related sensory attributes was investigated. Methods
Model systems composed of layers of mixed agar-gelatin gels were used to control the spatial distribution of sucrose and fat. Layers varying in concentration of sucrose or oil-in-water emulsion droplets (i.e. fat) were combined to prepare gels with homogeneous and inhomogeneous distributions of sucrose and fat. A series of experiments were carried out using 2-Alternative Forced Choice (2-AFC) tests, line scale ratings and time-intensity analysis to investigate the effects of modulation of the spatial distribution of sucrose and modulation of the mechanical properties of gels on sweetness intensity. The relationship between the spatial distribution of tastants and consumer preference was investigated in different types of foods (e.g. semi-solid gels, breads and sausages). Furthermore, a Quantitative Descriptive Analysis (QDA) panel was carried out to investigate the effect of modulation of the spatial distribution of fat on the perception of fat-related sensory attributes. Results
An inhomogeneous distribution of sucrose at large sucrose concentration differences enhanced sweetness intensity. The frequency of high-intensity discontinuous stimulation of taste receptors, which is related to the presence of tastant concentration differences in the mouth during oral processing, was identified as the driving factor for taste enhancement. The oral breakdown of semi-solid gels, which is affected mainly by fracture strain, and the mixing behavior of gel fragments formed upon breakdown were shown to influence the frequency of receptor stimulation and, consequently, taste enhancement. Furthermore, the optimum frequency of high-

intensity discontinuous stimulation required to maximize taste enhancement was shown to depend on the textural properties of the gel. These findings suggest that the spatial distribution of tastants and the mechanical properties (especially fracture strain) can be modulated to maximize taste enhancement. Additionally, consumer preference was found to be maintained or increased in products containing tastants heterogeneously distributed in the food matrix.
Fat-related mouthfeel attributes, such as spreadable and melting, were enhanced by an inhomogeneous distribution of fat at large fat concentration differences. The presence of high-fat zones on the surface of the model system was shown to maximize the enhancement of attributes related to fat. Therefore, the enhancement of fat-related attributes seems to be driven by the presence of high-fat zones preferably on the surface of the product rather than by the presence of fat concentration differences within the product. Conclusions
The combined effects of modulation of the spatial distribution of tastants and fat and modulation of the mechanical properties can be applied in the development of low-sugar, low-salt and low-fat food products with improved taste quality.

TABLE OF CONTENTS Chapter 1 Introduction 9 Chapter 2
Enhancement of sweetness intensity in gels by inhomogeneous distribution of sucrose Published in Food Quality and Preference (2010) 21: 837-842
17
Chapter 3
Effect of gel texture and sucrose spatial distribution on sweetness perception Published in LWT - Food Science and Technology (2012) 46: 183-188
31
Chapter 4
Taste enhancement in gelled products: Effect of fracture properties on oral breakdown, bolus formation and sweetness intensity Submitted for publication
45
Chapter 5
Effect of tastant concentration differences on taste intensity, taste intensity fluctuation and consumer preference Submitted for publication
63
Chapter 6
Effect of sucrose concentration profile of consecutive stimuli on sweetness intensity Submitted for publication
79
Chapter 7
Inhomogeneous distribution of fat enhances the perception of fat-related sensory attributes in gelled foods Published in Food Hydrocolloids (2012) 27: 448-455
95
Chapter 8
General discussion 113 Summary 133
Summary in Dutch 139
References 147
Acknowledgments 155
About the author
159


Chapter1 ── Introduction ──

| Chapter 1
10 |
INTRODUCTION In recent years, more attention has been given to the health benefits of foods. In this context, the demand for food products with reduced contents of sugar, salt and fat has increased. The current intake of sugar, salt and fat exceeds the recommended values established by dietary guidelines and has been linked to the incidence of health problems1-3. Therefore, in an attempt to reduce the intake of these food components, extensive research has been conducted on the development and manufacturing of low-sugar, low-salt and low-fat food products.
Sugar, salt and fat are important contributors to the organoleptic properties and to the palatability of food products. As these food components present several functional properties, reductions in their contents affect not only taste, but also aroma, texture and appearance4-10. Consequently, the acceptability of low-sugar, low-salt and low-fat products tends to be compromised11-15.
Most strategies available to reduce sugar, salt and fat did not succeed in maintaining the sensorial quality and, consequently, the consumer appreciation for low-sugar, low-salt and low-fat products. For that reason, there is a need for strategies that overcome the current limitations of reducing sugar, salt and fat without compromising the overall quality of food products. The Challenge of Reducing Sugar and Salt in Food Products
Sucrose, the most consumed sugar, is extensively used in food manufacturing as a source of sweetness and energy (primary function), enhancer of taste and aroma, preservative, contributor to color development and provider of volume and consistency to the structure16. The current overconsumption of sucrose and other added sugars led health organizations to establish an upper limit for sugar intake2. Sugars promote a positive energy balance and some studies suggested a link between high sugar intake and the occurrence of obesity, dental caries, diabetes and other diseases. However, there is no conclusive evidence that indicates the intake of sugars as a single factor in the occurrence of these diseases17, 18.
Salt (NaCl) has an important role in taste, flavor, texture, preservation and shelf-life stability of processed foods. The ion sodium (Na+) is the main responsible for eliciting salty taste19. There is strong evidence linking an excessive consumption of sodium to rises in blood pressure and to a consequent increase in the risk of cardiovascular diseases3, 20. Processed foods such as bread, cereals and ready-to-eat meals are the

Introduction |
11 |
main sources of salt in the Western diet21-23. For that reason, the food industry is committed in defining successful strategies to reduce salt in food products.
Several strategies have been proposed to reduce sugar and salt in foods. These strategies comprise the use of tastant replacers, substitutes and flavor enhancers, stepwise reductions of tastant levels over time and the modulation of taste perception through multisensory interactions and through the pattern of delivery of taste stimuli.
A wide range of compounds has been used to replace or substitute sugar and salt. High-intensity and bulk sweeteners are present in several low-sugar products available in the market. However, their use is limited due to undesirable effects on the sensorial quality, such as development of metallic and bitter aftertaste24 and deterioration of mouthfeel properties16. The replacement of NaCl by potassium chloride (KCl) and other salts is a strategy that has been used to reduce sodium in processed foods. The limitation in the use of alternative salts lies in the decline of sensorial quality (e.g. development of metallic and bitter taste and loss of texture), loss of stability, processing problems and increase of costs. The negative taste/flavor aspects of alternative salts can be compensated by the addition of flavor enhancers, masking agents and bitter binders25-28. As single compounds cannot provide all functions of sugar and salt, combinations of tastants replacers or substitutes are usually made to minimize the loss of quality29.
The level of tastants in the diet was shown to alter taste response and taste preference 30-32. In this context, a gradual and progressive reduction of tastants in foods has been proposed as a strategy to reduce the intake of tastants by shifting consumer preference to low tastant levels30,
33. This strategy allowed for salt reduction in bread without affecting consumer acceptability34,
35. However, the benefits from this reduction strategy are only seen over a long term, since reductions occur in small steps to avoid an abrupt decline in acceptance. Furthermore, this strategy requires the commitment of all manufacturers of a specific product category to avoid shifts between brands36.
The use of multisensory integration principles to modulate and enhance the perception of taste is an alternative strategy to reduce tastants in foods. It is known that suppressing or enhancing effects are obtained by the simultaneous presentation of stimuli from different sensory modalities37,
38. In this context, the addition of aromas (i.e. volatile compounds) was shown to enhance taste intensity in tastant-water solutions due to cross modal aroma-taste interactions. The observed enhancement depended on the quality (i.e. specific aroma-taste associations) and on the intensity of

| Chapter 1
12 |
the aroma39-43. Aroma-induced taste enhancement was also observed in complex matrices. The saltiness of solid model cheese was enhanced by Comté cheese and sardine aromas. Carrot aroma, which is not associated with salty taste, did not enhance saltiness41. The addition of aromas naturally present in apples was shown to enhance sweetness of apple juice. A sucrose reduction of up to 15% could be achieved without compromising taste44,
45. Based on the potential of aromas to enhance taste intensity, the use of aromas was proposed as a strategy to compensate for the loss of taste that results from sugar and salt reduction36, 41, 46. However, the addition of single aromas was shown to cause undesirable changes in the odor quality44,
45. Therefore, the
successful application of the aroma-induced taste enhancement strategy in food products requires a screening of compounds and concentrations that maximize taste enhancement and minimize undesirable effects. Since aroma-induced taste enhancement is aroma-specific and product-specific, the screening needs to be done for each product individually. Furthermore, as other sensory attributes besides taste are affected by tastant reductions, the use of aroma-induced taste enhancement as a single strategy to compensate for the overall quality loss becomes limited.
Taste perception can also be modulated and enhanced through the pattern of delivery of taste stimuli. Temporal variations of tastant concentration (i.e. tastant concentration differences) during the consumption of liquids were shown to enhance taste perception47-49. Variations of tastant concentration were obtained by alternating the delivery of pulses of solutions containing low and high concentrations of tastants. The mechanisms suggested to explain the observed taste enhancement include a reduction of adaptation of taste receptors and an increase in the burst frequency of afferent gustatory fibers due to sequential phasic responses of receptors47, 48. The use of tastant concentration differences was proposed as a promising strategy to reduce the contents of salt and sugar in liquids48,
49. To determine the potential of applying
this reduction strategy in commercial food products, the effect of variations of tastant concentration on the perception of taste in complex matrices should be assessed in detail. In this thesis, the presence of concentration differences of food components (e.g. tastants and fat) in food matrices will be referred to as the inhomogeneity concept.

Introduction |
13 |
Effect of Mechanical and Rheological Properties on Taste Perception
It is well known that the mechanical and rheological properties of foods affect the perception of taste. Increases in the viscosity of liquids50-53 or in the hardness or firmness of (semi-)solids54-56 are frequently related to taste suppression.
Two mechanisms may explain the effects of mechanical and rheological properties on taste: perceptual and physicochemical mechanisms. Perceptual mechanisms involve texture-taste cross-modal interactions37,
57. Physicochemical mechanisms involve the mobility of tastants through the matrix and the release of tastants from the matrix51,
58-
60. These two mechanisms may occur simultaneously depending on the textural characteristics of the food product61.
During oral processing, (semi-)solid foods are broken down into fragments, which are then reduced in size, mixed and lubricated with saliva and fluids released from the product to prepare the bolus for swallowing62,
63. The breakdown and mixing contribute to the release of tastants from the food matrix and facilitate the contact of tastants with taste receptors. The pattern of release of tastants from the matrix has been suggested to play an important role in the perception of taste in different types of products. In viscous solutions, the release of tastants was shown to be affected by the mixing behavior of the solution60, 64, 65. In semi-solids, the release was shown to be affected by the fracture properties of the matrix60,
66. Therefore, in order to fully understand the relationship between mechanical properties and taste perception in (semi-)solids, the breakdown and mixing that occur during oral processing should be taken into account. The Challenge of Reducing Fat in Food Products
With the rise of health concerns associated with a diet rich in fat, a decrease in the daily intake of dietary fat, together with a decrease in the intake of cholesterol and saturated fatty acids have been recommended1. Besides providing energy and supplying essential fatty acids and fat-soluble vitamins to the diet, fats contribute to the texture and bulk properties, flavor and mouthfeel of food products67, 68. The main challenge of reducing fat is to overcome the detrimental loss of flavor and mouthfeel sensations elicited by fat29. Reductions of fat are often related to undesirable changes in the sensorial quality of products and to decreases in palatability7-10, 69. As a consequence, consumer liking and the acceptability of low- and reduced-fat products tend to be compromised70.

| Chapter 1
14 |
The main strategy applied in the manufacturing of low- or reduced-fat products involves changes in the formulation of products combined with the use of fat mimetics (carbohydrate- or protein-based compounds) or fat substitutes (fat-based compounds). Fat substitutes and mimetics can imitate the structural behavior and functionality of fat due to their physical and chemical properties. Fat substitutes or mimetics are usually used in combinations depending on the functional property that needs to be maintained29, 71.
Similarly to the scenario of tastant reduction, there is a need for alternative strategies to reduce fat in foods without compromising the overall quality. Aromas were shown to modulate the perception of fat-related texture attributes in custard desserts72 and Na-caseinate gels73. These findings suggest that aromas could be used to compensate for the changes in texture that result from fat reduction. As tastant concentration differences were shown to enhance the perception of taste in liquids, one can hypothesize that the inhomogeneity concept could be applied to enhance the responses of other sensory modalities, such as the perception of attributes related to fat (e.g. flavor and mouthfeel attributes). Therefore, the feasibility of modulating the perception of fat-related sensory attributes through the use of the inhomogeneity concept should be assessed.
RATIONALE AND THESIS OUTLINE
The need to reduce the intake of sugar, salt and fat calls for strategies that allow for reductions of tastants and fat without compromising the overall quality of food products. The use of the inhomogeneity concept was proposed as a promising reduction strategy in liquids due to its potential to enhance taste48, 49. Therefore, to explore the applicability of this strategy in commercial food products, the effect of tastant concentration differences on taste perception should be investigated in complex matrices. In this context, the effect of the spatial distribution of sucrose (i.e. sucrose concentration differences) on the perception of taste in semi-solids was selected as the first topic to be investigated in this thesis. As the mechanical properties of semi-solids are known to affect the perception of taste54-56, the effect of mechanical properties on taste perception was selected as the second topic to be investigated.
The aim of this thesis was to identify and understand the factors that affect the perception of taste in semi-solid foods. To achieve this aim, the relationship between the spatial distribution of sucrose, the mechanical properties of semi-solid gels and the perception of taste was investigated in detail. Additionally, the relationship between

Introduction |
15 |
the spatial distribution of fat and the perception of fat-related sensory attributes was investigated. The knowledge about the underlying factors of perception of sensory attributes can give important insights into the design of low-sugar, low-salt and low-fat food products with improved sensorial quality.
The scheme shown in Figure 1.1 represents an overview of the relationship between spatial distribution of tastants, mechanical properties and taste perception as investigated in this thesis.
An overview of the strategies that have been developed to reduce the contents of sugar, salt and fat in food products and their respective limitations is given in this chapter (Chapter 1). Additionally, Chapter 1 gives an overview of the mechanisms through which the mechanical properties of food products affect the perception of taste.
The first step towards the accomplishment of the aim of this thesis was to develop a semi-solid model system suitable for controlling the spatial distribution of sucrose. Chapter 2 describes the development and characterization of a model system based on mixed agar-gelatin gels. The feasibility of using the inhomogeneity concept as a sugar reduction strategy in semi-solids was assessed through the investigation of the effect of sucrose spatial distribution on sweetness intensity.
In Chapter 3, the mechanical properties of the model system were modulated through variations of gel formulation. The combined effects of modulation of the spatial distribution of sucrose and modulation of mechanical properties on sweetness intensity were then investigated. We aim at identifying the factors that can enhance the perception of taste.
The gel formulation was further modified to vary independently the fracture strain and fracture stress of the model system (Chapter 4). The effect of the mechanical properties of gels on taste perception was explored in more detail through the investigation of the oral breakdown behavior (i.e. characteristics of gel fragments formed upon chewing), in-mouth mixing (i.e. characteristics of bolus) and sucrose release from the gel. We aim at getting further insights into the mechanisms through which the mechanical properties of semi-solids influence the perception of taste.
To determine the applicability of the inhomogeneity concept as a reduction strategy, the consumer preference of products with inhomogeneous distributions of tastants was assessed in Chapter 5. The effect of tastant concentration differences on taste intensity, fluctuation of taste intensity and consumer preference was investigated in

| Chapter 1
16 |
gels, breads and sausages. We aim at defining a relationship between tastant spatial distribution and consumer preference in different types of foods.
Chapter 6 describes an extension of the approach to modulate the spatial distribution of tastants within a product. Gels and model custard desserts were used to investigate the effect of sucrose concentration profile of consecutive stimuli on sweetness intensity.
The feasibility of using the inhomogeneity concept as a fat reduction strategy was assessed in Chapter 7. A model system (based on mixed agar-gelatin gels) suitable for controlling the spatial distribution of fat (oil-in-water emulsion droplets) was developed and characterized. The developed model system was used to investigate the effect of modulation of fat spatial distribution on the perception of fat-related sensory attributes.
The final chapter (Chapter 8) presents a synthesis and a critical discussion of the main findings, together with conclusions and implications of the knowledge acquired in this thesis.
Figure 1-1. Envisaged relationship between spatial distribution of tastants, mechanical properties and taste perception.
Mechanical properties
Spatial distribution of tastants
Perception of taste
- Breakdown and mixing - Release of tastants- Cross-modal interactions
Food product
Oral processing
IngredientsProcessing

Chapter 2 Ana Carolina Mosca Fred van de Velde Johannes H.F. Bult Martinus A.J.S. van Boekel Markus Stieger
Food Quality and Preference (2010) 21: 837-842
── Enhancement of Sweetness Intensity in Gels by Inhomogeneous Distribution of Sucrose ──

| Chapter 2
18 |
ABSTRACT
Model systems consisting of layers of mixed agar/gelatin gels were used to investigate the effect of the spatial distribution of sucrose on sweetness intensity. 2-Alternative forced choice tests were performed with consumers to compare the sweetness of layered samples with inhomogeneous distributions of sucrose to the sweetness of a reference sample with a homogeneous distribution. All samples had the same overall sucrose concentration (10% w/w) and similar mechanical and rheological properties.
Inhomogeneous samples with large concentration differences of sucrose between the layers were perceived sweeter than the homogeneous reference. No differences in sweetness intensity were observed between the reference and inhomogeneous samples with small concentration differences of sucrose. Additionally, the position of the layers containing sucrose did not affect sweetness intensity. Results showed that an inhomogeneous distribution of sucrose can allow for a 20% sucrose reduction without compromising sweetness intensity.
INTRODUCTION
In recent years, concern has grown about the association of dietary practices with the development of health problems. In this context, a decrease in sugar intake is recommended to diminish the incidence of diseases2. Several initiatives have been suggested to reduce sugar content in food products and beverages. However, sugar reduction remains a challenge for food manufacturers, as it generally leads to changes in the overall quality which may compromise consumer acceptance.
Sugar reduction can be achieved through the use of sugar alternatives or replacements, such as high-intensity and bulk sweeteners. These compounds are present in several low-sugar and light products available in the market, but their use is limited due to undesirable effects, such as metallic/bitter aftertaste24 and deterioration of mouthfeel properties16. Alternatively, sweetness perception can be modulated and enhanced, allowing for sugar reduction while maintaining the sweetness levels expected by consumers.
One approach to modulate sweetness perception is the use of multisensory integration principles. It is known that suppressing or enhancing effects are obtained when stimuli from different sensory modalities are presented simultaneously57. The occurrence of cross-modal interactions such as texture-taste, texture-aroma and aroma-taste has been extensively reported. For instance, the enhancement of

Enhancement of sweetness intensity |
19 |
sweetness intensity by aromas has been described in several studies53,
74-77. The impact of texture on taste and aroma intensity is also well established. Increases in the viscosity of liquids50-52, 58 and in the hardness of semi-solids54, 56,
78 have been shown to reduce the perceived aroma and taste intensity. Comparable results have been observed in more complex systems, such as real foods and beverages. Flavor and aroma intensity of orange drink, tomato juice and coffee were reduced by the addition of thickeners, such as xanthan, hydroxypropylcellulose, sodium alginate and carboxymethylcellulose79. In custard desserts, a decrease in viscosity led to an increase in sweetness intensity, but did not affect aroma intensity53. These studies show that the manipulation of texture and composition of food systems can be used to modulate the perception of taste.
The pattern of delivery of taste stimuli can also be manipulated to enhance taste perception. A continuous and prolonged exposure to taste stimuli leads to adaptation and results in a gradual decrease of taste receptor response80, 81. Under normal eating and drinking conditions, however, adaptation is reduced82, a fact that has been attributed to mouth movements during chewing and swallowing83, 84. Meiselman and Halpern47 showed that adaptation is also reduced when the stimulus is delivered discontinuously as alternating pulses of tastant solution and water. This study reported that a pulsatile delivery can, besides reducing adaptation, enhance saltiness intensity. Busch et al.49 found comparable enhancement effects in a study in which sequences of alternating pulses of high- and low-salt solutions were delivered in a continuous flow. Similarly, a pulsatile delivery was reported to enhance sweetness intensity between 8-14% depending on the pulsation period48.
In the studies mentioned above, a discontinuous temporal stimulation resulting from a pulsatile delivery of taste stimuli led to taste enhancement in liquids. The aim of this chapter was to investigate whether such taste enhancement can be obtained in semi-solids, which provide more realistic eating conditions. We hypothesize that taste enhancement in semi-solid gels can be achieved by an inhomogeneous spatial distribution of tastants, which might lead to a discontinuous stimulation of taste receptors. To test this hypothesis, samples exhibiting an inhomogeneous spatial distribution of sucrose were prepared by placing 4 layers of mixed agar/gelatin gels containing different sucrose concentrations on top of each other. The mechanical and rheological properties of the gels and the diffusion of sucrose between layers were determined in order to have well characterized stimulus material for the sensory tests. Two sensory studies were performed with consumers. The first study investigated the
| Chapter 2
20 |
effect of the magnitude of sucrose concentration differences on sweetness intensity. The second study investigated the effect of the position of the layers containing sucrose on sweetness intensity. The ability of consumers to perceive the inhomogeneous distribution of sucrose in the layered samples was also tested.
MATERIALS AND METHODS Materials
Gelatin (PBG 07 bloom 270-290) was purchased from PB Gelatins (Vilvoorde, BE). Agar powder (Organic Flavour, Veenendaal, NL) and sucrose were obtained from local retailers. Water purified by reverse osmosis (RO) was used to prepare the samples. Sample Preparation
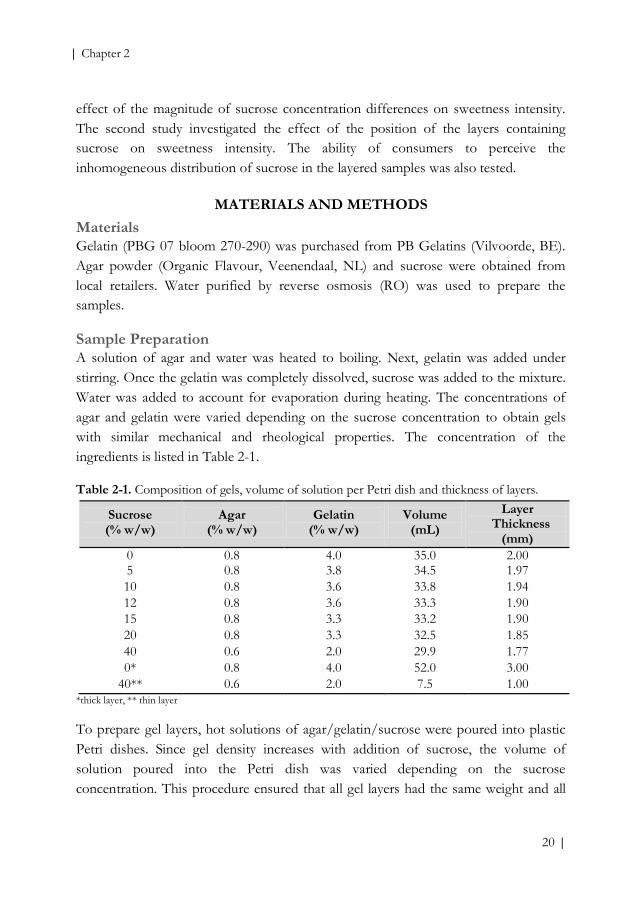
A solution of agar and water was heated to boiling. Next, gelatin was added under stirring. Once the gelatin was completely dissolved, sucrose was added to the mixture. Water was added to account for evaporation during heating. The concentrations of agar and gelatin were varied depending on the sucrose concentration to obtain gels with similar mechanical and rheological properties. The concentration of the ingredients is listed in Table 2-1. Table 2-1. Composition of gels, volume of solution per Petri dish and thickness of layers.
Sucrose (% w/w)
Agar (% w/w)
Gelatin (% w/w)
Volume (mL)
Layer Thickness
(mm) 0 0.8 4.0 35.0 2.00 5 0.8 3.8 34.5 1.97 10 0.8 3.6 33.8 1.94 12 0.8 3.6 33.3 1.90 15 0.8 3.3 33.2 1.90 20 0.8 3.3 32.5 1.85 40 0.6 2.0 29.9 1.77 0* 0.8 4.0 52.0 3.00
40** 0.6 2.0 7.5 1.00 *thick layer, ** thin layer To prepare gel layers, hot solutions of agar/gelatin/sucrose were poured into plastic Petri dishes. Since gel density increases with addition of sucrose, the volume of solution poured into the Petri dish was varied depending on the sucrose concentration. This procedure ensured that all gel layers had the same weight and all

Enhancement of sweetness intensity |
21 |
inhomogeneous samples had the same overall sucrose concentration (10% w/w). After storage overnight at 5 ˚C, gel layers were cut into square layers and were then stored at 5 ˚C. Gels were prepared 2 days before the sensory tests were conducted. The length and width of square layers were 20 mm. The height (layer thickness) was about 2 mm, except for thick layers containing 0% sucrose* (3 mm) and thin layers containing 40% sucrose** (1 mm). Table 2-1 shows the volume of solution used to prepare the gel layers and the thickness of square layers.
Samples varying in distribution of sucrose were prepared by placing 4 square layers containing different sucrose concentrations on top of each other. Compression Measurements
Uniaxial compression measurements were performed using an Instron 5543 test system (Instron Int., Edegem, BE). Hot solutions of agar/gelatin/sucrose were poured into 60 mL plastic syringes (26.4 mm inner diameter). The syringes were stored overnight at 5 ˚C. Following, gels were removed from the syringes and cut into cylindrical pieces of approximately 25 mm diameter and 25 mm height. Gel pieces were compressed between two parallel plates (150 mm diameter) lubricated with a thin layer of paraffin oil. Compression was applied at a crosshead velocity of 1 mm/s up to a linear compression strain of 80%.
The specimen absolute deformation was expressed as Hencky’s or true strain (εH)85:
∫
==
H
H HHdH
HH
0 0
ln1ε
where H0 is the initial specimen height and H is the final height after deformation.
The overall stress acting on the sample during compression was expressed as true stress σt:
AF
t =σ
where F is the force measured during compression and A is the cross-sectional area of the sample. Fracture stress and fracture strain were defined as the maximum in the true stress versus true strain curves (point of fracture).
All measurements were performed at ambient temperature (23 ± 1˚C). The mean values of Young’s modulus, fracture stress and fracture strain were calculated from the measurements of 8 replicates (4 gel pieces from 2 gel specimen).

| Chapter 2
22 |
Rheological Measurements
Gelling and melting curves were determined using an AR 2000 rheometer (TA Instruments, Leatherhead, UK) operating in oscillatory mode with a cylindrical geometry (28 mm rotor diameter, 30 mm stator diameter). Hot solutions of agar/gelatin/sucrose were poured into the geometry of the rheometer, which was equilibrated at 80 ˚C. A thin layer of paraffin oil was applied to the sample surface to prevent evaporation during the measurements. The temperature was decreased from 80 to 5 ˚C at a rate of 0.5 ˚C/min allowing gel formation (gelling curve). Next, the temperature was maintained at 5 ˚C for 3 h and then increased to 60 ˚C at a rate of 0.5 ˚C/min (melting curve). The gel temperature (Tgel) was obtained from the gelling curve as the temperature at which the storage modulus (G’) was equal to the loss modulus (G”). The maximum G’ (G’max) was obtained after 3 h at 5 ˚C. The temperatures at which the gels started and ended the melting process (Tm, start and Tm,
end) were obtained from the melting curves. The linear viscoelastic regime was determined using strain and frequency sweeps. Measurements were performed in duplicate at a frequency of 1 Hz and a strain of 1%. Sucrose Diffusion Test
The diffusion of sucrose between layers was determined over time. Layers (dimensions 20x20x2 mm) containing 0 and 20% sucrose were arranged in 2 combinations: 20/0/20 and 20/0 - where numbers correspond to the percentage of sucrose (% w/w) in each layer. Layers were kept in contact for 0.5, 1, 2, 4, 6 and 8 h. Next, layers were separated, placed in water at a dilution of 1:10 and kept overnight at 5 ˚C to allow the sucrose to diffuse into the water. A volume of 1 mL of solution was collected for the quantification of sucrose concentration by HPLC analysis.
NIZO Premia software was used to estimate the diffusion coefficient of sucrose in mixed agar/gelatin gels by fitting a model based on Fick’s diffusion equation to the experimental data obtained from the diffusion test. Sensory Analysis
Study 1 Sixty-four consumers (33 females; age: 30-60) participated in the study. Subjects were submitted to a preliminary taste test to evaluate their ability to identify tastes. In order to be qualified to participate in this study, subjects had to identify correctly at least 8 out of 10 taste solutions and should not miss a particular taste twice. All subjects gave written informed consent.

Enhancement of sweetness intensity |
23 |
The following samples were used to investigate the effect of the magnitude of sucrose concentration differences on sweetness intensity: 15/5/15/5, 20/0/20/0, 40/0/0/0, 40/0/40/0, 12/12/12/12 and 10/10/10/10 (reference) (numbers correspond to the percentage of sucrose (% w/w) in each layer). All samples had an overall sucrose concentration of 10% w/w, except sample 12/12/12/12 (12% w/w sucrose). Layer thickness was about 2 mm in all samples with exception of sample 40/0/40/0, which had a layer thickness of 1/3/1/3 mm in order to keep the overall sucrose concentration at 10% w/w. Layers were removed from the refrigerator 1 hour prior to the sensory test to equilibrate to 20 ˚C. Layers were assembled on top of each other less than 30 min before the sensory test to minimize sucrose diffusion between layers.
The test was divided into 4 sessions of 1.5 h, each one containing 16 subjects. Samples were evaluated in sensory booths at 20 ˚C and under normal light. 2-Alternative Forced Choice (2-AFC) tests were performed to compare the sweetness of all samples with the sweetness of the reference (10/10/10/10). Subjects were instructed to place the sample in the mouth, to chew until it could be swallowed and to expectorate the bolus. They received the samples in pairs and were asked to indicate the sweetest sample of each pair after tasting both samples. All pairs were evaluated 4 times in randomized order during a single session. Water and crackers were provided to clean the palate between samples. Breaks of 2 min were taken between comparisons and of 3 min between replications. Study 2 Fifty-nine consumers (22 females; age: 35-65) participated in the study. The recruitment criterion was the same as described in study 1.
The effect of the position of the layers containing sucrose on sweetness intensity was investigated in 3 samples: 40/0/40/0, 40/0/0/40 and 0/40/40/0. Samples were compared with each other in terms of sweetness in 2-AFC tests. Subjects evaluated samples in pairs and indicated the sweetest sample of each pair after tasting both samples. Each pair was evaluated 3 times in randomized order during a single session. The test conditions were the same as described in study 1.
After the 2-AFC tests were completed, an additional test was performed to verify whether consumers could perceive the inhomogeneous distribution of sucrose in the layered samples. The following samples were used: 10/10/10/10, 20/0/20/0, 40/0/0/0, 40/0/40/0, 40/0/0/40 and 0/40/40/0. Subjects were asked to place the sample in the mouth, to chew until it could be swallowed and to expectorate the

| Chapter 2
24 |
bolus. The “variation of sweetness intensity perceived during consumption” was rated on a 100-point scale anchored at 10 (no variation of sweetness) and 90 (large variation of sweetness). Samples were evaluated once. Data Analysis
Data was collected with Fizz software (v 2.40c, Biosystemes, FR). For study 1, the proportion of selections of inhomogeneous samples over the homogenous reference in the 2-AFC tests was calculated in 2 ways: collapsed over subjects and for each subject separately. Proportions collapsed over subjects were tested for deviations from chance level (μ=0.5) by binomial testing (Fizz calculations, v 2.40c, Biosystemes, FR). Individual proportions (p) were logit-transformed (logit transform=ln(p/(1-p)))86 to obtain data suited for statistical testing using general linear models. Proportions equal to 0 and 1 were first set to 0.01 and 0.99, respectively. Logit-transformed p values of individual subjects were used to test for differences in discriminability between inhomogeneous samples and the homogeneous reference. These values were compared by repeated measures ANOVA (SPSS, v 11.5, SPSS Inc, USA) with sucrose concentration difference as a fixed factor.
For Study 2, binomial testing (Fizz calculations, v 2.40c, Biosystemes, FR) was used to identify sweetness differences among samples compared in the 2-AFC tests. LSD test was used to identify sample subgroups on basis of perceived variation of sweetness (α=0.05).
RESULTS AND DISCUSSION
Mechanical and Rheological Properties of Gels
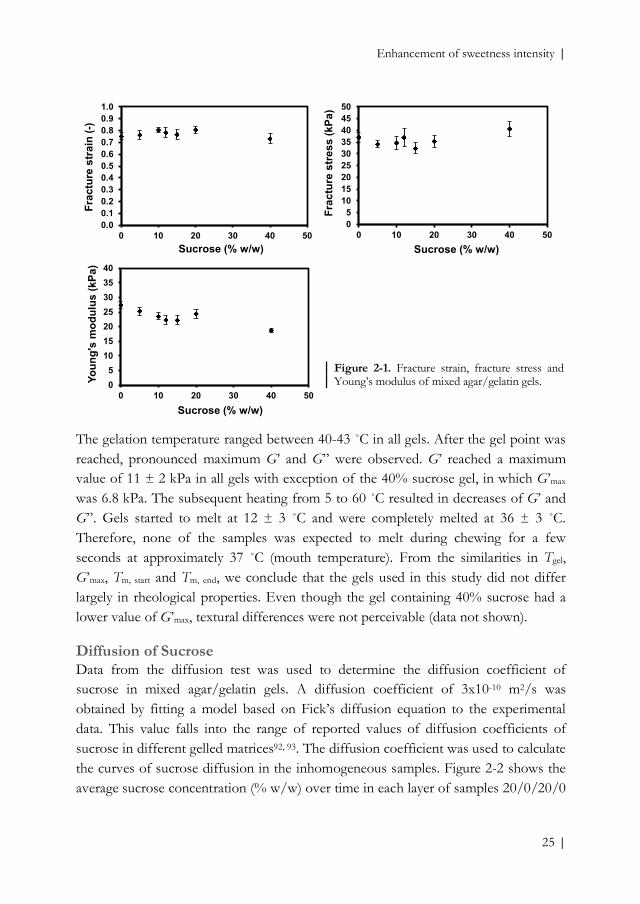
It has been reported that sucrose affects the mechanical and rheological properties of gelled products87-91. Large deformation measurements performed in this study showed that fracture stress and fracture strain increased with increasing sucrose concentration in samples containing a fixed amount of gelling agents (0.8% w/w agar and 4% w/w gelatin). Young’s modulus remained approximately constant (data not shown). Therefore, the gel formulation was adjusted to exclude the effects of variation of texture on taste perception. By varying the concentrations of agar and gelatin depending on the sucrose concentration, gels with similar mechanical and rheological properties were obtained. Figure 2-1 shows the values of fracture strain, fracture stress and Young’s modulus. The small differences in large deformation properties did not result in perceivable textural differences, as indicated in a preliminary sensory test (data not shown).
Enhancement of sweetness intensity |
25 |
The gelation temperature ranged between 40-43 ˚C in all gels. After the gel point was reached, pronounced maximum G’ and G” were observed. G’ reached a maximum value of 11 ± 2 kPa in all gels with exception of the 40% sucrose gel, in which G’max was 6.8 kPa. The subsequent heating from 5 to 60 ˚C resulted in decreases of G’ and G”. Gels started to melt at 12 ± 3 ˚C and were completely melted at 36 ± 3 ˚C. Therefore, none of the samples was expected to melt during chewing for a few seconds at approximately 37 ˚C (mouth temperature). From the similarities in Tgel, G’max, Tm, start and Tm, end, we conclude that the gels used in this study did not differ largely in rheological properties. Even though the gel containing 40% sucrose had a lower value of G’max, textural differences were not perceivable (data not shown). Diffusion of Sucrose
Data from the diffusion test was used to determine the diffusion coefficient of sucrose in mixed agar/gelatin gels. A diffusion coefficient of 3x10⁻¹⁰ m2/s was obtained by fitting a model based on Fick’s diffusion equation to the experimental data. This value falls into the range of reported values of diffusion coefficients of sucrose in different gelled matrices92, 93. The diffusion coefficient was used to calculate the curves of sucrose diffusion in the inhomogeneous samples. Figure 2-2 shows the average sucrose concentration (% w/w) over time in each layer of samples 20/0/20/0
0.00.10.20.30.40.50.60.70.80.91.0
0 10 20 30 40 50
Frac
ture
str
ain
(-)
Sucrose (% w/w)
05
101520253035404550
0 10 20 30 40 50
Frac
ture
str
ess
(kPa
)
Sucrose (% w/w)
05
10152025303540
0 10 20 30 40 50
Youn
g's
mod
ulus
(kPa
)
Sucrose (% w/w)
Figure 2-1. Fracture strain, fracture stress and Young’s modulus of mixed agar/gelatin gels.

| Chapter 2
26 |
and 40/0/40/0. After 30 min, the initial sucrose concentration changed from 20/0/20/0 to 16/7.9/12.1/4 and from 40/0/40/0 to 23.9/9.6/14.4/4.3. Therefore, in order to maintain large sucrose concentration differences between layers at the time of consumption, layers were assembled on top of each other less than 30 min before the sensory tests were conducted.
Figure 2-2. Sucrose diffusion curves of samples 20/0/20/0 and 40/0/40/0. The different symbols represent the order of layers in the samples. Sensory Analysis
Study 1 Binomial tests indicated that consumers perceived the samples 40/0/0/0, 40/0/40/0 and 12/12/12/12 significantly sweeter than the reference (10/10/10/10) (k=144, p<0.05; k=195, p<0.001 and k=178, p<0.001, respectively; at μ=0.5, n=256) (Figure 2-3). Significant differences in sweetness were not observed between samples 15/5/15/5 and 20/0/20/0 and the reference. These results show that an inhomogeneous distribution of sucrose enhances the sweetness intensity of semi-solid gels, but large sucrose concentration differences are necessary to achieve a significant sweetness enhancement.
A comparison of logit-transformed proportion of selections of inhomogeneous samples over the homogeneous reference in the 2-AFC tests revealed an overall effect of sucrose concentration differences [F(4,252)=13.3, p<0.001]. Figure 2-3 shows the positive effect of sucrose concentration differences on the proportion of selections of inhomogeneous samples. Sample 40/0/40/0 displayed the largest sweetness enhancement, as indicated by its high proportion of selections. The sweetness enhancement of this sample was even higher than that of the homogeneous sample
0 2 4 6 80
5
10
15
20
Sucr
ose
(% w
/w)
Sucr
ose
(% w
/w)
Time (h)
0 20 0 20
0
10
20
30
40
0 40 0 40

Enhancement of sweetness intensity |
27 |
12/12/12/12, which contained 20% more sucrose. Based on these results, we suggest that an inhomogeneous distribution of sucrose can compensate for an effective sucrose reduction of about 20%.
Figure 2-3. Proportion of selections (Mean ± SEM) of inhomogeneous samples over the homogeneous reference in the 2-AFC tests. p-values are calculated by binomial test of k (n=256, µ=0.50). An enhancement of sweetness intensity by an inhomogeneous distribution of sucrose has also been observed by Holm et al.94. In their study, 5 trained panelists evaluated the sweetness of layered gels at different times of oral exposure (0, 15, 30, 45, 60 and 75 s). An inhomogeneous sample composed of 7 layers (9/0/22.5/0/22.5/0/9) was perceived sweeter than the homogeneous sample (both samples containing an overall sucrose concentration of 9% w/w) at t = 0, 15 and 30 s. Taste enhancement was not observed for an inhomogeneous five-layer sample (15/0/15/0/15), which had smaller sucrose concentration differences than the seven-layer sample. These findings are in agreement with our observation that large sucrose concentration differences are required to enhance sweetness.
In liquids, a temporal variation of tastant concentration obtained by a pulsatile delivery was shown to enhance taste intensity47-49. A pulsatile delivery leads to a synchronized stimulation of taste receptors, since all receptors are stimulated simultaneously by a pulse of tastant solution. In the case of our inhomogeneous layered gels, fragments of gel containing different concentrations of sucrose move continuously in the mouth during chewing. Consequently, taste receptors are exposed to a discontinuous stimulation in a desynchronized fashion, since some receptors are exposed to high concentrations of sucrose while others are exposed to low concentrations. In line with the observations of taste enhancement in liquids, we suggest that this discontinuous stimulation of taste receptors led to the observed
0
0.1
0.2
0.3
0.4
0.5
0.6
0.7
0.8
15/5/15/5 20/0/20/0 40/0/0/0 40/0/40/0 12/12/12/12
Prop
ortio
n of
sel
ectio
ns
p=
0.8,
k =
125
p<
0.05
, k=
144
p<
0.00
1, k
= 1
95
p<
0.00
1, k
= 17
8
p=
0.49
, k=
134
| Chapter 2
28 |
sweetness enhancement. Although the chewing process ultimately leads to the formation of a homogeneous bolus, the period at which the distribution of sucrose is inhomogeneous in the mouth appears to be sufficient to enhance sweetness.
Reduction of adaptation49 and high burst frequencies of afferent gustatory fibers due to sequential phasic responses of receptors47, 48 are among the mechanisms suggested to explain taste enhancement by pulsatile delivery. The latter was observed in animal studies by Smith et al.95, who reported that a rinse interval with water between the presentation of taste stimuli increased the overall burst frequency of the chorda tympani of rats. We propose that these are the possible mechanisms responsible for the sweetness enhancement observed in the layered gels. After being stimulated by a fragment of gel containing sucrose, taste receptors will become less responsive due to adaptation80, 81. A subsequent exposure to a fragment without sucrose will act as a rinsing interval, allowing for a partial recovery from adaptation. Because the stimuli (fragments of gel containing low- and high-sucrose concentrations) are in constant movement in the mouth, a receptor is expected to be stimulated repeatedly and the resulting stimulation-partial recovery-stimulation process is expected to occur intermittently in different receptors. As a result, the summated response of all receptors to an inhomogeneous distribution of tastants will increase and taste intensity will be enhanced. Alternatively, if each receptor displays bursts of phasic responses upon each stimulation by gel fragments containing high concentrations of sucrose, then the summated output of these asynchronous bursts of multiple receptors will be higher than the output resulting from a continuous stimulation (in the case that all fragments contain the same sucrose concentration). As a result, taste intensity will be enhanced. Hence, a partial recovery from receptor adaption as well as accumulated serial phasic responses of receptors may account for the observed taste enhancement by an inhomogeneous distribution of sucrose in gels.
We suggest that the larger sweetness enhancement of sample 40/0/40/0 compared with sample 40/0/0/0 may be explained by the larger number of high-sucrose fragments obtained for sample 40/0/40/0 with the same chewing effort. This means that the total surface area of gel fragments containing a high concentration of sucrose is larger in sample 40/0/40/0. Consequently, the probability of exposure of receptors to a high concentration of sucrose is higher in sample 40/0/40/0 than in sample 40/0/0/0.

Enhancement of sweetness intensity |
29 |
Study 2 The effect of the position of the layers containing sucrose on sweetness intensity was tested by comparing the sweetness of samples 40/0/40/0, 40/0/0/40 and 0/40/40/0 in 2-AFC tests. Figure 2-4 shows that the sweetness intensity of these samples did not differ significantly. Therefore, we conclude that the position of the layers containing sucrose does not affect sweetness intensity and, consequently, taste enhancement. In the case that the samples were kept statically on the tongue for an extended period, it would be expected that the outside layers would affect the overall perceived sweetness. In this study, however, chewing started right after the placement of the sample in the mouth and the layers were broken down into fragments, which could move freely in the mouth. The fact that differences in sweetness were not observed between samples 40/0/40/0, 40/0/0/40 and 0/40/40/0 suggests that taste enhancement is driven by the presence of large tastant concentration differences within a product.
Figure 2-4. Effect of the position of the layers containing sucrose on sweetness intensity determined using 2-AFC tests. An additional sensory test was performed to verify whether the inhomogeneous distribution of sucrose in the layered gels was perceived by consumers. The homogeneous sample 10/10/10/10 showed the lowest perceived variation of sweetness intensity during consumption (Table 2-2). The inhomogeneous samples 20/0/20/0 and 40/0/40/0 did not differ significantly from the homogeneous sample in terms of variation of sweetness intensity. Therefore, the inhomogeneous distribution of sucrose in the sample that showed the largest sweetness enhancement (40/0/40/0) was not perceived by the consumers.
0
20
40
60
80
100
120
140
160
180
Num
ber o
f ans
wer
s
40/0
/0/4
040
/0/4
0/0
p = 0.43 p = 0.87 p = 0.15
0/40
/40/
040
/0/4
0/0
0/40
/40/
040
/0/0
/40

| Chapter 2
30 |
Table 2-2. Mean values of perceived variation of sweetness intensity in layered gels during consumption.
Sample 40/0/0/40 0/40/40/0 40/0/0/0 20/0/20/0 40/0/40/0 10/10/10/10 Mean 46.2a 45.9a 44.1ab 40.3abc 36.9bc 33.0c
Means sharing the same letter are not significantly different (p <0.05).
CONCLUSIONS
We conclude that the spatial distribution of sucrose in layered gels plays an important role in the perception of taste. Our results showed that an inhomogeneous distribution of sucrose at large concentration differences allows for a 20% sucrose reduction. It was also showed that sweetness intensity and, consequently, sweetness enhancement, are not affected by the position of the layers containing sucrose. The modulation of the spatial distribution of tastants is a promising strategy to reduce the contents of sugar and salt in foods. This strategy has the potential of being applied in the development of healthier products without compromising sensory performance.

Chapter 3 ── Effect of Gel Texture and Sucrose Spatial Distribution on Sweetness Perception ──
Ana Carolina Mosca Fred van de Velde Johannes H.F. Bult Martinus A.J.S. van Boekel Markus Stieger
LWT - Food Science and Technology (2012) 46: 183-188
| Chapter 3
32 |
ABSTRACT
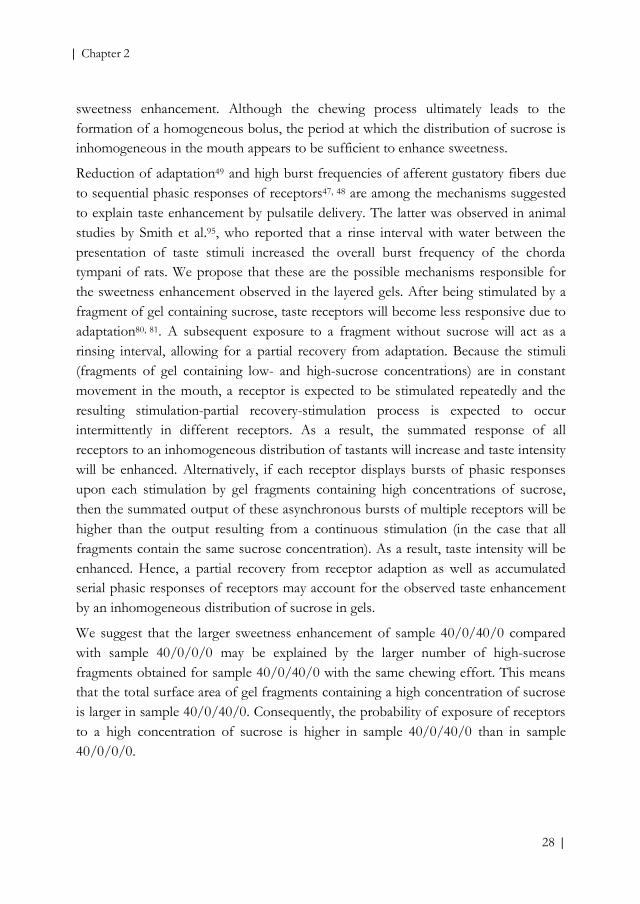
The combined effects of mechanical properties and spatial distribution of sucrose on sweetness intensity were investigated in this chapter. Layered gels differing in mechanical properties (soft, medium and hard gels) and in the distribution of sucrose (homogeneous and inhomogeneous distributions) were used for this purpose. Rating measurements, 2-Alternative Forced Choice tests and time-intensity analysis were performed to compare the sweetness of soft, medium and hard gels with homogeneous and inhomogeneous distributions of sucrose.
Results showed that all gels with an inhomogeneous distribution of sucrose were perceived sweeter than gels in which sucrose was homogeneously distributed. This indicates that the enhancement of sweetness by an inhomogeneous distribution of sucrose does not depend on the mechanical properties of the gel. Furthermore, the time-intensity profiling showed that the soft gel, which had low values of fracture strain and fracture stress and broke down into a large number of small fragments upon chewing, had the highest sweetness intensity. The time required to reach the maximum sweetness intensity tended to be shorter in the soft gel than in medium and hard gels. Results suggest that the breakdown behavior of semi-solid gels during oral processing affects the perception of taste.
INTRODUCTION
There is a great interest in reducing the contents of sugar and salt in food products due to the rising awareness of health issues related to a high intake of these tastants. Because consumers are sensitive to small changes in sensory properties, such as taste, flavor and mouthfeel, the development of low-sugar and low-salt food products remains a challenge for food manufacturers.
An effective sugar and salt reduction strategy based on the modulation of the spatial distribution of tastants in the food matrix has been proposed recently. Holm et al.94 and the results reported in Chapter 2 showed that sweetness intensity was enhanced in layered gels in which sucrose was heterogeneously distributed in the gel matrix. Similarly, Noort et al.96 reported that the saltiness intensity of bread was enhanced by an inhomogeneous distribution of salt. In all cases, the magnitude of taste enhancement increased with increasing the magnitude of tastant concentration differences. A sucrose reduction of up to 20% in gelled products (Chapter 2) and a salt reduction of up to 28% in breads96 were achieved without compromising taste.
Effect of texture and sucrose distribution on taste perception |
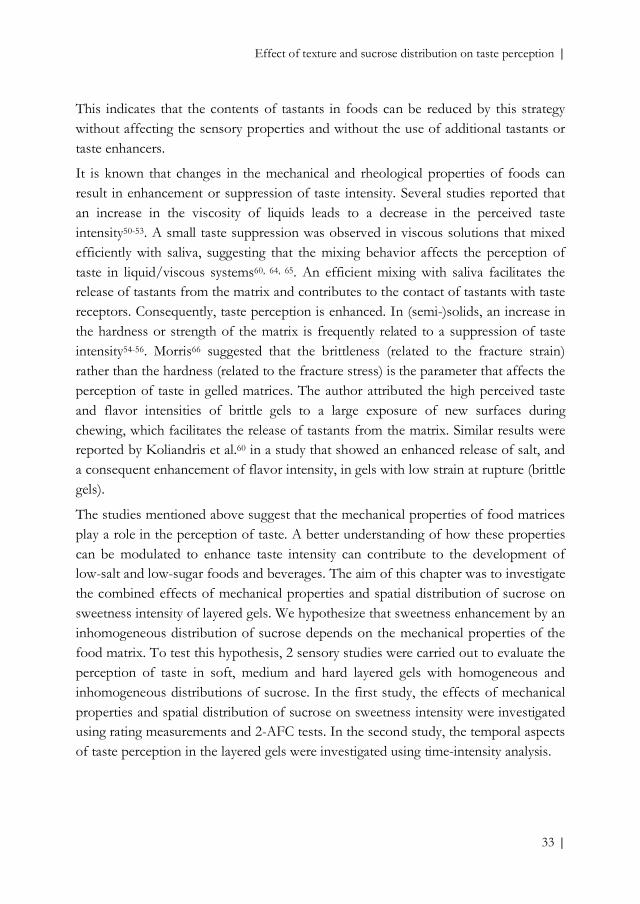
33 |
This indicates that the contents of tastants in foods can be reduced by this strategy without affecting the sensory properties and without the use of additional tastants or taste enhancers.
It is known that changes in the mechanical and rheological properties of foods can result in enhancement or suppression of taste intensity. Several studies reported that an increase in the viscosity of liquids leads to a decrease in the perceived taste intensity50-53. A small taste suppression was observed in viscous solutions that mixed efficiently with saliva, suggesting that the mixing behavior affects the perception of taste in liquid/viscous systems60, 64, 65. An efficient mixing with saliva facilitates the release of tastants from the matrix and contributes to the contact of tastants with taste receptors. Consequently, taste perception is enhanced. In (semi-)solids, an increase in the hardness or strength of the matrix is frequently related to a suppression of taste intensity54-56. Morris66 suggested that the brittleness (related to the fracture strain) rather than the hardness (related to the fracture stress) is the parameter that affects the perception of taste in gelled matrices. The author attributed the high perceived taste and flavor intensities of brittle gels to a large exposure of new surfaces during chewing, which facilitates the release of tastants from the matrix. Similar results were reported by Koliandris et al.60 in a study that showed an enhanced release of salt, and a consequent enhancement of flavor intensity, in gels with low strain at rupture (brittle gels).
The studies mentioned above suggest that the mechanical properties of food matrices play a role in the perception of taste. A better understanding of how these properties can be modulated to enhance taste intensity can contribute to the development of low-salt and low-sugar foods and beverages. The aim of this chapter was to investigate the combined effects of mechanical properties and spatial distribution of sucrose on sweetness intensity of layered gels. We hypothesize that sweetness enhancement by an inhomogeneous distribution of sucrose depends on the mechanical properties of the food matrix. To test this hypothesis, 2 sensory studies were carried out to evaluate the perception of taste in soft, medium and hard layered gels with homogeneous and inhomogeneous distributions of sucrose. In the first study, the effects of mechanical properties and spatial distribution of sucrose on sweetness intensity were investigated using rating measurements and 2-AFC tests. In the second study, the temporal aspects of taste perception in the layered gels were investigated using time-intensity analysis.
| Chapter 3
34 |
MATERIALS AND METHODS
Materials
The ingredients used to prepare the samples were obtained as described in Chapter 2. Sample Preparation
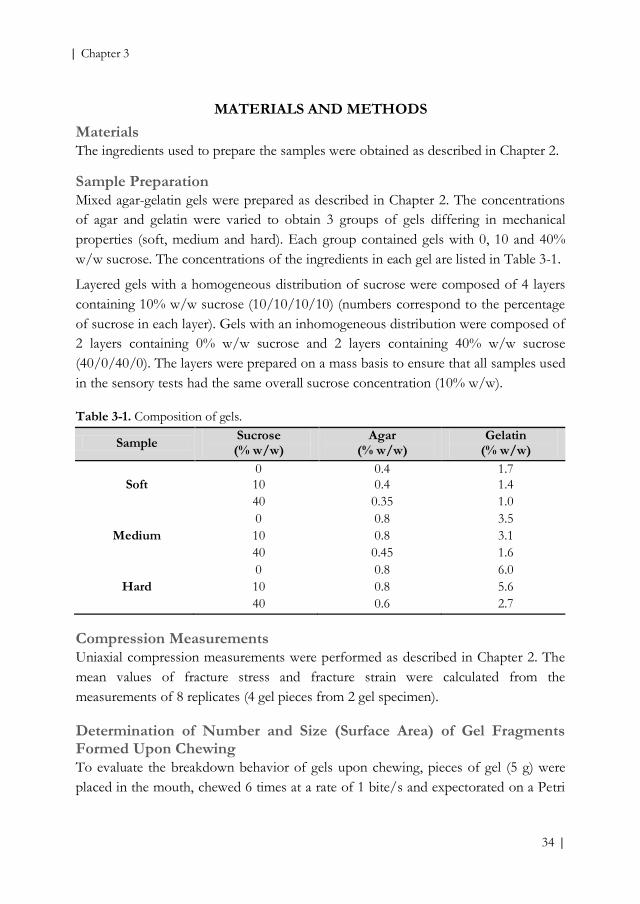
Mixed agar-gelatin gels were prepared as described in Chapter 2. The concentrations of agar and gelatin were varied to obtain 3 groups of gels differing in mechanical properties (soft, medium and hard). Each group contained gels with 0, 10 and 40% w/w sucrose. The concentrations of the ingredients in each gel are listed in Table 3-1.
Layered gels with a homogeneous distribution of sucrose were composed of 4 layers containing 10% w/w sucrose (10/10/10/10) (numbers correspond to the percentage of sucrose in each layer). Gels with an inhomogeneous distribution were composed of 2 layers containing 0% w/w sucrose and 2 layers containing 40% w/w sucrose (40/0/40/0). The layers were prepared on a mass basis to ensure that all samples used in the sensory tests had the same overall sucrose concentration (10% w/w). Table 3-1. Composition of gels.
Compression Measurements
Uniaxial compression measurements were performed as described in Chapter 2. The mean values of fracture stress and fracture strain were calculated from the measurements of 8 replicates (4 gel pieces from 2 gel specimen). Determination of Number and Size (Surface Area) of Gel Fragments Formed Upon Chewing
To evaluate the breakdown behavior of gels upon chewing, pieces of gel (5 g) were placed in the mouth, chewed 6 times at a rate of 1 bite/s and expectorated on a Petri
Sample Sucrose (% w/w)
Agar (% w/w)
Gelatin (% w/w)
0 0.4 1.7 Soft 10 0.4 1.4
40 0.35 1.0 0 0.8 3.5
Medium 10 0.8 3.1 40 0.45 1.6 0 0.8 6.0
Hard 10 0.8 5.6 40 0.6 2.7

Effect of texture and sucrose distribution on taste perception |
35 |
dish. The mouth was rinsed with 20 mL of water to remove all gel fragments. This procedure was followed by 10 subjects (8 females; age: 20-34). Subjects received a brief instruction about the task to be performed at the beginning of the test. Each gel was evaluated once per subject in randomized order. Pictures of the Petri dishes containing the expectorated gel fragments were made using a Canoscan 9950F scanner (Canon Inc., JP). The number and surface area of gel fragments were determined using the image analysis software Qwin Pro V 3.1.0 (Leica Microsystems Imaging Solutions Ltd., UK) according to the method described by van den Berg et al.97. The average number and surface area of gel fragments were calculated from the images obtained from all subjects. To enhance the color contrast, a suspension of Titanium dioxide (TiO2) (3% w/w) was added to the gels during sample preparation. Sensory Study 1: Effect of Mechanical Properties and Sucrose Spatial Distribution on Sweetness Intensity
Samples Three groups of layered gels (soft, medium and hard) were used. Each group consisted of a gel with a homogeneous spatial distribution of sucrose (10/10/10/10) and a gel with an inhomogeneous distribution (40/0/40/0). All layered gels had an overall sucrose concentration of 10% w/w. To prepare the layered gels, layers were removed from the refrigerator 1 h prior to the sensory tests to equilibrate to 20 ˚C and were assembled on top of each other less than 30 min before the sensory tests were conducted. Subjects Fifty-nine consumers (36 females; age: 27-61) with normal taste ability participated in the study. Subjects passed a basic taste test in which they had to identify correctly at least 8 out of 10 taste solutions and should not miss a particular taste twice. All subjects gave written informed consent. Method Samples were evaluated in sensory booths at 20 ˚C and under normal light. Subjects attended 2 sessions of 1.5 h each in 2 separate days. In each session, subjects started rating the intensities of the attributes hardness, difficulty to disintegrate upon chewing and sweetness of each gel on 100-point scales. Low-end scale anchors were set at score 10 and labeled ‘not hard’, ‘easy to disintegrate upon chewing’ and ‘not sweet’ for the attributes hardness, difficulty to disintegrate upon chewing and sweetness,

| Chapter 3
36 |
respectively. High-end scale anchors were set at score 90 and labeled ‘very hard’, ‘difficult to disintegrate upon chewing’ and ‘very sweet’ for the attributes hardness, difficulty to disintegrate upon chewing and sweetness, respectively. Subjects were instructed to place the sample in the mouth, to chew until the sample could be swallowed and to expectorate the bolus. The intensities of the 3 attributes were then rated. Breaks of 1 min were taken between samples to clean the palate with water and a piece of cracker. All samples were evaluated in duplicate.
After the attribute rating test, subjects compared the sweetness of gels with homogeneous and inhomogeneous distributions of sucrose in 2-AFC tests. Homogeneous and inhomogeneous gels of the same texture were presented in pairs. Subjects were instructed to place the sample in the mouth, to chew until the sample could be swallowed and to expectorate the bolus. After tasting both samples of the pair, subjects had to indicate the sweetest sample. Over the 2 sessions, all pairs were evaluated 4 times in randomized order. Breaks of 2 min were taken between comparisons and of 3 min between replications. Data analysis Response data was collected with Fizz software (v 2.40c, Biosystemes, FR). The effect of gel mechanical properties (Texture; within subject factor: soft, medium and hard) and sucrose spatial distribution (Homogeneity; within subject factor: homogeneous and inhomogeneous) on the ratings of hardness, difficulty to disintegrate upon chewing and sweetness were tested by repeated-measures ANOVA (SPSS, v 17, SPSS Inc, USA) with texture and homogeneity as fixed factors.
The proportion of selections of gels with an inhomogeneous distribution of sucrose in the 2-AFC tests was calculated as described in Chapter 2. Logit-transformed p-values of individual subjects were used to test for differences in discriminability of homogenous and inhomogeneous gels between the 3 texture groups. For this, repeated-measures ANOVA (SPSS, v 17, SPSS Inc, USA) was used with texture as a fixed, within-subject factor. Sensory Study 2: Effect of Mechanical Properties and Sucrose Spatial Distribution on Time-Intensity Profile of Sweetness Intensity
Samples The same set of layered gels described in study 1 was used to investigate the temporal aspects of taste perception during chewing.

Effect of texture and sucrose distribution on taste perception |
37 |
Subjects Thirteen subjects (10 females; age: 34-50) with normal taste ability participated in the study. Subjects were experienced with time-intensity methodology from previous studies. The recruitment criterion was the same as described in study 1. All subjects gave written informed consent. Method Subjects rated the sweetness intensity of samples during chewing for 40 s on a 100-point scale, anchored ‘not sweet’ at scale value 0 and ‘very sweet’ at scale value 100, by moving the controller of a vertical rating-bar displayed on a computer screen. Samples were evaluated in triplicate during 2 sessions of 40 min. Samples were presented in randomized order. Breaks of 1 min were taken between samples to rinse the mouth with water. A warm-up sample (a gel of medium texture and homogeneous distribution of sucrose) was provided at the beginning of each session. Data analysis Three dependent variables were derived from the time-intensity data: the maximum sweetness intensity (Imax), the time at which the maximum sweetness intensity was perceived (tmax) and the area under the sweetness curve (AUSC). The effect of gel mechanical properties (soft, medium and hard) and sucrose spatial distribution (homogeneous and inhomogeneous) on Imax, tmax and AUSC were tested by repeated-measures ANOVA (SPSS, v 17, SPSS Inc, USA) with texture and homogeneity as fixed, within-subject factors.
To determine whether the inhomogeneous distribution of sucrose in the layered gels led to a perceivable fluctuation of sweetness intensity during the time-intensity ratings, sweetness intensity distributions in the time domain were transformed to power spectral densities in the frequency domain using the ‘periodogram’ algorithm in Matlab (v 7.0.1. The Mathworks Inc, USA). This algorithm calculates the relative contribution of the variation of intensity ratings over time to specific frequency bands. These power spectral density calculations employ Fast Fourier Transforms98.
RESULTS AND DISCUSSION
Mechanical Properties of Gels
Three groups of gels differing in mechanical properties (soft, medium and hard) were prepared by varying the concentrations of agar and gelatin. To ensure that all gels within the same group had similar fracture and breakdown properties, the
| Chapter 3
38 |
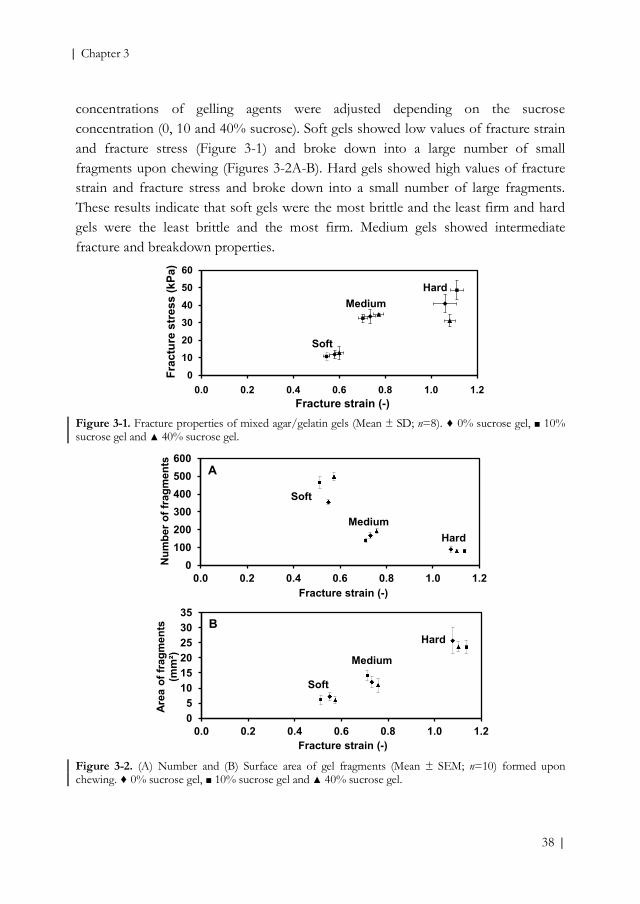
concentrations of gelling agents were adjusted depending on the sucrose concentration (0, 10 and 40% sucrose). Soft gels showed low values of fracture strain and fracture stress (Figure 3-1) and broke down into a large number of small fragments upon chewing (Figures 3-2A-B). Hard gels showed high values of fracture strain and fracture stress and broke down into a small number of large fragments. These results indicate that soft gels were the most brittle and the least firm and hard gels were the least brittle and the most firm. Medium gels showed intermediate fracture and breakdown properties.
Figure 3-1. Fracture properties of mixed agar/gelatin gels (Mean ± SD; n=8). ♦ 0% sucrose gel, ■ 10% sucrose gel and ▲ 40% sucrose gel. Figure 3-2. (A) Number and (B) Surface area of gel fragments (Mean ± SEM; n=10) formed upon chewing. ♦ 0% sucrose gel, ■ 10% sucrose gel and ▲ 40% sucrose gel.
0
10
20
30
40
50
60
0.0 0.2 0.4 0.6 0.8 1.0 1.2
Frac
ture
str
ess
(kPa
)
Fracture strain (-)
Soft
MediumHard
0100200300400500600
0.0 0.2 0.4 0.6 0.8 1.0 1.2
Num
ber o
f fra
gmen
ts
Fracture strain (-)
Soft
MediumHard
05
101520253035
0.0 0.2 0.4 0.6 0.8 1.0 1.2
Area
of f
ragm
ents
(m
m²)
Fracture strain (-)
Soft
Medium
Hard
B
A

Effect of texture and sucrose distribution on taste perception |
39 |
Gels from the soft and medium groups (i.e. gels containing 0, 10 and 40% sucrose) showed similar values of fracture strain and stress, whereas gels from the hard group showed differences in fracture stress that could not be minimized by the adjustment of the formulation. These differences, however, were smaller than the differences in fracture properties between the 3 groups of gels. Effect of Mechanical Properties and Sucrose Spatial Distribution on Sweetness Intensity
Figures 3-3A-C show the mean values of hardness, difficulty to disintegrate upon chewing and sweetness obtained from the intensity rating tests. Subjects differentiated the 3 groups of gels in terms of hardness [F(2,116)=281; p<0.001] and difficulty to disintegrate upon chewing [F(2,116)=183; p<0.001], but not in terms of sweetness [F(2,116)=0.13; p=0.9]. Hard gels were perceived as the hardest and the most difficult to disintegrate upon chewing (Figures 3-3A and 3-3B). Within each group, layered gels in which sucrose was heterogeneously distributed were perceived significantly sweeter than the gels in which sucrose was homogeneously distributed [F(1,58)=50.9; p<0.001] (Figure 3-3C). This result confirms that an inhomogeneous distribution of sucrose in layered gels enhances sweetness intensity
Chapter 2, 94.
Figure 3-3. Intensity ratings (Mean ± SEM; n=118) of the attributes: (A) hardness, (B) difficulty to disintegrate upon chewing and (C) sweetness of soft, medium and hard gels with
homogeneous (-□-) (10/10/10/10) and inhomogeneous (-■-) (40/0/40/0) distributions of sucrose.
0
10
20
30
40
50
60
70
Soft Medium Hard
Har
dnes
s (-)
0
10
20
30
40
50
Soft Medium Hard
Swee
tnes
s (-)
0
10
20
30
40
50
60
70
Soft Medium Hard
Diff
icul
ty to
dis
inte
grat
e (-)
C
A B

| Chapter 3
40 |
Although texture did not affect the sweetness ratings, a significant texture x homogeneity interaction effect was observed on sweetness [F(2,116)=7.2; p<0.001]. This effect can be characterized as a difference in sweetness ratings between homogeneous and inhomogeneous gels that depends on the texture. The hard gel showed the largest difference in sweetness between homogeneous and inhomogeneous gels and the medium gel showed the smallest difference (Figure 3-3C).
Results from the 2-AFC test showed that, regardless of the texture group, gels with an inhomogeneous distribution of sucrose were more often perceived sweeter than gels with a homogeneous distribution (soft: k=197, p<0.001; medium: k=183, p<0.001 and hard: k=209, p<0.001; at μ=0.5, n=236). Given that both intensity ratings and 2-AFC results indicated a sweetness enhancement in inhomogeneous soft, medium and hard gels, we conclude that sweetness enhancement by an inhomogeneous distribution of sucrose does not depend on the mechanical properties of the gel. Furthermore, the comparison of the logit-transformed proportion of selections revealed an overall effect of texture on the probability that inhomogeneous gels are perceived sweeter than homogeneous gels [F(2,116)=5.5, p<0.01]. This effect was due to a larger proportion of selections of inhomogeneous gels of hard texture compared to inhomogeneous gels of medium texture. The soft texture did not differ from the other textures in terms of proportion of selections of inhomogeneous gels in the 2-AFC test. Both the intensity ratings and 2-AFC results indicated that the hard texture leads to large sweetness differences between homogeneous and inhomogeneous gels. Based on these results, we hypothesize that sucrose concentration differences in the hard inhomogeneous gel might be maintained for an extended period during oral processing. These long-lasting tastant concentration differences might be the cause of the large sweetness differences between homogenous and inhomogeneous hard gels. Effect of Mechanical Properties and Sucrose Spatial Distribution on Time-Intensity Profile of Sweetness Intensity
Time-intensity analysis was performed to investigate the effects of mechanical properties and sucrose distribution on the temporal aspects of taste perception in the layered gels. The overall sweetness intensity of each gel was determined as the area under the sweetness curve (AUSC) and the maximum sweetness intensity (Imax) was determined as the maximum value in the sweetness curve. An effect of homogeneity was observed on the overall sweetness intensity [F(1,12)=24.6; p<0.001] and on Imax

Effect of texture and sucrose distribution on taste perception |
41 |
[F(1,12)=30.3; p<0.001]. In line with the sweetness intensity ratings and 2-AFC results, all inhomogeneous gels had significantly higher overall sweetness intensity (data not shown) and Imax (Figure 3-4A) than homogeneous gels. An effect of texture was observed on the overall sweetness intensity [F(2,24)=11.9; p<0.001] and on Imax [F(2,24)=24.2; p<0.001]. Soft gels were perceived as the sweetest (highest values of overall sweetness intensity and Imax) and the hard gel as the least sweet (lowest values of overall sweetness intensity and Imax). This result is in agreement with studies that reported an effect of mechanical properties on taste perception54-56. Figure 3-4. (A) Maximum sweetness intensity (Imax) and (B) Time at which Imax was perceived (tmax) (Mean ± SEM; n=39) of soft, medium and hard gels with homogeneous (-□-) (10/10/10/10) and inhomogeneous (-■-) (40/0/40/0) distributions of sucrose. In the intensity rating test only a main effect of homogeneity was observed on sweetness intensity, whereas in the time-intensity analysis main effects of homogeneity and texture were observed on the overall sweetness intensity and on Imax. A possible explanation for this inconsistence is that the measurement in the first test is an integral index of intensity given in retrospect, whereas the measurement in the second test is a composite of responses continuously generated. A texture x homogeneity interaction effect was observed on Imax [F(2,24)=8.2; p<0.01], but not on the overall sweetness intensity [F(2,24)=1.5; p=0.2]. This effect indicates that the differences in Imax between homogeneous and inhomogeneous gels depended on texture. The largest difference was observed for the hard gel, reinforcing the hypothesis of long-lasting tastant concentration differences during oral processing. The time at which Imax was perceived (tmax) tended to be shorter for the soft gel (Figure 3-4B), but the difference was not significant [F(2,24)=2.7; p=0.08].
From the time-intensity data we also determined whether the inhomogeneous distribution of sucrose led to a perceivable fluctuation of sweetness intensity during
0
5
10
15
20
25
Soft Medium Hard
t max
(s)
0
10
20
30
40
50
60
Soft Medium Hard
I max
(-)
A B

| Chapter 3
42 |
the time-intensity ratings. Analysis of the power spectral densities averaged from 10 consecutive 0.05 Hz frequency bins from 0 to 0.5 Hz revealed main effects of homogeneity in all 10 frequency bins [minimum F(1,12)=8.2; maximum p=0.01]. Inhomogeneous sucrose distributions in the gels caused higher power spectral densities than homogeneous distributions. Furthermore, texture effects were observed in the first 4 frequency bins from 0 to 0.2 Hz [F-values (2,24)=7,1; 6.3; 3.0 and 3.8, respectively; p-values=0.004; 0.006; 0.07 and 0.04, respectively]. In these frequency bins, power spectral densities decreased consistently with hardness. These results indicate that gels with an inhomogeneous distribution of sucrose had larger variations of sweetness intensity than homogeneous gels in a wide range of frequencies. Results also indicate that the hard gel induced smaller fluctuations of taste intensity at low frequencies (0-0.2 Hz) than soft and medium gels. The taste intensity fluctuations observed in inhomogeneous gels reinforce the assumption that tastant concentration differences are maintained during the oral processing of layered gels due to the presence of gel fragments containing low- and high-sucrose concentrations (Chapter 2). It was hypothesized that these tastant concentration differences lead to a discontinuous stimulation of taste receptors and, consequently, to the observed taste enhancement. In the rating test described in Chapter 2, consumers did not perceive fluctuations of sweetness intensity in the sample 40/0/40/0. In the present study, the observed temporal fluctuation of sweetness intensity in the inhomogeneous sample (40/0/40/0) indicates that the sucrose distribution heterogeneity affected the response behavior. Although the results of the frequency analysis indicate that subjects processed the distribution heterogeneity information, this does not imply that subjects consciously perceived sweetness intensity fluctuations.
The results for the temporal derivatives of sweetness intensity measured suggest that the mechanical properties of semi-solid gels affect the perception of taste. We hypothesize that the formation of a large number of gel fragments upon chewing in soft gels leads to a more efficient contact of sucrose and taste receptors. As a consequence, sweetness is perceived at high intensities in a short time. Fracture strain was reported to be the parameter that affects the perception of taste in gelled matrices60, 66. Since fracture strain and fracture stress were varied simultaneously in the gels used in this study, we cannot attribute the differences in sweetness between soft, medium and hard gels to one of these parameters. Besides physicochemical mechanisms (related to the release of tastants from the gel), perceptual mechanisms

Effect of texture and sucrose distribution on taste perception |
43 |
(related to cross-modal interactions) might also have contributed to the observed differences in sweetness between gels differing in mechanical properties.
CONCLUSIONS
Sweetness enhancement was observed in inhomogeneous soft, medium and hard layered gels, suggesting that taste enhancement by an inhomogeneous distribution of sucrose does not depend on the mechanical properties of semi-solids. Although the mechanical properties did not affect the overall sweetness intensity ratings, the breakdown behavior of the gel during oral processing affected the temporal aspects of taste perception. Soft gels were perceived as the sweetest (highest values of overall sweetness intensity and Imax) and hard gels as the least sweet. The time required to reach Imax tended to be shorter for soft gels than for medium and hard gels. We suggest that the formation of a large number of small fragments upon chewing results in a large surface area of contact between tastants and taste receptors. Consequently, the perception of taste is enhanced. The large difference in sweetness observed between homogeneous and inhomogeneous gels of hard texture might be explained by long-lasting tastant concentration differences during oral processing. Perceptual texture-taste interactions might also have accounted for the sweetness differences between gels differing in mechanical properties.
We conclude that sweetness perception can be enhanced through the modulation of the mechanical properties of food matrices. The combined effects of modulation of spatial distribution of sucrose and modulation of mechanical properties can be applied in the design of healthier low-sugar and low-salt food products.
ACKNOWLEDGEMENTS
The authors would like to thank Julie Cuvillier for helping in the execution of the experiments.


Chapter 4 Ana Carolina Mosca Fred van de Velde Johannes H.F. Bult Martinus A.J.S. van Boekel Markus Stieger
Submitted for publication
── Taste Enhancement in Gelled Products: Effect of Fracture Properties on Oral Breakdown, Bolus Formation and Sweetness Intensity ──

| Chapter 4
46 |
ABSTRACT
The effects of fracture strain and fracture stress on oral breakdown, in-mouth mixing, sucrose release and taste perception were investigated in this chapter. For this purpose, hydrocolloid gels containing sucrose heterogeneously distributed in layers were used. The oral breakdown was characterized by the number and surface area of gel fragments formed upon chewing. The in-mouth mixing was characterized by the mixing of gel fragments during bolus formation.
Results showed that the perception of taste in semi-solid gels was mainly affected by the breakdown and mixing behavior. The fracture properties of the gel had a direct effect on the oral breakdown and on the mixing of fragments during oral processing. The release of sucrose from the gel was affected by the surface area from which sucrose was released. Gels with low values of fracture strain and fracture stress broke down into a large number of fragments of small size upon chewing and had an efficient mixing with saliva. These gels were perceived sweeter than gels with high values of fracture strain and fracture stress. Furthermore, fracture strain had larger impact on the breakdown behavior and on sweetness intensity than fracture stress.
We suggest that the differences in sweetness intensity between gels differing in fracture properties result from differences in the frequency of stimulation of taste receptors. Increases in the total surface area of fragments formed upon chewing combined with an efficient mixing facilitate the release of tastants and the contact of tastants with taste receptors. Consequently, the frequency of stimulation of taste receptors is increased and the perception of taste is enhanced.
INTRODUCTION
The demand for low-sugar and low-salt food products has increased as a response to the growing concerns towards the current overconsumption of sugar and salt (tastants). As the sensorial properties of products are usually affected by reductions of tastants, low-sugar and low-salt products tend to have low acceptability in the market. Therefore, food manufacturers search for tastant reduction strategies that do not compromise the overall quality of products.
A tastant reduction strategy developed recently, which is based on the modulation of the spatial distribution of tastants in the food matrix, showed potential to avoid undesirable changes in sensorial properties and in consumer preference. Several studies reported that tastant concentration differences, which result from an

Oral breakdown, bolus formation and taste perception |
47 |
inhomogeneous distribution of sugar and salt in the food matrix, enhance taste intensity
Chapters 2-3,
94, 96, 99. This strategy was shown to allow for a 20% sucrose reduction in gelled products and for a 28% salt reduction in breads without compromising sweetness and saltiness. Besides maintaining taste intensity, this strategy also maintained consumer liking and preference. Semi-solid gels, breads and sausages containing tastants heterogeneously distributed in the matrix were shown to be equally or more preferred than products in which tastants were homogeneously distributed (Chapter 5). Noort et al.99 observed a relationship between consumer liking and the magnitude of salt concentration differences in bread. Saltiness intensity increased with increasing the magnitude of salt concentration differences, whereas consumer liking reached an optimum at intermediate concentration differences. These results give evidence that the reduction strategy based on the inhomogeneity concept can be applied in commercial food products.
Semi-solid products with inhomogeneous distributions of tastants break down into fragments containing different concentrations of tastants upon chewing. The presence of tastant concentration differences in the mouth exposes taste receptors to a discontinuous stimulation. The intensity of the discontinuous stimulation and the number of receptors stimulated by high-intensity stimuli were shown to affect taste enhancement (Chapter 2). These findings suggest that the frequency of discontinuous stimulation of receptors by high-intensity stimuli is the driving factor for the enhancement of taste by an inhomogeneous distribution of tastants. The results reported in Chapters 2 and 3 indicated that the breakdown of layers containing sucrose affects the frequency of discontinuous stimulation of receptors. Layered gels composed of 40% w/w sucrose layers that yielded more fragments of small size upon chewing had the highest sweetness enhancement. Therefore, in order understand the enhancement of taste that results from an inhomogeneous distribution of tastants, the relationship between mechanical properties, oral breakdown and taste perception should be further investigated.
During the oral processing of semi-solid products, the structure is broken down into fragments, which are then reduced in size, mixed and lubricated with saliva and fluids released from the product to form a bolus suitable to be swallowed62, 63. The oral breakdown and the mixing of fragments contribute to the release of tastants and facilitate the contact of tastants with taste receptors. It has been suggested that a facilitated release of tastants from semi-solids increases the perception of taste and flavor. Products that yielded more fragments upon chewing showed higher intensities

| Chapter 4
48 |
of taste and flavor than products that yielded less fragments. The strain at fracture (which is related to the brittleness of the product and thereby to the number and size of fragments formed) was suggested to be the parameter that affects taste and flavor perception60, 66.
The aim of this chapter was to investigate the effect of fracture properties on taste perception of semi-solid gels. To get a better understanding of the combined effects of mechanical properties and spatial distribution of tastants on taste perception, layered gels with inhomogeneous distributions of sucrose were used. Layered gels were composed of 2 layers containing 0% w/w sucrose and 2 layers containing 40% w/w sucrose. Four types of 40% sucrose layers differing in magnitude of fracture strain and fracture stress and 1 type of 0% sucrose layer with constant fracture properties were prepared. Layered gels were used to investigate the oral breakdown, the in-mouth mixing, the sucrose release from the gel and the perception of taste.
MATERIALS AND METHODS
Materials
Titanium dioxide (TiO2) suspension (30% w/w suspension of TiO2 in glucose syrup stabilized with gum acacia and preserved with potassium sorbate) (Overseal, FR) was purchased from Tefco Ingredients (Bodegraven, NL). Black food colorant (Americolor, USA) was purchased from a local retailer. The other ingredients used to prepare the samples were obtained as described in Chapter 2. Sample Preparation
The gel preparation procedure described in Chapter 2 was slightly modified. A solution of agar and water was heated to boiling. Gelatin was added after the solution was cooled down to 80 ˚C. The solution was kept in a water bath at 80 ˚C under stirring for 15 min. The solution was removed from the water bath and sucrose was added. For the gels that required colorant, the solution was cooled down to 60 ˚C after the addition of sucrose and colorant was added. An amount of 0.1% w/w of black food colorant was added to the 40% w/w sucrose gels and an amount of 0.5% w/w of TiO2 suspension was added to the 0% w/w sucrose gels. The solution was stirred for 5 min and water was added to compensate for the amount that evaporated during heating.
The concentrations of agar and gelatin were varied to obtain 4 types of 40% sucrose gels differing in fracture strain and fracture stress. One type of 0% sucrose gel with

Oral breakdown, bolus formation and taste perception |
49 |
intermediate fracture properties was prepared. The composition of each gel is shown in Table 4-1. Table 4-1. Composition of gels.
Gel Type Fracture Stress (σ)
Fracture Strain (ε)
Sucrose (% w/w)
Agar (% w/w)
Gelatin (% w/w)
Hσ/Lε High Low 40 0.7 0 Hσ/Hε High High 40 0.4 2.7 Lσ/Lε Low Low 40 0.4 1 Lσ/Hε Low High 40 0.2 1.8 Mσ/Mε Medium Medium 0 0.43 2.8
Gel layers were prepared by pouring hot solutions of agar/gelatin/sucrose into plastic Petri dishes. After storage overnight at 5 ˚C, gel layers were cut into squares. The length and width of square layers were 20 mm. The thickness of the 0% sucrose layers was 6 mm and the thickness of the 40% sucrose layers was 2 mm.
Samples (layered gels) consisted of 4 square layers (2 layers containing 0% and 2 layers containing 40% sucrose) placed on top of each other as shown in Figure 4-1. Layers were prepared on a mass basis to ensure an overall sucrose concentration of 10% w/w in all samples. Layered gels were assembled less than 30 min prior to the sensory tests to minimize diffusion of sucrose through the layers.
Compression Measurements
Uniaxial compression measurements were performed as described in Chapter 2. The mean values of fracture stress and fracture strain were calculated from the measurements of 8 replicates (4 gel pieces from 2 gel specimen). Breakdown and Mixing Test
The breakdown behavior of layered gels was determined by measuring the number and surface area of gel fragments formed upon chewing. The in-mouth mixing was determined by the characterization of the mixing of gel fragments in the bolus. Food
Figure 4-1. Layered gels composed of 0% sucrose layers (white layers) and 40% sucrose layers (black layers).
2 mm
6 mm
2 mm
6 mm

| Chapter 4
50 |
colorant was added to the gels used in this test to enable the differentiation between fragments containing 0% sucrose (white color) and 40% sucrose (black color). Seven subjects (6 females; age: 20-34) participated in this test. Subjects received a brief instruction about the task to be performed at the beginning of the test. They were asked to place the layered samples between the molars in one side of the mouth and to chew a fixed number of times (3, 6, 9, 12 and 15 chews) at a rate of 1 chew/s. The chewing rate was controlled with a timer by the subject. The bolus consisting of gel fragments and saliva was then expectorated in a Petri dish. In addition, subjects were asked to chew the samples until the bolus was ready to be swallowed (free chew condition) and to indicate the number of chews required. One replicate of each layered gel was evaluated per subject in randomized order. Pictures from the top and from the bottom of the Petri dishes containing the expectorated boluses were taken using a PowerShot SX 120 IS camera (Canon Inc., JP) and a 9950F scanner (Canon Inc., JP), respectively.
Subsequently, 20 mL of water was added to the Petri dishes containing the expectorated boluses and the gel fragments were gently separated with a spatula. Pictures from the bottom of the Petri dishes containing the gel fragments were taken using a 9950F scanner (Canon Inc., JP). These pictures were subjected to image analysis using the software Leica Qwin Pro V 3.1.0 (Leica Microsystems Imaging Solutions Ltd., UK) for the characterization of the oral breakdown behavior of layered gels (i.e. number and surface area of fragments). Sucrose Release Test
To determine the release of sucrose from the gel into water, layered gels (composed of 2 layers containing 0% sucrose (dimensions: 20x20x6 mm) and 2 layers containing 40% sucrose (dimensions: 20x20x2 mm)) previously weighed were placed in a beaker containing 50 mL of RO water (23 ± 1 ˚C). The weight of the layered gels was approximately 7.5 g. The content of the beaker was stirred at 300 rpm. A volume of 1 mL of solution was collect from the beaker with a syringe after 5, 10, 15, 30, 45, 60, 150, 300 and 3600 s. For each time point, a new beaker with water and a new layered gel were used. The tip of syringe was covered with a filter to avoid the presence of fragments of gel in the solution collected. The concentration of sucrose in the solutions was quantified by HPLC analysis.
To determine the effect of surface area on the release of sucrose from the gel, layered gels were cut into 16 pieces of equal size. This yielded a total of 64 pieces, which were

Oral breakdown, bolus formation and taste perception |
51 |
composed of 32 pieces containing 0% sucrose (dimensions: 5x5x6 mm) and 32 pieces containing 40% sucrose (dimensions: 5x5x2 mm). In the first release experiment, the total surface area of the layers from which sucrose diffused (2 layers containing 40% sucrose) was 1920 mm2. In the second release experiment, the total surface area of the pieces from which sucrose diffused (32 pieces containing 40% sucrose) was 2880 mm2. The total surface area was, therefore, increased by a factor of 1.5. The procedure described above was repeated for the determination of the release of sucrose from the gel pieces into water. Sweetness Rating Test
The effect of fracture properties on the overall sweetness intensity of layered gels was investigated at different moments of oral processing. The samples used in this test were prepared without the addition of colorant. Ten untrained subjects (6 females; age: 20-37) with normal ability to taste participated in this test. Subjects received a brief instruction about the task to be performed at the beginning of the test. They were asked to place a layered sample between the molars in one side of the mouth, to chew a fixed number of times (3, 6, 9, 12 and 15 chews) at a rate of 1 chew/s (controlled with a timer) and to expectorate the bolus. Sweetness intensity was then rated on a 100-point scale, anchored ‘not sweet’ at scale value 0 and ‘very sweet’ at scale value 100. Four replicates of each sample were assessed by subjects in 4 different sessions of 1 h. Samples were presented in randomized order within replicates. Water was provided to clean the mouth between samples. Data Analysis
To determine the effect of fracture properties and number of chews on the number and surface area of white and black fragments formed upon chewing, full-factorial multi-factor ANOVA (SPSS, v 17, SPSS Inc, USA) was performed with fracture strain and fracture stress (low and high) and number of chews (3, 6, 9, 12 and 15) as fixed factors and subjects as a random factor. To determine the effect of fracture properties on the number of chews required for swallowing and on the number and area of fragments at the moment of swallowing, full-factorial multi-factor ANOVA was performed with fracture strain and fracture stress (low and high) as fixed factors and subjects as a random factor. To determine the effect of fracture properties and number of chews on sweetness intensity ratings, full-factorial multi-factor ANOVA was performed with fracture strain and fracture stress (low and high), number of chews (3, 6, 9, 12 and 15) and replicates (4) as fixed factors and subjects as a random
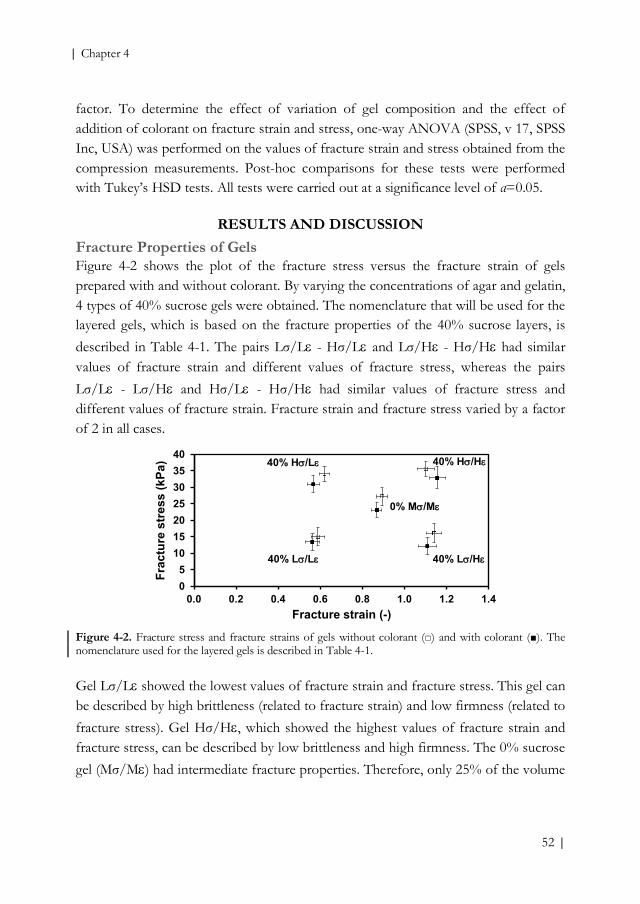
| Chapter 4
52 |
factor. To determine the effect of variation of gel composition and the effect of addition of colorant on fracture strain and stress, one-way ANOVA (SPSS, v 17, SPSS Inc, USA) was performed on the values of fracture strain and stress obtained from the compression measurements. Post-hoc comparisons for these tests were performed with Tukey’s HSD tests. All tests were carried out at a significance level of α=0.05.
RESULTS AND DISCUSSION
Fracture Properties of Gels
Figure 4-2 shows the plot of the fracture stress versus the fracture strain of gels prepared with and without colorant. By varying the concentrations of agar and gelatin, 4 types of 40% sucrose gels were obtained. The nomenclature that will be used for the layered gels, which is based on the fracture properties of the 40% sucrose layers, is described in Table 4-1. The pairs Lσ/Lε - Hσ/Lε and Lσ/Hε - Hσ/Hε had similar values of fracture strain and different values of fracture stress, whereas the pairs Lσ/Lε - Lσ/Hε and Hσ/Lε - Hσ/Hε had similar values of fracture stress and different values of fracture strain. Fracture strain and fracture stress varied by a factor of 2 in all cases. Figure 4-2. Fracture stress and fracture strains of gels without colorant (□) and with colorant (■). The nomenclature used for the layered gels is described in Table 4-1.
Gel Lσ/Lε showed the lowest values of fracture strain and fracture stress. This gel can be described by high brittleness (related to fracture strain) and low firmness (related to fracture stress). Gel Hσ/Hε, which showed the highest values of fracture strain and fracture stress, can be described by low brittleness and high firmness. The 0% sucrose gel (Mσ/Mε) had intermediate fracture properties. Therefore, only 25% of the volume
05
10152025303540
0.0 0.2 0.4 0.6 0.8 1.0 1.2 1.4
Frac
ture
str
ess
(kPa
)
Fracture strain (-)
40% Hσ/Lε 40% Hσ/Hε
40% Lσ/Lε 40% Lσ/Hε
0% Mσ/Mε

Oral breakdown, bolus formation and taste perception |
53 |
of the layered gels differed in fracture properties, since the 40% sucrose layers represented 25% of the total volume.
Low and high values of fracture strain and fracture stress differed significantly for both types of gels (with and without colorant) (p<0.05). The addition of colorant did not lead to significant changes in fracture strain and fracture stress. Effect of Fracture Properties on Bolus Formation
The test conditions used in this study (i.e. 3, 6, 9, 12 and 15 chews and a chew rate of 1 chew/s) were defined in a preliminary trial as appropriate conditions to monitor the oral breakdown of the layered gels. During the breakdown test, the number of chews required to prepare the bolus for swallowing was determined by asking the subjects to chew freely the layered gels and to indicate the required number of chews. The average number of chews indicated by the subjects is shown in Table 4-2. Table 4-2. Number of chews (Mean ± SEM, n=7) required to prepare the bolus for swallowing and characteristics of gel fragments at the moment of swallowing (Mean ± SEM, n=7).
Gel Type Required Chews
Layer (% sucrose)
Number of Fragments
Surface Area of Fragments (mm2)
Hσ/Lε 11.6 ± 1.0 0 234 ± 59 10.8 ± 4.1 40 150 ± 50 14.7 ± 5.5
Hσ/Hε 14.7 ± 1.2 0 252 ± 38 8.1 ± 3.1 40 119 ± 34 12.0 ± 4.5
Lσ/Lε 10.0 ± 1.1 0 258 ± 69 10.8 ± 4.1 40 132 ± 43 13.1 ± 5.0
Lσ/Hε 14.1 ± 1.2 0 247 ± 43 9.6 ± 3.6 40 139 ± 32 11.9 ± 4.5
For gels Lσ/Lε and Hσ/Lε, the required number of chews was smaller than the maximum value established in the test protocol (15 chews), whereas for gels Lσ/Hε and Hσ/Hε, the required number of chews was similar to the maximum value established in the protocol. Gel Lσ/Lε required less chews than the other gels to prepare the bolus for swallowing. These results indicate that the differences in fractures properties among the layered gels were large enough to change the duration of oral processing. A significant effect of fracture strain was observed on the number of chews required for swallowing [F(1,6)=31.4; p<0.001].
The bolus formation of layered gels differing in fracture properties was characterized through the determination of the mixing of black gel fragments (40% sucrose layers) and white fragments (0% sucrose layers) and through the determination of the

| Chapter 4
54 |
number and surface area of gel fragments formed upon chewing. An example of expectorated boluses produced after 3, 6, 9, 12 and 15 chews by one subject is shown in Figure 4-3. A visual comparison of the pictures indicates that the boluses of the different gels became more homogeneous as the number of chews increased. Moreover, gels with low values of fracture strain and stress showed a more homogeneous bolus than gels with high values of fracture strain and stress. A visual comparison of the pictures did not allow identifying the magnitude of the impact of each fracture parameter (fracture strain or fracture stress) on the mixing of fragments.
Figure 4-3. In-mouth mixing: expectorated boluses produced by one subject after 3, 6, 9, 12 and 15 chews.
3 chews
Hσ/Lε Hσ/Hε Lσ/Hε
6 chews
9 chews
12 chews
15 chews
Lσ/Lε

Oral breakdown, bolus formation and taste perception |
55 |
Figure 4-4 shows an example of expectorated boluses in which the fragments have been separated for the determination of the number and surface area of fragments formed upon chewing.
Figure 4-4. Oral breakdown behavior: white fragments (0% sucrose layers) and black fragments (40% sucrose layers) produced by one subject after 3, 6, 9, 12 and 15 chews. The average number and surface area of white and black gel fragments obtained from image analysis are shown in Figure 4-5. The number of chews had a significant effect on the number and surface area of white fragments [F(4,24)=88.1 and 28.1; p<0.001] and black fragments [F(4,24)=185.9 and 19.9; p<0.001]. As the number of chews
3 chews
6 chews
9 chews
12 chews
15 chews
Hσ/Lε Hσ/Hε Lσ/Lε Lσ/Hε
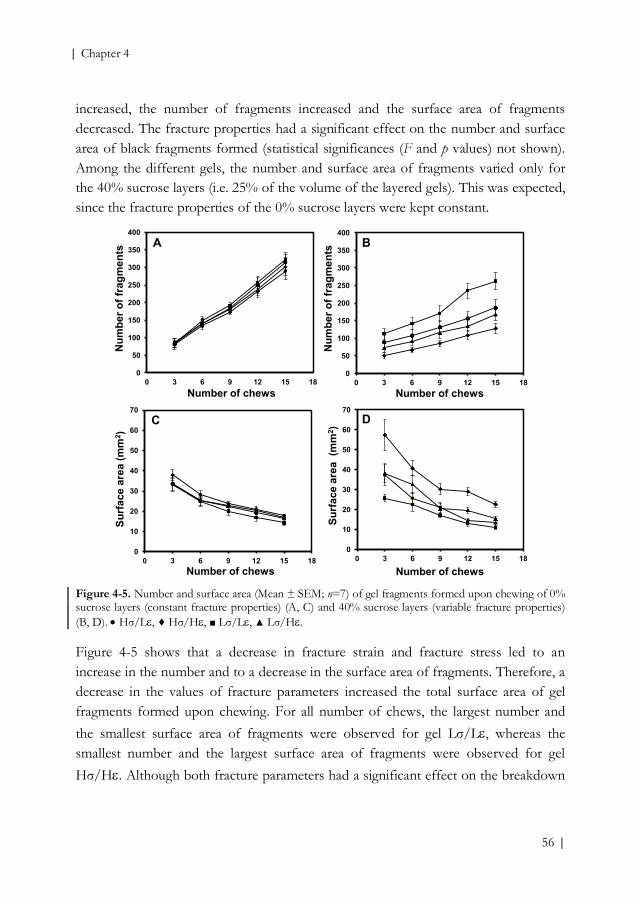
| Chapter 4
56 |
increased, the number of fragments increased and the surface area of fragments decreased. The fracture properties had a significant effect on the number and surface area of black fragments formed (statistical significances (F and p values) not shown). Among the different gels, the number and surface area of fragments varied only for the 40% sucrose layers (i.e. 25% of the volume of the layered gels). This was expected, since the fracture properties of the 0% sucrose layers were kept constant.
Figure 4-5. Number and surface area (Mean ± SEM; n=7) of gel fragments formed upon chewing of 0% sucrose layers (constant fracture properties) (A, C) and 40% sucrose layers (variable fracture properties) (B, D). • Hσ/Lε, ♦ Hσ/Hε, ■ Lσ/Lε, ▲ Lσ/Hε. Figure 4-5 shows that a decrease in fracture strain and fracture stress led to an increase in the number and to a decrease in the surface area of fragments. Therefore, a decrease in the values of fracture parameters increased the total surface area of gel fragments formed upon chewing. For all number of chews, the largest number and the smallest surface area of fragments were observed for gel Lσ/Lε, whereas the smallest number and the largest surface area of fragments were observed for gel Hσ/Hε. Although both fracture parameters had a significant effect on the breakdown
0
10
20
30
40
50
60
70
0 3 6 9 12 15 18
Surf
ace
area
(m
m2 )
Number of chews
0
50
100
150
200
250
300
350
400
0 3 6 9 12 15 18
Num
ber o
f fra
gmen
ts
Number of chews
0
10
20
30
40
50
60
70
0 3 6 9 12 15 18
Surf
ace
area
(mm
2 )
Number of chews
0
50
100
150
200
250
300
350
400
0 3 6 9 12 15 18
Num
ber o
f fra
gmen
ts
Number of chews
A
C
B
D

Oral breakdown, bolus formation and taste perception |
57 |
behavior, the absolute differences in number and surface area of black fragments between gels with low and high strain were larger than that between gels with low and high stress. Therefore, a 2 fold variation of fracture strain had larger effects on the breakdown behavior of gels than a 2 fold variation of fracture stress.
The number and surface area of gel fragments produced by the free chewing condition (i.e. number of chews required to prepare the bolus for swallowing) give an estimation of the particle size distribution in the bolus at the moment of swallowing. The average number and surface area of white and black fragments are shown in Table 4-2. Significant effects of fracture strain or fracture stress were not observed on the number and surface area of fragments at the moment of swallowing. This indicates that subjects adapted their number chews according to the fracture properties of the gel in order to swallow particles of similar size. Effect of Fracture Properties on Sucrose Release
The release of sucrose from the layered gels into water was investigated to determine whether the differences in gel composition and, consequently, in fracture properties, affect the profile of sucrose release. Figure 4-6 shows the sucrose release curves of the layered gels Hσ/Lε, Hσ/Hε, Lσ/Lε and Lσ/Hε. Figure 4-6. Sucrose release curves of layered gels (total surface area of 1920 mm2) (close symbols) and gels pieces (total surface area of 2880 mm2) (open symbols). • Hσ/Lε, ♦ Hσ/Hε, ■ Lσ/Lε, ▲ Lσ/Hε. The values in the plot correspond to the absolute concentration of sucrose (% w/w) in the solution. The values plotted correspond to the absolute concentration of sucrose (% w/w) in the solution. After 1 h (last data point; not shown in Figure 4-6), the equilibrium in sucrose concentration between the gel and the solution was reached (i.e. the concentration of sucrose in the solution was approximately 1.5% w/w). All gels exhibited similar sucrose release profiles, suggesting that the variations in the gel
0.0
0.2
0.4
0.6
0.8
1.0
0 50 100 150 200 250 300 350
Sucr
ose
(% w
/w)
Time (s)

| Chapter 4
58 |
composition did not lead to prominent changes in the gel network and, consequently, in the diffusion coefficient. Although the magnitudes of fracture strain and stress were varied by a factor of 2, the mobility of sucrose through the gel and the release of sucrose from the gel did not change. This can be explained by the characteristics of the network structure of agar-gelatin gels, which is open and not sufficiently dense to prevent the mobility and the release of sucrose100.
Figure 4-6 also shows that the sucrose release profile did not vary between the pieces of the layered gels Hσ/Lε, Hσ/Hε, Lσ/Lε and Lσ/Hε. The comparison of the sucrose release curves of layered gels and gels pieces shows that the sucrose release rate was faster for the pieces than for the layers. A 1.5 fold increase in the total surface area led to an approximate 1.6 fold increase in the rate of sucrose release. This indicates that sucrose release is proportional to the total surface area.
The results from the release experiment showed that the variations of fracture properties, which resulted from variations of gel composition, did not have a direct effect on the profile of sucrose release from of the gels into water. However, fracture properties have an indirect effect on the profile of sucrose release, since fracture strain and fracture stress affect the surface area of fragments formed upon chewing. As the layered gels Hσ/Lε, Hσ/Hε, Lσ/Lε and Lσ/Hε were shown to break down into fragments of different surface area, the in-mouth sucrose release profile of these gels will differ. This means that gels that break down into a large number of small fragments during oral processing (i.e. gels that have low values of fracture strain and fracture stress) will have the fastest in-mouth release of sucrose. Similar results were reported by Koliandris et al.60 and Mills et al.100. Koliandris et al.60 observed a negative correlation between Na+ release from gels and strain at fracture. Gels with low strain at fracture (brittle gels) had a higher release of salt than gels with high strain at fracture. Mills et al.100 observed higher release rates of salt from gelatin gels compared to gellan gels. The authors attributed those differences to an increase in the total surface area of gelatin gel fragments, since gelatin gels yielded more fragments of smaller size under compression than gellan gels. Effect of Fracture Properties on Sweetness Intensity
The number of chews had a significant effect on sweetness intensity ratings [F(4,36)=32.95; p<0.001]. Figure 4-7 shows that sweetness ratings increased as chewing progressed. Across all gels, sweetness intensities rated after 3 chews were the lowest, whereas sweetness intensities rated after 12 and 15 were the highest (p<0.05).

Oral breakdown, bolus formation and taste perception |
59 |
The differences between sweetness intensities rated after 12 and 15 chews were not significant. Figure 4-7. Sweetness intensity of layered gels (Mean ± SEM; n=10, 4 replicates). • Hσ/Lε, ♦ Hσ/Hε, ■ Lσ/Lε, ▲ Lσ/Hε. The fracture properties also had a significant effect on sweetness intensity ratings (fracture strain [F(1,9)=50.2; p<0.001] and fracture stress [F(1,9)=24.2; p<0.001]). Gels with low values of fracture strain and stress had higher sweetness intensity ratings than gels with high values of fracture strain and stress for all number of chews (Figure 4-7). The comparison of the F values of fracture strain (50.2) and fracture stress (24.2) indicates that the magnitude of the effect of fracture strain on sweetness intensity was larger than that of fracture stress. Furthermore, the absolute difference in sweetness intensity between gels with low and high strain was larger than that between gels with low and high stress, reinforcing that fracture strain had larger impact on sweetness intensity than fracture stress.
Two types of mechanisms may explain the effect of texture on taste perception: perceptual and physicochemical mechanisms. The first type is related to perceptual texture-taste interactions37, 57. The second type is related to the mobility and release of tastants58,
59. These 2 mechanisms may occur simultaneously depending on the textural characteristics of the food matrix61. The plot of sweetness intensity ratings versus surface area of black fragments (fragments that contained sucrose) shows that the data points for the gels differing in fracture properties superimpose (Figure 4-8). This indicates that the breakdown behavior (i.e. formation of a large number of fragments of small size and increase in the total surface area) is the driving factor for taste perception in the layered gels. We conclude, therefore, that the perception of taste in semi-solid gels can be explained by physicochemical mechanisms. Furthermore, fracture strain is the fracture parameter that has more impact on the perception of
0
20
40
60
80
100
0 3 6 9 12 15 18
Swee
tnes
s in
tens
ity (-
)
Number of chews

| Chapter 4
60 |
taste. Increases in the total surface area of fragments combined with an efficient mixing facilitate the release of tastants and the contact of tastants with taste receptors. Consequently, the frequency of stimulation of receptors is increased and taste is enhanced. Additional perceptual effects of texture on sweetness might also have contributed for the differences in sweetness intensity between the layered gels differing in fracture properties. However, our results did indicate the occurrence of perceptual mechanisms. Figure 4-8. Sweetness intensity (Mean ± SEM; n=10, 4 replicates) versus surface area of black fragments formed upon chewing (Mean ± SEM; n=7). • Hσ/Lε, ♦ Hσ/Hε, ■ Lσ/Lε, ▲ Lσ/Hε.
CONCLUSIONS
Fracture properties were shown to affect the perception of taste in gelled products through changes in the oral breakdown and in-mouth mixing behavior. The profile of sucrose release was shown to be indirectly affected by fracture properties, as it depended on the surface area of gel fragments from which sucrose was released. Fracture strain had larger effects on the breakdown behavior and on taste perception than fracture stress. Results suggest that the differences in sweetness intensity in the layered gels differing in fracture strain resulted from differences in the frequency of stimulation of taste receptors. The release of sucrose from the matrix is facilitated in products that break into a large number of small fragments upon chewing and have an efficient mixing during bolus formation (i.e. products with low values of fracture properties). Consequently, there is more contact of sucrose with taste receptors (i.e. high frequency of receptor stimulation) and taste perception is enhanced. Therefore, the mechanical properties (especially fracture strain) can be modulated to enhance the perception of taste. In products with inhomogeneous distributions of tastants, texture modulation can be performed only in the zones containing high-tastant concentration. This means that the modulation of mechanical properties and spatial distribution of
0
20
40
60
80
100
0 20 40 60 80
Swee
tnes
s in
tens
ity (-
)
Surface area of fragments (mm2)

Oral breakdown, bolus formation and taste perception |
61 |
tastants can be applied in the development of products with reduced contents of tastants.
ACKNOWLEDGEMENTS
The authors would like to thank Jiana Ren and Jennifer Rey for helping in the execution of the experiments.


Chapter 5
── Effect of tastant concentration differences on taste intensity, taste intensity fluctuation and consumer preference ──
Ana Carolina Mosca Johannes H.F. Bult Markus Stieger
Submitted for publication

| Chapter 5
64 |
ABSTRACT
Two sensory studies were carried out to compare the taste intensity, the perceived fluctuation of taste intensity and the consumer preference of food products with homogeneous and inhomogeneous distributions of tastants using 2-AFC tests. The first study evaluated pairs of products (homogeneous and inhomogeneous) from different food categories (gels, breads and sausages). The second study evaluated 4 types of gels and sausages (1 homogeneous product and 3 inhomogeneous products varying in the magnitude of tastant concentration differences).
In the first study, all products with inhomogeneous distributions of tastants were perceived sweeter or saltier than the respective homogeneous products. Tastant concentration differences were perceived through fluctuations of taste intensity in inhomogeneous gels and breads, but not in inhomogeneous sausages. Inhomogeneous gels and sausages were more preferred than the homogeneous products, whereas inhomogeneous and homogeneous breads were equally preferred. In the second study, the taste intensity of inhomogeneous gels increased with increasing the magnitude of tastant concentration differences. Homogeneous and inhomogeneous sausages did not differ in taste intensity. Tastant concentration differences induced perceivable taste intensity fluctuations in inhomogeneous gels, but not in inhomogeneous sausages. The inhomogeneous gel with the largest tastant concentration difference was more preferred than the homogeneous gel. Homogeneous and inhomogeneous sausages were equally preferred by consumers. Furthermore, results suggested that taste enhancement in inhomogeneous (semi-) solid products does not depend on the conscious perception of taste intensity fluctuations.
We conclude that products in which tastants are heterogeneously distributed in the matrix are equally or more preferred than products in which tastants are homogeneously distributed. Therefore, the inhomogeneity concept could be applied in the development of low-sugar and low-salt products without compromising consumer preference.
INTRODUCTION
Food manufacturers have a great interest in developing low-sugar and low-salt food products that have a good acceptance in the market. Because sugar and salt are important contributors to the sensorial properties of foods, products with reduced

Tastant concentration differences and consumer preference |
65 |
contents of sugar and salt tend to have lower consumer acceptance than the regular products.
Changes in rheological, physical and sensorial properties of foods as a result of tastant (sugar and salt) reduction or tastant replacement have been observed in different food categories such as meat4, bakery5, 6, confectionary101 and dairy102. Consumer preference was also shown to be affected by reductions in sugar and salt contents. The overall acceptability of pork ham11 and the taste pleasantness of sausages12 were higher at higher salt levels. Zandstra et al.13 reported a relation between salt content and pleasantness ratings in bread. Pleasantness had an optimum value at a salt content of 2% and declined below and above this salt level. In cookies14 and ice cream15, the acceptability of products decreased as sugar content was reduced. In both products, a reduction in sugar content had more impact on the overall acceptability than a reduction in fat content. Therefore, to maintain the acceptance of products, tastant reduction strategies should not cause prominent changes in the properties of food products.
It has been shown that an inhomogeneous distribution of tastants in food matrices enhances the perception of taste. Chapter 2 and Holm et al.94 reported that sweetness intensity was enhanced in gelled products in which sucrose was heterogeneously distributed in the matrix. Taste enhancement by inhomogeneous distributions of tastants was shown to be independent of the mechanical properties of the matrix (Chapter 3). Similarly, the saltiness intensity of breads was enhanced by an inhomogeneous distribution of salt96, 99. An increase in the magnitude of tastant concentration differences within the matrix led to an increase in the magnitude of taste enhancement in all cases. A 20% sucrose reduction in gelled products (Chapter 2) and a 28% salt reduction in breads96 were achieved without decreasing the intensities of sweetness and saltiness.
The results of the studies mentioned above suggested that the modulation of the spatial distribution of tastants in the food matrix is a feasible strategy to reduce sugar and salt in food products. To determine the full applicability of this tastant reduction strategy, the consumer acceptance of products with inhomogeneous tastant distributions should be evaluated. Noort et al.99 investigated the consumer liking of breads containing salt heterogeneously distributed in the crumb. The authors found that saltiness intensity increased with increasing the magnitude of tastant concentration differences, whereas consumer liking reached an optimum at

| Chapter 5
66 |
intermediate concentration differences. It was concluded that the inhomogeneity concept can enhance saltiness intensity of breads without affecting consumer liking.
The aim of this chapter was to investigate the effects of tastant concentration differences on taste intensity, perceived fluctuation of taste intensity and consumer preference. Furthermore, this chapter aimed at determining a relationship between the spatial distribution of tastants and consumer preference in different food matrices. Two sensory studies were carried out to compare the taste intensity, the perceived taste intensity fluctuation and the preference of products with homogeneous and inhomogeneous distributions of tastants using 2-AFC tests. In the first study, pairs of gels, breads and sausages (1 homogeneous and 1 inhomogeneous product) were evaluated. In the second study, 4 types of gels and sausages (1 homogeneous product and 3 inhomogeneous products varying in the magnitude of tastant concentration differences) were evaluated.
MATERIALS AND METHODS
Sample Preparation
Gels Mixed agar-gelatin gels containing 0, 10, 20 and 40% w/w sucrose were prepared according to the procedure described in Chapter 4. Hot solutions of agar/gelatin/sucrose were poured into Petri dishes. After cooling overnight, gel layers were cut into squares that were stored at 5 ˚C until further use in the sensory tests. The length and width of square layers were 20 mm. All layers had a thickness of 2 mm, except the 0 and 40% sucrose layers that were used to prepare the sample 40/0/40/0. These layers had thickness of 3 and 1 mm, respectively. Layered gels with homogeneous and inhomogeneous distributions of sucrose were prepared by combining square layers containing different concentrations of sucrose (Table 5-1). The layers were prepared on a mass basis to ensure an overall sucrose concentration of 10% w/w in all layered gels. Breads Breads containing 0, 1.5 and 3.0% w/w salt were prepared at TNO Quality of Life (Zeist, NL) as described by Noort et al.96. Breads were stored at -20 ˚C after preparation. One day prior to the sensory test, breads were removed from the freezer to defrost and to equilibrate to 20 ˚C. On the day of the test, cubes of about 10x10x30 mm were cut from the crumb of the breads. Two cubes containing 1.5% w/w salt

Tastant concentration differences and consumer preference |
67 |
were combined to prepare samples with a homogeneous distribution of salt. Inhomogeneous samples were composed of 1 cube containing 0% w/w salt and 1 cube containing 3.0% w/w salt (Table 5-1). The mass of the cubes was approximately the same (1.50 ± 0.02 g) to ensure an overall salt concentration of 1.5% w/w in homogenous and inhomogeneous samples. Sausages Commercial Lyoner sausages were kindly provided by Vion food group (Landsberg, DE). Sausages were composed of 80% pork meat with added water, salt, spices, stabilizers (E450, E412), dextrose, antioxidant (E300), flavor, color (E120) and preservative (E250). The amount of salt added during production was varied: 0.5, 1.0, 1.5, 2.0, 2.5, 3.0, and 3.5% w/w salt. Sausages were cut into circular slices of approximately 70 mm diameter and 2 mm thickness. Each circular slice was further cut into 8 pieces of equal size. The pieces were stored at 5 ˚C until further use in the sensory tests. Four pieces of sausage varying in salt concentration were placed on top of each other to prepare sausage samples with homogeneous and inhomogeneous distributions of salt (Table 5-1). The mass of the sausage pieces within a sample was approximately the same (1.80 ± 0.02 g) to ensure an overall salt concentration of 2% w/w in homogenous and inhomogeneous samples. Sensory Study 1: Effect of Tastant Concentration Differences on Taste Intensity, Fluctuation of Taste Intensity and Consumer Preference
Samples The gel, bread and sausage samples used in study 1 are listed in Table 5-1. Gel layers and sausage pieces were removed from the refrigerator 1 h prior to the sensory tests to equilibrate to 20 ˚C. The samples were assembled (by placing 4 gel layers or 4 sausage pieces on top of each other) less than 30 min before the sensory tests to minimize diffusion of tastants within samples. Breads, which were removed from the freezer 1 day prior to the sensory tests, were cut into cubes. Bread samples were composed of 2 cubes of equal mass. All products were served in closed plastic containers. Subjects A total of 183 subjects (133 females; age: 30-60) with normal ability to taste participated in the study. All subjects gave written informed consent.

| Chapter 5
68 |
Table 5-1. Overview of samples used in study 1 and 2.
Numbers correspond to the concentration of tastant (% w/w) in each layer. In the schematic figures, each symbol ‘+’ represents 0.5% w/w salt (bread and sausage) and each symbol ‘●’ represents 2% w/w sugar (gel). The layer thickness of all layered gels was 2/2/2/2 mm with the exception of sample 40/0/40/0, which had a thickness of 1/3/1/3 mm.
Product Category
Product Pairs Total Tastant Concentration (% w/w) Homogenous Inhomogeneous
Study 1
Gel
10/10/10/10
40/0/40/0
10
Bread
1.5/1.5
0/3
1.5
Sausage
2/2/2/2
0.5/3.5/0.5/3.5
2
Study 2
Gel
10/10/10/10
20/0/20/0
10
10/10/10/10
40/0/0/0
10
10/10/10/10
40/0/40/0
10
Sausage
2/2/2/2
1.5/2.5/1.5/2.5
2
2/2/2/2
1/3/1/3
2
2/2/2/2
0.5/3.5/0.5/3.5
2

Tastant concentration differences and consumer preference |
69 |
Method The test was divided into 8 sessions of 1 h, each one containing approximately 23 subjects. Each subject attended 1 session. Samples were evaluated in a sensory room at 20 ˚C with normal light and controlled air. 2-AFC tests were performed to compare the consumer preference, the taste intensity and the fluctuation of taste intensity of gels, breads and sausages with homogenous and inhomogeneous distributions of tastants. Samples were presented in pairs composed of homogeneous and inhomogeneous products belonging to the same product category (gel, bread and sausage) (Table 5-1). Subjects were instructed to remove the first sample from the plastic container, to place the sample in the mouth, to chew until the sample could be swallowed and to expectorate the bolus. The same procedure was repeated for the second sample of the pair. After tasting both samples, subjects had to indicate which one they preferred. Subsequently, 2 additional pairs of the same samples were evaluated and subjects had to indicate which product was the sweetest (gel) or saltiest (bread and sausage) and which product had the largest fluctuation of sweetness or saltiness intensity during chewing. This procedure was followed for the 3 products. The order of homogeneous and inhomogeneous samples within the pairs and the order at which the different products were presented were randomized. Each product category was presented as the first product to 1/3 of the subjects (approximately 60 times). The order of the 2-AFC test was kept the same (first question: preference, second question: taste intensity and third question: fluctuation of taste intensity). Water and crackers were used to clean the palate between samples. Breaks of 1 min were taken between pairs. The test was executed by Essensor (Ede, NL). Data analysis Response data was collected with Fizz software (v 2.40c, Biosystemes, FR). The observed numbers of selections (k) out of the total number of comparisons (n) were tested by binomial testing (Fizz calculations, v 2.40c, Biosystemes, FR) to identify differences between the homogeneous and inhomogeneous samples compared in the 2-AFC tests. The relations between the 2-AFC results for consumer preference, taste intensity and fluctuation of taste intensity were determined using Chi-square analysis (SPSS v 17, SPSS Inc, USA). Logistic regression was performed to investigate whether consumer preference could be predicted by the factors spatial distribution of tastants, consumer age and gender (SPSS v 17, SPSS Inc, USA).

| Chapter 5
70 |
Sensory Study 2: Effect of Magnitude of Tastant Concentration Differences on Taste Intensity, Fluctuation of Taste Intensity and Consumer Preference of Gels and Sausages
Samples Samples were prepared as described in study 1. The gel and sausage samples used in study 2 are listed in Table 5-1. Subjects A total of 125 subjects (82 females; age: 29-57) with normal ability to taste participated in the study. All subjects gave written informed consent. Method The test was divided into 8 sessions of 1 h, each one containing approximately 16 subjects. Each subject attended 2 sessions in 2 consecutive days. Samples were evaluated in a sensory room at 20 ˚C with normal light and controlled air. Consumer preference, taste intensity and fluctuation of taste intensity of gels and sausages with homogeneous and inhomogeneous distribution of tastants were compared in 2-AFC tests. Samples were presented in pairs composed of homogeneous and inhomogeneous products belonging to the same product category. Three different pairs of each product were evaluated. One of the samples of the pair was always the homogenous product and the other was one of the inhomogeneous products varying in magnitude of tastant concentration differences (Table 5-1). The evaluation procedure was the same as described in study 1. The order of samples within the pairs (homogeneous and inhomogeneous) and the order of the pairs (inhomogeneous samples varying in the magnitude of tastant concentration differences) were randomized. Each product category was presented as the first product to half of the subjects (approximately 62 times). The order of the 2-AFC test was kept the same (first question: preference, second question: taste intensity and third question: fluctuation of taste intensity). Water and crackers were used to clean the palate between samples. Breaks of 1 min were taken between pairs. The test was executed by Essensor (Ede, NL). Data analysis Data was analyzed as described in study 1.

Tastant concentration differences and consumer preference |
71 |
RESULTS AND DISCUSSION
Study 1: Taste Intensity, Fluctuation of Taste Intensity and Consumer Preference of Gels, Breads and Sausages with Homogeneous and Inhomogeneous Distributions of Tastants
Results from the 2-AFC tests showed that products with inhomogeneous distributions of tastants were selected as the sweetest (gel) or the saltiest (bread and sausage) more often than the respective homogeneous products at the same overall tastant content (gel: k=153, n=183, p<0.001; bread: k=133, n=183, p<0.001; sausage: k=113, n=183, p<0.001) (Figure 5-1). These results are in agreement with previous studies that reported an enhancement of taste intensity by an inhomogeneous distribution of tastants in gelled productsChapters 2-3, 94 and in breads96, 99. The results of the present study showed that the saltiness intensity of sausages can also be enhanced by an inhomogeneous distribution of salt. The inhomogeneity concept can, therefore, be used to enhance taste intensity in a variety of food products. Subjects perceived fluctuations of taste intensity more often in inhomogeneous gels and breads than in the respective homogeneous products (gel: k=144, n=183, p<0.001; bread: k=131, n=183, p<0.001). Homogeneous and inhomogeneous sausages did not differ in terms of perceived taste intensity fluctuations (k=95, n=183, p=0.6) (Figure 5-1). In the study reported in Chapter 2, subjects did not perceive fluctuations of taste intensity in inhomogeneous layered gels exhibiting large tastant concentration differences (layered gel 40/0/40/0). In contrast, results of the study reported in Chapter 3 showed that the inhomogeneous distribution of sucrose in the layered gel 40/0/40/0 induced fluctuations of sweetness intensity in time-intensity ratings. These results indicated that the inhomogeneous distribution of sucrose in the layered gel 40/0/40/0 affected the response behavior. As a specific relation between the perception of taste intensity fluctuations and taste enhancement was not observed, we suggest that the perception of fluctuations of taste intensity in inhomogeneous (semi-)solids does not affect the enhancement of taste. In other words, taste enhancement resulting from tastant concentration differences occurs with and without a conscious perception of taste intensity fluctuations.
Burseg et al.48 reported similar results for temporal variations of tastant concentration in liquids. By delivering alternate pulses of solutions containing low and high sucrose concentration with a gustometer, an enhancement of sweetness intensity was achieved independently of a conscious perception of the pulsatile delivery. In liquids, the stimulation of taste receptors by a pulsatile delivery is synchronized, since all receptors

| Chapter 5
72 |
are simultaneously stimulated by a pulse of tastant solution. In inhomogeneous (semi-) solid products, some receptors are exposed to high tastant concentrations while others are exposed to low concentrations by fragments moving in the mouth during oral processing. This leads to a desynchronized stimulation of taste receptors (Chapter 2). We conclude, therefore, that a synchronous variation of tastant concentration in liquids as well as an asynchronous variation of tastant concentration in (semi-)solids can be consciously perceived. Furthermore, the enhancement of taste that results from variations of tastant concentration is not affected by the perception of taste intensity fluctuations in liquids and (semi-)solids. Figure 5-1. Percentage of selections (k/n) of inhomogeneous products relative to the homogeneous products in the 2-AFC tests (n=183). Chance level=50 % (dashed line). Significance level: *** p<0.001. Inhomogeneous gels (k=136, n=183, p<0.001) and sausages (k=124, n=183, p<0.001) were selected as the most preferred sample in the pair more often than the respective homogeneous products. Homogeneous and inhomogeneous breads were equally selected as the most preferred (k=79, n=183, p=0.06) (Figure 5-1). These results indicate that consumer preference is at least maintained or increased in products with inhomogeneous distributions of tastants in comparison to products with homogeneous distributions at the same overall tastant concentration.
A positive relation between taste intensity and consumer preference was suggested as taste intensity and preference were both higher in inhomogeneous gels and sausages than in the respective homogeneous products. Therefore, the relations between all 2-AFC results (i.e. consumer preference, taste intensity and fluctuation of taste intensity) were tested by Chi-square analysis. In breads and sausages, significant relations between the 3 dependent variables were not observed. In gels, a positive relation
0102030405060708090
100
inhomogeneous gel 40/0/40/0
inhomogeneous bread 0/3
inhomogeneous sausage 3.5/0.5/3.5/0.5
Perc
enta
ge o
f sel
ectio
ns (%
)
taste intensityfluctuation of taste intensitypreference
*** ***
*** *** *** *** ***

Tastant concentration differences and consumer preference |
73 |
between taste intensity and consumer preference was observed (χ2=3.8; p<0.05). Assuming that taste intensity drives consumer preference, this result suggests that an increase in taste intensity leads to an increase in consumer preference in gels. However, as higher taste intensities were observed in inhomogeneous products, we cannot conclude whether the higher consumer preference for inhomogeneous products resulted from increases in taste intensity or from the perception of taste intensity fluctuations. To determine which of these parameters affects consumer preference, pairs of products that have equal taste intensities but vary in the perception of taste intensity fluctuations should be compared on consumer preference. These pairs should be composed of homogenous products containing an overall tastant concentration higher than the inhomogeneous products.
The predictability of consumer preference by spatial distribution of tastants, consumer age and gender was evaluated by logistic regression analysis. Results showed that consumer preference was driven by tastant distribution in gels (p<0.001), sausages (p<0.001) and bread (p<0.01) rather than by consumer gender and age. Study 2: Taste Intensity, Fluctuation of Taste Intensity and Consumer Preference of Gels and Sausages Varying in the Magnitude of Tastant Concentration Differences
As the magnitude of tastant concentration differences increased in inhomogeneous gels, the number of selections of inhomogeneous samples as the sweetest sample in the pair also increased (20/0/20/0: k=67, n=125, p=0.47; 40/0/0/0: k=77, n=125, p<0.01; 40/0/40/0: k=88, n=125, p<0.001) (Figure 5-2). These results confirm that large sucrose concentration differences are required to enhance taste intensity. In sausages, however, the taste intensity of homogeneous and inhomogeneous products did not differ (1.5/2.5/1.5/2.5: k=58, n=125, p=0.47; 1.0/3.0/1.0/3.0: k=63, n=125, p=1; 0.5/3.5/0.5/3.5: k=71, n=125, p=0.15 (Figure 5-2). In contrast to study 1, the inhomogeneous sausage with the largest salt concentration differences (0.5/3.5/0.5/3.5) was not selected as the saltiest sample more often than the homogeneous sausage. However, the percentage of selections (k/n) of this inhomogeneous sausage in terms of taste intensity did not differ considerably between study 1 (k/n=0.62) and study 2 (k/n=0.57). We suggest, therefore, that the smaller number of assessors used in study 2 (n=125) in comparison to study 1 (n=183) might have been the reason for the inconsistence in the results.

| Chapter 5
74 |
Figure 5-2. Percentage of selections (n/k) (taste intensity) of inhomogeneous products relative to the homogeneous products in the 2-AFC tests (n=125). Chance level=50% (dashed line). Significance level: ** p<0.01 and *** p<0.001. Gels with inhomogeneous distributions of sucrose were selected more often than the homogeneous gels as the sample that induced taste intensity fluctuations (20/0/20/0: k=82, n=125, p<0.001; 40/0/0/0: k=87, n=125, p<0.001; 40/0/40/0: k=83, n=125, p<0.001). Homogeneous and inhomogeneous sausages did not differ in perceived taste intensity fluctuations (1.5/2.5/1.5/2.5: k=62, n=125, p=1; 1.0/3.0/1.0/3.0: k=56, n=125, p=0.28; 0.5/3.5/0.5/3.5: k=68, n=125, p=0.37 (Figure 5-3).
Figure 5-3. Percentage of selections (n/k) (fluctuation of taste intensity) of inhomogeneous products relative to the homogeneous products in the 2-AFC tests (n=125). Chance level=50% (dashed line). Significance level: *** p<0.001. The inhomogeneous gel with the largest tastant concentration difference (40/0/40/0) was preferred more often than the homogeneous gel (k=87, n=125, p<0.001). The other inhomogeneous gels were preferred as often as the homogenous gel (20/0/20/0: k=67, n=125, p=0.47 and 40/0/0/0: k=64, n=125, p=0.86) (Figure 5-4). Inhomogeneous and homogeneous sausages were equally preferred (1.5/2.5/1.5/2.5:
0102030405060708090
100
gel sausage
Perc
enta
ge o
f sel
ectio
ns
fluct
uatio
n of
tast
e in
tens
ity (%
)
20/0
/20/
0
40/0
/0/0
40/0
/40/
0
1.5/
2.5/
1.5/
2.5
1.0/
3.0/
1.0/
3.0
0.5/
3.5/
0.5/
3.5
*** *** ***
0102030405060708090
100
gel sausage
Perc
enta
ge o
f sel
ectio
ns
tast
e in
tens
ity (%
)
20/0
/20/
0
40/0
/0/0
40/0
/40/
0
1.5/
2.5/
1.5/
2.5
1.0/
3.0/
1.0/
3.0
0.5/
3.5/
0.5/
3.5
** ***

Tastant concentration differences and consumer preference |
75 |
k=57, n=125, p=0.37; 1.0/3.0/1.0/3.0: k=60, n=125, p=0.72; 0.5/3.5/0.5/3.5: k=71, n=125, p=0.15). These results confirm that consumer preference is maintained or increased in products with inhomogeneous distributions of tastants.
Figure 5-4. Percentage of selections (k/n) (preference) of inhomogeneous products relative to the homogeneous products in the 2-AFC tests (n=125). Chance level=50% (dashed line). Significance level: *** p<0.001. Results from the Chi-square analysis did not show significant relations between consumer preference, taste intensity and fluctuation of taste intensity in sausages. In gels, significant relations were observed between 2-AFC results for preference and taste intensity fluctuation (20/0/20/0: χ2=5.2; p<0.05), taste intensity and taste intensity fluctuation (20/0/20/0: χ2=5.2; p<0.05; 40/0/0/0: χ2=4.7; p<0.05), preference and taste intensity (40/0/40/0: χ2=10.9; p<0.001). The latter result is in agreement with study 1.
Logistic regression results showed that for the inhomogeneous gel with the largest tastant concentration difference (40/0/40/0), consumer preference was positively related to tastant distribution (p<0.001) and consumer gender (p<0.05). Female subjects selected the inhomogeneous gel as the most preferred more often than male subjects. Preference and consumer age were not significantly related in gels. For inhomogeneous sausages, consumer preference could not be predicted by any of these parameters.
The present study confirmed that the inhomogeneity concept can enhance taste intensity in different matrices and can, therefore, be applied to reduce sugar and salt in a variety of food products. Consumer preference was shown to be at least maintained or increased in products with inhomogeneous distributions of tastants. Since taste intensity was enhanced in products in which tastants were heterogeneously
0102030405060708090
100
gel sausage
Perc
enta
ge o
f sel
ectio
ns
pref
eren
ce (%
)
20/0
/20/
0
40/0
/0/0
40/0
/40/
0
1.5/
2.5/
1.5/
2.5
1.0/
3.0/
1.0/
3.0
0.5/
3.5/
0.5/
3.5
***

| Chapter 5
76 |
distributed, we could not distinguish between the effects of taste intensity and taste intensity fluctuations on consumer preference. Increases in sweetness and saltiness intensity are usually related to rises in preference, acceptance and pleasantness of food products11-15. However, the relation between taste intensity and preference is not linear, as preference response has an optimum value at intermediate taste intensities (i.e. the breakpoint value)103 and declines above and below this optimum value. If consumer preference is driven by taste intensity, then inhomogeneous products will be more preferred than homogeneous products due to the enhancement of taste intensity. In that case, we would expect an optimum magnitude of tastant concentration differences that enhances taste while raising consumer preference, as observed by Noort et al.99.
Besides taste intensity, the perception of fluctuations of taste intensity in the inhomogeneous products might also have had an effect on consumer preference. Hyde and Witherly104 proposed that temporal sensory contrasts resulting from changes in the properties of foods (e.g. changes in texture, taste and flavor) during oral processing were related to palatability. The authors used an ice cream model system to suggest that dynamic contrasts increase the palatability of food products. In line with this study, we suggest that tastant concentration differences might have produced unexpected sensations during the consumption of inhomogeneous products. Consequently, the palatability of inhomogeneous products might have been enhanced. This enhanced palatability might have contributed positively to the increase in consumer preference of inhomogeneous products observed in the present study.
CONCLUSIONS
An inhomogeneous distribution of tastants was shown to enhance the perception of taste in a variety of food products, such as gels, breads and sausages. The observed taste enhancement was not affected by the conscious perception of taste intensity fluctuations during the consumption of inhomogeneous products. Products in which tastants were heterogeneously distributed were equally or more preferred than products in which tastants were homogeneously distributed at the same overall tastant content. This suggests that the inhomogeneity concept can be applied in the development of low-sugar and low-salt food products that have a good acceptance by consumers.

Tastant concentration differences and consumer preference |
77 |
ACKNOWLEDGMENTS
The authors would like to thank Ronald Klont and Alexander Pakosch (Vion food group) for providing the Lyoner sausages, Martijn Noort (TNO) for providing the breads, Wim Vassen and Frieda Klomp (Essensor) for performing the consumer studies and Sara Camacho for helping in the execution of the experiments.


Chapter 6 ── Effect of Sucrose Concentration Profile of Consecutive Stimuli on Sweetness Intensity ──
Ana Carolina Mosca Fred van de Velde Johannes H.F. Bult Martinus A.J.S. van Boekel Markus Stieger
Submitted for publication

| Chapter 6
80 |
ABSTRACT
This chapter investigated the effect of sucrose concentration profile of consecutive stimuli on sweetness intensity. Samples composed of sequences of 4 cubes of a semi-solid gel or 4 spoons of a model custard dessert were used for this purpose. Sucrose concentration was varied between the cubes and spoons at 4 concentration profiles (decreasing, increasing, middle peak and boundary peak) and at 2 concentration difference magnitudes (low and high). Sequences of 4 cubes or spoons containing the same sucrose concentration were used as the reference sample. The sweetness intensity of the samples was evaluated using line scale and time-intensity ratings.
Line scale ratings showed that the sucrose concentration profile had an effect on sweetness intensity. An enhancement of sweetness intensity in relation to the reference was observed in sequences that ended with a high-intensity stimulus, whereas a suppression of sweetness was observed in sequences that ended with a low-intensity stimulus. The observed sweetness enhancement and suppression were attributed to serial position effects.
Time-intensity ratings showed that the sweetness intensity of sequences differing in sucrose concentration profile was not enhanced in relation to the reference. Furthermore, time-intensity ratings showed that subjects evaluated each cube of gel or each spoon of custard within a sequence as an independent stimulus. The lack of taste enhancement was attributed mainly to the long time frame at which sucrose concentration differences were experienced during the consumption of the samples. It was concluded that variations of tastant concentration at long time frames might not lead to a discontinuous stimulation of taste receptors at the frequency required for the occurrence of taste enhancement by tastant concentration differences. Furthermore, the fact that the samples were composed of different parts (i.e. 4 cubes or spoons) might also have contributed to the individual evaluation of the different stimuli.
INTRODUCTION
In the context of decreasing the intake of sugar and salt, it is necessary to reduce the contents of these tastants in processed foods. The modulation of the spatial distribution of tastants within a product is among the strategies developed towards sugar and salt reduction in foods. Inhomogeneous distributions of tastants (i.e. tastant concentration differences) were shown to enhance taste intensity in different types of foods
Chapters
2-5,
94,
96. Sugar and salt reduction could be achieved without compromising

Sucrose concentration profile of consecutive stimuli |
81 |
taste intensity. For that reason, the modulation of the spatial distribution of tastants was suggested as a feasible strategy to reduce sugar and salt in food products.
In Chapter 2 we proposed that taste receptors are exposed to an asynchronous discontinuous stimulation during the oral breakdown of products with inhomogeneous distributions of tastants. The intensity of the discontinuous stimulation was shown to be an important factor for taste enhancement, as large sucrose concentration differences were required to enhance taste intensity. The number of receptors stimulated by high-intensity stimuli was also shown to be an important factor for the occurrence of taste enhancement. Inhomogeneous samples that yielded more high-sucrose fragments during oral processing showed the highest taste enhancement in comparison to homogenous samples. These findings suggest that the frequency of discontinuous stimulation of receptors by high-intensity stimuli is the driving factor for the enhancement of taste that results from tastant concentration differences. The frequency of temporal variations of tastant concentration was also identified as a determinant factor for taste enhancement in liquids47-49. Therefore, taste intensity enhancement can be maximized by the optimization of the frequency of discontinuous stimulation of taste receptors.
In the studies that investigated the effects of modulation of tastant spatial distribution on taste perception in (semi-)solids, tastants were distributed in layers
Chapters
2-5,
94,
96 or as encapsulated crystals99. In this way, tastant concentration differences were experienced within a short time frame during the consumption of the products (usually within one bite). Up to now, no information is available on the effectiveness of enhancing taste intensity when the time scale of variation of tastant concentration during the consumption of a product is increased (e.g. over several bites). In this context, this chapter investigated the effect of sucrose concentration profile of consecutive stimuli on sweetness intensity. We aimed at getting a better understanding on the relationship between the time frame at which tastant concentration is varied during the consumption of products and the occurrence of taste enhancement. For this purpose, samples composed of sequences of 4 cubes of a semi-solid gel or 4 spoons of a model custard were used. Semi-solid gels and viscous custards were selected due to the different oral processing patterns involved in the consumption of these products. Gels require several chews to prepare the bolus for swallowing, whereas custards are sipped from the spoon and promptly swallowed. As gels are kept in the mouth for longer periods than custards, the time frame at which the different stimuli are experienced and the time frame at which tastant concentration is varied are

| Chapter 6
82 |
longer for gels than for custards. The concentration of sucrose was varied between the cubes and spoons at 4 concentration profiles (decreasing, increasing, middle peak and boundary peak) and at 2 concentration difference magnitudes (low and high). The content of sucrose in all sequences of gel or custard was the same (i.e. 1.6 g and 0.8 g of sucrose, respectively). Two rating methods were used to evaluate sweetness intensity. The overall sweetness intensity was assessed after the consumption of the entire sample (i.e. 4 cubes or spoons) using line scale ratings. The temporal profile of sweetness intensity was assessed continuously during the evaluation of the sample (i.e. 4 cubes or spoons) using time-intensity ratings.
As the different stimuli are presented in a sequence, serial position effects such as recency and primacy effects might occur. Primacy effects refer to the recall of items at the beginning of a list or to the enhanced expression of the first acquired memories. Recency effects refer to the recall of items at the end of a list or to the expression of the most recently acquired memories105, 106. The time of exposure to a stimulus and the interval between consecutive stimuli in a sequence were shown to affect the occurrence of serial position effects107, 108. We hypothesize, therefore, that sweetness intensity depends on the sucrose concentration profile of consecutive stimuli. Furthermore, the effect of sucrose concentration profile of a sequence of stimuli on sweetness intensity might depend on the time scale at which consecutive stimuli are presented.
MATERIALS AND METHODS Materials
Milk and corn starch were purchased from local retailers. The other ingredients used to prepare the samples were obtained as described in Chapter 2. Sample Preparation
Gels Mixed agar-gelatin gels were prepared as described in Chapter 4. After cooling overnight, gels were cut into cubes, which were stored at 5 ˚C until further use in the sensory test. The dimensions of the cubes were approximately 20x20x10 mm (length x width x height). To obtain cubes with similar weight (4.0 ± 0.1 g), the volume of solution poured into Petri dishes was varied according to the sucrose concentration in the gel. The concentration of all ingredients used to prepare the gels and the volumes are listed in Table 6-1.

Sucrose concentration profile of consecutive stimuli |
83 |
Table 6-1. Composition of gels and custards and volume used to prepare layered gels.
Model Custard Desserts Milk was heated to boiling under stirring. After boiling, the milk was removed from the heat plate, sucrose was added and the solution was stirred for 1 min. The solution was then placed back on the heat plate and corn starch (dissolved in approximately 5 mL of cold milk) was gradually added under constant stirring. The solution was stirred for 3 min and then cooled to about 40 ˚C. Water was added to compensate for losses due to evaporation. The final solution was poured into plastic containers and stored in a cold room at 5 ˚C until further use in the sensory test. The concentration of all ingredients used to prepare the custards is listed in Table 6-1. Compression Measurements of Gels
Uniaxial compression measurements were performed for the different gels as described in Chapter 2. The mean values of fracture strain and fracture stress were calculated from the measurements of 8 replicates (4 gel pieces from 2 gel specimen). Rheological Measurements of Custards
The flow curves of the custards were determined using a Haake RV 20 rheometer (Thermo Instruments, NL) with a concentric cylinder geometry. Custards were removed from the cold room and were allowed to equilibrate to room temperature. A volume of about 55-58 mL of each sample was poured into the rheometer, which was previously equilibrated at 23 ˚C. During the measurements of viscosity, shear rate was increased from 0-400 s-1 in 5 min and then decreased from 400-0 s-1 in 5 min. Four replicates of each custard were analyzed.
Gel Custard Sucrose (% w/w)
Agar ( % w/w)
Gelatin (% w/w)
Volume (mL)
Sucrose (% w/w)
Milk ( % w/w)
Corn Starch (% w/w)
0 0.8 4.0 150 0 96.4 3.6 5 0.8 3.8 147 2.5 93.9 3.6 7 0.8 3.8 145 3.5 92.9 3.6 8 0.8 3.7 145 4.0 92.4 3.6 10 0.8 3.6 143 5.0 91.4 3.6 12 0.8 3.6 141 6.0 90.4 3.6 13 0.8 3.5 140 6.5 89.9 3.6 15 0.8 3.3 137 7.5 88.9 3.6 20 0.8 3.3 135 10 86.4 3.6

| Chapter 6
84 |
Sensory Study
Subjects Seventeen subjects (15 female; age: 21-65) with normal ability to taste participated in this study. Subjects were experienced with time-intensity methodology from previous sensory studies. All subjects gave written informed consent. Samples Gels Gel samples were composed of sequences of 4 cubes varying in sucrose concentration. The reference sample was composed of a sequence of 4 cubes of gel containing the same sucrose concentration (10% w/w). All samples (i.e. sequences of 4 cubes) contained a total of 1.6 g of sucrose. The samples evaluated are listed in Table 6-2. Table 6-2. Gel and custard samples.
Product
Difference Magnitude
Sucrose Concentration Profilea
Reference Increasing Decreasing Mid Peak Boundary Peak Gel Low 10/10/10/10 5/8/12/15 15/12/8/5 5/15/15/5 15/5/5/15 Gel High 10/10/10/10 0/7/13/20 20/13/7/0 0/20/20/0 20/0/0/20
Custard Low 5/5/5/5 2.5/4/6/7.5 7.5/6/4/2.5 2.5/7.5/7.5/2.5 7.5/2.5/2.5/7.5 Custard High 5/5/5/5 0/3.5/6.5/10 10/6.5/3.5/0 0/10/10/0 10/0/0/10
a numbers correspond to the percentage of sucrose (% w/w) in each cube of gel or spoon of custard. Sucrose concentration was varied between gel cubes at 4 concentration profiles (decreasing, increasing, middle peak and boundary peak) and at 2 concentration difference magnitudes (low and high contrast). In the high-contrast condition, the differences in sucrose concentration between gel cubes were larger than that in the low-contrast condition. A schematic representation of the sucrose concentration profiles of gels is shown in Figure 6-1. Samples were removed from the refrigerator 1 h prior to the sensory test to equilibrate the temperature. Custards Custard samples were composed of sequences of 4 spoons containing 4.0 ± 0.2 g of custard varying in sucrose concentration. The reference sample consisted of a sequence of 4 spoons containing the same sucrose concentration (5% w/w). All samples (i.e. sequences of 4 spoons) contained a total of 0.8 g of sucrose. The custard samples evaluated are listed in Table 6-2. The concentration of sucrose was also varied between the spoons at 4 concentration profiles (decreasing, increasing, middle peak
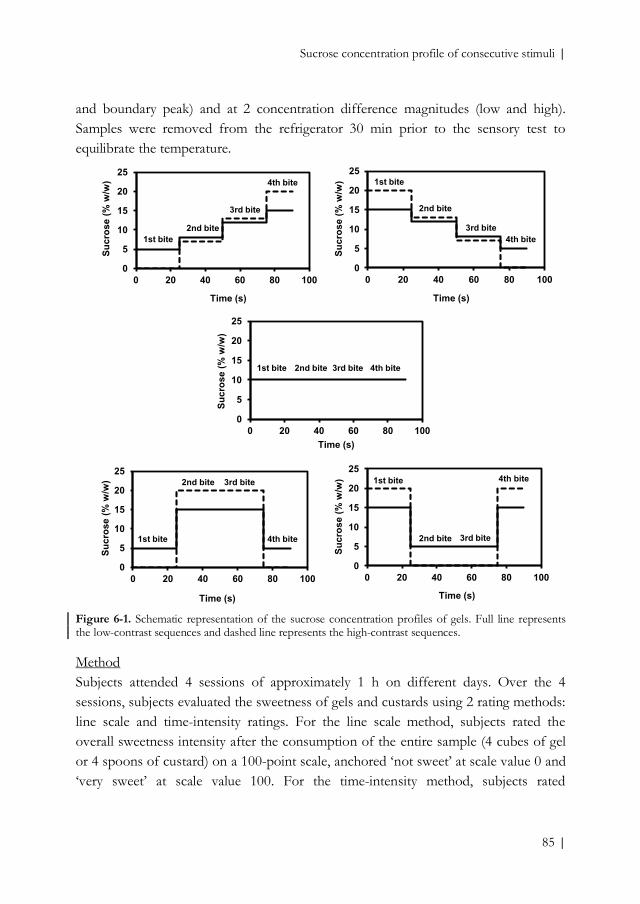
Sucrose concentration profile of consecutive stimuli |
85 |
and boundary peak) and at 2 concentration difference magnitudes (low and high). Samples were removed from the refrigerator 30 min prior to the sensory test to equilibrate the temperature. Figure 6-1. Schematic representation of the sucrose concentration profiles of gels. Full line represents the low-contrast sequences and dashed line represents the high-contrast sequences. Method Subjects attended 4 sessions of approximately 1 h on different days. Over the 4 sessions, subjects evaluated the sweetness of gels and custards using 2 rating methods: line scale and time-intensity ratings. For the line scale method, subjects rated the overall sweetness intensity after the consumption of the entire sample (4 cubes of gel or 4 spoons of custard) on a 100-point scale, anchored ‘not sweet’ at scale value 0 and ‘very sweet’ at scale value 100. For the time-intensity method, subjects rated
0
5
10
15
20
25
0 20 40 60 80 100
Sucr
ose
(% w
/w)
Time (s)
1st bite 2nd bite 3rd bite 4th bite
0
5
10
15
20
25
0 20 40 60 80 100
Sucr
ose
(% w
/w)
Time (s)
1st bite2nd bite
3rd bite
4th bite
0
5
10
15
20
25
0 20 40 60 80 100
Sucr
ose
(% w
/w)
Time (s)
1st bite
4th bite
2nd bite
3rd bite
0
5
10
15
20
25
0 20 40 60 80 100
Sucr
ose
(% w
/w)
Time (s)
1st bite
2nd bite 3rd bite
4th bite
0
5
10
15
20
25
0 20 40 60 80 100
Sucr
ose
(% w
/w)
Time (s)
1st bite
2nd bite 3rd bite
4th bite

| Chapter 6
86 |
continuously the sweetness intensity during the consumption of each sample (4 cubes of gel or 4 spoons of custard). The rating was done on a 100-point scale, anchored ‘not sweet’ at scale value 0 and ‘very sweet’ at scale value 100. The scale was displayed on a computer screen and subjects had to move the controller of a vertical rating-bar. Within 1 session, subjects evaluated 1 product category (gel or custard) using 1 rating method (line scale or time-intensity). The order of product and the order of method were randomized. Gels Instructions about the task to be performed were provided at the beginning of each evaluation session. Subjects were asked to place the 1st gel cube in the mouth, to chew it for 15 s and to expectorate the bolus. A 10 s interval was taken between cubes. This procedure was followed for the 4 cubes that composed 1 sample. The total evaluation time of each gel sample was 90 s. The timing of chewing and expectorating was controlled with a timer by the panel leader, who used the words “chew” and “spit” to instruct the subjects. The test conditions (chewing time and the interval between cubes) were selected in a preliminary trial as the conditions that best resembled a normal eating situation. Subjects rated the overall sweetness on a 100-point scale after expectorating the last cube (4th gel cube). The temporal sweetness intensity was continuously rated while cubes were chewed and expectorated. A schematic overview of the experimental setup is shown in Figure 6-2.
Samples were presented in 2 blocks based on the magnitude of sucrose concentration differences in the sequences (low and high contrast). Each block was composed of 6 samples: a reference sample (10/10/10/10), 4 samples varying in sucrose concentration profile and a blind reference (10/10/10/10). The first sample of each block was the reference sample. Subjects were informed that the sweetness intensity of this sample should represent a sweetness value of 50% on the rating scale. The sweetness intensity of the other samples in the block (i.e. 4 concentration profiles and blind reference) should be rated in relation to the reference. Blocks (6 samples) were assessed in duplicate per session (i.e. total of 24 samples). Samples within each block and the blocks (low and high contrast) were presented in randomized order. Breaks of 1 min were taken between samples and of 2 min between blocks. Water and crackers were used to clean the palate between samples.

Sucrose concentration profile of consecutive stimuli |
87 |
Figure 6-2. Schematic overview of the experimental setup. Custards The evaluation procedure for the custard samples was similar to the procedure described for the gels, except for the timing of sipping and expectorating. Subjects were asked to place a spoon of custard in the mouth, to keep the custard in the mouth for 6 s and then to expectorate it. A break of 9 s was taken between spoons. This procedure was followed for the 4 spoons that composed 1 sample. The total evaluation time of each custard sample was 51 s. For custards, 6 s in the mouth and 9 s between spoons were selected in a preliminary trial as the conditions that best resembled a normal eating situation. A schematic overview of the experimental setup is shown in Figure 6-2. Samples were presented in 2 blocks based on the magnitude of sucrose concentration differences in the sequences (low and high contrast). Each block was composed of 6 samples: a reference sample (5/5/5/5), 4 samples varying in the sucrose concentration profile and a blind reference (5/5/5/5). Blocks were assessed in duplicate per session (i.e. total of 24 samples). Samples within each block and the blocks (low and high contrast) were presented in randomized order. Breaks of 1 min were taken between samples (4 spoons) and of 2 min between blocks to clean the palate with water and a piece of cracker. Data Analysis
Two sets of data (line scale and time-intensity rating) were collected. The data from line scale ratings was extracted by measuring the marks made by the subjects with a ruler. For the time-intensity ratings, the area under the sweetness curve (AUSC) was
rate sweetness
-10 0 10 20 30 40 50 60 70 80 90
Sip Spit Sip SipSpit Spit Spit
rate sweetness
Chew Chew Chew ChewSpit Spit Spit Spit
rate sweetness continuously
Sip
rate sweetness continuously
Stim
ulus
Res
pons
eSt
imul
usR
espo
nse
Time (s)
Gel
Time intensityor
Line scale
Custard
Time intensityor
Line scale

| Chapter 6
88 |
used as a measure of the overall sweetness. Furthermore, the sweetness curves were used to evaluate the differences in the temporal profile of sweetness between samples. To determine the effects of sucrose concentration profile on sweetness intensity ratings, full-factorial multi-factor ANOVA (SPSS, v 17, SPSS Inc, USA) was performed for each block (low and high contrast) with sucrose concentration profile (5 profiles: decreasing, increasing, middle peak, boundary peak and blind reference) and replicates (2) as fixed factors and subjects as a random factor. Post-hoc comparisons for these tests were performed with Tukey’s HSD tests. All tests were carried out at a significance level of α=0.05.
RESULTS AND DISCUSSION
Mechanical and Rheological Properties of Gels and Custards
To account for the differences in mechanical properties resulting from the addition of sucrose, the concentration of gelatin was adjusted according to the sucrose concentration. In this way, all gels had similar values of fracture strain and fracture stress (data not shown). The values of fracture strain ranged from 0.80 ± 0.06 to 0.71 ± 0.05 mm/mm and the values of fracture stress ranged from 40 ± 4 to 31 ± 5 kPa in gels containing 0 and 20% sucrose, respectively.
The viscosity of the custards was measured as a function of shear rate. The flow curves showed that the shear thinning behavior and hysteresis of custards varying in sucrose concentration were similar (data not shown). Therefore, adjustments in formulation were not performed. The viscosity at a shear rate of 10 s-1 ranged from 1.3 ± 0.5 to 2.2 ± 0.7 Pa s (increasing shear rate curve) and from 0.8 ± 0.1 to 1.4 ± 0.7 Pa s (decreasing shear rate curve) in custards containing 0 and 10% sucrose, respectively. The viscosity at a shear rate of 100 s-1 ranged from 0.28 ± 0.05 to 0.34 ± 0.05 Pa s in custards containing 0 and 10% sucrose, respectively. Effect of Sucrose Concentration Profile on Sweetness Intensity
Line Scale Ratings Figure 6-3A shows the results of line scale ratings of gel samples. For the low-contrast block, a significant effect of sucrose concentration profile on sweetness was observed [F(4,144)=5.0, p<0.001]. The sweetness intensity of the decreasing profile (15/12/8/5) was significantly lower than the sweetness of the increasing (5/8/12/15) and boundary peak (15/5/5/15) profiles (p<0.05). Sweetness enhancement was not observed as none of the samples had an overall sweetness intensity significantly higher

Sucrose concentration profile of consecutive stimuli |
89 |
than the blind reference (10/10/10/10). For the high-contrast block, a significant effect of sucrose concentration profile was also observed [F(4,144)=11.6, p<0.001]. Sweetness suppression was observed for the decreasing profile (20/13/7/0), as the sweetness intensity of this sample was significantly lower than the sweetness of the blind reference and all the other samples (p<0.05). The highest sweetness ratings were observed for increasing (0/7/13/20) and boundary peak (20/0/0/20) profiles. The sweetness of the increasing profile was significantly higher than the sweetness of the blind reference, indicating taste enhancement (p<0.05). Figure 6-3. Overall sweetness intensity (Mean ± SEM; n=17, duplicate) obtained from line scale ratings: A. Gels and B. Custards. Within each series (low- and high-contrast sequences), samples followed by ‘*’ are significantly different from the blind reference (first bar in each series as indicated by dashed lines) at p<0.05. Figure 6-3B shows the results of line scale ratings of custard samples. For the low-contrast block, a significant effect of sucrose concentration profile on sweetness intensity was observed [F(4,144)=14.3, p<0.001]. Similarly to gels, the sweetness intensity of the decreasing profile (7.5/6/4/2.5) was significantly lower than the sweetness of the increasing (2.5/4/6/7.5) and boundary peak (7.5/2.5/2.5/7.5) profiles (p<0.05). Sweetness enhancement was observed for the increasing gradient
01020304050607080
Low contrast High contrast
Swee
tnes
s in
tens
ity (-
)
15/5
/5/1
5
5/15
/15/
5
15/1
2/8/
5
10/1
0/10
/10
5/8/
12/1
5
20/0
/0/2
0
0/20
/20/
0
20/1
3/7/
0
10/1
0/10
/10
0/7/
13/2
0
01020304050607080
Low contrast High contrast
Swee
tnes
s in
tens
ity (-
)
5/5/
5/5
7.5/
2.5/
2.5/
7.5
2.5/
7.5/
7.5/
2.5
2.5/
4/6/
7.5
7.5/
6/4/
2.5
10/0
/0/1
0
0/10
/10/
0
10/6
.5/3
.5/0
5/5/
5/5
0/3.
5/6.
5/10
A
* * B
*
*
*
*

| Chapter 6
90 |
profile, as the sweetness intensity of this sample was significantly higher than that of the blind reference (5/5/5/5) (p<0.05). For the high-contrast block, a significant effect of sucrose concentration profile on sweetness intensity was also observed [F(4,144)=31.226, p<0.001]. The sweetness intensity of the decreasing profile (10/6.5/3.5/0) was significantly lower than the sweetness of the blind reference and all the other samples (p<0.05), indicating taste suppression. Sweetness enhancement was observed for the increasing (0/3.5/6.5/10) and for the boundary peak (10/0/0/10) profiles (p<0.05).
For both products, the highest sweetness intensity ratings were observed for the sucrose concentration profiles ending with a high-intensity stimulus (20% sucrose for gels and 7.5 and 10% for custards). The lowest sweetness intensity ratings were observed for the decreasing concentration profile, which ended with a low-intensity stimulus (0% sucrose for gels and custards). This indicates that the last stimulus of the sequences affected the evaluation of the overall sweetness intensity. The observed sweetness enhancement and suppression can, therefore, be attributed to recency effects105, 106. Results did not indicate the occurrence of primacy effect. The time of evaluation of each stimulus (i.e. period that stimulus was kept in the mouth) (15 s for gels and 6 s for custards) and the interval between the different stimuli (10 s for gels and 9 s for custards) were long. As a consequence, subjects based the evaluation of the overall sweetness intensity on the last stimulus presented in the sequences. Although the evaluation of gels and custards had different time scales (90 s for gels and 51 s for custards), similar results were observed for both product categories. Time-Intensity Ratings Two parameters were extracted from the time-intensity ratings: the sweetness curves and the area under the sweetness curves (AUSC). The first parameter shows the patterns of temporal variations of sweetness intensity that were induced by the different sucrose concentration profiles. The second parameter gives an estimation of the overall sweetness intensity. Temporal Profile of Sweetness Intensity The average sweetness curves of gel samples are shown in Figures 6-4A-B. It can be seen that subjects rated sweetness intensity following the profile of sucrose concentration of each sample. These results indicate that subjects evaluated each cube of gel as an independent stimulus. Furthermore, the highest sweetness intensities were perceived for the samples belonging to the high-contrast block. This was expected as

Sucrose concentration profile of consecutive stimuli |
91 |
the concentration of sucrose in the cubes of the high-contrast sequences was higher than the sucrose concentration in the cubes of the low-contrast sequences. Similar results were observed for the sweetness curves of custard samples (data not shown).
Figure 6-4. Sweetness curves (Mean ± SEM; n=17, duplicate) of gels obtained from time-intensity ratings: A. Low-contrast sequences and B. High-contrast sequences. Overall Sweetness Intensity Figure 6-5A shows the overall sweetness intensity (extracted from the area under the sweetness curves) of gel samples. For the low-contrast block, a significant effect of sucrose concentration profile on sweetness intensity was observed [F(4,144)=7.2, p<0.001]. The overall sweetness intensity of the increasing profile (5/8/12/15) was significantly lower than the sweetness of the blind reference and all the other samples, indicating a suppression of sweetness (p<0.05). For the high-contrast block, no effect of sucrose concentration profile on the overall sweetness intensity was observed [F(4,144)=2.254, p>0.05]. The overall sweetness intensity of the samples belonging to this block did not differ significantly.
0
20
40
60
80
100
0 20 40 60 80 100
Swee
tnes
s in
tens
ity (-
)
Time (s)
Middle peak profile
Increasing profile
Blind reference
Decreasing profileBoundary peak profile
0
20
40
60
80
100
0 20 40 60 80 100
Swee
tnes
s in
tens
ity (-
)
Time (s)
Blind reference
Increasing profile
Decreasing profileBoundary peak profile
Middle peak profile
A
B

| Chapter 6
92 |
Figure 6-5B shows the overall sweetness intensity of custard samples. For the low-contrast block, a significant effect of sucrose concentration profile on sweetness intensity was observed [F(4,144)=4.2, p<0.01]. The overall sweetness intensity of the boundary peak profile (7.5/2.5/2.5/7.5) was significantly lower than the sweetness of the increasing (2.5/4/6/7.5) and middle peak (2.5/7.5/7.5/2.5) profiles (p<0.05). For the high-contrast block, a significant effect of sucrose concentration profile on sweetness intensity was also observed [F(4,144)=7.4, p<0.001]. The boundary peak profile (10/0/0/10) was perceived significantly less sweet than the blind reference and all the other samples, indicating sweetness suppression (p<0.05). Figure 6-5. Overall sweetness intensity (area under the sweetness curves) (Mean ± SEM; n=17, duplicate) obtained from time-intensity ratings: A. Gels and B. Custards. Within each series (low- and high-contrast sequences), samples followed by ‘*’ are significantly different from the blind reference (first bar in each series as indicated by dashed lines) at p<0.05. The results from time-intensity ratings show that sweetness intensity was not enhanced in the sequences varying in sucrose concentration profile. These results confirm that the sweetness enhancement observed for the increasing and boundary peak profiles in the line scale ratings resulted from recency effects. These results also confirm that the sweetness suppression observed for the decreasing profile in the line
0500
10001500200025003000350040004500
Low contrast High contrast
Swee
tnes
s in
tens
ity (-
)
5/5/
5/5
7.5/
2.5/
2.5/
7.5
2.5/
7.5/
7.5/
2.5
2.5/
4/6/
7.5
7.5/
6/4/
2.5
10/0
/0/1
0
0/10
/10/
0
10/6
.5/3
.5/0
5/5/
5/5
0/3.
5/6.
5/10
0500
10001500200025003000350040004500
Low contrast High contrast
Swee
tnes
s in
tens
ity (-
)
15/5
/5/1
5
5/15
/15/
5
15/1
2/8/
5
10/1
0/10
/10
5/8/
12/1
5
20/0
/0/2
0
0/20
/20/
0
20/1
3/7/
0
10/1
0/10
/10
0/7/
13/2
0
*
* A
B

Sucrose concentration profile of consecutive stimuli |
93 |
scale ratings resulted from recency effects. The sweetness suppression observed for the boundary peak profile of custard (10/0/0/10) in the time-intensity ratings probably resulted from the subsequent presentation of 2 spoons containing low concentration of sucrose (0% sucrose). We did not find a clear explanation for the sweetness suppression observed for the increasing profile of gel (5/8/12/15) in the time-intensity ratings.
In summary, the results observed in this chapter confirm that the frequency of high-intensity discontinuous stimulation of receptors is the driven factor for the enhancement of taste intensity that results from tastant concentration differences. In the approach described in this chapter, the time frame at which sucrose concentration was varied during the consumption of samples (within 90 s for gels and 51 s for custards) was longer than that in the layered approach (layered samples were consumed in approximately 10 s). Consequently, the frequency of discontinuous stimulation induced by sucrose concentration differences might not have been high enough for the occurrence of taste enhancement. One could hypothesize that the intensity of the stimulation might have been the reason for the lack of enhancement. In Chapter 2, sweetness enhancement was observed only in gels composed of layers containing 0 and 40% sucrose (i.e. 40/0/0/0 and 40/0/40/0 - numbers correspond to the percentage of sucrose (% w/w) in each layer). In the samples used in the present study, the lowest and highest sucrose concentration were 0 and 20% sucrose. Therefore, the intensity of the stimuli used rather than the long time frame could be the reason for the insufficient frequency of high-intensity discontinuous stimulation. However, the fact that the sweetness curves obtained from time-intensity ratings showed that subjects evaluated each stimulus individually gives indication that the long time frame at which sucrose concentration was varied during the consumption of the samples was the reason for the lack of taste enhancement.
Besides the long time frame of variation of sucrose concentration, the sample design used in this study might be another reason that led subjects to evaluate each cube or spoon as an independent stimulus. The fact that the samples were composed of different parts (i.e. 4 cubes or spoons) might have induced the subjects to evaluate each cube/spoon individually rather than the sample as a whole. The sweetness curves of the middle peak and boundary peak profiles give evidence to this assumption. When 2 stimuli containing the same sucrose concentration were presented consecutively, the sweetness intensity ratings of the second stimulus tended to decrease in all samples (see Figure 6-4). We suggest that subjects might have expected

| Chapter 6
94 |
that the subsequent cube/spoon in the sequences would taste differently from the previous one, since it was a different cube/spoon. This means that expectations might have affected the evaluation of the samples used in this study. The decrease in taste intensity between 2 consecutive stimuli of similar sucrose concentration might also have resulted from taste adaptation effects. For future studies, we recommend that tastant concentration is varied at large time scales in samples perceived as a whole. Furthermore, different time scales of variation of tastant concentration during the consumption of samples should be investigated to determine whether taste can be enhanced.
CONCLUSIONS Variations of sucrose concentration at long time frames during the consumption of sequences of stimuli did not enhance sweetness intensity in relation to sequences that had a constant sucrose concentration. Time-intensity ratings showed that each stimulus presented in sequences of 4 cubes of gel or 4 spoons of custard was evaluated individually by the assessors. These results confirm that the frequency of discontinuous stimulation of taste receptors is an important factor for the occurrence of taste enhancement by tastant concentration differences. As the time frame between the different stimuli (i.e. time frame at which sucrose concentration was varied) was long in the samples used in this study, discontinuous stimulation of receptors might not have occurred at the frequency required for the occurrence of taste enhancement. Furthermore, the fact that the samples were composed of different parts (i.e. 4 cubes or spoons) might also have contributed to the individual evaluation of the different stimuli.
ACKNOWLEDGEMENTS
The authors would like to thank Amarachi Ruth Iwuagwu for helping in the execution of the experiments.

Chapter7 Ana Carolina Mosca João Almeida Rocha Guido Sala Fred van de Velde Markus Stieger
Food Hydrocolloids (2012) 27: 448-455
── Inhomogeneous Distribution of Fat Enhances the Perception of Fat-Related Sensory Attributes in Gelled Foods ──
| Chapter 7
96 |
ABSTRACT
This chapter investigated the effect of the spatial distribution of fat on the perception of fat-related sensory attributes using a model system that consisted of layered agar/gelatin gels containing oil-in-water (O/W) emulsion droplets dispersed in the gel matrix. Four layers of gel varying in concentration of emulsion droplets were combined to prepare samples with homogeneous and inhomogeneous distributions of fat (emulsion droplets). The formulation of the gels was optimized to obtain samples with comparable mechanical and rheological properties.
A significant enhancement of mouthfeel attributes, such as spreadable and melting, was observed in gels with inhomogeneous distributions of fat in a Quantitative Descriptive Analysis (QDA) panel. Inhomogeneous samples with large fat concentration differences were perceived more spreadable and melting than the sample in which fat was homogeneously distributed. Creaminess ratings tended to increase as the magnitude of fat concentration differences increased in the inhomogeneous samples. Additionally, the position of the high-fat layers in the inhomogeneous samples affected the perception of fat-related attributes. The sample with high-fat layers on the outside had the highest ratings for all mouthfeel and afterfeel attributes. The enhancement of fat-related attributes by an inhomogeneous distribution of fat depended on the overall fat content. The enhancement at 15% w/w fat was larger than that at 5% w/w fat. We suggest that the modulation of the spatial distribution of fat can be used to reduce the fat content of food products without causing undesirable changes in the sensory properties.
INTRODUCTION
The excessive consumption of fat has been linked to the incidence of health problems, such as obesity and cardiovascular diseases. As a consequence, there is an increasing demand for low-fat products in an attempt to decrease fat intake. Given that the reduction of fat usually causes undesirable changes in the properties of foods, the development of low-fat products remains a challenge for food manufacturers.
The effect of fat content on the mechanical and sensorial properties of model systems has been reported in several studies. In emulsion-filled gels, an increase in the concentration of O/W emulsion droplets dispersed in the gel matrix enhanced the perception of fat-related mouthfeel and afterfeel attributes such as creamy, spreadable, sticky and coating109. Besides the concentration of emulsion droplets, the droplet size,

Enhancement of fat-related sensory attributes |
97 |
the characteristics of the matrix and the type of droplet-matrix interaction were also shown to affect the sensorial properties of emulsion-filled gels. An increase in the size of emulsion droplets led to a decrease in perceived hardness and to an increase in perceived oiliness of emulsion-filled agar gels110. Gels that contained unbound emulsion droplets and that melted during oral processing were described as soft, smooth and creamy in a Quantitative Descriptive Analysis (QDA) panel109 .
Changes in the properties of food products due to a variation of fat content have also been reported. Low-, reduced- and full-fat Cheddar cheeses showed different mechanical properties7 and different flavor profiles8. In a study conducted on commercial cream cheeses, full-fat products had higher firmness, higher cohesiveness, higher difficulty to dissolve and to spread and lower stickiness than Neufchatel and fat-free cheeses9. De Wijk et al.10 reported that the fat content of custard desserts affected the perception of sensory attributes related to the rough-creamy/soft dimension. High-fat custards were perceived creamier, fattier, less dry and less rough than fat-free custards. Therefore, a successful fat reduction strategy should not cause prominent changes in the physicochemical and sensorial properties of the low-fat product.
This chapter presents the modulation of the spatial distribution of fat in food matrices as a new strategy that can allow for a reduction of fat while maintaining the overall quality of low-fat products. It has been shown that an inhomogeneous distribution of tastants leads to an enhancement of taste intensity. Chapters 2-5 and Holm et al.94 reported that sweetness intensity was enhanced in multi-layered gels in which sucrose was heterogeneously distributed. Similarly, Noort et al.96 reported that the saltiness intensity of bread was enhanced by an inhomogeneous distribution of NaCl. In all cases, the largest taste enhancement was observed in inhomogeneous samples with large tastant concentration differences. The use of the inhomogeneity concept was shown to allow for a sucrose reduction of up to 20% in gelled products (Chapter 2) and for a salt reduction of up to 28% in breads96 without loss of sweetness or saltiness intensity. In line with the studies mentioned above, we hypothesize that an inhomogeneous distribution of fat (O/W emulsion droplets) in semi-solid emulsion-filled gels enhances the perception of sensory attributes that are related to fat. Consequently, reductions of fat can be achieved without causing undesirable changes in sensorial properties. To test this hypothesis, emulsion-filled gels varying in the spatial distribution of fat (O/W emulsion droplets) were prepared. The mechanical and rheological properties and the microstructure of the gels were analyzed to have

| Chapter 7
98 |
well characterized stimulus materials for the sensory test. A QDA panel was carried out to characterize the sensory properties of gels with homogeneous and inhomogeneous distributions of fat. The results of the QDA panel were used to investigate the effect of the spatial distribution of fat and the effect of the position of the layers varying in fat content on the perception of fat-related attributes. The dependency of the enhancement on the overall fat content was also investigated.
MATERIALS AND METHODS
Materials
Powdered whey protein isolate (WPI; BiproTM) was obtained from Davisco Foods International (La Sueur, USA). Sunflower oil was purchased from a local retailer. The other ingredients used to prepare the samples were obtained as described in Chapters 2 and 4. Sample Preparation
O/W Emulsions Stock emulsions containing 40% w/w sunflower oil in a water phase consisting of 1% w/w WPI were prepared by pre-homogenization using an Ultra Turrax (Polytron, Kinematica AG, CH), followed by homogenization at 500 bar in a high pressure homogenizer (Ariete, Model NS1001L 2K - Panda 2K, Niro Soavi S.p.A, IT). The average Sauter diameter (d3,2) of emulsion droplets obtained with this homogenization procedure was 1.5 µm. The size distribution of droplets in the emulsion was analyzed by light scattering using a Malvern Mastersizer 2000 (Malvern Instruments Ltd., Malvern, UK). Gels A solution of agar and water was heated to boiling. The solution was allowed to cool down to 80 ˚C. At this temperature, gelatin was added and the solution was kept under stirring in a water bath at 80 ˚C for 15 min. Sucrose was added and the solution was cooled down to 50 ˚C. The required amount of O/W emulsion (pre-heated to 50 ˚C) was added and the solution was stirred for 5 min. Water was added to account for evaporation during heating. To obtain a similar color in all gels, 1% w/w TiO2 suspension was added as a whitening agent in gels with low fat content (0, 2 and 5% w/w fat). The final solution was stirred for 10 min. The concentration of the ingredients in the gels is listed in Table 7-1.

Enhancement of fat-related sensory attributes |
99 |
Layered samples were composed of 4 layers of gel. To prepare the layers of gel, solutions of agar/gelatin/sucrose/emulsion were poured into plastic Petri dishes. The volume poured into the Petri dishes was varied according to the fat content in the gel to obtain layers with similar weight (Table 7-1). This procedure ensured that the final layered samples had the same overall fat content. Layers were prepared individually. After the gelation of each layer, the subsequent layer was added on top of the previous one. This step was repeated until all 4 layers were poured into the Petri dish. After storage overnight at 17 ˚C, gels were removed from the conditioned room and were allowed to equilibrate to room temperature (~ 23 ˚C). Gels were cut into pieces (20x20x13 mm) (length x width x height) and were used in the sensory test. Table 7-1. Composition and volume of gel layers
a.
a Concentrations of agar, gelatin and sucrose are expressed as % w/w on the aqueous phase. Concentrations of fat and TiO2 are expressed as % w/w on the total mass of gel. Layered samples varying in the spatial distribution of fat (homogeneous and inhomogeneous distributions) were obtained by the combination of layers containing different concentrations of fat. The layered samples prepared are listed in Table 7-2. Compression Measurements
Uniaxial compression measurements were performed as described in Chapter 2. The mean values of Young’s modulus, fracture stress and fracture strain were calculated from the measurements of 8 replicates (4 gel pieces from 2 gel specimen). Rheological Measurements
The melting and gelling behavior of the gels were determined as described in Chapter 2.
Fat (% w/w)
Agar (% w/w)
Gelatin (% w/w)
Sucrose (% w/w)
TiO2 (% w/w)
V (mL)
0 0.3 2.3 10 1 48 2 0.3 2.3 10 1 48 5 0.3 2.4 10 1 49 10 0.25 2.3 10 0 49 15 0.3 2.4 10 0 49 20 0.2 2.5 10 0 50 25 0.2 2.5 10 0 50 28 0.2 2.5 10 0 50

| Chapter 7
100 |
Confocal Laser Scanning Microscopy (CLSM)
CLSM was used to analyze the microstructure of the gels. Samples were stained with Rhodamine B (0.2% solution; 20 µL per mL sample) to allow for the visualization of the protein phase. CLSM images were recorded at room temperature (23 ± 1 ˚C) on a LEICA TCS SP5 Confocal Laser Scanning Microscope, equipped with an inverted microscope (model Leica DMI6000) and a set of 4 visible light lasers (Leica Microsystems, Mannheim, DE). A Leica objective lens of 63x magnification was used (PL FLUOTAR L 63x/0.70 CORR). The excitation wavelength was set at 568 nm. Digital image files were acquired in tagged image file format at 1024x1024 pixel resolution representing an image size of 0.125x0.125 mm. Table 7-2. Layer sequences used to prepare samples varying in spatial distribution of fat.
Quantitative Descriptive Analysis
Samples The samples used in the sensory test are listed in Table 7-2. Subjects Seven trained subjects (5 females; age: 27-58) participated in the study. The subjects were selected based on their ability to recognize and identify odors and basic tastes, verbal creativity and texture sensitivity. Motivation, teamwork, communication skills, and personal availability were also considered during selection. Subjects gave written informed consent.
Sample Overall Fat Content (% w/w)
Bottom Layer
(fat % w/w)
Middle Bottom Layer (fat % w/w)
Middle Top Layer
(fat % w/w)
Top Layer
(fat % w/w)
15/15/15/15 15 15 15 15 15 20/20/20/20 20 20 20 20 20 25/5/25/5 15 25 5 25 5
20/10/20/10 15 20 10 20 10 28/2/28/2 15 28 2 28 2 2/28/28/2 15 2 28 28 2 28/2/2/28 15 28 2 2 28
5/5/5/5 5 5 5 5 5 10/0/10/0 5 10 0 10 0

Enhancement of fat-related sensory attributes |
101 |
Method QDA was used to evaluate the sensorial properties of layered samples. Four training sessions and 2 evaluation sessions were carried out. All sessions lasted 1 h. During the first 2 training sessions, subjects generated a concept attribute list. In the third session, they practiced the evaluation of samples by rating the generated attributes. The last training session was used to finalize the attribute list based on the results of the third session. The final attribute list is shown in Table 7-3. The evaluation sessions were performed in individual sensory booths with appropriate lighting and ventilation. Subjects rated all attributes of each sample on a non-structured line scale with anchors at 10% of the scale defined as “very weak/very little” and at 90% of the scale defined as “very strong/very much”. The scales were displayed on a computer screen. Subjects were instructed to place the sample in the mouth and to chew freely. Taste and mouthfeel attributes were rated in the order in which they were perceived. The order was previously discussed and defined during the training sessions. After expectorating the bolus, subjects rated the aftertaste and afterfeel attributes and cleaned the mouth with water and a piece of cracker before tasting the following sample. A warm-up sample was used at the beginning of each session to familiarize the subjects with the samples and the task. Samples were assessed in duplicate by each subject in randomized order. Data Analysis Attribute intensity ratings were collected with Fizz software (v 2.40g, Biosystemes, FR). Data reduction was performed by Principal Component Analysis (PCA) (Unscrambler, Camo Inc., USA). Multi-factor ANOVA (SPSS, v 17, SPSS Inc, USA) was performed on all attribute intensity ratings with samples (all 9 layered samples) and replicates (2) as fixed factors and subjects as a random factor. Subsequent multi-factor ANOVA was performed in 3 sub-sets of samples to test for: a. effect of fat content in samples with homogeneous distributions of fat (fixed factor: fat content; 3 samples: 5/5/5/5, 15/15/15/15 and 20/20/20/20), b. effect of fat spatial distribution at an overall fat content of 15% w/w (fixed factor: fat distribution; 6 samples: 15/15/15/15, 20/10/20/10, 25/5/25/5, 28/2/28/2, 2/28/28/2 and 28/2/2/28) and c. effect of fat spatial distribution at an overall fat content of 5% w/w (fixed factor: fat distribution; 2 samples: 5/5/5/5 and 10/0/10/0). Post-hoc comparisons for these tests were performed with Tukey’s HSD tests. All tests were carried out at a significance level of α=0.05.

| Chapter 7
102 |
RESULTS AND DISCUSSION
Mechanical Properties of Gels
The addition of emulsion droplets is known to affect the mechanical properties of gels such as Young’s modulus (often related to the stiffness) and fracture strain (often related to the brittleness)109, 111, 112. The effect of emulsion droplets on the mechanical properties depends on the interactions between droplets and gel matrix and on the ratio between the modulus of the matrix and the modulus of the droplets (fillers). If the modulus of the droplets is lower than the modulus of the matrix, then an increase in the volume fraction of emulsion droplets decreases the modulus of the filled gel. In the case of droplets with higher modulus than the matrix, the impact of emulsion droplets on the mechanical properties of the filled gel depends on the droplet-matrix interaction. If the droplets interact with the gel matrix (bound fillers), then the modulus of the filled gel increases while the fracture strain decreases with increasing emulsion droplets volume fraction. If there is no interaction between emulsion droplets and gel matrix (unbound fillers), then modulus and fracture strain decrease as emulsion droplets volume fraction increases. Furthermore, unbound fillers cause less prominent decreases in fracture strain than bounded fillers112. Because Young’s modulus and fracture strain play a significant role in the sensorial properties of emulsion-filled gels109, the effect of emulsion droplets content on the mechanical properties of the gel was investigated in this study. Figure 7-1 shows that the mechanical properties of the gels were affected considerably by the fat (emulsion droplet) content. Young’s modulus increased while fracture stress, fracture strain, and energy to fracture decreased with increasing fat content in gels that contained a constant concentration of gelling agents (0.4% w/w agar and 1.8% w/w gelatin). The observed changes in mechanical properties indicate that the emulsion droplets were bounded to the gel matrix. This type of interaction was expected due to the pH of the mixed agar/gelatin gel, which was approximately 6. At this pH value, gelatin (isoelectric point ~ 8.7) is positively charged and the whey protein isolate (isoelectric point of ~ 5) absorbed at the surface of the emulsion droplets is negatively charged. Consequently, electrostatic attractions between the WPI and the gel bind the droplets to the matrix.
To obtain gels with similar mechanical properties and to avoid textural differences in layers containing different concentrations of fat, the formulation of the gels was adjusted by varying the concentrations of agar and gelatin according to the fat content (Table 7-1). As shown in Figure 7-1, the values of Young’s modulus, fracture stress,

Enhancement of fat-related sensory attributes |
103 |
fracture strain and energy to fracture were similar in the adjusted formulation. The effect of fat content on the large deformation properties was, therefore, compensated by the variation of the concentrations of the gelling agents.
Figure 7-1. Effect of fat content on the mechanical properties of emulsion-filled gels containing 0.4% w/w agar and 1.8% w/w gelatin (•) and on the mechanical properties of gels varying in agar and gelatin concentration (adjusted formulation) (○). The sensory attribute melting was shown to be correlated to the attributes spreadable and creamy in gelled products113, 114. For that reason, the melting behavior of the gels used in this study (adjusted formulation) was determined. Figure 7-2 shows that all gels had similar Tm, onset and Tm, end, indicating a similar melting behavior. The gels started to melt at 14 ± 2 ˚C (Tm, onset) and were completely melted at 36 ± 1 ˚C (Tm, end).
Figure 7-2. Melting temperatures of emulsion-filled gels (adjusted formulation): (▬) Tm, onset (start of melting process) and (X) Tm, end (end of melting process).
0
2
4
6
8
10
0 5 10 15 20 25 30
Youn
g’s
mod
ulus
(kPa
)
Fat (% w/w)
0
0.2
0.4
0.6
0.8
1
0 5 10 15 20 25 30
Frac
ture
str
ain
(-)
Fat (% w/w)
02468
101214
0 5 10 15 20 25 30
Frac
ture
str
ess
(kPa
)
Fat (% w/w)
0
10
20
30
40
50
60
0 5 10 15 20 25 30Ener
gy to
frac
ture
(mJ)
Fat (% w/w)
05
10152025303540
0 5 10 15 20 25 30
Tem
pera
ture
(ºC
)
Fat (% w/w)

| Chapter 7
104 |
Microstructure
The microstructure of the gels was analyzed to determine the distribution of emulsion droplets in the gel matrix, the occurrence of aggregation of emulsion droplets and the effect of the addition of TiO2 suspension on the microstructure. Figure 7-3 shows that the formation of aggregated emulsion droplets occurred in all gels. The formation of emulsion droplet aggregates can be explained as a result of weak forces, such as van der Waals interactions109, and as a result of entrapment of emulsion droplets during the liquid to solid phase transition in the gelled matrix115. As aggregation occurred in all cases, we conclude that the mechanical properties of the gels were affected by the presence of emulsion droplet aggregates in a similar way. Figure 7-3 also shows that the addition of the whitening agent TiO2 did not affect the microstructure of the gels, given that no differences were observed between images of gels containing 0 and 1% w/w TiO2 suspension.
Figure 7-3. CLSM images of emulsion-filled gels varying in fat and TiO2 content (image size 0.125x0.125 mm).
0
1 0
0
15
2
20
5
25
10
28
TiO2 (%) Fat (%)
Fat (%)
TiO2 (%)

Enhancement of fat-related sensory attributes |
105 |
Sensory Characterization
PCA Analysis The attribute list generated by the QDA panel consisted of 7 flavor, 9 mouthfeel, 2 aftertaste and 5 afterfeel attributes (Table 7-3). Table 7-3. List of sensory attributes generated in the QDA training sessions.
Attribute Description Flavor Intensity Flavor intensity Sweet Sweet taste, overall sweetness Vanilla Taste of vanilla Carton Taste of wet cardboard, musty, starch Bitter Bitter taste Milky Taste of milk, whey Development of sweet taste Time to develop the sweet taste during
chewing Mouthfeel Firm Product feels firm Cooling Product gives a cold feeling in the mouth Resilient Product can be pressed by the tongue,
springs back Crumbly Product crumbles in the mouth Spreadable Product can be spread between tongue
and palate Creamy/velvet Product feels warm, soft, full Fatty Fat layer on the tongue Watery Product feels thin, humid Melting
Product dissolves in the mouth, structure disappears with minimum effort
Aftertaste Sweet Sweet aftertaste Bitter Bitter aftertaste Afterfeel Creamy Warm, soft, full, velvety afterfeel Coating Thin layer of deposits on the tongue Dry Dry tongue Rough Rough feeling on the teeth Sticky Sticky lips
The attributes that differed significantly between samples are summarized in the PCA bi-plot (Figure 7-4). The primary axis explains the differences in gels varying from resilient and crumbly to melting and spreadable. The secondary axis explains the differences in gels varying from watery to creamy. Inhomogeneous samples with the largest fat concentration differences between layers (28/2/28/2, 2/28/28/2 and 28/2/2/28) were characterized by fat-related attributes, such as spreadable, melting and creamy. The homogeneous sample 15/15/15/15 was characterized by a firm

| Chapter 7
106 |
texture. The other inhomogeneous samples (20/10/20/10 and 25/5/25/5) and the homogeneous sample containing 20% fat (20/20/20/20) had intermediate intensity ratings for the attributes in the resilient/crumbly to melting/spreadable dimension. This suggests a relation between fat spatial distribution, fat concentration differences and the perception of fat-related sensory attributes. Samples containing 5% fat (5/5/5/5 and 10/0/10/0) had lower intensity ratings for the attributes related to fat, such as fatty, creamy and spreadable, than the samples containing 15% fat.
Figure 7-4. Principal component analysis bi-plot of sensory data. Comparison of Layered Samples Samples were divided in 3 sub-sets to test for the following effects on the perception of fat-related sensory attributes: a. effect of fat content in samples with homogeneous distributions of fat (3 samples: 5/5/5/5, 15/15/15/15 and 20/20/20/20); b. effect of fat spatial distribution at an overall fat content of 15% (6 samples: 15/15/15/15, 20/10/20/10, 25/5/25/5, 28/2/28/2, 28/2/2/28 and 2/28/28/2); and c. effect of fat spatial distribution at an overall fat content of 5% (2 samples: 5/5/5/5 and 10/0/10/0). Only the mouthfeel and afterfeel attributes that are often used to describe products containing fat, such as firm, creamy, fatty, spreadable and melting109,
114, will be discussed in this chapter.
PC2
(15%
)
PC1 (66%)
Mcreamy/velvetMfirm
Mmelting
Mcrumbly
Mresilient
Mspreadable
Mfatty
AFrough
AFcreamy
Mwatery
Tsweet
5/5/5/5
28/2/2/2820/10/20/10
25/5/25/5
10/0/10/0
28/2/28/22/28/28/2
15/15/15/1520/20/20/20

Enhancement of fat-related sensory attributes |
107 |
Table 7-4. Average intensity ratings of mouthfeel and afterfeel fat-related attributes
a. Mfirm Mspreadable Mcreamy Mfatty Mmelting AFcreamy
A. Homogeneous samples varying in fat content
51.9a
45.3a
32.8a
31.6a
30.1a
22.4a
54.7a
51.9a
42.4ab
38.2a
35.6ab
34.5b
44.9a
58.9a
45.4b
39.8a
43.7b
43.0b
B. Samples varying in spatial distribution of fat; 15% fat
54.7c
51.9a
42.4a
38.2a
35.6a
34.5a
48.0bc
61.6abc
43.9a
39.5a
51.0ab
39.5a
42.6abc
55.1ab
47.4a
43.6a
42.3ab
37.3a
37.6ab
68.1bc
51.5a
40.6a
57.1bc
33.0a
34.0ab
69.0c
51.4a
43.2a
58.6bc
35.1a
27.6a
71.6c
56.9a
51.5a
69.2c
47.4a
C. Samples varying in spatial distribution of fat; 5% fat
51.9a
45.3a
32.8a
31.6a
30.1a
22.4a
43.1a
49.3a
33.1a
28.8a
46.0b
23.3a
a Within columns and sub-sets, means followed by different letters are significantly different at p<0.05. b Numbers correspond to the fat content (% w/w) in each layer.
20/20/20/20
15/15/15/15
15/15/15/15
20/10/20/10
25/5/25/5
28/2/28/2
2/28/28/2
28/2/2/28
5/5/5/5
10/0/10/0
Attribute
5/5/5/5
Sample
b

| Chapter 7
108 |
Homogeneous Samples Varying in Overall Fat Content The comparison of the attributes intensity ratings of homogeneous samples containing 5, 15 and 20% fat indicated an effect of fat content on the perception of fat-related mouthfeel and afterfeel attributes in emulsion-filled gels (Table 7-4A). As fat content increased, significant increases in the ratings of mouthfeel creamy [F(2,30)=3.7; p<0.05], mouthfeel melting [F(2,30)=3.8; p<0.05] and afterfeel creamy [F(2,30)=9.9; p<0.001] were observed. The ratings of mouthfeel spreadable [F(2,30)=2.6; p=0.09] and mouthfeel fatty [F(2,30)=2.0; p=0.15] tended to increase with increasing fat content, but the differences were not significant. These results are in agreement with Sala et al.109,
114, who reported increasing ratings of fat-related attributes in emulsion-filled gels with increasing fat content. The observed differences in the ratings of the attribute melting can be related exclusively to mouthfeel sensations that are induced by the fat content, since the rheological characterization showed that all gels had similar melting behavior. Homogeneous and Inhomogeneous Samples Containing 15% Fat To investigate the effect of the spatial distribution of fat on the perception of fat-related attributes, the intensity ratings of mouthfeel and afterfeel attributes of homogenous and inhomogeneous samples containing 15% fat were compared (Table 7-4B). Significant differences for the mouthfeel attributes firm [F(5,66)=6.4; p<0.001], spreadable [F(5,66)=6.2; p<0.001] and melting [F(5,66)=8.1; p<0.001] were observed between samples. Inhomogeneous samples with the largest fat concentration differences (combination of layers containing 2 and 28% fat) were perceived less firm, more spreadable and more melting than the homogenous sample. The observed differences in firmness and melting result from mouthfeel sensations induced by the fat content, since all gels had similar mechanical properties and melting behavior. In a study conducted by De Wijk et al.116, ratings of the attribute melting of custard desserts seemed to be affected by the distribution of fat in the bolus, which was related to the breakdown behavior of the product. The authors suggested that the perception of melting is determined by the surface properties of the product. Our results support this assumption, since the highest melting rating was observed for the inhomogeneous sample that had the high-fat layers on the outside position (28/2/2/28). This sample also had the highest ratings for the other mouthfeel and afterfeel attributes, suggesting that the position of the high-fat layers affects the perception of fat-related attributes. These results suggest that a high fat content on the surface of the bolus during the first stages of oral processing might enhance the

Enhancement of fat-related sensory attributes |
109 |
perception of fat-related attributes. In the final stages of oral processing, when the bolus is ready to be swallowed, the distribution of fat in the bolus will be homogeneous. Therefore, the mouthfeel sensations induced by fat during the first contacts of the product with oral tissues and during the first chews might be decisive for the ratings of fat-related mouthfeel attributes, and might affect the overall perception of the product.
Although the intensity ratings of mouthfeel creamy did not differ significantly between samples [F(5,66) = 2.3; p = 0.06], there was a trend of increasing creaminess ratings as fat concentration differences increased in the inhomogeneous samples (Table 7-4B). The samples 28/2/28/2, 2/28/28/2 and 28/2/2/28 had higher creaminess ratings than the homogeneous sample 15/15/15/15 (51.5, 51.4, 56.9 and 42.4, respectively). Results show that the difference in creaminess ratings between the homogeneous samples containing 15 and 20% fat (42.4 and 45.4, respectively) was smaller than the differences between the inhomogeneous samples composed of 2 and 28% fat layers and the 15% fat homogeneous sample. This indicates that the modulation of the spatial distribution of fat was more efficient in increasing creaminess ratings than the increase in the overall fat content of the homogeneous sample. The modulation of fat spatial distribution also had more impact on the ratings of the mouthfeel attributes spreadable, fatty and melting than the increase in the overall fat content of the homogeneous sample.
The intensity ratings of afterfeel creamy did not differ significantly between homogeneous and inhomogeneous samples containing 15% fat [F(5,66)=1.8; p=0.12]. This result was expected as the distribution of fat in the bolus of all samples is homogeneous after oral processing. Therefore, independently of the initial spatial distribution of fat, samples with the same overall fat content should have similar afterfeel perception. The inhomogeneous sample 28/2/2/28 had a higher rating for afterfeel creamy than the homogeneous sample containing 20% fat (47.4 and 43, respectively). Although the difference was not significant, these results also suggest that a high concentration of fat on the surface of the bolus during the initial stages of oral processing might affect the overall perception of a product. Homogeneous and Inhomogeneous Samples Containing 5% Fat The effect of fat spatial distribution on the perception of fat-related sensory attributes at a lower overall fat content was investigated by comparing homogeneous and inhomogeneous samples containing 5% fat. Mouthfeel melting was the only attribute

| Chapter 7
110 |
that differed significantly between samples 5/5/5/5 and 10/0/10/0 [F(1,18)=7.0; p<0.05] (Table 7-4C). The inhomogeneous sample was perceived more melting than the homogeneous sample. This general lack of enhancement at a lower fat content can be explained by the presence of 0% fat layers in the inhomogeneous sample 10/0/10/0. Layers without fat cause very different mouthfeel sensations compared to layers that contain some fat, and this might have had an impact on the attributes ratings. Alternatively, the absolute difference in fat content between the layers of the inhomogeneous sample may not have been large enough. At an overall fat content of 15%, an enhancement of fat-related attributes was observed only for the samples with the largest fat concentration differences (combination of 2 and 28% fat layers). Sample 20/10/20/10, which had the same absolute fat concentration differences as sample 10/0/10/0, did not show a significant enhancement of fat-related attributes.
Previous studies that investigated the effect of tastant spatial distribution on taste perception of layered products showed that large tastant concentration differences are required to enhance taste intensity
Chapter 2, 94, 96. In the current study, we observed that inhomogeneous samples with the largest fat concentration differences had the highest intensity ratings of fat-related attributes. However, the results suggest that the cause of the enhancement of fat-related attributes by an inhomogeneous distribution of fat might be the mere presence of zones containing high-fat content (preferably on the surface of the product) rather than the presence of fat concentration differences within the product.
CONCLUSIONS
An inhomogeneous distribution of fat (emulsion droplets) in layered emulsion-filled gels enhanced the perception of fat-related sensory attributes, such as spreadable and melting. Inhomogeneous samples with large fat concentration differences had higher intensity ratings of mouthfeel and afterfeel attributes than the homogeneous sample at the same overall fat content. Creaminess ratings tended to increase with increasing fat concentration differences in the inhomogeneous samples. The highest intensity ratings of fat-related sensory attributes were observed for the inhomogeneous sample with the high-fat layers positioned on the outside of the sample. This indicates that the position of the high-fat layers affects the perception of attributes related to fat. Moreover, the enhancement of fat-related attributes at an overall fat content of 15% fat was larger than the enhancement at 5% fat. Results suggest that the mere presence of zones containing high-fat content (preferably on the surface of the product) could

Enhancement of fat-related sensory attributes |
111 |
be the cause of the enhancement of fat-related attributes by an inhomogeneous distribution of fat.
We suggest that the modulation of the spatial distribution of fat can be used to reduce the fat content of food products without causing undesirable changes in the sensory properties.


Chapter 8 ── General Discussion ──

| Chapter 8
114 |
In view of the need to reduce the contents of sugar, salt and fat in processed foods, this thesis investigated the factors that affect the perception of taste and fat-related sensory attributes in semi-solids. A study that described the effects of tastant concentration differences on taste perception in liquids47 was the starting point for the research reported in this thesis. In this study, saltiness intensity was enhanced by temporal variations of salt concentration during the consumption of liquids. The use of tastant concentration differences (referred to as the inhomogeneity concept in this thesis) was later suggested as a feasible strategy to reduce salt and sugar in foods48, 49. At the start of this research project, no information was available on the effectiveness of using the inhomogeneity concept to enhance the perception of taste in complex matrices that resemble commercial food products. Therefore, the effect of the spatial distribution of sucrose (i.e. sucrose concentration differences) on the perception of taste in semi-solids was selected as the first topic to be investigated in this thesis.
The mechanical properties of (semi-)solid products are known for influencing the perception of taste. Several studies reported that variations of strength or firmness led to variations of taste intensity in (semi)-solids54-56. For that reason, the effect of mechanical properties on taste perception was selected as the second topic to be investigated in this thesis.
This thesis aimed at identifying and understanding the factors that affect the perception of taste in semi-solid foods. To achieve this aim, the relationship between the spatial distribution of sucrose, the mechanical properties of semi-solid gels and the perception of taste was investigated. The relationship between the spatial distribution of fat and the perception of fat-related sensory attributes was also investigated. The progress made towards the accomplishment of the proposed aim will be discussed in this chapter.
MAIN FINDINGS
An inhomogeneous distribution of sucrose at large sucrose concentration differences enhanced sweetness intensity in semi-solid gels (Chapter 2). A sucrose reduction of up to 20% could be achieved without compromising sweetness. These findings suggest that the inhomogeneity concept can be used as a strategy to reduce sugar in semi-solid foods. The observed sweetness enhancement was shown to depend on the frequency of discontinuous stimulation of taste receptors. For that reason, the occurrence of sweetness enhancement did not depend on the mechanical properties of gels, whereas the magnitude of sweetness enhancement depended on the mechanical properties

General discussion |
115 |
(Chapter 3). The breakdown and mixing that occur during oral processing were shown to affect the release of tastants from the gel and, consequently, the frequency of receptor stimulation and the perception of taste. Fracture strain showed larger effects on the oral breakdown and on taste perception than fracture stress (Chapter 4). These findings indicate that the spatial distribution of tastants and the mechanical properties (especially fracture strain) of foods can be modulated in such a way that the frequency of discontinuous stimulation of receptors is optimized and taste enhancement is maximized. Consumer preference was found to be maintained or increased in a variety of products (e.g. gels, breads and sausages) containing tastants heterogeneously distributed in the food matrix (Chapter 5). These results support the use of the inhomogeneity concept as a reduction strategy in commercial food products. The time frame at which tastant concentration is varied during the consumption of products was shown to be an important factor for the occurrence of discontinuous stimulation of taste receptors at the frequency required for taste enhancement (Chapter 6). The use of the inhomogeneity concept is not limited to tastant distribution. The modulation of the spatial distribution of fat was shown to be a feasible strategy to reduce fat in food products (Chapter 7). Fat-related mouthfeel attributes, such as spreadable and melting, were enhanced by an inhomogeneous distribution of fat at large fat concentration differences. The presence of high-fat zones on the surface of the model system was shown to maximize the enhancement of attributes related to fat. It was concluded that the perception of taste and fat-related attributes are enhanced through distinct mechanisms. In the case of taste, the presence of large tastant concentration differences within the product is required for the occurrence of high-intensity discontinuous stimulation of receptors. In the case of fat-related attributes, the mere presence of high-fat zones (preferably on the surface of the product) seems to be the requirement for the enhancement of the sensations elicited by fat.
METHODOLOGICAL CONSIDERATIONS
Model System
The development and characterization of a model system suitable for controlling the spatial distribution of tastants was the first point addressed in this thesis. At the start of this research project, 2 types of model systems were considered. The first type consisted of encapsulating a solution of sucrose or sucrose crystals. The capsules containing sucrose would then be dispersed in a semi-solid matrix. A limitation
| Chapter 8
116 |
encountered in the development of such a system was to find a shell material able to entrap efficiently sucrose into capsules. Sucrose is water soluble and can diffuse easily through shells composed of water-based materials. A fat-based material would be the only possibility to avoid diffusion. Two types of fat with melting points of 37 and 55 ˚C were used to encapsulate a sucrose solution using a double nozzle encapsulator. Due to difficulties in solidifying the fat shell, the capsules obtained were irregular and presented cracks in the surface, which led to leakage. The use of a fluidized bed to coat sucrose crystals with a fat layer was the second encapsulation approach tested. The encapsulation of sucrose crystals was more efficient than the encapsulation of sucrose solution. When placed into aqueous media, the fat coating showed an acceptable performance in entrapping sucrose crystals. However, the coated material obtained did not show a good performance as a stimulus material. Before taste could be perceived (i.e. before tastants got in contact with receptors), the layer of fat had to melt and sucrose crystals had to be dissolved. Under normal eating conditions, the coated crystals would be swallowed before taste could be perceived. Furthermore, the coated crystals conferred an unpleasant graininess. Concerning the application of the encapsulation approach in commercial products, the use of fat as a coat/shell material could compromise the perception of taste by creating a fat layer on the surface of the tongue. Moreover, the caloric value of products would be increased. An increase in production costs is another drawback that would limit the application of this approach. Due to all these limitations, the encapsulation of sucrose was not considered a feasible model system for the purposes of this thesis.
The second model system considered was the layered gel described in Chapter 2. In this model system, layers of gel were used to control the spatial distribution of sucrose. Samples differing in sucrose distribution were obtained by the combination of 4 layers of gel containing different concentrations of sucrose. A mixture of agar and gelatin was selected as the best option among the different hydrocolloids tested. Layers of mixed agar-gelatin gels were easy to prepare and presented some adherence when placed on top of each other. Furthermore, the spatial distribution of tastants could be easily modulated in this model system by varying the thickness and the number of layers. The mechanical properties of the layers could also be easily modulated by varying the overall concentration of gelling agents or the agar/gelatin ratio. As the addition of sucrose altered the mechanical properties and the density of the gels, some points were taken into account during the preparation of the model system. To avoid differences in mechanical properties between layers, the

General discussion |
117 |
concentrations of agar and gelatin were adjusted according to the concentration of sucrose in the gel. Furthermore, the layers were prepared on a mass basis to guarantee a constant overall sucrose concentration in the different layered gels. The diffusion of sucrose through the layers was another point considered. Due to the open gel network that is not sufficiently dense to entrap sucrose molecules, the diffusion rate of sucrose through the layers was fast (i.e. in the same order of magnitude of the diffusion of sucrose in water). To overcome this limitation, the layered gels used in the sensory studies performed in this thesis were freshly prepared (i.e. layers varying in sucrose concentration were placed on top of each other less than 30 min prior to the sensory tests).
Due to the satisfactory performance of the layered model system in controlling the spatial distribution of sucrose, a similar model system was developed to control the spatial distribution of fat (i.e. oil-in-water emulsion droplets) (Chapter 7). Similar points (e.g. changes in mechanical properties and density) were taken into account during the development of this model system. Another point considered was the color difference between layers containing different concentrations of fat. To overcome this limitation, a whitening agent (TiO2 suspension) was used to obtain similar color in all layers. Due to the size of fat droplets, their diffusion through the layers could be neglected. Consequently, the layers could be assembled during sample preparation. As the layers were stuck together, the presence of different layers was not noticed by the subjects and the sample was perceived as a whole during the sensory tests. In the model system containing sucrose, subjects could easily notice that samples were composed of different layers. This was not the ideal situation, since bias could be introduced in the judgment. Therefore, the use of model systems in which layers have more adherence and stick together would be recommended for further studies.
In Chapter 6, the approach of controlling the spatial distribution of tastants in layers was extended to a larger length scale. Samples composed of sequences of 4 cubes of gel or 4 spoons of model custard dessert were prepared. The distribution of sucrose was varied by combining cubes or spoons containing different concentrations of sucrose. Gels were also composed of agar and gelatin. The formulation was adjusted to standardize the mechanical properties. Custards were composed of whole milk, corn starch and sucrose. Aroma was not added to avoid effects on sweetness. As the viscosity of custards varying in sucrose concentration was similar, adjustments in the formulation were not required. The cubes and spoons were prepared on a mass basis to guarantee the same overall sucrose content in all gel and custard samples. This
| Chapter 8
118 |
extended approach was used to investigate whether taste enhancement could be obtained when tastant concentration is varied at long time frames during the consumption of products. Evaluation Procedure
Different methodologies were tested to evaluate the sweetness of samples varying in sucrose distribution using consumers (i.e. subjects not trained). The first method tested was rating on line scales. This method did not allow for a good comparison between the sweetness of inhomogeneous samples and the sweetness of the homogeneous reference. As several samples varying in sucrose distribution were evaluated, subjects could not compare properly the inhomogeneous samples to the homogeneous reference. In order to detect sweetness differences between samples, the reference had to be presented several times. For that reason, the 2-Alternative Forced Choice (2-AFC) method was tested. As a direct comparison between 2 samples is performed in this method, the sweetness of each inhomogeneous sample could be compared to the sweetness of the homogeneous reference. This method is sensitive and allows for the detection of small differences between samples. The drawback of this method is the large number of samples that is needed for the several comparisons and the large number of subjects required. The third method tested to evaluate sweetness was time-intensity ratings. This method provides several parameters such as the sweetness curves, the maximum value of sweetness (Imax), the time at which Imax is perceived (tmax) and the overall sweetness intensity (estimated from the area under the sweetness curves). The temporal variations of sweetness during the consumption of samples, which is shown by the sweetness curves, can be evaluated with time-intensity ratings. For the purpose of evaluating the sweetness of samples varying in the distribution of sucrose, 2-AFC and time-intensity ratings were considered the most appropriate methods.
For the evaluation of samples varying in fat distribution, a Quantitative Descriptive Analysis (QDA) panel was performed. This method was used because the evaluation of sensory attributes related to fat (e.g. creaminess) is more complex and requires the use of trained subjects. Furthermore, as several attributes are affected by the fat content, QDA was an appropriate method because it allows for the simultaneous evaluation of several attributes. We recommend the use of a QDA panel to check whether an inhomogeneous distribution of tastants leads to changes in other sensory attributes besides taste (e.g. texture and flavor).

General discussion |
119 |
DISCUSSION AND INTERPRETATION OF RESULTS
Role of Tastant Concentration Differences in Taste Perception
An inhomogeneous distribution of sucrose was shown to enhance sweetness intensity when sucrose concentration differences within the layered gels were large (Chapter 2). This indicates that, similarly to liquids47-49, tastant concentration differences enhance taste perception in semi-solids. This also indicates that temporal concentration differences in liquids are equivalent to spatial concentration differences in semi-solids. Tastant concentration differences were, therefore, identified as a factor that affects taste perception in semi-solids. The next step was to understand how tastant concentration differences could be modulated in semi-solids to maximize the perception of taste. This thesis did not investigate the physiological mechanisms responsible for the enhancement of taste. However, this information is required for the discussion of the results. The outcome of studies that investigated the effects of variations of tastant concentration in liquids47,
48,
95 gave indications that a partial
recovery from taste receptor adaption and accumulated serial phasic responses of receptors could be the mechanisms responsible for the observed taste enhancement in semi-solids. Based on this assumption, we propose that taste receptors are exposed to an asynchronous discontinuous stimulation during the oral breakdown of semi-solids exhibiting inhomogeneous distributions of tastants. Cycles of stimulation-partial recovery from adaptation are repeated in individual receptors and bursts of phasic response occur in multiple receptors. As a consequence, the total output of receptor response is higher than that resulting from a continuous stimulation (i.e. lack of tastant concentration differences). Large tastant concentration differences lead to high-intensity discontinuous stimulation and to a consequent high output of receptors response. For this reason, the highest sweetness enhancement was observed in the inhomogeneous samples exhibiting the largest sucrose concentration differences (i.e. samples 40/0/0/0 and 40/0/40/0 - numbers correspond to the percentage of sucrose (% w/w) in each layer). Other studies also observed that large tastant concentration differences are required for a significant taste enhancement48, 94, 96.
It was hypothesized in Chapter 2 that the larger sweetness enhancement of sample 40/0/40/0 (layer thickness: 1/3/1/3 mm) in comparison to sample 40/0/0/0 (layer thickness: 2/2/2/2 mm) was related to the large total surface area of high-sucrose gel fragments formed during the breakdown of sample 40/0/40/0. The probability of receptor exposure to high concentrations is expected to increase with increasing the total surface area of high-sucrose gel fragments. Consequently, the total output of
| Chapter 8
120 |
receptors response is also expected to increase. The characterization of the expectorated boluses of these 2 samples showed that sample 40/0/40/0 yielded more high-sucrose fragments of smaller size upon chewing than sample 40/0/0/0 (data not reported in the preceding chapters). As the mechanical properties of all layers in both samples were similar, the differences in breakdown behavior (i.e. number and size of fragments) resulted from differences in layer thickness. These results indicate that, besides the intensity of the discontinuous stimulation, the number of stimulations also seems to account for the enhancement of taste that results from the presence of tastant concentration differences. In liquids, the frequency at which pulses of low- and high-tastant solutions were alternated was shown to affect taste enhancement48,
49. The optimum pulsation frequency that maximized taste perception could be determined by controlling the pulsation period with a gustometer. We hypothesize, therefore, that the frequency of high-intensity discontinuous stimulation drives taste enhancement by tastant concentration differences in semi-solids. We suggest that taste perception can be enhanced in semi-solids as the frequency of high-intensity discontinuous stimulation increases until the optimum frequency is reached. After this optimum value, a plateau for taste enhancement is expected.
If the frequency of high-intensity discontinuous stimulation of receptors is the driving factor for taste enhancement, then the magnitude of taste enhancement should only be affected by the breakdown behavior of the product (i.e. number and size of fragments formed during oral processing). This explains why the position of the 40% sucrose layers in samples 40/0/40/0, 40/0/0/40 and 0/40/40/0 did not affect taste perception/enhancement (Chapter 2). As these samples were composed of similar layers, the fragments formed during oral processing were similar. Consequently, the frequency of discontinuous stimulation and the magnitude of taste enhancement should not differ between these samples. An equal breakdown behavior also explains the fact that taste enhancement was not affected by the overall sucrose content of the layered gels (data not reported in the preceding chapters). The thickness of 0% sucrose layers was slightly varied to obtain samples 40/0/40/0 with an overall sucrose content of 10 and 14% w/w. The mechanical properties of 0 and 40% sucrose layers were similar. Results from 2-AFC tests showed that the inhomogeneous samples had a similar magnitude of sweetness enhancement in relation to the homogeneous samples (10/10/10/10 and 14/14/14/14). As the 40% sucrose layers had the same mechanical properties and the same thickness, the fragments formed during oral

General discussion |
121 |
breakdown and the frequency of discontinuous stimulation are expected to be similar in these samples.
An experiment performed using a model system consisting of gel cubes also showed a relation between the frequency of discontinuous stimulation of taste receptors and taste perception/enhancement (data not reported in the preceding chapters). Three sets of cubes of gels varying in size were prepared: small cubes (1x1x1 mm), medium cubes (3x3x3 mm) and large cubes (10x10x10 mm). Each set was composed of a homogeneous and an inhomogeneous sample. The samples were prepared on a mass basis to obtain an overall sucrose content of 10% w/w (i.e. inhomogeneous sample: total weight of 5 g, 1.25 g of cubes containing 40% w/w sucrose and 3.75 g of cubes containing 0% w/w sucrose; homogeneous sample: 5 g of cubes containing 10% w/w sucrose). As all samples had the same total weight (5 g), small cubes had the largest total surface area (small cubes=6360 mm2, medium cubes=2106 mm2 and large cubes=636 mm2). For the sensory test, subjects were asked to place all cubes that composed a sample (i.e. 5 g) in the mouth at once, to move them around without chewing and to expectorate the sample. Sweetness intensity was then rated on a 100-point scale. Results showed that the sweetness of small, medium and large cubes differed significantly (p<0.001). Small cubes had the highest sweetness intensity and large cubes had the lowest sweetness intensity. These results confirm that the frequency of stimulation plays an important role in the perception of taste. As small cubes had the largest total surface area, the exposure of receptors to taste stimuli was higher for small cubes than for medium and large cubes. Consequently, a large number of stimulations was induced and small cubes were perceived sweeter than medium and large cubes. The sweetness of homogeneous and inhomogeneous samples within each set did not vary significantly. This lack of taste enhancement in the inhomogeneous samples can be attributed to the type of measurement used. The differences in sweetness between homogeneous and inhomogeneous cubes might not have been detected by rating measurements. A direct comparison of homogeneous and inhomogeneous cubes of same size in 2-AFC tests could have shown sweetness differences. Another reason for the lack of sweetness differences between homogeneous and inhomogeneous samples can be related to the constraints imposed for the oral movements. As subjects had to move the cubes without chewing, the contact of tastants with taste receptors might have been compromised. As a consequence, the frequency of discontinuous stimulation of receptors by high-

| Chapter 8
122 |
intensity stimuli was not high enough to enhance sweetness in the inhomogeneous samples.
Chapter 6 gave more insights into the relationship between the frequency of discontinuous stimulation and taste perception/enhancement. In this chapter, sequences of 4 cubes of gel or 4 spoons of custard dessert were used as stimuli. The concentration of sucrose was varied between the cubes and spoons. In this way, the time frame at which sucrose concentration was varied during the consumption of the samples was longer (i.e. between bites) than that for the layered gels (i.e. within one bite). The temporal profile of sweetness determined during the consumption of the sequences of 4 cubes/spoons showed clearly that subjects evaluated each cube/spoon as an independent stimulus. This indicates that the time used to evaluate each stimulus and/or the intervals between stimuli in the sequences were long. Consequently, sucrose concentration differences did not induce discontinuous stimulation of receptors at the frequency required for the occurrence of taste enhancement.
In summary, an inhomogeneous distribution of tastants at large concentration differences enhances the perception of taste in semi-solids. The enhancement of taste depends on the frequency of high-intensity discontinuous stimulation of taste receptors. Results suggest that the inhomogeneity concept can be used as a strategy to reduce tastants in semi-solid products without compromising the sensorial quality. Role of Mechanical Properties in Taste Perception
The determination of the exact frequency of high-intensity discontinuous stimulation of receptors that maximizes taste enhancement in semi-solids is a challenge. However, the determination of the conditions that optimize the frequency of discontinuous stimulation and, consequently, maximize taste enhancement is achievable. As the frequency of discontinuous stimulation was suggested to be related to the breakdown behavior during oral processing (Chapter 2), the effect of mechanical properties (i.e. fracture strain and fracture stress) on taste perception was the next topic addressed in this thesis.
It was shown in Chapter 3 that the mechanical properties of semi-solid gels did not affect the occurrence of taste enhancement by tastant concentration differences. However, the magnitude of the enhancement was affected by the mechanical properties. Inhomogeneous soft and hard gels had the largest sweetness enhancement, while the inhomogeneous medium gel had a smaller enhancement than the hard gel. The temporal sweetness profile obtained by time-intensity ratings was also affected by

General discussion |
123 |
the mechanical properties of the gels. The soft gel had the highest sweetness intensity (Imax), which tended to be perceived faster than in the other gels (i.e. short tmax). The hard gel had the lowest Imax and the longest tmax. Furthermore, the soft gel had the smallest difference in Imax between homogeneous and inhomogeneous gels, whereas the hard gel had the largest difference. The observed effects of mechanical properties on taste perception and on the magnitude of taste enhancement can be explained by differences in the oral breakdown behavior of the gels. In the set of gels used in Chapter 3 (soft, medium and hard gels), fracture strain and stress were varied simultaneously. In Chapter 4, fracture strain and fracture stress were varied independently. The effects of fracture strain and stress on oral breakdown and taste perception could then be decoupled and investigated in more detail. Gels with low values of fracture strain and stress break down into a large number of small fragments that mix efficiently during bolus formation. Increases in the total surface area of fragments combined with an efficient mixing of fragments were shown to facilitate the release of tastants from the gel and to enhance sweetness intensity (Chapter 3 and 4). This indicates that the frequency of taste receptor stimulation and the total output of receptor response are affected by the breakdown and mixing that occur during oral processing. Fracture strain (often related to the brittleness) was shown to have more impact on the oral breakdown of the gel and on the perception of taste than fracture stress (Chapter 4). Therefore, the high Imax and the high magnitude of taste enhancement observed for the inhomogeneous soft gel in Chapter 3 can be related to a high release of tastants from the gel and to a high frequency of high-intensity discontinuous stimulation. For the homogeneous soft gel, the release of tastants from the gel is fast and taste is perceived promptly. As a consequence, Imax is high and the difference in Imax between homogeneous and inhomogeneous soft gels is small. For the hard gel, the frequency of receptor stimulation is expected to be low, since hard gels break down into a small number of large fragments that mix less efficiently (Chapter 3 and 4). The slow mixing of the bolus of inhomogeneous hard gels might maintain the tastant concentration differences in the mouth for an extended period. As the chewing process is long for hard gels (i.e. more chews are required to prepare the bolus for swallowing) (Chapter 4), receptors are exposed to a high-intensity discontinuous stimulation for an extended period. Consequently, the total output of receptors response for hard gels is comparable to that for soft gels. For the homogeneous hard gel, a low frequency of receptor stimulation is induced and taste receptor adaptation might occur. This can be the reason for the low Imax observed for

| Chapter 8
124 |
the homogeneous hard gel and for the large difference in Imax between homogeneous and inhomogeneous hard gels.
Based on these results, we suggest that the optimum frequency of high-intensity discontinuous stimulation that maximizes taste enhancement by concentration differences depends on the mechanical properties of semi-solids. Taste perception was shown to be related to the release of tastants from the gels and to the period that tastant concentration differences are maintained, which are both dependent of the oral breakdown and mixing behavior. Therefore, the maximum taste enhancement is an optimum between the frequency of high-intensity discontinuous stimulation and the period that tastant concentration differences are maintained during oral processing. Semi-solids with low values of fracture properties (especially low fracture strain) require a high frequency to maximize taste enhancement, since they break easily during mastication, the in-mouth release of tastants is fast and tastant concentration differences are maintained for a short period. On the other hand, a low frequency of high-intensity stimulation might be sufficient to maximize taste enhancement in semi-solids with high values of fracture strain and stress, since tastant concentration differences are maintained for an extended period during oral processing.
Two main conclusions can be drawn about the relation between mechanical properties of semi-solids and taste perception. First, taste perception can be enhanced through the modulation of the breakdown and mixing behavior of the product. Fracture strain should be the focus of mechanical properties modulation. Second, the modulation of mechanical properties can be combined with the modulation of the spatial distribution of tastants to further enhance taste perception. As shown in Chapter 4, the modulation of mechanical properties is only required in the parts of the inhomogeneous product that contain sucrose.
Our results showed that taste perception in semi-solid gels is affected by the breakdown and mixing behavior. Additional perceptual effects of texture on sweetness might also have contributed for the differences in sweetness between layered gels varying in mechanical properties. However, our results indicated that the effects of mechanical properties on taste perception can be explained exclusively by physicochemical mechanisms.

General discussion |
125 |
Role of Fat Concentration Differences in the Perception of Fat-Related Sensory Attributes
After identifying the potential of tastant concentration differences to enhance taste perception, we decided to investigate the enhancement of other sensory responses using the inhomogeneity concept. In this context, the effect of modulation of the spatial distribution of fat (i.e. oil-in-water emulsion droplets) on the perception of fat-related sensory attributes was assessed (Chapter 7).
The perception of the mouthfeel attributes spreadable and melting was enhanced in samples exhibiting large fat concentration differences between the layers of the model system. Creaminess tended to increase along with fat concentration differences. The inhomogeneous sample with the largest fat concentration differences and with the high-fat layers positioned on the outside of the sample (sample 28/2/2/28 - numbers correspond to the percentage of fat (% w/w) in each layer) showed the highest ratings for all fat-related mouthfeel and afterfeel attributes. This indicates that the magnitude of fat concentration differences between the layers and the position of the high-fat layers affect the perception/enhancement of fat-related attributes.
Distinct mechanisms are responsible for the perception of taste and fat. The perception of taste is related to the physical contact of tastants with receptors located in the oral cavity117. The perception of fat is complex and involves the perception of flavor and mouthfeel attributes during oral processing67. We will focus our discussion about the enhancement of fat-related attributes on the perception of mouthfeel attributes, since the modulation of fat spatial distribution did not affect the perception of flavor attributes (Chapter 7). As taste and fat are perceived through different mechanisms, it would be expected that the presence of concentration differences enhances taste and fat-related attributes through different mechanisms. In the case of taste, large tastant concentration differences increase the total output of taste receptors. The frequency of high-intensity discontinuous stimulation, the driving factor for taste enhancement, was shown to depend on the breakdown and mixing behavior of the semi-solid product. For that reason, the position of the layers containing sucrose did not affect taste perception/enhancement in gels with similar mechanical properties. In the case of fat, the mere presence of high-fat zones rather than the presence of concentration differences within a product might be the reason for the enhancement of mouthfeel and textural sensations elicited by fat. Results suggested that modulating the distribution of fat in such a way that the surface of the product has high-fat content would be enough to enhance the perception of fat-

| Chapter 8
126 |
related attributes. Results also suggested that the mouthfeel sensations induced during the initial stages of oral processing (i.e. first contacts of the product with oral tissues and first chews) might be decisive for the evaluation of fat-related attributes. This means that the overall perception of a product might be influenced by the first impression of a high-fat content.
The enhancement of fat-related attributes by an inhomogeneous distribution of fat depended on the overall fat content, as the enhancement at 15% fat was larger than that at 5% fat. The most probable reason for the lack of enhancement at 5% fat was the presence of layers without fat in the inhomogeneous sample 10/0/10/0. The absence of fat might have elicited completely different mouthfeel and textural sensations than that elicited by the other samples. This result supports the assumption that the mere presence of high-fat zones might be the reason for the enhancement of fat-related attributes. The fact that the overall sucrose content of inhomogeneous layered gels did not affect the enhancement of taste, whereas the overall fat content affected the enhancement of fat-related attributes reinforces the assumption that concentration differences enhance the perception of taste and fat through distinct mechanisms.
Furthermore, we aimed at quantifying the enhancement of fat-related sensory attributes and to determine the amount of fat that could be reduced by the modulation of the spatial distribution of fat. A homogeneous sample containing 20% fat was used for that purpose. The inhomogeneous samples with the largest fat concentration differences between layers (combination of layers containing 2 and 28% fat; overall fat content of 15%) had higher ratings of mouthfeel and afterfeel attributes than the 20% fat homogeneous sample. As the differences in attributes ratings between homogeneous samples containing 15 and 20% fat were not significant, a quantification of the enhancement was not possible. However, the differences in attributes ratings between the 15 and 20% fat homogeneous samples were smaller than the differences between the inhomogeneous samples composed of 2 and 28% fat layers and the 15% fat homogeneous sample. This indicates that the modulation of the spatial distribution of fat was more efficient in increasing the ratings of fat-related attributes than the increase in the overall fat content of the homogeneous sample.
In summary, the perception of fat-related sensory attributes can be enhanced by the presence of high-fat zones preferably on the surface of the product. Although the magnitude of the enhancement was not determined, results suggested that the

General discussion |
127 |
modulation of the distribution of fat can be used as a strategy to reduce fat in semi-solid products without compromising the sensorial quality. Impact of Concentration Differences of Food Components on the Overall Perception of Products
The fact that an inhomogeneous distribution of food components enhances sensory responses in different types of products supports the application of the inhomogeneity concept in commercial food products. The real application potential, however, will be determined by consumers. This thesis and other studies showed that large tastants concentration differences enhance taste intensity. Besides affecting the perception of taste, tastant concentration differences may also affect the overall perception of products. Therefore, the acceptability of products with inhomogeneous distributions of tastants was investigated. Our first step towards the determination of consumer acceptability was to determine the ability of consumers to perceive tastant concentration differences in inhomogeneous products (Chapters 2, 3 and 5). Untrained consumers were used in all studies. The rating measurements on a line scale performed in Chapter 2 indicated that sucrose concentration differences did not induce perceivable fluctuations of sweetness intensity in the inhomogeneous samples 20/0/20/0 and 40/0/40/0 in comparison to the homogeneous reference (10/10/10/10). In Chapter 3, frequency analysis indicated that inhomogeneous distributions of sucrose in the sample 40/0/40/0 induced larger fluctuations of sweetness intensity during time-intensity ratings than homogeneous distributions in the reference sample. In Chapter 5, 2-AFC tests were used to compare the perception of taste intensity fluctuations of gels, sausages and breads with homogeneous and inhomogeneous distributions. Inhomogeneous gels and breads showed more taste intensity fluctuations than the homogeneous products. Saltiness intensity fluctuations were not perceived in inhomogeneous sausages. Rating measurements (Chapter 2) did not indicate differences in taste intensity fluctuation between the inhomogeneous samples 20/0/20/0 and 40/0/40/0 and the homogeneous reference, while 2-AFC tests indicated taste fluctuation differences between these samples (Chapter 5). This confirms that the 2-AFC method is more sensitive to evaluate small differences between samples. Although the ability of consumers to perceive taste intensity fluctuations varied over the studies, taste enhancement by tastant concentration differences was consistently observed in all studies. These findings indicate that the perception of taste intensity fluctuations in products with inhomogeneous distributions of tastants does not affect the occurrence of taste enhancement. In other

| Chapter 8
128 |
words, taste enhancement by tastant concentration differences occurs with and without a conscious perception of taste intensity fluctuations. Similarly, the enhancement of taste by tastant concentration differences in liquids was shown to be independent of a conscious perception of taste intensity fluctuations48.
Our second step towards the determination of consumer acceptability was to determine the effect of tastant concentration differences on consumer preference of gels, breads and sausages (Chapter 5). Consumer preference was shown to be at least maintained or increased in products with inhomogeneous distributions of tastants in comparison to products with homogeneous distributions at the same overall tastant content. In the samples used in Chapter 5, taste intensity and the perception of taste intensity fluctuation varied simultaneously. As a consequence, we could not conclude whether the high preference for inhomogeneous products resulted from the perception of high taste intensities or from the perception of taste intensity fluctuations. Increases in sweetness and saltiness intensity are often related to increases in the preference, acceptance and pleasantness of food products14,
15. Therefore, the enhanced taste intensities that result from tastant concentration differences might be the parameter that drives consumer preference for inhomogeneous products. If this is the case, then we would expect an optimum magnitude of tastant concentration differences that enhances taste while raising consumer preference99. However, the perception of taste intensity fluctuations might also have contributed to the high preference for inhomogeneous products. We hypothesize that taste intensity fluctuations might have elicited unexpected sensations during the consumption of inhomogeneous product. As a result, inhomogeneous products might have been perceived as more palatable and more appealing to consumers. To determine the parameter that affects consumer preference (taste intensity or taste intensity fluctuations), pairs of products that have equal taste intensities but vary in the perception of taste intensity fluctuations should be compared on consumer preference. These pairs should be composed of homogeneous samples containing an overall tastant content higher than the inhomogeneous samples.
In summary, the results observed in Chapter 5 support the use of the inhomogeneity concept as a strategy to reduce sugar and salt in a variety of food products.

General discussion |
129 |
IMPLICATIONS AND RECOMMENDATIONS
The knowledge that sensory responses in semi-solids can be enhanced through the modulation of the spatial distribution of food components (e.g. sugar and fat) and the modulation of mechanical properties has implications in the design of healthier foods. When applying the inhomogeneity concept in commercial food products, the following points need to be taken into account.
An inhomogeneous distribution of sucrose was shown to allow for a sucrose reduction of up to 20% in gelled products (Chapter 2). The overall tastant reduction that can be achieved by the combination of the modulation of tastant spatial distribution and mechanical properties still needs to be determined. The fat reduction that can be achieved through the modulation of fat spatial distribution also needs to be determined. Therefore, the real contribution that the strategy based on the inhomogeneity concept can give to the decrease in tastant and fat intake needs to be investigated in more detail. Furthermore, the effect of repeated exposure on the enhancement of sensory responses by the inhomogeneity concept in semi-solids is unknown. The magnitude of aroma-induced taste enhancement in apple juice was shown to be reduced by repeated exposure (unpublished data). Therefore, the magnitude of the enhancement of taste and fat-related sensory attributes might also decrease with a continuous consumption of products with inhomogeneous distributions of tastants and fat. All this information is required to determine whether the reduction targets established by dietary guidelines can be achieved through the use of the inhomogeneity concept in semi-solids. It can be the case that the modulation of the spatial distribution of tastants and fat and modulation of mechanical properties need to be combined with other strategies, such as the use of replacers or enhancers.
Our results give evidence that the presence of high-tastant zones within a product does not compromise taste. Therefore, the inhomogeneity concept seems to be a strategy that minimizes the negative effects of sugar and salt reduction on the overall quality of products. However, the impact of inhomogeneous distributions of tastants on other attributes, such as texture and flavor, should be assessed. Variations of fat spatial distribution at a fixed overall fat content did not affect the perception of flavor and aftertaste attributes (Chapter 7). We suggest that a QDA panel can be used to characterize the sensory attributes of products varying in spatial distribution of tastants. We assume, however, that the overall quality is not compromised, since consumer preference was not negatively affected by an inhomogeneous distribution of

| Chapter 8
130 |
tastants in gels, breads and sausages (Chapter 5). Additionally, as sugar and salt contribute to the microbial stability of products, low-tastant zones within a product will be more sensitive to spoilage. Therefore, the spoilage pattern of products with inhomogeneous distributions of tastants should be determined to guarantee food safety.
From the technological perspective, the modulation of the distribution of tastants within a food matrix can be challenging. As shown in Chapter 2, the diffusion of tastants from high- to low-concentration zones is fast in products with high moisture content. Therefore, a feasible approach to control the spatial distribution of tastants in products that have long shelf-life still needs to be developed. In Chapter 6, we extended the approach to control the spatial distribution of tastants within a product by varying the distribution of sucrose in products composed of different parts (i.e. 4 cubes of gel or 4 spoons of custard dessert). In this way, sucrose diffusion between the different sucrose concentration zones was avoided. However, the time frame at which tastant concentration was varied during the consumption of the products did not lead to an enhancement of taste. Furthermore, the fact that the products were composed of different parts seems to have affected the evaluation of taste. To determine whether this extended approach is feasible to enhance taste, we suggest that the effect of variations of tastant concentration on taste perception should be investigated at different time scales, preferably in products that are perceived as a whole. In the case of modulation of fat distribution, fat concentration differences can be maintained for an extended period since fat droplets do not diffuse easily. Therefore, the knowledge about enhancement of fat-related sensory attributes by fat concentration differences acquired in this thesis is applicable without restrictions.
The modulation of the mechanical properties of a product is a straightforward task, as it can be achieved through variations in the product formulation. Reformulations should focus on the optimization of fracture strain, which is the fracture parameter that showed larger impact on taste perception. By designing products that disintegrate easily upon chewing, the perception of taste can be optimized. However, the mechanical properties of a product can only be varied to a certain extent. If the modulation of mechanical properties is exaggerated, the product will lose its textural characteristics and consumers might reject it. Therefore, it is necessary to determine the range at which the mechanical properties can be modulated without causing detrimental effects on the quality of the product.

General discussion |
131 |
CONCLUDING REMARKS
Inhomogeneous distributions of tastants at large concentration differences enhanced taste intensity in semi-solids. The frequency of high-intensity discontinuous stimulation of taste receptors was identified as the driving factor for taste enhancement by tastant concentration differences. The oral breakdown, which is affected mainly by fracture strain, and the mixing behavior are the parameters that influence the frequency of discontinuous stimulation and, consequently, taste enhancement. Furthermore, it was shown that the optimum frequency of high-intensity discontinuous stimulation required to maximize taste enhancement depends on the mechanical properties of the semi-solid product. The effect of salt spatial distribution on saltiness intensity was not investigated in this thesis. However, we assume that the knowledge about taste perception obtained in this thesis is also applicable to the enhancement of saltiness by salt concentration differences in semi-solids.
This thesis succeeded in identifying tastant concentration differences and fracture strain as factors that affect taste perception in semi-solids. The scheme shown in Figure 8.1 represents an overview of the relationship between spatial distribution of tastants, mechanical properties and taste perception as identified in this thesis. Our findings suggest that the spatial distribution of tastants and the mechanical properties (especially fracture strain) of the high-tastant zones can be modulated to optimize the frequency of discontinuous stimulation of taste receptors and to maximize taste enhancement. However, technological limitations related to the modulation of the distribution of tastants in the food matrix and the limited range at which the mechanical properties can be modified without compromising the characteristics of products should not be neglected.
The relationship between fat spatial distribution and the perception of fat-related sensory attributes was investigated in less detail than the relationship between sucrose spatial distribution and taste perception. Results indicated that the presence of high-fat zones preferably on the surface of a product rather than the presence of fat concentration differences within a product is the driving factor for the enhancement of fat-related attributes. These findings suggest that the perception of fat-related attributes can be maximized by the modulation of the spatial distribution of fat.
We conclude that the modulation of tastants and fat spatial distribution can be used as a strategy to reduce the contents of sugar, salt and fat in processed foods. However,

| Chapter 8
132 |
the total reduction that can be obtained through this strategy needs to be assessed in order to determine whether the targets for tastant and fat reduction can be achieved. The knowledge acquired in this thesis can contribute to the development of low-sugar, low-salt and low-fat food products with improved sensorial quality.
Figure 8.1. Identified relationship between spatial distribution of tastants, mechanical properties and taste perception.
Food product
Ingredients Spatial distribution of
tastantsLarge tastantconcentration
differences
Perception of taste
Taste enhancement-Breakdown
-Mixing -Release of tastants
Oral processingMechanical
properties Fracture strain Fragments with
low/high tastantconcentrationsFrequency of discontinuous stimulation of taste receptors
Processing

S ── Summary ──

| Summary
134 |
The need to reduce the consumption of sugar, salt and fat is a topic that has gained attention in the past years. As processed foods are substantial sources of sugar, salt and fat to the diet, food manufacturers are making great efforts in developing low-sugar, low-salt and low-fat food products that are highly appreciated by consumers. Reducing sugar, salt and fat, however, is not a straightforward task, since it has implications on the overall quality and on the palatability of food products.
This thesis aimed at identifying and understanding the factors that affect the perception of taste in semi-solid foods. The knowledge about the underlying factors of taste perception can be applied in the development of low-sugar and low-salt food products with improved sensorial quality. To achieve the proposed aim, the relationship between the spatial distribution of sucrose, the mechanical properties of semi-solid gels and the perception of taste was investigated. The relationship between the spatial distribution of fat and the perception of fat-related sensory attributes was also investigated.
The effect of modulation of the spatial distribution of sucrose on sweetness intensity was the first point addressed in this thesis (Chapter 2). The model system used for that purpose consisted of 4 layers of mixed agar-gelatin gels placed on top of each other. Layered gels varying in the distribution of sucrose (i.e. homogeneous and inhomogeneous distributions) were prepared by combining layers containing different concentrations of sucrose. All layered gels had the same overall sucrose content and similar mechanical properties. 2-Alternative Forced Choice (2-AFC) tests were carried out to compare the sweetness intensity of layered gels with homogeneous and inhomogeneous distributions of sucrose. It was observed that inhomogeneous gels with large sucrose concentration differences between layers were perceived significantly sweeter than gels in which sucrose was homogeneously distributed. A sucrose reduction of up to 20% could be achieved without compromising taste intensity. The results reported in Chapter 2 suggested that large tastant concentration differences within a product lead to a discontinuous stimulation of taste receptors and, consequently, to taste intensity enhancement. A partial recovery from taste receptor adaptation and accumulated serial phasic responses of receptors were suggested as the underlying mechanisms of taste enhancement. It was concluded that the inhomogeneity concept can be used as a reduction strategy in semi-solids without compromising the sensorial quality.
Summary |
135 |
The combined effect of modulation of the spatial distribution of sucrose and modulation of the mechanical properties of gels on sweetness intensity was the next topic investigated (Chapter 3). Three sets of homogeneous and inhomogeneous layered gels differing in mechanical properties (i.e. soft, medium and hard gels) were used for that purpose. Soft gels had low values of fracture strain and stress and broke down into a large number of fragments of small size upon chewing. Hard gels had high values of fracture strain and stress and broke down into a small number of fragments of large size. The sweetness of gels with homogeneous and inhomogeneous distributions of sucrose was compared using rating measurements, 2-AFC tests and time-intensity analysis. All rating methods showed that inhomogeneous gels were perceived significantly sweeter than the homogeneous gels belonging to the same texture category. This indicated that the enhancement of sweetness resulting from an inhomogeneous distribution of sucrose was not affected by the mechanical properties of the gel. However, the magnitude of taste enhancement was affected by the mechanical properties. The medium gel had a lower enhancement than the hard gel, while the soft gel did not differ significantly from medium and hard gels in terms of magnitude of taste enhancement. The temporal sweetness profile was also affected by the mechanical properties of the gels. The soft gel had the highest sweetness intensity (Imax), which tended to be perceived faster than in the other gels. The results reported in Chapter 3 suggested that the breakdown behavior of the gel during oral processing affects the perception of taste and the magnitude of taste enhancement. It was hypothesized that an increase in the total surface area of gel fragments formed upon chewing facilitates the contact of tastants with taste receptors. Consequently, taste is perceived in a short time and at high intensities. Results suggested that the conditions that maximize taste enhancement by inhomogeneous distributions of sucrose might depend on the mechanical properties of the product. Based on the results reported in Chapter 3, it was concluded that the inhomogeneity concept can be used in different food products. Furthermore, the effects of tastant spatial distribution and mechanical properties can be combined for an optimization of taste enhancement.
To gain a more detailed understanding of the effects of mechanical properties on taste perception and to decouple the effects of fracture strain and fracture stress, the formulation of the model system was optimized (Chapter 4). Inhomogeneous layered gels composed of 2 layers containing 0% sucrose and 2 layers containing 40% sucrose were used for that purpose. Four types of gels were prepared: 2 pairs of gels had 40% sucrose layers with similar fracture strain, but different fracture stress and 2 pairs of
| Summary
136 |
gels had 40% sucrose layers with similar stress, but different strain. The magnitude of variation of fracture strain and fracture stress was equivalent (i.e. 2 fold). The oral breakdown behavior, in-mouth mixing, sucrose release and taste perception were then investigated. In agreement with the results reported in Chapter 3, layered gels with low values of fracture strain and stress were perceived sweeter than gels with high values of fracture parameters. The results reported in Chapter 4 indicated that an increase in the total surface area of gel fragments formed upon chewing combined with an efficient mixing of fragments during bolus formation facilitate the release of tastants. Consequently, the contact of tastants with taste receptors is favored and taste perception is enhanced. Variations of fracture strain had larger effects on oral breakdown and on sweetness intensity than equivalent variations of fracture stress. Therefore, the modulation of the mechanical properties, which is only required in the parts of the inhomogeneous product that contain sucrose, should focus on the optimization of fracture strain.
The results reported in Chapters 2-4 gave evidence that taste intensity can be enhanced through the modulation of the spatial distribution of tastants. Consumer appreciation is an important determinant of the success of food products in the market. Therefore, the consumer preference of products with inhomogeneous distributions of tastants was the next point addressed in this thesis (Chapter 5). 2-AFC tests were carried out to compare the taste intensity, the perception of fluctuation of taste intensity and the preference of gels, breads and sausages with homogeneous and inhomogeneous distributions of tastants. Gel and sausage samples were composed of 4 layers containing different concentrations of sucrose and salt, respectively. Bread samples were composed of 2 cubes cut from the crumb of breads containing different concentrations of salt. Sweetness and saltiness enhancement resulting from tastant inhomogeneous distributions were observed in all products. Furthermore, the observed taste enhancement was shown to occur with and without a conscious perception of taste intensity fluctuations. Products with inhomogeneous distributions of tastants were equally or more preferred than products with homogeneous distributions at the same overall tastant content. The results observed in Chapter 5 support the application of the inhomogeneity concept as a reduction strategy in a variety of food products.
In the sensory studies described in Chapters 2-5, the products were placed in the mouth at once for the evaluation of taste. In this way, tastant concentration differences were experienced in a single bite (i.e. short time frame). Chapter 6

Summary |
137 |
described an extension of the approach used to modulate the spatial distribution of tastants within a product. Samples composed of sequences of 4 cubes of gel or 4 spoons of custard dessert were used to investigate the effect of tastant concentration differences experienced bite after bite on taste perception. In this extended approach, sucrose concentration was varied between the cubes of gel and spoons of custard. The overall sweetness intensity was assessed after the consumption of the entire sample (i.e. 4 cubes/spoons) using line scale ratings. The temporal sweetness profile was assessed during the evaluation of the sample using time-intensity ratings. Line scale ratings showed that the evaluation of the overall sweetness intensity was affected by the last stimulus tasted in the sequences of 4 cubes/spoons. This result indicated that the period that the stimuli were kept in the mouth and/or the intervals between consecutive stimuli were long. As a consequence, subjects based the evaluation of sweetness on the last cube/spoon. Time-intensity ratings did not show sweetness enhancement in the sequences of stimuli. The sweetness curves indicated that subjects evaluated each cube/spoon as an independent stimulus. The fact that the samples were composed of different parts (i.e. 4 cubes/spoons) might have induced subjects to evaluate each cube/spoon as an independent sample. It was concluded that the time frame at which tastant concentration is varied during the consumption of products is an important factor for the occurrence of taste enhancement. Furthermore, tastant concentration differences should be presented in a product that is perceived as a whole product rather than in a product composed of different parts.
In line with the concept of enhancement of sensory responses by concentration differences, the effect of modulation of the spatial distribution of fat on the perception of fat-related sensory attributes was investigated (Chapter 7). The model system developed for that purpose was composed of 4 layers of mixed agar-gelatin gels containing oil-in-water emulsion droplets (i.e. fat) dispersed in the gel matrix. Layered gels with homogeneous and inhomogeneous distributions of fat were prepared by combining 4 layers containing different concentrations of fat. All layered gels had the same overall fat content and similar mechanical properties. Quantitative Descriptive Analysis (QDA) was performed to characterize the sensory properties of gels with homogeneous and inhomogeneous distributions of fat. A significant enhancement of the mouthfeel attributes spreadable and melting was observed in samples with an inhomogeneous distribution of fat. Creaminess tended to increase along with fat concentration differences in inhomogeneous gels. The inhomogeneous gel with the largest fat concentration differences and with the high-fat layers

| Summary
138 |
positioned outside of the sample had the highest ratings for all fat-related mouthfeel and afterfeel attributes. Furthermore, the enhancement of fat-related attributes resulting from an inhomogeneous distribution of fat was larger at an overall fat content of 15% than at 5% fat. The results reported in Chapter 7 suggested that the presence of high-fat zones (preferably on the surface of the product) rather than the differences in fat concentration within the product might be the reason for the enhancement of fat-related sensory attributes. This means that inhomogeneous distributions of tastants and fat might enhance taste and fat-related attributes through distinct mechanisms. It was concluded that the modulation of the spatial distribution of fat can be used to reduce the fat content of food products without causing undesirable changes in the sensory properties.
The main findings and implications of this thesis were interpreted and discussed in Chapter 8. Tastant concentration differences and fracture strain were identified as the factors that affect taste perception in semi-solids. The observed taste enhancement was shown to be driven by the frequency of high-intensity discontinuous stimulation of taste receptors. The breakdown and mixing that occur during oral processing affect the release of tastants and, consequently, the frequency of receptor stimulation. Therefore, the optimum condition that maximizes the enhancement of taste by tastant concentration differences depends on the mechanical properties of the semi-solid product. These findings suggest that the spatial distribution of tastants and the mechanical properties (especially fracture strain) of the high-tastant zones can be modulated in such a way that the frequency of receptor stimulation is optimized and taste enhancement is maximized. The enhancement of fat-related sensory attributes was suggested to be driven by the presence of high-fat zones preferably on the surface of the product rather than by the presence of fat concentration differences within the product.
The modulation of the distribution of food components seems to be a promising strategy to reduce sugar, salt and fat in food products. However, the real contribution of this strategy to the decrease in tastants and fat intake needs to be investigated in more detail. Furthermore, more information is required on the effect of repeated exposure and on the effects of an inhomogeneous distribution of tastants on the perception of other sensory attributes (e.g. flavor, texture). Moreover, technological limitations, such as the diffusion of tastants and the limited range at which the mechanical properties can be modified, need to be taken into account before this strategy can be fully applied in the manufacturing of commercial food products.

S ── Samenvatting ──

| Samenvatting
140 |
De noodzaak om de consumptie van suiker, zout en vet te verminderen is een onderwerp dat in de afgelopen jaren steeds meer aandacht heeft gekregen. Kant-en-klare en samengestelde voedingsmiddelen zijn een belangrijke bron van suiker, zout en vet in het dieet. Daarom leveren de producenten van deze voedingsmiddelen een grote inspanning om laag-suiker, laag-zout en laag-vet producten te ontwikkelen die door de consument gewaardeerd worden. Echter de verlaging van suiker, zout en vet is geen eenvoudige taak omdat deze ingrediënten positief bijdragen aan de kwaliteit en kauwbaarheid van de voedingsmiddelen.
Dit proefschrift richt zich op het identificeren en begrijpen van de factoren die de smaak van vaste levensmiddelen beinvloeden. Deze kennis over de onderliggende factoren van smaakperceptie kan worden aangewend voor de ontwikkeling van laag-suiker, laag-zout en laag-vet producten met behoud van smaak. Om de bovenbeschreven doelstelling te behalen is onderzoek verricht naar het verband tussen de ruimtelijke verdeling van sucrose, de mechanische eigenschappen van vaste levensmiddelen en de smaakwaarneming van deze producten. Het verband tussen de ruimtelijke verdeling van vet en de waarneming van vetgerelateerde sensorische attributen is ook onderzocht.
Het eerste punt dat onderzocht werd in dit proefschrift (Hoofdstuk 2) is het effect van een ongelijke ruimtelijke verdeling van sucrose in het voedsel op de waargenomen zoetheid. Hiervoor werd een modelsysteem ontwikkeld dat bestaat uit vier op elkaar gestapelde lagen van een agar-gelatine gel. Gelaagde gelen met een verschillende distributie van sucrose (homogeen of inhomogeen verdeeld) werden gemaakt door het opstapelen van lagen met een verschillende sucroseconcentratie. Alle gelaagde gelen bevatten gemiddeld dezelfde hoeveelheid sucrose en alle hadden dezelfde mechanische eigenschappen. Een sensorische discriminatie test (2-Alternative Force Choice; 2-AFC) werd uitgevoerd om gelaagde gelen met een homogene en inhomogene sucroseverdeling met elkaar te vergelijken op zoetheid. De gelen met een inhomogene sucroseverdeling werden significant als zoeter waargenomen dan de gelen met een homogene sucroseverdeling. Bovendien was de zoetheid hoger naarmate de contrasten in sucroseconcentratie binnen de inhomogene gels groter was. Een sucroseverlaging van maximaal 20% werd verkregen zonder een waarneembaar verschil in de zoetintensiteit. De resultaten in Hoofdstuk 2 geven aanleiding aan te nemen dat (i) verschillen in smaakstofconcentratie in een product resulteren in een discontinue stimulering van de smaakreceptoren op de tong over tijd en plaats en, als gevolg daarvan, (ii) tot een smaakversterking die veroorzaakt wordt door de

Summary in Dutch |
141 |
bijzondere reactie van smaakreceptoren op discontinue smaakstimuli. Concluderend, het concept van de inhomogene ruimtelijke verdeling kan toegepast worden als een strategie om laag-suiker en laag-zout producten te ontwikkelen zonder afbreuk te doen aan de sensorische kwaliteit ervan.
Hoofdstuk 3 beschrijft het onderzoek naar het gecombineerde effect van variatie in de ruimtelijke verdeling van sucrose en variatie in de mechanische eigenschappen van de vaste levensmiddelen op de waarneming van zoet. Hiervoor werden drie sets van homogene en inhomogene gelaagde gelen ontwikkeld, die verschilden in hun mechanische eigenschappen (zachte, gemiddelde en harde gelen). De zachte gelen werden gekenmerkt door een lage vervorming en kracht bij breuk en vielen tijdens het kauwen uit elkaar in een groot aantal kleine fragmenten. Harde gelen vertoonden een hoge vervorming en kracht bij breuk en vielen tijdens het kauwen uit elkaar in een klein aantal grote fragmenten. De zoetheid van de gelen met een homogene en een inhomogene sucroseverdeling werden vergeleken middels twee sensorische meetmethoden: een 2-AFC test en tijd-intensiteit (TI) metingen. De sensorische scores lieten, overeenkomstig eerdere experimenten, zien dat de gelen met een inhomogene sucroseverdeling significant zoeter werden gevonden dan de gelen met een homogene sucroseverdeling (uit de groep met gelijke mechanische eigenschappen). Dit effect deed zich voor op ongeacht de mechanische eigenschappen van de gel. Echter, de mate waarin smaakversterking optrad was wel afhankelijk van de mechanische eigenschappen van de gel. De gel met gemiddelde hardheid vertoonde een lagere smaakversterking dan de harde gel. De mate van smaakversterking van de zachte gel verschilde niet significant van die van de gemiddelde en harde gel. Verder vertoonde de zachtste gel de hoogste zoetintensiteit (Imax), die ook sneller na blootstelling aan de stimulus waargenomen werd dan bij de andere gelen. De resultaten zoals beschreven in Hoofdstuk 3 geven aanleiding om te veronderstellen dat het breukgedrag van de gelen tijdens kauwen bepalend is voor de waarneming van smaak en de mate van smaakversterking door de inhomogene verdeling van de smaakstof: Bij gelijkblijvende sucrose concentraties zijn zachte gelen het zoetst en is de smaakversterking ten gevolge van inhomogene sucrose verdeling juist het sterkst voor harde gelen. De resultaten suggereren dat de condities waaronder de maximale smaakversterking door de inhomogene verdeling van de smaakstof bereikt wordt, bepaald worden door de mechanische eigenschappen van het product. Omdat de hardheid van de gelen het breukgedrag sterk beïnvloed doet dit vermoeden dat de toename in het totale oppervlak van de gelfragmenten gevormd

| Samenvatting
142 |
tijdens kauwen het contact tussen de smaakstoffen en smaakreceptoren vergemakkelijkt waardoor het effect van inhomogene sucrose concentraties op smaakversterking het beste tot zijn recht komt. Concluderend, de resultaten die in Hoofdstuk 3 worden beschreven laten zien dat de inhomogene ruimtelijke verdeling van smaakstoffen toegepast kan worden in verschillende levensmiddelen teneinde de smaakwaarneming te vergroten. Verder kunnen de effecten van de ruimtelijke verdeling van de smaakstoffen en de effecten van de mechanische eigenschappen op de smaakwaarneming gecombineerd worden om de smaakversterking verder te optimaliseren.
Om een meer gedetailleerd begrip te krijgen van de invloed van mechanische eigenschappen op de smaakwaarneming en om de effecten van kracht en vervorming bij breuk te ontrafelen, werd de samenstelling van het modelsysteem geoptimaliseerd (Hoofdstuk 4). Het inhomogene, gelaagde modelsysteem werd hiervoor opgebouwd uit twee lagen met 0% sucrose en twee lagen met 40% sucrose. Vier verschillende gelen werden ontwikkeld: twee paren waarin de lagen met 40% sucrose een gelijke vervorming bij breuk hadden, maar verschilden in de kracht bij breuk en twee paren waarin de lagen met 40% sucrose een gelijke kracht bij breuk hadden, maar verschilden in de vervorming bij breuk. De orde van grootte van de variatie in kracht en vervorming bij breuk waren gelijk voor beide grootheden (een factor twee verschil). Onderzoek werd verricht naar het uit elkaar vallen in fragmenten tijdens het kauwen, het mengen van deze fragmenten tijdens kauwen, de afgifte van sucrose en de waarneming van zoet. In overeenstemming met de resultaten beschreven in Hoofdstuk 3, werden de gelaagde gelen met lage waarden voor de kracht en vervorming bij breuk als zoeter waargenomen dan de gelen met hoge waarden voor kracht en vervorming bij breuk. De in Hoofdstuk 4 gerapporteerde resultaten laten zien dat een toename in het totale oppervlak van de gelfragmenten (gevormd tijdens het kauwen) gecombineerd met een efficiënte menging van deze fragmenten tijdens de vorming van de bolus bijdragen aan de afgifte van de smaakstoffen. Als een consequentie wordt het contact tussen de smaakstoffen en de smaakreceptoren verbeterd. De variaties in de vervorming bij breuk hadden een groter effect op het opbreken van de gelen tijdens het kauwen en op de smaakwaarneming dan gelijke variaties in de kracht bij breuk. De aanpassingen van de mechanische eigenschappen zijn alleen noodzakelijk in die lagen van de inhomogene gel, die de hoogste sucrose concentratie bevatten. Op basis van de bovenstaande resultaten wordt het aanbevolen om, voor het optimaliseren van smaakervaring bij gereduceerde
Summary in Dutch |
143 |
smaakstofconcentraties in voedsel, de optimalisatie van de mechanische eigenschappen van de gelen te richten op de vervorming bij breuk als de belangrijkste parameter.
De resultaten die in het Hoofdstukken 2-4 beschreven zijn, tonen aan dat smaakversterking bereikt kan worden door variatie in de ruimtelijke verdeling van smaakstoffen en het afstemmen van de mechanische eigenschappen van het voedsel op deze smaakstofverdeling. De consumentenacceptatie van deze aangepaste producten is doorslaggevend voor het succes van dergelijk levensmiddelen in de markt. Daarom werd de consumentenvoorkeur voor producten met een inhomogene smaakstofverdeling onderzocht (Hoofdstuk 5). De smaakintensiteit, de waarneming van de variatie in smaakintensiteit en de voorkeur van consumenten werden vergeleken tussen gelen, brood en vleeswaren, alle met een homogene en een inhomogene smaakstofverdeling. De monsters van gelen en de vleeswaren bestonden uit vier lagen met een verschillende concentratie sucrose (gelen) en zout (vleeswaren). De monsters brood werden samengesteld uit twee stukjes brood die uit de kruim van brood met een verschillend zoutgehalte werden gesneden. Versterking van de zoet- en zoutwaarneming als een gevolg van de inhomogene ruimtelijk verdeling van de smaakstof werd aangetoond in elk van de producten middels 2-AFC vergelijkingen tussen voedsel versies. Verder werd aangetoond dat de smaakversterking optreedt ongeacht of men zich bewust was van de smaakstofvariaties. De producten met een inhomogene ruimtelijk verdeling van de smaakstof werden door de consumenten evenveel of zelfs meer gewaardeerd dan de producten die homogeen verdeelde smaakstoffen bevatten. De resultaten beschreven in Hoofdstuk 5 laten zien dat de toepassing van inhomogene smaakstof verdeling een realistische strategie is om suiker en zout te verlagen in een breed palet aan levensmiddelen.
Tijdens de sensorische studies, beschreven in Hoofdstuk 2-5, werden de monsters (producten) in zijn geheel in de mond genomen voor de beoordeling van de zoet- of zoutintensiteit. Hierdoor werd de variatie in de smaakstof intensiteit waargenomen in deze ene hap (met andere woorden binnen een korte tijd). Hoofdstuk 6 beschrijft een uitbreiding van het concept van de inhomogene verdelingen van smaakstoffen tot variaties in smaakstofconcentratie tussen verschillende happen van een product. Om dit effect te onderzoeken werden twee modelsystemen gebruikt: vier blokjes van een gel en vier lepels van een vla (modelproduct). Middels deze aanbiedingsmethode werd de sucroseconcentratie gevarieerd tussen de gelblokjes of de lepels met vla. De algemene indruk van zoetintensiteit over opeenvolgende happen werd beoordeeld op

| Samenvatting
144 |
een lineaire schaal, na de consumptie van alle vier de gelblokjes of alle vier de lepels vla. Het profiel van de waargenomen zoetheid in de tijd werd bepaald met een tijd-intensiteit meting. De resultaten lieten zien dat de algemene zoetheid indruk werd bepaald door de laatst beoordeelde/geproefde stimulus in de serie van vier gelblokjes of lepels vla. Dit toont aan dat de periode dat de stimulus in de mond gehouden wordt en/of het interval tussen de stimuli zo lang waren dat de panelleden de algehele zoetheid van een serie happen vooral afstemmen op het laatste gelblokje of het laatste hapje vla. De tijd-intensiteit metingen vertoonden geen aanwijzingen voor smaakversterking. De curves voor de zoetheidintensiteit lieten zien dat de panelleden elk gelblokje of elke lepel vla beoordelen als een aparte stimulus. Ook het feit dat de monsters waren opgebouwd uit verschillende delen (gelblokjes of lepel) kunnen bijgedragen hebben aan het feit dat de panelleden elk gelblokje en elke lepel als een aparte stimulus beoordeeld hebben. Concluderend, de lengte van het tijdsinterval waarbinnen de verschillen in smaakstofconcentratie worden waargenomen is een belangrijke factor voor het optreden van smaakversterking. Mogelijk speelt het ook een rol of waargenomen opeenvolgingen van verschillende smaakintensiteiten aan hetzelfde product wordt toegeschreven of aan een reeks producten die duidelijk niet uit de zelfde verpakking afkomstig zijn. Om maximale smaakversterking te realiseren moeten de verschillen in de smaakstofintensiteiten afkomstig zijn van een product dat in een hap geconsumeerd wordt en niet in de verschillende happen.
Analoog aan het concept van smaakversterking door de inhomoge verdeling van de smaakstofconcentratie, werd het effect van de ruimtelijke verdeling van vet op de waarneming van vetgerelateerde sensorische attributen onderzocht (Hoofdstuk 7) op de mogelijkheid hiermee een reductie van vet te realiseren zonder negatieve consequenties voor de waargenomen producteigenschappen. Voor dit onderzoek werd een modelsysteem ontwikkeld dat bestond uit vier lagen van een agar-gelatine gel met emulsiedruppels (vet) ingebed in deze gel. Gelaagde gelen met een homogene en inhomogene vetverdeling werden gemaakt door gellagen met verschillende concentraties vet samen te voegen. Alle gelaagde gelen bevatten gelijke hoeveelheden vet en hadden gelijke mechanische eigenschappen. Een sensorische evaluatie middels Quantitative Descriptive Analysis (QDA) werd uitgevoerd om de sensorische eigenschappen van de gelaagde gelen met een homogene en inhomogene vetverdeling in kaart te brengen. Monsters met een inhomogene vetverdeling vertoonden een significante versterking van vet-gerelateerde eigenschappen als ‘smeerbaar’ en ‘smeltend’ ten opzichte van monsters met homogene vetverdelingen. Het kenmerk
Summary in Dutch |
145 |
‘romig’ nam in intensiteit toe met de toename in vetconcentratieverschillen in de inhomogene gelen. De hoogste scores voor alle vetgerelateerde mondgevoel- en nagevoelattributen werden behaald door het inhomogene monster met het hoogste concentratieverschil en de lagen, met name als de hoogste vetconcentratie zich aan de buitenzijde van het monster bevond. Het overal vetgehalte in het monster had een invloed op de versterking van de vetgerelateerde attributen: de versterking was groter voor de monsters met 15% vet dan voor het monster met 5% vet. De resultaten beschreven in Hoofdstuk 7 laten zien dat de aanwezigheid van lagen met een hoog vetgehalte aan het oppervlak van het monster een belangrijkere verklaring voor de waargenomen versterking is dan de concentratieverschillen in het monster. Dit betekent dat de versterking van sensorische waarnemingen door verschillen in de concentratie smaakstoffen en vet het gevolg zijn van een verschillend mechanisme. Concluderend, de controle over de ruimtelijke verdeling van vet in een product gebruikt kan worden om producten te ontwikkelen met een lager vetgehalte zonder dat de sensorische eigenschappen veranderen.
In Hoofdstuk 8 van dit proefschrift worden de belangrijkste vindingen en de gevolgen van de verschillende studies geïnterpreteerd en bediscussieerd. Verschillen in smaakstofconcentraties en de vervorming bij breuk werden geïdentificeerd als de factoren die van invloed zijn op de smaak van vaste producten. De waargenomen smaakversterking wordt bepaald door (i) de ruimtelijke en temporele frequentie waarmee plaatselijk hoge en lage concentraties van smaakstoffen op de tong elkaar afwisselen en (ii) de omvang van de smaakstof concentratie contrasten over tijd en plaats op de tong. Het opbreken van het product en het mengen van de gelfragmenten tijdens het kauwen bepalen de wijze waarop smaakstoffen vrijkomen over de tijd en als gevolg daarvan de frequentie van de wisselende stimulatie van de smaakreceptoren. De optimale conditie die leidt tot maximale smaakversterking door de inhomogene verdeling van smaakstoffen wordt mede bepaalt door de mechanische eigenschappen van de het vaste product. Als discontinue smaakstof verdeling in het product aan de basis staat van smaakversterking dan moeten de breukeigenschappen van het product zo gestuurd worden dat de frequentie van de stimulatie van de smaakreceptoren optimaal is ten gevolge van blootstelling aan lagen/zones met een hoge en lage smaakstofconcentratie. De versterking van de vetgerelateerde attributen wordt verondersteld meer het gevolg te zijn van de aanwezigheid van zones met een hoog vetgehalte (bij voorkeur aan het oppervlak) dan van de aanwezigheid van concentratieverschillen in het product.

| Samenvatting
146 |
De controle over de ruimtelijke (inhomogene) verdeling van ingrediënten lijkt een veelbelovende strategie te zijn om suiker, zout en vet te verlagen voedingsmiddelen. Echter de werkelijke bijdrage van deze strategie aan de verlaging van de consumptie van smaakstoffen en vet moet nog verder onderzocht worden. Verder moet er nog meer onderzoek verricht worden naar het effect van herhaalde blootstelling aan inhomogene smaakstof verdelingen op de waarneming van andere sensorische attributen, zoals smaak en textuur. Tot slot zijn er nog de technologische uitdagingen, zoals de diffusie van de smaakstoffen in het product die leiden tot een homogenisatie van smaakstof verdelingen en de beperkte variatie die in de mechanische eigenschappen aangebracht kunnen worden zonder dat het product niet meer als gewoonlijk herkend wordt. Elk van deze aspecten moet meegewogen worden voordat de beschreven smaak en textuur optimalisatie strategieën werkelijk toegepast kan worden in productie van commerciële voedingsmiddelen.

R ── References ──

| References
148 |
1. WHO. (1990). Diet, nutrition and the prevention of chronic diseases. WHO Technical Report Series No. 797; World Health Organization: Geneva.
2. WHO. (2003). Diet, nutrition, and the prevention of chronic diseases. Report of a Joint WHO/FAP Expert Consultation. WHO Technical Report Series No. 916; World Health Organization: Geneva.
3. WHO. (2007). Reducing salt intake in populations. Report of a WHO Forum and Technical Meeting. WHO Document Production Services; World Health Organization: Geneva.
4. Ruusunen, M.; Vainionpää, J.; Puolanne, E.; Lyly, M.; Lähteenmäki, L.; Niemistö, M.; Ahvenainen, R. (2003). Physical and sensory properties of low-salt phosphate-free frankfurters composed with various ingredients. Meat Science, 63, 9-16.
5. Zoulias, E. I.; Piknis, S.; Oreopoulou, V. (2000). Effect of sugar replacement by polyols and acesulfame-K on properties of low-fat cookies. Journal of the Science of Food and Agriculture, 80, 2049-2056.
6. Lynch, E. J.; Dal Bello, F.; Sheehan, E. M.; Cashman, K. D.; Arendt, E. K. (2009). Fundamental studies on the reduction of salt on dough and bread characteristics. Food Research International, 42, 885-891.
7. Rogers, N. R.; Drake, M. A.; Daubert, C. R.; McMahon, D. J.; Bletsch, T. K.; Foegeding, E. A. (2009). The effect of aging on low-fat, reduced-fat, and full-fat Cheddar cheese texture. Journal of Dairy Science, 92, 4756-4772.
8. Drake, M. A.; Miracle, R. E.; McMahon, D. J. (2010). Impact of fat reduction on flavor and flavor chemistry of Cheddar cheeses. Journal of Dairy Science, 93, 5069-5081.
9. Brighenti, M.; Govindasamy-Lucey, S.; Lim, K.; Nelson, K.; Lucey, J. A. (2008). Characterization of the rheological, textural, and sensory properties of samples of commercial US cream cheese with different fat contents. Journal of Dairy Science, 91, 4501-4517.
10. De Wijk, R. A.; van Gemert, L. J.; Terpstra, M. E. J.; Wilkinson, C. L. (2003). Texture of semi-solids; sensory and instrumental measurements on vanilla custard desserts. Food Quality and Preference, 14, 305-317.
11. Lee, H. C.; Chin, K. B. (2011). Evaluation of various salt levels and different dairy proteins in combination with microbial transglutaminase on the quality characteristics of restructured pork ham. International Journal of Food Science & Technology, 46, 1522-1528.
12. Ruusunen, M.; SÁrkkÁ-Tirkkonen, M.; Puolanne, E. (1999). The effect of salt reduction on taste pleasantness in cooked Bologna-type'sausages. Journal of Sensory Studies, 14, 263-270.
13. Zandstra, E. H.; de Graaf, C.; Mela, D. J.; Van Staveren, W. A. (2000). Short- and long-term effects of changes in pleasantness on food intake. Appetite, 34, 253-260.
14. Drewnowski, A.; Nordensten, K.; Dwyer, J. (1998). Replacing sugar and fat in cookies: impact on product quality and preference. Food Quality and Preference, 9, 13-20.
15. Guinard, J. X.; Zoumas-Morse, C.; Mori, L.; Panyam, D.; Kilara, A. (1996). Effect of sugar and fat on the acceptability of vanilla ice cream. Journal of Dairy Science, 79, 1922-1927.
16. Alonso, S.; Setser, C. (1994). Functional replacements for sugars in foods. Trends in Food Science & Technology, 5, 139-146.
17. Arola, L.; Bonet, M. L.; Delzenne, N.; Duggal, M. S.; Gómez-Candela, C.; Huyghebaert, A.; Laville, M.; Lingström, P.; Livingstone, B.; Palou, A.; Picó, C.; Sanders, T.; Schaafsma, G.; Van Baak, M.; Van Loveren, C.; Van Schothorst, E. M. (2009). Summary and general conclusions/outcomes on the role and fate of sugars in human nutrition and health. Obesity Reviews, 10, 55-58.
18. Ruxton, C. H. S.; Gardner, E. J.; McNulty, H. M. (2009). Is sugar consumption detrimental to health? A review of the evidence 1995-2006. Critical Reviews in Food Science and Nutrition, 50, 1-19.
19. Lindemann, B. (1997). Sodium taste. Current Opinion in Nephrology and Hypertension, 6, 425-429. 20. MacGregor, G. A. (1997). Salt: more adverse effects. American Journal of Hypertension, 10, 37S-41S.

References |
149 |
21. James, W. P.; Ralph, A.; Sanchez-Castillo, C. (1987). The dominance of salt in manufactured food in the sodium intake of affluent societies. The Lancet, 329, 426-429.
22. Mattes, R. D.; Donnelly, D. (1991). Relative contributions of dietary sodium sources. Journal of the American College of Nutrition, 10, 383-93.
23. Joossens, J. V.; Sasaki, S.; Kesteloot, H. (1994). Bread as a source of salt: an international comparison. Journal of the American College of Nutrition, 13, 179-83.
24. Schiffman, S. S.; Booth, B. J.; Losee, M. L.; Pecore, S. D.; Warwick, Z. S. (1995). Bitterness of sweeteners as a function of concentration. Brain research bulletin, 36, 505-513.
25. Verma, A. K.; Banerjee, R. (2011). Low-sodium meat products: retaining salty taste for sweet health. Critical Reviews in Food Science and Nutrition, 52, 72-84.
26. Gillette, M. (1985). Flavor effects of sodium chloride. Food Technolology, 6, 47-52. 27. Desmond, E. (2006). Reducing salt: a challenge for the meat industry. Meat Science, 74, 188-196. 28. Doyle, M. E.; Glass, K. A. (2010). Sodium reduction and its effect on food safety, food quality,
and human health. Comprehensive Reviews in Food Science and Food Safety, 9, 44-56. 29. Sandrou, D. K.; Arvanitoyannis, I. S. (2000). Low-fat/calorie foods: current state and
perspectives. Critical Reviews in Food Science and Nutrition, 40, 427-447. 30. Bertino, M.; Beauchamp, G. K.; Engelman, K. (1982). Long-term reduction in dietary sodium
alters the taste of salt. American Journal of Clinical Nutrition, 36, 1134-1144. 31. Bertino, M.; Beauchamp, G. K.; Engelman, K. (1986). Increasing dietary salt alters salt taste
preference. Physiology & Behavior, 38, 203-213. 32. Kim, G. H.; Lee, H. M. (2009). Frequent consumption of certain fast foods may be associated
with an enhanced preference for salt taste. Journal of Human Nutrition and Dietetics, 22, 475-480. 33. Blais, C.; Pangborn, R.; Borhani, N.; Ferrell, M.; Prineas, R.; Laing, B. (1986). Effect of dietary
sodium restriction on taste responses to sodium chloride: a longitudinal study. The American Journal of Clinical Nutrition, 44, 232-243.
34. Girgis, S.; Neal, B.; Prescott, J.; Prendergast, J.; Dumbrell, S.; Turner, C.; Woodward, M. (2003). A one-quarter reduction in the salt content of bread can be made without detection, 57, 616-620.
35. Bolhuis, D. P.; Temme, E. H. M.; Koeman, F. T.; Noort, M. W. J.; Kremer, S.; Janssen, A. M. (2011). A salt reduction of 50% in bread does not decrease bread consumption or increase sodium intake by the choice of sandwich fillings. The Journal of Nutrition, 141, 2249-2255.
36. Dötsch, M.; Busch, J.; Batenburg, M.; Liem, G.; Tareilus, E.; Mueller, R.; Meijer, G. (2009). Strategies to reduce sodium consumption: a food industry perspective. Critical Reviews in Food Science and Nutrition, 49, 841-851.
37. Bult, J. H. F.; de Wijk, R. A.; Hummel, T. (2007). Investigations on multimodal sensory integration: texture, taste, and ortho- and retronasal olfactory stimuli in concert. Neuroscience Letters, 411, 6-10.
38. Small, D.; Prescott, J. (2005). Odor/taste integration and the perception of flavor. Experimental Brain Research, 166, 345-357.
39. Frank, R. A.; Byram, J. (1988). Taste-smell interactions are tastant and odorant dependent. Chemical Senses, 13, 445-455.
40. Stevenson, R. J.; Prescott, J.; Boakes, R. A. (1999). Confusing tastes and smells: how odours can influence the perception of sweet and sour tastes. Chemical Senses, 24, 627-635.
41. Lawrence, G.; Salles, C.; Palicki, O.; Septier, C.; Busch, J.; Thomas-Danguin, T. (2011). Using cross-modal interactions to counterbalance salt reduction in solid foods. International Dairy Journal, 21, 103-110.
42. Schifferstein, H. N. J.; Verlegh, P. W. J. (1996). The role of congruency and pleasantness in odor-induced taste enhancement. Acta Psychologica, 94, 87-105.
43. Djordjevic, J.; Zatorre, R. J.; Jones-Gotman, M. (2004). Odor-induced changes in taste perception. Experimental Brain Research, 159, 405-408.
| References
150 |
44. Knoop, J. E.; Bult, J. H. F.; Stieger, M.; Smit, G. (submitted). Gustatory and olfactory interactions enhance taste perception in a complex beverage.
45. Knoop, J. E.; Bult, J. H. F.; Stieger, M.; Smit, G., (submitted). Masking off-flavours in apple juice induced by sweetness enhancing component ethylhexanoate.
46. Lawrence, G.; Salles, C.; Septier, C.; Busch, J.; Thomas-Danguin, T. (2009). Odour-taste interactions: a way to enhance saltiness in low-salt content solutions. Food Quality and Preference, 20, 241-248.
47. Meiselman, H. L.; Halpern, B. P. (1973). Enhancement of taste intensity through pulsatile stimulation. Physiology & Behavior, 11, 713-716.
48. Burseg, K. M. M.; Brattinga, C.; de Kok, P. M. T.; Bult, J. H. (2010). Sweet taste enhancement through pulsatile stimulation depends on pulsation period not on conscious pulse perception. Physiology & Behavior, 100, 327-331.
49. Busch, J. L. H. C.; Tournier, C.; Knoop, J. E.; Kooyman, G.; Smit, G. (2009). Temporal contrast of salt delivery in mouth increases salt perception. Chemical Senses, 34, 341-348.
50. Pangborn, R. M.; Trabue, I. M.; Szczesniak, A. S. (1973). Effect of hydrocolloids on oral viscosity and basic taste intensities. Journal of Texture Studies, 4, 224-241.
51. Baines, Z. V.; Morris, E. R. (1987). Flavour/taste perception in thickened systems: the effect of guar gum above and below c*. Food Hydrocolloids, 1, 197-205.
52. Cook, D. J.; Hollowood, T. A.; Linforth, R. S. T.; Taylor, A. J. (2002). Perception of taste intensity in solutions of random-coil polysaccharides above and below c*. Food Quality and Preference, 13, 473-480.
53. Tournier, C.; Sulmont-Rossé, C.; Sémon, E.; Vignon, A.; Issanchou, S.; Guichard, E. (2009). A study on texture-taste-aroma interactions: physico-chemical and cognitive mechanisms. International Dairy Journal, 19, 450-458.
54. Boland, A. B.; Delahunty, C. M.; van Ruth, S. M. (2006). Influence of the texture of gelatin gels and pectin gels on strawberry flavour release and perception. Food Chemistry, 96, 452-460.
55. Bayarri, S.; Rivas, I.; Izquierdo, L.; Costell, E. (2007). Influence of texture on the temporal perception of sweetness of gelled systems. Food Research International, 40, 900-908.
56. Costell, E.; Peyrolon, M.; Duran, L. (2000). Influence of texture and type of hydrocolloid on perception of basic tastes in carrageenan and gellan gels. Food Science and Technology International, 6, 495-499.
57. Verhagen, J. V.; Engelen, L. (2006). The neurocognitive bases of human multimodal food perception: sensory integration. Neuroscience & Biobehavioral Reviews, 30, 613-650.
58. Hollowood, T. A.; Linforth, R. S. T.; Taylor, A. J. (2002). The effect of viscosity on the perception of flavour. Chemical Senses, 27, 583-591.
59. Brossard, C. D.; Lethuaut, L.; Boelrijk, A. E. M.; Mariette, F.; Genot, C. (2006). Sweetness and aroma perceptions in model dairy desserts: an overview. Flavour and Fragrance Journal, 21, 48-52.
60. Koliandris, A.; Lee, A.; Ferry, A. L.; Hill, S.; Mitchell, J. R. (2008). Relationship between structure of hydrocolloid gels and solutions and flavour release. Food Hydrocolloids, 22, 623-630.
61. Gierczynski, I.; Guichard, E.; Laboure, H. (2011). Aroma perception in dairy products: the roles of texture, aroma release and consumer physiology. A review. Flavour and Fragrance Journal, 26, 141-152.
62. Hutchings, J. B.; Lillford, P. J. (1988). The perception of food texture - the philosophy of the breakdown path. Journal of Texture Studies, 19, 103-115.
63. Prinz, J. F.; Lucas, P. W. (1997). An optimization model for mastication and swallowing in mammals. Proceedings of the Royal Society of London. Series B: Biological Sciences, 264, 1715-1721.
64. Ferry, A. L.; Hort, J.; Mitchell, J. R.; Cook, D. J.; Lagarrigue, S.; Valles Pamies, B. (2006). Viscosity and flavour perception: why is starch different from hydrocolloids? Food Hydrocolloids, 20, 855-862.

References |
151 |
65. Ferry, A. L. S.; Mitchell, J. R.; Hort, J.; Hill, S. E.; Taylor, A. J.; Lagarrigue, S.; Vallès-Pàmies, B. (2006). In-mouth amylase activity can reduce perception of saltiness in starch-thickened foods. Journal of Agricultural and Food Chemistry, 54, 8869-8873.
66. Morris, E. R. (1994). Rheological and organoleptic properties of food hydrocolloids. In Food hydrocolloids: structure, properties, and functions. Nishinari, K.; Doi, E. (Eds.). Plenum Press: New York, pp 201-210.
67. Drewnowski, A.; Almiron-Roig, E. (2010). Human perceptions and preferences for fat-rich foods. In Fat Detection: Taste, Texture, and Post Ingestive Effects. Montmayeur, J. P.; le Coutre, J. (Eds.) CRC Press: Boca Raton.
68. Drewnowski, A. (1992). Sensory properties of fats and fat replacements. Nutrition Reviews, 50, 17-20.
69. Keeton, J. T. (1994). Low-fat meat products-technological problems with processing. Meat Science, 36, 261-276.
70. Vickers, Z.; Mullan, L. (1997). Liking and consumption of fat-free and full-fat cheese. Food Quality and Preference, 8, 91-95.
71. Lucca, P. A.; Tepper, B. J. (1994). Fat replacers and the functionality of fat in foods. Trends in Food Science & Technology, 5, 12-19.
72. De Wijk, R. A., Rasing, F., Wilkinson, C. L. (2003). Texture of semi-solids: sensory flavor-texture interactions for custard desserts. Journal of Texture Studies, 34,131-146. 73. Knoop, J. E.; Sala, G.; Bult, J. H. F.; Smit, G.; Stieger, M. (submitted). Aroma influences texture
perception of cheeses and dairy model gels. 74. Murphy, C.; Cain, W. S.; Bartoshuk, L. M. (1977). Mutual action of taste and olfaction. Sensory
Processes, 1, 204-211. 75. Murphy, C.; Cain, W. S. (1980). Taste and olfaction: independence vs interaction. Physiology &
Behavior, 24, 601-605. 76. Cliff, M.; Noble, A. C. (1990). Time-intensity evaluation of sweetness and fruitiness and their
interaction in a model solution. Journal of Food Science, 55, 450-454. 77. Lavin, J. G.; Lawless, H. T. (1998). Effects of color and odor on judgments of sweetness among
children and adults. Food Quality and Preference, 9, 283-289. 78. Wilson, C. E.; Brown, W. E. (1997). Influence of food matrix structure and oral breakdown
during mastication on temporal perception of flavor. Journal of Sensory Studies, 12, 69-86. 79. Pangborn, R. M.; Gibbs, Z. M.; Tassan, C. (1978). Effect of hydrocolloids on apparent viscosity
and sensory properties of selected beverages. Journal of Texture Studies, 9, 415-436. 80. Meiselman, H. L. (1972). Human taste perception. Critical Reviews in Food Technology, 3, 89-119. 81. Meiselman, H. L.; Buffington, C. (1980). Effects of filter paper stimulus application on gustatory
adaptation. Chemical Senses, 5, 273-277. 82. Theunissen, M. J. M.; Polet, I. A.; Kroeze, J. H. A.; Schifferstein, H. N. J. (2000). Taste
adaptation during the eating of sweetened yogurt. Appetite, 34, 21-27. 83. Theunissen, M. J. M.; Kroeze, J. H. A. (1996). Mouth movements diminish taste adaptation, but
rate of mouth movement does not affect adaptation. Chemical Senses, 21, 545-551. 84. Theunissen, M. J. M.; Kroeze, J. H. A.; Schifferstein, H. N. J. (2000). Method of stimulation,
mouth movements, concentration and viscosity: effects on the degree of taste adaptation. Perception and Psychophysics, 62, 607-614.
85. Peleg, M. (1984). A note on the various strain measures at large compressive deformations. Journal of Texture Studies, 15, 317-326.
86. McCullagh, P.; Nelder, J. A. (1983). Generalized linear models. Chapman & Hall: London. 87. Bayarri, S.; Durán, L.; Costell, E. (2003). Compression resistance, sweetener's diffusion and
sweetness of hydrocolloids gels. International Dairy Journal, 13, 643-653.

| References
152 |
88. Bayarri, S.; Izquierdo, L.; Durán, L.; Costell, E. (2006). Effect of addition of sucrose and aspartame on the compression resistance of hydrocolloids gels. International Journal of Food Science and Technology, 41, 980-986.
89. Whittaker, L. E.; Al-Ruqaie, I. M.; Kasapis, S.; Richardson, R. K. (1997). Development of composite structures in the gellan polysaccharide/system. Carbohydrate Polymers, 33, 39-46.
90. Bayarri, S.; Durán, L.; Costell, E. (2004). Influence of sweeteners on the viscoelasticity of hydrocolloids gelled systems. Food Hydrocolloids, 18, 611-619.
91. Normand, V.; Aymard, P.; Lootens, D. L.; Amici, E.; Plucknett, K. P.; Frith, W. J. (2003). Effect of sucrose on agarose gels mechanical behaviour. Carbohydrate Polymers, 54, 83-95.
92. Friedman, L. (1930). Structure of agar gels from studies of diffusion. Journal of the American Chemical Society, 52, 1311-1314.
93. Schantz, E. J.; Lauffer, M. A. (1962). Diffusion measurements in agar gel. Biochemistry, 1, 658-663.
94. Holm, K.; Wendin, K.; Hermansson, A. M. (2009). Sweetness and texture perceptions in structured gelatin gels with embedded sugar rich domains. Food Hydrocolloids, 23, 2388-2393.
95. Smith, D. V.; Bealer, S. L.; van Buskirk, R. L. (1978). Adaptation and recovery of the rat chorda tympani response to NaCl. Physiology & Behavior, 20, 629-636.
96. Noort, M. W. J.; Bult, J. H. F.; Stieger, M.; Hamer, R. J. (2010). Saltiness enhancement in bread by inhomogeneous spatial distribution of sodium chloride. Journal of Cereal Science, 52, 378-386.
97. Van den Berg, L.; van Vliet, T.; van der Linden, E.; van Boekel, M. A. J. S.; van de Velde, F. (2008). Physical properties giving the sensory perception of whey proteins/polysaccharide gels. Food Biophysics, 3, 198-206.
98. Cooley, J. W.; Tukey, J. W. (1965). An algorithm for the machine calculation of complex Fourier series. Mathematics of Computation, 19, 297-301.
99. Noort, M. W. J.; Bult, J. H. F.; Stieger, M. (2012). Saltiness enhancement by taste contrast in bread prepared with encapsulated salt. Journal of Cereal Science, 55, 218-225.
100. Mills, T.; Spyropoulos, F.; Norton, I. T.; Bakalis, S. (2011). Development of an in-vitro mouth model to quantify salt release from gels. Food Hydrocolloids, 25, 107-113.
101. Sokmen, A.; Gunes, G. (2006). Influence of some bulk sweeteners on rheological properties of chocolate. LWT - Food Science and Technology, 39, 1053-1058.
102. Güven, M.; Karaca, O. B. (2002). The effects of varying sugar content and fruit concentration on the physical properties of vanilla and fruit ice-cream-type frozen yogurts. International Journal of Dairy Technology, 55, 27-31.
103. Moskowitz, H. R.; Kluter, R. A.; Westerling, J.; Jacobs, H. L. (1974). Sugar sweetness and pleasantness: evidence for different psychological laws. Science, 184, 583-585.
104. Hyde, R. J.; Witherly, S. A. (1993). Dynamic contrast: a sensory contribution to palatability. Appetite, 21, 1-16.
105. Neath, I. (1993). Distinctiveness and serial position effects in recognition. Memory & Cognition, 21, 689-698.
106. Glanzer, M.; Cunitz, A. R.. (1966). Two storage mechanisms in free recall. Journal of Verbal Learning and Verbal Behavior, 5, 351-360.
107. Reed, P. (2000). Rats’ memory for serially presented flavors: effects of interstimulus interval and generalization decrement. Learning & Behavior, 28, 136-146.
108. Melchor-Hipólito, B.; Meza-Reynoso, G.; Juárez-Maldonado, C.; Ortega-Saavedra, G.; Cruz-Morales, S.; Arriaga-Ramírez, J. (2010). Serial position effects in social transmission of food preference: retention/demonstration intervals. Learning & Behavior, 38, 80-86.
109. Sala, G.; de Wijk, R. A.; van de Velde, F.; van Aken, G. A. (2008). Matrix properties affect the sensory perception of emulsion-filled gels. Food Hydrocolloids, 22, 353-363.

References |
153 |
110. Kim, K. H.; Gohtani, S.; Yamano, Y. (1996). Effects of oil droplets on physical and sensory properties of O/W emulsion agar gel. Journal of Texture Studies, 27, 655-670.
111. Sala, G.; van Vliet, T.; Stuart, M. A. C.; van de Velde, F.; van Aken, G. A. (2009). Deformation and fracture of emulsion-filled gels: effect of gelling agent concentration and oil droplet size. Food Hydrocolloids, 23, 1853-1863.
112. Sala, G.; van Vliet, T.; Stuart, M. A. C.; van Aken, G. A.; van de Velde, F. (2009). Deformation and fracture of emulsion-filled gels: effect of oil content and deformation speed. Food Hydrocolloids, 23, 1381-1393.
113. Van den Berg, L.; van Vliet, T.; van der Linden, E.; van Boekel, M. A. J. S.; van de Velde, F. (2007). Breakdown properties and sensory perception of whey proteins/polysaccharide mixed gels as a function of microstructure. Food Hydrocolloids, 21, 961-976.
114. Sala, G.; van de Velde, F.; Stuart, M. A. C.; van Aken, G. A. (2007). Oil droplet release from emulsion-filled gels in relation to sensory perception. Food Hydrocolloids, 21, 977-985.
115. Kim, K. H.; Gohtani, S.; Matsuno, R.; Yamano, Y. (1999). Effects of oil droplet and agar concentration on gel strength and microstructure of O/W emulsion gel. Journal of Texture Studies, 30, 319-335.
116. De Wijk, R. A.; Prinz, J. F.; Janssen, A. M. (2006). Explaining perceived oral texture of starch-based custard desserts from standard and novel instrumental tests. Food Hydrocolloids, 20, 24-34.
117. Lindemann, B. (2001). Receptors and transduction in taste. Nature, 413, 219-225.


A ── Acknowledgements ──

| Acknowledgements
156 |
Looking at this thesis gives me a good “MISSION ACCOMPLISHED” feeling. It is extremely rewarding to see the outcome of 4 years of work put together! This thesis, however, is not the result of only my efforts. I was very fortunate to have wonderful people around me, giving a direct or an indirect support through these past 4 years. I hope I was able to express my gratitude at the moment that I received every little bit of help.
Dear supervisors, Tiny van Boekel, Markus Stieger and Fred van de Velde. You are important contributors to my accomplishments. I really appreciated the way you supervised my PhD project. You gave me freedom to make my own decisions and you were always available to give support and advice. Thanks a lot! Harold Bult, you were not my official supervisor, but in several occasions you behaved as if you were. Thanks for all the statistical support and for always being willing to discuss the design of my experiments and results.
I am very grateful for all the contributions that I have received from my colleagues from the TIFN project ‘Texture-Taste Interactions’. Our collaboration was very fruitful and led to nice results. I also want to thank other TIFN colleagues for their input and for their interest in my project. Harmen, thanks for always being willing to talk and to give advice.
I always felt very welcome at the Product Design and Quality Management group, by my fellow PhD students and by the staff. Thanks everybody! Dear participants of the PhD tour to Australia, thanks for making that trip so special! Girls from Food Physics, thanks for the nice talks!
I am very grateful for all the assistance that I received at Nizo during the 4 years that I spent there performing my experiments. Thanks everybody for being willing to share your knowledge and experience with me. Roelie and Celine, thanks for your friendship and for all your help! Jan, thanks for always being willing to give instructions and explanations! I am also very grateful for the assistance that I received during the execution of my sensory studies at A&F and Essensor. I am sure that nobody will forget my layered gels… I want to give a special thanks to the students that I supervised: Julie Cuvillier, João Rocha, Jiana Rens, Jennifer Rey and Amarachi Iwuagwu. Thanks for your enthusiasm and motivation! The results of your work contributed a lot to my thesis.
I also would like to thank Christian Salles and his group at Inra for receiving me as a guest researcher. Merci!

Acknowledgements |
157 |
Guido and Dilek, more than paranymphs you are true friends. Guido, you became a friend, a guide, a teaser. Thanks for all the professional and personal support. Grazie! Dilek, I am glad we were selected to organize the P2 day together! I really enjoyed the time we spent together and all ours talks about work, life, future etc. Teşekkürler canim!
Ellen, Xiao, Sven, Sara, Onur, Janine, Cathrine, Kerstin, Erika, Mary, Kristin, Van-Anh, Anne, Raimon, Ladka, Agnieszka, thanks for your friendship! I have lots of nice memories of the moments we spent together. Dieuwerke, I really enjoyed your company at the conferences and all our nice talks! Oylum, canim! You are a very special friend and I am glad we could spend time as housemates. Thanks for always being there when I needed. Teşekkürler a thousand times! Paco, thanks a lot for always being willing to help. Muchas gracias! Turkish guys, teşekkürler! Hazi, shokran!
Queridos amigos brasileiros, muito obrigada pelo carinho e pela amizade! Sandrinha, Laris, Anabele, Cinara, Carol Silva, Murilo, Vanjinha, Uli, Saulo, Larissa, Mari Melo, Pri Sabadin, Carli, Marcela, Angel, Carlos, Davi e muitos outros que conheci em Wagenigen, vocês contribuiram para que esses 4 anos fossem super especiais.
Familia querida, pai, mãe, Carina e Yuri, o amor e o apoio de vocês me ajudam a seguir buscando meus objetivos. Vocês fazem parte de todas as minhas conquistas! Muito obrigada por tudo!
▬ Carol ▬


A ── About the author ──

| Curriculum vitae
160 |
Ana Carolina Mosca was born on January 20th, 1981 in Itu, São Paulo, Brazil. After completing secondary school at ‘Escola Técnica Estadual Conselheiro Antonio Prado’ (Campinas, BR), she started the Bachelor’s program Food Engineering at Universidade Estadual de Campinas (UNICAMP) (Campinas, BR). During her BSc studies, Carol did a 6-month internship in the Laboratory of Flavor Chemistry at the University of Illinois (Urbana-Champaign, USA). After receiving her Bachelor’s degree in 2005, she returned to the University of Illinois to pursue her Master’s degree in Food Science and Human Nutrition. Her Master’s thesis was entitled ‘Effect of cultivar type and time of harvest on the flavor profile, chemical composition and sensory properties of vegetable soybean (edamame)’. During her MSc studies, she did a 3-month internship in the Department of Sensory and Consumer Science at PepsiCo (Chicago, USA). In January 2008, Carol was appointed as a PhD fellow at the Top Institute Food and Nutrition and at the Product Design and Quality Management Group at Wageningen University (Wageningen, NL). Her research project, which was part of the project ‘Texture-Taste Interactions’, focused on identifying and understanding the factors that affect the perception of taste in semi-solid foods. After receiving her PhD degree, Carol will work as a postdoctoral fellow at the Institut National de la Recherche Agronomique (INRA) in Dijon, France.

| List of publications
161 |
Publications in Peer-Reviewed Journals
Mosca, A.C., van de Velde, F., Bult, J.H.F., van Boekel, M.A.J.S., Stieger, M. Enhancement of sweetness intensity in gels by inhomogeneous distribution of sucrose. Food Quality and Preference, 21 (2010) 837–842.
Mosca, A. C., van de Velde, F., Bult, J. H. F., van Boekel, M. A. J. S. & Stieger, M. Effect of gel texture and sucrose spatial distribution on sweetness perception. LWT - Food Science and Technology (2012) 46: 183-188.
Mosca, A.C., Rocha, J.A., Sala, G., van de Velde, F., Stieger, M. Inhomogeneous distribution of fat enhances the perception of fat-related sensory attributes in gelled foods. Food Hydrocolloids (2012) 27: 448-455.
Abstracts and Proceedings
Mosca, A.C., Sala, G., van de Velde, F., Stieger, M. Enhancement of fat-related sensory attributes by an inhomogeneous spatial distribution of fat in gelled foods. In: abstract book 9th Pangborn Sensory Science Symposium, 4-8 September 2011, Toronto, CA (poster presentation).
Mosca, A.C., van de Velde, F., Bult, J.H.F., Stieger, M. Effect of taste contrast on consumer preference of gels, breads and sausages. In: abstract book 9th Pangborn Sensory Science Symposium, 4-8 September 2011, Toronto, CA (poster presentation).
Mosca, A.C., van de Velde, F., Bult, J.H.F., Stieger, M. Designing food structures to enhance the perception of tastants and fat. In: abstract book 4th International Symposium on Delivery of Functionality in Complex Food Systems, 21-24 August 2011, Guelph, CA (oral presentation).
Mosca, A.C., van de Velde, F., Bult, J.H.F., Stieger, M. Designing food structures to enhance taste intensity. In: proceedings 11th International Congress on Engineering and Food, 22-26 May 2011, Athens, GR (oral presentation).
Mosca, A.C., van de Velde, F., van Boekel, M.A.J.S., Stieger, M. Engineering food structures to develop low-sugar and low-salt food products. In: abstract book 5th
European Workshop on Food and Technology, 22-23 March 2011, Valencia, SP (oral presentation).

List of publications |
162 |
Mosca, A.C., van de Velde, F., van Boekel, M.A.J.S., Stieger, M. Enhancement of sweetness intensity by inhomogeneous distribution of sucrose. In: abstract book Berlin Food 2010, 8-10 September 2010, Berlin, DE (oral presentation).
Mosca, A.C., van de Velde, F., Bult, J.H.F., Stieger, M. Effect of textural properties on the enhancement of sweetness intensity in layered gels. In: abstract book Food Oral Processing - Physics, Physiology and Psychology of Eating, 4-7 July 2010, Leeds, UK (oral presentation).
Mosca, A.C., van de Velde, F., van Boekel, M.A.J.S., Stieger, M. Enhancement of sweetness intensity in layered gels. In: abstract book 3rd International Symposium on Delivery of Functionality in Complex Food Systems, 18-21 October 2009, Wageningen, NL (oral presentation).

| Overview of completed training activities
163 |
Discipline Specific Activities
Courses A Unified Approach to Mass Transfer, 2008, Delft, NL 12th European School on Rheology, 2009, Leuven, BE Reaction Kinetics in Food Science, 2009, Wageningen, NL Basic Statistics, 2010, Wageningen, NL Sustainability Analysis in Food Production, 2011, Wageningen, NL
Conferences and Workshops 8th Pangborn Sensory Science Symposium, 2009, Florence, IT 3rd International Symposium on Delivery of Functionality in Complex Food Systems, 2009, Wageningen, NL International Conference on Food Oral Processing - Physics, Physiology and Psychology of Eating, 2010, Leeds, UK Berlin Food 2010 Conference, 2010, Berlin, DE 5th European Workshop on Food Engineering and Technology, 2011, Valencia, SP 11th International Congress on Engineering and Food, Athens, GR 9th Pangborn Sensory Science Symposium, 2011, Toronto, CA
General Courses
Team Management and Development, Leeuwendal Training, 2008, Ede, NL Techniques for Writing and Presenting a Scientific Paper, 2009, Wageningen, NL Career Perspectives, 2011, Wageningen, NL PhD Introduction Week, 2008, Eindhoven, NL
Optional Courses and Activities
Organized and Participated in the PhD Tour to Australia, 2010 Guest Researcher at INRA, 2010, Dijon, FR

164 |
The research described in this thesis was financially supported by Top Institute Food and Nutrition.
Financial support from Wageningen University and Top Institute Food and Nutrition for printing this thesis is gratefully acknowledged.
Cover design Esther Ris, www.proefschriftomslag.nl Layout Ana Carolina Mosca Printed by GVO drukkers & vormgevers B.V. / Posen & Looijen, Ede, NL