![Linear Displacement Effficiency_In waterflooding [Compatibility Mode]](https://static.fdocuments.net/doc/165x107/551c750b49795911568b4724/linear-displacement-effficiencyin-waterflooding-compatibility-mode.jpg)
Linear Displacement Effficiency_In waterflooding [Compatibility Mode]
International Journal of Advancements in Research & Technology, Volume 6, Issue 8, August-2017 ISSN 2278-7763
Copyright © 2017 SciResPub.
Designing a Reservoir System for Waterflooding; (A Niger-Delta
Case Study)*
NMEGBU, Chukwuma Godwin Jacob and PEPPLE, Daniel Dasigha 1Department of Petroleum Engineering, Rivers State University, Port-Harcourt, Nigeria; 2Department of Petroleum Engineering, Rivers State University, Port-Harcourt, Nigeria. 1Email: [email protected] 2Email: [email protected]
ABSTRACT
A dynamic reservoir simulation was performed on Eclipse to investigate the applicability of recommended waterflood design principles to an offshore Niger Delta oil field case study. To ascertain contributions of the different schemes and techniques applied in selecting the most appropriate waterflood design, a case of recovery by natural depletion was first considered. This recovery approach, after all possible optimizations, yielded a recovery factor of 28.7%, implying the need for additional recovery by secondary and enhanced oil recovery technologies. The numerical reservoir model was subsequently examined under different cases to optimize a secondary recovery water scheme. Optimized parameters included critical gas saturation, well placement, plateau production and injection rates, and well completion. Sensitivity analysis was also performed with respect to these optimization constraints. With five injectors, including a converted watered-cut producer, overall recovery at the end of the waterflood project simulation was 49.6%, a significant leap from that obtained by natural depletion. Keywords : Enhanced Oil Recovery; Natural Depletion; Recover; Simulation; Water flooding;
1 INTRODUCTION
hen a reservoir is depleted of it natural energy and substantial accumulation still proves recoverable, a choice of recovery scheme is made from a variety of
enhanced oil recovery methods. These choices are however dependent on a wide range of factors which take into consideration the geology of the reservoir, residual oil saturation, reservoir chemistry, petro-physical properties of the reservoir, lithology, expected ultimate recovery and so on. Secondary and enhanced oil recovery methods are selected to tackle distinct recovery cases; for example, thermal methods can be target recovery techniques for reservoirs with low API gravity crude oil, chemical processes may be considered for reservoirs with high interfacial tension between the rock-fluid / oil-water system, enriched gas injection can be ideal for residual oil mobility enhancement via viscosity reduction, and so on. The lower the complexity of the reservoir system with respect to enhanced oil recovery upon evaluation, the less ambiguous the process in selecting suitable EOR techniques. Conventionally, waterflooding is referred to as a secondary recovery method, usually precedes other enhanced methods. It have been practiced for years and its full conception evolved primarily in the late1940's and1950's from extensive research and development efforts by institutions combined with field experiences in the 1960's and 1970's [1]. The primary reasons why waterflooding is the most successful and most widely used oil recovery process is that it offers a relatively low cost when compared to other injection fluids, water is generally readily available, its ease of injection and high displacement efficiency with which it displaces oil. [1], [ 2].
Before the implementation of the flooding project, a preliminary well design is made by a league of engineers. Many complex and sophisticated enhanced recovery processes
have been established in recent time in an effort to recover the enormous oil reserves left behind by inefficient primary recovery mechanisms. Many of these processes have the potential to recover more oil than waterflooding in specific reservoirs. However, no process has been discovered which enjoys the widespread applicability of waterflooding [3].
Designing for waterflooding which is the intent of this study is multi phased. First, simple engineering evaluation techniques are conducted to determine whether the reservoir meets the minimum technical and economic criteria for a successful flood. If so, then more-detailed technical calculations are required, this will include the full range of engineering and geo-scientific studies. The geologists must develop as complete an understanding as possible of the internal character of the pay intervals and of the continuity of non-pay intervals [4]. Sometimes, this pre-understanding often is limited because the injector/producer wells’ connectivity has not been determined quantitatively. Interference testing can provide insight into connectivity when its cost is justifiable [5].
Designs are also evaluated to determine well spacing and pattern style to be used in a particular flood. These choices are based on the thorough comprehension of the reservoir geology, the proposed design of surface facilities (particularly water-injection volumes), and any potential limits on the numbers of injectors and producers [6], [7]. Such factors are interrelated in terms of capital and operating costs and oil, water and gas producion rates to define the overall economics of the project. In making these preliminary calculations, facility capacities need to be flexible because as the waterflood progresses, there certainly will be modifications to the original designs and operating conditions [4], [8], [9].
In the establishment of the suitability of candidate
W
35
IJoART

International Journal of Advancements in Research & Technology, Volume 6, Issue 8, August-2017 ISSN 2278-7763
Copyright © 2017 SciResPub.
reservoirs for waterflooding, the reservoir geometry, fluid properties, reservoir depth, lithology and rock properties, fluid saturations, reservoir uniformity and pay continuity, primary reservoir driving mechanisms and other critical parameters must be thoroughly analyzed. [10].
A critical consideration during the designing phase of a waterflooding project is the flood pattern selection. The flood pattern analysis is aimed at selecting proper injection patterns that will deliver the injected water at desired maximum possible contacts with the residual oil. During the design stage, injectors can be made by conversion of existing producing wells into injectors or drilling infill injection wells. [8], [11]. Surface or subsurface topology and/or the use of slant-hole drilling techniques may result in production or injection wells that are not uniformly positioned. In these cases, the region affected by an injection well could be different for every other injection well. Some small reservoirs are developed for primary production with a limited number of wells and when it economics proves marginal, perhaps only few production wells are converted into injectors in a non-uniform arrangement. Faulting and localized variations in porosity or permeability may also lead to irregular patterns for water flooding [3].
This study is aimed at designing and optimizing waterflooding schemes within a case study, it tends to justify the objective of performing a preliminary natural depletion simulation, designing a waterflood based on voidage replacement principle, optimizing well locations and perforations to maximize recovery, optimize sensitive reservoir parameters like critical gas saturation and optimize production / injection rates to meet management constraints while maximizing recovery. Owing to design data limitations, this study primarily investigates the impact of well orientation, radius and location on the overall recovery from the waterflood. Intricate design details for the drilling of the well are not considered. Furthermore, the variation of each of these parameters on injection / production wells will be sensitized on both performance and field recovery efficiency.
The significance of study of this study is based on the fact that recovery from every oil and gas within the study area field is often inevitably phased into the primary, secondary and possibly tertiary phases. The Nigerian oil industry, in its over 60 years of existence, have remained reliant on majorly primary and minor secondary recovery. This research is structured to be a reminder of how much resources are left behind when adequate secondary recovery methods are not implemented.
2 RESEARCH METHODOLOGY
The research tends to build an Eclipse model for a Niger delta oil field and its adaptation is used well design and Simulation using the ECLIPSE software.
2.1 Recommended Steps in Waterflood Design
The recommended design steps presented in [9] provides a basis for this study and is hence adopted, these steps are as follows;
2.1.1 Construct a Geologic Model of the Reservoir or Project Area.
Identify and include all faults and other structural features that may affect fluid flow in a geologic frame work model of the reservoir.
Identify and include all reservoir heterogeneities, such as permeability barriers, reservoir unconformities, etc. in the geologic model.
Perform characterization of the geologic model to include areal and vertical variation of reservoir properties such as facies, net pay, porosity, permeability, and saturations.
2.1.2 Analyze Rock/Fluid Properties Data.
Determine mineralogy of reservoir rocks.
Conduct studies on compatibility of injection water with reservoir rocks.
Determine PVT properties of reservoir fluids, including saturation pressures and oil viscosity.
2.1.3 Construct Reservoir Flow Model with Data Obtained Geologic and Reservoir Data
If the reservoir had prior production history, history-match reservoir model to obtain the current depleted state of the reservoir before the start of waterflooding. At the completion of the above statement, determine gas cap size if a gas cap is present and extent of aquifer influx if reservoir has an active aquifer. Compare pressure distribution in model after history match to actual pressure data. Identify state of reservoir depletion. Explore distribution of fluid saturation in the model after history match to identify potential undepleted areas of the reservoir that would be targets for waterflooding.
2.1.4 Run prediction cases
Run a base prediction case assuming continuation of current depletion strategy. Run several predictive cases assuming the reservoir is waterflooded with different numbers and locations of water injectors and producers. Compare results obtained from above. If the waterflood cases indicate substantial improvement in total oil recovery, then proceed to design optimization.
2.1.5 Optimize Waterflood Design.
Choose the cases from the preceding step with the “best” reservoir performance and optimize the numbers and locations of injectors and producers.
Optimize injection and production rates for each case. Rank the cases by incorporating project economics.
2.1.6 Perform Sensitivity Analysis
Select two or three cases from waterflood design optimization and perform sensitivity analyses on key reservoir and operational variables of the waterflood design.
Repeat economic analyses of the entire project based on results from the step above.
36
IJoART
International Journal of Advancements in Research & Technology, Volume 6, Issue 8, August-2017 ISSN 2278-7763
Copyright © 2017 SciResPub.
3 RESULTS AND DISCUSSION
The numerical reservoir model is examined under different cases to implement two different production schemes with the aim of production optimization.
Scenario 1: Natural depletion scheme Scenario 2: Water Injection scheme
3.1 Scenario 1: Natural Depletion Scheme
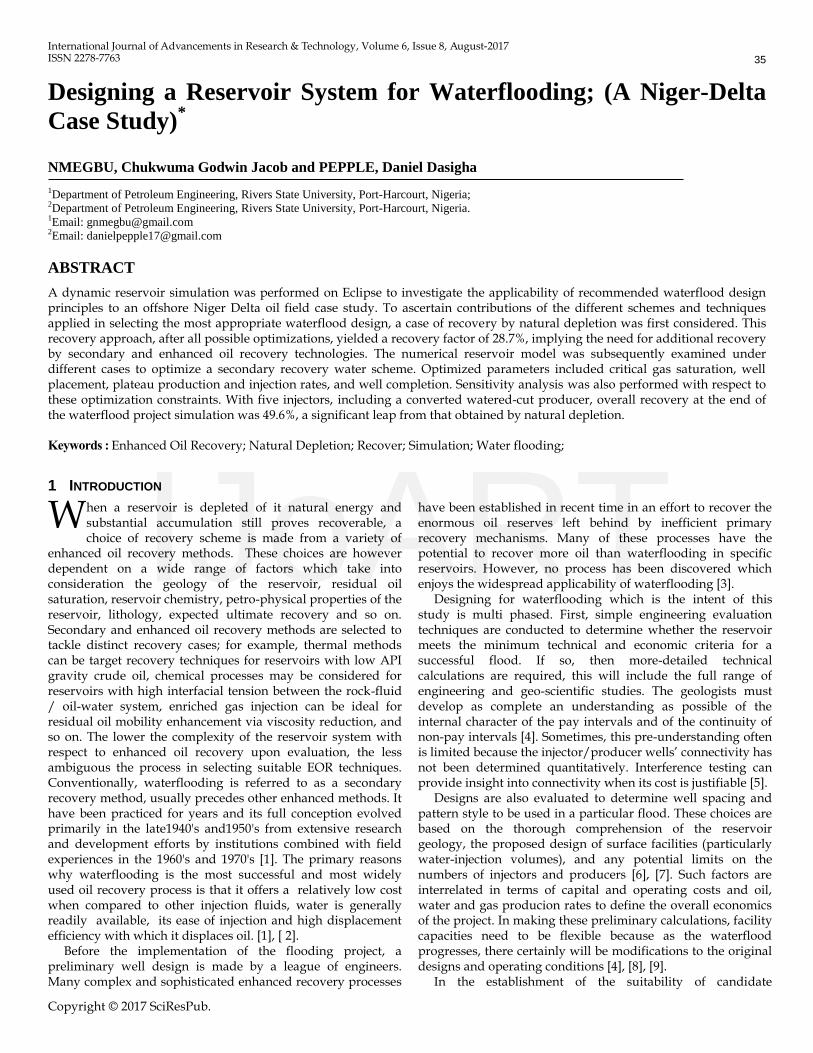
The reservoir model is simulated for hydrocarbon production by the natural energy inside the reservoir with the aid of different drive mechanisms such as the solution gas drive, rock and connate water expansion, water drive, and consequently as the pressure drop below bubble point, secondary gas drive.
The model is run from an initial reservoir pressure of 446 bars to about 258 bars (Bubble point pressure). Drawdown was given to be 30bar. Initially, there were four appraisal wells (A2, A4, N2, and N3). 3.1.1 Four-Well Optimization Initial simulation run was from initial reservoir pressure to bubble point pressure, i.e. from 446 bars – 258 bars. The four explorations and delineation wells assigned A2, A4, N2 and N3 are opened to production for the initial simulation run under the following constraints.
TABLE 1 PRELIMINARY SIMULATION PARAMETERS
Parameter Value
Bottom hole pressure constraint 258 bar
Drawdown pressure 30 bar
Plateau rate 1800 Sm3/day
Maximum Water cut 90%
Max GOR 1500 Sm3
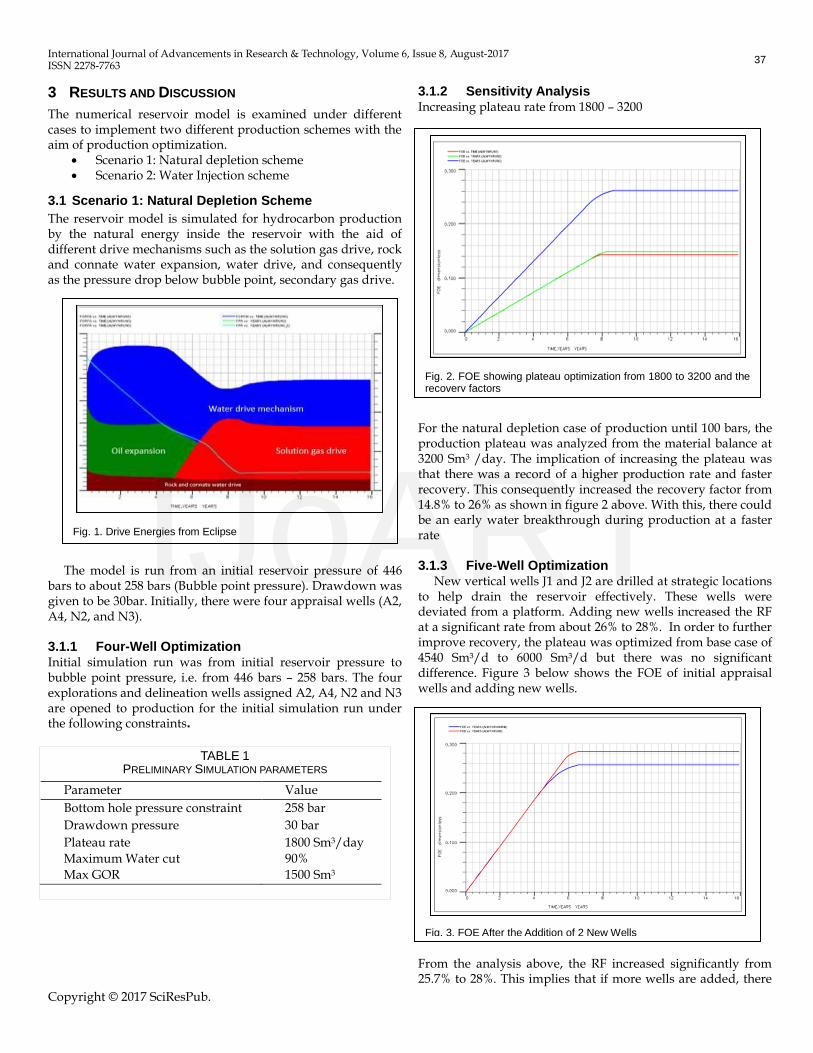
3.1.2 Sensitivity Analysis Increasing plateau rate from 1800 – 3200 For the natural depletion case of production until 100 bars, the production plateau was analyzed from the material balance at 3200 Sm3 /day. The implication of increasing the plateau was that there was a record of a higher production rate and faster recovery. This consequently increased the recovery factor from 14.8% to 26% as shown in figure 2 above. With this, there could be an early water breakthrough during production at a faster rate 3.1.3 Five-Well Optimization
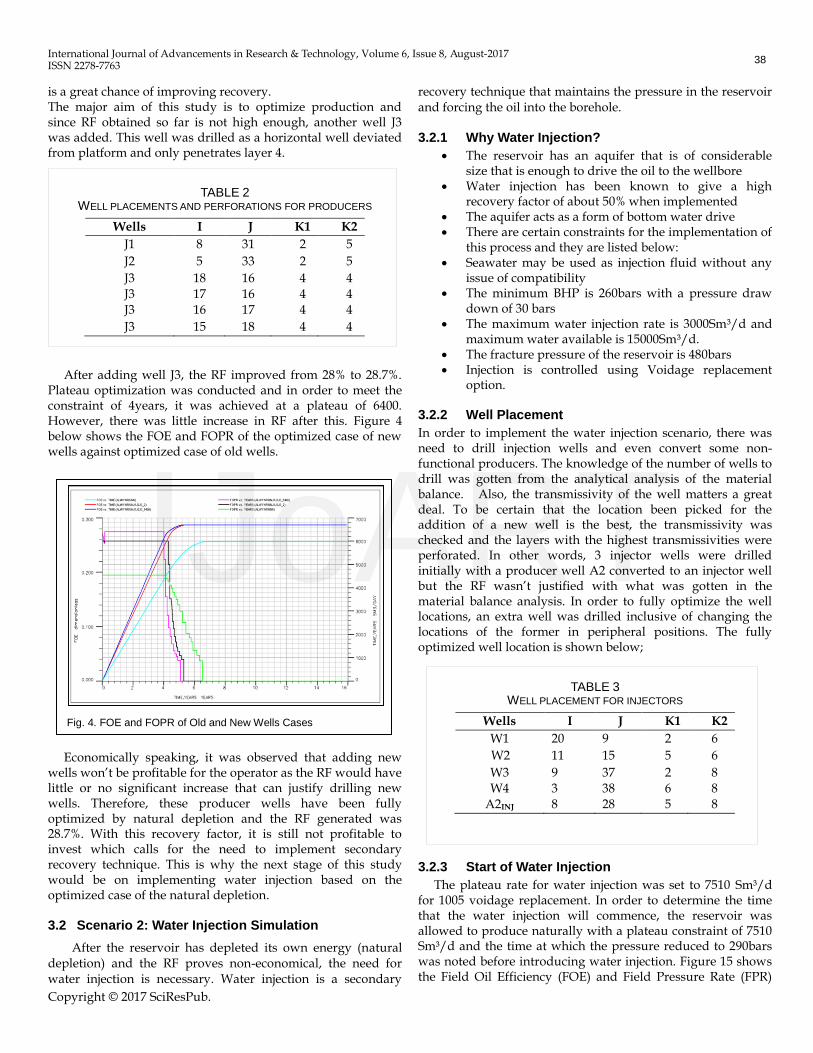
New vertical wells J1 and J2 are drilled at strategic locations to help drain the reservoir effectively. These wells were deviated from a platform. Adding new wells increased the RF at a significant rate from about 26% to 28%. In order to further improve recovery, the plateau was optimized from base case of 4540 Sm³/d to 6000 Sm³/d but there was no significant difference. Figure 3 below shows the FOE of initial appraisal wells and adding new wells. From the analysis above, the RF increased significantly from 25.7% to 28%. This implies that if more wells are added, there
Fig. 1. Drive Energies from Eclipse
Fig. 2. FOE showing plateau optimization from 1800 to 3200 and the recovery factors
Fig. 3. FOE After the Addition of 2 New Wells
37
IJoART
International Journal of Advancements in Research & Technology, Volume 6, Issue 8, August-2017 ISSN 2278-7763
Copyright © 2017 SciResPub.
is a great chance of improving recovery. The major aim of this study is to optimize production and since RF obtained so far is not high enough, another well J3 was added. This well was drilled as a horizontal well deviated from platform and only penetrates layer 4.
TABLE 2 WELL PLACEMENTS AND PERFORATIONS FOR PRODUCERS
Wells I J K1 K2
J1 8 31 2 5
J2 5 33 2 5
J3 18 16 4 4 J3 17 16 4 4 J3 16 17 4 4
J3 15 18 4 4
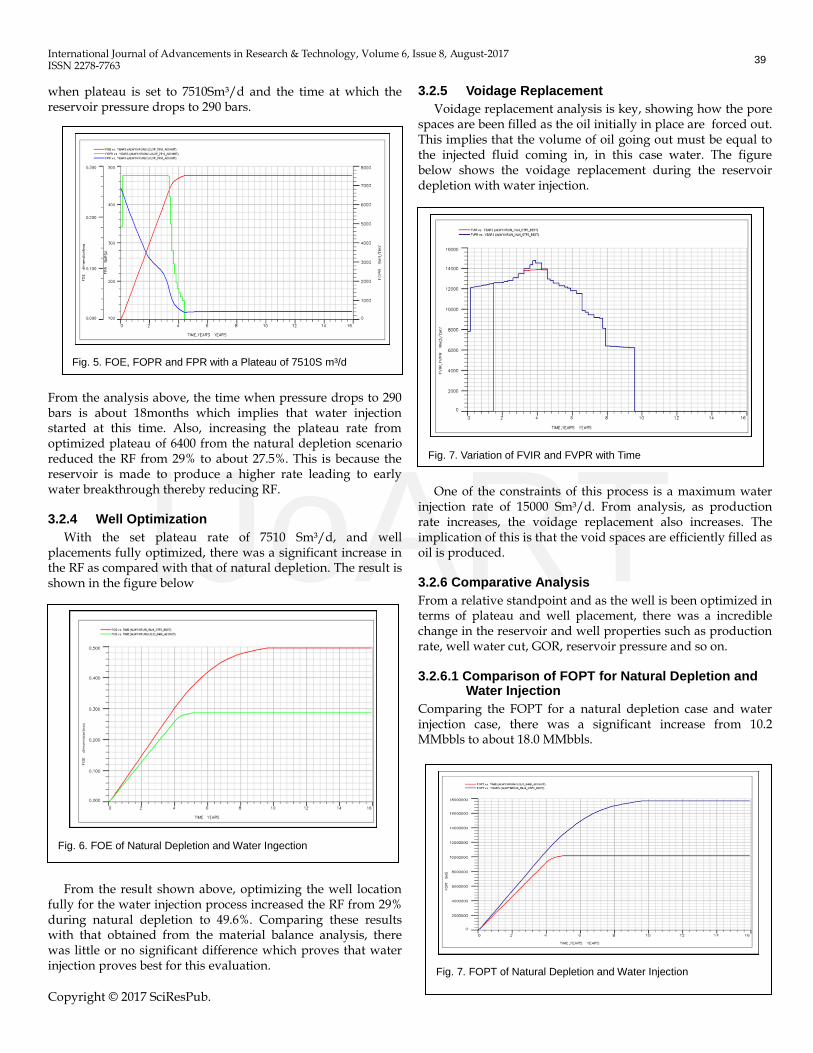
After adding well J3, the RF improved from 28% to 28.7%. Plateau optimization was conducted and in order to meet the constraint of 4years, it was achieved at a plateau of 6400. However, there was little increase in RF after this. Figure 4 below shows the FOE and FOPR of the optimized case of new wells against optimized case of old wells.
Economically speaking, it was observed that adding new wells won’t be profitable for the operator as the RF would have little or no significant increase that can justify drilling new wells. Therefore, these producer wells have been fully optimized by natural depletion and the RF generated was 28.7%. With this recovery factor, it is still not profitable to invest which calls for the need to implement secondary recovery technique. This is why the next stage of this study would be on implementing water injection based on the optimized case of the natural depletion.
3.2 Scenario 2: Water Injection Simulation
After the reservoir has depleted its own energy (natural depletion) and the RF proves non-economical, the need for water injection is necessary. Water injection is a secondary
recovery technique that maintains the pressure in the reservoir and forcing the oil into the borehole. 3.2.1 Why Water Injection?
The reservoir has an aquifer that is of considerable size that is enough to drive the oil to the wellbore
Water injection has been known to give a high recovery factor of about 50% when implemented
The aquifer acts as a form of bottom water drive There are certain constraints for the implementation of
this process and they are listed below: Seawater may be used as injection fluid without any
issue of compatibility The minimum BHP is 260bars with a pressure draw
down of 30 bars The maximum water injection rate is 3000Sm³/d and
maximum water available is 15000Sm³/d. The fracture pressure of the reservoir is 480bars Injection is controlled using Voidage replacement
option.
3.2.2 Well Placement
In order to implement the water injection scenario, there was need to drill injection wells and even convert some non-functional producers. The knowledge of the number of wells to drill was gotten from the analytical analysis of the material balance. Also, the transmissivity of the well matters a great deal. To be certain that the location been picked for the addition of a new well is the best, the transmissivity was checked and the layers with the highest transmissivities were perforated. In other words, 3 injector wells were drilled initially with a producer well A2 converted to an injector well but the RF wasn’t justified with what was gotten in the material balance analysis. In order to fully optimize the well locations, an extra well was drilled inclusive of changing the locations of the former in peripheral positions. The fully optimized well location is shown below;
TABLE 3 WELL PLACEMENT FOR INJECTORS
Wells I J K1 K2
W1 20 9 2 6
W2 11 15 5 6
W3 9 37 2 8 W4 3 38 6 8
A2INJ 8 28 5 8
3.2.3 Start of Water Injection
The plateau rate for water injection was set to 7510 Sm³/d for 1005 voidage replacement. In order to determine the time that the water injection will commence, the reservoir was allowed to produce naturally with a plateau constraint of 7510 Sm³/d and the time at which the pressure reduced to 290bars was noted before introducing water injection. Figure 15 shows the Field Oil Efficiency (FOE) and Field Pressure Rate (FPR)
Fig. 4. FOE and FOPR of Old and New Wells Cases
38
IJoART
International Journal of Advancements in Research & Technology, Volume 6, Issue 8, August-2017 ISSN 2278-7763
Copyright © 2017 SciResPub.
when plateau is set to 7510Sm³/d and the time at which the reservoir pressure drops to 290 bars. From the analysis above, the time when pressure drops to 290 bars is about 18months which implies that water injection started at this time. Also, increasing the plateau rate from optimized plateau of 6400 from the natural depletion scenario reduced the RF from 29% to about 27.5%. This is because the reservoir is made to produce a higher rate leading to early water breakthrough thereby reducing RF. 3.2.4 Well Optimization
With the set plateau rate of 7510 Sm³/d, and well placements fully optimized, there was a significant increase in the RF as compared with that of natural depletion. The result is shown in the figure below
From the result shown above, optimizing the well location
fully for the water injection process increased the RF from 29% during natural depletion to 49.6%. Comparing these results with that obtained from the material balance analysis, there was little or no significant difference which proves that water injection proves best for this evaluation.
3.2.5 Voidage Replacement
Voidage replacement analysis is key, showing how the pore spaces are been filled as the oil initially in place are forced out. This implies that the volume of oil going out must be equal to the injected fluid coming in, in this case water. The figure below shows the voidage replacement during the reservoir depletion with water injection.
One of the constraints of this process is a maximum water injection rate of 15000 Sm³/d. From analysis, as production rate increases, the voidage replacement also increases. The implication of this is that the void spaces are efficiently filled as oil is produced.
3.2.6 Comparative Analysis
From a relative standpoint and as the well is been optimized in terms of plateau and well placement, there was a incredible change in the reservoir and well properties such as production rate, well water cut, GOR, reservoir pressure and so on.
3.2.6.1 Comparison of FOPT for Natural Depletion and
Water Injection
Comparing the FOPT for a natural depletion case and water injection case, there was a significant increase from 10.2 MMbbls to about 18.0 MMbbls.
Fig. 5. FOE, FOPR and FPR with a Plateau of 7510S m³/d
Fig. 6. FOE of Natural Depletion and Water Ingection
Fig. 7. Variation of FVIR and FVPR with Time
Fig. 7. FOPT of Natural Depletion and Water Injection
39
IJoART
International Journal of Advancements in Research & Technology, Volume 6, Issue 8, August-2017 ISSN 2278-7763
Copyright © 2017 SciResPub.
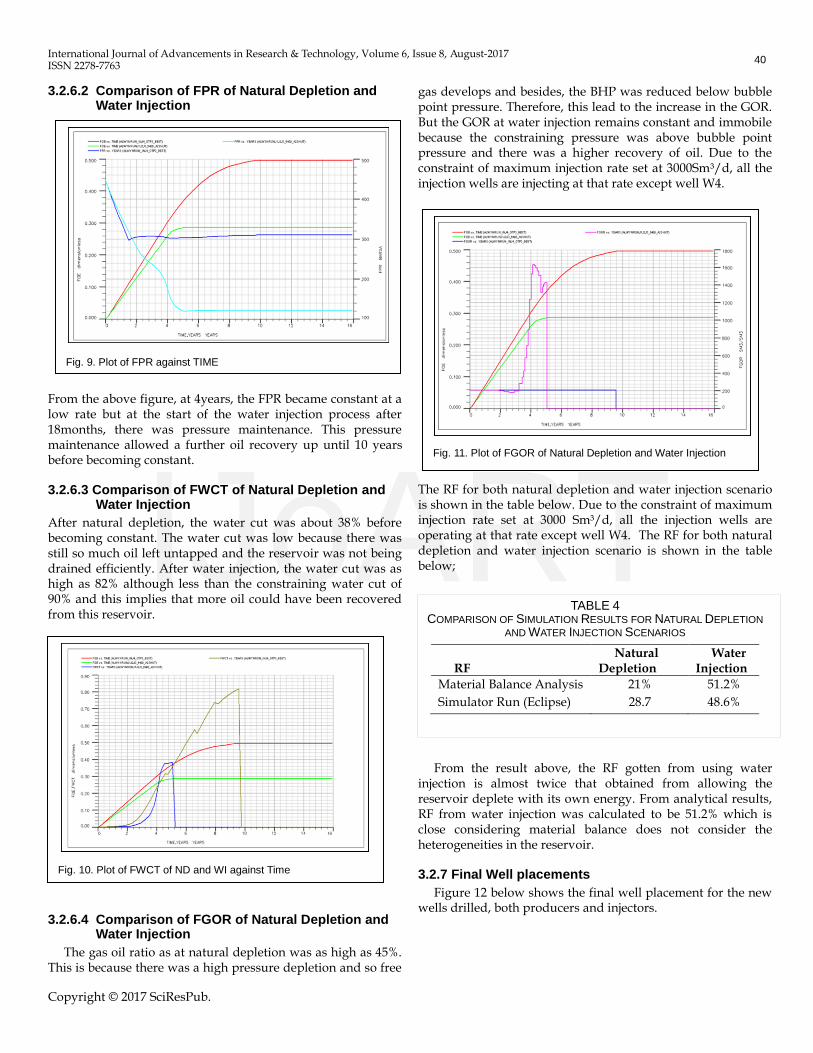
3.2.6.2 Comparison of FPR of Natural Depletion and Water Injection
From the above figure, at 4years, the FPR became constant at a low rate but at the start of the water injection process after 18months, there was pressure maintenance. This pressure maintenance allowed a further oil recovery up until 10 years before becoming constant. 3.2.6.3 Comparison of FWCT of Natural Depletion and
Water Injection
After natural depletion, the water cut was about 38% before becoming constant. The water cut was low because there was still so much oil left untapped and the reservoir was not being drained efficiently. After water injection, the water cut was as high as 82% although less than the constraining water cut of 90% and this implies that more oil could have been recovered from this reservoir.
3.2.6.4 Comparison of FGOR of Natural Depletion and
Water Injection
The gas oil ratio as at natural depletion was as high as 45%. This is because there was a high pressure depletion and so free
gas develops and besides, the BHP was reduced below bubble point pressure. Therefore, this lead to the increase in the GOR. But the GOR at water injection remains constant and immobile because the constraining pressure was above bubble point pressure and there was a higher recovery of oil. Due to the constraint of maximum injection rate set at 3000Sm³/d, all the injection wells are injecting at that rate except well W4.
The RF for both natural depletion and water injection scenario is shown in the table below. Due to the constraint of maximum injection rate set at 3000 Sm³/d, all the injection wells are operating at that rate except well W4. The RF for both natural depletion and water injection scenario is shown in the table below;
TABLE 4 COMPARISON OF SIMULATION RESULTS FOR NATURAL DEPLETION
AND WATER INJECTION SCENARIOS
RF
Natural Depletion
Water Injection
Material Balance Analysis 21% 51.2%
Simulator Run (Eclipse) 28.7 48.6%
From the result above, the RF gotten from using water
injection is almost twice that obtained from allowing the reservoir deplete with its own energy. From analytical results, RF from water injection was calculated to be 51.2% which is close considering material balance does not consider the heterogeneities in the reservoir. 3.2.7 Final Well placements
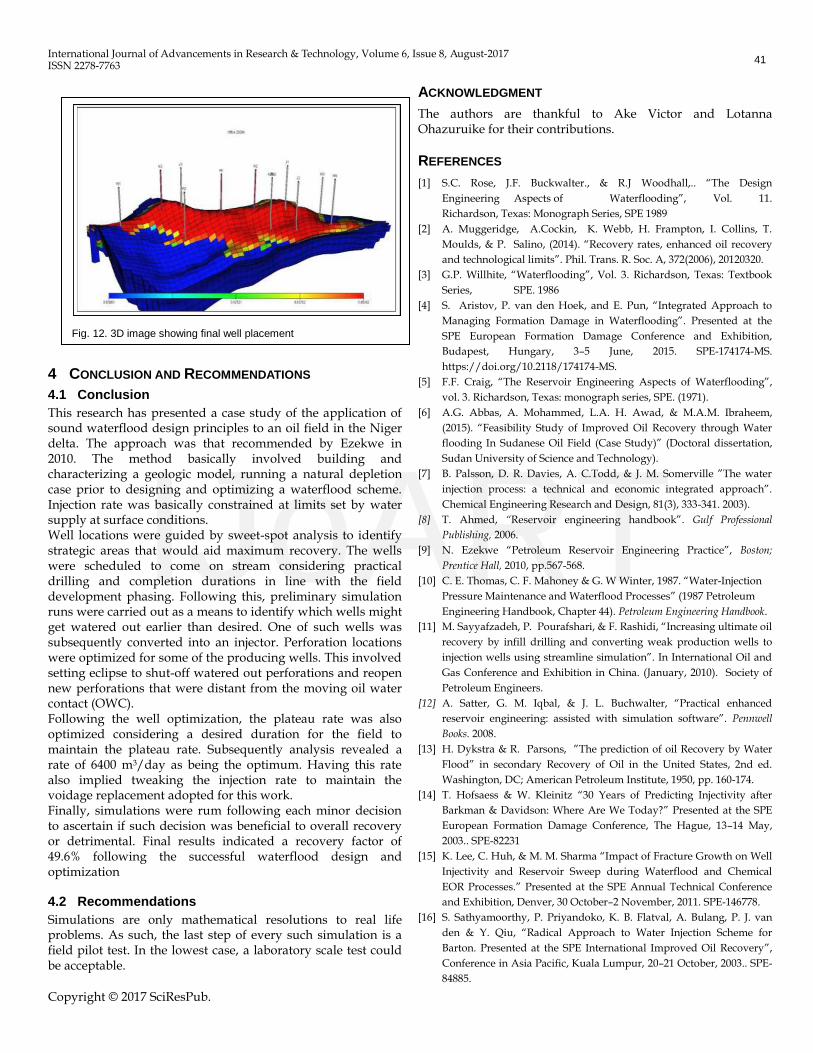
Figure 12 below shows the final well placement for the new wells drilled, both producers and injectors.
Fig. 9. Plot of FPR against TIME
Fig. 10. Plot of FWCT of ND and WI against Time
Fig. 11. Plot of FGOR of Natural Depletion and Water Injection
40
IJoART
International Journal of Advancements in Research & Technology, Volume 6, Issue 8, August-2017 ISSN 2278-7763
Copyright © 2017 SciResPub.
4 CONCLUSION AND RECOMMENDATIONS
4.1 Conclusion
This research has presented a case study of the application of sound waterflood design principles to an oil field in the Niger delta. The approach was that recommended by Ezekwe in 2010. The method basically involved building and characterizing a geologic model, running a natural depletion case prior to designing and optimizing a waterflood scheme. Injection rate was basically constrained at limits set by water supply at surface conditions. Well locations were guided by sweet-spot analysis to identify strategic areas that would aid maximum recovery. The wells were scheduled to come on stream considering practical drilling and completion durations in line with the field development phasing. Following this, preliminary simulation runs were carried out as a means to identify which wells might get watered out earlier than desired. One of such wells was subsequently converted into an injector. Perforation locations were optimized for some of the producing wells. This involved setting eclipse to shut-off watered out perforations and reopen new perforations that were distant from the moving oil water contact (OWC). Following the well optimization, the plateau rate was also optimized considering a desired duration for the field to maintain the plateau rate. Subsequently analysis revealed a rate of 6400 m3/day as being the optimum. Having this rate also implied tweaking the injection rate to maintain the voidage replacement adopted for this work. Finally, simulations were rum following each minor decision to ascertain if such decision was beneficial to overall recovery or detrimental. Final results indicated a recovery factor of 49.6% following the successful waterflood design and optimization
4.2 Recommendations
Simulations are only mathematical resolutions to real life problems. As such, the last step of every such simulation is a field pilot test. In the lowest case, a laboratory scale test could be acceptable.
ACKNOWLEDGMENT
The authors are thankful to Ake Victor and Lotanna Ohazuruike for their contributions.
REFERENCES
[1] S.C. Rose, J.F. Buckwalter., & R.J Woodhall,.. “The Design
Engineering Aspects of Waterflooding”, Vol. 11.
Richardson, Texas: Monograph Series, SPE 1989
[2] A. Muggeridge, A.Cockin, K. Webb, H. Frampton, I. Collins, T.
Moulds, & P. Salino, (2014). “Recovery rates, enhanced oil recovery
and technological limits”. Phil. Trans. R. Soc. A, 372(2006), 20120320.
[3] G.P. Willhite, “Waterflooding”, Vol. 3. Richardson, Texas: Textbook
Series, SPE. 1986
[4] S. Aristov, P. van den Hoek, and E. Pun, “Integrated Approach to
Managing Formation Damage in Waterflooding”. Presented at the
SPE European Formation Damage Conference and Exhibition,
Budapest, Hungary, 3–5 June, 2015. SPE-174174-MS.
https://doi.org/10.2118/174174-MS.
[5] F.F. Craig, “The Reservoir Engineering Aspects of Waterflooding”,
vol. 3. Richardson, Texas: monograph series, SPE. (1971).
[6] A.G. Abbas, A. Mohammed, L.A. H. Awad, & M.A.M. Ibraheem,
(2015). “Feasibility Study of Improved Oil Recovery through Water
flooding In Sudanese Oil Field (Case Study)” (Doctoral dissertation,
Sudan University of Science and Technology).
[7] B. Palsson, D. R. Davies, A. C.Todd, & J. M. Somerville ”The water
injection process: a technical and economic integrated approach”.
Chemical Engineering Research and Design, 81(3), 333-341. 2003).
[8] T. Ahmed, “Reservoir engineering handbook”. Gulf Professional
Publishing, 2006.
[9] N. Ezekwe “Petroleum Reservoir Engineering Practice”, Boston;
Prentice Hall, 2010, pp.567-568.
[10] C. E. Thomas, C. F. Mahoney & G. W Winter, 1987. “Water-Injection
Pressure Maintenance and Waterflood Processes” (1987 Petroleum
Engineering Handbook, Chapter 44). Petroleum Engineering Handbook.
[11] M. Sayyafzadeh, P. Pourafshari, & F. Rashidi, “Increasing ultimate oil
recovery by infill drilling and converting weak production wells to
injection wells using streamline simulation”. In International Oil and
Gas Conference and Exhibition in China. (January, 2010). Society of
Petroleum Engineers.
[12] A. Satter, G. M. Iqbal, & J. L. Buchwalter, “Practical enhanced
reservoir engineering: assisted with simulation software”. Pennwell
Books. 2008.
[13] H. Dykstra & R. Parsons, ”The prediction of oil Recovery by Water
Flood” in secondary Recovery of Oil in the United States, 2nd ed.
Washington, DC; American Petroleum Institute, 1950, pp. 160-174.
[14] T. Hofsaess & W. Kleinitz “30 Years of Predicting Injectivity after
Barkman & Davidson: Where Are We Today?” Presented at the SPE
European Formation Damage Conference, The Hague, 13–14 May,
2003.. SPE-82231
[15] K. Lee, C. Huh, & M. M. Sharma “Impact of Fracture Growth on Well
Injectivity and Reservoir Sweep during Waterflood and Chemical
EOR Processes.” Presented at the SPE Annual Technical Conference
and Exhibition, Denver, 30 October–2 November, 2011. SPE-146778.
[16] S. Sathyamoorthy, P. Priyandoko, K. B. Flatval, A. Bulang, P. J. van
den & Y. Qiu, “Radical Approach to Water Injection Scheme for
Barton. Presented at the SPE International Improved Oil Recovery”,
Conference in Asia Pacific, Kuala Lumpur, 20–21 October, 2003.. SPE-
84885.
Fig. 12. 3D image showing final well placement
41
IJoART

International Journal of Advancements in Research & Technology, Volume 6, Issue 8, August-2017 ISSN 2278-7763
Copyright © 2017 SciResPub.
[17] M. Zwaan, R. Hartmans, S. Schoofs, A. H. De Zwart, G. Rocco, R.
Adawi, & T. Sorop, “EOR Field Management Through Well-Planned
Surveillance”. In SPE EOR Conference at Oil and Gas West Asia,
January, 2012. Society of Petroleum Engineers.
42
IJoART