
Designing a Provenance-Based Climate Data Analysis Application
5
Designing a Provenance-Based Climate Data Analysis Application Emanuele Santos 1 , David Koop 1 , Thomas Maxwell 2 , Charles Doutriaux 3 , Tommy Ellqvist 1 , Gerald Potter 2 , Juliana Freire 1 , Dean Williams 3 , and Cl´ audio T. Silva 1 1 Polytechnic Institute of New York University 2 NASA Goddard Space Flight Center 3 Lawrence Livermore National Laboratory http://uv-cdat.llnl.gov/ Abstract. Climate scientists have made substantial progress in under- standing Earth’s climate system, particularly at global and continental scales. Climate research is now focused on understanding climate changes over wider ranges of time and space scales. These efforts are generating ultra-scale data sets at very high spatial resolution. An insightful analy- sis in climate science depends on using software tools to discover, access, manipulate, and visualize the data sets of interest. These data explo- ration tasks can be complex and time-consuming, and they frequently involve many resources from both the modeling and observational climate communities. Because of the complexity of the explorations, provenance is critical, allowing scientists to ensure reproducibility, revisit existing computational pipelines, and more easily share analyses and results. In addition, as the results of this work can impact policy, having prove- nance available is important for decision-making. In this paper we de- scribe, UV-CDAT, a workflow-based, provenance-enabled system that integrates climate data analysis libraries and visualization tools in an end-to-end application, making it easier for scientists to integrate and use a wide array of tools. 1 Introduction This is the first paper describing capabilities of the newly developed UV-CDAT system, an advanced application that can locally and remotely access ultra-scale climate data archives, provide high-performance parallel analysis and visualiza- tion capabilities to the desktop of a climate scientist, and ultimately, apply these tools to make informed decisions on meeting the energy needs of the nation and the world in light of climate change consequences. UV-CDAT has been devel- oped in response to the needs of scientists for access, analysis, and visualization to computer model output resulting from high-resolution, long-term, climate change projections performed as part of the U.S. Global Change Research Pro- gram. This program is funding a multi-agency effort towards the modeling and simulation of long-term climate change, and for the past several years, this effort has been an extremely important resource for the research community. As an example of the research progress that has been enabled under this effort, the DOE BER-funded Program for Climate Model Diagnosis and Intercomparison
Transcript of Designing a Provenance-Based Climate Data Analysis Application

Designing a Provenance-Based Climate DataAnalysis Application
Emanuele Santos1, David Koop1, Thomas Maxwell2, Charles Doutriaux3,Tommy Ellqvist1, Gerald Potter2, Juliana Freire1, Dean Williams3, and
Claudio T. Silva1
1 Polytechnic Institute of New York University2 NASA Goddard Space Flight Center
3 Lawrence Livermore National Laboratoryhttp://uv-cdat.llnl.gov/
Abstract. Climate scientists have made substantial progress in under-standing Earth’s climate system, particularly at global and continentalscales. Climate research is now focused on understanding climate changesover wider ranges of time and space scales. These efforts are generatingultra-scale data sets at very high spatial resolution. An insightful analy-sis in climate science depends on using software tools to discover, access,manipulate, and visualize the data sets of interest. These data explo-ration tasks can be complex and time-consuming, and they frequentlyinvolve many resources from both the modeling and observational climatecommunities. Because of the complexity of the explorations, provenanceis critical, allowing scientists to ensure reproducibility, revisit existingcomputational pipelines, and more easily share analyses and results. Inaddition, as the results of this work can impact policy, having prove-nance available is important for decision-making. In this paper we de-scribe, UV-CDAT, a workflow-based, provenance-enabled system thatintegrates climate data analysis libraries and visualization tools in anend-to-end application, making it easier for scientists to integrate anduse a wide array of tools.
1 Introduction
This is the first paper describing capabilities of the newly developed UV-CDATsystem, an advanced application that can locally and remotely access ultra-scaleclimate data archives, provide high-performance parallel analysis and visualiza-tion capabilities to the desktop of a climate scientist, and ultimately, apply thesetools to make informed decisions on meeting the energy needs of the nation andthe world in light of climate change consequences. UV-CDAT has been devel-oped in response to the needs of scientists for access, analysis, and visualizationto computer model output resulting from high-resolution, long-term, climatechange projections performed as part of the U.S. Global Change Research Pro-gram. This program is funding a multi-agency effort towards the modeling andsimulation of long-term climate change, and for the past several years, this efforthas been an extremely important resource for the research community. As anexample of the research progress that has been enabled under this effort, theDOE BER-funded Program for Climate Model Diagnosis and Intercomparison

2 Designing a Provenance-Based Climate Data Analysis Application
UV-CDAT
VisTrails
Provenance Storage
Pack
age
Supp
ort
Pack
age
Supp
ort
CDAT Core
VCS
VTK/ParaView
Workflow Builder
UV-CDAT GUI Scripting
R
VisIt
ParaView
Loosely Coupled Integration
Tightly Coupled Integration
MatLab
Fig. 1. UV-CDAT system architecture.
(PCMDI) has collected and disseminated Model Intercomparison Project (MIP)simulation output from most of the world’s premier climate modeling centers,including the Coupled Model Intercomparison Project, phase 3 (CMIP-3) collec-tions which encompass over 35 terabytes (TB) of data, and more than 1 petabyte(PB) of CMIP-3 data has been distributed to over 4,300 users worldwide, re-sulting in over 600 peer-reviewed publications evaluating and using simulationsfrom these state-of-the-art climate models.
Leading domain-specific tools [3, 5, 8], such as Climate Data Analysis Tools(CDAT) lack a number of desirable features to enable the analysis of this data.In particular, CDAT is ill-equipped to process very large data sets resulting fromfuture high-resolution climate model simulations, and it lacks provenance andworkflow functionality [4,6] that are key to ensure that results are reproducibleand easily accessible across the climate research community. UV-CDAT is builton top of a provenance-enabled workflow system, and all its functionality is in-tegrated through either tightly coupled or loosely coupled software components.This model has allowed us to create a modular design that easily supports the in-tegration of major new packages (and related functionality) in a matter of a fewdays versus months of efforts rewriting the guts of the system to accommodatefor the new software.
To summarize, our main contribution in this paper is to describe the UV-CDAT system, the first provenance-enabled end-user visualization and analysistool. UV-CDAT presents a novel architecture that seamlessly integrates work-flows, provenance, climate data analysis libraries, and visualization tools in anend-to-end application.
2 UV-CDAT Overview
There are quite a number of components to UV-CDAT, and it is out of the scopeof this paper to provide a complete description of the system. We focus on theprovenance support, and on how this was enabled in a GUI-based end-user appli-cation. Below we provide a rough overview of the system. UV-CDAT is availablefor downloading from http://uv-cdat.llnl.gov/. UV-CDAT is a workflow-based,provenance-enabled system that integrates climate data analysis libraries andvisualization tools in an end-to-end application.
The UV-CDAT framework integrates software infrastructure through twoprimary means (Figure 1). Tightly coupled integration of CDAT Core, VCS
Designing a Provenance-Based Climate Data Analysis Application 3
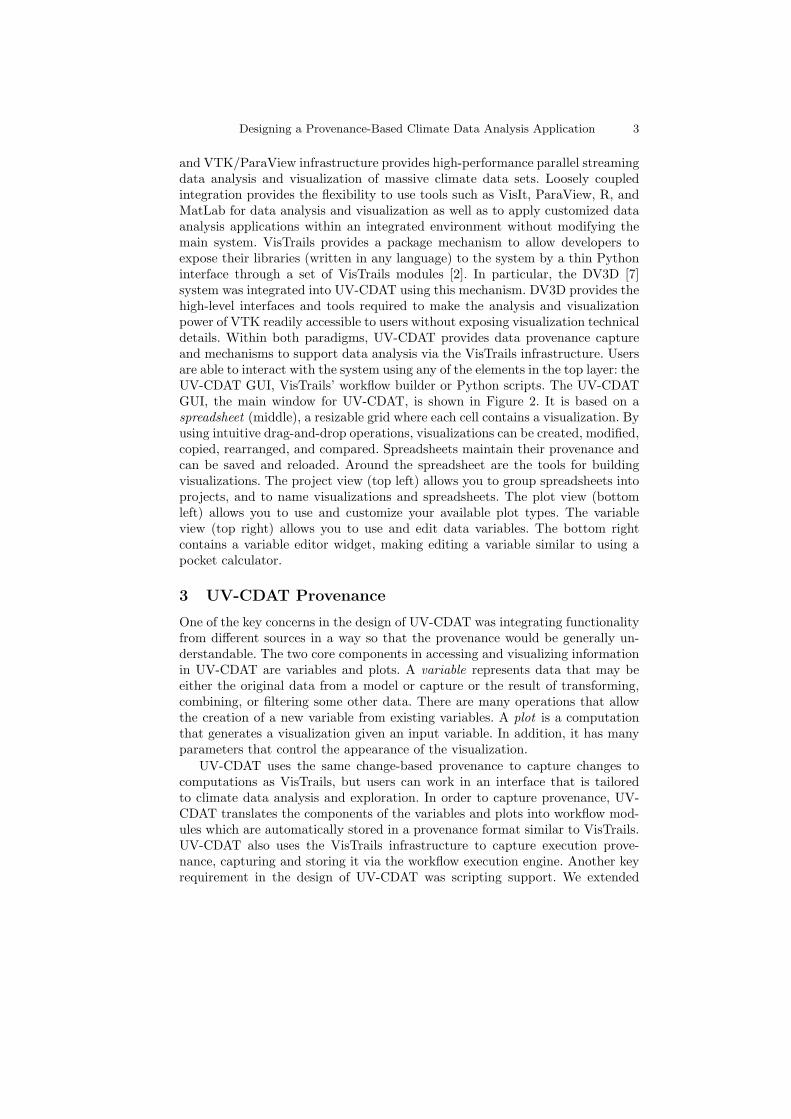
and VTK/ParaView infrastructure provides high-performance parallel streamingdata analysis and visualization of massive climate data sets. Loosely coupledintegration provides the flexibility to use tools such as VisIt, ParaView, R, andMatLab for data analysis and visualization as well as to apply customized dataanalysis applications within an integrated environment without modifying themain system. VisTrails provides a package mechanism to allow developers toexpose their libraries (written in any language) to the system by a thin Pythoninterface through a set of VisTrails modules [2]. In particular, the DV3D [7]system was integrated into UV-CDAT using this mechanism. DV3D provides thehigh-level interfaces and tools required to make the analysis and visualizationpower of VTK readily accessible to users without exposing visualization technicaldetails. Within both paradigms, UV-CDAT provides data provenance captureand mechanisms to support data analysis via the VisTrails infrastructure. Usersare able to interact with the system using any of the elements in the top layer: theUV-CDAT GUI, VisTrails’ workflow builder or Python scripts. The UV-CDATGUI, the main window for UV-CDAT, is shown in Figure 2. It is based on aspreadsheet (middle), a resizable grid where each cell contains a visualization. Byusing intuitive drag-and-drop operations, visualizations can be created, modified,copied, rearranged, and compared. Spreadsheets maintain their provenance andcan be saved and reloaded. Around the spreadsheet are the tools for buildingvisualizations. The project view (top left) allows you to group spreadsheets intoprojects, and to name visualizations and spreadsheets. The plot view (bottomleft) allows you to use and customize your available plot types. The variableview (top right) allows you to use and edit data variables. The bottom rightcontains a variable editor widget, making editing a variable similar to using apocket calculator.
3 UV-CDAT Provenance
One of the key concerns in the design of UV-CDAT was integrating functionalityfrom different sources in a way so that the provenance would be generally un-derstandable. The two core components in accessing and visualizing informationin UV-CDAT are variables and plots. A variable represents data that may beeither the original data from a model or capture or the result of transforming,combining, or filtering some other data. There are many operations that allowthe creation of a new variable from existing variables. A plot is a computationthat generates a visualization given an input variable. In addition, it has manyparameters that control the appearance of the visualization.
UV-CDAT uses the same change-based provenance to capture changes tocomputations as VisTrails, but users can work in an interface that is tailoredto climate data analysis and exploration. In order to capture provenance, UV-CDAT translates the components of the variables and plots into workflow mod-ules which are automatically stored in a provenance format similar to VisTrails.UV-CDAT also uses the VisTrails infrastructure to capture execution prove-nance, capturing and storing it via the workflow execution engine. Another keyrequirement in the design of UV-CDAT was scripting support. We extended
4 Designing a Provenance-Based Climate Data Analysis Application
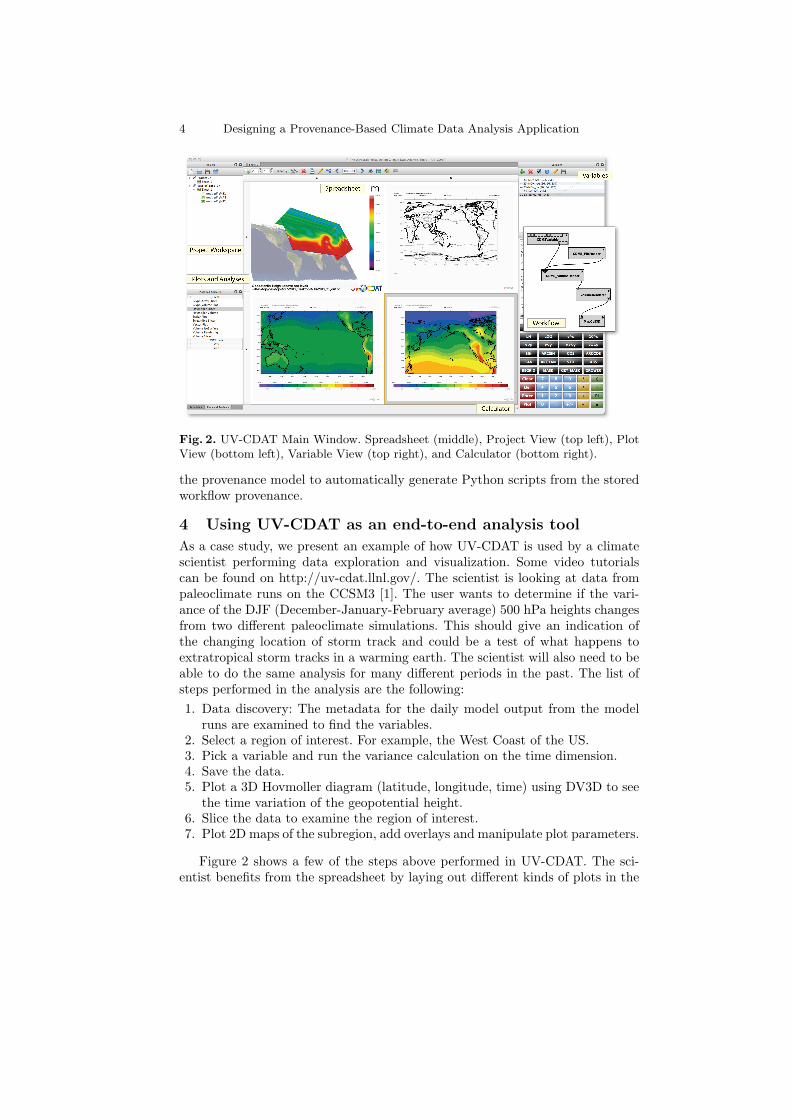
Fig. 2. UV-CDAT Main Window. Spreadsheet (middle), Project View (top left), PlotView (bottom left), Variable View (top right), and Calculator (bottom right).
the provenance model to automatically generate Python scripts from the storedworkflow provenance.
4 Using UV-CDAT as an end-to-end analysis tool
As a case study, we present an example of how UV-CDAT is used by a climatescientist performing data exploration and visualization. Some video tutorialscan be found on http://uv-cdat.llnl.gov/. The scientist is looking at data frompaleoclimate runs on the CCSM3 [1]. The user wants to determine if the vari-ance of the DJF (December-January-February average) 500 hPa heights changesfrom two different paleoclimate simulations. This should give an indication ofthe changing location of storm track and could be a test of what happens toextratropical storm tracks in a warming earth. The scientist will also need to beable to do the same analysis for many different periods in the past. The list ofsteps performed in the analysis are the following:1. Data discovery: The metadata for the daily model output from the model
runs are examined to find the variables.2. Select a region of interest. For example, the West Coast of the US.3. Pick a variable and run the variance calculation on the time dimension.4. Save the data.5. Plot a 3D Hovmoller diagram (latitude, longitude, time) using DV3D to see
the time variation of the geopotential height.6. Slice the data to examine the region of interest.7. Plot 2D maps of the subregion, add overlays and manipulate plot parameters.
Figure 2 shows a few of the steps above performed in UV-CDAT. The sci-entist benefits from the spreadsheet by laying out different kinds of plots in the

Designing a Provenance-Based Climate Data Analysis Application 5
same spreadsheet. Creating 3D plots using DV3D’s set of tools was a simpletask. Before UV-CDAT, the scientist was required to save and manage dozensof scripts in order to know the operations and datasets used in the plots. Theprovenance captured in UV-CDAT is changing all that. The provenance of anyplot is readily accessible at any point in time of the analysis. The scripting sup-port was useful to generate scripts to run in batch mode for other time periods inthe model run. In addition, the captured provenance allows a student not famil-iar with the climate model output to learn and repeat the procedure describedabove.
5 ConclusionWe have described the UV-CDAT system, what we believe is the first provenance-enabled end-user visualization and analysis tool for ultra-scale climate analysis.UV-CDAT presents a novel architecture that seamlessly integrates workflows,provenance, climate data analysis libraries, and visualization tools in an end-to-end application. The system is already available to the climate community.Over the next year and a half, we will continue to refine and extend its func-tionality with the goal of making it the primary tool for climate scientists. Ourfuture work plans include to further refine UV-CDAT provenance and workflowcapabilities to make the integration with other packages as smoothly as possible.We plan to add a more intuitive and powerful provenance browser, and make iteasier for scientists to publish their analysis, workflows, and data products onthe web.Acknowledgments: This project has been funded by the U.S. Department ofEnergy (DOE) Office of Biological and Environmental Research (BER). This isa large project involving many institutions, including LLNL, LBNL, Los Alamos,ORNL, Kitware, NYU-Poly, SCI-Utah, and NASA.
References
1. Community Climate System Model version 3.0 (CCSM3).http://www.cesm.ucar.edu/models/ccsm3.0/. Accessed on Mar 21, 2012.
2. A. Brown and G. Wilson, editors. The Architecture of Open Source Applications:Elegance, Evolution, and a Few Fearless Hacks, chapter 23: VisTrails, pages 377–394. Lulu.com, 2011. http://www.aosabook.org/.
3. Climate Data Analysis Tools (CDAT). http://www2-pcmdi.llnl.gov/cdat. Accessedon Mar 21, 2012.
4. S. B. Davidson and J. Freire. Provenance and Scientific Workflows: Challenges andOpportunities. In Proceedings of SIGMOD, pages 1345–1350, 2008.
5. B. Doty and J. L. K. III. The Grid Analysis and Display System (GrADS): Apractical tool for Earth science visualization. In Eighth International Conference onInteractive Information and Procession Systems, Atlanta, GA, January 1992.
6. J. Freire, D. Koop, and C. Silva. Provenance for computational tasks: A survey.Computing in Science and Engineering, 10(3):11, 2008.
7. NASA. Dv3d. http://portal.nccs.nasa.gov/DV3D.8. Unidata. The Integrated Data Viewer (IDV).
https://www.unidata.ucar.edu/software/idv/. Accessed on Mar 21, 2012.


