Designing a Multi-Objective Three-Stage Location- Routing ...
19
Advances in Industrial Engineering, Autumn 2019, 53(4): 149-167 DOI: 10.22059/jieng.2021.313355.1744 RESEARCH PAPER Designing a Multi-Objective Three-Stage Location- Routing Model for Humanitarian Logistic Planning under Uncertainty Fatemeh Zafari, Davood Shishebori * Department of Industrial Engineering, Yazd University, Yazd, Iran Received: 08 November 2020, Revised: 17 February 2021, Accepted: 18 February 2021 © University of Tehran 2019 Abstract Natural and technological disasters threaten human life all around the world significantly and impose many damages and losses on them. The current study introduces a multi-objective three-stage location-routing problem in designing an efficient and timely distribution plan in the response phase of a possible earthquake. This problem considers uncertainty in parameters such as demands, access to routes, time and cost of travels, and the number of available vehicles. Accordingly, a three-stage stochastic programming approach is applied to deal with the uncertainties. The objective functions of the proposed problem include minimizing the unsatisfied demands, minimizing the arriving times, and minimizing the relief operations costs. A modified algorithm of the improved version of the augmented ε-constraint method, which finds Pareto-optimal solutions in less computational time, is presented to solve the proposed multi-objective mixed-integer linear programming model. To validate the model and evaluate the performance of the methods several test problems are generated and solved by them. The computational results show the satisfactory performance of the proposed methods and the effectiveness of the proposed model for the delivery of relief commodities in the affected areas. Keywords: Humanitarian logistics; Location-Routing Problem; Disaster Management; Multi-Objective optimization; Stochastic Programming. Introduction The International Federation of Red Cross and Red Crescent Societies (IFRC) defines a disaster as “a sudden, calamitous event that seriously disrupts the functioning of a community or society and causes human, material, and economic or environmental losses that exceed the community’s or society’s ability to cope using its resources” [1]. Disasters are as old as human being history and fall into two categories; natural disasters and technological disasters, which are caused by human factors. To keep a record of these disasters, the Center for Research on the Epidemiology of Disasters (CERD) has established the International Disaster Database (EM-DAT) including data on the occurrence and effects of more than 22000 disasters in the world from 1900 to the present day. A disaster can be recorded in this database if 10 or more people have died, 100 or more people have been affected, a situation of emergency has been declared, or international assistance has been called [2]. Based on the data from the EM-DAT, the number and magnitude of natural and technological disasters have grown exponentially during the past several decades and, accordingly, more people have been affected. The IFRC’s World Disaster Report (2015) declares that between 1994 and 2013, EM-DAT recorded 6,873 * Corresponding author: (D. Shishebori) Email: [email protected]
Transcript of Designing a Multi-Objective Three-Stage Location- Routing ...
Advances in Industrial Engineering, Autumn 2019, 53(4): 149-167 DOI: 10.22059/jieng.2021.313355.1744
RESEARCH PAPER
Designing a Multi-Objective Three-Stage Location-
Routing Model for Humanitarian Logistic Planning
under Uncertainty
Fatemeh Zafari, Davood Shishebori *
Department of Industrial Engineering, Yazd University, Yazd, Iran
Received: 08 November 2020, Revised: 17 February 2021, Accepted: 18 February 2021
© University of Tehran 2019
Abstract Natural and technological disasters threaten human life all around the world
significantly and impose many damages and losses on them. The current study
introduces a multi-objective three-stage location-routing problem in designing an
efficient and timely distribution plan in the response phase of a possible earthquake.
This problem considers uncertainty in parameters such as demands, access to
routes, time and cost of travels, and the number of available vehicles. Accordingly,
a three-stage stochastic programming approach is applied to deal with the
uncertainties. The objective functions of the proposed problem include minimizing
the unsatisfied demands, minimizing the arriving times, and minimizing the relief
operations costs. A modified algorithm of the improved version of the augmented
ε-constraint method, which finds Pareto-optimal solutions in less computational
time, is presented to solve the proposed multi-objective mixed-integer linear
programming model. To validate the model and evaluate the performance of the
methods several test problems are generated and solved by them. The
computational results show the satisfactory performance of the proposed methods
and the effectiveness of the proposed model for the delivery of relief commodities
in the affected areas.
Keywords: Humanitarian logistics;
Location-Routing Problem;
Disaster Management;
Multi-Objective
optimization;
Stochastic Programming.
Introduction
The International Federation of Red Cross and Red Crescent Societies (IFRC) defines a disaster
as “a sudden, calamitous event that seriously disrupts the functioning of a community or society
and causes human, material, and economic or environmental losses that exceed the
community’s or society’s ability to cope using its resources” [1]. Disasters are as old as human
being history and fall into two categories; natural disasters and technological disasters, which
are caused by human factors. To keep a record of these disasters, the Center for Research on
the Epidemiology of Disasters (CERD) has established the International Disaster Database
(EM-DAT) including data on the occurrence and effects of more than 22000 disasters in the
world from 1900 to the present day. A disaster can be recorded in this database if 10 or more
people have died, 100 or more people have been affected, a situation of emergency has been
declared, or international assistance has been called [2]. Based on the data from the EM-DAT,
the number and magnitude of natural and technological disasters have grown exponentially
during the past several decades and, accordingly, more people have been affected. The IFRC’s
World Disaster Report (2015) declares that between 1994 and 2013, EM-DAT recorded 6,873
* Corresponding author: (D. Shishebori)
Email: [email protected]

150 Zafari and Shishebori
natural disasters worldwide, which claimed a total of 1.35 million lives and 4360 million people
were affected by them over this period. According to this report, earthquakes are generally far
more deadly than any other type of disaster, accounting for nearly 750,000 deaths, which is
more than all deaths from others put together [3]. Earthquakes took place in Southeastern Iran
in December 2003, The Indian Ocean Tsunami in December 2004, Pakistan in October 2005,
Chilean in February 2010, Haiti in January 2010, Japan in March 2011 and Nepal in April 2015
are listed among recent major earthquakes in the world. Regarding the significant damages and
losses caused by disasters (including earthquakes), disaster management and humanitarian
logistics have become an important research area.
Humanitarian logistics involve a systematic approach to deal with natural and technological
disasters. They are classified into four main phases of the disaster management cycle, including
mitigation, preparedness, response, and recovery [4]; such that each of which is mostly defined
as a part of a continuous process.
The purpose of the mitigation phase is to prevent the occurrence of a disaster or reduce its
potential effects. The mitigation phase relates to predicting and analyzing potential risks and
carrying out activities such as strengthening infrastructures and preventing populating
dangerous and vulnerable areas. In the preparedness phase, arrangements such as the
positioning of necessary resources and providing a distribution plan are carried out for a
possible quick, efficient response after a disaster. The response phase focuses on immediate
post-disaster relief operations, aimed at minimizing the suffering and death of humans.
Assessment and evaluation of disruptions, locating relief facilities, routing of vehicles, rescue
and evacuation of victims, efficient management of available resources, and distribution of
relief commodities in the presence of severe time constraints are major challenges of this phase.
The recovery phase relates to improving the conditions of the affected areas through long-term
activities such as repair and reconstruction of infrastructures [5-8]. In general, disaster
management is a comprehensive, complex, and extensive process that begins before the
occurrence of a disaster with the phases of mitigation and preparedness. It continues with the
response and recovery phases in the event of a crisis. With an increasing number of studies on
disaster management through developing techniques, methods, and models of humanitarian
logistics, researchers have attempted to reduce the destructive effects of disasters. However, the
application of mathematical concepts and models in relief operations does not have a long
history and has emerged since the 1980s. Recent studies emphasize the importance of
formulating an appropriate mathematical model that can be used in pre-disaster planning (at the
strategic level) and the implementation of plans in the early hours and days after a disaster (at
the operational level). Logistics activities and the flow of relief commodities in the relief chain
is a major issue in the rescue operations after a disaster that can play a key role in saving the
lives of the victims and meeting the needs. In this regard, the present paper focuses on the
logistics perspective of the response phase and, in particular, the planning to design an efficient
and timely distribution system for delivering the relief commodities (RCs) at affected areas
(AAs) after an earthquake via two important related problems; location and routing. Typically,
approaches whereby location and routing problems are separately formulated usually result in
a suboptimal solution [9]. Since the integration of these two topics leads to better practical
solutions, the current study introduces a type of locating-routing problem called the Three
Stages Location Routing Problem (TS-LRP). In the first stage, some locations are selected as
depots for storing humanitarian aids. Also, decision making about the assignment of the local
depots (LDs) to the supply centers (SCs) and the determination of the number of RCs to be sent
in the selected depots are made. In the second stage, for each disaster scenario, a distribution
system is designed based on data on uncertain parameters. Assignment of distribution points
(DPs) to the opened LDs and routing of vehicles are the most important decisions of this stage.
In the third stage, with the receipt of new demand data, another response plan is presented. The
Advances in Industrial Engineering, Autumn 2019, 53(4): 149-167 151
third stage also deals with decisions on assigning of DPs to SCs and the routing of helicopters
in the air transportation network. Furthermore, the formulation of the problem is proposed as a
multi-objective model, including maximizing delivery value, maximizing delivery rate, and
minimizing delivery cost. For solving the multi-objective TS-LRP problem, a modified
algorithm of the improved version of the augmented ε-constraint method, which generates more
efficient solutions in lower computational time, is proposed. Since the LRPs are themselves
NP-hard [10], a non-dominated sorting genetic algorithm II, which is a simple but efficient
evolutionary algorithm (EA) for solving various multi-objective optimization problems, is
suggested for the problem at large sizes.
The remainder of this paper is organized as follows. A comprehensive review of the related
literature on the problem is provided in three research streams in the next section. In Section 3,
a detailed description of the problem, its assumptions, and the proposed mathematical model is
presented. Section 4 is devoted to the proposed methods with detailed explanations. The test
problems and results are discussed in Section 5. Finally, Section 6 states the conclusion and
makes some suggestions for future studies.
Literature Review
This section surveys the previous works on humanitarian logistics and brings three issues of
interest into focus. These issues that can be studied comparatively include a) location-routing
problems, b) multi-objective optimization problems, and c) multi-stage stochastic programming
problems. According to the literature mentioned in Table 1, various mathematical models have
already been introduced to help with planning in this field. The analysis of previous works
makes one convinced that, despite the significance of updated information about disasters and
reduction of their adverse effects over time, it has been paid little attention in response to
disasters. Considering the role and impact of changing data, especially about demands for
different types of relief commodities, any task of modeling the corresponding problems should
ensure the improved efficiency of emergency response plans. Also, most of the previous models
have included various decisions with different and often conflicting goals. For example,
maximizing the satisfied demand is one of the common goals in humanitarian logistics.
However, it alone does not guarantee the maximum survival of the affected individuals because
it may call for the delivery of relief commodities to the individuals who are no longer alive.
Accordingly, timely access to relief resources has a significant impact on the satisfaction and
the survival rate of individuals.
Minimizing latency (i.e. delay of vehicles or wait of affected individuals) should be taken
into account as another main goal in humanitarian logistics. It is clear that the efficient and
timely distribution of relief commodities also plays a critical role in post-disaster relief
operations. When a disaster occurs, some parts of the road transportation network may be
destroyed, and some roads may be out of access. This makes it very difficult to send or deliver
relief commodities to distribution centers. Most studies on relief logistics have used only the
road transportation network for the flow of relief commodities and have not defined alternative
routes in the network. Considering different modes of transportation and providing alternative
routes in modeling transportation networks is extremely important when designing a resilient
and reliable distribution system. The present study tries to fill in the research gap by the
simultaneous inclusion of all these features in the formulation of the proposed problem. Table
1 shows a brief review of the main characteristics of previous studies in the literature and
indicates the research gap.
The main contributions of the current study are listed below:

152 Zafari and Shishebori
The new TS-LRP is introduced using MIP. From the viewpoint of modeling, this is a
multi-commodity, multi-depot, and multi-transportation mode location-routing problem
with split delivery and a heterogeneous vehicle fleet.
Updating data on demand is considered in modeling the problem in three stages, and an
amount of extra demand s defined at the end of the second stage of the proposed
formulation. In the third stage, efforts are made to increase the efficiency of emergency
responses by designing another distribution system of delivering relief commodities to
affected areas.
By formulating a multi-objective programming model, along with attempts to maximize
the amount of delivery as the first objective of the problem, the modeler pay
simultaneous attention to time and cost to provide a quick, flexible, and efficient
response plan. In this way, a set of Pareto-optimal solutions are developed for the
problem that allow decision-maker to evaluate the trade-off between conflicting
objectives and then choose the best solution among them.
Due to its high speed, an air transportation network is utilized in the third stage, which
provides an alternative in the road transportation network in the second stage. These
two routes are incorporated into the proposed mathematical formulation. This feature
improves the responsiveness and reliability of the distribution system.
Due to the inadequacy of the required historical data, uncertainty in such parameters as
the amount of demand, the status of access to routes, the time and cost of travels, and
the number of available vehicles is taken into consideration. Additionally, a set of
possible earthquake scenarios is generated along with best distribution plan for each of
them. Depending on the case, the closest plan can be implemented in the event of a real
earthquake.
Statement and formulation of the problem
In this section, a mathematical formulation is developed for a new three-stage location-routing
problem in the humanitarian supply chain. The problem is first described in high details, and
then its formulation is presented.
Problem description
In this context, a three-stage stochastic programming approach is applied to design a problem
of distributing humanitarian aids and available vehicles from supply points to demand points in
the event of an earthquake. The first stage involves facility location decisions regarding the
opening of local depots, whereas the last two stages concern decisions about distribution
planning, including the allocation of limited resources and routing of vehicles. Among the
several contributors to the humanitarian supply chain, three are the central actors relevant to the
problem of the current study. They comprise Supply Centers (SCs), Local Depots (LDs), and
Distribution Points (DPs). SCs serve as the initial source of supply and deliver general logistic
supports to operations. LDs, as considered in this study, are temporary ones. They are non-
stationary and non-operational in times of no crisis and are generally located at sites appropriate
for handling large inflows and outflows of goods and personnel, such as airports and train
stations. DPs are centralized locations in which people can collect their immediate needs (e.g.,
canned food, water bottles, blankets, etc.) faster and more easily. They are selected from the
existing schools and mosques in nearly every one of the districts in need. LDs are in charge of
the operation and finally the demobilization of DPs. The amount and the type of commodities
sent to different DPs are also determined at LDs.

Advances in Industrial Engineering, Autumn 2019, 53(4): 149-167 153
Table 1. An overview of the related literature and the research gap.
Year
Referen
ce
Covered Problem type
Objective Concerned obj. function Uncertainty elements Other characteristics
phases function
Prep
aredn
ess
Resp
on
se
RA
P
FL
P
VR
P
NF
P
LR
P
Sin
gle o
bj.
Multip
le ob
j.
To
tal cost
To
tal distan
ce\time
Laten
cy/w
aiting
time
Un
satisfied/sat. d
eman
d
Oth
ers
Dem
and
Netw
ork
Cap
acity
Co
st
Tim
e
Tw
o-stag
e
Multi-stag
e
Multi-m
od
e
Multi-ro
ute
Multi-item
Case stu
dy
2004 [23]
2007 [14]
2008 [8]
2010 [24]
2010 [25]
2010 [26]
2011 [15]
2012 [16]
2012 [27]
2013 [17]
2014 [9]
2014 [10]
2014 [18]
2014 [28]
2015 [3]
2015 [29]
2016 [5]
2016 [19]
2016 [4]
2016 [11]
2016 [30]
2017 [20]
2017 [12]
2018 [13]
2019
Yahyaei
and
Bozorgi-
Amiri
The
proposed
model (2020)
There are some factors that restrict the local agents in making decisions and planning
influential strategies. The amount and type of demands, size of available vehicles, and state of
infrastructures are the highly uncertain factors in this study. Moreover, transportation time and
cost are uncertain too due to the uncertainty in the state of the road network. So, the knowledge
of the time and cost of travels is not gained until damaged routes are determined. As far as
uncertainty is concerned in this study, these aspects and their consequences are mostly in focus.
It is to be noted that the demand districts may be in remote areas, and the disaster areas might
be in a chaotic state under emergencies, making it impossible to have a comprehensive
overview. Hence, demand is often considered as one of the most uncertain parameters in
humanitarian logistics. This uncertain parameter can fluctuate unexpectedly because of
aftershock damages, taking resort to more self-sufficiency by people, movement of individuals
from region to region in the hope of getting more relief, or the spread of contagious diseases.
Unpredictable demand patterns affect the distribution plans as well as the management of relief

154 Zafari and Shishebori
efforts. Therefore, distribution planning activities are complicated by uncertainty and limited
data.
Shortly after an earthquake, relief agencies and local agents send a team of experts to the
affected areas (AAs) to collect and report information about the consequences of the
earthquake. They make an initial assessment of the earthquake and the needs of the affected
people. This serves as a basis to initiate an emergency response. Based on the location of the
demand districts, several DPs are inaugurated in the area to provide immediate relief for the
affected people. The location of the DPs serves as the basis for the determination of the LDs to
open and operate. Relief commodities (RCs) are sent from the SCs when the experts are
engaged in gathering more information about the state of AAs. Before it is known what scenario
has occurred and how it has affected human life and the environment, several early decisions
are made only on the basis of the degree of severity and the location of the earthquake. These
decisions regard the selection of the right LDs from a set of potential locations to open, the
assignment of LDs to SCs, and the allocation of RCs to LDs. They are modeled as decisions to
make in the first stage. The vehicles that have already arrived at the LDs mark the transition
from the first stage to the second stage.
Within the first hours after an incident, the initial data on demand are received at DPs, and
the number of vehicles available at each LD, the status of access to routes in the road network,
and time and cost of travels are more or less confirmed. Accordingly, the initial distribution
plan is designed at LDs. Now that the data are available, vehicles are packed and dispatched
from the LDs as soon as they are loaded according to the plan. Assignment of DPs to LDs,
selection of appropriate routes for different vehicles, and determination of the number of RCs
to be delivered to DPs are the specific required actions in the second stage. Note that locating
LDs in the first stage and routing vehicles in the second stage are integrated, and a location-
routing problem is established. Also, from the start of a relief operation, the location of DPs
and the status of the road network are significant in the locating of LDs. Since the team of
experts has no precise data on the level and nature of the demand at DPs when the vehicles
leave the LDs, before the completion of the information, the initial data on demand (i.e. the
main demand) must be satisfied. Therefore, the vehicles sent will need to deliver the RCs to the
extent possible. As time passes on, the amount of information about the demand rises via the
reports by the team of experts. In some cases, due to demand fluctuations, additional demand,
called extra demand, is identified at DPs. For those cases to which this applies, another plan is
designed to distribute humanitarian aids based on new data on demand. The third stage
corresponds to the updated demand information and the required actions for the RCs re-
transported toward different DPs. It is assumed that new data on demand are received when the
vehicles have arrived at DPs and delivered RCs to them. The challenges of the third stage
include assigning DPs to SCs, determining the number of RCs to be carried, and finding routes
and a sequence for helicopter movements. The more immediately a relief operation is carried
out, the more people are saved from death, and the better the impacts of the disaster are
controlled. Therefore, in an efficient humanitarian logistics system, a sufficient number of RCs
should be distributed in AAs within a limited time after a disaster. This is why, in the third
stage, RCs are sent from SCs to DPs through an air transportation network.
The first-stage transportation is carried out by only one type of vehicle in the road network.
Each vehicle begins its route from a single SC and returns to it after delivering RCs to an LD.
The second-stage transportation is carried out by various vehicles in the road network.
Additionally, a set of available routes is defined between every two nodes of the second-stage
road network, so that, if some of them are destroyed, alternative routes will be available to use.
At this stage, multiple depots are opened, but a vehicle must start its tour from one of the LDs,
travel to one or a few DPs, and then return to the same depot without a sub-tour. The third-stage
transportation is carried out by carrier helicopters in the air network. Choosing routes for

Advances in Industrial Engineering, Autumn 2019, 53(4): 149-167 155
helicopters is based on the same requirements as for the other vehicles; each helicopter must
start its tour from a single SC, visit its assigned DPs, and come back to that center without sub-
tours. The current study, thus, presents a multi-commodity, multi-depot, multi-transportation
mode, multi-objective, and three-stage locating-routing model under uncertainty in a three-level
relief chain which includes SCs, LDs, and DPs. Fig. 1 shows the scheme of the relief supply
chain.
The proposed formulation is based on the following assumptions. In the second and third
stages, split delivery is allowed. More specifically, multiple vehicles can serve each DP. It
means that one DP can receive various commodities with different carriers, and one of them
can partly satisfy the demand of one DP. Capacity considerations are essential in determining
the quantities to deliver. The total RCs delivered by a vehicle on one tour cannot exceed its
capacity. The total RCs sent from each SC should not exceed its capacity. The total RCs
delivered to each LD cannot be more than its capacity. Sometimes, it is not possible to fulfill
all the demands even with additional resources. Accordingly, to distribute RCs, a service level
is defined and employed as a minimum percentage of demand satisfaction in the second and the
third stages. The maximum number of available vehicles at LDs or SCs is limited. Each SC can
have different types of RCs. Each LD can store different types of RCs. Each DP can receive
services from only one LD in the second stage and one SC in the third stage. Each vehicle is
allowed to stow different types of RCs for each given transportation assignment. Finally, each
vehicle is assigned to one LD or SC.
Supply Center
Local Depot
Distribution Point
Fig. 1. The general scheme of the distribution system in the proposed relief chain
Sets, parameters, and decision variables
This section defines the sets, indices, parameters, and decision variables involved in the model.
Sets:
U Set of SCs indexed by , {1,2,...,| |}u u U U
I Set of candidate points for LDs indexed by , {1,2,...,| |}i i I I
J Set of DPs indexed by , {1,2,...,| |}j j J J L Set of SCs and DPs indexed by , {1,2,...,| |}u j L U J K Set of candidate points for LDs and DPs indexed by , {1,2,...,| |}i j K I J
R Set of vehicles in the second stage indexed by {1,2,..., { }}V
ivsi I v Vs Sr R Max F

156 Zafari and Shishebori
Rʹ Set of helicopters in the third stage indexed by {1,2,..., { }}H
usu Us Sr R Max F
V Set of vehicle types in the second stage indexed by {1,2,...,| |}v V V
N
Set of routes in the second stage indexed by
{0,1,..., { / 2}}V
ijvsi K j Ks S v Vn N Max Max G
B Set of RC types indexed by {1,2,...,| |}b B B S Set of disaster scenarios indexed by {1,2,...,| |}s S S
Deterministic parameters:
bQ The occupied volume of each unit of RC type b (m3)
ubS The supply capacity of SC u for each RC type b (m3) D
iC The storage capacity of LD i (m3) VC The load capacity of each vehicle in the first stage (m3) V
vC The load capacity of each vehicle type v in the second stage (m3) HC The load capacity of each helicopter in the third stage (m3)
VE The fixed cost of using each vehicle in the first stage (Monetary Unit (MU)) V
vE The fixed cost of using each vehicle type v in the second stage (MU) HE The fixed cost of using each helicopter in the third stage (MU)
D
iE The fixed cost of opening LD i (MU) C
bE Procurement cost of each unit of RC type b (MU) P
bE Shortage penalty cost of each unit of RC type b (MU) V
uiE Transportation cost of each unit of RC from SC u to LD i in the road network (MU) H
ujE Transportation cost of each unit of RC from node u L to node j L in the air network (MU)
V
uiT Travel time between SC u and LD i in the road transportation network (Minute) H
ujT Travel time between node u L and node j L in the air transportation network (Minute) V
uF Total number of available vehicles at SC u
sP The probability of disaster occurrence scenario s (0 1; 1)s ssP P
M A large positive number
Stochastic parameters: V
jbsD Main demand for each unit of RC type b at DP j in scenario s H
jbsD Extra demand for each unit of RC type b at DP j in scenario s V
jbs Minimum percentage of demand for RC type b in DP j that should be satisfied at the end of
the second stage in scenario s (0 1)V
jbs H
jbs Minimum percentage of demand for RC type b in DP j that should be satisfied at the end of
the third stage in scenario s (0 1)H
jbs V
ivsF Total number of available vehicles type v at LD i in scenario s H
usF Total number of available helicopters at SC u in scenario s

Advances in Industrial Engineering, Autumn 2019, 53(4): 149-167 157
V
ijvsG Total number of available routes between node i K and node j K that can be used by
vehicle type v in scenario s V
ijnsE The transportation cost of each unit of RC from node i K to node j K in the road
network through route n in scenario s (MU) V
ijnsT Travel time between node i K and node j K in the road network through route n in
scenario s (Minute)
Variables in the first stage: V
uibY
Amount of RC type b that is delivered by vehicles from SC u to LD i V
uiX
Number of vehicles that travel from SC u to LD i in the road network V
iO
A binary variable equal to 1 if LD i is opened, 0 otherwise V
uiZ
A binary variable equal to 1 if a vehicle travels from SC u to LD i, 0 otherwise V
iT
The arrival time of the vehicle (s) at LD i
Variables in the second stage: V
ijrbsY
Amount of RC type b that is delivered by vehicle r from LD i to DP j in scenario s V
js
Auxiliary variable for sub-tour elimination constraints in the route of the vehicle (s) when
arriving at DP j in scenario s V
jbs
Amount of unsatisfied demand of RC type b at DP j at the end of the second stage in
scenario s V
ijsX
A binary variable equal to 1 if DP j is assigned to LD i in scenario s, 0 otherwise V
ijnrsZ
A binary variable equal to 1 if vehicle r travels from node i K to node j K in the road
network through route n in scenario s, 0 otherwise V
jsT
The arrival time of the vehicle (s) at DP j in scenario s
Variables in the third stage: H
ujr bsY
Amount of RC type b that is delivered by helicopter rʹ from SC u to DP j in scenario s H
js
Auxiliary variable for sub-tour elimination constraints in the route of the helicopter (s)
when arriving at DP j in scenario s H
jbs
Amount of unsatisfied demand of RC type b at DP j at the end of the third stage in scenario
s H
ujsX
A binary variable equal to 1 if DP j is assigned to SC u in scenario s, 0 otherwise H
ujr sZ
A binary variable equal to 1 if helicopter rʹ travels from node u L to node j L in
scenario s, 0 otherwise H
jsT
The arrival time of the helicopter (s) at DP j in scenario s
Other decision variables: T
sA
The maximum value of vehicle arrival times at different DPs in scenario s (at the end of the
second stage) B
sA
Upper bound of the total cost of relief operations in scenario s (at the end of the third stage)
Mathematical formulation

158 Zafari and Shishebori
This section represents the formulation for the proposed TS-LRP.
Objective functions:
1 .( )V H
s jbs jbs
j J b B s S
Min Z P
(1)
2 . H
s js
j J s S
Min Z P T
(2)
3 . B
s s
s S
Min Z P A
(3)
Eq. 1 shows the first objective function which minimizes the unmet demand in the second and
the third stages. The second objective function minimizes the total waiting time for DPs to
receive RCs or the total latency, which is equal to the sum of the helicopters’ arrival times at
DPs at the end of the third stage. The third objective function minimizes the maximum cost of
the relief operations.
First stage constraints:
. .V D V
uib b i i
u U b B
Y Q C O i I
(4)
. . ,V V V
uib b ui
b B
Y Q C X u U i I
(5)
V V
ui u
i I
X F u U
(6)
. 0 ,V V V
ui u uiX F Z u U i I
(7)
0 ,V V
ui uiZ X u U i I
(8)
(1 ). ,V V V
ui ui iT Z M T u U i I
(9)
Constraint (4) relates to the capacity of LDs. It preventing the inflow of RCs to LDs excluded
from the distribution process. Constraint (5) prevents the violation of the vehicle capacity.
Constraint (6) limits the number of vehicles leaving SCs according to the size of the available
ones, while constraint (7) controls the number of vehicles traveling between an SC and an LD.
Constraint (8) assures coherence between the integer variable defining the number of vehicles
traveling on a route and the corresponding binary variable. Constraint (9) calculates the arrival
time of vehicles at LDs, which is equal to the travel time between an SC and an LD.
Second stage constraints: 0 , ,V V
ijnrs jinrs
j K n N j K n Nj i j i
Z Z i K r R s S
(10)
1 , ,V
jj nrs
j J n Nj j
Z j J r R s S
(11)
1 , ,V
ijnrs
i K n Ni j
Z j J r R s S
(12)
1 ,V
ijnrs
i I j J n N
Z r R s S
(13)
1 , , , ,V
ijnrs
n N
Z i K j K j i r R s S
(14)
1 , , ,V V V
ijnrs jj nrs ij s
j J n N j K n Nj j
Z Z X i I j J r R s S
(15)
1 ,V
ij s
i I
X j J s S
(16)
Advances in Industrial Engineering, Autumn 2019, 53(4): 149-167 159
, ,Vivs
V V
ijnrs ivs
j J n N r F
Z F i I v V s S
(17)
. . ,V V V
ijrbs b r ijnrs
i I j J b B i I j J n N
Y Q C Z r R s S
(18)
. . , ,V V V
ijrbs b r ijnrs
i I b B i K n Ni j
Y Q C Z j J r R s S
(19)
. , ,V V V
ijrbs jbs jbs
i I r R
Y D j J b B s S
(20)
, ,V V V
jbs ijrbs jbs
i I r R
D Y j J b B s S
(21)
.(1 ) ( . ). , , , , ,V V V V V
js j s jj nrs j bs j bs b
b B
M Z D Q j J j J j j n N r R s S
(22)
.(1 ) , , , ,V V V V
i ijns ijnrs jsT T M Z T i I j J n N r R s S
(23)
.(1 ) , , , , ,V V V V
j s j jns j jnrs jsT T M Z T j J j J j j n N r R s S
(24)
. ,V V
js ijs
i I
T M X j J s S
(25)
,V T
js sT A j J s S
(26)
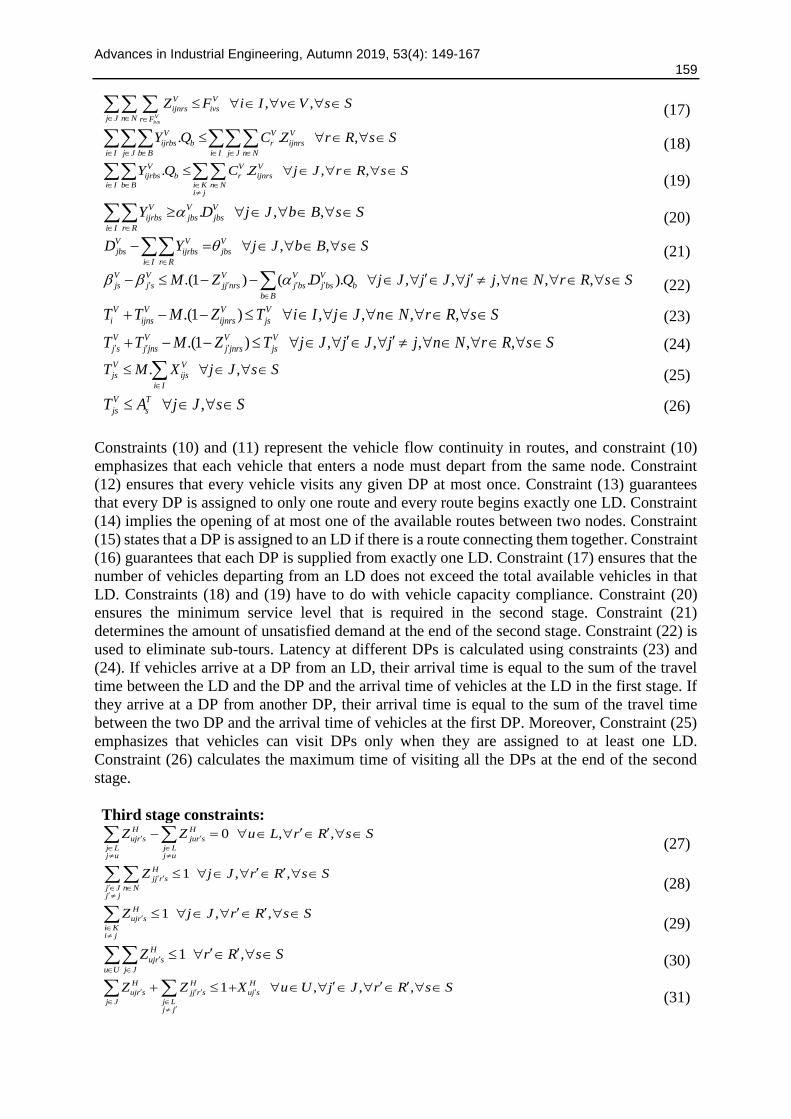
Constraints (10) and (11) represent the vehicle flow continuity in routes, and constraint (10)
emphasizes that each vehicle that enters a node must depart from the same node. Constraint
(12) ensures that every vehicle visits any given DP at most once. Constraint (13) guarantees
that every DP is assigned to only one route and every route begins exactly one LD. Constraint
(14) implies the opening of at most one of the available routes between two nodes. Constraint
(15) states that a DP is assigned to an LD if there is a route connecting them together. Constraint
(16) guarantees that each DP is supplied from exactly one LD. Constraint (17) ensures that the
number of vehicles departing from an LD does not exceed the total available vehicles in that
LD. Constraints (18) and (19) have to do with vehicle capacity compliance. Constraint (20)
ensures the minimum service level that is required in the second stage. Constraint (21)
determines the amount of unsatisfied demand at the end of the second stage. Constraint (22) is
used to eliminate sub-tours. Latency at different DPs is calculated using constraints (23) and
(24). If vehicles arrive at a DP from an LD, their arrival time is equal to the sum of the travel
time between the LD and the DP and the arrival time of vehicles at the LD in the first stage. If
they arrive at a DP from another DP, their arrival time is equal to the sum of the travel time
between the two DP and the arrival time of vehicles at the first DP. Moreover, Constraint (25)
emphasizes that vehicles can visit DPs only when they are assigned to at least one LD.
Constraint (26) calculates the maximum time of visiting all the DPs at the end of the second
stage.
Third stage constraints: 0 , ,H H
ujr s jur s
j L j Lj u j u
Z Z u L r R s S
(27)
1 , ,H
jj r s
j J n Nj j
Z j J r R s S
(28)
1 , ,H
ujr s
i Ki j
Z j J r R s S
(29)
1 ,H
ujr s
u U j J
Z r R s S
(30)
1 , , ,H H H
ujr s jj r s uj s
j J j Lj j
Z Z X u U j J r R s S
(31)

160 Zafari and Shishebori
1 ,H
ij s
u U
X j J s S
(32)
,H
us
H H
ujr s us
j J r F
Z F u U s S
(33)
. . ,H H H
ujr bs b ujr s
u U j J b B u U j J
Y Q C Z r R s S
(34)
. . , ,H H H
ujr bs b ujr s
u U b B u Lu j
Y Q C Z j J r R s S
(35)
( ). , ,H H V H
ujr bs jbs jbs jbs
u U r R
Y D j J b B s S
(36)
( ) , ,H V H H
jbs jbs ujr bs jbs
u U r R
D Y j J b B s S
(37)
.(1 ) ( ). . , , , ,H H H H V H
js j s jj r s j bs j bs j bs b
b B
M Z D Q j J j J j j r R s S
(38)
.(1 ) , , ,T H H H
s uj ujr s jsA T M Z T u U j J r R s S
(39)
.(1 ) , , , ,H H H H
j s j js j j rs jsT T M Z T j J j J j j r R s S
(40)
. ,H H
js ujs
u U
T M X j J s S
(41)
Constraints (27)-(30) correspond to (10)-(13) of the second stage, while constraints (31)-(41)
correspond to (15)-(25) of the second stage.
Efficiency constraints applied to all stages:
, ,V H
uib ujr bs ub
i I j J r R
Y Y S u U b B s S
(42)
0 , ,V V
ijrbs uib
j J r R u U
Y Y i I b B s S
(43)
. . . .
. . .( )
. .
C V V V V V D V
b uib ui ui ui i i
u U i I b B u U i I u U i I i I
V V V V P V H
r ijnrs ijns ijnrs b jbs jbs
i I j J n N r R i K j J n N r R j J b Bj i
C H H
b ujr bs
u U j J r R b B j J r R
E Y E X E Z E O
E Z E Z E
E Y E
.H H H B
ujr s uj ujr s s
u U u L j J r Rj u
Z E Z A
s S
(44)
The supply constraint (42) ensures that the amount of RCs sent from SCs is kept within the
maximum amount available in them. Constraint (43) states that the amount of RCs dispatched
from LDs does not exceed the amount of RCs brought to them (input-output balance).
Constraint (44) calculates the maximum cost of the relief operations, including procurement,
shortage penalty, transportation costs of RCs, and fixed costs of using vehicles and opening
LDs.
Non-negativity constraints for all stages:
0 , ,V
uibY u U i I b B
(45)
0V
iT i I
(46)
0 , V
ui and inteX uer i Ig U
(47)
0,1V
iO i I
(48)
0,1 ,V
uiZ u U i I
(49)
0 , , , ,V
ijrbsY i I j J r R b B s S
(50)

Advances in Industrial Engineering, Autumn 2019, 53(4): 149-167 161
0 ,V
js j J s S
(51)
0 , ,V
jbs j J b B s S
(52)
0 ,V
jsT j J s S
(53)
0,1 , ,V
ijsX i I j J s S
(54)
0,1 , , , , ,V
ijnrsZ i K j K i j n N r R s S
(55)
0 , , , ,H
ujr bsY u U j J r R b B s S
(56)
0 ,H
js j J s S
(57)
0 , ,H
jbs j J b B s S
(58)
0 ,H
jsT j J s S
(59)
0,1 , ,H
ujsX u U j J s S
(60)
0,1 , , , ,H
ujr sZ u L j L u j r R s S
(61)
, 0T B
s sA A s S
(62)
Finally, constraints (45)-(62) define the ranges and types of decision variables.
Solution methodology
Exact solution method: AUGMECON2
In the literature on humanitarian logistics, there are many multi-objective problems (MOPs)
and several methods to solve them. These methods seek to find a set of solutions called Pareto-
optimal (non-dominated or efficient) solutions rather than optimal solutions [31]. Based on the
time of taking preferences from the decision-maker, the methods for solving MOPs fall into
three categories: a priori, interactive, and a posteriori. In a priori approaches, before the solution
process, decision-making preferences such as setting goals or weights for the objectives are
determined. In interactive methods, the most preferred solutions are progressively explored by
a repetitive process according to the decision-making preferences. In a posteriori methods, from
the Pareto front, a set of non-dominated solutions is determined, and, if necessary, more are
explored. Then, the decision-maker is applied to select the most preferred solution [32].
While all the efficient solutions are not identified in a priori and interactive methods, in a
posteriori ones, all Pareto-optimal solutions are generated, or a sufficient sample of them is
made. These methods are often preferred when the access to decision-makers is limited. The ε-
constraint method is one of the best-known and popular a posteriori methods to find Pareto-
optimal solutions. It is also widely used to solve a variety of MOPs (e.g., see [12, 14, 18, 20-
22, 30, 31]). This method was first introduced by Haimes et al. [33], and its comprehensive
discussion was presented by Vira and Haimes [34]. They demonstrated that the ε-constraint
method guarantees the achievement of an entire non-dominated set for a general multi-objective
problem given a suitable increase in the value of ε vectors. Herein, applying the ε-constraint is
embraced for its simplicity and ease of determining the appropriate values of ε to identify all
the efficient solutions [35-37].
Meta-heuristic solution method: NSGA-II

162 Zafari and Shishebori
In this section, a Multi-Objective Evolutionary Algorithm (MOEA) is applied to solve the MOP
in question. The NP-hard nature of the proposed TS-LRP and the existence of the multiple
conflicting objectives in its formulation justify the use of MOEAs in the present study. Among
different MOEAs, Non-dominated Sorting Genetic Algorithm II (NSGA-II), introduced by Deb
et al. [38], is one of the most efficient algorithms to solve MOPs (see [13-16, 21, 39-41] for
example). Herein, the NSGA-II is applied because of its popularity, simplicity, and ability to
solve various optimization problems. For a comprehensive illustration of the NSGA-II, the
readers can refer to [38].
Computational results
Test problems
In this section, 18 test problems are designed to verify the proposed model for the TS-LRP and
evaluate the performance of the presented methods. Each test problem is characterized by a
vector as (|U|, |I|, |J|, |R|, |Rʹ|, |M|, |N|, |B|, |S|), which indicates its dimension. The instances are
classified into small, medium, and large-scale problems. For all of them, the number of
scenarios, types of RCs, and types of vehicles are considered equal to two. Moreover, the
number of SCs, potential LDs, DPs, vehicles, and routes change from 2 to 3, 2 to 3, 2 to 8, 2 to
6, and 2 to 18 respectively. The occupied volume of each unit of RCs is 0.05 and 0.03 (m3) for
types 1 and 2, and the procurement costs of them are 100000 and 540000 (MU). The shortage
penalty cost of each unit of RC is five times more than its procurement cost. The transportation
cost of each unit of RC in the road and air networks is equal to 35 and 50 per minute (MU). The
load capacity of each vehicle in the first stage, each vehicle of type 1 and type 2 in the second
stage, and each helicopter are 92, 66, 33, and 87 (m3) respectively. The fixed cost of using these
items is 7776000, 5184000, 6480000, and 38775000 (MU) respectively. The supply capacity
of all the SCs for different types of RCs is the same and equal to 5000 (m3). The storage
capacity of each LD is 2000 (m3), and the fixed cost of opening it is 124300000 (MU).
For all types of RCs at all DPs in all scenarios, the minimum percentage of demand that
should be satisfied at the end of the second stage is assumed to be 0.7. This parameter is
supposed to be 0.8 at the end of the third stage. The time of travels is calculated using the
Euclidean distance between the nodes and the average speed of vehicles (approximately 65
km/h for road vehicles and 180 km/h for helicopters). The cost of travels is equal to the
transportation cost of each unit of RCs multiplied by its time. The number of constraints, the
number of variables, and the dimension of the mathematical model are presented in Table 2 for
the test problems. The three-objective model is separately solved as three single-objective
models. The mathematical formulation of each single-objective problem is coded in GAMS
25.1.2 and solved by the CPLEX solver for the test problem using a PC with configurations:
Intel Core i7, 2.59 GHz, 64-bit, and RAM 8.00 GB.
Table 2. Characteristics of the test problems

Advances in Industrial Engineering, Autumn 2019, 53(4): 149-167 163
Problem
size
Problem
number
Problem dimension
Constraints Variables
Small
1 (2, 2, 2, 2, 2, 2, 2, 2, 2) 241 135
2 (2, 2, 2, 2, 2, 2, 7, 2, 2) 311 167
3 (2, 2, 3, 2, 2, 2, 6, 2, 2) 427 227
4 (2, 2, 3, 3, 2, 2, 5, 2, 2) 447 241
5 (2, 2, 3, 2, 2, 2, 10, 2, 2) 443 243
6 (2, 2, 3, 4, 2, 2, 4, 2, 2) 463 249
Medium
7 (2, 2, 3, 4, 2, 2, 8, 2, 2) 611 229
8 (2, 2, 5, 2, 2, 2, 7, 2, 2) 653 375
9 (2, 2, 5, 2, 2, 2, 10, 2, 2) 783 411
10 (2, 2, 5, 3, 2, 2, 9, 2, 2) 811 435
11 (2, 2, 5, 3, 2, 2, 10, 2, 2) 829 443
12 (2, 2, 5, 3, 2, 2, 12, 2, 2) 848 451
Large
13 (2, 3, 5, 6, 2, 2, 12, 2, 2) 1196 575
14 (2, 2, 8, 2, 2, 2, 16, 2, 2) 1349 723
15 (2, 3, 8, 3, 2, 2, 16, 2, 2) 1500 781
16 (2, 3, 8, 3, 2, 2, 18, 2, 2) 1512 789
17 (2, 2, 8, 3, 2, 2, 16, 2, 2) 1561 803
18 (2, 3, 8, 4, 2, 2, 18, 2, 2) 1764 877
Result analysis
In this section, the test instances defined in Section 5.1 are solved to verify the formulated
model and examine the performance of the proposed methods. The M-AUGMECON2 is coded
in GAMS 25.1.2, and the NSGA-II is coded in MATLAB R2015b. The algorithms are
implemented using a PC with configurations mentioned in Section 5.1. To solve the test
problems by the proposed M-AUGMECON2, the weight of the first, second, and third
objectives are considered to be 0.4, 0.35, and 0.25 respectively. Also, the satisfaction degree
of violation of the first, second, and third objectives from their optimal values, which are 4, 5,
and 6 percent, is assumed to be 0.9. To solve the test problems by the proposed NSGA-II, first,
MINITAB 17.0 is used to carry out the Taguchi analysis of the effect of the NSGA-II
parameters on the solutions of the test problems. Therefore, the NSGA-II is evaluated for 162
runs, and the best levels of its parameters are determined based on the S/N ratio graphs.
The results obtained by using the two proposed methods to solve the test problems are
reported in Table 4. It is to be emphasized that although M-AUGMECON2 works well for small
and medium-scale problems, it is not capable of solving large-scale problems within the
computing time of 14400 seconds. Accordingly, NSGA-II is proposed to solve such problems.
It has satisfactory performance and obtains Pareto-optimal solutions in less than 570 seconds.
As the size of the instances increases, the elapsed time to reach the Pareto front also increases
in the two proposed algorithms. Since AUGMECON2 reaches Pareto-optimal solutions in small
and medium-scale problems within the specified computational time, it is a good opportunity
to compare the two methods used here. The results obtained from the comparison of the M-
AUGMECON2 and the NSGA-II in terms of computational time, the number of Pareto points,
and the average values for the first, second, and third objectives are presented in Figs. 2 and 3.
The NSGA-II provides a great convergence to the Pareto-optimal front and performs better for
larger-scale problems in much lower computational time than the M-AUGMECON2 does. Note
that, in smaller-scale problems, CPUTs for both algorithms are almost of the same range.
Regarding the number of Pareto points, it seems that the NSGA-II works well. The remarkable

164 Zafari and Shishebori
fact to be noted is that, although experimental results point to the high ability of the NSGA-II
to deal with large-scale problems, knowing its weaknesses (such as the low diversity of its
solutions) can lead to the improvement of its current framework in future studies.
Fig. 2. Comparing M-AUGMECON2 and NSGA-II methods by CPUT metric
Fig. 3. Comparing M-AUGMECON2 and NSGA-II methods by NPS metric
Conclusion and future research
The number and the severity of disasters have increased in recent decades, causing heavy losses
in human societies. Making appropriate decisions for logistic operations in response to
unpredictable disasters such as earthquakes can reduce casualties. In this regard, the present
study has introduced a multi-objective three-stage location-routing problem (TS-LRP) to design
an efficient and timely distribution plan for responding to a possible earthquake under
uncertainty and conditions close to the real world. The objectives of the problem consist of
maximizing the delivery value, maximizing the delivery rate, and minimizing the delivery cost.
In this study, a modified version of AUGMECON2 (M-AUGMECON2) is developed to solve
the multi-objective TS-LRP, which provides a set of Pareto-optimal solutions for the decision-
maker to implement a response plan. Also, NSGA-II is proposed for large-scale problems. To
validate the model and evaluate the performance of the methods, several test problems are
0
1000
2000
3000
4000
5000
6000
7000
8000
18
CPUT
M-AUGMECON2
NSGA-II
0
5
10
15
20
25
30
35
40
45
50
18
NPS
M-AUGMECON2
NSGA-II

Advances in Industrial Engineering, Autumn 2019, 53(4): 149-167 165
generated and solved by the two proposed algorithms. Furthermore, for different test problems
of small and medium sizes, the problem-solving methods are compared. The results obtained
show the satisfactory performance of the NSGA-II in terms of low computation time and good
convergence to the Pareto-optimal front. Moreover, the model takes into account the fluctuation
of demands by defining the third stage of decision-making. In this way, with a short time spent
in the air network and the costs of the third stage accepted, more RCs can be sent to AAs, as
compared to a two-stage model that does not consider updated demands. This feature points to
the effectiveness and the improved performance of the model as well as its contribution to
emergency responses to a disaster. The establishment of LDs in appropriate locations, optimal
allocation of limited resources, and selection of the shortest routes for vehicles for efficient and
timely delivery of RCs are the other promising results of solving the model for several test
instances. Since information changes at different times during an emergency, providing a
dynamic model for the corresponding problem is a recommendation of interest for future
research. Another recommended topic is the investigation of a problem when AAs are
prioritized to deliver RCs to victims in difficult areas. Also, the use of inventory control
methods, the use of other approaches to dealing with uncertainty, such as fuzzy programming
and robust optimization, and the use of heuristic or meta-heuristic methods for the proposed
model make good topics for future research.
References
[1] IFRC. What is a Disaster?. 2018; Available from: https://www.ifrc.org/en/what-we-
do/disaster-management/about-disasters/what-is-a-disaster/.
[2] EM-DAT. Criteria. 2018; Available from: https://www.emdat.be/explanatory-notes.
[3] CRED, Report on Human cost of Natural Disasters. A global perspective. 2015.
[4] McLoughlin, D.J.P.a.r., A framework for integrated emergency management. Public
Administration Review, 1985. 45: p. 165-172.
[5] Toth, P. and D. Vigo, Vehicle routing: problems, methods, and applications. 2014: SIAM.
[6] Ahmadi, M., A. Seifi, and B. Tootooni, A humanitarian logistics model for disaster relief
operation considering network failure and standard relief time: A case study on San Francisco
district. Transportation Research Part E: Logistics and Transportation Review, 2015. 75: p. 145-
163.
[7] Caunhye, A.M., et al., A location-routing model for prepositioning and distributing emergency
supplies. Transportation research part E: logistics and transportation review, 2016. 90: p. 161-
176.
[8] Ransikarbum, K. and S.J.J.I.J.o.P.E. Mason, Goal programming-based post-disaster decision
making for integrated relief distribution and early-stage network restoration. International
Journal of Production Economics, 2016. 182: p. 324-341.
[9] Moshref-Javadi, M. and S.J.E.J.o.O.R. Lee, The latency location-routing problem. European
Journal of Operational Research, 2016. 255(2): p. 604-619.
[10] Tuzun, D. and L.I.J.E.j.o.o.r. Burke, A two-phase tabu search approach to the location routing
problem. European Journal of Operational Research, 1999. 116(1): p. 87-99.
[11] Ukkusuri, S.V. and W.F. Yushimito, Location routing approach for the humanitarian
prepositioning problem. Transportation research record, 2008. 2089(1): p. 18-25.
[12] Rath, S. and W.J. Gutjahr, A math-heuristic for the warehouse location–routing problem in
disaster relief. Computers & Operations Research, 2014. 42: p. 25-39.
[13] Wang, H., L. Du, and S. Ma, Multi-objective open location-routing model with split delivery
for optimized relief distribution in post-earthquake. Transportation Research Part E: Logistics
and Transportation Review, 2014. 69: p. 160-179.
[14] Nedjati, A., G. Izbirak, and J. Arkat, Bi-objective covering tour location routing problem with
replenishment at intermediate depots: Formulation and meta-heuristics. Computers & Industrial
Engineering, 2017. 110: p. 191-206.
166 Zafari and Shishebori
[15] Vahdani, B., et al., Two-stage multi-objective location-routing-inventory model for
humanitarian logistics network design under uncertainty. International journal of disaster risk
reduction, 2018. 27: p. 290-306.
[16] Tzeng, G.-H., H.-J. Cheng, and T.D. Huang, Multi-objective optimal planning for designing
relief delivery systems. Transportation Research Part E: Logistics and Transportation Review,
2007. 43(6): p. 673-686.
[17] Zhan, S.-l. and N. Liu. A multi-objective stochastic programming model for emergency logistics
based on goal programming. in Computational Sciences and Optimization (CSO), 2011 Fourth
International Joint Conference on. 2011. IEEE.
[18] Tricoire, F., A. Graf, and W.J. Gutjahr, The bi-objective stochastic covering tour problem.
Computers & operations research, 2012. 39(7): p. 1582-1592.
[19] Najafi, M., K. Eshghi, and W. Dullaert, A multi-objective robust optimization model for
logistics planning in the earthquake response phase. Transportation Research Part E: Logistics
and Transportation Review, 2013. 49(1): p. 217-249.
[20] Abounacer, R., M. Rekik, and J. Renaud, An exact solution approach for multi-objective
location–transportation problem for disaster response. Computers & Operations Research,
2014. 41: p. 83-93.
[21] Rezaei-Malek, M., et al., An approximation approach to a trade-off among efficiency, efficacy,
and balance for relief pre-positioning in disaster management. Transportation research part E:
logistics and transportation review, 2016. 93: p. 485-509.
[22] Paul, N.R., B.J. Lunday, and S.G. Nurre, A multiobjective, maximal conditional covering
location problem applied to the relocation of hierarchical emergency response facilities. Omega,
2017. 66: p. 147-158.
[23] Shapiro, A., D. Dentcheva, and A. Ruszczyński, Lectures on stochastic programming: modeling
and theory. 2009: SIAM.
[24] Barbarosoǧlu, G. and Y. Arda, A two-stage stochastic programming framework for
transportation planning in disaster response. Journal of the operational research society, 2004.
55(1): p. 43-53.
[25] Rawls, C.G. and M.A. Turnquist, Pre-positioning of emergency supplies for disaster response.
Transportation research part B: Methodological, 2010. 44(4): p. 521-534.
[26] Salmerón, J. and A. Apte, Stochastic optimization for natural disaster asset prepositioning.
Production and operations management, 2010. 19(5): p. 561-574.
[27] Mete, H.O. and Z.B. Zabinsky, Stochastic optimization of medical supply location and
distribution in disaster management. International Journal of Production Economics, 2010.
126(1): p. 76-84.
[28] Döyen, A., N. Aras, and G. Barbarosoğlu, A two-echelon stochastic facility location model for
humanitarian relief logistics. Optimization Letters, 2012. 6(6): p. 1123-1145.
[29] Rennemo, S.J., et al., A three-stage stochastic facility routing model for disaster response
planning. Transportation research part E: logistics and transportation review, 2014. 62: p. 116-
135.
[30] Rath, S., M. Gendreau, and W.J. Gutjahr, Bi‐ objective stochastic programming models for
determining depot locations in disaster relief operations. International Transactions in
Operational Research, 2016. 23(6): p. 997-1023.
[31] Ehrgott, M., Multicriteria optimization. Vol. 491. 2005: Springer Science & Business Media.
[32] Babazadeh, R., et al., A sustainable second-generation biodiesel supply chain network design
problem under risk. Omega, 2017. 66: p. 258-277.
[33] Haimes, Y., On a bicriterion formulation of the problems of integrated system identification and
system optimization. IEEE transactions on systems, man, and cybernetics, 1971. 1(3): p. 296-
297.
[34] Vira, C. and Y.Y. Haimes, Multiobjective decision making: theory and methodology, in North
Holland series in system science and engineering. 1983, North-Holland.
[35] Shishebori D, Jabalameli MS. A new integrated mathematical model for optimizing facility
location and network design policies with facility disruptions. Life Sci J. 2013;10(1):1896-906.

Advances in Industrial Engineering, Autumn 2019, 53(4): 149-167 167
[36] Shishebori D, Yousefi Babadi A, Noormohammadzadeh Z. A Lagrangian relaxation approach
to fuzzy robust multi-objective facility location network design problem. Scientia Iranica. 2018
Jun 1;25(3):1750-67.
[37] Abdolazimi O, Esfandarani MS, Shishebori D. Design of a supply chain network for
determining the optimal number of items at the inventory groups based on ABC analysis: a
comparison of exact and meta-heuristic methods. Neural Computing and Applications. 2020
Oct 20:1-6.
[38] Deb, K., et al., A fast and elitist multiobjective genetic algorithm: NSGA-II. IEEE transactions
on evolutionary computation, 2002. 6(2): p. 182-197.
[39] Goodarzian F, Shishebori D, Nasseri H, Dadvar F. A bi-objective production-distribution
problem in a supply chain network under grey flexible conditions. RAIRO-Operations Research.
[40] Mahmoudi A, Shishebori D, Sadegheih A. Pricing for a multi-channel supply chain with the
participation of a third-party logistics service: A game theory approach. Iranian Journal Of
Supply Chain Management. 2020 Sep 21;22(67):23-34.
[41] Abdolazimi O, Esfandarani MS, Salehi M, Shishebori D. Robust design of a multi-objective
closed-loop supply chain by integrating on-time delivery, cost, and environmental aspects, case
study of a Tire Factory. Journal of Cleaner Production. 2020 Aug 10;264:121566.
This article is an open-access article distributed under the terms and
conditions of the Creative Commons Attribution (CC-BY) license.


![[Vehicle Routing and Transportation 3] - Universiteit Hasselt · [Vehicle Routing and Transportation 3] D16 ... Algorithm for the Multi-Objective Vehicle Routing Problem with Time](https://static.fdocuments.net/doc/165x107/5acb82947f8b9aa3298e93a2/vehicle-routing-and-transportation-3-universiteit-hasselt-vehicle-routing-and.jpg)