Design Zone Exhibition Summative Report - OMSI€¦ · Exhibition Overview Design Zone is a 6,000...
85
Design Zone Exhibition Summative Report Prepared for Oregon Museum of Science and Industry May 2013 1
Transcript of Design Zone Exhibition Summative Report - OMSI€¦ · Exhibition Overview Design Zone is a 6,000...
Design Zone Exhibition
Summative Report
Prepared for
Oregon Museum of Science and Industry
May 2013
1

Acknowledgements
This material is based upon work supported by the National
Science Foundation under Grant No. DRL-0714634. Any opinions,
findings, and conclusions or recommendations expressed in this
material are those of the author(s) and do not necessarily reflect
the views of the National Science Foundation.
2 © May 2013 Oregon Museum of Science and Industry Garibay Group | Design Zone Exhibition Summative Evaluation
© May 2013 Oregon Museum of Science and Industry
Table of Contents
Executive Summary 4
Exhibition Overview 6
Evaluation Design 9
Results 13
Visitor Demographics 14
Visitor Engagement
Dwell Time at Exhibits 16
Use of Challenges 17
Exhibit Behaviors 18
Competition and Cooperation 20
Questions 21
Use of Mathematical Interpretation 23
Recognition of Math and Algebra Content 30
Recognition of a Different Kind of Math Experience 34
Comfort with Math and Algebra 36
Enjoyment 42
Perception of Challenge 45
3
Photo Credits All photos: Garibay Group
except pages 6, 8, 9 and 52: OMSI
© May 2013 Oregon Museum of Science and Industry Garibay Group | Design Zone Exhibition Summative Evaluation
Connections 48
Algebraic Thinking 52
Algebraic Thinking in Three Exhibits in Depth 56
Algebraic Thinking among General Visitors 71
Parent Role in Algebraic Thinking 72
Additional Factors Affecting Algebraic Thinking 73
Impacts Summary 74
Conclusions and Recommendations 77
Conclusions 78
Recommendations 79
References 80
Appendices 82

Executive Summary Design Zone is a 6,000 square foot traveling exhibition developed by the Oregon Museum of
Science and Industry (OMSI) as part of the Access Algebra project funded by the National Science
Foundation (NSF).
Design Zone’s primary objective is to
engage visitors in algebraic thinking, with
a special focus on reaching a target
audience of 10- to 14-year-olds and their
families. The exhibition is organized into
three thematic areas: art, music, and
engineering. Exhibits in each area are
based on real-world design challenges in
which math and algebra are used.
Garibay Group was contracted to conduct
the summative evaluation of Design Zone.
Using a mixed methods approach, data
were collected at three museums hosting
the Design Zone exhibition.
Key Results
The summative evaluation found that the
exhibition successfully met its intended
goals and impacts.
Design Zone’s visitors generally reflected
the science/natural history museum-going
population. Eightly-four percent of
randomly surveyed visitors came in family
groups and 81% identified as Caucasian.
Although most children in these groups
were younger than the target age range
(58% with children in the 6- to 9-year
4 © May 2013 Oregon Museum of Science and Industry Garibay Group | Design Zone Exhibition Summative Evaluation
range), more than one-third (37%)
reported that their group included children
in the target 10–14 age range.
The mean dwell time at individual exhibits
was 4:33 minutes (exceeding the NSF
indicator target of 2 minutes), and these
dwell times were long enough for most
groups to complete one or more
challenges at each exhibit. Nearly three-
quarters of the observed groups
attempted at least one exhibit challenge;
in more than one fourth of the groups, the
respondent using the exhibit set a
challenge for him or herself.
Parent panels were designed to help
visitors discover the math and algebra at
the exhibits and to use that math and
algebra to meet the exhibit challenges. On
average, about 40% of groups looked at
these panels while engaging at an exhibit,
and about 20% used the information in
the parent panel as they engaged.
Evaluation also found strong evidence
that visitors engaged in algebraic
reasoning as part of working through
exhibit challenges. We found that visitor
engagement with algebra in the exhibition
was complex and did not follow a
prescribed path. As part of analysis, we
developed an “algebraic thinking
framework” which generalized visitors’
modes of engagement with algebraic
reasoning. Engagement was fluid, with
visitors moving back and forth across
modes as they approached the
challenges. Completing challenges was
easier when visitors discovered the key
functional relationships and mathematical
tools (which helped visitors quantify
relationships) embedded within the
exhibits. Ninety percent of children in the
target age range (and 88% of children in
the entire sample) engaged in one or
more modes of algebraic thinking at the
exhibits. Some 42% engaged
quantitatively, and another 17% moved to
more abstract levels of thinking (i.e.,
generalizing relationships).
Data also suggested that parental
involvement made a difference in
supporting children’s engagement with
algebraic concepts. When parents were

Executive Summary, cont’d.
5 © May 2013 Oregon Museum of Science and Industry Garibay Group | Design Zone Exhibition Summative Evaluation
engaged, 50% of children engaged in
algebraic thinking using a quantitative
approach or even by generalizing
relationships. When parents were not
engaged, only 31% of children used those
modes of algebraic reasoning.
The exhibits also included several ways of
representing quantitative information,
including numerical data, graphs, and
tables. In 77% of groups, visitors looked
at one or more representations of data (at
the exhibit at which we observed them),
with children viewing more
representations than adults (74% vs.
56%). The lower percentages for adults
may reflect the fact that children were
more likely to engage directly with the
exhibits than adults were (100% vs. 34%).
A slightly lower percentage of groups
visibly used the information in data
representations. Nonetheless, on
average, 55% of the groups had one or
more member use a data representation
at an exhibit. This includes slightly more
than half (51%) of children and one-third
of adults (33%) who used one or more
representations of data in their
interactions at an exhibit.
Overall 95% of the respondents surveyed
agreed that they enjoyed their experience
in the exhibition. When asked what they
enjoyed most, respondents most often
named specific individual exhibits or
mentioned the hands-on and interactive
nature of the exhibits; only 4% of the
surveyed respondents mentioned math
or algebra as the most enjoyable
elements, however.
Among groups with children in the target
age range who remembered using math
in the exhibition, 94% agreed or strongly
agreed that they felt comfortable with that
aspect of their experience.
Nearly three-quarters of the target
audience groups (74%) agreed or agreed
strongly that they felt that “some of the
exhibits were pretty challenging, but we
figured them out in the end.” There was
even stronger agreement (82%) among
target groups who had also agreed that
they used algebra in Design Zone.
Seventy-one percent of groups with
children in the target age range agreed
that some of the exhibits reminded them
of the math they did in school, and 86%
of these groups agreed that the exhibits
helped them think about ways that math is
used in everyday life. School connections
were most often about math concepts,
representations, or activities done in math
class, such as graphs and learning
algebra, while everyday connections were
most often about the physical similarities
between the exhibits and objects or
experiences encountered in everyday life.
Overall, Design Zone provided a
challenging yet successful, comfortable,
and enjoyable experience for families that
met the criteria for the target audience as
well as for the larger cross-section of
visitors who engaged with these exhibits.
The Design Zone exhibition, overall, met
the goals for the project. Perhaps the
major challenge remaining for the project
(and for the informal math education
field) is to find more effective ways to
guide visitors toward more quantitative
and, ultimately, more abstract ways
of engaging in algebraic thinking on
the exhibition floor. With that in mind,
the report closes with a series of
recommendations for refining the
current exhibition.

Overview
6 © May 2013 Oregon Museum of Science and Industry Garibay Group | Design Zone Exhibition Summative Evaluation

Exhibition Overview Design Zone is a 6,000 square foot traveling exhibition developed by the Oregon Museum of Science
and Industry (OMSI) as part of the Access Algebra project funded by the National Science Foundation
(NSF). The primary goal of Design Zone is to engage visitors in algebraic thinking, with a special focus
on reaching a target audience of 10- to 14-year-olds and their families.
Approach to math content
The project team based its approach to
algebra on those advocated by the
National Council of Teachers of
Mathematics Principles and Standards
for School Mathematics (National Council
of Teachers of Mathematics, 2000),
project advisors, research on “early
algebra,” and promising practices from
prior math exhibitions (including the
use of challenges to engage visitors in
math learning).
The project defined algebraic thinking as
• Finding and exploring mathematical
patterns and relationships between
quantities (functional relationships)
• Representing mathematical
relationships in a variety of ways,
including images, words, models,
tables, graphs, and symbols
• Using mathematical relationships to
describe, analyze, predict, and create
7 © May 2013 Oregon Museum of Science and Industry Garibay Group | Design Zone Exhibition Summative Evaluation
Approach to exhibit development
Based on research in informal education,
the project team identified a number of
design affordances (exhibit characteristics
that the team hoped would foster certain
behaviors in order to achieve project
impacts). Design affordances include the
physical design of the exhibit as well as
accompanying text and graphics on
panels or monitors, videos, and artifacts.
To engage family groups in math learning,
exhibits were designed to include “family
friendly” characteristics identified in the
PISEC studies of family learning: multi-
sided, multi-user, accessible, multi-
outcome, multi-modal, readable, and
relevant (Borun et al., 1998).
To foster the prolonged engagement
necessary for discovering and exploring
patterns and functional relationships,
exhibits were designed to incorporate
characteristics identified by the
Project Impacts
Desired project impacts were as
follows:
Impact 1
The target audience of youth ages
10−14 and their families will use
algebraic thinking skills.
Impact 2
The target audience will have
enjoyable and memorable experiences
with algebra/math.
Impact 3
The target audience will be aware that
algebra is more than solving equations.
Impact 4
Groups of target audience members
will feel comfortable engaging in
algebra activities together.

Exhibition Overview, cont’d.
8
Exploratorium’s APE (active, prolonged
engagement) research (Humphrey, et al.,
2005). These included posing challenges,
offering multiple entry points, and allowing
multiple outcomes.
In addition to the design affordances listed
above, the team identified three design
affordances specifically to support math
engagement: creative challenges that
could be met through algebraic thinking,
parent panels (brief text panels in each
exhibit designed to provide caregivers
with key information about the underlying
functional relationship, so that caregivers
could support children’s learning), and
“math tools” (quantitative information
made available to visitors and directly
relevant to the functional relationships
inherent in the challenges—through
quantitative labeling and data displays).
© May 2013 Oregon Museum of Science and Industry Garibay Group | Design Zone Exhibition Summative Evaluation
The exhibition
The exhibition was organized into three
thematic areas: art, music, and
engineering (Figure 1). To reinforce this
organization, each thematic area was
color coded and a tower in each area
presented a slide show of relevant
careers. Exhibits in each area were
based on real-world design challenges in
which math and algebra are used.
For example, in the art area, visitors
could engage with the exhibit “Balancing
Art.” Two stations are side by side, one at
adult height and the other at a child’s
height. Each station consists of a
balancing rod suspended at a central
pivot point. Visitors hang colored pieces
of different weights at regular intervals
along the balancing rod (and from other
pieces) to create a mobile. The weights
and the intervals along the rod are
labeled quantitatively (relative weights
and distances). On a graphic panel,
visitors are presented with three
challenges—schematic diagrams
suggesting configurations of pieces that
create balanced mobiles but without
information about which weights or
distances to use. By attempting the
challenges, visitors are encouraged to
explore the relationship between weight
and distance that creates a balanced
mobile. The parent panel for this exhibit is
designed to provide caregivers with
concrete examples and representations
of the relationship (including diagrams
and equations) that can help them
discover that relationship more quickly
and thus support their children’s learning.
Figure 1. Examples of exhibits from each of
the three thematic areas in Design Zone:
Music, Art, and Engineering.

Evaluation Design Garibay Group worked with the OMSI team on the evaluation for Design Zone (Figure 2). Front-end,
formative, and summative evaluation have guided the Design Zone team during each phase of exhibit
development. This report discusses summative findings.
Goals and Research Questions
The primary goal of the summative
evaluation was to assess the extent to
which Design Zone met its goals. For
each of the four desired impacts, the team
developed a set of one-to-five quantitative
indicators—measureable objectives that
they hoped the target audience would
achieve through their exhibition
experience. (The indicators are listed
Tables 8–11.) The summative evaluation
was designed to determine whether these
indicators were realized.
More generally, summative evaluation
also focused on the ways in which visitors
engaged with the exhibition, the nature
of visitors’ social interactions, and the
extent to which visitors engaged in
algebraic thinking.
Methods
Data were collected at three sites for this
study—at OMSI and at two host sites,
Pacific Science Center and Franklin
Institute. We used a mixed methods
approach (Green and Caracelli, 2003),
9 © May 2013 Oregon Museum of Science and Industry Garibay Group | Design Zone Exhibition Summative Evaluation
collecting both quantitative and qualitative
data. Methods included observations with
follow-up interviews, surveys, and video.
Exit Surveys
Exit survey data were collected to assess
visitors’ overall visitor experiences. This
method provided measures on overall
outcomes, specifically the extent to which
quantitative indicators were achieved.
Surveys asked questions about visitors’
enjoyment, perceptions about the extent to
which visitors used math/algebra, comfort,
overall experience, and demographics.
Surveys contained closed-ended, Likert
scale, and open-ended questions.
Figure 2. Floor plan of the 6,000 square foot Design Zone exhibition at OMSI.

Evaluation Design, cont’d.
10
Data collectors orally administered
surveys using random sampling,
selecting respondents to ensure that
data were valid and generalizable. In
all, 900 surveys were collected at the
Pacific Science Center and Franklin
Institute. (Refusal rates were about 50%,
with visitors citing a range of reasons
from impending IMAX theater shows to
tired and cranky children to needing to
head home.)
Observations and Follow-Up Interviews
While surveys provided data about project
impacts, observations and interviews
focused on understanding the overall
nature of the visitor experience, including
understanding: 1) ways in which visitors
engaged with the exhibits; 2) social
interactions among groups; 3) use of
mathematical representations; and 4) the
extent to which, and ways in which,
visitors engaged in algebraic thinking.
The majority of field observations were
done unobtrusively, although we included
a small sample (n = 5) of participant
observations. In the unobtrusive
observations, researchers observed
groups and systematically recorded
details about their interactions, behaviors,
and modes of engagement. Observations
© May 2013 Oregon Museum of Science and Industry Garibay Group | Design Zone Exhibition Summative Evaluation
Figure 3. While groups with children 10−14
years old were the focus of this study,
observed groups often contained children
who were younger or older than the target
age range.
were generally conducted at the exhibit
component level and groups were
observed at a component for the duration
of their engagement with that component.
We collected observations at all exhibit
components and attempted, as much as
possible, to obtain similar observation
samples at each component.
We conducted 154 observations.
Researchers focused as much as possible
on observing visitor groups who seemed
to have at least one child in the 10- to 14-
year-old target age range (Figure 3). The
majority (113) of observations were
conducted using a randomized selection
technique whereby researchers observed
the first group to approach an exhibit that
also fit the age criterion. The balance of
observations (41) used purposive
sampling. Since researchers were also
conducting follow-up interviews after
observations, we also included a second
criterion to observe only groups where a
parent was nearby so that at the interview
stage, we could obtain parental consent to
include children in the interview. The
overall sampling approach strategy still
allowed for collecting data from groups
with children younger or older than the
target range, since groups often had more
than one child of varied ages. Additionally,
at times when researchers could not find
children in the target age range, they
observed groups with children as close to
that target age as possible using the
random sample approach. In terms of
sample characteristics, 69% of
observations included children in the 10−
to 14-year-old target age range, 27% were
younger (5−9 years) and 4% were older
(15−18 years).

Evaluation Design, cont’d.
11
Observations were collected at OMSI,
Pacific Science Center, and Franklin
Institute. Number of observations varied
by site, however, primarily due to the
varying length and time of year of the
exhibit run. Researchers took advantage
of school breaks (winter and spring) to
ensure higher visitation rates from families
(as opposed to school groups) and to be
as efficient as possible in data collection.
At OMSI, researchers focused primarily
on collecting video data (described later in
this section), so collected fewer
observations at this site.
Immediately after the observation,
researchers interviewed the group they
had observed to gain a deeper
understanding of visitors’ experiences and
perspectives. Researchers used a semi-
structured interviewing approach (Babbie,
1998), probing on a range of topics
pertinent to the study (e.g., reactions,
perceptions of main exhibit ideas).
Video Data
Researchers also conducted a small
video study at OMSI as part of the
summative evaluation with the goal of
examining in more depth what aspects of
an exhibit stimulated and supported
algebraic thinking and to better
© May 2013 Oregon Museum of Science and Industry Garibay Group | Design Zone Exhibition Summative Evaluation
Figure 4. “Balancing Art” set up for
videotaping. Yellow arrow points to video
camera.
understand what engagement with
algebraic reasoning looked like in Design
Zone (Figures 4 and 5). The research
team selected three exhibits for the
study—“Balancing Art,” “Drawing in
Motion”, and “Slide-a-Phone”—because
they engaged visitors in a wide range of
activities and embodied different aspects
of algebraic reasoning. Visitors were
videotaped as they engaged with one of
these exhibits (the researchers
designated the exhibit prior to
recruitment). Respondents were allowed
to engage with the exhibit as long as
they wanted (the longest interaction ran
19 minutes). After the video session,
participants were immediately interviewed
to gain a better understanding of
their experiences.
Given the goals of this portion of the
evaluation and the nature of video,
researchers selected child-adult dyads as
the focus of the study. Using purposive
sampling, visitors were recruited as they
entered the museum. Selection criteria
included recruiting adult-child pairs with
children ages 10–12 who were also not
members of OMSI and did not home-
school their children. We also strove for as
even a mix as possible in gender among
adult and child respondents.
Figure 5. “Drawing in Motion” set up for
videotaping, with barrier, research in
progress sign, and video camera. Yellow
arrow points to video camera.
Evaluation Design, cont’d.
12
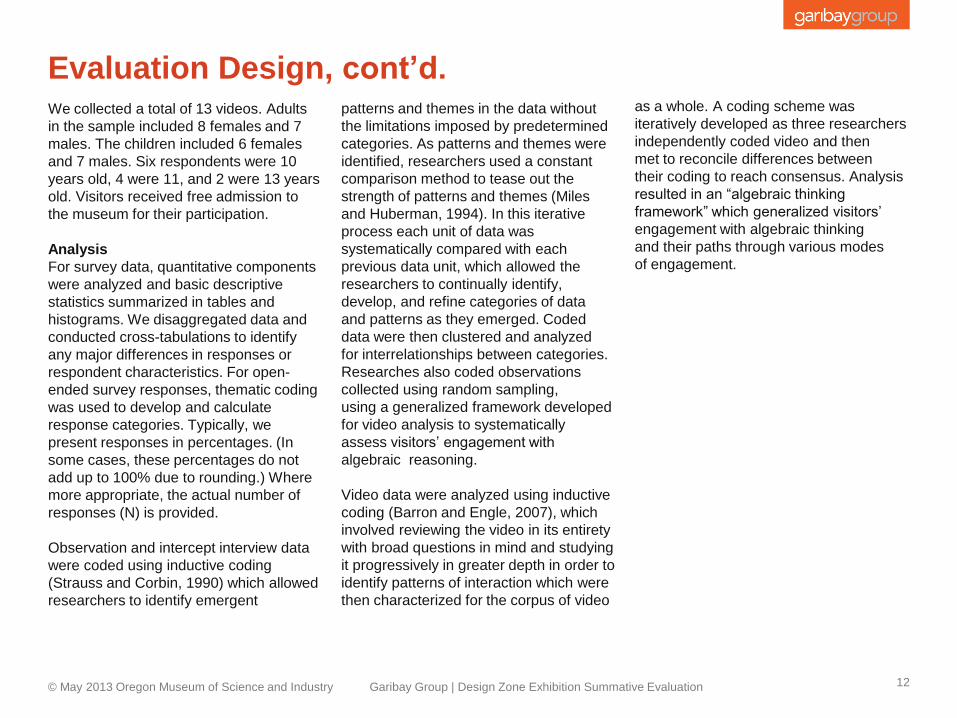
We collected a total of 13 videos. Adults
in the sample included 8 females and 7
males. The children included 6 females
and 7 males. Six respondents were 10
years old, 4 were 11, and 2 were 13 years
old. Visitors received free admission to
the museum for their participation.
Analysis
For survey data, quantitative components
were analyzed and basic descriptive
statistics summarized in tables and
histograms. We disaggregated data and
conducted cross-tabulations to identify
any major differences in responses or
respondent characteristics. For open-
ended survey responses, thematic coding
was used to develop and calculate
response categories. Typically, we
present responses in percentages. (In
some cases, these percentages do not
add up to 100% due to rounding.) Where
more appropriate, the actual number of
responses (N) is provided.
Observation and intercept interview data
were coded using inductive coding
(Strauss and Corbin, 1990) which allowed
researchers to identify emergent
© May 2013 Oregon Museum of Science and Industry Garibay Group | Design Zone Exhibition Summative Evaluation
patterns and themes in the data without
the limitations imposed by predetermined
categories. As patterns and themes were
identified, researchers used a constant
comparison method to tease out the
strength of patterns and themes (Miles
and Huberman, 1994). In this iterative
process each unit of data was
systematically compared with each
previous data unit, which allowed the
researchers to continually identify,
develop, and refine categories of data
and patterns as they emerged. Coded
data were then clustered and analyzed
for interrelationships between categories.
Researches also coded observations
collected using random sampling,
using a generalized framework developed
for video analysis to systematically
assess visitors’ engagement with
algebraic reasoning.
Video data were analyzed using inductive
coding (Barron and Engle, 2007), which
involved reviewing the video in its entirety
with broad questions in mind and studying
it progressively in greater depth in order to
identify patterns of interaction which were
then characterized for the corpus of video
as a whole. A coding scheme was
iteratively developed as three researchers
independently coded video and then
met to reconcile differences between
their coding to reach consensus. Analysis
resulted in an “algebraic thinking
framework” which generalized visitors’
engagement with algebraic thinking
and their paths through various modes
of engagement.

Results
13 © May 2013 Oregon Museum of Science and Industry Garibay Group | Design Zone Exhibition Summative Evaluation

Visitor Demographics The randomized sample obtained via exit surveys indicated visitors to Design Zone reflected the general
science/natural history museum-going population.
14 © May 2013 Oregon Museum of Science and Industry Garibay Group | Design Zone Exhibition Summative Evaluation
Of the total sample, 84% of visitors
surveyed came in family groups (85%
Pacific Science Center; 76% Franklin
Institute). There was a broad distribution
of age ranges: more than half (58%) of
families reported having children 6–9
years old in their group and more than
one-third (37%) reported having children
in the target 10–14 age range in their
group (Figure 6).
More than a third (33%) of visitors
indicated they had previously been to the
museum.
38%
62%
40%
12% 6%
47%
55%
35%
5% 3%
0%
10%
20%
30%
40%
50%
60%
70%
5 yearsor younger
6 to 9years
10 to 14years
15 to 17years
18 yearsor older
Figure 6. Visitor groups with children (may have children in more than one age range)
Pacific Science Center
Franklin Institute
n = 900

Visitor Demographics, cont’d. Eighty-one percent of respondents identified themselves as Caucasian (Figure 7).
15 © May 2013 Oregon Museum of Science and Industry Garibay Group | Design Zone Exhibition Summative Evaluation
80%
17%
11%
3% 3% 1%
81%
8% 5%
9% 5%
0% 0%
10%
20%
30%
40%
50%
60%
70%
80%
90%
Caucasian Asian/Pacific Islander
Other African-American
Hispanic/Latino NativeAmerican
Figure 7. Race/ethnicity
Pacific Science Center
Franklin Institute
n = 900

Visitor Engagement: Dwell Time at Exhibits The mean dwell time of 4:33 minutes exceeded the NSF indicator target of 2 minutes (median = 4:00
minutes). Disaggregated data showed that children in the target age range spent more time at the
exhibits than did the overall sample, which included groups with children younger than the target range
(mostly 7–9) (Figure 8).
16 © May 2013 Oregon Museum of Science and Industry Garibay Group | Design Zone Exhibition Summative Evaluation
While these times may seem
unexpectedly long, remember that this
sample excludes groups that included
only preschoolers and children with no
adult in sight. These dwell times were
long enough for most groups to complete
one or more challenges, either those set
by the exhibit labels or ones that groups
set for themselves.
2%
16%
52%
28%
1% 0% 1%
18%
49%
29%
2% 0% 0%
10%
20%
30%
40%
50%
60%
< 1 min. 1–2 min. 3–5 min. 6–10 min. 11–15 min. 16–20 min.
Figure 8. Dwell time at individual exhibits
All groupsn = 141
Groups that included 10- to 14-year-oldsn = 95

Visitor Engagement: Use of Challenges The challenges introduced on exhibit labels and monitors played an important role in the overall strategy
for motivating visitors to engage in algebraic thinking. Of the groups observed during structured
observations, 89% engaged in at least one challenge. These results did not differ much whether a group
member was in the target age range or not. Eighty-six percent of groups that included 10- to 14-year-
olds engaged in at least one challenge.
17 © May 2013 Oregon Museum of Science and Industry Garibay Group | Design Zone Exhibition Summative Evaluation
Groups most often attempted one or
more of the challenges included on
exhibit labels and monitors, although
some developed their own challenges.
Nearly three-quarters of the groups
attempted at least one exhibit challenge.
In more than a quarter of the groups, the
member using the exhibit set a
challenge for him or herself. A few
worked with a challenge set by an adult
in their group (Figure 9).
72%
28%
4%
73%
28%
2%
0%
10%
20%
30%
40%
50%
60%
70%
80%
Exhibit challenges Own challenges Group (parent) challenges
Figure 9. Challenges attempted by designated children and their groups
All groupsn = 141
Groups that included 10- to 14-year-oldsn = 95

Visitor Engagement: Exhibit Behaviors
18 © May 2013 Oregon Museum of Science and Industry Garibay Group | Design Zone Exhibition Summative Evaluation
Video data from this study provided
insights into the roles and behaviors
of children and caregivers. These
data demonstrated the important roles
that caregivers could play while engaging,
alongside their children, with the exhibits.
These roles typically played out in
different sequences of behaviors at
each exhibit.
At “Balancing Art,” children took active
control, selecting weights from the tray
below the balancing rod and hanging
them up. Their caregivers most often
stood behind the children, watching them
work and observing the balancing rod.
This position often led parents to discover
the parent panel, located to the side of the
exhibit, which helped them understand
and explain the direct mathematical
relationship between weight and
distance—thereby helping them to take on
a teacher role.
In contrast, “Drawing in Motion” was
designed to encourage two visitors to
cooperatively use the exhibit. In this
exhibit, one visitor moves a slider that
controls motion along the X axis; the other
visitor moves a slider that controls motion
along the Y axis. Together they control a
“pen” that draws on a coordinate grid.
Typically each caregiver and child stood
in front of one of the sliders on either side
of the control panel and parent panel.
They usually cooperated with one another
as they moved the sliders left and right,
figuring out how to control the drawing on
the screen and, in two cases, moving
simultaneously to draw diagonal lines.
Caregivers often took a leadership role,
either telling children what to do directly
or trying to teach them about the
relationship between the sliders and the
on-screen activity.
Most groups also found “Slide-a-Phone”
to be a cooperative venture. In this
exhibit, one visitor adjusts the overall
length of a large sound tube, while
another visitor beats out a rhythm on an
attached drumhead. Visitors try to play
“mystery” songs whose melodies are
represented by a graph of tube lengths.
Both caregivers and children took
leadership roles at various times. Children
often decided which role they would play,
while caregivers were more prone to read
the graph, tell the child what to do, and
sometimes explain the key relationship
between length of tube and pitch.
Caregivers took a facilitator role more
often, although children sometimes
contributed equally or even led
discussions of the exhibit. To operate the
“Slide-a-Phone,” visitors usually divided
the labor so one person hit the drumhead
while the other moved the tube.
At all three exhibits—“Balancing Art,”
“Drawing in Motion,” and “Slide-a-
Phone”—caregivers approached their
roles as guides or teachers using a variety
of techniques including:
1) giving specific information (like
terminology);
2) explaining general concepts, often
related to the rule or relationship that
governed that exhibit;
3) explaining why the instructions were
given in a certain way;
4) correcting mistakes in a way that
helped the partner improve;
5) asking a series of guiding questions
and drawing out desired answers; and
6) setting up a problem or challenge that
helped guide the learner towards
important discoveries.
Many of these strategies seemed quite
appropriate for an informal setting.

Visitor Engagement: Exhibit Behaviors, cont’d. Based on observation data, 100% of the 10- to 14-year-olds we observed engaged directly with the
exhibit, but about 40% spent some time observing as well (Figure 10).
19 © May 2013 Oregon Museum of Science and Industry Garibay Group | Design Zone Exhibition Summative Evaluation
In contrast, only about a third of the
adults engaged directly with the exhibit,
but 84% took an observer role. Some
three-quarters of both caregivers and
children talked with other members of
their groups (children sometimes talked
with children instead of with adults).
Group interactions varied and we saw
groups talk about a range of things such
as how to use the exhibit, strategies for
how to successfully complete a
challenge or advice for meeting a
challenge, and explanations. Adults took
the role of guide/teacher much more
often than children, who usually took the
learner role.
100%
78%
42% 39%
7%
34%
70%
84%
3%
41%
0%
10%
20%
30%
40%
50%
60%
70%
80%
90%
100%
Engageddirectly with
exhibit
Talked toothers in
group
Observed Assumedlearner role
Assumedteacher role
Figure 10. Interactions between respondents as they engaged with the exhibits
(Groups with designated children in the 10- to 14-year-old age range)
Children
Adults
n = 96

Visitor Engagement: Competition and Cooperation Some Design Zone exhibits (for instance, “Bike Race”) encouraged competition while others, such as
“Drawing in Motion,” were designed to encourage cooperation among visitors. Respondents engaged in
both competitive and cooperative behaviors across the range of Design Zone exhibits, with cooperative
behaviors, such as taking turns and working together, predominating (Figure 11). The results for adult
caregivers reflect the fact that caregivers spent much of their time observing rather than directly
engaging with the exhibits.
20 © May 2013 Oregon Museum of Science and Industry Garibay Group | Design Zone Exhibition Summative Evaluation
61%
46% 42%
14%
40%
29% 26%
2%
0%
10%
20%
30%
40%
50%
60%
70%
Cooperated byeither taking
turns or workingtogether
Worked together Took turns Competed
Figure 11. Group interactions as they engaged with the exhibits
(Groups with designated children in the 10–14 year age range)
Children
Adults
n = 96
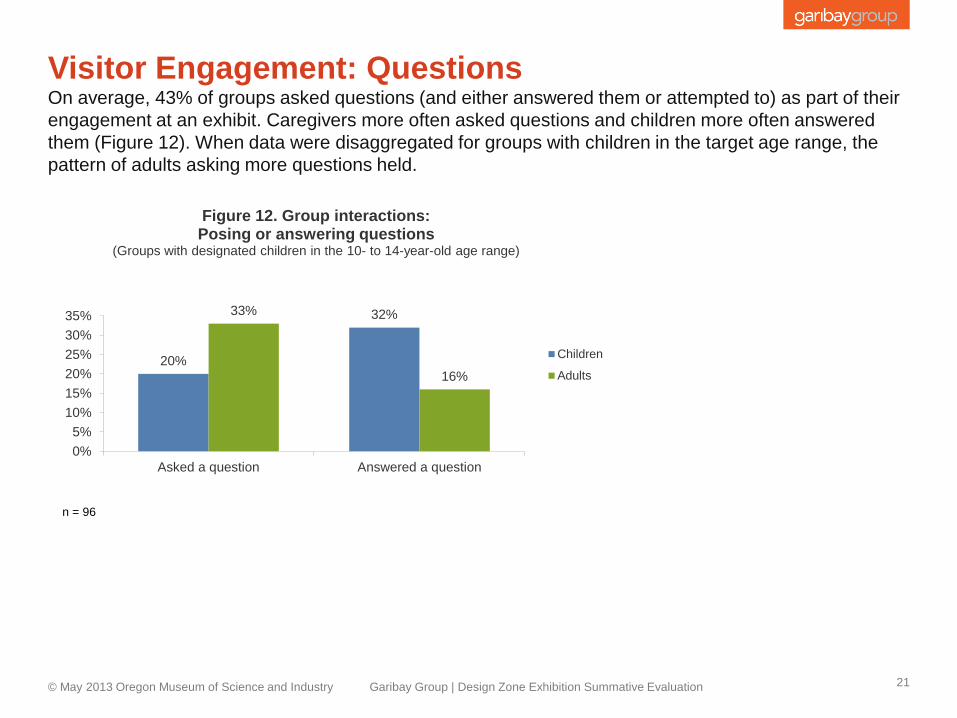
Visitor Engagement: Questions On average, 43% of groups asked questions (and either answered them or attempted to) as part of their
engagement at an exhibit. Caregivers more often asked questions and children more often answered
them (Figure 12). When data were disaggregated for groups with children in the target age range, the
pattern of adults asking more questions held.
21 © May 2013 Oregon Museum of Science and Industry Garibay Group | Design Zone Exhibition Summative Evaluation
20%
32% 33%
16%
0%
5%
10%
15%
20%
25%
30%
35%
Asked a question Answered a question
Figure 12. Group interactions: Posing or answering questions
(Groups with designated children in the 10- to 14-year-old age range)
Children
Adults
n = 96
Visitor Engagement: Questions, cont’d.
22 © May 2013 Oregon Museum of Science and Industry Garibay Group | Design Zone Exhibition Summative Evaluation
understand what their children
were doing, sometimes after being
disengaged for a time (e.g. “What are
you building?” “What do we do here?”
“What's your score?”).
Few questions could be categorized as
classic inquiry questions, the kinds that
budding scientists might ask in trying to
understand a physical phenomenon.
When those sorts of questions were
asked, they most often fit within the
framework of whatever challenge the
group was trying to meet. For example, a
parent at “Roller Coaster Hills” asked his
daughter to predict, “Where’s [the ball]
going to hit next?” A parent at “Designing
for Speed” held up two wheels for
comparison and asked, “Why do you think
that one’s faster?”
About a quarter of the groups asked
questions as they figured out the basics of
how an exhibit worked (e.g., “What is this
one supposed to do?” “Where’s the shift
key?” “Why wasn’t it working?”).
Some 15% of groups asked questions as
part of meeting a challenge or
understanding the relationships that
helped them meet that challenge (e.g.,
“How many reflections did you count?”
“What song was I playing?” “Why do you
think that wheel’s faster?” “Where’s it
going to hit next?”).
The remaining questions included those
asked by groups trying to figure out which
exhibit to try next (e.g., “Do you want to try
this?” “What do you want to do next?”),
questions about personal connections
(e.g. “Does this make you think of music
class?”), and attempts by parents to

Visitor Engagement: Use of Mathematical Interpretation “Parent panels” were designed to help visitors discover the math and algebra at the exhibits and to use
that math and algebra in ways that would help them meet the exhibit challenges. Both groups with
children in the target age range and groups with only younger children looked at and talked about the
parent panels with approximately equal frequency (Figure 13). Groups with children in the target age
range, however, were more apt to use the parent panel information to meet exhibit challenges than were
groups with only younger children.
23 © May 2013 Oregon Museum of Science and Industry Garibay Group | Design Zone Exhibition Summative Evaluation
Parent panels included a range of
information, in some cases graphs, tables,
and equations, along with explanations
about how to use these algebraic
representations to meet the exhibit
challenges (Figure 14). For instance, the
parent panel at “Hit the Target” included
a graph showing the relationship between
the launch angle of the catapult arm and
the distance it would throw a ball, along
with an explanation of how to use that
graph to achieve higher scores at this
exhibit. At “Drawing in Motion,” visitors
made their own drawings on a coordinate
grid, and the parent panel explained the
underlying concept of slope and how to
draw lines with different slopes.
40%
23% 20%
39%
16% 18%
0%
10%
20%
30%
40%
50%
Looked at parent panel Used information inparent panel
Talked about parentpanel
Figure 13. Groups that looked at, used, and/or talked about the information in parent panels as they engaged
with an exhibit
Groups with 10- to 14-year-oldsn = 96
Groups with under 10-year-oldsn = 38

Visitor Engagement: Use of Mathematical Interpretation,
cont’d.
24 © May 2013 Oregon Museum of Science and Industry Garibay Group | Design Zone Exhibition Summative Evaluation
The exhibits also included several ways of
representing quantitative information,
including numbers on weights, scales,
and distances that were part of exhibits,
illustrations of graphs and tables on labels
and monitors; readouts of numerical data
generated by visitors, and graphs and
tables created in real time by visitors
(Figures 14 and 15). For example, in
“Designing for Speed,” visitors rolled
different wheels down a track and a
monitor displayed the time it took each
wheel to reach the bottom, creating a
table of data.
We tracked how and how frequently
visitors used whatever quantitative
representations (“math tools”) were
available at a particular exhibit
(regardless of its source) in order to
measure the indicator set by the team,
which stated that “During the visit, 60% of
the target audience will use math tools
provided.” Note that such data
representations were made available to
visitors in several different ways.
For instance, in some cases, tables of
quantitative information were presented to
visitors in labels (e.g., “Digital Strings”).
In other cases, visitors generated the data
as they played at the exhibits (e.g.,
“Designing for Speed”). Likewise, graphs
were sometimes presented in challenge
labels and parent panels (e.g., “Hit the
Target”) and sometimes generated by
visitors (e.g., “Sound Graph”). Including all
these types of data representations, in
over three-quarters (77%) of groups,
visitors looked at one or more
representations of data (at the exhibit at
which we observed them), with children
looking at more representations than
adults (74% vs. 56%). The lower
percentages for adults may reflect the fact
that a large percentage of adults did not
engage directly with the exhibits.
Figure 14. Parent panel for “Balancing Art”
that used an equation to help visitors
complete the challenge.
Figure 15. “Design a Roller Coaster” had an
on-screen graph to represent data to the
visitor.

Visitor Engagement: Use of Mathematical Interpretation,
cont’d. Figure 16 breaks out data by type of representation (e.g., readouts, tables, graphs).
25 © May 2013 Oregon Museum of Science and Industry Garibay Group | Design Zone Exhibition Summative Evaluation
57%
28%
7%
54%
25%
6%
38%
22%
6%
0%
10%
20%
30%
40%
50%
60%
Numbers/readouts Graphs Tables of data
Figure 16. Respondents who looked at representations of data at an exhibit
(Groups with designated children in the 10–14 year age range)
Group
Children
Adults
n = 96

Visitor Engagement: Use of Mathematical Interpretation,
cont’d.
26 © May 2013 Oregon Museum of Science and Industry Garibay Group | Design Zone Exhibition Summative Evaluation
Of course, the data in the representations
were designed to be used by visitors as
they tried to meet the challenges at each
exhibit. For instance, groups used
readouts to tell who completed the most
turns in 15 seconds at “Testing Gears,”
used the graph of distance over time at
“Bike Race” to tell how they were doing
relative to competitors (and eventually
who won the race), or compared the
tabulated results of two or more time trials
at “Designing for Speed” (Figure 17).
Children were more apt to attend to
numbers and readouts than adults
because they generally were more
directly involved with the exhibits.
Younger children, in particular, often
needed adult help to interpret and apply
data arranged into tables or displayed in
graphs. Comparisons of the percentages
for the individual types of representations,
however, must be interpreted with some
caution. Numbers (e.g., on weights and
scales) and data readouts were available
at almost every exhibit, but tables were
generated by visitors at only two exhibits
(“Designing for Speed” and “Testing
Gears”) and presented on labels at a few
others (e.g., “Build a Plaza” and “Mirror
Multiplier”). Graphs were generated and
displayed at more exhibits than tables
were, but not as frequently as numbers
and readouts.
Figure 17. The “Designing for Speed”
showed visitors a screen with tabulated race
results.

Visitor Engagement: Use of Mathematical Interpretation,
cont’d. Compared with the results in Figure 16, a slightly lower percentage of groups we observed overtly used
the information and data they found in data representations as they engaged with the exhibits (Figure 18).
27 © May 2013 Oregon Museum of Science and Industry Garibay Group | Design Zone Exhibition Summative Evaluation
42%
16%
1%
38%
16%
1%
25%
10%
1%
0%
10%
20%
30%
40%
50%
Numbers/readouts Graphs Tables of data*
Figure 18. Respondents who used the different representations of data
as they engaged with an exhibit (Groups with designated children in the 10–14 year age range)
Group
Children
Adults
n = 96
* Note that visitors often looked at only one or two of the numbers
generated in tables at exhibits like “Designing for Speed” and “Testing
Gears,” rather than comparing numbers within a table. Picking out one
or two numbers was coded as “numbers/readouts”; comparing numbers
within or across a table was coded as “tables of data.”

Visitor Engagement: Use of Mathematical Interpretation,
cont’d.
28 © May 2013 Oregon Museum of Science and Industry Garibay Group | Design Zone Exhibition Summative Evaluation
Nonetheless, on average, 55% of the
groups had one or more member use a
data representation at an exhibit. This
includes just over half (51%) of children
and one-third of adults (33%) who used
one or more representations of data in
their interactions at an exhibit. Because
most visitors engaged with many exhibits
during a visit, this implies that the 60%
impacts and indicators target was easily
exceeded when respondents’ entire visit
is taken into account.
Note that the findings on both data
representations and parent panels have a
bearing on whether a respondent felt like
they were doing math or algebra at an
exhibit. As discussed in the introductory
section, the team’s definition of “algebraic
thinking” included finding, describing, and
using patterns and predictable
relationships between variables to meet
the exhibit challenges. The majority of 10-
to 14-year-olds (83%) described and/or
used such a pattern or relationship, at
least in qualitative terms. Only 23% of
these youth, however, made a prediction.

Visitor Engagement: Use of Mathematical Interpretation,
cont’d. The Design Zone team was also interested in whether visitors recognized that they had used math and
algebra in Design Zone. Of groups who used a quantitative representation, almost one-third of target-
aged youth, but less than 20% of adults, recognized what they were doing as math and far fewer in both
groups considered what they were doing at that exhibit to be algebra (Figure 19).
29 © May 2013 Oregon Museum of Science and Industry Garibay Group | Design Zone Exhibition Summative Evaluation
51%
29%
7%
33%
14%
7%
0%
10%
20%
30%
40%
50%
60%
Used any representation ofdata, numbers or readouts,
graphs, or tables
Recognized math Recognized algebra
Figure 19. Respondents who used data representations that recognized
they used math or algebra (Groups with designated children in the 10- to 14-year-old age range)
Designated children Adults
n = 96

Recognition of Math and Algebra Content Exit survey data allowed us to determine the extent to which visitors recognized the math and algebra
content. When asked about math in general, 68% of the total sample agreed (a 3 or 4 rating on a 1–4
scale) that their group had used math in the exhibition (Figure 20). For groups with children in the target
age range, the level of agreement was higher (81%). The rating average for all groups was 2.91, while the
rating average for groups that included 10- to 14-year-olds was 3.23.
30 © May 2013 Oregon Museum of Science and Industry Garibay Group | Design Zone Exhibition Summative Evaluation
18% 14%
26%
42%
8% 11%
31%
50%
0%
10%
20%
30%
40%
50%
60%
1(disagree strongly)
2 3 4(agree strongly)
Figure 20. Agreement ratings to the statement “My group and I used math at some of the exhibits in Design Zone.”
All groupsn = 895
Groups that included 10- to 14-year-oldsn = 263

Recognition of Math and Algebra Content, cont’d.
31 © May 2013 Oregon Museum of Science and Industry Garibay Group | Design Zone Exhibition Summative Evaluation
During intercept interviews, visitors
discussed a range of impressions
concerning what the exhibition was about.
Some visitors focused on the themes—
music, building things, playing games—
while others emphasized more general
ideas such as design and engineering.
Still others talked about the science they
had done and learned. Some visitors
pointed out that math played a part in their
overall experience. A smaller subset of
these visitors, however, identified algebra
as part of their experience. A few visitors
congratulated the team on finding a
“stealth” way to get kids to do algebra.
When respondents were asked, “If you
were going to tell someone back home
what this exhibit was about, what would
you tell them?” the most frequently
mentioned word in a textual analysis of
responses to this question was “math,”
suggesting that visitors saw math as a
major part of the exhibition. Other
often-mentioned ideas were design,
science, and music. “Algebra” was
infrequently mentioned.
Here’s a selection of responses that
mention math and algebra:
It’s making math fun.
Math and play.
Using math in different area of
everyday life.
Great for math applications, this
reminds me of a class I took called
Practical Math.
Visual representation and application of
math in the real world.
Good ways to introduce math...I’d call it
stealth math!
A lot of algebra...math-driven design
exhibits which are fun for kids.
Algebra, a lot of algebra. I would say
people who enjoy math would be more
into it.
Ratios, math, geometry, algebra without
the children noticing.
The following responses include math as
part of a more complex description of
what the exhibition is about:
Expanding people’s ideas in what
design is and how math affects design.
It’s a mixture of math, architecture,
and design.
The science and math behind the things
we do.
Science and math and how they’re
a part of everyday life. AKA
“integrated curriculum.”
It’s about kids, keeping kids interested
in science and math.
It's about math, concepts,
making games, and help[ing] kids
understand math.
It was about puzzles, figuring out how
stuff works, and using math.

Recognition of Math and Algebra Content, cont’d. Agreement ratings with the statement, “My group and I used algebra at some of the exhibits in Design
Zone” were lower than for using math at the exhibit (Figure 21). Forty-three percent of the total sample
and 51% of those with children in the target age range agreed with the statement (a 3 or 4 rating). The
rating average for all groups was 2.25, while the rating average for groups that included 10- to 14-year-old
was 2.51.
32 © May 2013 Oregon Museum of Science and Industry Garibay Group | Design Zone Exhibition Summative Evaluation
40%
17% 21% 22%
30%
17%
24% 28%
0%
10%
20%
30%
40%
50%
1(disagree strongly)
2 3 4(agree strongly)
Figure 21. Agreement ratings for the statement, “My group and I used algebra at some of the exhibits in Design Zone.”
All groupsn = 895
Groups that included 10- to 14-year-oldsn = 263

Recognition of Math and Algebra Content, cont’d.
33 © May 2013 Oregon Museum of Science and Industry Garibay Group | Design Zone Exhibition Summative Evaluation
For both of the math and the algebra
statements, agreement ratings were
higher for groups with children in the
target age range than for the sample
as a whole. This suggests that the
experience—at least in terms of seeing
math and algebra—was more successful
for the target audience than for the larger
sample as a whole.
A follow-up question about what sorts
of math respondents remembered doing
gave insight into how visitors thought
about the math at the exhibits. The two
most frequent responses were
doubtless influenced by the earlier
questions: algebra (25% of the 779
responses) and math (15% of responses).
Fifteen percent of responses, however,
included the name of another branch of
math: geometry.
More specific responses included words
for mathematical operations, like addition
(14% of responses) and division (3% of
responses). The word “measuring” was
included in 3% of responses, and things
that were measured were also mentioned,
like “speed” and “weights” (both 5% of
responses). Of algebra-related terms, it
was not surprising that “graphs” was
mentioned more often than “equations”
(11% vs. 2%), since the exhibits included
more graphs than equations.

Recognition of a Different Kind of Math Experience Although the Design Zone team was clear in its intention to design experiences different from those of
school math, we wondered if the visitors appreciated that aspect of the experience. As seen in Table 1,
below, large majorities of all subgroups agreed that Design Zone allowed them to experience math
differently than from school math.
34 © May 2013 Oregon Museum of Science and Industry Garibay Group | Design Zone Exhibition Summative Evaluation
1
(disagree strongly) 2 3
4
(agree strongly)
Rating
Average
All groups
n = 882 7% 7% 25% 62% 3.42
Groups that included
10- to 14-year-olds
n = 261
5% 6% 24% 66% 3.51
Only groups with 10- to 14-
year-olds who agreed that
they used math
n = 212
3% 5% 23% 70% 3.59
Only groups with 10- to 14-
year-olds who agreed that
they used algebra
n = 138
2% 4% 20% 73% 3.64
Only groups who agreed
that they used math
n = 602 3% 5% 24% 68% 3.58
Table 1. Agreement ratings to the statement, “The exhibits allowed us to experience math in ways that were
different from school math.”

Recognition of a Different Kind of Math Experience, cont’d.
35 © May 2013 Oregon Museum of Science and Industry Garibay Group | Design Zone Exhibition Summative Evaluation
These remarks suggest that although
most respondents saw links between
the math they learned at school and
Design Zone, they recognized that the
exhibition provided a very different set
of experiences.
Respondents also made a number of
comments that supported this finding,
such as:
[“Drawing in Motion” is more fun than
drawing graphs at school] because you
get to see it happen on [the screen].
We were having FUN.
I didn’t really look at it as math until
you asked.
You don’t really think about applying
math, that’s what makes it so fun.
[The exhibit] wasn’t straight forward
about math. [I] didn’t even see the word
math a lot throughout!
There was no pressure.
There aren’t any right or wrong
answers, just experimenting with
different variables.
No one is judging. It’s OK to make a
mistake and you don’t feel stupid.

Comfort with Math and Algebra Survey respondents were also asked to rate their comfort level using math at the Design Zone exhibits
(Figure 22). Analysis of ratings from respondents who agreed they had used math in the exhibit (ratings
of 3 or 4) indicated that comfort levels were generally high, with 83% of respondents providing ratings of
3 or 4. Ratings were somewhat higher (94%) for groups with children in the target age range. The rating
average for groups who agreed they used math was 3.62, while the rating average for groups that
included 10- to 14-year-olds who agreed they used math was 3.67.
36 © May 2013 Oregon Museum of Science and Industry Garibay Group | Design Zone Exhibition Summative Evaluation
2% 5%
21%
72%
1% 6%
19%
75%
0%
10%
20%
30%
40%
50%
60%
70%
80%
1(disagree strongly)
2 3 4(agree strongly)
Figure 22. Agreement ratings to the statement, “My group felt comfortable using math at the Design Zone exhibits.”
Groups who agreed that they used mathn = 603
Groups with 10- to 14-year-olds who agreed that they used mathn = 212

Comfort with Math and Algebra, cont’d. Because we wanted to determine comfort with math across the entire visitor sample (not just those who
agreed they had used math), we asked this question of all survey respondents. Looking at the entire
sample (Figure 23), agreement ratings are somewhat lower, with 81% agreeing that they felt
comfortable. (Note that groups with 10- to 14-year-olds gave ratings that were relatively high, with 89%
providing 3 or 4 ratings.) The rating average for all groups was 2.51, while the rating average for groups
that included 10- to 14-year-olds was 3.30.
37 © May 2013 Oregon Museum of Science and Industry Garibay Group | Design Zone Exhibition Summative Evaluation
11% 8%
20%
61%
4% 7%
19%
70%
0%
10%
20%
30%
40%
50%
60%
70%
80%
1(disagree strongly)
2 3 4(agree strongly)
Figure 23. Agreement ratings to the statement, “My group felt comfortable using math at the Design Zone exhibits.”
All groupsn = 879
Groups that included 10- to 14-year-oldsn = 260

Comfort with Math and Algebra, cont’d. In a follow-up question, exit survey respondents were asked to give the reason for their ratings about
their comfort doing the math at Design Zone. When their open-ended answers were coded, five
categories emerged (Table 2).
38 © May 2013 Oregon Museum of Science and Industry Garibay Group | Design Zone Exhibition Summative Evaluation
Agreement levels with the statement
“My group felt comfortable using math at the Design Zone exhibits.”
Answered 1 (disagree
strongly)
n = 95
Answered 2
n = 64
Answered 3
n = 151
Answered 4
(agree strongly)
n = 501
Aspects of exhibit design, such as
label explanations and interactivity 6% 3% 46% 46%
How easy or difficult the math was 4% 19% 17% 30%
Group members’ backgrounds and
feelings about math 14% 13% 21% 24%
Group members’ ages 41% 39% 18% 10%
Did not do math 35% 22% 6% 1%
Table 2. Reasons for comfort ratings with math

Comfort with Math and Algebra, cont’d.
39 © May 2013 Oregon Museum of Science and Industry Garibay Group | Design Zone Exhibition Summative Evaluation
Positive Agreement
Respondents who strongly agreed that
they felt comfortable with the math in the
exhibits cited a variety of sources for their
comfort. Nearly half, 46%, commented
favorably on aspects of the design of the
exhibits—such as the overall interactive
approach—or the clarity and usefulness of
the instructions (Table 2). For instance,
they said the instructions and
explanations on the exhibit labels and
screens helped them feel comfortable.
The instructions were straightforward.
The instructions: what [the exhibit] does,
what you need is clear.
Good instructions for people who may
not have initially understood, so the
“answer” was there.
The explanations on the signs
are helpful.
Panels help guide successful
experiments.
Others cited various advantages of taking
a challenge-based, hands-on, and
interactive approach to the exhibits.
That because it was hands on,
regardless of the child’s age, they
could do it.
[The math] was integrated into
challenges in a natural way.
Instant gratification, got to touch it.
Thirty percent of respondents mentioned
how easy or simple the math seemed
(which would represent the interaction
of exhibit design with the respondents’
backgrounds). Examples include
the following:
It was very basic math.
It wasn’t difficult at all.
Easy to interact with exhibits, and can
go at your own pace.
It was simple enough, but
still challenging.
Twenty-four percent of the comments
related more to respondents’ own
backgrounds and feelings about math.
These responses fell into several
subcategories. Some respondents cited
aspects of their personal backgrounds as
the source of their comfort, such as
schooling and an overall predisposition
towards math, while other cited their own
math-related careers, or even their
companion’s background in math, as a
source of their comfort.
It’s stuff that relates to school.
[I] remember it from school.
It’s all the stuff we learned in
high school.
I’m an engineer, I’m always
comfortable.
I’m a science teacher, so this is easy
for me!
Because I’m a CPA.
I’m a math major.
[My] husband’s a math teacher.
I’m here with a math professor, and I’m
a high school teacher.
I had a mathematician with me.
My son is good at it.
Others commented that they just like
math, and they’re good with it.
I’m a math head.
I like numbers.
I am good at math.
Math is like second nature.

Comfort with Math and Algebra, cont’d.
40 © May 2013 Oregon Museum of Science and Industry Garibay Group | Design Zone Exhibition Summative Evaluation
Ten percent of comments mentioned the
role that the age of their group members
played in their comfort with the exhibits.
Many of these comments cited a good fit
between the exhibition’s math and the
ages of children in their group.
Our kids had no problems playing, they
had fun.
11-year-old was comfortable...age of
[our] kids good for this exhibit.
[It was] kid friendly.
Despite respondents’ agreement that they
felt comfortable with the exhibition’s math,
some of their comments pointed to
mismatches between the exhibition’s
math and some of the children in their
group. While a few comments discussed
a mismatch for older children,
most concerned the idea of the
exhibit not being as appropriate for
younger audiences.
Needs more stuff for big kids, stuff for
them to think about.
My kids are young, so they were using
math but maybe not aware.
Definitely comfortable, but maybe not
for a younger kid.
Among this group, several categories of
responses occurred at low levels (less
than 5%), but were still enlightening. For
instance, a few respondents mentioned
that the exhibit setting was low-pressure
and thus not intimidating.
It was fun, no pressure.
Making it fun made it easier and
not intimidating.
You get to play with it; it’s all right to fail.
Some respondents noted that it did not
feel as if they were doing math.
You don’t really think about applying
math, that’s what makes it so fun.
They didn’t realize that’s what they were
doing [referring to math].
I didn’t really look at it as math until
you asked.
A few respondents also mentioned how
the exhibits contributed to their own
comfort, or the comfort of their children, by
using examples from everyday life.
The math seemed “every day.”
It was applicable to what kids see
every day, applying the elements of
design and math to things the kids can
relate to.
Finally, a few respondents mentioned the
role of floor staff in making them feel
comfortable with the math in the exhibits.
[There were] lots of explainers to help.
Started at “balance art” and an
explainer showed us how to use the
math for it. That basically got the ball
rolling for us.

Comfort with Math and Algebra, cont’d.
41 © May 2013 Oregon Museum of Science and Industry Garibay Group | Design Zone Exhibition Summative Evaluation
Negative Agreement
For respondents who disagreed strongly
with the statement about feeling
comfortable using math, 35% said they
did not do any math at the exhibits (Table
2). Forty-one percent of responses
related to the ages of the children in their
groups as part of what contributed to their
lack of comfort. These respondents
primarily noted they felt the exhibit was
aimed at children older than those in their
group. Here are some examples of things
they said:
The kids were too young to understand
math.
With kids 7, 5, and 4, they don’t
understand much about math.
My kids are young. My youngest likes
blocks and went to build, not too much
thinking went into that.
Not worth explaining to a 7-year-old.
Age appropriateness was lacking.
Another 14% cited, negatively, their own
backgrounds and feelings about math.
I haven’t done math in years, makes
me realize I’m not as intelligent as I
think I am.
Math is a weak area for me.
We lost a lot of math skills.
I hate math, so it’s never easy for me.
I don’t like to use math, stay away from
math!
Six percent of these respondents
commented on specific aspects of the
design of the exhibits (vs. 46% of those
who strongly agree that they felt
comfortable with the math). Not
surprisingly, these respondents’
comments were negative.
Some of the instructions were
confusing. Also, [it] wasn’t clear what
we were supposed to accomplish for
some exhibits.
It goes back to the explanations thing. It
says “use algebra to do this” and didn’t
explain.
Four percent of these adults said that the
math was too hard for them.
It was hard.
I didn’t feel like doing math, too
complicated.

Enjoyment Ninety-five percent of the respondents surveyed agreed that they enjoyed their experience, rating it a 3
or 4 on a 1–4 scale (Figure 24). Those in the target age range reported higher levels of engagement
(97%) than the sample as a whole. The rating average for all groups was 3.68, while the rating average
for groups that included 10- to 14-year-olds was 3.77.
42 © May 2013 Oregon Museum of Science and Industry Garibay Group | Design Zone Exhibition Summative Evaluation
2% 3%
21%
74%
1% 2%
17%
80%
0%
10%
20%
30%
40%
50%
60%
70%
80%
90%
1(disagree strongly)
2 3 4(agree strongly)
Figure 24. Agreement ratings with the statement, “We really enjoyed our experiences in Design Zone.”
All groupsn = 889
Groups that included 10- to 14-year-oldsn = 260

Enjoyment, cont’d. Although there was seemingly little room for improvement, respondents who also agreed with the
statement that they had used math or algebra at Design Zone tended to rate their enjoyment even
higher, reaching the 100% level (rating of 3 or 4) for target audience members who agreed they used
algebra (Table 3).
43 © May 2013 Oregon Museum of Science and Industry Garibay Group | Design Zone Exhibition Summative Evaluation
1
(disagree strongly) 2 3
4
(agree strongly)
Rating
Average
Groups who agreed
that they used math
n = 603 1% 1% 20% 78% 3.75
Groups with 10- to 14-
year-olds who agreed
that they used math
n = 212
1% 1% 17% 82% 3.80
Groups with 10- to 14-
year-olds who agreed
that they used algebra
n = 138
0% 0% 13% 87% 3.87
Table 3. Agreement ratings for the statement, “We really enjoyed our experiences in Design Zone” for groups
who agreed they used math or algebra in the exhibition.

Enjoyment, cont’d.
44 © May 2013 Oregon Museum of Science and Industry Garibay Group | Design Zone Exhibition Summative Evaluation
When asked what they enjoyed most,
survey respondents provided a range of
answers. Most named specific individual
exhibits that they recalled as especially
fun and/or engaging. Especially popular
exhibits included “Hit the Target,” “Bike
Race,” “Balancing Art,” “Digital Strings,”
the three roller coaster exhibits, “Laser
Light Show,” and “Marble Maze.”
Respondents also often mentioned
the hands-on and interactive nature of
the exhibits.
Only 4% of the surveyed respondents
mentioned math or algebra in their
answers as what was most enjoyable:
I liked how they pointed out the math. It
was explicit. Great to have interesting
activity and then say it’s math.
Really smart way to trick kids into
learning math.
Demonstrates math graphically so it’s
easier to understand.
How math and physics come together
through design.
Algebra. I love an exhibit with math in it.
Algebraic connection, how real life is
tied in to math.
I like the use of algebra to teach basic
concepts, making algebra applicable.

Perception of Challenge Nearly three-quarters of the target audience groups, 74%, agreed or agreed strongly (ratings of 3 or 4)
with the statement, “Some of the exhibits were pretty challenging, but we figured them out in the end.”
As did 68% of the entire sample (Figure 25). The rating average for all groups was 2.85. The rating
average for groups that included 10- to 14-year-olds was 3.00. This indicates that Design Zone met the
NSF indicator: “During the visit, a majority of the target audience (51% or more) will feel challenged,
but successful.”
45 © May 2013 Oregon Museum of Science and Industry Garibay Group | Design Zone Exhibition Summative Evaluation
18% 15%
33% 35%
13% 13%
36% 38%
0%
10%
20%
30%
40%
1(disagree strongly)
2 3 4(agree strongly)
Figure 25. Agreement ratings for the statement, “Some of the exhibits were pretty challenging, but we figured them
out in the end.”
All groupsn = 885
Groups that included 10- to 14-year-oldsn = 261

Perception of Challenge, cont’d. We found respondents expressed stronger agreement with “challenged but successful” in groups which
agreed that they had used math or algebra (Table 4).
46 © May 2013 Oregon Museum of Science and Industry Garibay Group | Design Zone Exhibition Summative Evaluation
1
(disagree strongly) 2 3
4
(agree strongly) Rating Average
Groups who agreed that
they used math
n = 602
11% 14% 35% 40% 3.05
Groups with 10- to 14-
year-olds who agreed
that they used math
n = 212
9% 13% 36% 42% 3.11
Groups with 10- to 14-
year-olds who agreed
that they used algebra
n = 138
7% 10% 36% 46% 3.21
Table 4. Agreement ratings for groups who agreed they used math or algebra in the exhibit to the statement
“Some of the exhibits were pretty challenging, but we figured them out in the end.”

Perception of Challenge, cont’d.
47 © May 2013 Oregon Museum of Science and Industry Garibay Group | Design Zone Exhibition Summative Evaluation
Those respondents who agreed strongly
that they were both challenged and
successful most often described a
particular exhibit at which they eventually
succeeded. Most of the exhibits were
listed in at least a few of the responses.
The most frequently mentioned exhibits,
both mentioned in 8% of the responses,
were “Hit the Target” and the roller
coaster exhibits (respondents were
usually not specific about which one). The
other exhibits were mentioned in 2% or
less of the responses.
Of those respondents who disagreed
strongly with this statement, more than
three-quarters said they did not find any
exhibit to be challenging.
No challenges for me or my grandson.
Didn’t find any to be challenging.
All pretty easy stuff for kids...no
challenges.
It was easy. Would have liked for it to
be more challenging.
Most of the other respondents in this
group mentioned specific exhibits that
they were unable to figure out or use.
The Picture Calculator. It took too long
to figure out.
Child didn’t understand the laser light
show.
We gave up. The mirror maze [“Mirror
Multiplier”] was challenging. It was hard.

Connections Respondents were asked to rate their level of agreement to two statements about connections between
what they were doing at the exhibits and the math they had done in school or the ways they used math
in everyday life. We found good levels of agreement in both cases. Sixty-nine percent of all respondents
and 71% of groups with children in the target age range agreed or agreed strongly (providing ratings of 3
or 4) with the statement, “Some of the exhibits reminded us of the math we did in school” (Figure 26).
The rating average for all groups was 2.95. The rating average for groups that included 10- to 14-year-
olds was 3.08.
48 © May 2013 Oregon Museum of Science and Industry Garibay Group | Design Zone Exhibition Summative Evaluation
18% 13%
25%
44%
12% 17%
23%
48%
0%
10%
20%
30%
40%
50%
60%
1(disagree strongly)
2 3 4(agree strongly)
Figure 26. Agreement ratings to the statement, “Some of the exhibits reminded us of the math we did in school.”
All groupsn = 886
Groups that included 10- to 14-year-oldsn = 262

Connections, cont’d. Seventy-nine percent of all respondents, and 86% of those groups with children in the target age range,
provided agreement ratings of 3 or 4 to the statement, “Some of the exhibits helped us think about ways
that math is used in everyday life” (Figure 27). The rating average for all groups was 2.23. The rating
average for groups that included 10- to 14-year-olds was 3.43.
49 © May 2013 Oregon Museum of Science and Industry Garibay Group | Design Zone Exhibition Summative Evaluation
10% 11%
24%
55%
5% 10%
24%
62%
0%
10%
20%
30%
40%
50%
60%
70%
1(disagree strongly)
2 3 4(agree strongly)
Figure 27. Agreement ratings to the statement, “Some of the exhibits helped us think about ways that math is used in
everyday life.”
All groupsn = 888
Groups that included 10- to 14-year-oldsn = 263

Connections, cont’d. School connections were most often about math concepts, representations, or activities done in math
class, such as graphs and learning algebra (Table 5).
50 © May 2013 Oregon Museum of Science and Industry Garibay Group | Design Zone Exhibition Summative Evaluation
Exhibit Respondents were reminded of….
“Balancing Art”
Learning algebra in school, including balancing equations. (Respondents sometimes talked about specific teachers and what they
had done in class.)
The physical science concept of the lever: The “farther away you are from the fulcrum, the more power you've got.”
Using scales in school. For instance, one child remembered that in math class, they weighed pencils and paperclips and other things
to see which was heaviest.
“Bike Race” Graphs that the kids had used in school, for math or science.
“Drawing in
Motion”
A coordinate grid and plotted points, done in fourth grade.
A school activity where they moved between points based on coordinates like “7, 10.”
Graphs done in math where they just used their pencils. (But this exhibit was more fun “because you get to see it happen on [the
screen].”)
“Drum Machine” Similar exercises in school, counting out beats in their music.
A music class where they do percussion.
“Fast Tracks” A project done in fourth grade called the marble roll, made of paper towel tubes, cut open and taped to lockers.
“Hit the Target”
Math in school, because it used a graph to display information.
Graphs done earlier during the school year, which helped her, understand the exhibit’s panels.
A boy's science teacher, who would shoot him in class with Nerf guns.
A similar catapult a girl had in her own science class that was adjustable with a small dial.
“Slide-a-Phone”
“It looks like a graph that tells you what the tones are.”
The graph made it like algebra to one respondent.
Playing an instrument a couple of years ago in music class. The boy said they would beat on something and move it around and it
would make different tones.
Table 5. Examples of connections that respondents made between the exhibits and school experiences

Connections, cont’d. Everyday connections were most often about the physical similarities between the exhibits and objects
or experiences encountered in everyday life (Table 6).
51 © May 2013 Oregon Museum of Science and Industry Garibay Group | Design Zone Exhibition Summative Evaluation
Table 6. Examples of connections respondents made between the exhibits and everyday life
Exhibit Respondents were reminded of….
“Balancing Art” Teeter-totters, especially how sitting on the beam in particular places changed how it worked.
Mobiles made as art projects; mobiles made out of spoons as art.
“Bike Race” Biking up a hill, because it’s very tiring.
Riding bikes every day to school or work.
“Drawing in Motion” An Etch A Sketch.
“Drum Machine” Noises people would make while they’re thinking (like tapping a pencil).
“Fast Tracks”
A marble game that an adult had when he was growing up.
Playground slides, because the steeper the real life [playground] slide, the faster it would be.
Driveways during an ice storm.
“Hit the Target”
Baseball and basketball, because each involved a ball flying in an arc and landing somewhere, either in a basket or a glove.
Basketball, because of the arc of the shot.
Choosing golf clubs, because each has a different angle on the face which changes the height of the shot and therefore the
distance of the golf ball.
“Marble Maze”
A physical game where they had to roll a marble through a maze.
A cell phone game they have that has a similar style.
In a workshop when a screw or a nut rolls off the table.
Golf, because of the ball going into the little holes.
“Slide-a-Phone”
A trombone.
A didgeridoo, from Australia. It doesn’t slide but it sounds like this.
Musical instruments they make like this at home sometimes with toilet paper and paper towel tubes.
Using milk bottles with water in them as musical instruments.
“Maybe a gigantic pencil?”

Algebraic Thinking
52 © May 2013 Oregon Museum of Science and Industry Garibay Group | Design Zone Exhibition Summative Evaluation
A primary goal of Design Zone was to
engage visitors in algebraic thinking. This
concept was “operationalized” to focus on
patterns and functional relationships. The
goal was to have visitors use algebraic
thinking through a) finding and exploring
mathematical patterns and relationships
between quantities; b) representing
mathematical relationships in a range of
ways, including images, words, models,
graphs, and symbols; and c) using
mathematical relationships to describe,
analyze, predict, and create.
Thus, we were interested in
understanding the ways and extent to
which visitors engaged in algebraic
thinking as they used exhibits in Design
Zone. To explore this issue in some
depth, we conducted observations and
included a video study at selected exhibits
to obtain case studies of child-parent pairs
(Figures 28–30). Based on these data, we
developed a framework of ways visitors
engaged with algebraic thinking. Table 7
describes this framework.
Figure 28. The “Balancing Art” exhibit, one of
the exhibits in the video study. Figure 29. A group at “Drawing in Motion,”
another exhibit where video data was
collected.
Figure 30. The “Slide-a-Phone” exhibit was
the third exhibit where visitors were
videotaped for this study.
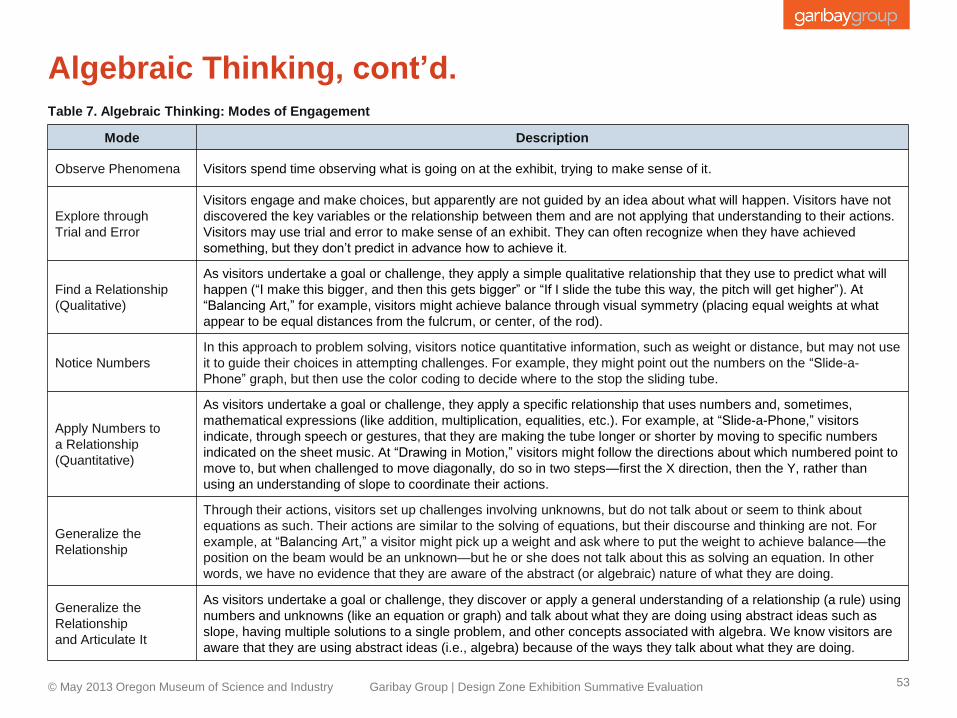
Algebraic Thinking, cont’d.
53 © May 2013 Oregon Museum of Science and Industry Garibay Group | Design Zone Exhibition Summative Evaluation
Table 7. Algebraic Thinking: Modes of Engagement
Mode Description
Observe Phenomena Visitors spend time observing what is going on at the exhibit, trying to make sense of it.
Explore through
Trial and Error
Visitors engage and make choices, but apparently are not guided by an idea about what will happen. Visitors have not
discovered the key variables or the relationship between them and are not applying that understanding to their actions.
Visitors may use trial and error to make sense of an exhibit. They can often recognize when they have achieved
something, but they don’t predict in advance how to achieve it.
Find a Relationship
(Qualitative)
As visitors undertake a goal or challenge, they apply a simple qualitative relationship that they use to predict what will
happen (“I make this bigger, and then this gets bigger” or “If I slide the tube this way, the pitch will get higher”). At
“Balancing Art,” for example, visitors might achieve balance through visual symmetry (placing equal weights at what
appear to be equal distances from the fulcrum, or center, of the rod).
Notice Numbers
In this approach to problem solving, visitors notice quantitative information, such as weight or distance, but may not use
it to guide their choices in attempting challenges. For example, they might point out the numbers on the “Slide-a-
Phone” graph, but then use the color coding to decide where to the stop the sliding tube.
Apply Numbers to
a Relationship
(Quantitative)
As visitors undertake a goal or challenge, they apply a specific relationship that uses numbers and, sometimes,
mathematical expressions (like addition, multiplication, equalities, etc.). For example, at “Slide-a-Phone,” visitors
indicate, through speech or gestures, that they are making the tube longer or shorter by moving to specific numbers
indicated on the sheet music. At “Drawing in Motion,” visitors might follow the directions about which numbered point to
move to, but when challenged to move diagonally, do so in two steps—first the X direction, then the Y, rather than
using an understanding of slope to coordinate their actions.
Generalize the
Relationship
Through their actions, visitors set up challenges involving unknowns, but do not talk about or seem to think about
equations as such. Their actions are similar to the solving of equations, but their discourse and thinking are not. For
example, at “Balancing Art,” a visitor might pick up a weight and ask where to put the weight to achieve balance—the
position on the beam would be an unknown—but he or she does not talk about this as solving an equation. In other
words, we have no evidence that they are aware of the abstract (or algebraic) nature of what they are doing.
Generalize the
Relationship
and Articulate It
As visitors undertake a goal or challenge, they discover or apply a general understanding of a relationship (a rule) using
numbers and unknowns (like an equation or graph) and talk about what they are doing using abstract ideas such as
slope, having multiple solutions to a single problem, and other concepts associated with algebra. We know visitors are
aware that they are using abstract ideas (i.e., algebra) because of the ways they talk about what they are doing.

Algebraic Thinking, cont’d.
54 © May 2013 Oregon Museum of Science and Industry Garibay Group | Design Zone Exhibition Summative Evaluation
Most visitors we observed built their
exhibit experiences around challenges,
either those presented explicitly in the
exhibits or those they set for themselves.
Visitors wanted to build a specific
structure, score the most points, name
that tune, achieve a perfect balance,
put the ball in the hole, avoid losing a
marble in a gaping mouth, connect all the
dots, or win the race. If, at first, visitors
failed to meet a challenge, they looked for
ways to improve and tried again. When
they met the exhibit’s challenge or
achieved their own challenges, many
visitors celebrated (some exhibits even
celebrated along with them). There were
cries of “Yes!” with arms raised above
their heads, fist pumps, high and low
fives, sometimes a little victory dance, and
perhaps even a bit of taunting of the
vanquished sibling.
Visitors applied algebraic thinking in
different ways and did so within the
context of the challenges they attempted
and the goals they sought to achieve.
Completing challenges was easier when
visitors discovered the key functional
relationships embedded within the
exhibits. Respondents had an even easier
time if they discovered and used the
mathematical tools provided by the
exhibits. For instance, most visitors at
“Fast Tracks” discovered they could make
the ball roll faster if they made the track
steeper, and some found that they could
measure the ball’s speed using the digital
readouts on the speed gates. At “Drawing
in Motion,” many visitors discovered that
they had to move both sliders at the same
time to draw a diagonal line and that they
had to pay close attention to the relative
rates of motion of the two sliders to
precisely connect the dots on screen.
Respondents showed and told us they
were thinking about and using these
relationships in a range of ways—some
were felt or experienced kinesthetically
(like “Testing Gears” or “Bike Race”),
some were expressed as words or
gestures in qualitative form, some
included measurements and counts, and
some used the kinds of generalized and
symbolic approaches associated with the
subject of algebra.
As visitors wrestled with completing a
challenge, they tried different
approaches—or modes of engagement—
and often shifted between them. For
example, as visitors attempted a
challenge, they might start with trial and
error and then, gaining some insight from
this exploration, might find a relationship
and apply a generalized understanding of
that relationship to the challenge. Visitors
also moved back and forth between
modes. For instance, a group might apply
a generalized understanding of a
relationship in meeting one challenge
but then when faced with a more complex
challenge, might shift to a trial and
error approach.
Here’s one scenario. Visitors might start
by observing a phenomenon at the
exhibit. Once visitors discovered a
challenge or set a goal, their efforts
generally became more focused. They
started applying strategies to solve
whatever problems they encountered. The
simplest strategy was trial and error: just
try something—whatever comes to
mind—and see if it works. Thinking about
the results of their informal experiments
often led visitors to discover a key
relationship—the thing they had to
change and the way they had to change it
to achieve their goal. When this
relationship was expressed through
visitors’ actions and words, we termed it
finding a relationship.

Algebraic Thinking, cont’d.
55 © May 2013 Oregon Museum of Science and Industry Garibay Group | Design Zone Exhibition Summative Evaluation
If visitors discovered that they could apply
numbers—measurements and counts—to
describe the functional relationship, they
began to engage in applying numbers to a
relationship. Visitors moved to
generalizing the relationship when they
started to approach the challenge using
more abstract ways of thinking generally
associated with school algebra. This
mode of engagement involved using
graphs, data tables, and equations that
expressed the key relationship in ways
that allowed visitors to meet a range of
challenges presented by the exhibit.
What we call generalizing the relationship
overlaps considerably with what might
traditionally be considered doing algebra
(sometimes defined as “abstract
arithmetic”). We do not, however, restrict
the term “algebraic thinking” to this mode
of engagement. Algebraic thinking, as
defined for this study, begins as soon as
visitors recognize a relationship between
two things that change (i.e., variables) at
the exhibit. In informal settings like Design
Zone, therefore, even children too young
to have heard the word “algebra” can, at a
basic level, practice algebraic thinking.
As visitors shift to other modes,
their thinking might become quantified
and then generalized so that their
understanding of a relationship applies to
a range of challenges.
The scenario described above presents a
generalized, rather linear description of
visitors’ engagement. In our video study,
however, we found that visitor
engagement with algebra in the exhibition
was complex and did not follow a
prescribed path. Engagement was fluid,
with visitors moving back and forth
across modes as they approached
the challenges.

Algebraic Thinking in Three Exhibits in Depth
56 © May 2013 Oregon Museum of Science and Industry Garibay Group | Design Zone Exhibition Summative Evaluation
The following section discusses
respondents’ algebraic thinking in depth
during their engagement at three exhibits.
By focusing on each exhibit, we can
identify important patterns that emerge at
a single exhibit and note exceptions that
reveal interesting aspects of algebraic
thinking across these exhibits.
At “Balancing Art,” visitors might observe
phenomena, find a relationship, and state
it in several different ways, such as,
“When you add a weight to one side of the
balanced scale, that side goes down,” or
“When you take away a weight from one
side of a balanced scale, that side goes
up.” A statement relating variables of
weight and distance with balance might
be, “You can balance the scale if you
place two weights symmetrically on either
side of the pivot”—implying that visitors
noticed a relationship involving two
variables. Putting this in natural language,
one might say something like, “A heavy
weight that is closer to the pivot can be
balanced by a lighter weight farther from
the pivot.” One also might state the
general relationship as, “When trying to
balance the scale, both weight and
position matter.”
At “Drawing in Motion,” the core
relationships were between the positions
of the two sliders (along number lines)
and the position of the pointer drawing on
the screen. The “X” slider controlled
horizontal position. The “Y” slider
controlled vertical position. When the “X”
slider was moved to the right, the pointer
moved to the right, drawing a horizontal
line along the path it followed; when “X”
moved to the left, the pointer moved to the
left. When the “Y” slider was moved to the
right, the pointer moved down, leaving a
vertical line behind it; when “Y” moved to
the left, the pointer moved up. With
coordinated exploration at this exhibit,
visitors could discover relationships like
this: “When you move X and Y to the right
at the same time, the line on the screen
slopes upwards to the right.”
The core relationship at “Slide-a-Phone”
was between the length of the sliding tube
and the pitch of the sound produced when
a visitor hit the drum-like surface at one
end of the tube. At its simplest
expression, visitors noticed that when
they moved the slider, the pitch changed.
With a bit more exploration, they often
noticed that moving the slider to the left
made the tube longer, and when the tube
got longer, the pitch got lower. Moving the
slider to the right made the tube shorter
and the pitch higher. In other words, “A
longer tube makes a lower note and a
shorter tube a higher note.”
At all three exhibits, visitors could
discover the core functional relationships
through exploration. They could, in a
sense, feel the relationships as they
discovered them, because of the physical
feedback to their body motions; they
encountered physical resistance as they
lengthened the sound tube, moved the
sliders, and positioned the weights. Some
respondents seemed to develop a kind of
kinesthetic understanding of the
relationship before they were able to
verbalize their understanding. They might
express their ideas about this relationship
through gestures when they had trouble
finding words or use gestures as part of a
verbal description.
When visitors expressed these functional
relationships through words and gestures,
they were often expressing qualitative
relationships. For example, as they talked
about balancing the scale at “Balancing
Art,” respondents sometimes held their
arms out and tilted them side to side. At

Algebraic Thinking in Three Exhibits in Depth, cont’d.
57 © May 2013 Oregon Museum of Science and Industry Garibay Group | Design Zone Exhibition Summative Evaluation
“Slide-a-Phone” they moved their hands
apart to show a longer tube and lower
note and moved them closer together to
show a shorter tube and higher note.
Each exhibit, however, also allowed
visitors to think about the relationships
using numbers, expressing at least some
aspects of the relationship quantitatively.
These numbers included measurements
of tube length at “Slide-a-Phone,” position
markers on the sliders and the resulting
coordinate grid for “Drawing in Motion,”
and the weights of the hanging shapes
and their positions on the balancing rod at
“Balancing Art.”
Visitors often found and used these
numbers while engaging with the exhibits.
When they did, they were moving from a
qualitative understanding of the
relationships and engaging in quantitative
ways. Note that for “Drawing in Motion”
and “Balancing Art,” visitors could use
numbers to describe both sides of the
core relationship; the important variables
could be measured (or counted, as one
could approach relative rates of motion in
“Drawing in Motion”). At “Slide-a-Phone,”
however, only the length of the tube was
quantified on the graph-like “Name that
tune!” challenge cards. The pitch of the
resulting sound was not measured.
Once visitors recognized and used the
quantitative tools available at an exhibit,
they were ready to move on in their
mathematical understanding of the
relationship to a mode that expressed that
relationship in more abstract terms, a
mode more traditionally identified as
algebra. At two exhibits, the abstraction
was made concrete using a graph: the
coordinate system in “Drawing in Motion”
and the graph-like “Name that Tune”
challenge cards in “Slide-a-Phone.” At
“Drawing in Motion,” the variables were
labeled classically as “X” and “Y.” To
make drawings on the screen, visitors
had to work collaboratively to move a
point that drew lines, with one shifting the
point to designated numbers in the
horizontal or X direction and the other to
numbers in the vertical or Y direction.
Their movements were combined into a
real-time drawing on the on-screen
coordinate grid.
The “Slide-a-Phone” challenge cards
charted tube length (vertical axis) against
order of notes (non-numeric horizontal
axis of “time”) and showed the notes as
colored dots labeled with the exact length
of the tube required to hit that note. Each
“Slide-a-Phone” card displayed a different
series of tube lengths arrayed from left to
right—which, when struck on the drum
head in order, played a familiar song.
“Balancing Art” took another approach to
presenting an algebraic relationship, a
physical manifestation of balancing an
equation. As the parent panel stated,
“Solving these challenges involves
balancing two sides of an equation.
You have to think about both weight
and distance.”
“Balancing Art”
The four video cases at “Balancing
Art” illustrate the roles that attentive
caregivers can play in advancing their
children’s algebraic thinking and the
important role that the parent panel
played in helping respondents advance
their algebraic thinking.

Algebraic Thinking in Three Exhibits in Depth, cont’d.
58 © May 2013 Oregon Museum of Science and Industry Garibay Group | Design Zone Exhibition Summative Evaluation
would read labels—sometimes aloud—
and apply what she found. The mother
and daughter noticed the challenge label
early on and a minute into the interaction
the mother noticed the parent panel and
apparently understood its significance.
The mother made increasingly
sophisticated suggestions to her child
based on what she had read, reflecting
increasingly quantitative and more
abstract ways of thinking as time passed.
These suggestions helped the child shift
her approach.
Mo
de
of
En
ga
ge
me
nt
Generalize the relationship and articulate it
Generalize the relationship
P P C P C
Apply numbers to a relationship (quantitative)
P
Notice numbers C C P C C
Find a relationship (qualitative) C C P P
Trial and error
Observe phenomena
Time (min): 0:26 0:53 1:24 1:30 1:54 3:30 4:06 6:26
end
Figure 31. “Balancing Art”: Algebraic thinking trajectory (mother and her 12-year-old daughter). P = parent, C = child
The encounter of the mother and 12-year-
old girl in the “Balancing Art” video nicely
illustrates some recurring engagement
patterns at this exhibit (Figure 31).
Respondents often began their
engagement at “Balancing Art” using a
qualitative approach; the child in this dyad
started to figure things out quickly, using a
qualitative relationship almost
immediately as she attempted to balance
the scale. Since engagements often
began before respondents had viewed the
accompanying labels, this could be seen
as evidence that the exhibit’s design
helped respondents recall the concept
of a balance-beam scale, which is already
familiar to most children of this age. It was
also typical for caregivers to engage with
the exhibit experience from the very
beginning, even if they mostly stood,
watched, and looked at labels for the first
30 to 60 seconds. Because many
caregivers did not do or say much at first,
though, they could not always be
assigned a code immediately (it took 26
seconds in this example). The child in this
dyad took the lead at first, noticing the
numbers on the weights but
not doing much with them. As parent and
child stood back, however, the parent

Algebraic Thinking in Three Exhibits in Depth, cont’d.
59 © May 2013 Oregon Museum of Science and Industry Garibay Group | Design Zone Exhibition Summative Evaluation
Although the parent’s thoughts doubtless
included abstract ideas about equations
from about a minute in, she did not reveal
that understanding in her questions and
suggestions to the child until about 3:30
into the interaction. At that point she
started posing problems for her child,
many of which could be solved as if they
were equations with unknowns. For
instance, the mother put a 4 weight at
position 4 on one side, and asked, “How
much do you think you’ll have to put at 2
to make it balance?” When the child
solved that problem, the mother said,
“Let's make it harder.” She made up a
new problem and asked, “What would you
have to put on 3 to make it balance?”
Then after realizing her problem might not
have a solution, she said, “Or can you do
it?” The child solved the problem, but with
one weight on three and one on another
position. At that point the mother asked
the child to set a problem that she, the
parent, could solve. Using this approach,
both mother and daughter began to
generalize the relationship.
Mo
de
of
En
ga
ge
me
nt
Generalize the relationship
and articulate it P P P C
Generalize the relationship P C
Apply numbers to a relationship
(quantitative) C P C P P C C C
Notice numbers P C P C P C
Find a relationship (qualitative) C C P C P
Trial and error
Observe phenomena
Time (min): 0:03 0:23 0:31 0:57 1:39 4:40 4:50 13:04 14:10 15:14 15:20 16:37 17:33
end
Figure 32. “Balancing Art”: Algebraic thinking trajectory (mother and 10-year-old daughter). P = parent, C = child
Examining the chart for the group
consisting of a mother and her 10-year-
old daughter (Figure 32) reveals
additional complexities. In this group, the
mother and daughter’s problem solving
moves more or less in concert for more
than 14 minutes. They quickly worked
their way up to the simplest form of
quantitative thinking by placing equal
weights at equal distances on the scale.
Then, however, they shifted again as the
challenges they set for themselves
became more complex, relying on

Algebraic Thinking in Three Exhibits in Depth, cont’d.
60 © May 2013 Oregon Museum of Science and Industry Garibay Group | Design Zone Exhibition Summative Evaluation
qualitative rules to solve them (the
simplest being “add another weight to the
side of the scale that’s higher”). At about
13:20, the mother decided she wanted to
move beyond this very basic approach,
saying “If we put it on the 5 then it should
balance, because they’re the same
[position]. But we want to know what it
would take to balance them when they’re
not on the same [position].” At about
13:40, the mother noticed the parent
panel and read it to her daughter. The
mother said, “Here’s the equation. I knew
there was an equation, look! 3 times 4 is
the same as 4 times 3!” First they tried out
the examples on the parent panel, then
came up with their own equations—
sometimes getting the math a bit wrong
(such as adding when they should have
multiplied), but generally understanding
the abstract ideas about taking both
weight and distance into account when
solving the equations. As they began to
apply what they had learned from the
parent panel, they began to generalize the
relationship, with the mother arriving at
that mode first. The mother even
connected the exhibit to the girl’s school
math (at 18:40), asking, “When we start
doing balancing equations in math, are
you going to remember this?” Gesturing at
the giant mobile and then stretching her
arms out straight like the beam, the
mother said, “This is what I mean when I
say balance your equation. Your equation
is a balance beam and you gotta have
the same thing on both sides. And it
doesn’t matter if it looks the same, as long
as it equals the same.” Her daughter
said, “Huh,” and then resumed her
attempt to balance the mobile using every
available weight.
Another group (Figure 33) consisted of a
grandmother and her 11-year-old
grandson, who had a different experience
with algebraic thinking, primarily because
the grandmother quickly found both the
Mo
de
of
En
ga
ge
me
nt
Generalize the relationship and articulate it P P P
Generalize the relationship P P
Apply numbers to a relationship (quantitative) P P C P C
Notice numbers C C C
Find a relationship (qualitative) P C C
Trial and error C C C
Observe phenomena
Time (min): 0:20 1:53 3:18 4:33 4:57 5:26 5:43 6:10 8:26 8:31
end
Figure 33. “Balancing Art”: Algebraic thinking trajectory (grandmother and 11-year-old grandson). P = grandparent, C = child

Algebraic Thinking in Three Exhibits in Depth, cont’d.
61 © May 2013 Oregon Museum of Science and Industry Garibay Group | Design Zone Exhibition Summative Evaluation
challenge label and parent panel. After
they both looked at the parent panel, the
grandmother asked, “Have you had any
algebra in school?” Her grandson said
“Yeah,” and she continued, “But you
understand the principle that both sides
have to balance,” and she pointed out the
challenges. Although the labels got her
thinking and talking very quickly, the
grandmother struggled to adjust
her approach to meet the needs of her
grandson, who struggled a bit. As the boy
continued to use trial and error to balance
the mobile, she said, “See, you can do
this by guess, or you can do this by the
numbers, the algebra problem,” pointing
at the parent panel and talking about how
“1 times 6 is equal, the same as 2 times
3.” In this case the parent panel
succeeded with the caregiver but, for
uncertain reasons, the child was not ready
or able to follow her. The grandmother
worked through several more challenges
with her grandson. For his final challenge,
the grandmother totaled the weight on
one side of the beam. “You have 3, 3, and
3. 9 times 4 is…” The boy took over the
other side of the beam, swapping out
weights until there were three 3 weights at
the 4 position on that side. He said,
“There, 9 and 9.” Grandma said, “Good,
you got it, that’s great!” and they put the
weights back in the bin.
Another “Balancing Art” group included a
mother and her 10-year-old son (Figure
34). In some ways, they had a similar
experience to the third group. The boy
immediately started hanging weights on
the beam, seemingly without much
thought, saying, “This looks like it will be
fun! I like this.” The mother tried to get him
Figure 34. “Balancing Art”: Algebraic thinking trajectory (mother and her 10-year-old son). P = parent, C = child
Mo
de
of
En
ga
ge
me
nt
Generalize the relationship
and articulate it P P P P P P
Generalize the relationship C
Apply numbers to a
relationship (quantitative) P P C C P C C
Notice numbers C C C C
Find a relationship
(qualitative) C C C P C
Trial and error C C
Observe phenomena
Time (min): 0:11 0:18 0:32 0:41 1:05 1:18 1:42 2:09 2:18 2:25 5:25 6:12 8:10 10:10 12:20
end

Algebraic Thinking in Three Exhibits in Depth, cont’d.
62 © May 2013 Oregon Museum of Science and Industry Garibay Group | Design Zone Exhibition Summative Evaluation
to try some exhibit challenges, saying,
“Do you see that there are little signs right
here?” but having little impact on his
actions at first. The mother discovered the
parent panel early (at about 1:40),
pointing it out to her son and reading part
of it aloud. She exclaimed, “Oh, so it’s like
algebra! Balancing two sides of an
equation. You have to think about weight
and distance.” She then spent the rest of
the interaction subtly encouraging her
independent-minded son to try some
higher-level approaches to balancing the
scale. She gradually helped him to use a
quantitative approach as he tried a few
exhibit challenges and balanced with a 3
weight at the 4 position on one side and a
4 weight at the 3 position on the other. But
then the boy spent much of his time
setting his own challenges, trying to
balance weights in various combinations
using simple quantitative rules about
equal weights at equal distances from the
pivot. At one point his mom asked, “Is it
cheating when you’re using the same
side?” Then she stated, “If you match
them on each side it’s not as challenging.”
Toward the end of the engagement, the
boy decided to balance the scale using
every available weight. At that point, he
shifted back to a qualitative approach.
Overall, at “Balancing Art,” children took
the lead at balancing the scale, but
caregivers—because they stood back and
read the parent panel—led or tried to lead
their children through teaching behaviors.
Based on the follow-up interviews, there
were indications that the parent panels
stimulated adults’ memories of algebra,
either from their own school days or from
helping their children with their homework.
Caregivers used a range of teaching
strategies to help their children, but it
sometimes took a while to help children
try other approaches. In one case, the
child clearly preferred to find his own
ways to engage with the exhibit. It’s also
possible that the kinds of thinking required
at this exhibit were beyond what some 10-
year-olds could accomplish.

Algebraic Thinking in Three Exhibits in Depth, cont’d.
63 © May 2013 Oregon Museum of Science and Industry Garibay Group | Design Zone Exhibition Summative Evaluation
“Drawing in Motion”
At “Drawing in Motion,” caregivers and
children each controlled a slider and
acted cooperatively to complete the
challenges, so there was little opportunity
for a parent to stand back and watch or
read labels. A father and 12-year-old
daughter (Figure 35) moved up through
different modes in concert as they worked
through the exhibit challenges—at least
until they had to draw a diagonal line (at
2:40). At that point, the father explained,
“Oh, OK, now we’re both going to 9 at the
same speed.” Then, when it didn’t work
out, “You moved faster than I did, and
you went farther.” They completed the
challenge anyway, and were rewarded as
the computer program completed and
colored the drawing of the hippo.
Although this indicated that the father was
engaged in generalizing the relationship,
it took a bit more explanation before his
daughter understood. With the father’s
supervision, they successfully drew
several diagonal lines, including one
where they had to move at different
speeds. Continuing to lead, the father
said, “I’m Y, and it says I have to move
twice as fast as you…How about 1, 2, and
I’ll go 2 for every beat, OK? 1, 2, go, 3, 4,
5. How’d we do? Pretty good!” After the
exhibit challenges were completed, the
group switched to Free Draw mode (at
7:24 minutes) and drew a square spiral,
which had no diagonal lines and shifted to
applying numbers to the relationship. (For
this dyad to have moved to “generalizing
the relationships,” they would have had to
move beyond the practical aspects of
drawing a particular diagonal line and talk
about diagonals using more abstract
terms such as slope and ratio.)
Figure 35. “Drawing in Motion”: Algebraic thinking trajectory (father and his 12-year-old daughter). P = parent, C = child
Mo
de
of
En
ga
ge
me
nt
Generalize the relationship and articulate it
Generalize the relationship P P C
Apply numbers to a relationship (quantitative) P C C C P
Notice numbers
Find a relationship (qualitative) P C
Trial and error P C
Observe phenomena
Time (min): 0:33 1:45 2:02 2:40 3:40 7:24
end

Algebraic Thinking in Three Exhibits in Depth, cont’d.
64 © May 2013 Oregon Museum of Science and Industry Garibay Group | Design Zone Exhibition Summative Evaluation
Another group included a mother and a
10-year-old girl (Figure 36). Both
contributed as they worked to figure out
this exhibit. The girl first discovered the
numbers (at 0:12), but did not figure out
how to use them. The mom pushed some
buttons until she reached a screen that
showed the X and Y axis. Then she said,
“Oh, I see, you get it? Like if you’re going
to draw that, you have to use the
coordinates….‘Cause you’re the X, and
I’m the Y.” It took another minute or so for
the mother to figure out how to draw
cooperatively using “the numbers on the
sliders,” and with her help, the girl came
to understand and at this point she shifted
to applying numbers to the relationship (at
2:20 minutes). By taking turns moving
from point to point they completed four
exhibit challenges, though they never
figured out that they were supposed to
draw diagonal lines between some points
(the computer program rewarded their
efforts regardless of how they connected
the points).
Figure 36. Drawing in Motion: Algebraic thinking trajectory (mother and her 10-year-old daughter). P = parent, C = child
Mo
de
of
En
ga
ge
me
nt
Generalize the relationship and articulate it
Generalize the relationship
Apply numbers to a relationship (quantitative) P P C P C
Notice numbers C
Find a relationship (qualitative)
Trial and error P P P C C
Observe phenomena
Time (min): 0:08 0:12 0:40 1:03 2:20 5:10
end
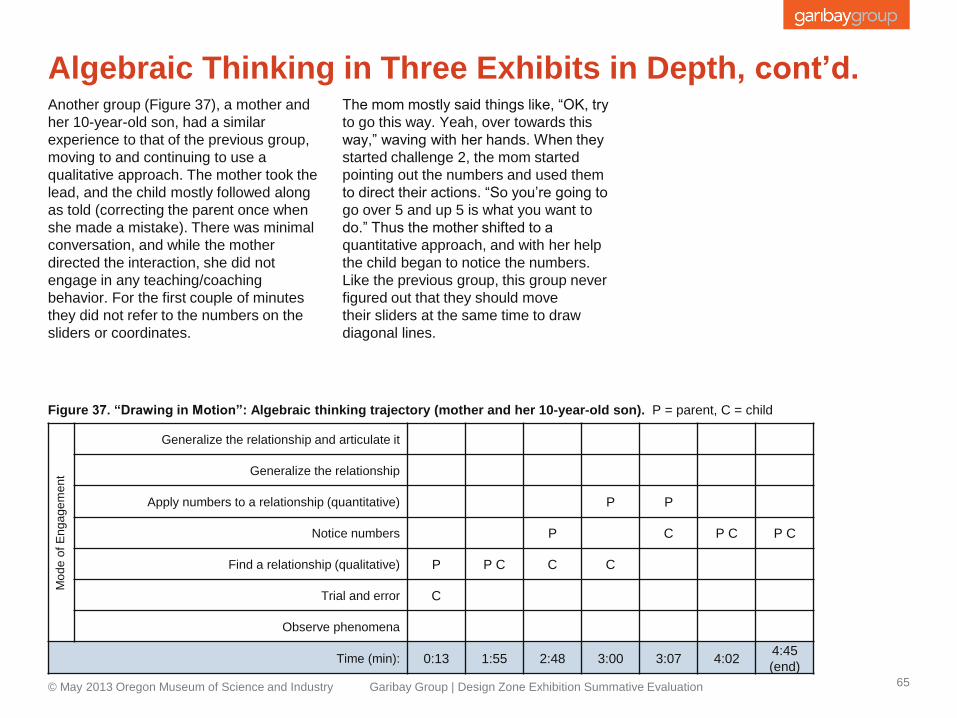
Algebraic Thinking in Three Exhibits in Depth, cont’d.
65 © May 2013 Oregon Museum of Science and Industry Garibay Group | Design Zone Exhibition Summative Evaluation
Another group (Figure 37), a mother and
her 10-year-old son, had a similar
experience to that of the previous group,
moving to and continuing to use a
qualitative approach. The mother took the
lead, and the child mostly followed along
as told (correcting the parent once when
she made a mistake). There was minimal
conversation, and while the mother
directed the interaction, she did not
engage in any teaching/coaching
behavior. For the first couple of minutes
they did not refer to the numbers on the
sliders or coordinates.
The mom mostly said things like, “OK, try
to go this way. Yeah, over towards this
way,” waving with her hands. When they
started challenge 2, the mom started
pointing out the numbers and used them
to direct their actions. “So you’re going to
go over 5 and up 5 is what you want to
do.” Thus the mother shifted to a
quantitative approach, and with her help
the child began to notice the numbers.
Like the previous group, this group never
figured out that they should move
their sliders at the same time to draw
diagonal lines.
Figure 37. “Drawing in Motion”: Algebraic thinking trajectory (mother and her 10-year-old son). P = parent, C = child
Mo
de
of
En
ga
ge
me
nt
Generalize the relationship and articulate it
Generalize the relationship
Apply numbers to a relationship (quantitative) P P
Notice numbers P C P C P C
Find a relationship (qualitative) P P C C C
Trial and error C
Observe phenomena
Time (min): 0:13 1:55 2:48 3:00 3:07 4:02 4:45
(end)

Algebraic Thinking in Three Exhibits in Depth, cont’d.
66 © May 2013 Oregon Museum of Science and Industry Garibay Group | Design Zone Exhibition Summative Evaluation
In the following group (Figure 38), a
grandfather guided his 11-year-old
grandson. The grandfather read both the
text on the screen and the parent panel as
they worked to figure out the exhibit. The
boy, on the Y slider, asked “What’s
straight up and down?” Then he moved
his slider. “Oh, I’m sideways.” At about
2:00, they had figured out how to use the
sliders for the exhibit challenges they
undertook. They first tried to draw a star,
with the grandfather calling out numbers
they should try to reach (but without
drawing diagonal lines at first). Taking on
challenge 1, the grandfather figured out,
“This is one where you have to work
together.” They worked their way through
the four challenges, using hints on the
screen to draw diagonal lines. Then they
completed a series of free draw
challenges including the heart. At this
point the group shifted back and forth
between applying numbers to the
relationship and generalizing the
relationship several times as they tried the
simpler challenges, even coming up with
their own (this group did not discuss their
slope-drawing activities in abstract terms).
Figure 38. “Drawing in Motion”: Algebraic thinking trajectory (grandfather and his 11-year-old grandson). P = grandparent, C = child
Mo
de
of
En
ga
ge
me
nt
Generalize the relationship and
articulate it
Generalize the relationship P P C P P C P P C P C
Apply numbers to a relationship
(quantitative) P P C C P C C P C C
Notice numbers
Find a relationship (qualitative) C
Trial and error C P
Observe phenomena C
Time (min): 0:57 1:30 2:00 3:08 4:07 4:23 4:48 5:18 5:49 7:32 10:53 13:01 14:52
end
Overall, the dyads using “Drawing in
Motion” were somewhat less successful in
shifting into generalizing and articulating
relationships. We noted two interesting
factors that likely played a role.
First, only one of the four “Drawing in
Motion” adults noticed and read the
parent panel, which introduced the
concept of slope and hinted at how to
draw lines with different slopes. The
parent who did read the panel led his
child in a fairly successful engagement.
The two parents who never figured out

Algebraic Thinking in Three Exhibits in Depth, cont’d.
67 © May 2013 Oregon Museum of Science and Industry Garibay Group | Design Zone Exhibition Summative Evaluation
how to draw diagonal lines did not appear
to notice or read the parent panel during
their engagement. Generally, caregivers
were as engaged with the physical
experience as their children, never getting
a chance to stand back and contemplate
what their children were doing, as parents
did at “Balancing Art.”
Second, visitors were rewarded with the
animation no matter how they connected
the coordinate points. They did not even
have to attempt drawing a diagonal line
for the higher-level challenges to get the
reward. It appears that the exhibit’s
feedback did not help support visitors in
generalizing relationships.

Algebraic Thinking in Three Exhibits in Depth, cont’d.
68 © May 2013 Oregon Museum of Science and Industry Garibay Group | Design Zone Exhibition Summative Evaluation
“Slide-a-Phone”
“Slide-a-Phone” provided an interesting
contrast to the other two exhibits. Some
groups used the same problem-solving
mode for nearly their entire engagement,
and one group never engaged in a
quantitative mode. Only one group
generalized the relationship and only
did so during the final minute of their
engagement. We examine these
groups’ engagements below to try to
understand why.
In a group consisting of a mother and son
(Figure 39), the 12-year-old child started
with a trial and error approach. Then at
0:41, the mother read the parent panel
and subsequently shifted to qualitative
modes of engagement. She read the
panel aloud to her son, “It says, the longer
the tube the lower the pitch, the shorter
the tube the higher the pitch. But you
already know that.” This helped him to
approach the challenge qualitatively.
They looked at the sheet music graph
(challenge card), and the mother said, “So
this is what they have set up, is the length
of the tube, and the…,” pointing at the
axes on the graph. Then she realized,
“You can play a song, that’s what it’s
Figure 39. “Slide-a-Phone”: Algebraic thinking trajectory (mother and her 12-year-old son). P = parent, C = child
Mo
de
of
En
ga
ge
me
nt
Generalize the relationship and articulate it
Generalize the relationship
Apply numbers to a relationship (quantitative)
Notice numbers
Find a relationship (qualitative) P P C P C
Trial and error C C
Observe phenomena
Time (min): 0:17 0:26 0:41 1:12 2:00
end
supposed to be.” So they played one song
together, positioning the tube using
numbers but not saying them out loud.
The boy recognized the song as “Twinkle,
Twinkle, Little Star” before they even
played it, which the mother questioned.
Once they played the song the mother
agreed it was “Twinkle, Twinkle,” and
they were ready to move on, as the
child commented that the exhibit was
“kinda boring.”

Algebraic Thinking in Three Exhibits in Depth, cont’d.
69 © May 2013 Oregon Museum of Science and Industry Garibay Group | Design Zone Exhibition Summative Evaluation
The following “Slide-a-Phone” group
consisted of a father and his 10-year-old
son (Figure 40). The child indicated he
was familiar with the length-pitch
relationship and almost immediately
recognized that it applied here. He slid the
tube far to the right, shortening the tube,
and said, “I’m thinking we should move
this to the lowest pitch we can get. ‘Cause
I’m a fan of low pitches.” So, the boy
started his engagement qualitatively and,
once they figured out the sheet music
graph, quickly shifted to a more
quantitative approach, positioning the
tube based on the lengths marked on the
notes, and for the last song, hitting
the drum once for each note. Because he
positioned notes based on color, the
father continued to use a more qualitative
approach for most of the group’s
engagement. Around 5:00, the father
noticed the parent panel, which described
the sheet music as a graph. He read the
label out loud, asking his son, “You do
graphs in school, right?” This gave both
parent and child a new way of thinking
and talking about what they had been
doing, and they consequently shifted to
generalizing the relationship right at the
end of their engagement. As they finished
up, the dad asked, “So what
Figure 40. “Slide-a-Phone”: Algebraic thinking trajectory (father and his 10-year-old son). P = parent, C = child
do you think?” The son said “I think it’s
pretty clever,” but he did not want a
“Slide-a-Phone” for his room.
Two other groups at “Slide-a-Phone,” on
the other hand, engaged with the exhibit
at the initial mode in which they began
their interactions:
• A father and 10-year-old daughter
began the engagement using a
qualitative approach and used that for
the duration of their engagement. The
parent read the directions label as they
began their interactions.
Mo
de
of
En
ga
ge
me
nt
Generalize the relationship and articulate it
Generalize the relationship P C P C
Apply numbers to a relationship (quantitative) C C C C
Notice numbers P
Find a relationship (qualitative) C P P
Trial and error
Observe phenomena
Time (min): 0:20 1:14 1:40 3:21 3:33 5:40 6:11
end

Algebraic Thinking in Three Exhibits in Depth, cont’d.
70 © May 2013 Oregon Museum of Science and Industry Garibay Group | Design Zone Exhibition Summative Evaluation
The father and daughter played
the sheet music using the colors of
the notes to find the matching
tube position.
• In another group, a mother and her
10-year-old daughter read the parent
panel together as they began their
engagement. The parent matched the
numbers on the notes to the numbers
on the tube, but did not pay much
attention to the meaning of the
numbers. She and the child used
this mode of engagement for the
entire time.
In general, the dyads at “Slide-a-Phone”
used primarily a qualitative approach.
The use of colored notes and tube
positions gave visitors a chance to
discover a qualitative rule, but it was a
sort of dead end; this rule did not inspire
further thinking about either the length-
pitch relationship or the graph-like nature
of the sheet music. The colored notes
did allow younger visitors to play the
music even if they couldn’t read the
numbers, but that came at a cost in terms
of the potential for algebraic thinking by
older children.

Algebraic Thinking among General Visitors To determine the general patterns of engagement with algebraic reasoning in a larger visitor sample, we
coded structured observation data (triangulated with follow-up interviews), using the same modes of
engagement developed for the video case studies. We found that 90% of children in the target age range
at the exhibits (and 88% of children in the entire sample) engaged in algebraic reasoning. Some 42%
engaged quantitatively and another 17% moved to abstract thinking (Figure 41). Notice that nearly a third
(28%) of children in the target age range approached the challenges quantitatively.
71 © May 2013 Oregon Museum of Science and Industry Garibay Group | Design Zone Exhibition Summative Evaluation
2%
7%
31%
14%
28%
10%
7%
4%
7%
35%
15%
24%
6%
8%
0% 10% 20% 30% 40%
Observe Phenomena
Trial and Error
Find a Relationship (Qualitative)
Notice Numbers
Apply Numbers to a Relationship (Quantitative)
Generalize the Relationship
Generalize the Relationship and Articulate It
Figure 41. Algebraic thinking: Modes of engagement
All children in samplen = 148
10- to 14-year-olds onlyn = 94

Parent Role in Algebraic Thinking
72 © May 2013 Oregon Museum of Science and Industry Garibay Group | Design Zone Exhibition Summative Evaluation
Structured observations revealed that
about one-third of parents were
unengaged during their interactions at the
exhibit at which we observed them. (Keep
in mind, of course, that how engaged a
parent can be will vary based on the age
of their children and from exhibit to
exhibit.) Given that the video case studies
indicated that adults played a role in
helping children move toward more
sophisticated modes of engagement, we
also examined how this dynamic played
out in the larger visitor sample. We
disaggregated data for groups with
children in the target age range by
comparing those with “engaged parents”
to those where the parent was not
engaged at the time we observed them.
Although the sample sizes are small, the
data suggest that parental involvement
did make a difference (Figure 42).
When parents were engaged, 50% of
children engaged in algebraic thinking
using a quantitative approach or even
generalizing relationships. When parents
were not engaged, only 31% of children
used those modes of algebraic thinking.
3%
10%
27%
7%
31%
10%
9%
3%
0%
38%
28%
21%
7%
3%
0% 10% 20% 30% 40%
Observe Phenomena
Trial and Error
Find a Relationship (Qualitative)
Notice Numbers
Apply Numbers to a Relationship(Quantitative)
Generalize the Relationship
Generalize the Relationship and Articulate It
Figure 42. Algebraic thinking: Modes of engagement comparison of children with
engaged and non-engaged parents.
10- to 14-year-olds with non-engaged parentsn = 29
10- to 14-year-olds with engaged parentsn = 67

Additional Factors Affecting Algebraic Thinking
73 © May 2013 Oregon Museum of Science and Industry Garibay Group | Design Zone Exhibition Summative Evaluation
Although parental engagement was
clearly important, we also identified
certain aspects of the exhibits themselves
that contributed to how children engaged
in algebraic thinking. First, some exhibits
seemed to support more abstract levels of
thinking than others. “Fast Tracks,” for
instance, provided wonderful
opportunities for visitors to discover a
basic relationship—steeper slope results
in greater ball speed—and allowed
visitors to measure one side of the
relationship: ball speed. The labels,
however, did not support taking this
relationship to more abstract levels by,
for example, graphing the results.
Second, some exhibits provided visitors
with a qualitative “shortcut” that meant
they did not have to use the quantitative
tools provided. For example, three
exhibits allowed visitors to use colors
instead of numbers to meet their
challenges (colored dots on the sheet
music and tubes at “Slide-a-Phone” and
“Whack-a-Phone” and the colored dots on
the ramp at “Roller Coaster Hills”). The
use of colored notes at “Slide-a-Phone,”
for instance, gave visitors a chance to
discover a qualitative rule about the
relationship between color and pitch but
did not get visitors thinking more about
either the length-pitch relationship or the
graph-like nature of the sheet music.
Third, one exhibit, “Drawing in Motion,”
rewarded visitors with an animation even
if they did not attempt to draw a diagonal
line. In those cases, the exhibit’s feedback
did not seem to support visitors’
movement towards generalizing the
relationship (slope).
Fourth, despite the important role that the
parent panel could play in guiding visitors’
algebraic thinking, the placement of that
panel sometimes made it harder for
parents and children to notice them. It
may have been more effective to embed
some of the key algebraic ideas and
phrases more explicitly in the challenge
labels, directions, and on-screen hints.
In a traveling exhibition where config-
urations may shift and panels may be
placed in different locations from those
originally intended, this may become even
more important.

Impacts Summary All four impacts were met. Twelve indicators were met, three were not met (two came close), and one
indicator (1-3) seemed to apply only to some types of exhibits, making it difficult to obtain large enough
sample sizes to measure this indicator (Tables 8–11).
74
Indicators Evidence of Indicator
1. During the visit, 70% of the target
audience will discover various functional
relationships/rules at exhibits as
demonstrated by their use of the
relationship/rule (to make a prediction,
explore relationships, etc.).
90% of youth in the target age range (and 88% of children in the entire sample) engaged in algebraic
thinking. All forms of reasoning beginning at the qualitative level in visitors’ modes of engagement are
based on using relationships/rules.
2. During the visit, 60% of the target
audience will be able to describe the
relationships/rules encountered (words,
images, models, tables, graphics,
equations, etc.).
83% of children in the 10−14 age range described or used a relationship/rule or pattern during their
engagement (often qualitatively).
3. During the visit, 50% of the target
audience will be able to create a rule of
their own that they can use to extend or
create a pattern or other transformations
with objects and/or numbers.
This indicator applies to certain types of exhibits, such as “Build-a-Wall” (extending patterns with blocks)
where visitors have leeway to create in ways that are not possible at many other exhibits. As the exhibit
concept evolved from the early stages to final design this indicator seems to be less important for
assessing Impact 1 and is, perhaps, more of a holdover from earlier stages of the process. While we
noted examples of visitors extending patterns at the blocks exhibits, the sample size for children in the
target age range at those exhibits was too small to provide a reliable quantitative measure.
4. During the visit, the average dwell time
of the target audience at a component
will be 2 minutes.
The mean dwell time of 4:33 exceeded the NSF indicator target of 2 minutes. Children in the 10−14 age
range spent more time at the exhibits than the overall sample (mean of 6:30), which, depending on the
group’s configuration, could also include children younger than the target age range.
5. Demographic use of the exhibit will
mirror general museum demographics.
Demographics vary from museum to museum, meaning that this indicator can only be broadly
generalized. The randomized sample obtained via exit surveys indicated visitors to Design Zone reflected
the general science museum-going population. 84% of visitors surveyed came in family groups. There
was a broad distribution of age ranges: more than half (58%) the families reported having children 6–9
years old in their group and more than a third (37%) reported having children in the target 10–14 age
range in their group. One third (33%) of visitors indicated they had been to the museum before. 81%
identified as Caucasian.
© May 2013 Oregon Museum of Science and Industry Garibay Group | Design Zone Exhibition Summative Evaluation
Table 8. Impact 1: The target audience of youth 10–14 and their families will use algebraic thinking skills

Impacts Summary, cont’d.
75
Indicators Evidence of Indicator
1. During the visit, a majority of the target
audience (51%) will report they found
their experience at the exhibit enjoyable.
95% of groups rated their enjoyment at the exhibit as a 3 or 4 on a 1–4 scale. Those groups with children
10–14 years old provided slightly higher ratings (97%).
2. During the visit, a majority of the target
audience (51% or more) will feel
challenged, but successful.
74% of groups with children 10–14 years old agreed or agreed strongly (ratings of 3 or 4 on a 1–4 scale)
that the exhibits were challenging, but they successfully figured them out. 68% of all groups provided 3 or
4 ratings.
3. During the visit, 60% of the target
audience will use math tools provided.
On average, at individual exhibits, 57% of groups in the total sample used the math tools provided. When
data were disaggregated for groups with children in the 10–14 age range, 51% of children and 33% of
adults used one or more of the math tools.
4. During the visit, 50% of the target
audience will self-report awareness of
the math/algebra involved in at least one
of the activities they did.
51% of groups with children in the target age range agreed (providing 3 or 4 ratings on a 1–4 scale) that
their group had used algebra in the exhibit. A larger percentage of groups with children ages 10–14
recognized doing math; 81% of groups agreed (providing 3 or 4 ratings on a 1–4 scale) that their group
had used math in the exhibit.
© May 2013 Oregon Museum of Science and Industry Garibay Group | Design Zone Exhibition Summative Evaluation
Table 9. Impact 2: The target audience of youth 10–14 and their families will have enjoyable and memorable experiences with algebra/math
Indicators Evidence of Indicator
1. During the visit, 40% of the target
audience will self-report awareness of
doing algebra despite not solving
equations.
43% of groups agreed (providing 3 or 4 ratings on a 1–4 scale) that their group had used algebra in the
exhibit. Agreement ratings were higher (51%) for groups with children in the 10–14 age range. A larger
percentage of visitors recognized doing math; 68% of groups agreed (providing 3 or 4 ratings on a 1–4
scale) that their group had used math in the exhibit.
Table 10. Impact 3: The target audience of youth 10−14 and their families will be aware that algebra is more than solving equations

Impacts Summary, cont’d.
76
Indicators Evidence of Indicator
1. During the visit, 70% of the target
audience will ask questions.
43% of groups asked questions as part of their engagement at an exhibit. Adults tended to ask more
questions than children.
2. During the visit, 50% of the target
audience will answer questions.
43% of groups answered questions as part of their engagement at the exhibit. Children tended to answer
more questions than adults (largely because adults did more of the asking).
3. During the visit, a majority of the target
audience (51% or more) will talk to
others in their group.
78% of children and 70% of adults talked with other members of their group. The conversation was not
always between adults and children; children often engaged in conversations with other children in their
group.
4. During the visit, a majority of the target
audience (51% or more) will work
cooperatively (sharing strategies,
helping each other, etc.).
Cooperative behaviors, such as taking turns and working together, predominated the types of interactions
among groups. 61% of children in target age groups (and 41% of the adults) engaged in cooperative
behaviors.
5. During the visit, 60% of the target
audience will report feeling comfortable
in their overall experience at the exhibit.
81% of groups rated their comfort 3 or 4 on a 1–4 scale. Comfort ratings were higher (94%) for groups
with children in the 10–14 age range.
© May 2013 Oregon Museum of Science and Industry Garibay Group | Design Zone Exhibition Summative Evaluation
Table 11. Impact 4: Groups of target audience members will feel comfortable engaging in algebra activities together

Conclusions and
Recommendations
77 © May 2013 Oregon Museum of Science and Industry Garibay Group | Design Zone Exhibition Summative Evaluation
Conclusions
78
In the larger sample, 40% of parents also
took on the guide/teacher role for at least
part of the engagement. The data suggest
that parents’ teaching can lead their
children towards more sophisticated levels
of algebraic thinking.
Design Zone successfully engaged
visitors in algebraic thinking. Using the
modes of engagement coding developed
to map ways visitors engaged in algebraic
thinking, most (90%) successfully
engaged at least through qualitative
approaches, with a healthy percentage
(42%) of those in the target range
engaging quantitatively and another 17%
beginning to generalize relationships.
While few explicitly articulated these
relationships, the exhibition nonetheless
successfully induced children to engage in
thinking about key relationships—what
they had to change to meet a challenge
and the way they had to change it.
Visitors recognized connections to both
their everyday worlds and to school-based
learning. Interestingly, the connections to
the everyday world were often physical
analogies to the exhibits, whereas the
connections to schools were more often
about math and algebra.
It’s clear that Design Zone provided a
challenging, yet successful, comfortable,
and enjoyable experience for a cross-
section of visitors (not just those included
in the target audience). Most of them
remembered doing math in the exhibit,
and about half remembered encountering
algebra—but this recognition did not
diminish their enjoyment of the
experience. Enjoyment ratings were
high (95%).
Visitors spent significant time at Design
Zone and actively engaged with the
exhibits and with others in their group.
Children took an active role, engaging
directly with exhibits, and parents often
took on the role of guide/teacher. Groups
enthusiastically tried out challenges, with
the majority (89%) attempting at least one
challenge. We observed a range of
behaviors, but cooperative ones
predominated with those in the group
working together to try to successfully
complete a challenge.
Video data illustrated the rich interactions
that can take place when parents and
children engage together. The range of
teaching and leadership demonstrated by
these parents was particularly impressive.
© May 2013 Oregon Museum of Science and Industry Garibay Group | Design Zone Exhibition Summative Evaluation
Design Zone, overall, provided successful
and enjoyable experiences for visitors and
met the goals for the project. Perhaps the
major challenge remaining for the project
and the informal math education field is to
find more effective ways to guide visitors
toward more quantitative and, ultimately,
more abstract ways of engaging in
algebraic thinking on the exhibition floor.

Recommendations
79 © May 2013 Oregon Museum of Science and Industry Garibay Group | Design Zone Exhibition Summative Evaluation
• Recognize the complexity even of
qualitative relationships, and make
sure the ones that most visitors
discover and use are going to be
functional relationships that can be
quantified. That may mean avoiding
situations like the colored notes at
“Slide-a-Phone,” which let visitors
complete the challenge by simple
matching without thinking much
about the relationship between length
and pitch.
• Provide visitors with the tools to
measure both sides of a simple
relationship between variables. “Fast
Tracks,” for instance, provided
wonderful opportunities for visitors to
discover a basic relationship—steeper
slope results in greater ball speed—but
allowed visitors to measure only one
side of the relationship (ball speed). Is
there some way to allow visitors to
measure and graph ramp steepness as
well as ball speed?
• Continue to refine the mathematical
tools that show relationships to make
them even more integral to visitors’
success and to make sure visitors are
rewarded when they use them. For
instance, the sticky pivot at “Balancing
Art” sometimes threw respondents off
course as they tried to balance the
equations shown on the labels; visitors
got it right, but the scale still looked off
balance. In another example, “Drawing
in Motion” rewarded visitors even when
they did not try to draw a diagonal line.
• Although parent panels effectively
guided many visitors toward higher
levels of algebraic thinking, the
placement of these panels sometimes
made them harder to notice them.
Ideally the panels should be placed
where parents standing a bit behind
their children can notice and read them
without moving (which did not happen
with some of the recent installations of
“Balancing Art”). When parents are
going to deeply engage with the exhibit
challenges alongside their children, it
may be more effective to embed key
algebraic ideas and phrases more
explicitly in the challenge labels,
directions, and on-screen hints.
References
80 © May 2013 Oregon Museum of Science and Industry Garibay Group | Design Zone Exhibition Summative Evaluation

References
81
Babbie, E. (1998). The practice of social research. Albany, NY: Wadsworth Publishing
Company.
Barron, B. and Engle, R. (2007). Analyzing data derived from video records. In S.J.
Derry (Ed.), Guidelines for video research in education (pp. 24-33). Chicago, IL:
Data Research and Development Center, NORC at the University of Chicago.
Borun, M., Dritsas, J., Johnson, J. I., Peter, N. E., Wagner, K. F., Fadigan, K., Jangaard,
A., Stroup, E., & Wenger, A. (1998). Family learning in museums: The PISEC
perspective. Philadelphia, PA: Philadelphia/Camden Informal Science Education
Collaborative (PISEC), The Franklin Institute.
Greene, J. C. & Caracelli, V. J. (2003). Making paradigmatic sense of mixed methods
practice. In A.Tashakkori & C.Teddue (Eds.), Handbook of mixed methods in social
and behavioral research (pp. 91-110). Thousand Oaks: Sage Publications.
Humphrey, T., and Gutwill, J. P. (2005). Fostering active prolonged engagement: the art
of creating APE exhibits. San Francisco,CA: Exploratorium.
Miles, M. B. & Huberman, A. M. (1994). Qualitative data analysis (2nd ed.). London:
Sage Publications.
National Council of Teachers of Mathematics. (2000). Principles and standards for
school mathematics. Reston, VA: NCTM.
Strauss, A. & Corbin, J. (1990). Basics of qualitative research. Newbury Park, CA: Sage
Publications.
© May 2013 Oregon Museum of Science and Industry Garibay Group | Design Zone Exhibition Summative Evaluation

Appendices
82 © May 2013 Oregon Museum of Science and Industry Garibay Group | Design Zone Exhibition Summative Evaluation

Appendix A: Exit Survey Respondent Profile
83 © May 2013 Oregon Museum of Science and Industry Garibay Group | Design Zone Exhibition Summative Evaluation
Pacific
Science
Center
Franklin
Institute
Male 47% 49%
Female 53% 51%
Respondents by Gender
Pacific
Science
Center
Franklin
Institute
Visited museum
before 75% 62%
Were museum
members 58% 37%
Visited with family 89% 82%
Respondents’ Prior Visitation
Pacific
Science
Center
Franklin
Institute
Groups with children 85% 76%
5 or younger 38% 47%
6 to 9 years 62% 55%
10 to 14 years 40% 35%
15 to 17 years 12% 5%
18 or older 6% 3%
Respondents with Children in Group
Pacific
Science
Center
Franklin
Institute
African-American 3% 9%
Caucasian 80% 81%
Asian/Pacific Islander 17% 8%
Hispanic/Latino 3% 5%
Native American 1% 0%
Other 11% 5%
Respondents by Race/Ethnicity (self-identified)

Appendix B: Video Study Respondents
84 © May 2013 Oregon Museum of Science and Industry Garibay Group | Design Zone Exhibition Summative Evaluation
Exhibit
Adult
Gender
Adult Age
(years)
Adult Race/
Ethnicity Adult Highest Education
Child
Gender
Child
Age
(years)
Child
Grade
Child Race/
Ethnicity
(as identified by
adult)
Balancing Art
Female Declined Caucasian Some college education Female 10 4th Caucasian
Female 49 Caucasian College graduate Female 12 5th Caucasian
Female Declined Caucasian College graduate Male 11 5th Declined
Female 47 Caucasian Postgraduate degree Male 10 4th Caucasian
Drawing in
Motion
Female 33 African-American College graduate Male 10 4th African-American/
Hispanic-Latino
Male 54 Caucasian Postgraduate degree Female 12 7th Caucasian
Female 19 Hispanic/ Latino Some college education Female 10 5th Hispanic/Latino
Male 60 Caucasian Some college education Male 11 5th Caucasian
Slide-a-Phone
Male 34 Caucasian College graduate Female 10 4th Caucasian
Female 40 Hispanic/ Latino College graduate Female 11 5th Hispanic/Latino
Female 36 Caucasian Some college education Male 12 7th Caucasian
Male 51 Caucasian Some postgraduate
education Male 10 4th Caucasian

Appendix C: Observations—Child Respondent Profile
85 © May 2013 Oregon Museum of Science and Industry Garibay Group | Design Zone Exhibition Summative Evaluation
OMSI
Pacific
Science
Center
Franklin
Institute
5 to 9 years 50% 33% 25%
10 to 14 years 47% 59% 71%
15 to 18 years 3% 7% 4%
OMSI
Pacific
Science
Center
Franklin
Institute
Male 54% 52% 58%
Female 46% 48% 42%
Gender of Designated Child
Age of Designated Child