Design & Use of Nursery Systems with an emphasis on...
45
Design & Use of Nursery Systems with an emphasis on biofloc management Tzachi M. Samocha Texas A&M AgriLife Research Mariculture Lab at Flour Bluff, Corpus Christi, Texas
Transcript of Design & Use of Nursery Systems with an emphasis on...

Design & Use of Nursery Systems with an emphasis on biofloc
management
Tzachi M. Samocha
Texas A&M AgriLife Research Mariculture Lab at Flour Bluff, Corpus Christi, Texas

Credit
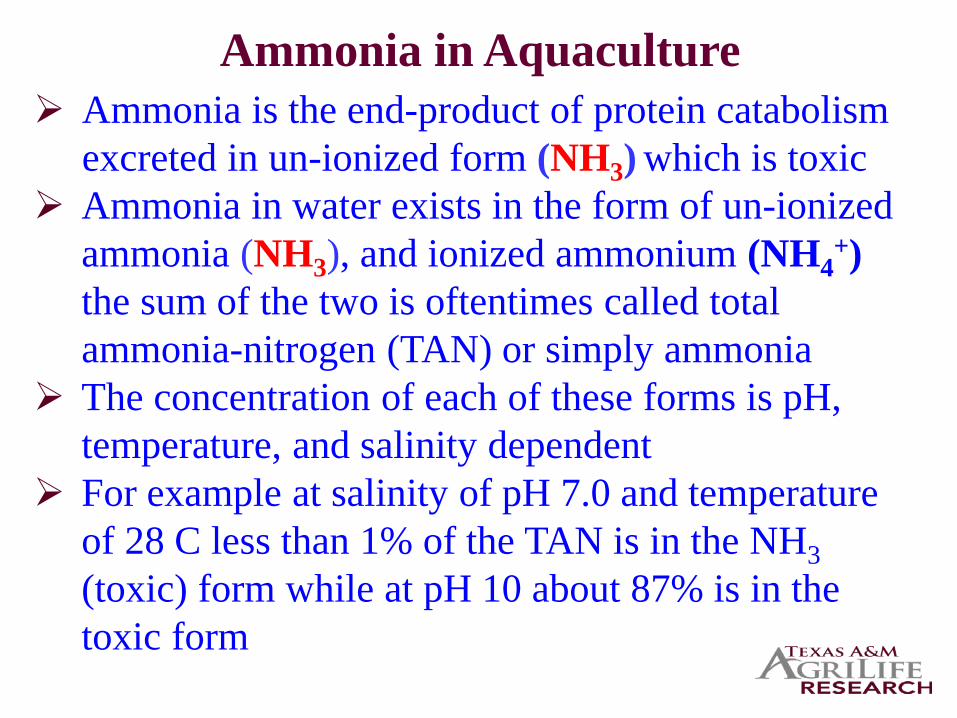
Ammonia in Aquaculture Ammonia is the end-product of protein catabolism
excreted in un-ionized form (NH3) which is toxic Ammonia in water exists in the form of un-ionized
ammonia (NH3), and ionized ammonium (NH4+)
the sum of the two is oftentimes called total ammonia-nitrogen (TAN) or simply ammonia
The concentration of each of these forms is pH, temperature, and salinity dependent
For example at salinity of pH 7.0 and temperature of 28 C less than 1% of the TAN is in the NH3 (toxic) form while at pH 10 about 87% is in the toxic form

Percent total ammonia present in the toxic, un-ionized ammonia form in 0 ppt salinity solution (USEPA, 1987)
Temperature pH (C) 6.0 6.5 7.0 7.5 8.0 8.5 9.0 9.5 10.0 5 0.013 0.040 0.12 0.39 1.2 3.8 11 28 56 10 0.019 0.059 0.19 0.59 1.8 5.6 16 37 65 15 0.027 0.087 0.27 0.86 2.7 8.0 21 46 73 20 0.040 0.13 0.40 1.2 3.8 11 28 56 80 25 0.057 0.18 0.57 1.8 5.4 15 36 64 85 30 0.080 0.25 0.80 2.5 7.5 20 45 72 89
use aquaCalc software to calculate changes in toxicity under other conditions

Bower & Bidwell, 1978. Ionization of ammonia in seawater: effects of temperature, pH, and salinity. Fish. Res. Board Can. 35(7):1012-1016. (DVD)
Use aquaCalc software to calculate changes in toxicity under other conditions

Ammonia Removal in Aquaculture Unlike nitrifying bacteria that produce nitrite
and nitrate, heterotrophic bacteria incorporate ammonia nitrogen directly into microbial biomass
When using 35% CP feed, only 1/3 of the dissolved organic carbon required by the heterotrophic bacteria is available from the feed
This means that additional organic C must be added for the heterotrophic bacteria to use all available ammonia generated by the shrimp
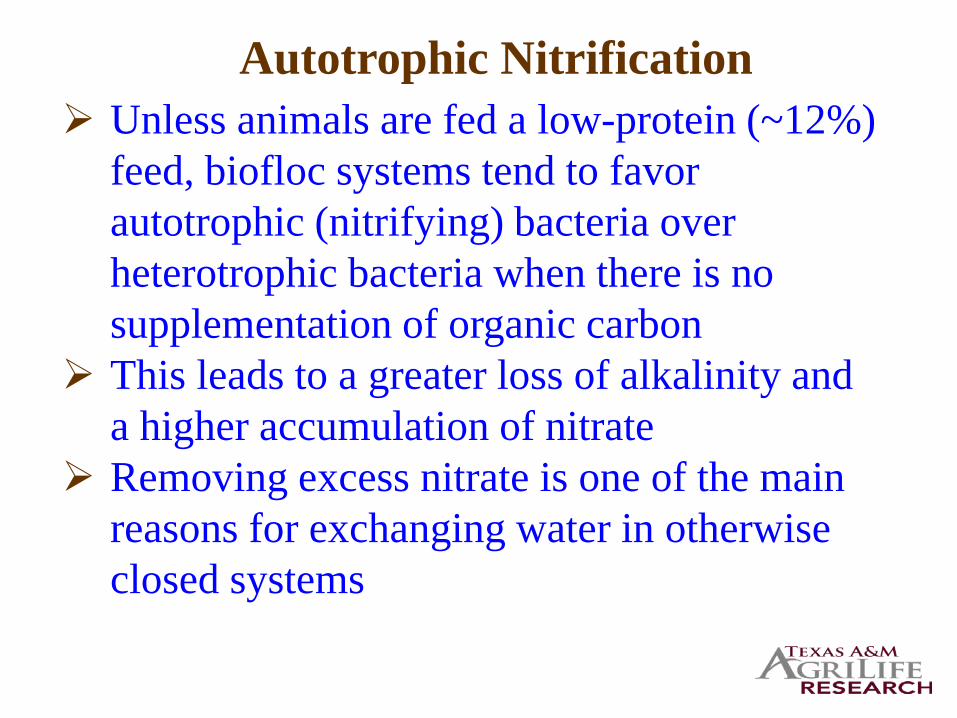
Unless animals are fed a low-protein (~12%) feed, biofloc systems tend to favor autotrophic (nitrifying) bacteria over heterotrophic bacteria when there is no supplementation of organic carbon
This leads to a greater loss of alkalinity and a higher accumulation of nitrate
Removing excess nitrate is one of the main reasons for exchanging water in otherwise closed systems
Autotrophic Nitrification

Heterotrophic Systems Heterotrophic bacterial growth is affected by
the system’s C/N ratio, temperature, DO, pH, and salinity
Increase in microbial biomass production is 40 times greater than the biomass generated from the nitrification process, and consumption of O2 is also much higher
CO2 production of heterotrophic floc also is higher than that of autotrophic nitrifiers

Why Operate a Mixotrophic System? Although adding alkalinity is required for the
nitrifying bacteria to work properly, some of it can be recovered if the system has a denitrification loop
If operated as a fully heterotrophic system, a greater effort and additional resources are required to control bacterial biomass, in particular, the system requires regular supplementation of dissolved organic carbon and much more oxygenation
A mixotrophic system, however, balances between the two extreme bacterial regimes to incorporate some the advantages of both

Ammonia Production by Shrimp 1. Use of software such as AquaCalc
2. Use of a generic formula 100 g (F) x 35% CP = 35 g (P) x 6.25 (CF) = 5.6 g (N) x 50% = 2.8 g TAN
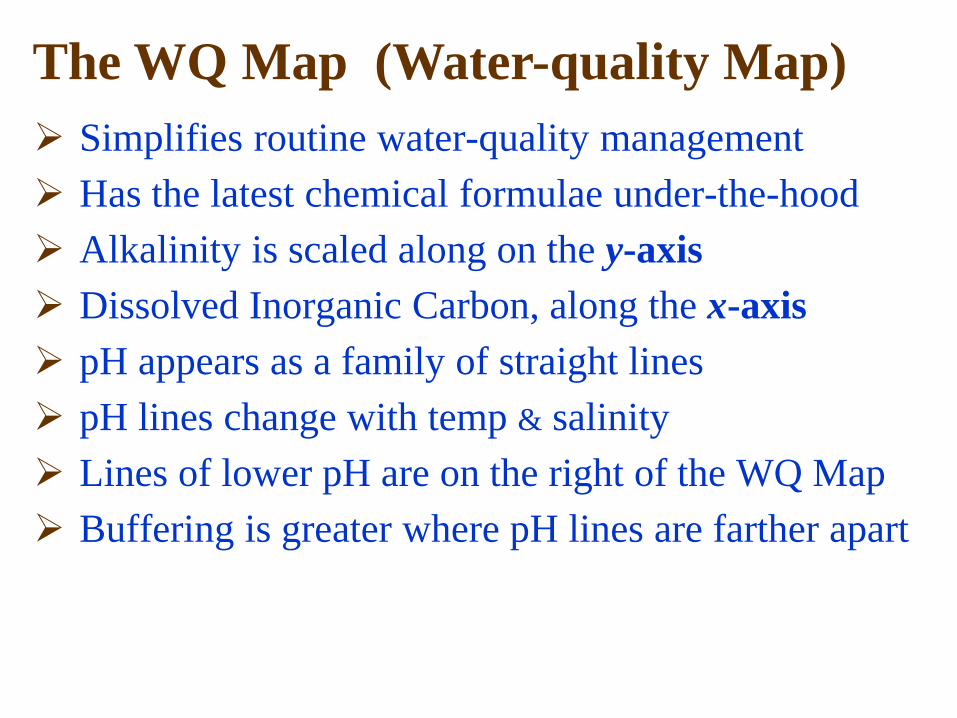
The WQ Map (Water-quality Map) Simplifies routine water-quality management Has the latest chemical formulae under-the-hood Alkalinity is scaled along on the y-axis Dissolved Inorganic Carbon, along the x-axis pH appears as a family of straight lines pH lines change with temp & salinity Lines of lower pH are on the right of the WQ Map Buffering is greater where pH lines are farther apart


WQ Map - The Green & Danger Zones The Green Zone defines a preferred pH - [Alk] regime
(illustrated: pH 7.4-8.1 & [Alk] 75-175 ppm CaCO3) CO2 Danger Zone
(illustrated: [CO2] ≥ 20 mg/L) NH3 Danger Zone, as a f (Temp., Sal., pH)
(illustrated: [NH3] ≥ 0.0125 mg/L & TAN 0.2 mg/L) So, the “game” is to keep your system... ...in the Green Zone
...out of the Danger Zones


Enter: temp: 32 C; salinity: 34 ppt; volume: 40 m3
Enter Initial State: pH 6.7, [Alk] 1.4 meq/L (70 ppm CaCO3) Enter Target State: pH 7.4, [Alk] 2.3 meq/L (115 ppm CaCO3) Choose: NaHCO3 (Na bicarbonate) & Na2CO3 (Na carbonate) Yellow Zone -- where you can 'travel' with NaHCO3 & Na2CO3
Press: “Calculate” to get... * adjustment path -- how & how fast pH & [Alk] change * how much of each reagent to add
Ans: 1.49 kg NaHCO3
0.97 kg Na2CO3
WQ Map - Adjustment Example #1


Enter: temp: 32 C; salinity: 34 ppt; volume: 40 m3
Enter Initial State: pH 6.7, [Alk] 1.4 meq/L (70 ppm CaCO3) Enter Target State: pH 7.4, [Alk] 2.3 meq/L (115 ppm CaCO3) Choose: NaHCO3 (Na bicarbonate) & NaOH (Na hyroxide) Yellow Zone -- where you can 'travel' with NaHCO3 & NaOH Press: “Calculate” to get...
* adjustment path -- how & how fast pH & [Alk] change * how much of each reagent to add
Ans: 2.26 kg NaHCO3
0.36 kg NaOH
WQ Map - Adjustment Example #2


Alkalinity adjustments generally change pH, [CO2], Ω (Ca mineral saturation), [NH3], & metal toxicity
The WQ Map can predict changes in water quality resulting from feed additions, nitrification, photosynthesis, & water exchange
It works for any aquatic system: biofloc systems, flow-through ponds, algae tanks, home aquaria, aquaponic systems, swimming pools
The WQ Map has been used to adjust water-quality quickly & accurately in the A&M biofloc system
WQ Map - Summary

National Sea Grant College Program for funding
Florida Organic Aquaculture for the cooperation and the commercialization
Texas A&M AgriLife Research for providing the support for the last 26 years
Current and former researchers, students and staff members of the Texas A&M AgriLife Research Mariculture Lab for the hard work and dedication
Acknowledgements

Design and Management of Nursery Systems for Litopenaeus
vannamei Postlarvae
Tzachi M. Samocha, Leandro F. Castro and David Prangnell
Texas A&M AgriLife Research Mariculture Lab at Flour Bluff, Corpus Christi, Texas

PRE-PRODUCTION PROCEDURES: Water source & conditioning Water pumped from the power plant intake canal Stored in reservoir (Pond) Salinity adjustment (30 ppt) Water pumped into raceways Water treated with chlorine to reach 5-10 ppm 30
min after application
Operations

PRE-PRODUCTION PROCEDURES: Organic Carbon
Probiotic + Molasses added before stocking with shrimp
Jumpstart nitrifying bacteria (FritzZyme 9, KI-Nitrifier™), floc inoculation
Treatment maintained post-stocking to keep the biofloc “healthy” (e.g., prevent algal bloom and/or heterotrophic domination)
Operations

PRE-PRODUCTION PROCEDURES: PL Transportation, Receiving and Acclimation
Ice Bag
Operations
Bags in Styrofoam boxes
Acclimation tanks Adjust salinity &
temperature Some feeding to
minimize cannibalism Shrimp stocked Assessing mortality

NURSERY Feeding and feed management EZ Artemia + Dry feed (<400 µm) - 1st week (5 times/day) Crumble (<400 µm to 1,200 µm) - 1st 21 days Use of intermittent & overall FCR as a tools Calculations based on growth, FCR & survival
Operations
Growth monitoring Select the right mesh & net size to sample 50 animals, twice/wk (Individual & Group weight,
check morphological structure, behavior, food in digestive system & fouling)

NURSERY Daily & Weekly Routines Water quality pH, DO, salinity, temperature - Daily Alkalinity, SS, TSS, (VSS), ammonia, nitrite,
(nitrate), (phosphate) - At least weekly (not critical) Visual observation of shrimp in all RWs - Daily Swimming activity, food in digestive system,
disease, fouling, morphological structure Dissecting scope and/or compound microscope
observations – Twice a week Feed management & feeding - Daily
Operations
NURSERY Carbon supplementation factors to consider Dissolved oxygen levels in the tank Ability to increase DO in the tank Concentrations of TAN and Nitrite in the water Nitrite is low and TAN starts to increase (3-5
mg/L) Both Nitrite and TAN start to increase (3-5
mg/L) To convert 1 g of TAN into heterotrophic bacteria biomass you need 6 g of organic carbon
Operations

NURSERY Example use of organic carbon from molasses: 40 m3 RW with 4 mg/L TAN in the water
1,000 ml molasses = 1,300 g = 312 g C (1,300 x 24%)
TAN in the tank: 4 x 40,000 = 160 g
C needed: 160 x 6 = 960 g
Molasses needed: 960 / 312 = 3.08 L
1,000 g white sugar = 430 g C
White sugar needed: 960 / 430 = 2.23 kg
Operations

ACCUMULATION OF BIOFLOC ON THE SURFACE
Mixing the floating biofloc Use of water jet

NURSERY Supplemental feed Start with wet & dry feed Increase feed particle size over
time (400-600, 600-800, 850-1,200 µm )
EZ Artemia – Wet feed
Crude Protein > 51.0 %
Crude Fat > 17.0 %
Crude Fiber < 3.7 %
Moisture < 0.0 %
< 400 µm – Dry feed
Crude Protein > 50.0 %
Crude Fat > 15.0 % Crude Fiber < 1.0 %
Moisture < 10.0 % Ash < 7.5 %
EZ Artemia
Operations
< 400 µm

NURSERY Shrimp sampling, health & diseases Shrimp are collected twice a week from all RWs Shrimp are collected from 3 or more different
locations within each RW Water chilled with ice is used to slow-down
swimming activities Group and individual weight Inspect morphological aspects using microscopy Shrimp behavior & general appearance observed
with emphasis on fouling & gut fullness
Operations

Feed and feed management for 40 m3 Nursery RWs stocked at 650 PL/m3 - Texas A&M AgriLife Research
ESTTEMP. DAY STAGE
WEIGHTg
GAIN %
GAINg
SURVIVAL%
NUMBERANIMALS
BIOMASS kg
FCRDAILY
FCRCUMULATIVE
FEEDFREQUENCY
TOTAL FEED Grams
FEED/DAYGrams Dry Wt. EZ Art (%)
Total/Day Wet wt Dry Diet+ (%)
Grams Total/Day Dry wt TYPE TOTAL APPX
24.5 1 PL 12 0.0015 26 100.0 286,000 0.43 0.8 24X 89 89.2 50% 165.2 50% 44.6 EZ ART,RW <400, Feed 3X2 PL 13 0.0019 26 0.0004 97.0 277,420 0.52 0.8 0.94 24X 194 104.9 50% 194.2 50% 52.4 EZ ART,RW <400, Feed 3X3 PL 14 0.0024 25 0.0005 96.7 276,627 0.65 0.8 0.86 24X 325 130.7 50% 242.0 75% 98.0 EZ ART,RW <400, Feed 3X4 PL 15 0.0030 25 0.0006 96.4 275,837 0.81 0.8 0.84 24X 481 156.4 25% 144.8 100% 156.4 EZ ART,RW <400, 5 PL 16 0.0037 24 0.0007 96.2 275,049 1.01 0.8 0.83 24X 675 193.4 25% 179.1 100% 193.4 EZ ART,RW <400, 6 PL 17 0.0045 24 0.0009 95.9 274,263 1.25 0.8 0.83 24X 914 239.1 25% 221.4 100% 239.1 EZ ART,RW <400, 7 PL 18 0.0056 24 0.0011 95.6 273,479 1.54 0.8 0.82 24X 1,209 295.6 10% 109.5 100% 295.6 EZ ART,RW <400,
25.5 8 PY 19 0.0070 24 0.0014 95.3 272,698 1.90 0.8 0.82 24X 1,575 365.6 10% 135.4 100% 365.6 EZ ART,RW <400, RW 400-6009 PL 20 0.0087 24 0.0017 95.1 271,919 2.35 0.8 0.82 24X 2,027 452.0 0% 0.0 100% 452.0 EZ ART,RW <400, 1897.2
10 PL 21 0.0107 24 0.0021 94.8 271,142 2.91 0.8 0.82 24X 2,586 558.9 0% 0.0 100% 558.9 RW 400-600, 11 PL 22 0.0133 24 0.0026 94.5 270,367 3.60 0.8 0.82 24X 3,277 691.0 0% 0.0 100% 691.0 RW 400-600, 12 PL 23 0.0165 24 0.0032 94.3 269,595 4.45 0.8 0.81 24X 4,131 854.4 Total 1391.6 100% 854.4 RW 400-600, 13 PL 24 0.0205 24 0.0040 94.0 268,825 5.50 0.8 0.81 24X 5,188 1,056.4 EZ ART 100% 1,056.4 RW 400-600, 14 PL 25 0.0254 24 0.0049 93.7 268,057 6.80 0.8 0.81 24X 6,548 1,360.7 100% 1,360.7 RW 400-600,
27.4 15 PL 26 0.0317 25 0.0063 93.5 267,291 8.48 0.8 0.81 24X 8,244 1,696.0 100% 1,696.0 RW 400-600, 16 PL 27 0.0397 25 0.0079 93.2 266,527 10.57 0.8 0.81 24X 10,358 2,113.9 100% 2,113.9 RW 600-85017 PL 28 0.0496 25 0.0099 92.9 265,765 13.17 0.8 0.81 24X 12,993 2,634.9 100% 2,634.9 RW 600-85018 PL 29 0.0620 25 0.0124 92.7 265,006 16.42 0.8 0.81 24X 16,277 3,284.2 100% 3,284.2 RW 600-85019 PL 30 0.0775 25 0.0155 92.4 264,249 20.47 0.8 0.81 24X 20,371 4,093.5 100% 4,093.5 RW 600-85020 PL 31 0.0968 25 0.0194 92.1 263,494 25.51 0.8 0.81 24X 25,473 5,102.2 100% 5,102.2 RW 600-85021 PL 32 0.1210 25 0.0242 91.9 262,741 31.80 0.8 0.81 24X 31,832 6,359.6 9,516.4 MP 1mm
28.2 22 PL 33 0.1513 25 0.0303 91.6 261,990 39.63 0.8 0.81 24X 39,759 7,926.7 10,295.6 MP 1mm RW 600-85023 PL 34 0.1891 25 0.0378 91.3 261,242 49.40 0.8 0.81 24X 49,639 9,880.1 11,071.6 MP 1mm 54,329.7 24 PL 35 0.2364 25 0.0473 91.1 260,495 61.57 0.8 0.81 24X 61,954 12,314.8 MP 1mm25 PL 36 0.2955 25 0.0591 90.8 259,751 76.75 0.8 0.81 24X 77,918 15,963.6 MP 1mm26 PL 37 0.3723 26 0.0768 90.6 259,009 96.43 0.8 0.81 24X 97,974 20,056.6 MP 1mm27 PL 38 0.4691 26 0.0968 90.3 258,269 121.15 0.8 0.81 24X 123,173 25,199.1 MP 1mm28 PL 39 0.5910 26 0.1220 90.0 257,531 152.21 0.8 0.81 24X 154,834 31,660.2 MP 1.5mm
29 29 PL 40 0.7447 26 0.1537 89.8 256,795 191.24 0.8 0.81 24X 194,612 39,777.9 MP 1.5mm30 PL 41 0.9383 26 0.1936 89.5 256,062 240.27 0.8 0.81 24X 244,588 49,976.9 MP 1.5mm31 PL 42 1.1823 26 0.2440 89.3 255,330 301.88 0.8 0.81 24X 307,379 62,791.0 MP 1.5mm32 PL 43 1.4897 26 0.3074 89.0 254,600 379.28 0.8 0.81 24X 386,270 78,890.6 MP 2mm33 PL 44 1.8770 26 0.3873 88.8 253,873 476.53 0.8 0.81 24X 485,388 99,118.1 MP 2mm34 PL 45 2.3651 26 0.4880 88.5 253,148 598.71 0.8 0.81 24X 609,920 124,532.0 MP 2mm MP 1mm35 PL 46 2.98 26 0.6149 88.3 252,424 752.22 0.8 0.81 24X 637,000 27,080.0 MP 2mm 587,360.8

NURSERY WQ sampling -- and indicators to watch for Ammonia and Nitrite concentration Solids accumulation - Optimum: TSS (250-350
mg/L) & SS (10-14 mL/L) Turn on settling tanks, FF or cyclone filters & closely
monitor solids concentrations until under control TSS vs. SS readings Maintain O2 >4 mg/L (adjust air flow when using
ALP air diffusers) Use pure O2, when needed Low DO may indicate overfeeding, high level of
solids or another water quality problem
Operations

NURSERY
Alkalinity, pH control Target pH: 7.4-7.6; Alkalinity: 140-160
mg/L Alkalinity - Bicarbonate pH – NaOH Alkalinity/pH – Na2CO3 (Soda Ash) All of these chemicals are added
carefully to avoid drastic changes in pH Dripping is the method of choice
Operations

BIOFLOC & SOLIDS CONTROL (FOAM FRACTIONATOR):
NURSERY Handling WQ emergencies Lost power supply - back-up generator pH decreasing - add soda ash or NaOH Alkalinity decreasing - add soda ash or
bicarbonate TSS or SS increasing - turn on FF, cyclones or ST Ammonia increasing - add organic C such as
molasses Nitrite increasing - add nitrifying bacteria or
decrease feed quantity and/or suspend feeding
Operations

NURSERY Handling WQ emergencies (40 m3 RWs) Shrimp swimming close to the surface - check DO Shrimp with white tails – check DO and increase
its level if needed To increase DO the following actions: Increase air flow to airlift pumps & air diffusers Supply oxygen through the Venturi Reduce solids (FF, ST, Cyclone), suspend /
decrease rations
Operations

Operations - Nursery Summary of results 1998-2013 Shift from HDPE to EPDM liners (be aware of toxicity issues) Exposure to high NO2-N levels (up to 26 mg/L) for 2 wks had
no adverse effect on shrimp performance in the nursery or GO Significantly higher nitrate levels in high-protein feed Molasses - enhance bacterial floc development, effective in
controlling ammonia but not nitrite DO monitoring system - an excellent tool to manage DO & feed
inputs, reduce shrimp stress & WQ deterioration L. vannamei can tolerate high levels of ammonia (≤ 26 mg/L) &
nitrite (≤ 35 mg/L) with good growth, survival & excellent health at 30 ppt salinity in the presence of biofloc & under no water exchange

Operations - Nursery Summary of results 1998-2013 Nursery of PL at high densities in biofloc
dominated water didn’t result in reduced growth in the GO phase
Using matured water for inoculation is beneficial in avoiding increase of ammonia & nitrite when using virgin seawater
Juveniles from these systems can be transferred into GO ponds with minimal losses
Applications of organic carbon should be started if TAN increases above 3 mg/L

GROW-OUT Stocking/Transfer:
Dip net Weighing (biomass!) Wet transfer (bio.!) Water transfer (bio.!) Use of oxygen
Fish pump Shrimp counter* Weighing Wet transfer
Operations
Drain harvest Weighing Wet transfer Water transfer

Use of fish pump to transfer juvenile shrimp into a secondary greenhouse-enclosed nursery located 800 m away from the primary nursery – Mexico (700K, 70 mg in 30 min)
Nursery Systems – Juvenile Transfer

L. vannamei 2000 (1.1%/d exchange)
NURSERY Summary of results 1998-2013
L. vannamei Intensive Nursery Inland Woods Bros., AZ
PL/m2 PL/m3 Wt0 (mg)
Days Wtf (g)
Yield (kg) Sur. (%) FCR
/m2 /m3 19,200 12,700 2.5 34 0.1 2.34 1.54 100 0.7 20,400 13,500 2.5 35 0.09 2.1 1.34 100 0.7
Four RWs: 98 m2; 148 m3; Salinity: 1.8-2.6 ppt

Water PL Wt0 Days Wtf Yield Sur. Water
FCR Treat. /m3 (mg) (g) kg/m3 (%) Ex (%/d)
Bead1 RSF2
3,780 6,540
0.6 0.6
74 74
0.65 0.85
2.42 5.26
96.3 100.1
1.35 0.47
1.70 1.09
FF3 5,010 0.6 74 0.69 3.18 97.8 2.06 1.50
1Bead Filter-BF, 2Pressurized Rapid Sand Filter, 3Foam Fractionator-FF
NURSERY Summary of results 1998-2013
L. vannamei 2002
Treatment Wto (mg) Wtf (g) Yield (kg/m3) Survival (%) FCR FF-2 1 0.6 1.91 a 7.64 a 100 a 0.97 a FF-3 1 0.6 2.00 a 6.89 a 92.4 a 1.08 a WE-1 2 0.6 1.73 b 3.92 b 55.9 1.64 a WE-4 2 0.6 1.43 b 4.74 b 81.8 a 1.36 a 1 Raceway operated with FF & 3.35% daily water exchange 2 Raceway operated with no FF using 9.37% daily water exchange
L. vannamei 2003

Variables 30% CP 40% CP
Final weight (g) 0.94 ± 0.00 1.03 ± 0.02
Survival (%) 82.29 ±11.26 84.13 ±6.07
FCR 0.91 ± 0.05 0.82 ± 0.05
Yield (kg/m³) 3.70 ± 0.49 4.18 ± 0.23
NURSERY Summary of results 1998-2013
L. vannamei 2009
Treatment Wt. (g)
Yield (kg/m3)
Survival (%) FCR Water Use
(L/kg shrimp)
Disease R 0.90 a 3.36 a 98.7 a 1.03 a 372 a Growth L 0.74 b 3.02 a 100 a 1.17 a 385 a
L. vannamei 2011

National Sea Grant College Program for funding Florida Organic Aquaculture for the cooperation
and the commercialization Texas A&M AgriLife Research for providing the
support for the last 26 years Current and former researchers, students and staff
members of the Texas A&M AgriLife Research Mariculture Lab for the hard work and dedication
Additional information is available at the:
www.texasaquaculture.org
Acknowledgements