DESIGN, SYNTHESIS AND BIOLOGICAL EVALUATION OF CELL ...
256
The Pennsylvania State University The Graduate School Department of Chemistry DESIGN, SYNTHESIS AND BIOLOGICAL EVALUATION OF CELL- PERMEABLE SMALL MOLECULE PROBES A Thesis in Chemistry by Laurie Frances Mottram 2007 Laurie Frances Mottram Submitted in Partial Fulfillment of the Requirements for the Degree of Doctor of Philosophy December 2007
Transcript of DESIGN, SYNTHESIS AND BIOLOGICAL EVALUATION OF CELL ...

The Pennsylvania State University
The Graduate School
Department of Chemistry
DESIGN, SYNTHESIS AND BIOLOGICAL EVALUATION OF CELL-
PERMEABLE SMALL MOLECULE PROBES
A Thesis in
Chemistry
by
Laurie Frances Mottram
2007 Laurie Frances Mottram
Submitted in Partial Fulfillment
of the Requirements
for the Degree of
Doctor of Philosophy
December 2007

ii
The thesis of Laurie Frances Mottram was reviewed and approved* by the following:
Blake R. Peterson
Associate Professor of Chemistry
Thesis Advisor
Chair of Committee
Philip C. Bevilacqua
Professor of Chemistry
Ken Feldman
Professor of Chemistry
Avery August
Associate Professor of Immunology
Auysman Sen
Head of the Department of Chemistry
*Signatures are on file in the Graduate School

iii
ABSTRACT
Molecular probes derived from fluorescein are widely used as tools for studies of
cellular biology. This classic green fluorophore is particularly suited for cellular analysis
by confocal laser scanning microscopy and flow cytometry due to its excitation
maximum at 490 nm, closely matching the 488 nm spectral line of the argon-ion laser.
Under physiological conditions (pH = 7.4), fluorescein predominantly exists as a highly
hydrophilic dianion exhibiting excellent quantum yield. However, protonation of
fluorescein to the monoanion is observed with the relatively high pKa of 6.5, rendering
this dye much less fluorescent in acidic solutions. Additionally, fluorescein is relatively
susceptible to photobleaching. Oregon Green, a more acidic 2’, 7’-difluoro derivative of
fluorescein, was developed as a less pH-sensitive fluorophore. The appended fluorine
atoms reduce the pKa of this dye to 4.8, substantially improving both photostability and
fluorescence at low pH. Another more hydrophobic fluorescein analogue termed Tokyo
Green was recently reported that replaces the carboxylate with a methyl group. This
structural modification yields a highly fluorescent monoanion. We report a novel
fluorophore termed Pennsylvania Green that combines the pH-insensitivity and
photostability of Oregon Green with the hydrophobicity of Tokyo Green. To demonstrate
the utility of the Pennsylvania Green fluorophore, we compared cellular membrane
probes derived from 4-carboxy Tokyo Green and 4-carboxy Pennsylvania Green.
Because of its lower pKa, only the Pennsylvania Green-derived probe enables facile
visualization of acidic endosomes within living mammalian cells.

iv
We also report an improved synthesis of the Pennsylvania Green fluorophore and
its related 4-carboxy derivative. 4-Carboxy-Pennsylvania Green was prepared from 4-
iodo-3-methyl-benzoic acid methyl ester in three steps and 32% overall yield. This new
synthesis is a notable improvement over our original methods. Chinese hamster ovary
cells expressing O6-alkylguanine-DNA alkyltransferase fusion proteins were treated with
Pennsylvania Green and Oregon Green linked to O6-benzylguanine (SNAP-Tag
substrates). Analysis by confocal laser scanning microscopy revealed that Pennsylvania
Green derivatives are substantially more cell permeable than analogous Orgeon Green
Probes.
Using the improved synthetic methods identified for the preparation of
Pennsylvania Green, four novel red fluorophores were designed and synthesized: Penn
Fluor 550, Penn Fluor 555, Penn Fluor 576 and Penn Fluor 609. The ability of
biotinylated derivatives of these new fluorophores to image strepavidin fusion proteins in
living mammalian cells was investigated.
As a non-fluorescent molecular probe of potential drug targets and the steroid
chaperone cycle, we synthesized dimeric molecules design to control estrogen receptor
and heat shock protein 90 in living cells. Heat shock protein 90 (Hsp90) is an abundant
ATP-dependent cellular chaperone that facilitates the folding of estrogen receptors (ERs)
and other oncogenic proteins involved in cancer proliferation. This protein is under
intense investigation as a target of anticancer drugs because breast cancer cells contain
Hsp90 in an activated high affinity conformation that is particularly susceptible to Hsp90
inhibitors. These inhibitors include the anticancer agent geldanamycin (GDM), which is
thought to inhibit the proliferation of cancer cells in part by blocking agonist-induced

v
release of steroid hormone receptors such as ERs from Hsp90. Here, we report the
synthesis and biological evaluation of chimeric ligands derived from estrogens and GDM
designed to heterodimerize ER and Hsp90 proteins. These compounds were found to
enforce interactions between these proteins in vitro and uniquely affect the subcellular
localization of ER alpha in a cancer cell line.
We also investigated a new class of immunosuppressant drugs called
bis(trifluoromethyl)pyrazoles (BTPs). To probe the mechanism of action and molecular
target of these new molecules, we designed BTP derivatives useful for affinity
chromatography. A biotinylated BTP successfully identified drebrin as a potential target
of BTPs. The binding of BTP to drebrin was further confirmed by western blot and
confocal microscopy experiments.

vi
TABLE OF CONTENTS
LIST OF FIGURES .....................................................................................................xiii
LIST OF TABLES.......................................................................................................xx
ACKNOWLEDGEMENTS.........................................................................................xxi
Chapter 1 Introduction to Fluorescence and Fluorescent Molecules……………………..1
1.1 Introduction to Fluorescence………………………………………………………..…1
1.1.1 Fluorescence of Organic Molecules…………………………………………2
1.1.2 General Rules Relating Chemical Structure and Fluorescence……………..3
1.2 Measurement of Fluorescence ……………………………………………………….5
1.2.1 Fluorescence Instrumentation………………………………………………6
1.3 Limitations of Fluorophores and Fluorescent Probes ..…………………………….....6
1.4 Fluorescent Dyes and Cells …………………………………………………………...8
1.4.1 Autofluorescence of Cells and Fluorescence of Cellular Components…......8
1.4.2 Interactions of Cells with Dyes……………………………………………...9
1.4.3 Binding to the Cell Surface……………………………………………….....9
1.4.4 Penetration of Dyes Inside the Cell………………………………………..11
1.5 Common Fluorophores………………………………………………………………12
1.5.1 Coumarins, Pyrenes and Other Fluorophores Excited by Ultraviolet
Light……………………………………………………………………………...13
1.5.2 Fluorescein and Fluorescein Derivatives…………………………………..15

vii
1.5.3 Long-wavelength Fluorophores……………………………………………17
1.5.4 Alexa Fluor Dye Series…………………………………………………….19
1.6 Conclusions…………………………………………………………………………..23
1.7 References……………………………………………………………………………24
Chapter 2 The Pennsylvania Green Fluorophore: A Hybrid of Oregon Green and Tokyo
Green for the Construction of pH-Insensitive, Hydrophobic Molecular
Probes…………………………………………………………………………….30
2.1 Introduction…………………………………………………………………………..30
2.2 Oregon Green………………………………………………………………………...31
2.3 Tokyo Green…………………………………………………………………………32
2.4 Design and Synthesis of Pennsylvania Green………………………………………..33
2.4.1 Synthesis of a Difluoroxanthone Fluorophore Precursor...………………...33
2.4.2 Synthesis of 4-Carboxy Pennsylvania Green and 4-Carboxy Tokyo
Green……………………………………………………………………..34
2.5 Photophysical Properties of Novel Fluorophores……………………………...…….35
2.5.1 pKa Determination of Novel Fluorophores………………………………..36
2.5.2 Quantum Yield Determination of Novel Fluorophores……………………37
2.6 Membrane Probes Derived from Pennsylvania Green and Tokyo Green……………40
2.7 Photobleaching of Membrane Probes………………………………………………..43
2.8 Conclusions…………………………………………………………………………..45
2.9 Experimental Section………………………………………………………………...46
2.9.1 General……………………………………………………………………..46

viii
2.9.2 Synthetic Procedures and Compound Characterization…………………....47
2.9.3 Assays and Protocols………………………………………………………60
2.10 References..…………………………………………………………………………63
Chapter 3 A Concise Synthesis of the Pennsylvania Green Fluorophore and Labeling of
Intracellular Targets with O6-Benzylguanine Derivatives ………..…………….67
3.1 Introduction………………………………………………………………………..…67
3.2 Synthesis of Fluorescein and Related Derivatives…………………………………...69
3.3 Improved Synthesis of Pennsylvania Green…………………………………………70
3.4 Improved Synthesis of 4-Carboxy Pennsylvania Green……………………………..71
3.5 Snap-Tag-Substrates...……………………………………………………………….72
3.6 Synthesis of Pennsylvania Green O6-Benzylguanine Probes………………………..73
3.7 Labeling of Intracellular Targets with Molecular Probes……………………………75
3.8 Conclusions…………………………………………………………………………..76
3.9 Experimental Section………………………………………………………………...77
3.9.1 General……………………………………………………………………..77
3.9.2 Snap-Tag Labeling…………………………………………………………78
3.9.3 Fluorescence Imaging……………………………………………………...79
3.9.4 Synthetic Procedures and Compound Characterization……………………79
3.10 References…………………………………………………………………………..92

ix
Chapter 4 Spanning the Spectrum with Novel Cell Permeable Fluorophores: Biotinylated
Probes that Enable Imaging of Strepavidin Fusion Proteins Expressed in Living
Mammalian Cells………………………………………………………………...97
4.1 Introduction…………………………………………………………………………..97
4.2 Absorbance and Auto-Fluorescence of Biological Samples….…………...…………98
4.3 Design of Novel Red-Shifted Fluorophores………………………………………..100
4.4 Synthesis of Penn Fluor 550, Penn Fluor 555 and their Carboxy Derivatives ....….101
4.5 Synthesis of Penn Fluor 576, Penn Fluor 609 and their Carboxy Derivatives ....….102
4.6 Absorption and Emission Spectra of Penn Fluors………………………………….104
4.7 Determination of Quantum Yield for Novel Red-Shifted Fluorophores …..………105
4.8 Studies of Intracellular Streptavidin with Biotinylated Probes…………………….107
4.9 Imaging of Cytosolic Streptavidin Fusion Proteins ………..……………………....111
4.10 Conclusions………………………………………………………………………..115
4.11 Experimental Section…….………………………………………………………..115
4.11.1 General…………………………………………………………………..115
4.11.2 Synthetic Procedures and Compound Characterization…………………116
4.11.3 Strepavidin Imaging……………………………………………………..135
4.12 References…..……………………………………………………………………..135
Chapter 5 Small Molecules that Heterodimerize Estrogen Receptors and Heat Shock
Protein 90…………………………………………………………………….....138

x
5.1 Introduction…………………………………………………………………………138
5.2 Hsp90 Inhibitors…………………………………………………………………….140
5.3 Previously Reported Estradiol-Geldanamycin Dimers……………………………..142
5.4 Design of Novel Estrone-Geldanamycin Dimers…………………………………..144
5.5 Synthesis of Estrone-Geldanamycin Dimers……………………………………….145
5.6 Detection of Heterodimer Formation in vitro………………………………………147
5.7 Yeast-Three Hybrid Assays...………………………………………………………149
5.8 Mammalian Three-hybrid Assays…………………………………………………..151
5.9 Mammalian ER Reporter Gene Assays with ERE Sites……………………………154
5.10 Mammalian Cytotoxicity Assays………………………………………………….156
5.11 Subcellular Localization of Fluorescently-tagged ER and Hsp90 in Mammalian
Cells………………...…………………………………………………………..158
5.12 Proposed Mechanism of Action of the Estrone-Geldanamycin Dimer…………...163
5.13 Second Generation Dimers………………………………………………………..164
5.14 Conclusions………………………………………………………………………..166
5.15 Experimental Section….…………………………………………………………..167
5.15.1 General…………………………………………………………………..167
5.15.2 Bacteria and Cell Lines………………………………………………….168
5.15.3 Synthesis of Dimeric Ligands…………………………………………...168
5.15.4 In vitro Coimmunoprecipitation Assay…………………………………179
5.15.5 Construction of Plasmids for Yeast Three-Hybrid Assay..……………...180
5.15.6 Construction of Plasmids for Mammalian Three-Hybrid Assay………..181
5.15.7 Construction of Plasmids for Fluorescently-Tagged Fusion Proteins..…182

xi
5.15.8 Microtiterplate β-Galactosidase Yeast Reporter Gene Assays………….182
5.15.9 Mammalian Three-Hybrid Assay……………………………………….184
5.15.10 Reporter Gene Assays with Full Length Estrogen Receptor α and ERE
Sites……………………………………………………………………..186
5.15.11 Mammalian Cytotoxicity Assays………………………………………187
5.15.12 Expression of Fluorescent Fusion Proteins and Confocal
Microscopy……………………………………………………………..188
5.16 References…………………………………………………………………………190
Chapter 6 Synthesis and Biological Evaluation of Bis(trifluoromethyl)pyrazole
Derivatives for Identification of Immunosuppresive Drug Targets …………....195
6.1 Introduction…………………………………………………………………………195
6.2 Bis(trifluoromethyl)pyrazoles as a Novel Class of Immunosuppresants…………...197
6.3 Design and Synthesis of BTP Derivatives for Identification of Drug Targets...…...198
6.4 BTP-Biotin Retains Inhibitory Activity…………………………………………….199
6.5 Affinity Chromatography using Biotinylated BTP…………………………………200
6.6 Interaction of BTP with Drebrin……………………………………………………202
6.7 BTP Blocks Drebrin Function……………………………………………………...203
6.8 Novel BTP Derivatives……………………………………………………………..204
6.9 Conclusions..………………………………………………………………………..205
6.10 Experimental Section….…………………………………………………………..206
6.10.1 General…………………………………………………………………..206

xii
6.10.2 Synthetic Procedures and Characterization……………………………..207
6.10.3 Assays and Protocols……………………………………………………217
6.11 References…………………………………………………………………………219
Appendix A, List of Cell Lines and Microbial Strains Used in this Research...……….222
Appendix B, Protein Sequences…...……………………………………………………223
Appendix C, Plasmids……...…………………………………………………………...229

xiii
LIST OF FIGURES
Chapter 1
Figure 1.1 Jablonski diagram illustrating excited states of a molecule. Excited states
exist as either singlets or triplets. The short lines symbolize vibrational and
rotational energy levels. …………………………………………………..2
Figure 1.2 General rules relating chemical structure and fluorescence. A. Increased
conjugation causes a red shift. B. Crosslinks cause a blue shift. C.
Increased molecular rigidity enhances fluorescence. ……………………..4
Figure 1.3 Incorporation of a variety of fluorescent probes into the membrane
bilayer. …………………………………………………………………..10
Figure 1.4 Acetylation of fluorescein allows the dye to be cell permeable; it is
transformed in situ to the fluorescent compound by esterases. …………12
Figure 1.5 Coumarin derivatives excited by UV light……………..………………..13
Figure 1.6 Pyrene derivatives excited by UV light…..……………………………...14
Figure 1.7 Structures of fluorescein derivatives and analogues...…………………...16
Figure 1.8 Structures of long-wavelength rhodamines. ……………..……………...18
Figure 1.9 Structures of cyanine dyes Cy3.5 and Cy5. ……………………………..19
Figure 1.10 Structures of some Alexa Fluor dyes. …………………………………..22
Chapter 2
Figure 2.1 Structures of known (7, 16, and 25) and novel (26-28) fluorescent dyes in
their anionic form. ……………………………………………………….31
Figure 2.2 Replacing the carboxylate group of fluorescein with other substituents and
the effect of those substituents on fluorescence. ……………………...…32
Figure 2.3 An improved synthesis of xanthone 36. ………………………………...34
xiv
Figure 2.4 Synthesis of the 4-carboxy-Pennsylvania Green and 4-carboxy-Tokyo
Green fluorophores. ……………………………….…………………….35
Figure 2.5 Absorbance versus pH titrations of 40 (panel A) and 41 (panel B) used to
determine pKa values (panel C). Overlaid emission spectra (panels A and
B) are in arbitrary units. ………………………………………………....37
Figure 2.6 Fluorescence vs. absorbance plots used to determine the relative quantum yields of 40 and 41 compared with fluorescein (7) and 5-carboxyfluorescein. ……………………………………………………...38
Figure 2.7 Synthesis of molecular probes of mammalian plasma membranes and
intracellular endosomes. ………………………………………………...41
Figure 2.8 Confocal laser scanning (left) and differential interference contrast (right)
micrographs of living Jurkat lymphocytes. Cells were treated with probes
44 and 45 (10 µM) in RPMI media for 1 h at 37 °C and washed with fresh
media prior to analysis by microscopy. In panel C, cells were treated with
45 (10 µM) and the vacuolar H+ ATPase inhibitor Bafilomycin A1 (1 µM)
to prevent acidification of endosomes. …………………………………42
Figure 2.9 Intracellular localization of the Pennsylvania Green probe 44 in early and
recycling endosomes. Jurkat lymphocytes were treated with 44 (10 µM)
and transferrin-AlexaFluor633 (Invitrogen, 0.42 µM) at 37 °C for 1 h,
cells were washed with media, and imaged by confocal laser scanning and
DIC (lower left) microscopy. Red fluorescence of internalized transferrin
is shown on the upper left. Green fluorescence of 44 is shown on the upper
right. Colocalization of green and red fluorescence is shown in yellow on
the lower right. ………………………………………………………….43
Figure 2.10 Representative examples of photobleaching of molecular probes added to
living Jurkat lymphocytes as imaged by confocal laser scanning
microscopy. Cells were treated with the Pennsylvania Green probe 44 or
the Tokyo Green probe 45 (10 µM, 1 h, 37 °C)…………………………44
Figure 2.11 Analysis of photobleaching rates of molecular probes added to living
Jurkat lymphocytes. Cells were treated with 44 or 45 (10 µM, 1 h, 37 °C),
washed with fresh media, and imaged by confocal microscopy while
subjected to continuous irradiation at 488 nm with a 25 mW argon-ion
laser at 1% laser power. At specific time points, the fluorescence intensity
of five individual cells was quantified and averaged. …………………...45

xv
Chapter 3
Figure 3.1 Structures of fluorophores and molecular probes in ionization states
observed at physiological pH. …………………………………………...68
Figure 3.2 Synthesis of fluorescein and carboxy-fluorescein derivatives. ………….70
Figure 3.3 Concise synthesis of Pennsylvania Green. ……………………………...71
Figure 3.4 Synthesis of 4-carboxy-Pennsylvania Green. …………...……………...72
Figure 3.5 X-ray structure of human AGT bound to O6-methylguanine on DNA
(Panel A, pdb code 1T38) and mechanism of covalent labeling of AGT
fusion proteins with O6-benzylguanine-fluorophores (Panel B). ………..73
Figure 3.6 Synthesis of molecular probes derived from O6-benzylguanine (47, 48)..74
Figure 3.7 Confocal laser scanning and differential interference contrast (DIC)
micrographs of CHO cells expressing AGT fusion proteins and treated
with probes 47 and 48. CAAX: C-terminal peptide derived from the Ras
protein that associates with the inner leaflet of the plasma membrane.
H2B: Nuclear-localized histone 2B protein. Molecular probes were added
at 5 µM for 1 h at 37 oC…………………....…………………………….76
Chapter 4
Figure 4.1 X-ray crystal structure of T state hemoglobin with oxygen bound at all
four hemes (pdb code 1GZX). …………………………………………..99
Figure 4.2 Structure of the heme group…….………………………………………..99
Figure 4.3 Absorption spectra of oxy and deoxyhemoglobin based on data from from
the Oregon Medical Laser Center. …………………..…………………100
Figure 4.4 Structure of known (20-22) and novel red-shifted fluorophores
(63-66)......................................................................................................101
Figure 4.5 Synthesis of Penn Fluor 550 (63), Penn Fluor 555 (64) and 4-carboxy
Penn Fluor 550 (72). …………………………………………………...102
Figure 4.6 Synthesis of Penn Fluor 576 (65), Penn Fluor 609 (66) and their carboxy
derivatives. ……………………………………………………………..103

xvi
Figure 4.7 Normalized absorbance spectra (Panel A) and fluorescence emission
spectra (Panel B) of novel fluorophores…………….………………….104 Figure 4.8 Fluorescence vs. absorbance plots used to determine the relative quantum
yields of 63-66 compared with Rhodamine B and Rhodamine 6G. …...106
Figure 4.9 Structures of biotinylated fluoresceins 83 and 84. ………………….....108
Figure 4.10 Chemical structures of Flubida-2 (85) and Flubi-2 (86). ……………...109
Figure 4.11 Structures of Pennsylvania Green-Biotin (87), Penn Fluor 550-Biotin
(88), Penn Fluor 576-Biotin (89), Penn Fluor 609-Biotin (90), Oregon
Green-Biotin (91), TAMRA-biotin (92) and ROX-Biotin (93). ……….110
Figure 4.12 Differential interference contrast (DIC) and confocal laser scanning
micrographs of CHO-K1 cells expressing SA-GTP-mRFP. Laser settings
were identical for all micrographs. Panel A: Penn Green-biotin (87).
Panel B: Penn Green-biotin (87) plus biotin. Panel C: Oregon Green-
biotin (91). Panel D: Oregon Green-biotin (91) plus biotin. ……...……112
Figure 4.13 Differential interference contrast (DIC) and confocal laser scanning
micrographs of CHO-K1 cells expressing SA-GTP-AcGFP. Laser settings
were identical for all micrographs. Panel A: Penn Fluor 550-biotin (88).
Panel B: TAMRA-biotin (92). Panel C: Penn Fluor 576-biotin (89). Panel
D: ROX-Biotin (93). Panel E: Penn Fluor 609 (90) ……...……………113
Figure 4.14 Differential interference contrast (DIC) and confocal laser scanning
micrographs of CHO-K1 cells expressing SA-GTP-AcGFP. Laser settings
were identical for all micrographs. Panel A: Penn Fluor 550-biotin (88).
Panel B: TAMRA-biotin (92) Panel C: Penn Fluor 576-biotin (89) Panel
D: ROX-Biotin (93)…………………………………………………….114
Chapter 5
Figure 5.1 The steroid receptor chaperone cycle illustrating folding of the estrogen
receptor (ER). Adapted from a review by Pratt and Toft……….….....139
Figure 5.2 Structures of selected Hsp90 inhibitors………………………………...141

xvii
Figure 5.3 Structures of estradiol-geldanamycin dimers synthesized by Kuduk and
coworkers……………………………………………………………….143
Figure 5.4 Structures of new synthetic estrone-geldanamycin dimers……………..144
Figure 5.5 Synthesis of E1-Gdm (100) and E1-Gdm-OH (101)…………………...145
Figure 5.6 Synthesis of compound 102…………………………………………….146
Figure 5.7 Schematic of immunoprecipitation experiment. Proteins that stably
interact with both portions of 100 will be coimmunoprecipitated ……..147
Figure 5.8 Immunoprecipitation experiment. From left to right, lane 1 shows Hsp90
only in the absence of compound. Lane 2 shows Hsp90 and ER with
addition of 10 µM E1-G (100). Lane 3 shows Hsp90 and a slight ER band
with addition of 10 µM of the ethylated estrone control (102). Lane 4
shows Hsp90 only with 10 µM of the cleaved carbamate control (101).
Lane 5 shows Hsp90 with addition of 10 µM 17β-estradiol as a
competitor. Lane 6 shows Hsp90 only with addition of 10 µM Gdm (94)
as a competitor………………………………………………………….148
Figure 5.9 Schematic of the yeast three hybrid system. Heterodimerization of the ER
LBD and the Hsp90 N-terminal fragment by 100 was designed to activate
expression of the reporter gene…………….…………………………...149
Figure 5.10 Dose reponse and competition experiments in yeast three hybrid assays.
Panel A: Dose response with E1-Gdm (100), including dropout controls.
Panel B: Gdm (94) competition assay against a fixed concentration of E1-
Gdm (100). ……………………………………………………………..150
Figure 5.11 CHO mammalian three-hybrid assay. Panel A: Dose response with
estradiol (E2) and E1-Gdm (100). Panel B: Dropout controls…………152
Figure 5.12 Schematic of ER reporter gene assay. Agonist ligands induce receptor
dimerization, DNA binding, and expression of the downstream reporter
gene……………………………………………………………………..154

xviii
Figure 5.13 ER reporter gene assays. Panel A: Dose response curves with E1-G (100),
Gdm (94) and the control agonist 17β -estradiol. Panel B: Competition
assay against constant 1 nM concentration of 17β -estradiol…………..156
Figure 5.14 Cellular toxicity assays. Panel A: HEK293 human embryonic kidney
cells. Panel B: MCF-7 human breast cancer cells……………………...157
Figure 5.15 Differential interference contrast (DIC) and laser scanning confocal
micrographs of SKN-BE(2)-C human neuroblastoma cells expressing
hER-(1-595)-AcGFP and mRFP-Hsp90. Laser settings were identical for
all micrographs. Scalebar: 50 µm. Cells were fixed 90 min after
compound addition. Panel A: 1% DMSO (vehicle control). Panel B: 100
nM E2. Panels C and D: 10 µM Gdm (94) without (G) and with (H)
coadministration of 100 nM E2. Panels E and F: 10 µM E1-Gdm (100)
without (E) and with (F) coadministration of 100 nM E2. Panel G: 10 µM
101. Panel H: 10 µM 102. ……………………………………………..160
Figure 5.16 Differential interference contrast (DIC) and confocal laser scanning
micrographs of SKN-BE(2)-C human neuroblastoma cells expressing
hER-(1-595)-AcGFP and mRFP-Hsp90. Laser settings were identical for
all micrographs. Scalebar represents 50 µm. Cells were fixed 24 h after
compound addition. Panel A: 1% DMSO (vehicle control). Panel B: 100
nM E2. Panel C: 10 µM E1-Gdm (100) displaying punctate localization.
Panel D: 10 µM E1-Gdm (100) displaying more diffuse localization.
Panel E: 50 µM E1-Gdm (100) displaying punctate localization. Panel F:
50 µM E1-Gdm (100) displaying more diffuse localization. Panel G: 10
µM Gdm (94). White arrows illustrate localization of ER in the nucleus.
Yellow fluorescence in the DIC + Fluor. panels indicates
colocalization…………………………………………………………...161
Figure 5.17 Synthesis of fluorescent estrogen probe (112)………………………….164
Figure 5.18 Differential interference contrast (DIC) and laser scanning confocal
micrographs of SKN-BE(2)-C human neuroblastoma cells expressing
ERβ-mRFP treated with 1 µM 112. Yellow indicates colocalization of
112 and ERβ-mRFP…………………………………………………….165
Figure 5.19 Structure of second generation estradiol-geldanamycin dimer 113…….166

xix
Chapter 6
Figure 6.1 General signaling pathway for NFAT. Upon activation by an extracellular
stimulus, the T-cell receptor is activated, leading to an increase in levels of
intracellular Ca2+ and activation of calmodulin. Under these conditions
the Ca2+/calmodulin-dependent cellular phosphatase calcineurin is
activated. Calcineurin binds to NFAT at its regulatory domain and
dephosphorylates NFAT, causing a conformational change that unmasks
its nuclear localization signal. NFAT translocates to the nucleus, where it
binds to NFAT response elements. ………………………………….…196
Figure 6.2 Structures of the Immunosuppresant Drugs CsA (114) and FK506
(115)…………………………………………………………………….197
Figure 6.3 Structures of select BTP molecules.……...…..………………………...197
Figure 6.4 Structure of BTP-biotin for use in affinity chromatography…..……….198
Figure 6.5 Synthesis of BTP-biotin (118). ………………………………………...199
Figure 6.6 NFAT-luciferase transgenic mouse thymocytes were stimulated in the 24
hours prior to assaying for luciferase activity. …………………………200
.
Figure 6.7 Schematic representation of affinity purification of BTP binding
proteins.....................................................................................................201
Figure 6.8 Purification of BTP-binding proteins. Lanes 1-3 are precleared lysates
incubated with only strepavidin-agarose beads. Lane 4 is beads incubated
with BTP-biotin (118) coated beads. …………………………………..202
Figure 6.9 Western blot analysis with anti-drebrin antibody confirming drebrin binds
to the BTP portion of 118 and not the linker region of this molecule….203
Figure 6.10 Confocal laser scanning micrographs of CHO cells transfected with either
GFP (top) or GFP-drebrin (middle and bottom) and treated with DMSO
(middle) or BTP (bottom) prior to staining for F-actin (red). ………….204
Figure 6.11 Synthesis of novel BTP derivatives. …………………………………...205

xx
LIST OF TABLES
Table 1.1 Alexa Fluor dye series…..……………………………………………….20
Table 2.1 Comparison of physicochemical properties of known (7,16,25) and novel
(40, 41) fluorophores. Q.Y.: Quantum yield. ……………………………39
Table 3.1 Physicochemical properties of fluorophores and fluorescent probes.
Values were determined in phosphate buffered saline (PBS) at pH
7.4...............................................................................................................74
Table 4.1 Absorption and emission wavelength maxima for novel fluorophores 63-
66. ………………………………………………………………………105
Table 4.2 Comparison of quantum yields for select known fluorophores and novel
fluorophores (63-66). …………………………………………………..107

xxi
ACKNOWLEDGEMENTS
I would like to thank my advisor Dr. Blake R. Peterson for his guidance and the
opportunity to work with such a great group. I am grateful for the support of all the
Peterson Lab members from whom I have learned a great deal. My Mother and my
Father have been a great source of encouragement for me throughout graduate school and
many other times in my life. For being a constant source of knowledge, comfort and
support, I thank D. Keith Hester II. For whom I always feel a great source of pride, joy
and admiration and for without whom the completion of this thesis would not have been
possible.

1
Chapter 1
Introduction to Fluorescence and Fluorescent Molecules
1.1 Introduction to Fluorescence
Fluorescence-based methods are some of the most powerful techniques for studies
of biology and medicine. A fluorescent signal contains information not only about the
fluorescent molecule itself but also about neighboring molecules and environment. In
this way, fluorescent dyes can be used as small molecular reporters or molecular probes.
Fluorescence is a process distinct from incandescence (i.e. emission of light due to high
temperatures). Heating is generally detrimental to the process of fluorescence, and most
substances, when fluorescing, produce very little heat. For this reason fluorescence has
commonly been referred to as "cold light". Virtually all organic molecules are capable of
fluorescence but the phenomenon is often limited to low temperature and short excitation
wavelengths.1 There are only a few compounds that will show an intense visible
fluorescence at room temperature when illuminated with visible or near-ultraviolet light.
The fluorescent probes that become the most useful are those that exhibit a strong and
easily distinguishable fluorescence signal.

2
1.1.1 Fluorescence of Organic Molecules
Figure 1.1. Jablonski diagram illustrating excited states of a molecule. Excited states
exist as either singlets or triplets. The short lines symbolize vibrational and rotational
energy levels.
Fluorescence is a process that occurs in three stages; excitation, excited state
lifetime, and fluorescence emission (Figure 1.1). The first step is excitation of a
molecule due to absorption of a photon from an external source. This creates an excited
electronic singlet state, lasting for a defined amount of time, usually only nanoseconds.
Once a molecule has absorbed energy, there are a number of routes by which it can return
to the ground state. If the photon emission occurs between states of the same spin state
(e.g. S1 � S0) this is termed fluorescence. If the spin state of the initial and final energy
levels are different (e.g. T1 � S0), the emission is called phosphorescence. Since
fluorescence is statistically much more likely than phosphorescence, the lifetimes of

3
fluorescent states are very short (1 x 10⁻⁵
to 10-8
seconds) whereas phosphorescence
lifetimes are somewhat longer (1 x 10⁻⁴
seconds to minutes).2
Three nonradiative processes are also significant: internal conversion (IC),
intersystem crossing (ISC) and vibrational relaxation. Internal conversion is the
radiationless transition between energy states of the same spin state. Intersystem crossing
is a radiationless transition between different spin states. Of these three processes,
vibrational relaxation occurs most frequently for many molecules. This occurs very
quickly (< 1 x 10-12
seconds) and is due to interactions with other intra- and
intermolecular degrees of freedom. When fluorescence occurs as a photon is emitted
returning a molecule to its ground state, the energy of this photon is lower than the
excitation and therefore of longer wavelength. The fluorescence emission spectrum is
spectrally close to the absorption spectrum and they tend to mirror each other. The
difference in energy or wavelength between the maximum of the absorption spectra and
the maximum of the emission specta is defined as the Stokes’ shift. This difference is
characteristic of all complex molecules.
1.1.2 General Rules Relating Chemical Structure and Fluorescence
It is typically quite difficult to relate the chemical structure of a dye to its
fluorescence properties. However, some general rules can be formulated, and the first set
of rules concerns how the excitation and emission wavelengths of a molecule are
affected.3 The empirical rules for wavelength are as follows: 1. A π electron system must

4
be involved if excitation occurs at wavelengths greater that 220 nm. 2. The absorption
and fluorescence spectra shift to longer wavelengths with extended conjugation (Figure
1.2A). This is demonstrated by benzene (1) having an absorption of 263 nm as compared
to naphthalene (2) at 314 nm. 3. A “crosslink” of the conjugated chain shifts the
absorption and fluorescence spectra to shorter wavelength (Figure 1.2B). This can be
seen when comparing phenanthrene (5) and anthracence (3). 4. Substitutions of side
groups usually results in a red shift. This concept will be demonstrated in later chapters.
Figure 1.2. General rules relating chemical structure and fluorescence. A. Increased
conjugation causes a red shift. B. “Crosslinks” cause a blue shift. C. Increased molecular
rigidity enhances fluorescence.
The second set of rules concerns how the intensity of fluorescence is affected.
The intensity and the efficiency of fluorescence is the quantum yield. Quantum yield is a
ratio of the number of photons emitted as light to the number of absorbed photons. All

5
fluorescent dyes will eventually fade after a certain number of excitation-emission cycles,
but there are some general rules that relate molecular structure to how high the quantum
yield initially is for a molecule.3 1. Introduction of heavy atoms into a fluorescent
molecule will reduce its fluorescence. 2. An increase in molecular rigidity often results in
an increase in fluorescence (Figure 1.2C).4 This concept is demonstrated by comparing
fluorescein (7) to the non-fluorescent, less rigid compound phenolpthalene (8). 3. Charge
transfer states can give rise to fluorescence in a molecule. 4. Ortho-para substituents on a
molecule tend not to interfere with fluorescence properties, but meta-directed groups tend
to decrease fluorescence. 5. The quantum yield of a molecule will decrease with
increasing temperature. Although it is difficult to accurately predict the fluorescent
properties of a molecule, the above rules tend to hold true for most systems. With
growing knowledge of fluorescence properties and fluorescent molecules there is a need
to better identify these molecules of interest.
1.2 Measurement of Fluorescence
When measuring fluorescence properties of a molecule a number of parameters
can be quantified. These properties include the intensity of fluorescence, emission
spectrum, excitation spectrum, absorption spectrum, polarization and lifetime. The basic
principle of measurement requires a light source, a sample, and a detector. There are
various arrangements in which fluorescence measurements can be determined depending

6
on the instrumentation being used. This variety of ways shows how diverse and versatile
fluorescence techniques can be.
1.2.1 Fluorescence Instrumentation
There are predominately four types of instrumentation used in measuring
fluorescence. Each of these instruments provides distinctly different information.2
General information regarding the concentration and chemical environment of a sample
can be obtained using a spectrofluorometer. A certain excitation wavelength is selected,
and the emission spectrum is recorded. A commonly used instrument to analyze
fluorescence of living cells is a flow cytometer, which measures fluorescence per cell in a
flowing stream. This allows small populations of cells in a large sample to be identified
and quantified. Fluorescence microscopes resolve fluorescence as a function of spatial
coordinates in two or three dimensions for microscopic objects. Fluorescence
microscopes are very useful when examining the localization of cellular fluorescence.
Lastly, there are fluorescence scanners including microarray and microtiter plate readers.
These instruments resolve fluorescence as a function of spatial coordinates in two
dimensions for macroscopic samples. This type of measurement is generally used for
fluorescence-based assays, gel electrophoresis and blots. Despite the diversity of
fluorescence measurement techniques there are limitations associated with fluorescent
probes.
1.3 Limitations of Fluorophores and Fluorescent Probes

7
Limitations of fluorophores and fluorescent probes can be divided into three
subcategories: sensitivity, spatial definition and temporal and spatial resolution.5
Temporal resolution is inherently limited by the fluorescence lifetime of the probe.
Different types of probes have different lifetimes ranging from nanoseconds to
milliseconds. The higher sensitivity of fluorescence techniques, as compared with
absorption techniques, is due in part to the fact that the absorption signal is related to the
incident light intensity. In fluorescence, the separation of the dye-related signal from the
background is easier than with absorption measurements. The intensity of fluorescence is
dependent on the sample concentration as well as other parameters such as the quantum
yield. Since measurement of very low intensities of photon emission is not difficult,
much lower concentrations of fluorophores can be detected compared to absorption
spectrometry.
The spatial resolution of an optical instrument is limited by the laws of optic
diffraction. In a classic microscope the theoretical limit is about 150-200 nm, by contrast
in a confocal microscope it is about 100-150 nm.1 The resolution of fluorescence
microscopes can be improved in some respects, but all brightly fluorescent objects closer
than the resolution limit are not resolved well using conventional fluorescence methods.
Imaging techniques using high magnification microscopes equipped with highly
sensitive cameras are capable of detecting single molecules and are reaching theoretical
limits. Attempts to maximize the temporal and spatial resolution always involve a trade
off between sensitivity and time resolution. A single dye molecule can only last for a
limited amount of excitation-emission cycles before it is degraded. With respect to the
8
sensitivity of cameras and the quantum yield of the dye, there are limited numbers of
images that can be captured. For longer measurements, either a lower resolution image
or a high dye concentration must be employed. There are also benefits and limitations
with respect to the dye itself that will be discussed later in this chapter.
1.4 Fluorescent Dyes and Cells
1.4.1 Autofluorescence of Cells and Fluorescence of Cellular Components
A basic requirement when working with fluorescent dyes is that they be easily
distinguishable from background fluorescence. This is important when working with
biological samples due to the fact that all biological material exhibits some fluorescence
that can interfere with emission from fluorescent probes or labels. Cellular
autofluorescence is present in all channels to varying extents, and provides a background
that varies from cell to cell.6 There are a few ways to circumvent autofluorescence.
One method is to devote a single channel to measure autofluorescence. Because the
autofluorescence spectrum of cells is generally very similar, the autofluorescence can be
treated as one additional type of fluorescent molecule. A simple subtraction of the signal
can significantly enhance sensitivity for detection of low-density molecules. Detection
of fluorophores also depends on the specific interaction of the dye with the cells under
investigation.

9
1.4.2 Interactions of Cells with Dyes
Interactions of dyes with cells can be described in three ways: 1. At the cellular
level one can observe specific cells stained with a dye of interest; 2. At the subcellular
level one can observe specific organelles or intracellular compartments that are stained;
3. On the molecular level, specific molecules of the cell can be shown to interact with the
dye. The cellular location of a dye is directly related to its chemical nature. The
structure of the dye defines whether it will insert in the plasma membrane, reside on the
cell surface, or whether it will penetrate inside the cell. The membrane acts as a barrier
that controls the entry and retention of probes on the basis of their hydrophilicity and
lipophilicity.7 For this reason hydrophilic probes will not cross cell membranes and
highly hydrophobic dyes are trapped in lipid bilayers. Therefore, having a moderately
lipophilic probe that can penetrate the membrane and enter the cytoplasm is of great
utility in studying molecular biology. Other physicochemical properties such as
electrostatics, size, and the ability of the dye to bind nonspecifically to membrane and
cellular proteins must also be considered.
1.4.3 Binding to the Cell Surface
Fluorescent labeling of lipid bilayers and cellular membranes can be
accomplished with a large variety of dyes. The plasma membrane of cells will

10
spontaneously incorporate some hydrophobic dyes and some negatively charged dyes
(Figure 1.3).8 The rate of spontaneous incorporation into the membrane may be
improved by chemical modification of the dye. For example, by adding a lipophilic tail
or cholesterol moiety to the dye can facilitate staining of the cell surface.
Figure 1.3. Incorporation of a variety of fluorescent probes into a lipid bilayer.8
In addition to spontaneous incorporation of probes, covalent modification is also a
means to stain cell membranes. There are a wide variety of fluorescent compounds that
will chemically react with the components of the cell wall or plasma membrane and will
form covalent bonds to biomolecules. The limiting factors for such procedures are the
stringent reaction conditions that must be used to insure cell survival. Because

11
membranes are not the only part of the cell that scientists wish to study, it is important for
certain dyes to be able to penetrate the cell membrane and access intracellular
compartments.
1.4.4 Penetration of Dyes Into Cells
For many membrane impermeable dyes, elaborate procedures have been
developed to cross plasma membranes and gain access to the cytoplasm. The most
widely used approach is to chemically modify a dye as a membrane permeable precursor
that can be enzymatically converted into the fluorophore in situ (Figure 1.4). This
method is commonly utilized with fluorescein (7). When modified as fluorescein
diacetate (9), the molecule enters cells and is converted into fluorescein upon cleavage of
the acetate groups by esterases in situ. However, if no such precursor is available other
techniques must be used. Most of these methods are generally based on disruption of
membranes. There are many mechanical methods including microinjection with a glass
capillary, osmotic shock, mild sonication and vigorous agitation. In a chemical strategy,
cells can be soaked in ATP prior to loading to facilitate uptake.1 Cells can also be loaded
by fusion with a liposome or other material filled with the dye of interest. Each strategy
has its advantages and limitations. Some techniques work well for adherent cell cultures
and other work better for cells in suspension.9, 10

12
Figure 1.4. Acetylation of fluorescein allows the dye to be cell permeable; it is
transformed in situ to the fluorescent compound by esterases.
However, the simplest and least invasive method is passive diffusion. Using this
method, cells are simply incubated with the dye solution in media and the dye penetrates
into the cell. This simple method requires a cell permeable compound in order to be
effective. Therefore it is advantageous to have such dye molecules available to study
cellular biology.
1.5 Common Fluorophores
Fluorophores are molecules that can be irradiated and emit red-shifted photons.
Many fluorophores are used as positional markers that yield information only about their
spatial location. However due to the possibility of energy transfer between fluorophores,
fluorescence quenching, or sensitivity to solvent polarity, it is possible to obtain data on
neighboring molecules. There is a continuous need for better fluorescent labels with
better properties. Some of the most common fluorescent dyes range from blue
fluorescent to red fluorescent and are very diverse in structure.
13
1.5.1 Coumarins, Pyrenes and Other Fluorophores Excited by Ultraviolet Light
Fluorophores that must be excited by UV irradiation are of limited use in
biological systems. This is due to the fact the many cells and tissues autofluoresce when
excited by UV light. UV can also be damaging to nucleic acids and biomolecules.
However, for certain applications such as immunofluorescence, a blue fluorescent probe
provides a signal that is easily distinguishable from green, yellow, orange, or red probes.
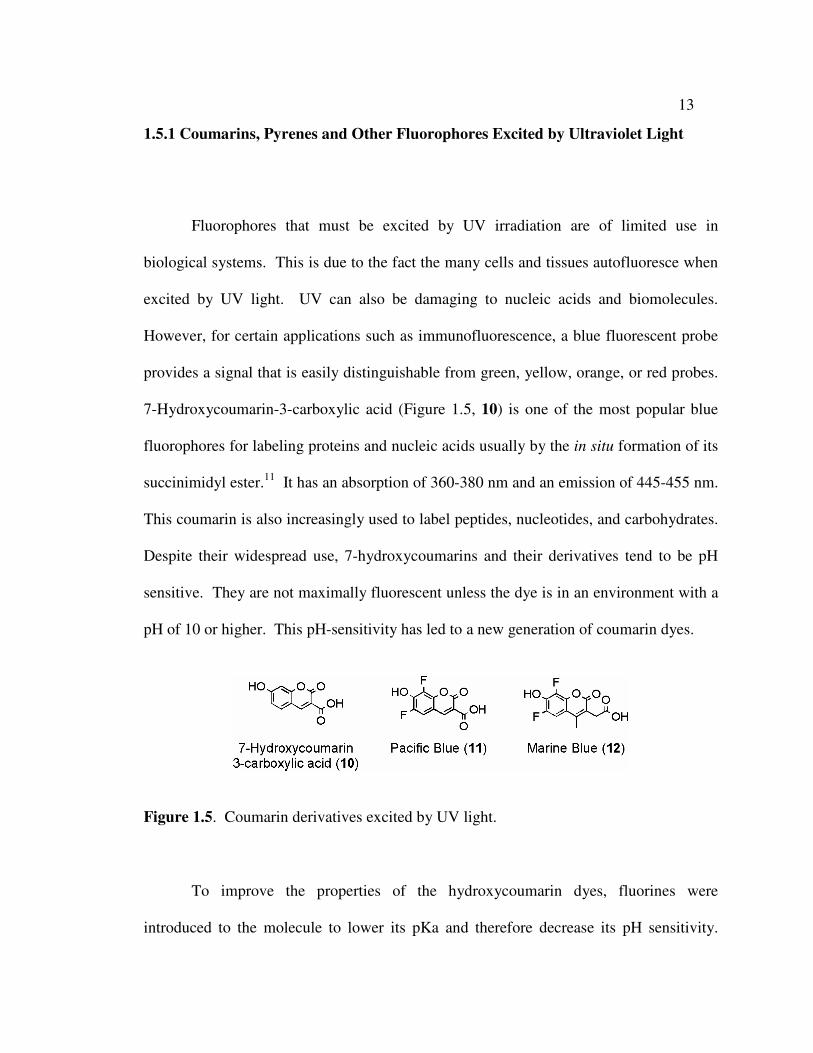
7-Hydroxycoumarin-3-carboxylic acid (Figure 1.5, 10) is one of the most popular blue
fluorophores for labeling proteins and nucleic acids usually by the in situ formation of its
succinimidyl ester.11
It has an absorption of 360-380 nm and an emission of 445-455 nm.
This coumarin is also increasingly used to label peptides, nucleotides, and carbohydrates.
Despite their widespread use, 7-hydroxycoumarins and their derivatives tend to be pH
sensitive. They are not maximally fluorescent unless the dye is in an environment with a
pH of 10 or higher. This pH-sensitivity has led to a new generation of coumarin dyes.
Figure 1.5. Coumarin derivatives excited by UV light.
To improve the properties of the hydroxycoumarin dyes, fluorines were
introduced to the molecule to lower its pKa and therefore decrease its pH sensitivity.

14
These new derivatives, named Pacific Blue (11) and Marine Blue (12), have significantly
reduced pKa values (3.7 and 4.7) as compared to their coumarin parent molecule (pKa
7.5). These dyes yield conjugates that are strongly fluorescent, even at neutral pH. These
dyes also have an increased resistance to photobleaching and higher quantum yields.12
Figure 1.6. Pyrene derivatives excited by UV light
Another series of UV excitable fluorophores includes pyrene and derivatives.
Pyrene (Figure 1.6, 13) shows an interesting excimer fluorescence. These excited state
dimers emit at longer wavelengths (470 nm) than the lone fluorophore (376 nm). The
fluorescent lifetime of these dimers is very long, greater than 100 ns. A similar molecule
is perylene (14), which also displays blue fluorescence. It is used as a blue-emitting
dopant material in OLEDs, either unmodified or substituted. Perylene has an absorption
maximum at 434 nm, and as with all polycyclic aromatic compounds, it exhibits low
water solubility. To improve the properties of pyrene and perylene, Cascade Blue was
developed (Figure 1.6, 15).13
This dye is a sulfonated pyrene, resulting in a high
absorptivity (400 nm), high fluorescence and resistance to photobleaching upon protein
conjugation. This dye is typically used for locating proteins on extracellular cell

15
surfaces.14
Although many other UV excitable dyes are known, fluorophores that emit
green photons are more commonly used to study biological systems.
1.5.2 Fluorescein and Fluorescein Derivatives
Due to high absorptivity, high quantum yield and good water solubility,
fluorescein (Figure 1.7, 7) has become one of the most widely used fluorophores. The
excitation maximum (490 nm) of fluorescein closely matches the 488 nm spectral line of
the argon laser, making it quite useful in laser scanning microscopy. However,
fluorescein has some substantial limitations.15-17
This fluorophore tends to quench upon
conjugation to biopolymers, especially when the degree of labeling is high. As with the
coumarin dyes, fluorescein is quite pH sensitive (pKa 6.5) with substantial loss of
fluorescence below pH 7. A high susceptibility to photobleaching is also a major
limitation of fluorescein. The same approach that was used to improve the coumarin
dyes was also applied to fluorescein to develop new dyes.

16
Figure 1.7. Structure of fluorescein derivatives and analogues.
The addition of fluorines to fluorescein yields an excellent dye, Oregon Green
488 (Figure 1.7, 16).18
The absorption and emission spectra of this dye is identical to that
of fluorescein. However, there are several advantages to Oregon Green, including its
lower pKa (4.8). This increased acidity translates to a less pH-sensitive fluorophore that
is also less susceptible to photobleaching. Conjugates of this dye are also not appreciably
quenched. Other halogenated fluoresceins such as eosin and erythrosine (Figure 1.7, 17
and 18 respectively) are not typically chosen due to their poor fluorescence properties.
These derivatives are used for their ability to act as phosphorescent probes or as
photosensitizers.19
These halogenated derivatives generally have poor quantum yields
due to the heavy atom effect.
As an alternative to Oregon Green (16), another photostable green dye is
Rhodamine Green (Figure 1.7, 19). This dye replaces two of the oxygens in fluorescein
with nitrogens. This replacement yields a highly fluorescent dye that is often conjugated
to nucleotides and nucleic acids. It is reported that Rhodamine Green is even more

17
photostable than Oregon Green and is completely pH insensitive between pH 4 and 9.20
Although green fluorescent molecules are widely used for many applications,
fluorophores that emit light at longer wavelengths are also important tools for studies of
biology.
1.5.3 Long-wavelength Fluorophores
Long-wavelength fluorophores are useful for multicolor labeling experiments
where dyes are needed that have absorption maxima above 520. The use of dyes that emit
in the IR region is also an attractive alternative to conventional UV-visible dyes because
fluorescence occurs in a low-energy region where there is little absorption or emission
associated with other biomolecules.21
Although the number of available long wavelength
dyes is smaller than that of shorter wavelength fluorophores, a variety of dyes have been
developed in recent years. Most long-wavelength dyes can be placed in two categories:
rhodamine derivatives and cyanine dyes. The structure of these dyes includes a rigid,
extended set of conjugated bonds or fused aromatic rings.
Rhodamines are fluorescein derivatives where nitrogens replace oxygens on the
xanthene moiety. As these nitrogens are alkylated, the wavelengths of these fluorophores
become red-shifted. The simplest example of this red-shifting phenomenon is
tetramethylrhodamine (Figure 1.8, 20). Termed TAMRA, this dye is typically used for
oligonucleotide labeling.22, 23
One drawback of this dye is that the absorption spectrum
of labeled proteins is often complex, splitting into two absorbance peaks at 520 and 550
nm. The emission of tetramethylrhodamine is maximal at 572 nm, making it an orange

18
fluorophore. Alkylation of the amine groups on rhodamine with ethyl groups gives
Lissamine Rhodamine (Figure 1.8, 21). The addition of ethyl groups shifts the absorption
and emission of Lissamine Rhodamine into the orange-red range. With an absorption of
570 nm and an emission of 595 nm, the Stokes shift away from tetramethylrhodamine is
not very large, but it permits conjugates of this fluorophore to be excited by the 568 nm
spectral line of the Ar-Kr mixed gas laser. Protein conjugates are more stable and can be
easier to purify than those of tetramethylrhodamine.8 The related Texas Red fluorophore
(Figure 1.8, 22) emits at a longer wavelength then both the aforementioned rhodamine
derivatives. Texas Red is widely used due to its minimal spectral overlap with
fluorescein.24, 25
It emits at about 615 nm, and its absorption maximum for excitation of
photons is at 589 nm.
Figure 1.8. Structures of long-wavelength rhodamines.
Another group of long wavelength fluorophores are the cyanine dyes. The basic
structure of cyanine dyes involves two aromatic or heterocyclic rings linked by a poly-
methine chain with conjugated double bonds.26
Depending on the structure, they cover
the spectrum from about 500 to 900 nm. Cy3.5 and Cy5 (Figure 1.9, 23 and 24) are two

19
common cyanine dyes. The reactive water soluble fluorescent dyes of the cyanine dye
family are usually synthesized with reactive groups on either one or both of the nitrogen
side chains so that they can be chemically cross-linked to either nucleic acids or proteins.
Cy3.5 is excited maximally at 545 nm and emits maximally at 643 nm, in the red part of
the spectrum, whereas Cy5 is excited maximally at 649 nm and emits maximally at 670
nm. Some limitations of cyanine dyes are the lack of sufficient labels for the tagging of
substrates, short fluorescence lifetimes, low quantum yields, and extensive aggregation in
aqueous solution.27
Due to these limitations and the limitations of other fluorophores, a
new series of dyes with exceptional properties was developed.
Figure 1.9. Structures of cyanine dyes Cy3.5 and Cy5.
1.5.4 Alexa Fluor Dye Series
There has been an ongoing effort to develop dyes that are highly fluorescent,
photostable, and pH-insensitive. It is also desirable for fluorophores to retain their bright
emission upon conjugation, which is particularly a problem for many rhodamines. It has
been shown that sulfonation of rings in the cyanine dyes increase their brightness in

20
aqueous media.21
This is also observed in dyes such as Cascade Blue (15).13
The Alexa
Fluor dye series (Molecular Probes, Invitrogen) uses existing fluorophore scaffolds
(coumarins and rhodamines) and modifies their structure by substituting one or more
hydrogen atoms with a sulfonic acid group. It is thought that sulfonation decreases the
inherent tendency of molecules to form aggregates,28
possibly due to the increased
polarity imparted by this group.
Table 1.1. Alexa Four dye series
Fluorescent
Emission
Alexa Fluor Dye
Abs/Em
(nm)
Blue Alexa Fluor 350 346/442
Blue Alexa Fluor 405 402/421
Yellow-Green Alexa Fluor 430 434/539
Green Alexa Fluor 488 495/519
Green Alexa Fluor 500 503/525
Yellow-Green Alexa Fluor 514 518/540
Yellow Alexa Fluor 532 531/554
Orange Alexa Fluor 546 556/573
Red-Orange Alexa Fluor 555 555/565
Red-Orange Alexa Fluor 568 578/603
Red Alexa Fluor 594 590/617
Red Alexa Fluor 610 612/628
Far-Red Alexa Fluor 633 632/647
Far-Red Alexa Fluor 635 633/647
Far-Red Alexa Fluor 647 650/668
Near Infrared Alexa Fluor 660 663/690
Near Infrared Alexa Fluor 680 679/702
Near Infrared Alexa Fluor 700 702/723
Near Infrared Alexa Fluor 750 749/775

21
The Alexa Fluor dyes have excitation and emission values ranging the entire
spectrum from ultraviolet to infrared (Table 1.1). By substituting hydrogens for
sulfonates on well known coumarin dyes, Alexa Fluor 350 (25) and Alexa Fluor 430 (26)
were created (Figure 1.10). The Alexa Fluor 488 fluorophore (27) is widely used due to
its superior properties compared to fluorescein.29, 30
The fluorescence spectrum is almost
identical to that of fluorescein, with strong absorption and greater photostability. This
dye is also pH-insensitive between pH 4 and 10. In contrast to the green fluorescence of
Alexa Fluor 488, Alexa Fluor 535, 546, 568 and 594 (Figure 1.10, 28-31) provide
fluorescent signals in the yellow to orange to red range. Both Alexa Fluor 546 and 555
are spectrally similar to tetramethylrhodamine and Cy3 but provide longer fluorescence
lifetimes due to their greater photostability. The Alexa Fluor 568 and Alexa Fluor 594
dyes are good replacements for Lissamine Rhodamine and Texas Red with superior
fluorescence output per protein or nucleic acid conjugate that tends to surpass other
spectrally similar fluorophore-labeled proteins.28

22
Figure 1.10. Structures of select molecules in the Alexa Fluor dye series.
There is an increasing need to develop dyes that can be excited by the 633 nm line
of the red He-Ne laser and the krypton-ion laser (647 nm). Fluorescence emissions this
far red are not detected by the human eye, which can only detect light up to about 650
nm. Many fluorophores in this range are also significantly quenched upon conjugation.
Molecular Probes has designed and extended their series of Alexa Fluor dyes to include
Alexa Fluor 633, 647, 660, 680, 700 and 750.31
The structures of these fluorophores have
not been disclosed by Molecular Probes. These far red dyes are very sought after due to
their spectra being well beyond the range of biological absorption and autofluorescence.
The growing popularity of the He-Ne laser prompts the need for compatible dyes.

23
1.6 Conclusions
Many unique fluorescent dyes are commercially available and their use as
biological probes is increasing due to improved properties of these fluorophores and
technological advances in instrumentation. Molecular Probes (now Invitrogen) has
successfully improved existing fluorophores with the Alexa Fluor dye series. This series
provides the most comprehensive range of fluorophores known to date, spanning the
entire visible spectrum. A drawback to this series is the high cost to consumers. When
used in organic synthesis, instead of small-scale protein labeling, these dyes are not cost
effective. Despite the improved characteristics of the Alexa Fluor dyes, including
increased photostability and pH insensitivity, there is one limitation that is often
overlooked or not mentioned, cell permeability. Many studies of cellular biology are
limited by the inability of fluorophores to pass through cell membranes. Although most
protein conjugates are by nature cell-impermeable and can only be used to study fixed
(dead) cells, cell-permeable small molecules can be used to study events in living cells.
Like fluorescein, Cy3 and Cy5, Alexa dyes carry multiple fixed negative charge. In most
cases the polarity of negatively charged functional groups prevents penetration through
cellular membranes. The need for bright cell-permeable fluorophores led us to synthesize
a series of compounds that we termed Pennsylvania Fluorophores.

24
1.7 References
1. Slavik, J., Fluorescent Probes in Cellular and Molecular Biology. CRC Press:
Boca Raton, 1994.
2. Jameson, D. M.; Croney, J. C.; Moens, P. D., Fluorescence: basic concepts,
practical aspects, and some anecdotes. Methods. Enzymol. 2003, 360, 1-43.
3. Morozov, Y. V., Interrelationship between the electronic structure, absorption
fluorescent properties and photoreaction capacity of certain organic molecules. J. App.
Spec. 1980, 32, (6), 602-607
4. Loutfy, R. O., High-Conversion Polymerization Flourescence Probes.
Macromolecules. 1981, 14, 270-275.
5. Agbaria, R. A.; Oldham, P. B.; McCarroll, M.; McGown, L. B.; Warner, I. M.,
Molecular fluorescence, phosphorescence, and chemiluminescence spectrometry. Anal.
Chem. 2002, 74, (16), 3952-3962.
6. Beisker, W.; Dolbeare, F.; Gray, J. W., An improved immunocytochemical
procedure for high-sensitivity detection of incorporated bromodeoxyuridine. Cytometry.
1987, 8, (2), 235-239.

25
7. Zhang, J.; Campbell, R. E.; Ting, A. Y.; Tsien, R. Y., Creating new fluorescent
probes for cell biology. Nat. Rev. Mol. Cell. Biol. 2002, 3, (12), 906-918.
8. Haugland, R. P., The Handbook: A guide to Fluorescent Probes and Labeling
Technologues. Invitrogen Corp.: 2005.
9. McNeil, P. L., Incorporation of macromolecules into living cells. Methods Cell
Biol. 1989, 29, 153-173.
10. Doxsey, S. J.; Sambrook, J.; Helenius, A.; White, J., An efficient method for
introducing macromolecules into living cells. J. Cell Biol. 1985, 101, (1), 19-27.
11. Higai, K.; Masuda, D.; Matsuzawa, Y.; Satoh, T.; Matsumoto, K., A fluorometric
assay for glycosyltransferase activities using sugars aminated and tagged with 7-
hydroxycoumarin-3-carboxylic acid as substrates and high performance liquid
chromatography. Biol. Pharm. Bull. 1999, 22, (4), 333-338.
12. Sun, W. C.; Gee, K. R.; Haugland, R. P., Synthesis of novel fluorinated
coumarins: excellent UV-light excitable fluorescent dyes. Bioorg. Med. Chem. Lett. 1998,
8, (22), 3107-3110.

26
13. Whitaker, J. E.; Haugland, R. P.; Moore, P. L.; Hewitt, P. C.; Reese, M.;
Haugland, R. P., Cascade blue derivatives: water soluble, reactive, blue emission dyes
evaluated as fluorescent labels and tracers. Anal. Biochem. 1991, 198, (1), 119-130.
14. Wang, Y.; Rasnick, D.; Klaus, J.; Payan, D.; Bromme, D.; Anderson, D. C.,
Nucleophile labeling of cysteine and serine protease substrates. J. Biol. Chem. 1996, 271,
(45), 28399-28406.
15. Song, L.; Hennink, E. J.; Young, I. T.; Tanke, H. J., Photobleaching kinetics of
fluorescein in quantitative fluorescence microscopy. Biophys. J. 1995, 68, (6), 2588-
2600.
16. Der-Balian, G. P.; Kameda, N.; Rowley, G. L., Fluorescein labeling of Fab' while
preserving single thiol. Anal. Biochem. 1988, 173, (1), 59-63.
17. Zuk, R. F.; Rowley, G. L.; Ullman, E. F., Fluorescence protection immunoassay:
a new homogeneous assay technique. Clin. Chem. 1979, 25, (9), 1554-1560.
18. Sun, W. C.; Klaubert, D. H.; Haugland, R. P., Fluorinated Fluoresceins. J. Org.
Chem. 1997, 62, 6469-6475.
19. Jing, B.; Zhang, M.; Shen, T., An unusual photosensitizer: dyad of eosin-tris(2,2'-
bipyridine)Ru(II). Org. Lett. 2003, 5, (20), 3709-3711.

27
20. Hama, Y.; Urano, Y.; Koyama, Y.; Bernardo, M.; Choyke, P. L.; Kobayashi, H.,
A comparison of the emission efficiency of four common green fluorescence dyes after
internalization into cancer cells. Bioconjug. Chem. 2006, 17, (6), 1426-1431.
21. Gomez-Hens, A.; Aguilar-Caballos, M. P., Long-wavelength fluorophores: new
trends in their analytical use. Trends Anal. Chem. 2004, 23, (2), 127-136.
22. Oefner, P. J.; Huber, C. G.; Umlauft, F.; Berti, G. N.; Stimpfl, E.; Bonn, G. K.,
High-resolution liquid chromatography of fluorescent dye-labeled nucleic acids. Anal.
Biochem. 1994, 223, (1), 39-46.
23. Chehab, F. F.; Kan, Y. W., Detection of specific DNA sequences by fluorescence
amplification: a color complementation assay. Proc. Natl. Acad. Sci. 1989, 86, (23),
9178-9182.
24. Titus, J. A.; Haugland, R.; Sharrow, S. O.; Segal, D. M., Texas Red, a
hydrophilic, red-emitting fluorophore for use with fluorescein in dual parameter flow
microfluorometric and fluorescence microscopic studies. J. Immunol. Methods. 1982, 50,
(2), 193-204.
25. Lefevre, C.; Kang, H. C.; Haugland, R. P.; Malekzadeh, N.; Arttamangkul, S.;
Haugland, R. P., Texas Res-X and rhodamine Red-X, new derivatives of sulforhodamine

28
101 and lissamine rhodamine B with improved labeling and fluorescence properties.
Bioconjug. Chem. 1996, 7, (4), 482-489.
26. Mujumdar, R. B.; Ernst, L. A.; Mujumdar, S. R.; Lewis, C. J.; Waggoner, A. S.,
Cyanine dye labeling reagents: sulfoindocyanine succinimidyl esters. Bioconjug. Chem.
1993, 4, (2), 105-111.
27. Brismar, H.; Trepte, O.; Ulfhake, B., Spectra and fluorescence lifetimes of
lissamine rhodamine, tetramethylrhodamine isothiocyanate, texas red, and cyanine 3.18
fluorophores: influences of some environmental factors recorded with a confocal laser
scanning microscope. J. Histochem. Cytochem. 1995, 43, (7), 699-707.
28. Panchuk-Voloshina, N.; Haugland, R. P.; Bishop-Stewart, J.; Bhalgat, M. K.;
Millard, P. J.; Mao, F.; Leung, W. Y.; Haugland, R. P., Alexa dyes, a series of new
fluorescent dyes that yield exceptionally bright, photostable conjugates. J. Histochem.
Cytochem. 1999, 47, (9), 1179-1188.
29. Huang, S.; Wang, H.; Carroll, C. A.; Hayes, S. J.; Weintraub, S. T.; Serwer, P.,
Analysis of proteins stained by Alexa dyes. Electrophoresis. 2004, 25, (6), 779-784.
30. Rusinova, E.; Tretyachenko-Ladokhina, V.; Vele, O. E.; Senear, D. F.; Alexander
Ross, J. B., Alexa and Oregon Green dyes as fluorescence anisotropy probes for

29
measuring protein-protein and protein-nucleic acid interactions. Anal. Biochem. 2002,
308, (1), 18-25.
31. Berlier, J. E.; Rothe, A.; Buller, G.; Bradford, J.; Gray, D. R.; Filanoski, B. J.;
Telford, W. G.; Yue, S.; Liu, J.; Cheung, C. Y.; Chang, W.; Hirsch, J. D.; Beechem, J.
M.; Haugland, R. P.; Haugland, R. P., Quantitative comparison of long-wavelength Alexa
Fluor dyes to Cy dyes: fluorescence of the dyes and their bioconjugates. J. Histochem.
Cytochem. 2003, 51, (12), 1699-1712.

30
Chapter 2
The Pennsylvania Green Fluorophore: A Hybrid of Oregon Green and Tokyo
Green for the Construction of Hydrophobic and pH-Insensitive Molecular Probes
2.1 Introduction
Molecular probes derived from fluorescein are widely used as tools for studies of
cellular biology. This green fluorophore is particularly suited for cellular analysis by
confocal laser scanning microscopy and flow cytometry due to its excitation maximum at
490 nm, closely matching the 488 nm spectral line of the argon-ion laser. In addition,
fluorescein has a high molar absorptivity and excellent quantum yield (0.92 at pH 9).
Under physiological conditions (pH 7.4), fluorescein is predominantly a highly
hydrophilic dianion. However, the monoanionic form of fluorescein exhibits the
relatively high pKa of 6.5, rendering this dye much less fluorescent in acidic solutions.1
Fluorescein is also relatively susceptible to photobleaching, which is thought to involve
reactions with molecular oxygen and proximity-induced reactions of the dye.2 Due to the
limitations of fluorescein, novel dyes with improved charateristics are continually sought
after. The usefulness of fluorescein for molecular probes has been diminished by the
development of fluorescent molecules with more desirable properties such as Oregon
Green.

31
2.2 Oregon Green
Oregon Green, a more acidic 2’, 7’-difluoro derivative of fluorescein (16, Figure
2.1), was developed as a less pH-sensitive fluorophore.3 The appended fluorine atoms
reduce the pKa of this dye to 4.8, substantially improving fluorescence at low pH. This
compound is also significantly more photostable than fluorescein. However, the high cost
and high polarity of Oregon Green limits its utility as a building block for hydrophobic
molecular probes. The high polarity imparted by multiple negative charges on Oregon
Green limits cell permeability, which can cause difficulties when using this fluorophore
for biological studies.
Figure 2.1. Structures of known (7, 16, and 25) and novel (26-28) fluorescent dyes in
their anionic form.

32
2.3 Tokyo Green
As a more hydrophobic alternative to fluorescein, recent pioneering work by
Urano, Nagano, and coworkers replaced the carboxylate of fluorescein with a methyl
group.4 This structural modification yielded a highly fluorescent monoanionic
fluorophore termed Tokyo Green (25, Figure 2.1). It had been originally thought that the
carboxylate of fluorescein was necessary for its fluorescence, because removal of the
carboxylate was shown to cause a reduction in quantum yield (Figure 2.2).5, 6
However,
when the carboxylate is replaced with a hydrogen, the molecule can achieve a planar
geometry. It was determined that the role of the carboxylate in fluorescein is to orient the
benzene moiety and the xanthene moiety of the fluorophore orthogonal to each other to
enhance fluorescene.7 Tokyo Green provides a new platform for the design of
fluorescent probes.
Figure 2.2. Replacing the carboxylate group of fluorescein with other substituents and
the effect of those substituents on fluorescence.

33
2.4 Design and Synthesis of Pennsylvania Green
Based on these precedents we designed and synthesized a novel fluorophore
termed Pennsylvania Green (26, Figure 2.1). This fluorophore melds the pH-insensitivity
and photostability of Oregon Green with the hydrophobicity of Tokyo Green. To
demonstrate the utility of the Pennsylvania Green fluorophore, we compared cellular
membrane probes derived from 4-carboxy Tokyo Green (27) and 4-carboxy Pennsylvania
green (28). The lower pKa of the Pennysylvania Green-derived probe was found to
enable visualization of early / recycling endosomes within living mammalian cells, and
this fluorophore provides a usful tool for analysis of these and related acidic intracellular
compartments.
2.4.1 Synthesis of a Difluoroxanthone Fluorophore Precursor
The synthesis of 4-carboxy-Pennsylvania Green (27) was accomplished in 10-
steps from commercially available 1,2,4-trifluoro-5-nitrobenzene (Figure 2.3, 30). As
shown in Figure 2.3, 1-amino-2,4-dimethoxy-5-fluorobenzene (32) was prepared via 31
by a previously reported route,3 involving displacement of fluorine by methoxide and
subsequent reduction of the nitro group to afford compound 32. Subjection of 32 to
Sandmeyer conditions afforded the novel iodoarene 33. This compound (33) was
converted to the known8 benzophenone 34 in excellent yield using Larhed’s recently
reported9 microwave and cobalt octacarbonyl-mediated synthesis of diaryl ketones

34
followed by demethylation with boron tribromide to afford compound 35. The five-step
route to 35 shown in Figure 2.3 is significantly more rapid and efficient (40% overall
yield) than the previously reported8 convergent 8-step synthesis of this compound.
Cyclization at elevated temperature under precedented conditions afforded the known
xanthone 36.8
Figure 2.3. An improved synthesis of xanthone 36.
2.4.2 Synthesis of 4-Carboxy-Pennsylvania Green and 4-Carboxy-Tokyo Green
As shown in Figure 2.4, xanthone 36 and commercially available xanthone 37
were converted into the novel fluorophores 4-carboxy-Pennsylvania Green (28) and 4-
carboxy-Tokyo Green (27). Xanthones 36 and 37 were first protected using MEM-Cl
and NaH to afford compound 38 and 39. Halogen metal exchange with i-PrMgCl10
proved to be an efficient method for installation of the methyl benzoate moiety of 40 and

35
41. The methyl esters were removed via base mediated hydrolysis using LiOH to
provide the free carboxylic acid of both Pennsylvania Green (28) and Tokyo Green (27).
Figure 2.4. Synthesis of the 4-carboxy-Pennsylvania Green and 4-carboxy-Tokyo Green
fluorophores.
2.5 Photophysical Properties of Novel Fluorophores
The molecular structure of a compound uniquely defines all its physical, chemical
and biological properties. A study of the physical properties of fluorescent molecules
often leads to a better understanding of the relationship between molecular structure and
fluorescence. Some of these properties include pKa, quantum yield and hydrophilicity.

36
2.5.1 pKa Determination of Novel Fluorophores 40 and 41
To examine the effects of substitution with fluorine, pKa values of 4-carboxy-
Pennsylvania Green methyl ester (40) and 4-carboxy-Tokyo Green methyl ester (41)
were determined by absorbance vs. pH titrations. Titrations were done in citrate or
phosphate buffers ranging in pH from 2 to 8. As shown in Figure 2.5, these experiments
revealed that the Pennsylvania Green derivative is identical in pKa to Oregon Green (pKa
= 4.8) and 1.4 pKa units more acidic than the corresponding Tokyo Green derivative
(pKa = 6.2). This lower pKa should render Pennsylvania Green less pH sensitive in
acidic cellular compartments.

37
Figure 2.5. Absorbance versus pH titrations of 40 (panel A) and 41 (panel B) used to
determine pKa values (panel C). Overlaid emission spectra (panels A and B) are in
arbitrary units.
2.5.2 Quantum Yield Determination of Novel Fluorophores
Quantum yield is a term used in fluorescence spectroscopy to define the effiency
with which a compound converts light absorbed to emitted light. If a compound absorbs
light and emits nothing (i.e. dark), then the quantum yield is zero. If every photon
absorbed results in photon emitted, the quantum yield is one.

38
Figure 2.6. Fluorescence vs. absorbance plots used to determine the relative quantum yields of 40 and 41 compared with fluorescein (7) and 5-carboxyfluorescein.
As shown in Figure 2.6, relative fluorescence quantum yields of fluorophores 40
and 41 were determined at pH 9.0 and pH 5.0 by the method of Williams et al.11
This
involves the use of well characterized standard samples with known quantum yields.
Solutions of the standard and the sample with identical absorbance at the same excitation
wavelength can be assumed to be absorbing the same number of photons. Hence a
simple ratio of the integrated fluorescence intensities will yield the ratio of the quantum

39
yields. Fluorescein (7) and 5-carboxyfluorescein were used as standards in these
experiments. At pH 9.0, both the Pennsylvania Green (40) and Tokyo Green (41)
fluorophores were very similar with quantum yields of 0.91 and 0.93 respectively.
However, as predicted by the differences in pKa, at pH 5.0 the more acidic Pennsylvania
Green derivative (40) was substantially brighter with a quantum yield of 0.68 compared
with 0.39 for the the Tokyo Green (41) derivative.
Table 2.1. Comparison of physicochemical properties of known (7,16,25)3, 4
and novel
(40, 41) fluorophores. Q.Y.: Quantum yield.
Compound abs / em pKa Q.Y. (pH)
Fluorescein (7) 490 / 514 6.5 0.92 (9)
Oregon Green (16) 490 / 514 4.8 0.97 (9)
Tokyo Green (25) 491 / 510 6.2 0.85 (13)
4-Carboxy-Pennsylvania Green
methyl ester (40) 496 / 517 4.8
0.91 (9)
0.68 (5)
4-Carboxy-Tokyo Green methyl ester (41) 496 / 517 6.2 0.93 (9)
0.39 (5)
Table 2.1 shows that 4-carboxy-Pennsylvania Green methyl ester (40) has
favorable properties when compared to other similar fluorophores. It posesses a low pKa
rendering it pH-insensitive and it has a high quantum yield in both basic and slightly
acidic solutions. These properties make Pennsylvania Green an interesting new
fluorophore for the construction of molecular probes.

40
2.6 Membrane Probes Derived from Pennsylvania Green and Tokyo Green
Two novel membrane probes (45 and 46) were synthesized by Dr. Siwarutt
Boonyarattanakalin to compare Pennsylvania Green and Tokyo Green in a cellular
environment. These probes were prepared by coupling fluorophores 27 and 28 to the
known12
3β-cholesterylamine derivative 42 using DCC and NHS to afford 43 and 44,
followed by removal of 3β -nosyl protecting groups with K2CO3 and thiophenol (Figure
2.7). Related compounds comprising fluorophores linked to N-alkyl-3β-
cholesterylamines have previously been shown to localize on the exofacial leaflet of
plasma membranes and within acidic intracellular endosomes of living mammalian
cells.12
N-Alkyl-3β-cholesterylamines can rapidly cycle between these two cellular
destinations, similar to many natural cell surface receptors.13

41
Figure 2.7. Synthesis of molecular probes of mammalian plasma membranes and
intracellular endosomes.
Living Jurkat lymphocytes treated with molecular probes 45 and 46 were
examined by confocal laser scanning microscopy. This human T-cell line was treated
with the compounds for 1 h, gently centrifuged and washed to remove unincorporated
probes, and cellular fluorescence was imaged as shown in Figure 2.8. These experiments
revealed that both compounds could be observed on the cellular plasma membrane and
provide novel markers that define the cell surface. However, only the Pennsylvania Green
probe (45) exhibited bright fluorescence in intracellular compartments (compare panels A
and B in Figure 2.8). These compartments were identified as early and recycling

42
endosomes by colocalization with internalized red fluorescent transferrin protein (Figure
2.9).14
The higher pKa of Tokyo Green results in substantial fluorescence quenching of
46 in the acidic environment of endosomes (pH ≤ 6.5).15
This was confirmed by
treatment with 46 and the specific vacuolar H+ ATPase inhibitor Bafilomycin A1,
16
which by blocking acidification of endosomes, increased the intracellular fluorescence of
46 (Figure 2.8, panel C).
Figure 2.8. Confocal laser scanning (left) and differential interference contrast (right)
micrographs of living Jurkat lymphocytes. Cells were treated with probes 45 and 46 (10
µM) in RPMI media for 1 h at 37 °C and washed with fresh media prior to analysis by
microscopy. In panel C, cells were treated with 45 (10 µM) and the vacuolar H+ ATPase
inhibitor Bafilomycin A1 (1 µM) to prevent acidification of endosomes. White arrows
illustrate intracellular endosomal fluorescence. Scale bar = 10 µm.

43
Figure 2.9. Intracellular localization of the Pennsylvania Green probe 45 in early and
recycling endosomes. Jurkat lymphocytes were treated with 45 (10 µM) and transferrin-
AlexaFluor633 (Invitrogen, 0.42 µM) at 37 °C for 1 h, cells were washed with media, and
imaged by confocal laser scanning and DIC (lower left) microscopy. Red fluorescence of
internalized transferrin is shown on the upper left. Green fluorescence of 45 is shown on
the upper right. Colocalization of green and red fluorescence is shown in yellow on the
lower right. Scale bar = 10 µm
2.7 Photobleaching of Membrane Probes
In addition to its lower pKa, a second advantage of Oregon Green compared with
fluorescein relates to enhanced photostability conferred by fluorination.3 To examine
whether Pennsylvania Green is similar to Oregon Green and more photostable than
Tokyo Green, Jurkat lymphocytes treated with probes 45 and 46 were subjected to
continuous irradiation with the Ar-ion laser (488 nm) of a confocal microscope. As
shown in Figure 2.10 the rate of photobleaching for Pennsylvania Green probe 45 is

44
much less than the Tokyo Green probe 46. After 60 seconds of irradiation it is evident
that probe 45 exhibits greater fluorescence.
Figure 2.10. Representative examples of photobleaching of molecular probes added to
living Jurkat lymphocytes as imaged by confocal laser scanning microscopy. Cells were
treated with the Pennsylvania Green probe 45 or the Tokyo Green probe 46 (10 µM, 1 h,
37 °C), washed with fresh media, and imaged by confocal microscopy while subjected to continuous irradiation at 488 nm with a
25 mW argon-ion laser (1% laser power). Images were acquired at the time points shown. Scale bar = 10 µm.
The fluorescence decay of individual cells due to photobleaching was quantified
and application of a single exponential function allowed calculation of the half-lives of
these fluorescent probes (Figure 2.11). This analysis revealed that the Pennsylvania
Green probe 45 is substantially more photostable (t1/2 = 49 min) compared to the Tokyo
Green probe 46 (t1/2 = 29 min). The Pennsylvania Green fluorophore thus has the

45
potential to provide a valuable new tool for the construction of molecular and cellular
probes.
Figure 2.11. Analysis of photobleaching rates of molecular probes added to living Jurkat lymphocytes. Cells were treated with 44 or
45 (10 µM, 1 h, 37 °C), washed with fresh media, and imaged by confocal microscopy while subjected to continuous irradiation at 488
nm with a 25 mW argon-ion laser at 1% laser power. At specific time points, the fluorescence intensity of five individual cells was
quantified and averaged. Fluorescence half-lives were calculated with a one-site exponential decay model.
2.8 Conclusions
As a more hydrophobic, photostable and less pH-sensitive alternative to
fluorescein, we designed and synthesized the Pennsylvania Green fluorophore. This
bright, monoanionic fluorophore is structurally related to both Oregon Green and Tokyo
Green. Comparison of membrane probes comprising N-alkyl-3β-cholesterylamine linked
to 4-carboxy Tokyo Green (pKa = 6.2) and 4-carboxy Pennsylvania Green (pKa = 4.8)
revealed that only Pennsylvania Green was highly fluorescent in acidic early and
recycling endosomes within living mammalian cells, suggesting that this new fluorophore
could be used to create useful probes of cellular biology.

46
2.9 Experimental Section
2.9.1 General
Chemical reagents were obtained from Acros, Aldrich, Alfa Aesar, or TCI
America. Solvents were from EM Science. Media and antibiotics were purchased from
Mediatech. Commercial grade reagents were used without further purification unless
otherwise noted. Anhydrous solvents were obtained after passage through a drying
column of a solvent purification system from GlassContour (Laguna Beach, CA). All
reactions were performed under an atmosphere of dry argon or nitrogen. Reactions were
monitored by analytical thin-layer chromatography on plates coated with 0.25 mm silica
gel 60 F254 (EM Science). TLC plates were visualized by UV irradiation (254 nm) or
stained with a solution of phosphomolybdic acid and sulfuric acid in ethanol (1:1:20).
Flash column chromatography employed ICN SiliTech Silica Gel (32-63 µm).
Purification by preparative reverse phase HPLC employed an Agilent 1100 preparative
pump / gradient extension instrument equipped with a Hamilton PRP-1 (polystyrene-
divinylbenzene) reverse phase column (7 µm particle size, 21.5 mm x 25 cm). The HPLC
flow rate was increased from 10 mL/min (t = 0 min) to 20 mL/min (t = 2 min) and
maintained at 20 mL/min for the remainder of the run unless otherwise noted. Melting
points were measured with a Thomas Hoover capillary melting point apparatus and are
uncorrected. Infrared spectra were obtained with a Perkin Elmer 1600 Series FTIR.
NMR spectra were obtained with Bruker CDPX-300, DPX-300, AMX-360, DRX-400, or

47
AMX-2-500 instruments with chemical shifts reported in parts per million (ppm, δ)
referenced to either CDCl3 (1H 7.27 ppm;
13C 77.23 ppm), DMSO-d6 (
1H, 2.50 ppm;
13C,
39.51 ppm), (CH3)4Si (1H, 0 ppm), or F3CCOOH (
19F, -76.55 ppm). High-resolution mass
spectra were obtained from the Pennsylvania State University Mass Spectrometry Facility
(ESI and CI). Peaks are reported as m/z.
2.9.2 Synthetic Procedures and Compound Characterization Data
33
1-Fluoro-5-iodo-2,4-dimethoxybenzene (33)
A solution of 1-amino-2,4-dimethoxy-5-fluorobenzene (32, 170 mg, 0.99 mmol,
prepared as previously reported3) in aqueous HCl (0.3 M, 3 mL) was chilled to 0 °C in an
ice-salt bath and treated with a cold solution of sodium nitrite (102 mg, 1.49 mmol) in
deionized H2O (2 mL). This solution was stirred for 30 min followed by the addition of
NaI (442 mg, 2.97 mmol). The solution was allowed to warm to 23 °C over 16 h,
neutralized with aqueous NaOH (2 M, 3 mL), and extracted with ethyl acetate (3 x 25
mL). The organic extract was washed with saturated aqueous NaCl, dried over
anhydrous Na2SO4, and the solvent was removed in vacuo. Flash column

48
chromatography (hexanes / ethyl acetate, 7:3) afforded 33 (190 mg, 68% yield) as a
brown oil; 1H NMR (300 MHz, CDCl3) δ 7.42 (d, J = 10.2 Hz, 1H), 6.47 (d, J = 7.3 Hz,
1H), 3.88 (s, 3H), 3.84 (s, 3H); 13
C NMR (75 MHz, CDCl3) 154.8, 154.7, 148.4, 148.2,
148.1, 145.2, 125.6, 125.3, 97.9, 97.8, 72.1, 72.0, 56.9, 56.4; 19
F NMR (282 MHz,
CDCl3) -142.9; IR (film) νmax 3004, 2942, 2846, 1599, 1503, 1028 cm-1
; HRMS (TOF
ESI+) m/z 281.9550 (M+, C8H8O2FI requires 281.9553).
34
Bis-(5-fluoro-2,4-dimethoxy-phenyl)-methanone (34)
To 1-fluoro-5-iodo-2,4-dimethoxybenzene (33, 620 mg, 2.2 mmol) in dry
acetonitrile (10 mL) was added Co2(CO)8 (496 mg, 1.4 mmol). The solution was placed
in a sealed reaction vessel and evolution of gas was observed. The sealed vessel was
subjected to microwave irradiation using a Panasonic kitchen microwave oven (1000 W,
model #NN-L7288A) for 20 s. The acetonitrile was removed in vacuo, the residue was
redissolved in ethyl acetate (20 mL), washed with water (20 mL), and dried over
anhydrous Na2SO4. The solvent was removed in vacuo. Flash column chromatography
(hexanes / ethyl acetate, 1:1) afforded 34 (360 mg, 96% yield), as a white solid, mp 142-
144 °C; 1H NMR (300 MHz, CDCl3) δ 7.35 (d, J = 11.5 Hz, 2H), 6.55 (d, J = 6.7 Hz,
2H), 4.01 (s, 6H), 3.73 (s, 6H); 13
C NMR (75 MHz, CDCl3) 190.8, 155.6, 155.5, 150.9,
150.8, 147.9, 144.7, 121.9, 121.8, 117.7, 117.4, 97.7, 56.4, 56.3; 19
F NMR (282 MHz,
CDCl3) -145.7; IR (film) νmax 3073, 2954, 2836, 1612, 1461 cm-1
; HRMS (TOF ESI+)
m/z 339.1044 (MH+, C17H16O5F2 requires 339.1038).

49
39
3,6-Bis-(2-methoxy-ethoxymethoxy)-xanthen-9-one (39)
A solution of 3,6-dihydroxy-xanthen-9-one (37, 1.00 g, 4.3 mmol) in dry THF
(100 mL) was chilled to 4 °C in an ice bath and treated with NaH (526 mg, 21.9 mmol).
The mixture was stirred for 30 min followed by the addition of 2-methoxyethoxymethyl
chloride (MEM-Cl, 2.5 mL, 21.9 mmol). The solution was allowed to warm to 23 °C
over 16 h. Aqueous citric acid (50 mL, 1 M) was added followed by extraction with ethyl
acetate (3 x 100 mL). The organic layer was washed with saturated aqueous NaCl and
dried over anhydrous Na2SO4. The solvent was removed in vacuo. Flash column
chromatography (hexanes / CH2Cl2 / ethyl acetate, 1:1:0.5) afforded 39 (1.215 g, 70%
yield), as a white solid, mp 106-108 °C; 1H NMR (300 MHz, CDCl3) δ 8.03 (d, J = 8.8
Hz, 2H), 6.93 (d, J = 7.8 Hz, 2H), 6.87 (dd, J = 8.4, 5.7 Hz, 2H) 5.24 (s, 4H), 3.71 (m,
4H) 3.45 (m, 4H), 3.23 (s, 6H); 13
C NMR (75 MHz, CDCl3) 175.9, 162.5, 158.1, 128.5,
116.9, 114.3, 103.5, 93.7, 71.8, 68.5, 59.4; IR (film) νmax 3077, 2900, 1781, 1610, 1442
cm-1
; HRMS (TOF ESI+) m/z 405.1549 (MH+, C21H24O8 requires 405.1537).

50
26
2,7-difluoro-6-hydroxy-9-(2-methylphenyl)-3H-xanthen-3-one (26, Pennsylvania
Green)
To a flame-dried Schlenk flask flushed with argon, 2-iodotoluene (141 µL, 1.1
mmol), dry THF (5 mL), and i-PrMgCl (560 µL, 1.1 mmol) were added. The solution
was stirred at 23 °C for 2 h. 2,7-Difluoro-3,6-bis-(2-methoxy-ethoxymethoxy)-xanthen-9-
one (38, 100 mg, 0.21 mmol) was added and the reaction was stirred at 23 °C for an
additional 16 h. The reaction was quenched by addition of MeOH (5 mL) and solvent
was removed in vacuo. The resulting residue was redissolved in CH2Cl2 (10 mL), treated
with TFA (0.5 mL) and stirred at 23 °C for 2 h. The solvent was removed in vacuo, and
the residue was purified by flash column chromatography (MeOH / CH2Cl2 , 1:20) to
afford 26 (59 mg, 79%) as an orange solid, mp > 280 °C; 1H NMR (300 MHz, CD3OD) δ
7.48-7.31 (m, 3H), 7.16 (d, J = 7.4 Hz, 1H), 6.87 (d, J = 4.7 Hz, 2H) 6.72 (d, J = 10.8
Hz, 2H), 1.96 (s, 3H); 13
C NMR (75 MHz, CD3OD) 165.7, 156.5, 156.3. 156.1, 152.7,
137.3, 133.2, 132.1, 131.6, 130.1, 127.6, 116.4, 116.5, 113.4, 113.1, 106.3, 19.6; 19
F
NMR (282 MHz, CD3OD) –131.4; IR (CH2Cl2) νmax 3057, 2976, 1711, 1598, 1255 cm-1
;
HRMS (TOF ESI+) m/z 339.0833 (MH+, C20H12O3F2 requires 339.0843).

51
40
4-(2,7-Difluoro-6-hydroxy-3-oxo-3H-xanthen-9-yl)-3-methyl-benzoic acid methyl
ester (40, 4-carboxy-Pennsylvania Green methyl ester)
To a flame-dried Schlenk flask flushed with argon, methyl 4-iodo-3-methyl
benzoate (173 mg, 0.62 mmol) and dry THF (5 mL) was added. This solution was cooled
to -20 °C, i-PrMgCl (310 µL, 0.62 mmol) was added, and the solution stirred at -20 °C
for 2 h. 2,7-difluoro-3,6-bis-(2-methoxy-ethoxymethoxy)-xanthen-9-one (15, 100 mg,
0.21 mmol) was added and the reaction was allowed to warm to 23 °C over 16 h. The
reaction was quenched by the addition of MeOH (5 mL) and solvent was removed in
vacuo. The resulting residue was redissolved in CH2Cl2 (10 ml), treated with TFA (0.5
mL) and stirred at 23 °C for 2 h. The solvent was removed in vacuo, and the residue was
purified by flash column chromatography (MeOH / CH2Cl2, 1:20) to afford 17 (60 mg,
72%) as a red solid, mp 220-224 °C; 1H NMR (400 MHz, DMSO-d6) δ 8.05 (s, 1H), 7.97
(d, J = 7.8 Hz, 1H), 7.42 (d, J = 7.8 Hz, 1H) 6.82 (d, J = 6.7 Hz, 2H), 6.62 (d, J = 11.1
Hz, 2H), 3.91 (s, 3H), 2.08 (s, 3H); 13
C NMR (75 MHz, DMSO-d6) 165.8, 153.2, 150.3,
148.88, 148.80, 148.7, 136.6, 136.5, 131.3, 130.8, 129.5, 127.0, 113.8, 111.3, 111.1,
105.1, 104.7, 52.3, 18.9; 19
F NMR (282 MHz, DMSO-d6) -135.5; IR (KBr) νmax 3467,
2999, 1797, 1710, 1211 cm-1
; HRMS (TOF ESI+) m/z 397.0888 (MH+, C22H14O5F2
requires 397.0884).

52
41
4-(6-Hydroxy-3-oxo-3H-xanthen-9-yl)-3-methyl-benzoic acid methyl ester (41, 4-
carboxy-Tokyo Green methyl ester)
To a flame-dried Schlenk flask flushed with argon, methyl 4-iodo-3-methyl
benzoate (325 mg, 1.18 mmol) and dry THF (10 mL) was added. This solution was
cooled to -20 °C, i-PrMgCl (590 µL, 1.18 mmol) was added, and the solution was stirred
at -20 °C for 2 h. Xanthone 39 (175 mg, 0.39 mmol) was added and the reaction was
allowed to warm to 23 °C over 16 h. The reaction was quenched by the addition of
MeOH (10 mL) and solvent was removed in vacuo. The resulting residue was dissolved
in CH2Cl2 (25 mL), TFA (1.0 mL) was added, and the mixture was stirred at 23 °C for 2
h. The solvent was removed in vacuo and the residue was purified by flash column
chromatography (MeOH / CH2Cl2, 1:20) to afford 41 (115 mg, 82%) as a red solid, mp
208-210 °C; 1H NMR (400 MHz, DMSO-d6) δ 8.07 (s, 1H), 7.99 (dd, J1 = 7.8, J2 = 1.8
Hz, 1H), 7.45 (d, J = 7.9, 1H) 6.99 (d, J = 9.2, 2H), 6.82 (d, J = 2.0, 2H), 6.77 (dd, J1 =
9.1, J2 = 2.1 Hz, 2H) 3.91 (s, 3H), 2.02 (s, 3H); 13
C NMR (75 MHz, DMSO-d6) 173.4,
166.2, 157.7, 154.2, 137.07, 137.00, 131.4, 131.3, 131.2, 129.9, 127.1, 121.8, 115.2,
103.4, 52.5, 19.2; IR (KBr) νmax 3073, 1766, 1604, 1197 cm-1
; HRMS (TOF ES+) m/z
361.1076 (MH+, C22H16O5 requires 361.1073).

53
28
4-(2,7-Difluoro-6-hydroxy-3-oxo-3H-xanthen-9-yl)-3-methyl-benzoic acid (28, 4-
carboxy-Pennsylvania Green)
To 4-carboxy-Pennsylvania Green methyl ester (40, 75 mg, 0.18 mmol) in
MeOH/H2O (3:2, 10 mL) was added aqueous LiOH (2.0 mL, 1 M). The red solution
turned bright orange and was stirred for 1 h. The MeOH was removed in vacuo and the
remaining aqueous solution was acidified with aqueous HCl (5.0 mL, 1 M). The
resulting precipitate was filtered and dried in vacuo to afford 28 as an orange solid (68
mg, 99%) mp > 280 °C; 1H NMR (400 MHz, D2O/NaOD, 9:1) δ 8.10 (s, 1H), 7.96 (d, J
= 7.1 Hz, 1H), 6.94 (d, J = 7.81 Hz, 1H), 6.60 (d, J = 6.9 Hz, 2H), 6.38 (d, J = 11.3 Hz,
2H), 2.00 (s, 3H); 13
C NMR (75 MHz, D2O/NaOD, 9:1) 174.6, 172.2, 172.1, 157.4,
156.9, 155.66, 155.62, 154.9, 139.8, 136.2, 135.6, 129.2, 111.1, 110.5, 110.4, 106.5,
104.5, 20.1; 19
F NMR (282 MHz, D2O/NaOD) –131.8 IR (KBr) νmax 3461, 3075, 2946,
1648, 1536, 1211 cm-1
; HRMS (TOF ESI+) m/z 405.0550 (MNa+, C21H12O5F2 requires
405.0537).

54
27
4-(6-Hydroxy-3-oxo-3H-xanthen-9-yl)-3-methyl-benzoic acid (27, 4-carboxy-Tokyo
Green)
To 4-carboxy-Tokyo Green methyl ester (41, 74 mg, 0.21 mmol) in MeOH/H2O
(3:2, 10 mL) was added aqueous LiOH (2.0 mL, 1 M). The red solution turned bright
orange and was stirred for 1 h. The MeOH was removed in vacuo and the remaining
aqueous solution was acidified with aqueous HCl (5 mL, 1 M). The resulting precipitate
was filtered and dried in vacuo to afford 27 as an orange solid (72 mg, 99%) mp > 280
°C; 1H NMR (400 MHz, D2O/NaOD, 9:1) δ 8.02 (s, 1H), 7.93 (d, J = 7.3 Hz, 1H), 7.39
(d, J = 7.5 Hz, 1H) 6.79 (d, J = 7.9 Hz, 2H), 6.58 (m, 4H), 2.03 (s, 3H); 13
C NMR (75
MHz, D2O/NaOD, 9:1) 182.4, 174.9, 159.2, 155.9, 138.7, 136.5, 136.0, 132.0, 131.1,
129.4, 127.5, 124.7, 111.8, 105.1, 19.6; IR (KBr) νmax 3507, 2944, 1708, 1598, 1212 cm-
1; HRMS (TOF ES+) m/z 347.0919 (MH
+, C21H14O5 requires 347.0918).

55
43
N-[4-(2,7-difluoro-6-hydroxy-3-oxo-3H-xanthen-9-yl)-3-methylbenzoyl]-β-alanyl-N-
(3-{(3β)-cholest-5-en-3-yl[(2-nitrophenyl)sulfonyl]amino}propyl)-β-alaninamide (43)
To 4-carboxy-Pennsylvania Green (28, 49 mg, 0.13 mmol) in THF (20 mL) was
added DCC (32 mg, 0.15 mmol) and N-hydroxysuccinimide (30 mg, 0.26 mmol)
followed by stirring at 23 °C for 2 h. The precipitated urea was removed by filtration and
the solvent was removed in vacuo to afford the corresponding Pennsylvania Green
succinimidyl ester. t-Butyl 3-({3-[(3-{(3β)-cholest-5-en-3-yl[(2-nitrophenyl) sulfonyl]
amino} propyl)amino]-3-oxopropyl}amino)-3-oxopropyl carbamate (40.9 mg, 0.047
mmol, prepared as previously reported12
) was treated with TFA in CH2Cl2 (2:25, 10 mL).
After 6 h at 23 °C, TLC (MeOH / CH2Cl2, 1:25) revealed conversion to the more polar
primary amine (42). Aqueous NaOH (1 M, 10 mL) was added, the mixture was extracted
with CH2Cl2 (2 x 10 mL), the organic extracts were combined, dried over anhydrous
Na2SO4, and solvent was removed in vacuo. DMSO (4 mL) was added followed by the
Pennsylvania Green succinimidyl ester (22 mg, 0.057 mmol) and K2CO3 (15.6 mg, 0.113
mmol). After 24 h at 23 °C, the reaction mixture was filtered and the product was
purified by preparative reverse-phase HPLC (gradient: 69.9% MeCN, 30% H2O, and
0.1% TFA to 99.9% MeCN, 0% H2O, and 0.1% TFA over 22 min; retention time = 20.8
min (215 nm)) to afford 43 (28.4 mg, 67%) as an orange-yellow solid, mp 83-85 °C; 1H

56
NMR (500 MHz, DMF-d7) δ 8.92 (br s, 2H), 8.76 (t, J= 5.6 Hz, 1H), 8.29 (t, J= 5.9 Hz,
1H), 8.14-8.05 (m, 2H), 8.00 (br s, 1H), 7.49 (d, 1H), 6.90 (br s, 2H), 6.74 (s, 1H), 6.72
(s, 1H), 5.44 (d, J = 5.4 Hz, 1H), 5.44 (d, J = 3.7 Hz, 1H), 3.80-3.17 (m, 10H), 2.62-2.52
(m, 3H), 2.40 (t, J = 7.0 Hz, 2H), 2.17 (s, 3H), 2.05-1.76 (m, 8H), 1.61-0.89 (m, 23H),
0.92 (d, J = 6.4 Hz, 3H), 0.86 (d, J = 1.9 Hz, 3H), 0.85 (d, J = 1.9 Hz, 3H), 0.67 (s, 3H);
13C NMR (126 MHz, DMF-d7) δ 171.4 (x 2), 166.5, 164.0, 150.0, 149.9, 149.8, 148.7,
141.4, 137.1, 136.8, 135.5, 135.1, 133.9, 133.0, 130.9, 130.3, 130.0, 125.8, 125.0, 122.2,
105.9, 59.6, 57.2, 56.7, 50.7, 42.8, 42.7, 40.2, 40.0, 38.3, 38.3, 37.3, 37.2, 37.1, 36.7,
36.5, 36.3, 32.8, 32.4, 32.3, 28.7, 28.4, 27.5, 28.7, 28.4, 27.5, 24.7, 24.3, 23.0, 22.7, 21.5,
19.5, 19.0, 12.1; 19
F NMR (282 MHz, CDCl3) -128.3; IR (film) νmax 3295, 2946, 1645,
1614, 1544, 1373, 1311, 1193 cm-1
; ESI+ m/z 1134.5437 (MH+, C63H78N5O10SF2 requires
1134.5
44
N-[4-(6-hydroxy-3-oxo-3H-xanthen-9-yl)-3-methylbenzoyl]-β-alanyl-N-(3-{(3β)-
cholest-5-en-3-yl[(2-nitrophenyl)sulfonyl]amino}propyl)-β-alaninamide (44)
To 4-carboxy-Tokyo Green (27, 61.5 mg, 0.17 mmol) in THF (25 mL) was added
DCC (44 mg, 0.21 mmol) and N-hydroxysuccinimide (41 mg, 0.35 mmol) followed by

57
stirring at 23 °C for 2 h. The precipitated urea was removed by filtration and the solvent
removed in vacuo to afford the Tokyo green succinimidyl ester. Tert-butyl 3-({3-[(3-{(3
β)-cholest-5-en-3-yl [(2-nitrophenyl) sulfonyl] amino}propyl)amino]-3-
oxopropyl}amino)-3-oxopropyl carbamate (29.4 mg, 0.034 mmol, prepared as previously
reported12
) was treated with TFA in CH2Cl2 (2:25, 10 mL). After 6 h at 23 °C, TLC
(MeOH / CH2Cl2, 1:25) revealed conversion to the more polar primary amine (42).
Aqueous NaOH (1 M, 10 mL) was added, the mixture was extracted with CH2Cl2 (2 x 10
mL), the organic extracts were combined, dried over anhydrous Na2SO4, and solvent was
removed in vacuo. DMSO (4 mL) was added followed by the Tokyo Green succinimidyl
ester (12 mg, 0.027 mmol) and K2CO3 (11.2 mg, 0.081 mmol). After 24 h at 23 °C, the
reaction mixture was filtered and the product was purified by preparative reverse-phase
HPLC (gradient: 72.9% MeCN, 27% H2O, and 0.1% TFA to 99.9% MeCN, 0% H2O, and
0.1% TFA over 22 min; retention time = 21.1 min (215 nm)) to afford 44 (19.1 mg,
64.3%) as an orange-yellow solid, mp 78-80 °C; 1H NMR (500 MHz, CD3OD) δ 8.05-
7.97 (m, 3H), 7.91 (d, J = 8.0 Hz, 1H), 7.82-7.70 (m, 6H), 7.40 (d, J = 7.9 Hz, 1H), 7.37
(d, J = 8.8 Hz, 1H), 7.20-7.00 (m, 3H), 5.23 (br s, 1 H), 5.18 (br s), 3.70 (t, J = 6.4 Hz,
2H), 3.56-3.32 (m, 7H), 3.24-3.14 (m, 5H), 2.59-2.38 (m, 5H), 2.27-1.20 (m, 18H), 1.17-
0.88 (m, 16H), 0.87 (br s, 3H), 0.86 (br s, 3H), 0.69 (s, 3H); 13
C NMR (126 MHz,
CD3OD) 174.0, 173.8, 172.2, 169.1, 160.5, 149.5, 149.4, 141.7, 138.0, 137.6, 136.1,
135.3, 134.6, 133.4, 133.1, 131.6, 131.5, 130.8, 130.5, 126.2, 125.4, 123.1, 117.2, 101.2,
61.5, 60.3, 58.0, 57.5, 51.6, 43.5, 43.1, 41.0, 40.7, 39.5, 38.7, 38.0, 37.7, 37.3, 37.1, 36.7,
36.5, 33.2, 33.0, 32.9, 32.8, 29.3, 29.1, 28.4, 25.3, 24.9, 23.2, 22.9, 22.1, 19.8, 19.2, 14.4,

58
12.3; IR (film) νmax 3417, 1661, 1634, 1544, 1373, 1202, 1198 cm-1
; ESI+ m/z
1098.5659 (MH+, C63H80N5O10S requires 1098.5626).
45
N-[4-(2,7-difluoro-6-hydroxy-3-oxo-3H-xanthen-9-yl)-3-methylbenzoyl]-β-alanyl-N-
{3-[(3β)-cholest-5-en-3-ylamino]propyl}-β-alaninamide (45)
To a slurry of N-[4-(2,7-difluoro-6-hydroxy-3-oxo-3H-xanthen-9-yl)-3-
methylbenzoyl]-β-alanyl-N-(3-{(3 β)-cholest-5-en-3-yl[(2-nitrophenyl) sulfonyl]amino}
propyl)-β-alaninamide (43, 23.4 mg, 0.021 mmol) and K2CO3 (15.9 mg, 0.144 mmol) in
DMF (5 mL) was added thiophenol (76 µL, 0.619 mmol). After 24 h at 23 °C, solids
were removed by filtration and solvent was removed in vacuo. The crude product was
dissolved in DMSO (4 mL) and purified by preparative reverse-phase HPLC (gradient:
59.9% MeCN, 40% H2O, and 0.1% TFA to 99.9% MeCN, 0% H2O, and 0.1% TFA over
30 min; retention time = 9.2 min (215 nm)) to afford 45 (16.1 mg, 82.6%) as an orange-
yellow solid, mp 139-140 °C; 1H NMR (500 MHz, DMF-d7) δ 8.92 (br s, 2H), 8.76 (t, J =
5.6 Hz, 1H), 8.29 (t, J = 5.9 Hz, 1H), 8.14-8.05 (m, 2H), 8.00 (br s, 1H), 7.49 (d, J = 7.9
Hz, 1H), 6.90 (br s, 2H), 6.74 (s, 1H), 6.72 (s, 1H), 5.44 (d, J = 5.4 Hz, 1H), 5.44 (d, J =
3.7 Hz, 1H), 3.71-3.67 (m, 2H), 3.47-3.00 (m, 8H), 2.61-2.50 (m, 4H), 2.43 (t, J = 6.8
Hz, 2H), 2.18 (s, 3H), 2.08-1.05 (m, 25H), 1.03-0.95 (m, 5H), 0.93 (d, J = 6.5 Hz, 3H),

59
0.87 (d, J = 1.8 Hz, 3H), 0.86 (d, J = 1.7 Hz, 3H), 0.69 (s, 3H); 13
C NMR (126 MHz,
DMF-d7) 172.7, 171.5, 166.6, 163.6, 159.6, 154.5, 150.0, 139.6, 137.1, 136.7, 135.6,
130.3, 130.0, 125.8, 123.4, 115.0, 112.1, 112.0, 58.2, 57.2, 56.7, 50.5, 42.8, 42.7, 40.2,
40.0, 37.5, 37.3, 37.2, 36.7, 36.5, 36.4, 36.3 (x 2), 35.5, 32.3, 32.2, 28.6, 28.4, 27.3, 25.4,
24.6, 24.3 (x 2), 23.0, 22.7, 21.4, 19.5, 19.3, 19.0, 12.0; 19
F NMR (282 MHz, DMF-d7) -
132.7; IR (film) νmax 3267, 2925, 1672, 1648, 1607, 1542, 1308, 1191, 1138 cm-1
; ESI+
m/z 949.5651 (MH+, C57H75N4O6F2 requires 949.5655).
46
N-[4-(6-hydroxy-3-oxo-3H-xanthen-9-yl)-3-methylbenzoyl]-β-alanyl-N-{3-[(3β)-
cholest-5-en-3-ylamino]propyl}-β-alaninamide (46)
To a slurry of N-[4-(6-hydroxy-3-oxo-3H-xanthen-9-yl)-3-methylbenzoyl]-β-
alanyl-N-(3-{(3β) -cholest-5-en-3-yl [(2-nitrophenyl) sulfonyl]amino} propyl)-β
alaninamide (44, 16.1 mg, 0.015 mmol) and K2CO3 (14.2 mg, 0.103 mmol) in DMF (5
mL) was added thiophenol (54 µL, 0.440 mmol). After 24 h at 23 °C, solids were
removed by filtration and solvent was removed in vacuo. The crude product was
dissolved in DMSO (4 mL) and purified by preparative reverse-phase HPLC (gradient:
54.9% MeCN, 45% H2O, and 0.1% TFA to 64.9% MeCN, 35% H2O, and 0.1% TFA to
99.9% MeCN, 0% H2O, and 0.1% TFA over 22 min; retention time = 11.7 min (215 nm))

60
to afford 46 (12.8 mg, 95.7%) as an orange-yellow solid, mp 127-129 °C; 1H NMR (500
MHz, DMF-d7) δ 8.96 (br s, 2H), 8.76 (t, J = 5.5 Hz, 1H), 8.29 (t, J = 5.7 Hz, 1H), 8.10-
8.07 (m, 2H), 8.00 (br s, 1H), 7.49 (d, J = 7.9 Hz, 1H), 7.07 (s, 1H), 7.05 (s, 1H), 6.87-
6.81 (m, 4H), 5.44 (d, J = 3.8 Hz, 1H), 3.71-3.67 (m, 2H), 3.48-3.44 (m, 2H), 3.34-3.30
(m, 2H), 3.21 (br s, 2H), 3.11 (br s, 1H), 2.61-2.50 (m, 4H), 2.43 (t, J = 6.8 Hz, 2H), 2.15
(s, 3H), 2.10-1.86 (m, 6H), 1.87-1.72 (m, 2H), 1.60-1.32 (m, 9H), 1.31-1.06 (m, 9H),
1.02 (s, 3H), 1.01-0.95 (m, 2H), 0.93 (d, J = 6.5 Hz, 3H), 0.87 (d, J = 1.8 Hz, 3H), 0.86
(d, J = 1.7 Hz, 3H), 0.69 (s, 3H); 13
C NMR (126 MHz, DMF-d7) 174.6, 172.7, 171.5,
166.6, 157.9, 152.5, 139.6, 137.1, 136.6, 136.0, 131.3, 130.1, 130.0, 125.6, 123.4, 122.5,
115.8, 104.1, 58.2, 57.2, 56.7, 50.5, 42.8 (x 2), 40.2, 40.0, 37.5, 37.3, 37.2, 36.7, 36.5 (x
2), 36.4, 36.3 (x 2), 32.3, 32.2, 28.6, 28.4 (x 2), 27.3, 25.4, 24.6, 24.3, 23.0, 22.7, 21.4,
19.5, 19.3, 19.0, 12.1; IR (film) νmax 3425, 2931, 1684, 1681, 1650, 1196, 1132; ESI+
m/z 913.5851 (MH+, C57H77N4O6 requires 913.5843).
2.9.3 Assays and Protocols
Measurement of pKa values. The absorbance values of compounds 40 and 41 as
a function of pH were obtained with a Cary-Varian 500 Scan UV-Vis NIR
spectrophotometer. Sodium phosphate buffer (0.1 M, Na2HPO4 and NaH2PO4) was used
at pH ≥ 5 and citrate buffer (0.05 M, citric acid and trisodium citrate dihydrate) was used
at lower pH values. Compounds were diluted from a 100 µM stock solution comprising
10% DMSO in H2O into buffer solutions to obtain a final concentration of 10 µM

61
compound in buffer containing 1% DMSO. Absorbance values from 300-800 nm were
measured with a 1 cm path-length quartz cuvette. The absorbance at 494 nm was plotted
versus pH, and pKa values were calculated by non-linear regression methods (GraphPad
Prism 3.0 software).
Determination of quantum yields. Quantum yields for 4-carboxy-Pennsylvania
Green methyl ester (40) and 4-carboxy-Tokyo Green methyl ester (41) were determined
at pH 9.0 and pH 5.0 in sodium phosphate buffer (0.1 M Na2HPO4 and NaH2PO4) using a
PTi MD-5020 fluorimeter. Samples in buffer were excited at 494 nm and the integrated
fluorescence emission (505 nm to 550 nm) was quantified (a 1 cm path length quartz
cuvette was used). This was repeated with increasing concentrations of sample (1 nM to
8 nM at pH 9.0 and 40 nM to 100 nM at pH 5.0). Fluorescein (Q.Y. = 0.92 at pH 9) and
5-carboxyfluorescein (Q.Y. = 0.92 at pH 9) were used as standards. The integrated
fluorescence intensity was plotted against the maximum absorbance of the sample at the
concentration studied as extrapolated from absorbance measurements at higher
concentrations. Linear least squares fitting of the data (including a zero intercept)
determined the slope, which is proportional to the quantum yield of the samples.
Fluorescein and 5-carboxyfluorescein were cross-calibrated to insure that the
experimentally measured quantum yields match literature values within ± 10%. Quantum
yields were calculated with the following equation using an average of the values from
fluorescein and 5-carboxyfluorescein as the standard:
Φx = Φst(Gradx/Gradst)(η2
x/η2
st)

62
Φst represents the quantum yield of the standard, and Φx represents the quantum
yield of the unknown, Grad is the slope of the best linear fit, and η is the refractive index
of the solvent used (the refractive index ratio of standard and sample was unity in these
measurements because the same buffer was used for each measurement).
Cell culture. Jurkat lymphocytes (human acute T-cell leukemia, ATCC #TIB-
152) were maintained in Roswell Park Memorial Institute (RPMI) 1640 media
supplemented with Fetal Bovine Serum (FBS, 10%), penicillin (100 units / mL), and
streptomycin (100 µg / mL). RPMI media used for cell culture and wash steps contained
antibiotics and FBS unless otherwise noted.
Microscopy. A Zeiss LSM 5 Pascal confocal laser-scanning microscope fitted
with a Plan Apochromat objective (63 X) was employed. Fluorophores were excited with
the 488 spectral line of a 25 mW Argon ion laser and emitted photons were collected
through a 505 nm LP filter. Transferrin-Alexa Fluor 633 was excited with the 633
spectral line of a HeNe laser and emitted photons were collected through a 650 nm LP
filter
Treatment of Jurkat lymphocytes with molecular probes. To Jurkat
lymphocytes (7 x 10⁵) in RPMI media (0.5 mL) was added 45 or 46 (final concentration
= 10 µM, 1% DMSO). These cells were incubated at 37 °C for 1 h to load the green
probes into cellular plasma membranes and intracellular endosomes. The cells were

63
washed with RPMI media (0.5 mL) to remove unincorporated receptor / DMSO,
resuspended in fresh media (200 µL), and analyzed by confocal microscopy. For the
inhibition of endosomal acidification experiment shown in Figure 3, panel C, cells were
pre-treated with Bafilomycin A1 (1 µM, Sigma) for 1 h, cells were further treated with 46
(10 µM) for an additional 1 h in media containing Bafilomycin A1 (1 µM), and cells
were washed and analyzed by microscopy as previously described.
Quantification of photobleaching rates. Jurkat lymphocytes were treated with
45 or 46 (10 µM) for 1 h, washed with RPMI media (0.5 mL), and resuspended in fresh
RPMI media (200 µL). Cells were imaged on a coverslip in media (30 µL) under constant
irradiation at 488 nm using the Ar-ion laser of the confocal microscope (1% laser power)
for up to 360 seconds. Micrographs of cells were collected after 0, 10, 20, 30, 40, 50, 60,
80, 100, 120, 180, 240, 300, and 360 seconds of laser exposure. The green fluorescence
of five individual cells as a function of time was quantified using the Zeiss LSM5 Pascal
software. A one-site exponential decay model was employed to calculate half-lives of the
fluorophores.
2.10 References
1. Sjoback, R.; Nygren, J.; Kubista, M., Absorption and Fluorescence Properties of
Fluorescein. Spectrochimica Acta Part A. 1995, 51, (6), L7-L21.

64
2. Song, L. L.; Hennink, E. J.; Young, I. T.; Tanke, H. J., Photobleaching Kinetics of
Fluorescein in Quantitative Fluorescence Microscopy. Biophys. J. 1995, 68, (6), 2588-
2600.
3. Sun, W. C.; Gee, K. R.; Klaubert, D. H.; Haugland, R. P., Synthesis of fluorinated
fluoresceins. J. Org. Chem. 1997, 62, (19), 6469-6475.
4. Urano, Y.; Kamiya, M.; Kanda, K.; Ueno, T.; Hirose, K.; Nagano, T., Evolution
of fluorescein as a platform for finely tunable fluorescence probes. J. Am. Chem. Soc.
2005, 127, (13), 4888-4894.
5. Lindqvist, L.; Lundeen, G., Radiationless Transitions in Xanthene Dyes. Journal
of Chemical Physics. 1966, 44, 1711-1712.
6. Fink, D. W.; Willis, C. R., Structure and Internal Mixing in Xanthene Dyes.
Journal of Chemical Physics. 1970, 53, 4720-4722.
7. Urano, Y.; Kamiya, M.; Kanda, K.; Ueno, T.; Hirose, K.; Nagano, T., Evolution
of fluorescein as a platform for finely tunable fluorescence probes. J. Am.Chem. Soc.
2005, 127, (13), 4888-4894.
8. Chen, C. A.; Yeh, R. H.; Lawrence, D. S., Design and synthesis of a fluorescent
reporter of protein kinase activity. J. Am. Chem. Soc. 2002, 124, (15), 3840-3841.

65
9. Enquist, P. A.; Nilsson, P.; Larhed, M., Ultrafast chemistry: Cobalt carbonyl-
mediated synthesis of diaryl ketones under microwave irradiation. Org. Lett. 2003, 5,
(25), 4875-4878.
10. Knochel, P.; Dohle, W.; Gommermann, N.; Kneisel, F. F.; Kopp, F.; Korn, T.;
Sapountzis, I.; Vu, V. A., Highly functionalized organomagnesium reagents prepared
through halogen-metal exchange. Angew. Chem. Int. Ed. 2003, 42, (36), 4302-4320.
11. Williams, A. T.; Winfield, S. A., Relative Fluorescence Quantum Yields Using a
Computer-controlled Luminescence Spectrometer. Analyst. 1983, 108, 1067-1071.
12. Boonyarattanakalin, S.; Martin, S. E.; Dykstra, S. A.; Peterson, B. R., Synthetic
mimics of small mammalian cell surface receptors. J. Am. Chem. Soc. 2004, 126, (50),
16379-16386.
13. Peterson, B. R., Synthetic mimics of mammalian cell surface receptors: prosthetic
molecules that augment living cells. Org. Biomol. Chem. 2005, 3, (20), 3607-3612.
14. Sheff, D.; Pelletier, L.; O'Connell, C. B.; Warren, G.; Mellman, I., Transferrin
receptor recycling in the absence of perinuclear recycling endosomes. J. Cell. Biol. 2002,
156, (5), 797-804.

66
15. Maxfield, F. R.; McGraw, T. E., Endocytic recycling. Nat. Rev. Mol. Cell. Biol.
2004, 5, (2), 121-132.
16. Yoshimori, T.; Yamamoto, A.; Moriyama, Y.; Futai, M.; Tashiro, Y.,
Bafilomycin A1, a specific inhibitor of vacuolar-type H(+)-ATPase, inhibits acidification
and protein degradation in lysosomes of cultured cells. J. Biol. Chem. 1991, 266, (26),
17707-17712.

67
Chapter 3
A Concise Synthesis of the Pennsylvania Green Fluorophore and Labeling of
Intracellular Targets with O6-Benzylguanine Derivatives
3.1 Introduction
As we have shown in the previous chapter, fluorescent molecular probes can be
powerful tools in the study of cellular biology. The classic green fluorophore fluorescein
(7, Figure 3.1)1 and related derivatives have been widely employed to label proteins,
2
nucleic acids,3 carbohydrates,
4 lipids,
5 and small molecules.
6 Fluorescein and its 5- and 6-
carboxy derivatives are typically easily synthesized7 and exhibit high quantum yields at
neutral and basic pH (QY=0.928). However, the high pKa (6.5) of these dyes renders the
quantum yield quite sensitive to pH fluctuations observed under physiological conditions
such as the environment in acidic endosomal compartments (pH ~ 5 to 6). As we have
seen previously, the limitations of many fluorescein derivatives include a relatively high
susceptibility to photobleaching9 and limited cell permeability
10 due to the predominant
dianionic charge state of 7 at physiological pH (7.4).1
To provide a more hydrophobic, less pH-sensitive, and more photostable analogue
of fluorescein, we synthesized a fluorophore termed Pennsylvania Green (26, Figure
3.1).11
This new fluorophore and its 4-carboxy analogue (27) incorporate structural
elements from the previously reported fluorophores Oregon Green12
and Tokyo Green.13
However, the availability of 4-carboxy-Pennsylvania Green as a building block for the

68
construction of molecular probes was limited by our previously described 10-step
synthesis from 1,2,4-trifluoro-5-nitrobenzene and 16% overall yield. To overcome this
limitation, we designed an improved synthesis of 4-carboxy-Pennsylvania Green (27) that
requires only three steps, affords a 32% overall yield, employs less expensive 4-iodo-3-
methyl-benzoic acid methyl ester as the starting material, and allows preparation of gram
quantities of this fluorophore. To further characterize the biological properties of
derivatives of Pennsylvania Green, fluorescent molecular probes 47 and 48 derived from
O6-benzylguanine (Figure 3.1) were investigated.
Figure 3.1. Structures of fluorophores and molecular probes in ionization states observed
at physiological pH.

69
3.2 Synthesis of Fluorescein and Related Derivatives
Fluorescein derivatives are typically synthesized by condensation of 1,3-
dihydroxybenzene (49, resorcinol) with phthalic anhydride (50) under acidic conditions
at relatively high temperatures (Figure 3.2A).7, 14
To prepare pure isomers of 5- and 6-
carboxyfluorescein on large scale, Burgess reported the synthesis of isomeric methane
sulfonic esters (52 and 53) that can be readily separated by recrystallization (Figure 3.2B)
and subsequently converted to 5- and 6-carboxy fluorescein.7 Whereas these reactions
have been historically useful, the conditions tend to be fairly harsh and are not
compatable with sensitive functionality. As an alternative, Van Vranken demonstrated
that the fluorophore scaffold commonly used in metal-sensitive fluorescein derivatives
(fluo indicators) can be constructed by condensation of resorcinol with an aldehyde rather
than an anhydride in the presence of dilute methane sulfonic acid, followed by oxidative
cyclization with DDQ.15
These milder reaction conditions avoid the generation of isomers
and have the potential to allow access to a broader range of fluorophores.

70
Figure 3.2. Synthesis of fluorescein and carboxy-fluorescein derivatives.
3.3 Improved Synthesis of Pennsylvania Green
Based on the above precedents, we investigated the condensation of o-
methylbenzaldehyde (54) with 4-fluororesorcinol (55) as a concise method to synthesize
Pennsylvania Green (26). 4-Fluororesorcinol is commercially available, but we typically
prepare it on a 5 gram scale using the two step method of Vij and Shreeve.16
As seen in
Figure 3.3, condensation of 54 with 55 in the presence of 9% methane sulfonic acid gives
triarylmethane 56 in 83% yield. Initial attempts to prepare the the unmodified
Pennsylvania Green fluorophore (26) by oxidative cyclization with DDQ in
AcOH/benzene afforded 26 in 28% yield. Further optimization revealed that treatment of
56 with p-TsOH in refluxing toluene was more effective, providing 26 in 37% yield.

71
Figure 3.3. Concise synthesis of Pennsylvania Green.
3.4 Improved Synthesis of 4-Carboxy Pennsylvania Green
To prepare 4-carboxy Pennsylvania Green (27), commercially available 4-iodo-3-
methyl benzoic acid methyl ester (57) was employed (Figure 3.4). This aryl iodide (57)
was subjected to halogen-metal exchange using i-PrMgCl and subsequently formylated
with DMF in 95% yield.17
The resulting aldehyde (58) was condensed with 4-
fluororesorcinol (55) in 9% methane sulfonic acid to afford triarylmethane 59 in 88%
yield. Treatment of 59 with DDQ or chloranil did not afford the cyclic product,
presumably due to the influence of the electron withdrawing ester substituent. However,
refluxing in toluene with 20 equivalents of p-TsOH was found to promote cyclization;
subsequent base-promoted hydrolysis of the methyl ester in the same pot yielded the
desired product (27) in 38% yield. Although related one-pot methods for the synthesis of
fluorophores are known using concentrated methane sulfonic acid with ZnCl2 or ZnBr2,18,
19 similar attempts to combine aldehyde 58 with resorcinol 55 using various Lewis acids
generally lowered the yield or impeded purification of the final product.

72
Figure 3.4. Synthesis of 4-carboxy-Pennsylvania Green.
3.5 Snap-Tag Substrates
O6-Benzylguanine derivatives (SNAP-Tag substrates)
20 have been shown to
represent useful probes of cellular biology because they can be used to selectively
alkylate the DNA repair protein O6-alkylguanine-DNA alkyltransferase (AGT), enabling
covalent labeling of AGT fusion proteins (SNAP-Tag fusion proteins).21
The native
human AGT protein is a monomeric protein of 207 amino acids that reacts with aberrant
O6-alkyl guanine residues to repair this mutagenic lesion in DNA. As shown in Figure
3.5, X-ray crystallography has illuminated the molecular details of interactions of AGT
with modified guanine residues. Nucleophilic attack of cysteine-145 of human AGT on
alkylguanine derivatives repairs these modified guanines by transferring the alkyl group
to cysteine and liberating free guanine. This reaction specifically modifies AGT and is
not observed with other proteins. O6-benzylguanine derivatives are stable under
physiological conditions, and this approach can be used to label AGT fusion proteins
with fluorophores and other probes linked to O6-benzylguanine. This technology has been
improved and generalized by construction of mutants of AGT that increase the specificity
of AGT for O6-benzylguanines and that eliminate the DNA binding activity of this

73
protein.22
This method has been used to fluorescently label subcellular compartments in
mammalian cells,23
follow receptor trafficking,24
detect AGT fusion proteins in SDS
PAGE gels,25
and immobilize proteins on solid support.26
Figure 3.5. X-ray structure of human AGT bound to O6-methylguanine on DNA (Panel
A, pdb code 1T38) and mechanism of covalent labeling of AGT fusion proteins with O6-
benzylguanine-fluorophores (Panel B).
3.6 Synthesis of Pennsylvania Green O6-benzylguanine Probes
Molecular probes 47 and 48 were prepared by acylation of the commercially
available O6-benzylguanine derivative 62
20 with N-hydroxysuccinimimdyl ester
derivatives of 4-carboxy-Pennsylvania Green (60)11
and commercially available 5-
carboxy-Oregon Green (61) (Figure 3.6). These structurally similar AGT substrates were
prepared to examine differences in cellular permeability resulting from substitution of the

74
carboxylate of 47 with the methyl substituent of 48. Previous studies of AGT fusion
proteins expressed within mammalian cells have reported that the efficiency of labeling is
critically dependent on the cell-permeability of the substrate.23
Figure 3.6. Synthesis of molecular probes derived from O6-benzylguanine (47, 48).
To confirm that differences in cellular labeling do not result from changes in
physicochemical properties, the maximal aborbance (abs) and emission wavelengths
(em), molar extinction coefficients (ε) and quantum yield (Φ) of compounds (26, 27, 47,
and 48) were determined and these values are listed in table 3.1.
Compound abs/em (nm) ε (M-1
cm-1
) Φ (pH)
Fluorescein (7) 490/514 77,000 0.925 (9)
Pennsylvania Green (26) 494/514 82,000 0.91 (7.4)
4-carboxy-Pennsylvania
Green (27)
494/515 62,000 0.89 (7.4)
O6-Bezylgaunine-
Pennsylvania Green (47)
494/515 58,000 0.92 (7.4)
O6-Bezylgaunine-Oregon
Green (48)
494/522 73,000 0.97 (7.4)
Table 3.1. Physicochemical properties of fluorophores and fluorescent probes. Values
were determined in phosphate buffered saline (PBS) at pH 7.4.

75
3.7 Labeling of Intracellular Targets with Molecular Probes
The ability of probes 47 and 48 to efficiently label intracellular targets in Chinese
hamster ovary (CHO) cells was examined. To accomplish this objective, CHO cells were
transiently transfected with commerically available plasmid vectors (Covalys
Biosciences) that express AGT targeted to distinct subcellular locations. To image the
plasma membrane, AGT was expressed fused to the CAAX sequence from the Ras
protein, which is associated with the inner leaflet of the cellular plasma membrane.22
Conversely, AGT was expressed fused to nuclear histone 2B (H2B) protein to promote
localization in the cell nucleus.23
CHO cells transiently expressing AGT fusion proteins were treated with
molecular probes and analyzed by confocal laser scanning microscopy. As shown in
Figure 3.7, only the Pennsylvania Green derivative 47 (5 µM, 1 h treatment) was capable
of clearly labeling the cellular plasma membrane upon expression of the AGT-CAAX
fusion protein. Under identical conditions, the Oregon Green probe 48 showed only
punctate fluorescence throughout the cytoplasm of the subset of transfected cells
(compare panels A and C of Figure 3.7). Transient transfection of CHO cells with the
nuclear localized AGT-H2B fusion protein revealed strong nuclear fluorescence upon
treatment with 47 (5 µM, 1 h), but only weak nuclear fluorescence upon treatment with
48 under these conditions (compare panels B and D of Figure 3.7).

76
Figure 3.7. Confocal laser scanning and differential interference contrast (DIC)
micrographs of CHO cells expressing AGT fusion proteins and treated with probes 47
and 48. CAAX: C-terminal peptide derived from the Ras protein that associates with the
inner leaflet of the plasma membrane. H2B: Nuclear-localized histone 2B protein.
Molecular probes were added at 5 µM for 1 h at 37 °C. Scale bar = 10 µm
3.8 Conclusions
Our results demonstrate that subtle molecular substitution of the carboxylate of
Oregon Green for the methyl group of Pennsylvania Green can profoundly enhance the
cellular permeability and consequent biological activity of O6-benzylguanine derivatives.
The facile synthesis of Pennsylvania Green requires only three steps, affords a 32%
overall yield, employs less expensive 4-iodo-3-methyl-benzoic acid methyl ester as the
starting material, and allows preparation of gram quantities of this fluorophore. This

77
fluorophore and derivatives as reported here, have the potential to facilitate studies of
cellular biology requiring cell permeable and pH insensitive green fluorescent molecular
probes.
3.9 Experimental section
3.9.1 General
Chemical reagents were obtained from Acros, Aldrich, or TCI America. Solvents
were from EM Science. Tissue culture reagents were obtained from Valley Biomedical
Inc., Mediatech, BD Biosciences, and Gibco. Commercial grade reagents were used
without further purification unless otherwise noted. Anhydrous solvents were obtained
after passage through a drying column of a solvent purification system from
GlassContour (Laguna Beach, CA). All reactions were performed under an atmosphere of
dry argon or nitrogen. Reactions were monitored by analytical thin-layer chromatography
on plates coated with 0.25 mm silica gel 60 F254 (EM Science). TLC plates were
visualized by UV irradiation (254 nm and 365 nm) or stained with a solution of
phosphomolybdic acid and sulfuric acid in ethanol (1:1:20). Flash column
chromatography employed ICN SiliTech Silica Gel (32-63 µm). Purification by
preparative reverse-phase HPLC employed an Agilent 1100 preparative pump / gradient
extension instrument equipped with a Hamilton PRP-1 (polystyrene-divinylbenzene)
column (7 µm particle size, 21.5 mm x 25 cm). The HPLC flow rate was increased from

78
15 mL/min (t = 0 min) to 25 mL/min (t = 2 min) and maintained at 25 mL/min for the
remainder of the run unless otherwise noted. Melting points were measured with a
Thomas Hoover capillary melting point apparatus and are uncorrected. Infrared spectra
were obtained with a Perkin Elmer 1600 Series FTIR. NMR spectra were obtained with
Bruker CDPX-300, DPX-300, AMX-360, or DRX-400 instruments with chemical shifts
reported in parts per million (ppm, δ) referenced to either CDCl3 (1H 7.27 ppm;
13C 77.23
ppm) or CD3OD (1H, 4.78 ppm;
13C, 49.0 ppm). High-resolution mass spectra were
obtained from the Pennsylvania State University Mass Spectrometry Facility (ESI and
CI). Peaks are reported as m/z.
3.9.2 SNAP-tag labeling
Labeling of AGT fusion proteins expressed in Chinese hamster ovary (CHO)
cells. The CHO-K1 cell line (ATCC# CCL-61) was cultivated in F-12K medium
supplemented with 10% FBS, 100 units/mL penicillin and 0.1 mg/mL streptomycin.
Cells were propagated in a humidified 5% CO2 incubator at 37 °C. The day before
transient transfection, exponentially growing cells (1 x 10⁵ cells/well) were seeded on
collagen-coated glass coverslips in a 6-well plate. The cells were transfected using
FuGene (Roche), according to the manufacturer's instructions, using a plasmid / FuGene
ratio of 1:3 for pSEMXT-26M-CaaX and 2:3 for pSEMXT-H2B-26M (AGT expression
vectors provided by Covalys Biosciences). The cells were incubated for an additional 24
h to allow expression of AGT fusion proteins, cells were washed twice with growth
media (2 mL) and compounds 4 or 5 (5 µM) were added for 1 h at 37 °C. Cells were

79
rinsed twice with fresh growth media (2 mL) followed by incubation for an additional 30
min in the presence of fresh media (2 mL) to allow diffusion of any unbound
fluorophores from cells. Cells were rinsed again with media (2 mL) before imaging of
live cells by confocal laser scanning and differential interference contrast (DIC)
microscopy.
3.9.3 Fluorescence Imaging
An inverted Zeiss LSM 5 Pascal confocal laser-scanning microscope fitted with a
Plan Apochromat oil-immersion objective (63 X) was employed. Fluorophores were
excited with the 488 spectral line of an argon ion laser (25 mW, 1% laser power) and
emitted photons were collected through a 505 nm LP filter. For cellular imaging,
coverslips bearing living cells were carefully removed from the 6-well plate and mounted
on microscope slides bearing a press-to-seal silicone isolator filled with cell culture
medium to preserve viability during the course of the experiment.
3.9.4 Synthetic procedures and compound characterization data
56
4,4'-[(2-methylphenyl)methylene]bis(6-fluorobenzene-1,3-diol)

80
4-Fluororesorcinol (55, 100 mg, 0.78 mmol, prepared as described in Yang, J. J. et al.
Heteroatom Chem. 1998, 9, 229-239) and 2-methylbenzaldehyde (54, 43 µL, 0.37 mmol)
were dissolved in CH2Cl2 / ether (1:1, 4 mL). Methanesulfonic acid (400 µL) was added
and the reaction was stirred at 23 °C for 16 h. The solution was diluted with ether (5
mL), poured into saturated aqueous NaHCO3 (10 mL) and extracted with ethyl acetate (2
x 20 mL). The combined organic extracts were rinsed with saturated aqueous sodium
chloride (50 mL) and dried over anhydrous sodium sulfate. Flash column
chromatography (CH2Cl2 / MeOH, 9:1) afforded 56 as a tan solid (109 mg, 83%). m.p.
130-132 °C; 1H NMR (300 MHz, DMSO-d6) δ 8.90 (bs, 4H), 7.10-7.03 (m, 3H), 6.70 (m,
1H), 6.45 (d, J = 7.9 Hz, 2H), 6.21 (d, J = 12.4 Hz, 2H), 5.28 (s, 1H), 2.08 (s, 3H); 13
C
NMR (75 MHz, DMSO-d6) 150.8, 145.7, 143.1, 142.9, 142.77, 142.74, 135.9, 130.0,
127.6, 125.8, 125.4, 120.1, 120.0, 116.2, 115.9, 104.5, 19.0; IR (film) νmax 3320, 2925
cm-1
; HRMS (TOF ES-) m/z 357.0932 (MH–, C20H16O4F2 requires 357.0938).
.
26
2,7-difluoro-6-hydroxy-9-(2-methylphenyl)-3H-xanthen-3-one (26)
4,4'-[(2-Methylphenyl)methylene]bis(6-fluorobenzene-1,3-diol) (56, 50 mg, 0.14 mmol)
and p-TsOH (212 mg, 1.12 mmol) were dissolved in dry toluene (14 mL, 0.01 M) and
heated to reflux (111 °C) in a Dean Stark apparatus for 24 h. After cooling to 23 °C, the
solution was neutralized with aqueous KOH (2 M) to pH = 7. The solution was acidified
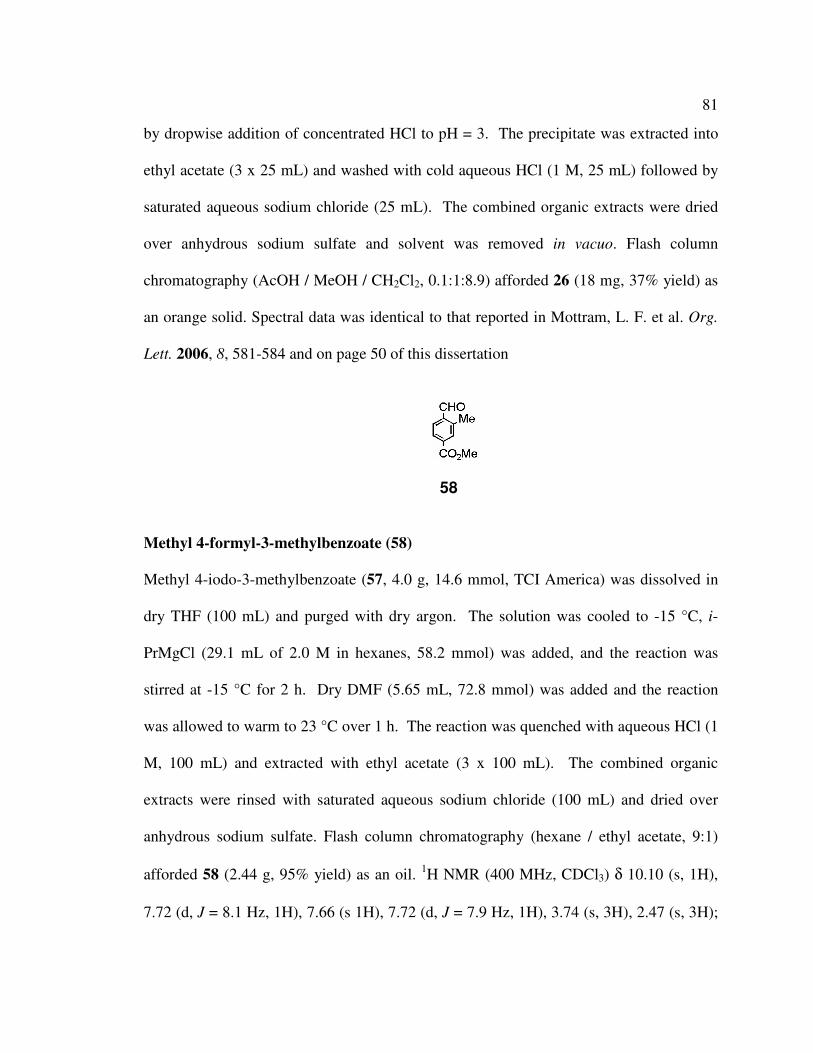
81
by dropwise addition of concentrated HCl to pH = 3. The precipitate was extracted into
ethyl acetate (3 x 25 mL) and washed with cold aqueous HCl (1 M, 25 mL) followed by
saturated aqueous sodium chloride (25 mL). The combined organic extracts were dried
over anhydrous sodium sulfate and solvent was removed in vacuo. Flash column
chromatography (AcOH / MeOH / CH2Cl2, 0.1:1:8.9) afforded 26 (18 mg, 37% yield) as
an orange solid. Spectral data was identical to that reported in Mottram, L. F. et al. Org.
Lett. 2006, 8, 581-584 and on page 50 of this dissertation
58
Methyl 4-formyl-3-methylbenzoate (58)
Methyl 4-iodo-3-methylbenzoate (57, 4.0 g, 14.6 mmol, TCI America) was dissolved in
dry THF (100 mL) and purged with dry argon. The solution was cooled to -15 °C, i-
PrMgCl (29.1 mL of 2.0 M in hexanes, 58.2 mmol) was added, and the reaction was
stirred at -15 °C for 2 h. Dry DMF (5.65 mL, 72.8 mmol) was added and the reaction
was allowed to warm to 23 °C over 1 h. The reaction was quenched with aqueous HCl (1
M, 100 mL) and extracted with ethyl acetate (3 x 100 mL). The combined organic
extracts were rinsed with saturated aqueous sodium chloride (100 mL) and dried over
anhydrous sodium sulfate. Flash column chromatography (hexane / ethyl acetate, 9:1)
afforded 58 (2.44 g, 95% yield) as an oil. 1H NMR (400 MHz, CDCl3) δ 10.10 (s, 1H),
7.72 (d, J = 8.1 Hz, 1H), 7.66 (s 1H), 7.72 (d, J = 7.9 Hz, 1H), 3.74 (s, 3H), 2.47 (s, 3H);

82
13C NMR (75 MHz, CDCl3) 191.4, 165.4, 139.9, 136.4, 133.4, 132.2, 130.9, 126.7, 51.9,
18.7; IR (film) νmax 2927, 2848, 2740, 1724, 1690 cm-1
; HRMS (TOF ESI+) m/z
179.0716 (MH+, C9H10O3 requires 179.0708).
59
Methyl 4-[bis(5-fluoro-2,4-dihydroxyphenyl)methyl]-3-methylbenzoate (59)
4-Fluororesorcinol (1.0 g, 7.8 mmol, prepared as described in Yang, J. J. et al.
Heteroatom Chem. 1998, 9, 229-239) and methyl 4-formyl-3-methylbenzoate (58, 658
mg, 3.7 mmol) were dissolved in dry CH2Cl2 / dry Et2O (1:1, 40 mL). Distilled
methanesulfonic acid (4.0 mL) was added and the reaction was stirred at 23 °C for 6 h.
The solution was diluted with ether (20 mL) and poured into saturated aqueous NaHCO3
(100 mL). Concentrated aqueous HCl was added dropwise until pH = 3. The solution
was extracted with ethyl acetate (3 x 20 mL) and dried over anhydrous sodium sulfate.
Flash column chromatography (MeOH / CH2Cl2, 1:9) afforded 59 (1.34 g, 88% yield) as
a tan solid. m.p. 132-136 °C; 1H NMR (300 MHz, CD3OD) δ 8.18 (s, 1H), 8.12 (d, J =
7.9 Hz, 1H), 7.30 (d, J = 8.0 Hz, 1H), 6.85 (d, J = 7.6 Hz, 2H), 6.71 (d, J = 11.2 Hz, 2H),
6.37 (s, 1H), 4.25 (s, 3H), 2.55 (s, 3H); 13
C NMR (75 MHz, CD3OD) 168.4, 150.7,
148.6, 147.1, 144.0, 143.2, 143.0, 137.5, 131.5, 128.2, 127.7, 127.0, 120.6, 120.5, 116.8,

83
116.5, 104.9, 39.8, 19.2; IR (film) νmax 3412, 2960, 1689 cm-1
; HRMS (TOF AP+) m/z
417.1156 (MH+, C22H18O6F2 requires 417.1150).
27
4-(2,7-Difluoro-6-hydroxy-3-oxo-3H-xanthen-9-yl)-3-methyl-benzoic acid (27, 4-
carboxy-Pennsylvania Green)
Methyl 4-[bis(5-fluoro-2,4-dihydroxyphenyl)methyl]-3-methylbenzoate (59) (100 mg,
0.24 mmol) and p-TsOH (0.91 g, 4.8 mmol) were dissolved in dry toluene (24 mL) and
heated to reflux (111 °C) in a Dean Stark apparatus for 24 h. The reaction was cooled to
23 °C, aqueous KOH (2 M) was added until pH = 10, and the reaction was stirred at 23
°C for 1 h. After hydrolysis of the methyl ester was complete as evidenced by TLC,
concentrated aqueous HCl was added dropwise until pH = 3. This solution was extracted
with ethyl acetate (3 x 25 mL), and the organic layers were washed with ice-cold HCl (1
M, 25 mL) followed by saturated aqueous sodium chloride (25 mL). The combined
organic extracts were dried over anhydrous sodium sulfate and solvent was removed in
vacuo. Flash column chromatography (AcOH / MeOH / CH2Cl2, 0.1:1:8.9) afforded 27
(34.8 mg, 38% yield) as an orange solid. Spectral data was identical to that reported in
Mottram, L. F. et al. Org. Lett. 2006, 8, 581-584.

84
60
1 -{[4 -(2, 7-difluoro-6-hydroxy-3-oxo-3H-xanthen-9-yl) -3 methyl benzoyl] oxy}
pyrrolidine -2,5- dione (60, 4-carboxy-Pennsylvania Green NHS ester)
4-Carboxy-Pennsylvania Green (27, 49 mg, 0.13 mmol), DCC (32 mg, 0.15
mmol) and N-hydroxysuccinimide (30 mg, 0.26 mmol) were dissolved in dry THF (20
mL). After stirring for 4 h at 23 °C, the urea byproduct was removed by filtration. The
solution was concentrated in vacuo. Flash column chromatography (MeOH / CH2Cl2,
1:9) afforded 60 (55 mg, 89% yield) as an orange solid. m.p. 225-230 °C; 1H NMR (300
MHz, DMSO-d6) δ 8.25 (s, 1H), 8.13 (d, J = 7.7 Hz, 1H), 7.55 (d, J = 7.9 Hz, 1H), 6.79
(d, J = 6.8 Hz, 2H), 6.73 (d, J = 11.1 Hz, 2H), 2.92 (s, 4H), 2.12 (s, 3H); 13
C NMR (75
MHz, DMSO-d6) 172.8, 170.3, 161.6, 1504.1, 153.5, 150.7, 148.2, 138.9, 137.7, 132.1,
130.2, 127.9, 125.7, 113.5, 113.4, 111.4, 111.1, 105.1, 26.6, 18.9; IR (film) νmax 3413,
2923, 1735, 1647, 1192 cm-1
; HRMS (TOF ES-) 478.0758 m/z (MH–, C25H14O7F2N
requires 478.0738). The 1H NMR spectrum (400 MHz) of 60 in CD3OD / D2O / NaOD
(99:0.7:0.3) is shown in Figure S3.

85
47
N-(4-{[(2-amino-9H-purin-6-yl)oxy]methyl}benzyl)-4-(2,7-difluoro-3,6-dihydroxy-
9H-xanthen-9-yl)-3-methylbenzamide (47)
A solution of 1-{[4-(2,7-difluoro-6-hydroxy-3-oxo-3H-xanthen-9-yl)-3-
methylbenzoyl]oxy}pyrrolidine-2,5-dione (60, 10 mg, 0.02 mmol) in DMF (1 mL) was
added to O6-[4-(aminomethyl)benzyl]guanine (62, 6.5 mg, 0.024 mmol, Covalys
Biosciences) and triethylamine (14 µL, 0.1 mmol) in DMF (500 µL). The reaction was
stirred at 23 °C for 16 h. The solvent was removed in vacuo. Purification by preparative
reverse-phase HPLC employed a linear gradient of water / acetonitrile (99:1 to 1:99 over
30 min, 0.1% TFA) to afford 47 as a orange solid (10.0 mg, 83%). m.p. > 280 °C; 1H
NMR (300 MHz, CD3OD) δ 8.25 (bs, 1H), 7.85 (s, 1H), 7.80 (d, J = 7.6 Hz, 1H), 7.45 (d,
J = 7.8 Hz, 2H), 7.53 (d, J = 8.1 Hz, 2H), 7.27 (d, J = 7.9 Hz, 1H), 6.83 (d, J = 7.1 Hz,
2H), 6.64 (d, J = 10.8 Hz, 2H), 5.47 (s, 2H), 4.47 (s, 2H), 2.02 (s, 3H); IR (film) νmax
3518, 3280, 2954, 1650 cm-1
; HRMS (TOF ESI+) m/z 657.1675 (MNa+, C34H24O5F2N6
requires 657.1644). Analysis of 47 by reverse phase HPLC is shown in Figure S1. The 1H
NMR spectrum (300 MHz) of 47 in CD3OD is shown in Figure S4.

86
Figure S1. Analytical reverse-phase HPLC of compound 47 after purification by
preparative reverse-phase HPLC (retention time = 14.69 min).
48
5-{[(4-{[(2-amino-9H-purin-6-yl)oxy]methyl}benzyl)amino]carbonyl}-2-(2,7-difluor
o-3,6-dihydroxy-9H-xanthen-9-yl)benzoate (48)
A solution of Oregon Green 488 carboxylic acid succinimidyl ester (61, 5 mg,
0.01 mmol, Invitrogen) in DMF (1 mL) was added to O6-[4-
(aminomethyl)benzyl]guanine (62, 3.2 mg, 0.012 mmol, Covalys Biosciences) and
triethylamine (7 µL, 0.05 mmol) in DMF (500 µL). The reaction was stirred at 23 °C for
16 h. The solvent was removed in vacuo. Purification by preparative reverse-phase HPLC
employed a linear gradient of water / acetonitrile (99:1 to 1:99 in 30 min, 0.1% TFA) to
Compound 47

87
afford 48 as a orange solid (6.3 mg, 95%). m.p. > 280 °C; 1H NMR (300 MHz, CD3OD)
δ 9.24 (t, J = 6.0 Hz, 1H), 8.37 (s, 1H), 8.14 (d, J = 8.0 Hz, 1H), 7.46 (d, J = 8.1 Hz, 2H),
7.36 (d, J = 7.9 Hz, 2H), 7.26 (d, J = 7.9 Hz, 1H), 6.74 (d, J = 7.5 Hz, 2H), 6.35 (d, J =
11.0 Hz, 2H), 5.55 (s, 2H), 4.51 (bs, 2H); HRMS (TOF ESI+) m/z 665.1596 (MNa+,
C34H22O7F2N6 requires 665.1577). Analysis of 48 by reverse phase HPLC is shown in
Figure S2. The 1H NMR spectrum (300 MHz) of 48 in CD3OD is shown in Figure S5.
Figure S2. Analytical reverse-phase HPLC of compound 48 after purification by
preparative reverse-phase HPLC (retention time = 16.25 min).
Compound 48

88
Figure S3. Proton NMR spectrum (400 MHz) of compound 60 in CD3OD / D2O / NaOD
(99:0.7:0.3).
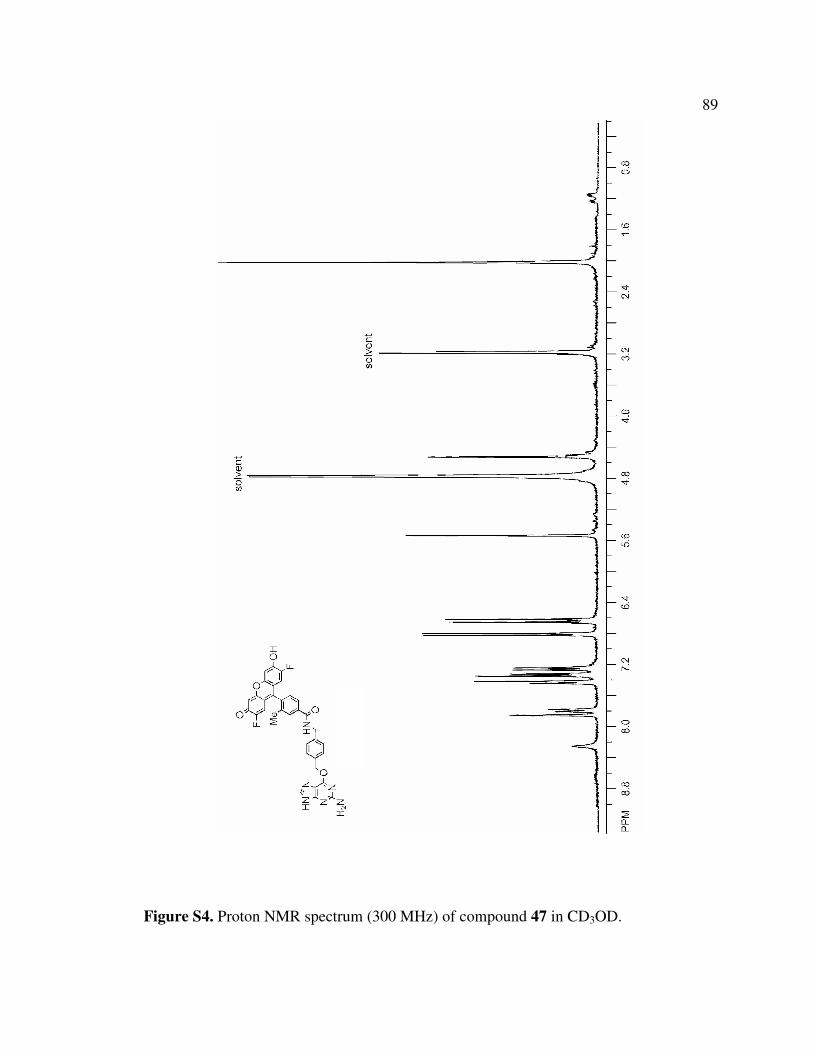
89
Figure S4. Proton NMR spectrum (300 MHz) of compound 47 in CD3OD.

90
Figure S5. Proton NMR spectrum (300 MHz) of compound 48 in CD3OD.

91
Determination of quantum yields.
Absorbance and emission spectra of compounds 26, 27, 47 and 48 were obtained with a
Cary 500 Scan UV-Vis-NIR spectrophotometer and PTi MD-5020 fluorimeter in
phosphate-buffered saline (PBS, pH 7.4, Figure S6). The quantum yields of compounds
26, 27, 47 and 48 were determined by the method of Williams, A. T. et al. (Analyst 1983,
108, 1067-1071, Figure S7). Samples were excited at 494 nm and the integrated
fluorescence emission (504 nm to 650 nm) was quantified (a 1 cm path length quartz
cuvette was used). This was repeated with increasing concentrations of sample (2 nM to
20 nM). Fluorescein (Φ = 0.92) and 5-carboxyfluorescein (Φ = 0.92) at pH = 9.0 were
used as standards. The integrated fluorescence emission at a given concentration was
plotted against the maximum absorbance of the sample at that concentration as
extrapolated from absorbance measurements at higher concentrations. Linear least
squares fitting of the data (including a zero intercept) was used to calculate the slope,
which is proportional to the quantum yield of the samples. Quantum yields were
calculated with the following equation using the average of the values measured for
fluorescein and 5-carboxyfluorescein as standards:
Φx = Φst(Gradx/Gradst)(η2
x/η2
st)
Φst represents the quantum yield of the standard, Φx represents the quantum yield
of the unknown, Grad is the slope of the best linear fit, and η is the refractive index of

92
the solvent used (the refractive index ratio of standard and sample was assumed to be
unity in these measurements because similar buffers were used for each measurement).
Determination of molar extinction coefficients (ε)
Beer’s Law plots of absorbance versus concentration were measured for compounds 26,
27, 47 and 48 in PBS (pH 7.4) with increasing concentrations of sample (0.1 µM to 2.0
µM). Absorbance values at 494 nm were determined for all samples. Linear least squares
fitting of the data (including a zero intercept) was used to determine the slope, which
corresponds to the extinction coefficient. Molar absorptivities (M-1
cm-1
) were calculated
using the following equation:
Absorbance = ε [concentration (M)] L, where L = path length = 1 cm
3.10 References
1. Sjoback, R.; Nygen, J.; Kubista, M., Spectrochimica Acta A. 1995, 51, L7-L21.
2. Giovannoni, L.; Lozzi, L.; Neri, D.; Neri, P., Highly fluorescent protein labeling
using dendritic peptide derivatives. J. Pept. Res. 2000, 55, (3), 195-202.
3. Cunningham, M.; Harris, M., The preparation of fluorescein-labeled nucleic acid
probes and their detection using alkaline phosphatase-catalyzed dioxetane
chemiluminescence. Methods Mol. Biol. 1996, 58, 53-63.

93
4. Ticha, M.; Kocourek, J., Fluorescein-labeled O-glycosyloxyalkenyl-
aminoalkenyl-acrylamide copolymers in lectin-saccharide binding studies. Carbohydr.
Res. 1991, 213, 339-343.
5. Axelsson, B.; Eriksson, H.; Borrebaeck, C.; Mattiasson, B.; Sjogren, H. O.,
Liposome immune assay (LIA). Use of membrane antigens inserted into labeled lipid
vesicles as targets in immune assays. J. Immunol. Methods. 1981, 41, (3), 351-363.
6. Lee, J.; Choi, J.; Cho, M., Fluorescein labeling of estrogen for application of
fluorescence polarization binding assays for antibody and receptor. Microchemical
Journal. 2001, 70, 229-238.
7. Ueno, Y.; Jiao, G.-S.; Burgess, K., Preparation of 5- and 6- carboxyfluorescein.
Synthesis. 2004, 15, 2591-2593.
8. Magde, D.; Wong, R.; Seybold, P. G., Fluorescence quantum yields and their
relation to lifetimes of rhodamine 6G and fluorescein in nine solvents: improved absolute
standards for quantum yields. Photochem. Photobiol. 2002, 75, (4), 327-334.
9. Song, L.; Hennink, E. J.; Young, I. T.; Tanke, H. J., Photobleaching kinetics of
fluorescein in quantitative fluorescence microscopy. Biophys. J. 1995, 68, (6), 2588-
2600.

94
10. Wu, M. M.; Llopis, J.; Adams, S. R.; McCaffery, J. M.; Teter, K.; Kulomaa, M.
S.; Machen, T. E.; Moore, H. P.; Tsien, R. Y., Studying organelle physiology with fusion
protein-targeted avidin and fluorescent biotin conjugates. Methods Enzymol. 2000, 327,
546-564.
11. Mottram, L. F.; Boonyarattanakalin, S.; Kovel, R. E.; Peterson, B. R., The
Pennsylvania Green Fluorophore: a hybrid of Oregon Green and Tokyo Green for the
construction of hydrophobic and pH-insensitive molecular probes. Org. Lett. 2006, 8, (4),
581-584.
12. Sun, W. C.; Klaubert, D. H.; Haugland, R. P., Fluorinated Fluoresceins. J. Org.
Chem. 1997, 62, 6469-6475.
13. Urano, Y.; Kamiya, M.; Kanda, K.; Ueno, T.; Hirose, K.; Nagano, T., Evolution
of fluorescein as a platform for finely tunable fluorescence probes. J. Am. Chem. Soc.
2005, 127, (13), 4888-4894.
14. Hollestz, T. M.; Knaf, A.; Reinhardt, R.; Chech, P., Synthesis and Application of
a New Fluorescein Derivative for Fluorescent Labelling of Oligonucleotides and as a
Novel Tool for Non-radioactive DNA Sequencing. Liebigs Ann. Chem. 1993, 10, 1051-
1056.

95
15. Bacci, J. P.; Kearney, A. M.; Van Vranken, D. L., Efficient two-step synthesis of
9-aryl-6-hydroxy-3H-xanthen-3-one fluorophores. J. Org. Chem. 2005, 70, (22), 9051-
9053.
16. Yang, J. J.; Su, D. B.; Vij, A.; Hubler, T.; Kirchmeier, R.; Shreeve, J., Preparation
of 4-fluororesorcinol. Heteroatom Chem. 1998, 9, 229-339.
17. Klis, T.; Serwatowski, J., Halogen-lithium exchange versus deprotonation:
synthesis of diboronic acids derived from aryl-benzyl ethers. . Org. Lett. 2007, 48, (7),
1169-1173.
18. Komatsu, H.; Iwasawa, N.; Citterio, D.; Suzuki, Y.; Kubota, T.; Tokuno, K.;
Kitamura, Y.; Oka, K.; Suzuki, K., Design and synthesis of highly sensitive and selective
fluorescein-derived magnesium fluorescent probes and application to intracellular 3D
Mg2+ imaging. J. Am. Chem. Soc. 2004, 126, (50), 16353-16360.
19. Lyttle, M. H.; Carter, T. G.; Cook, R. M., Org. Proc. Res. & Dev. 2001, 5, 45-49.
20. Keppler, A.; Kindermann, M.; Gendreizig, S.; Pick, H.; Vogel, H.; Johnsson, K.,
Labeling of fusion proteins of O6-alkylguanine-DNA alkyltransferase with small
molecules in vivo and in vitro. Methods. 2004, 32, (4), 437-444.

96
21. Krayl, M.; Guiard, B.; Paal, K.; Voos, W., Fluorescence-mediated analysis of
mitochondrial preprotein import in vitro. Anal. Biochem. 2006, 355, (1), 81-89.
22. Keppler, A.; Pick, H.; Arrivoli, C.; Vogel, H.; Johnsson, K., Labeling of fusion
proteins with synthetic fluorophores in live cells. Proc. Natl. Acad. Sci. 2004, 101, (27),
9955-9959.
23. Keppler, A.; Arrivoli, C.; Sironi, L.; Ellenberg, J., Fluorophores for live cell
imaging of AGT fusion proteins across the visible spectrum. Biotechniques. 2006, 41,
(2), 167-170, 172, 174-175.
24. Jacquier, V.; Prummer, M.; Segura, J. M.; Pick, H.; Vogel, H., Visualizing
odorant receptor trafficking in living cells down to the single-molecule level. Proc. Natl.
Acad. Sci. 2006, 103, (39), 14325-14330.
25. Sielaff, I.; Arnold, A.; Godin, G.; Tugulu, S.; Klok, H. A.; Johnsson, K., Protein
function microarrays based on self-immobilizing and self-labeling fusion proteins.
Chembiochem. 2006, 7, (1), 194-202.
26. Kindermann, M.; George, N.; Johnsson, N.; Johnsson, K., Covalent and selective
immobilization of fusion proteins. J. Am. Chem. Soc. 2003, 125, (26), 7810-7811.

97
Chapter 4
Spanning the Spectrum with Novel Cell-Permeable Fluorophores: Biotinylated
Probes that Enable Imaging of Streptavidin Fusion Proteins Expressed in Living
Mammalian Cells
4.1 Introduction
In the previous chapters, we demonstrated that Pennsylvania Green can be used to
image cells and intracellular proteins. Green fluorescent probes have been very successful
in studies of cellular biology, but they are limited in applications involving imaging of
tissues or organs in animals due to the abundance of natural chromophores that absorb in
this wavelength. It is for this reason there is considerable interest in longer-wavelength
fluorophores. Long-wavelength fluorophores are defined as those molecules that absorb
light close to 600 nm and emit light above 600 nm, where there is little interference from
biological chromophores. Relatively few fluorescent probes that absorb at these longer
wavelengths are known, and fewer still are capable of conjugation through a reactive
intermediate. Another major advantage of a long-wavelength fluorophore is the
application of multicolor imaging where the possibility of using two or more spectrally
separated fluorophores in one specimen greatly enhances the information that can be
obtained from a sample. We sought to use our improved fluorophore synthesis,
originally designed for Pennsylvania Green, to synthesize a new class of red shifted
fluorophores. The utility of these new fluorophores was investigated using biotinylated

98
probes that enable imaging of streptavidin fusion proteins expressed in living
mammalian cells.
4.2 Absorbance and Auto-Fluorescence of Biological Samples
Natural chromophores in living animals can cause problems with fluorescence
imaging. The main cause of these problems arises from hemoglobin in the bloodstream.
Hemoglobin, the predominant protein in red blood cells, is a globular protein comprised
of 4 polypeptide chains that form tetramers that pick up oxygen in the lungs and deliver it
to peripheral tissues to maintain the viability of cells. As shown in Figure 4.1, the two
alpha strands and two beta strands of hemoglobin are very similar.1 Hemoglobin forms a
reversible bond with oxygen. In its oxygenated state it is called oxyhemoglobin and is a
bright red color. In the reduced state it is called deoxyhemoglobin and it is purple-blue.
The folding of hemoglobin forms a pocket that strongly binds the heme group. The heme
pictured in Figure 4.2 consists of a porphyrin ring coordinated to Fe2+
. The iron atom,
which is the site of oxygen binding, bonds with the four nitrogens in the center of the
ring, which all lie in one plane. The iron is also bound strongly to the globular protein via
the imidazole ring of a histidine residue below the porphyrin ring. A sixth position can
reversibly bind oxygen, completing the octahedral coordination of six ligands.

99
Figure 4.1. X-ray crystal structure of T state hemoglobin with oxygen bound at all four
hemes (pdb code 1GZX).
Figure 4.2. Structure of the heme group.
The strong light-absorbing properties of oxy and deoxyhemoglobin interfere with
the detection of green fluorescence in living animals. It can be seen in Figure 4.3 that
the spectra of both forms of hemoglobin strongly absorb in the green region (495–570
nm) where fluorescein and Pennsylvania Green absorb photons and emit fluorescence.

100
Thus, there is a need for fluorophores that both absorb and emit in the red spectral region
away from the absorption bands of hemoglobin. Additionally, long wavelength dyes
should ideally be tuned to red light emitting diodes or lasers for efficient imaging.
Figure 4.3. Absorption spectra of oxy and deoxyhemoglobin based on data obtained from
the Oregon Medical Laser Center.
4.3 Design of Novel Red Shifted Fluorophores
Rhodamine dyes are well known for their photostability, high fluorescence and
pH-insensitivity. These dyes have been used for many different applications including
fluorescent antibodies and avidin conjugates for immunochemistry.2 As seen in chapter
one, Texas Red, TAMRA and Lissamine Rhodamine are among the most common red
shifted dyes. We sought to modify these existing fluorophore using the same design
strategy employed for Pennsylvania Green. In addition to replacement of a carboxylate
with a methyl group, further conjugation of the π system in our rhodamine derivatives as
well as the formation of rigid rings was designed to shift the absorption of our novel dyes

101
above 600 nm. We designed four novel fluorophores based on this approach: Penn Fluor
550, Penn Fluor 555, Penn Fluor 576 and Penn Fluor 609 (Figure 4.4, 63-66).
Figure 4.4. Structure of known (20-22) and novel red-shifted fluorophores (63-66).
4.4 Synthesis of Penn Fluor 550, Penn Fluor 555, and Their Carboxy Derivatives
The synthesis of our novel red-shifted fluorophores is based on the optimized
synthesis of Pennsylvania Green described in chapter three. As shown in figure 4.5,
Penn Fluor 550 and 555 (63 and 64) were made from the appropriate dialkyaminophenol
(67 and 68). These amino phenols were condensed with either o-tolualdehyde (54) or 3-
methyl-4-formyl benzoic acid methyl ester (58) in propionic acid with catalytic p-TsOH
to afford triarylmethanes 69-71.3 Propionic acid was found to produce better results for
the amino alcohols when compared to the methane sulfonic acid that was previously used
to condense resorcinol derivatives in the Pennsylvania Green synthesis. Oxidative
cyclization of triarylmethanes 69 and 71 proceeded using the quinone oxidant chloranil,
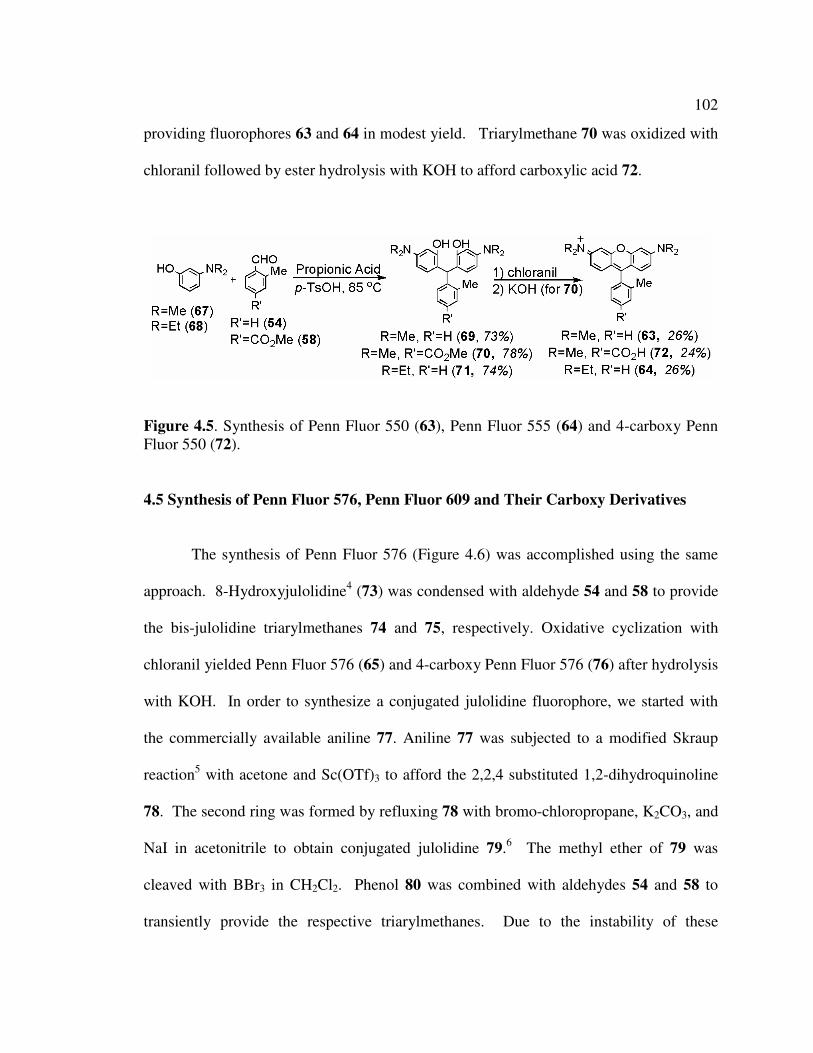
102
providing fluorophores 63 and 64 in modest yield. Triarylmethane 70 was oxidized with
chloranil followed by ester hydrolysis with KOH to afford carboxylic acid 72.
Figure 4.5. Synthesis of Penn Fluor 550 (63), Penn Fluor 555 (64) and 4-carboxy Penn
Fluor 550 (72).
4.5 Synthesis of Penn Fluor 576, Penn Fluor 609 and Their Carboxy Derivatives
The synthesis of Penn Fluor 576 (Figure 4.6) was accomplished using the same
approach. 8-Hydroxyjulolidine4 (73) was condensed with aldehyde 54 and 58 to provide
the bis-julolidine triarylmethanes 74 and 75, respectively. Oxidative cyclization with
chloranil yielded Penn Fluor 576 (65) and 4-carboxy Penn Fluor 576 (76) after hydrolysis
with KOH. In order to synthesize a conjugated julolidine fluorophore, we started with
the commercially available aniline 77. Aniline 77 was subjected to a modified Skraup
reaction5 with acetone and Sc(OTf)3 to afford the 2,2,4 substituted 1,2-dihydroquinoline
78. The second ring was formed by refluxing 78 with bromo-chloropropane, K2CO3, and
NaI in acetonitrile to obtain conjugated julolidine 79.6 The methyl ether of 79 was
cleaved with BBr3 in CH2Cl2. Phenol 80 was combined with aldehydes 54 and 58 to
transiently provide the respective triarylmethanes. Due to the instability of these

103
conjugated julolidine derivatives, the triarylmethane was not isolated, rather oxidative
cyclization was performed immediately after formation of triarylmethanes to afford 66
and 81. 4-Carboxy Penn Fluor 609 methyl ester (81) was hydrolyzed with KOH to
provide fluorophore 82.
Figure 4.6. Synthesis of Penn Fluor 576 (65), Penn Fluor 609 (66) and their carboxy
derivatives (76 and 82).
4.6 Absorption and Emission Spectra of Penn Fluors

104
The absorption and fluorescence emission spectra of fluorophores are two of the
most important criteria that must be scrutinized when selecting probes for applications in
laser scanning confocal microscopy. In addition to the wavelength range of the
absorption and emission bands, the quantum yield for fluorescence emission should be
considered. At laser excitation levels below saturation, fluorescence intensity is directly
proportional to the product of the extinction coefficient and the quantum yield.
Absorption and fluorescence emission spectra for Penn Fluor 550 (63), 555 (64), 576 (65)
and 609 (66) were compared to Pennsylvania Green (26). As shown in Figure 4.7, all
absorption and emission maxima are red-shifted compared with Pennsylvania Green,
with absorption and emission of some compounds exceeding 600 nm. Wavelengths of
maxima for individual fluorophores are summarized in Table 4.1.
Figure 4.7. Normalized absorbance spectra (Panel A) and fluorescence emission spectra
(Panel B) of novel fluorophores.
Compound Absorption (nm) Emission (nm)

105
Pennsylvania Green (26) 496 517
Penn Fluor 550 (63) 550 572
Penn Fluor 555 (64) 555 576
Penn Fluor 576 (65) 576 596
Penn Fluor 609 (66) 609 626
Table 4.1. Maximum absorption and emission wavelengths for novel fluorophores 63-66.
4.7 Determination of Quantum Yield for Novel Red-Shifted Fluorophores
In addition to the absorption and emission profiles of fluorophores, the quantum
yield is also an important parameter. The fluorescence quantum yield of
tetramethylrhodamine conjugates is usually only about one-fourth that of fluorescein
conjugates.7 However, because tetramethylrhodamine is readily excited by the intense
546 nm spectral line from mercury-arc lamps used in most fluorescence microscopes and
is intrinsically more photostable than fluorescein, tetramethylrhodamine conjugates often
appear brighter than corresponding fluorescein conjugates. Figure 4.8 shows that the
quantum yields of the new red-shifted fluorophores range from 0.46 to 0.70. The extra
rings in 65 and 66 prevent rotation about the nitrogen atoms, resulting in a shift in the
fluorophore's spectra to longer wavelengths and an increase in the fluorescence quantum
yield.
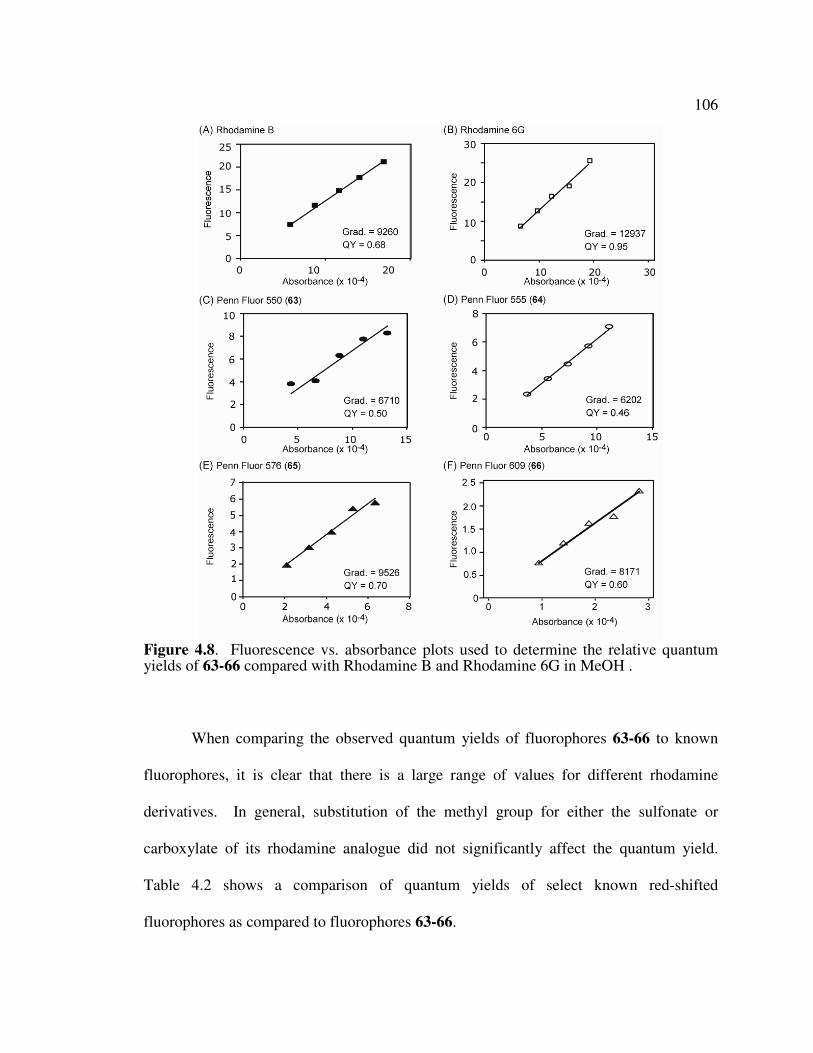
106
Figure 4.8. Fluorescence vs. absorbance plots used to determine the relative quantum yields of 63-66 compared with Rhodamine B and Rhodamine 6G in MeOH .
When comparing the observed quantum yields of fluorophores 63-66 to known
fluorophores, it is clear that there is a large range of values for different rhodamine
derivatives. In general, substitution of the methyl group for either the sulfonate or
carboxylate of its rhodamine analogue did not significantly affect the quantum yield.
Table 4.2 shows a comparison of quantum yields of select known red-shifted
fluorophores as compared to fluorophores 63-66.

107
Fluorophore Quantum Yield
Alexa Fluor 594 (31) 0.66
Texas Red (22) 0.70
Rhodamine B (21) 0.68
Penn Fluor 550 (63) 0.50
Penn Fluor 555 (64) 0.46
Penn Fluor 576 (65) 0.70
Penn Fluor 609 (66) 0.60
Table 4.2. Comparison of quantum yields for select known fluorophores and novel
fluorophores (63-66).
4.8 Studies of Intracellular Streptavidin with Biotinylated Fluorophores
To investigate the utility of our novel fluorophores, we prepared biotinylated
conjugates to image expression of streptavidin in mammalian cells. Avidin and
streptavidin are biotin-binding proteins that represent versatile tools in bioscience and
diagnostics. Recently, fluorimetric assays for (strep)avidin have been developed that rely
on the stoichiometric binding of fluorescent biotin derivatives (Figure 4.9, 83, 84) to the
binding sites of streptavidin.8 The longer 14-atom spacer of fluorescein-biotin (83) is
known to result in anti-cooperative binding by projecting fluorescein into adjacent biotin
binding sites. This causes slow association kinetics with avidin, whereas the shorter
linker between the biotin and fluorescein in biotin-4-fluorescein (84) results in non-
cooperative binding.9 Both 83 and 84 were developed as an alternative to radioactive

108
biotin for detecting and quantitating biotin-binding sites. In general these compounds
have been utilized only in vitro.
Figure 4.9. Structures of biotinylated fluoresceins 83 and 84.
Tsien and co-workers utilized a membrane permeable biotin-fluorescein diester to
probe an avidin-chimera protein expressed within the endoplasmic reticulum and Golgi
of Hela cells.10
They used a fluorescein-biotin based pH sensitive dye to study organelles
along the secretory pathway using expressed avidin proteins. The probes that they
studied, termed Flubida dyes, required ester modification for cell permeability (Figure
4.10). Flubi-2 (86) itself was not cell permeable, but the diester Flubida-2 (85)
functioned as a cell-permeable molecular probe, relying on intracellular esterases to

109
unmask the fluorophore. Their results illustrate the importance of cell permeable
fluorophores for studies of cellular biology.
Figure 4.10. Chemical structures of Flubida-2 (85) and Flubi-2 (86).
We sought to use cell permeable fluorophores to design better fluorescent biotin
derivatives as probes of intracellular streptavidin. To date, there has only been one
reported study of expression of streptavidin in mammalian cells.11
Our biotinylated
probes were designed to have the optimal ethylene diamine linker found in biotin-4-
fluorescein (84), but should be cell permeable without requiring additional synthetic
modification of the fluorophore. As shown in Figure 4.11, we modified Pennsylvania
Green, Penn Fluor 550, Penn Fluor 576, and Penn Fluor 609 (87-90) to explore the
cellular properties of these fluorophores. As controls, we also synthesized analogous
biotinylated Oregon Green (91), TAMRA (92), and ROX derivatives (93). Fluorescent

110
biotins were easily prepared by addition of biotin-ethylene diamine (Sigma-Aldrich) to
N-hydroxysuccinimidyl esters of the fluorophores.
Figure 4.11. Structures of Pennsylvania Green-Biotin (87), Penn Fluor 550-Biotin (88),
Penn Fluor 576-Biotin (89), Penn Fluor 609-Biotin (90), Oregon Green-Biotin (91),
TAMRA-biotin (92) and ROX-Biotin (93).
111
4.9 Imaging Cytosolic Streptavidin Fusion Proteins
In order to visualize the interaction between biotinylated fluorophores and
streptavidin (SA) in living cells, we constructed vectors encoding two fusion proteins.
We fused full length wild type (wt) SA to the monomeric red fluorescent protein mRFP1
and the green fluorescent protein AcGFP. Both vectors were engineered to have a short
peptide linker (GTP)12
between SA and the fluorescent protein. In order to compare
Pennsylvania Green-biotin (87) and the structurally similar Oregon Green-biotin (91), we
transfected mammalian CHO-K1 cells with the vector encoding SA(wt)-GTP-mRFP
followed by treatment with 87 and 91, both alone and in the presence of excess biotin as a
non-fluorescent competitor. As shown in Figure 4.12, the Pennsylvania Green-biotin
(87) was found to be much more cell permeable and co-localized with SA to a greater
extent than Oregon Green-biotin (91) (compare Panel A and Panel C). Both compounds
were able to be competed away with excess biotin, indicating that the interaction with SA
is specific (compare Panels B and D).
CHO-K1 cells were also transfected with SA (wt)-GTP-AcGFP in order to study
the activities of compounds 88-90, 92, and 93. As shown in Figure 4.13 all of the
biotinylated fluorophores co-localize with intracellular SA to some extent. Penn Fluor
550-biotin (88) appears to be superior in signal-to-noise ratio than the other probes. The
lower background of probe 88 is advantageous for fluorescent assays and microscopy.
The background associated with most fluorescent rhodamine derivatives results from
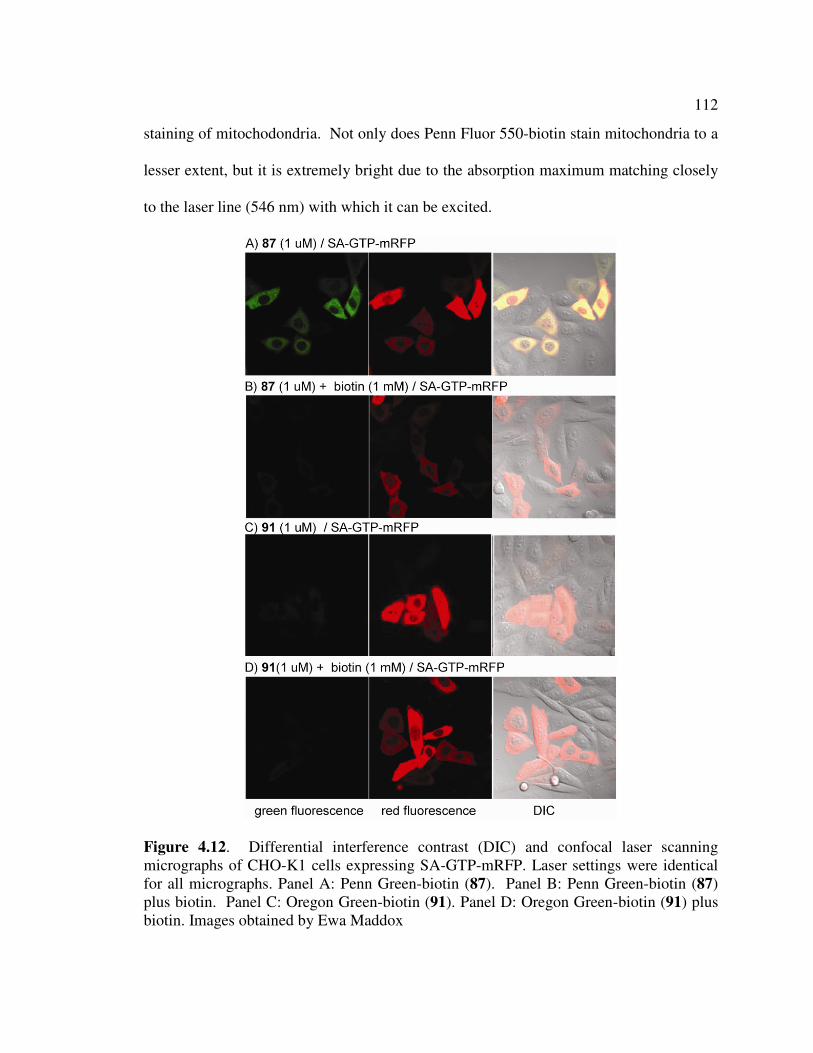
112
staining of mitochodondria. Not only does Penn Fluor 550-biotin stain mitochondria to a
lesser extent, but it is extremely bright due to the absorption maximum matching closely
to the laser line (546 nm) with which it can be excited.
Figure 4.12. Differential interference contrast (DIC) and confocal laser scanning
micrographs of CHO-K1 cells expressing SA-GTP-mRFP. Laser settings were identical
for all micrographs. Panel A: Penn Green-biotin (87). Panel B: Penn Green-biotin (87)
plus biotin. Panel C: Oregon Green-biotin (91). Panel D: Oregon Green-biotin (91) plus
biotin. Images obtained by Ewa Maddox

113
Figure 4.13. Differential interference contrast (DIC) and confocal laser scanning
micrographs of CHO-K1 cells expressing SA-GTP-AcGFP. Laser settings were identical
for all micrographs. Panel A: Penn Fluor 550-biotin (88). Panel B: TAMRA-biotin (92)
Panel C: Penn Fluor 576-biotin (89) Panel D: ROX-Biotin (93). Panel E: Penn Fluor 609-
biotin (90). Images obtained by Ewa Maddox (Penn State University)

114
To examine the cell-permeability of biotinylated probes 88 and 89, CHO-K1 cells
were transfected with SA (wt)-GTP-AcGFP and treated with 250 nM of 88 and 89 and
were compared to control compounds 92 and 93 at 250nm. As shown in Figure 4.14,
Penn Fluor 550-biotin (88) was found to be much more cell permeable and co-localized
with SA to a greater extent than TAMRA-biotin (92) (compare panel A and panel B). It
is also evident that Penn Fluor 576-biotin (89) was more cell permeable and co-localized
with SA to a greater extent than ROX-biotin (93) (compare panel C and panel D).
Figure 4.14. Differential
interference contrast (DIC) and
confocal laser scanning
micrographs of CHO-K1 cells
expressing SA-GTP-AcGFP. Laser
settings were identical for all
micrographs. Panel A: Penn Fluor
550-biotin (88). Panel B: TAMRA-
biotin (92) Panel C: Penn Fluor
576-biotin (89) Panel D: ROX-
Biotin (93).

115
4.10 Conclusions
We demonstrated the usefulness of our concise synthesis of Pennsylvania Green
by applying it to construct novel long-wavelength fluorophores. We synthesized four
hydrophobic red-shifted fluorophores (63-66) and demonstrated that their photophysical
properties are similar to those of commercially available compounds. Their utility as
molecular probes was demonstrated through studies of biotinylated fluorophores that
specifically bind SA expressed in the cytoplasm of mammalian cells. Of these
biotinylated probes, Penn Fluor 550-biotin (88) exhibited the best signal-to-noise ratio for
cellular imaging. Penn Fluor 550 exhibited extremely bright fluorescence making it a
potentially ideal red probe for the study of SA and other targets in mammalian cells.
4.11 Experimental Section
4.11.1 General
Chemical reagents were obtained from Acros, Aldrich, Alfa Aesar, or TCI America.
Solvents were from EM Science. Media and antibiotics were purchased from Mediatech.
Commercial grade reagents were used without further purification unless otherwise
noted. Anhydrous solvents were obtained after passage through a drying column of a
solvent purification system from GlassContour (Laguna Beach, CA). All reactions were
performed under an atmosphere of dry argon or nitrogen. Reactions were monitored by
analytical thin-layer chromatography on plates coated with 0.25 mm silica gel 60 F254
(EM Science). TLC plates were visualized by UV irradiation (254 nm) or stained with a

116
solution of phosphomolybdic acid and sulfuric acid in ethanol (1:1:20). Flash column
chromatography employed ICN SiliTech Silica Gel (32-63 µm). Melting points were
measured with a Thomas Hoover capillary melting point apparatus and are uncorrected.
Infrared spectra were obtained with a Perkin Elmer 1600 Series FTIR. NMR spectra
were obtained with Bruker CDPX-300, DPX-300, or DRX-400 instruments with
chemical shifts reported in parts per million (ppm, δ) referenced to either CDCl3 (1H 7.27
ppm; 13
C 77.23 ppm), or DMSO-d6 (1H, 2.50 ppm;
13C, 39.51 ppm). High-resolution
mass spectra were obtained from the Pennsylvania State University Mass Spectrometry
Facility (ESI and TOF). Peaks are reported as m/z.
4.11.2 Synthetic Procedures and Compound Characterization Data
69
5-(dimethylamino)-2-{[4-(dimethylamino)-2-hydroxyphenyl](2-methylphenyl)
methyl} phenol (69)
3-Dimethylaminophenol (67, 500 mg, 3.6 mmol) and o-tolualdehyde (54, 211 µL, 1.8
mmol) were dissolved in propionic acid (15 mL) and catalytic p-TsOH acid was added.
The reaction was purged with argon and heated to 80-85 oC. The reaction was monitored
by TLC by quenching 100 µL aliquots in aqueous saturated sodium bicarbonate (200
µL), then extracting the organic material with EtOAc (200 µL). When all starting
materials have been consumed (5 h), the solution was cooled to 0 oC then poured into

117
excess aqueous 3M sodium acetate (100 mL). This treatment neutralizes the propionic
acid and precipitates the triarylmethane. The filtrate was collected by vacuum-filtration,
washed with copious amounts of water, and dried in vacuo to provide 69 (495 mg, 73%)
as a tan solid, mp 82-84 °C; 1
H NMR (300 MHz, CD3OD) δ 6.94 (m, 3H), 6.72 (d, J =
6.8 Hz, 1H), 6.50 (d, J = 8.3 Hz, 1H), 6.18-6.07 (m, 4H), 5.81 (s, 1H), 2.69 (s, 12H), 2.06
(s, 3H); 13
C NMR (75 MHz, CD3OD) 156.0, 151.5, 144.1, 137.7, 131.5, 130.9, 129.2,
126.1, 120.6, 106.2, 102.1, 41.8, 40.2, 20.0; IR (film) νmax 3340, 2925, 1614, 1504 cm-
1;HRMS (TOF ES+) m/z 377.2229 (MH
+, C24H28O2N2 requires 377.2226).
70
methyl 4-{bis[4-(dimethylamino)-2-hydroxyphenyl]methyl}-3-methylbenzoate (70)
3-Dimethylaminophenol (67, 500 mg, 3.6 mmol) and 4-formyl-3-methyl-methylbenzoate
(58, 322 mg, 1.8 mmol) were dissolved in propionic acid (15 mL) and catalytic p-TsOH
acid was added. The reaction was performed using the same methods utilized for
compound 69 to afford 70 (609 mg, 78%) as a tan solid, mp 164-168 °C; 1H NMR (300
MHz, CDCl3) δ 7.71 (s, 1H), 7.60 (d, J = 8.1 Hz, 1H), 6.90 (d, J = 8.0 Hz, 1H), 6.50 (d,
J = 8.4 Hz, 2H), 6.20 (s, 2H), 6.14 (dd, J1 = 8.4, J2 = 2.1 Hz, 2H), 5.83 (s, 1H), 3.73 (s,
3H), 2.79 (s, 12H), 2.16 (s, 3H); 13
C NMR (75 MHz, CDCl3) 167.0, 154.6, 150.5, 148.7,
137.1, 130.9, 130.1, 128.3, 127.0, 126.5, 117.5, 104.8, 100.6, 51.7, 39.4, 19.0; IR (film)

118
νmax 3305, 2937, 1678, cm-1
; HRMS (TOF ES+) m/z 435.2364 (MH+, C26H30O4N2
requires 435.2284).
71
5-(diethylamino)-2-{[4-(diethylamino)-2-hydroxyphenyl](2-methylphenyl) methyl}
phenol (71)
3-Diethylaminophenol (68, 500 mg, 3.0 mmol) and o-tolualdehyde (54, 175 µL, 1.5
mmol) were dissolved in propionic acid (15 mL) and catalytic p-TsOH acid was
added. The reaction was performed using the same methods utilized for compound 69 to
afford 71 (480 mg, 74%) as a tan solid, mp 68-70 °C 1
H NMR (400 MHz, CDCl3) δ 7.02
(m, 3H), 6.90 (d, J = 6.8 Hz, 1H), 6.51 (d, J = 8.3 Hz, 1H), 6.05 (m, 4H), 5.55 (s, 1H),
3.10 (q, J = 6.9 Hz, 8H), 2.10 (s, 3H), 0.98 (t, J = 6.9 Hz, 12H); 13
C NMR (75 MHz,
CDCl3) 154.8, 148.1, 140.8, 136.8, 130.4, 130.4, 130.2, 115.2, 105.0, 104.8, 100.2,
100.0, 44.2, 40.8, 19.4, 12.4; IR (film) νmax 3457, 2971, 1620, 1521 cm-1
;HRMS (TOF
ES+) m/z 433.2848 (MH+, C28H36O2N2 requires 433.2855).
63
6-(dimethylamino)-N,N-dimethyl-9-(2-methylphenyl)-3H-xanthen-3-imine (63)
5-(dimethylamino)-2-{[4-(dimethylamino)-2-hydroxyphenyl](2-methylphenyl) methyl}
phenol (69, 100 mg, 0.26 mmol) and chloranil (95 mg, 0.39 mmol) were dissolved in

119
MeOH / CHCl3 (1:1, 10 mL) The solution was stirred at 23 oC for 1 h. When the reaction
was complete as observed by TLC, solvent was removed in vacuo and residue was
applied directly to a silica column. Flash chromatography (MeOH / CHCl3, 1:9) afforded
63 (24 mg, 26%) as a purple film. 1H NMR (300 MHz, CDCl3) δ 7.54-7.40 (m, 3H),
7.18-7.15 (m, 3H), 6.92-6.88 (m, 4H), 3.32 (s, 12H), 2.03 (s, 3H); 13
C NMR (75 MHz,
CDCl3) 158.5, 157.7, 157.4, 135.8, 131.4, 131.3, 130.7, 130.1, 128.7, 126.1, 114.3,
113.5, 96.8, 40.9, 19.5; IR (film) νmax 2933, 1587, 1187 cm-1
; HRMS (TOF ES+) m/z
357.1949 (M+, C24H25ON2 requires 357.1967).
72
9-(4-carboxy-2-methylphenyl)-6-(dimethylamino)-N,N-dimethyl-3H-xanthen-3-
imine (72)
methyl 4-{bis[4-(dimethylamino)-2-hydroxyphenyl]methyl}-3-methylbenzoate (70, 100
mg, 0.23 mmol) and chloranil (104 mg, 0.46 mmol) were dissolved in MeOH / CHCl3
(1:1, 10 mL) The solution was stirred at 23 oC for 1 h. When the reaction was complete
as observed by TLC, solvent was removed in vacuo and residue was redissolved in
MeOH/Water (3:2, 20 mL) and treated with aqueous 1M KOH (1 mL). Upon complete
deprotection of methyl ester the methanol was removed in vacuo and the remaining
aqueous solution was acidified with concentrated HCl (to pH 3-4), extracted with EtOAc
(3 x 50 mL), washed with aqueous saturated sodium chloride (100 mL) and dried over
anhydrous sodium sulfate. Flash chromatography (MeOH / CHCl3, 1:9) afforded 72 (23

120
mg, 24%) as a purple film. 1H NMR (300 MHz, CD3OD) δ 8.02 (s, 1H), 7.97 (d, J = 7.9
Hz, 1H), 7.29 (d, J = 7.9 Hz, 1H), 6.93 (m, 4H), 6.77 (d, J = 7.9 Hz, 2H), 3.20 (s, 12H),
1.97 (s, 3H); 13
C NMR (75 MHz, CD3OD) 168.9, 159.1 (x 2), 155.2, 137.9, 137.7, 134.8,
133.6, 132.5, 130.5, 128.4, 115.9, 114.3, 97.7, 41.0, 19.6; IR (film) νmax 3401, 2924,
1713, 1649, 1596 cm-1
; HRMS (TOF ES+) m/z 401.1881 (M+, C25H25O3N2 requires
401.1865).
64
6-(diethylamino)-N,N-diethyl-9-(2-methylphenyl)-3H-xanthen-3-imine (64)
5-(diethylamino)-2-{[4-(diethylamino)-2-hydroxyphenyl](2-methylphenyl) methyl}
phenol (71, 100 mg, 0.23 mmol) and chloranil (85 mg, 0.34 mmol) were dissolved in
MeOH / CHCl3 (1:1, 10 mL) The solution was stirred at 23 oC for 1 h. When reaction
was complete as observed by TLC solvent was removed in vacuo and residue was applied
directly to a silica column. Flash chromatography (MeOH / CHCl3, 1:9) afforded 64 (21
mg, 26%) as a purple film. 1H NMR (300 MHz, CDCl3) δ 7.54-7.38 (m, 3H), 7.16-7.13
(m, 3H), 6.86-6.79 (m, 4H), 3.62 (q, J = 7.2 Hz, 8H), 2.06 (s, 3H), 1.33 (t, J = 7.1 Hz,
12H) ; 13
C NMR (75 MHz, CDCl3) 157.9, 157.8, 155.6, 135.8, 131.6, 131.4, 130.7,
130.1, 128.7, 126.1, 114.0, 113.4, 96.5, 46.0, 19.5, 12.4; IR (film) νmax 2981, 1590, 1179
cm-1
; HRMS (TOF ES+) m/z 357.1949 (M+, C24H25ON2 requires 357.1967).

121
74
9,9'-[(2-methylphenyl)methylene]bis(2,3,6,7-tetrahydro-1H,5H-pyrido[3,2,1-ij]qui
nolin-8-ol) (74)
8-hydroxyjulolidine (73, 500 mg, 2.6 mmol) and o-tolualdehyde (54, 54 µL, 1.3 mmol)
were dissolved in propionic acid (15 mL) and catalytic p-TsOH acid was added. The
reaction was performed using the same methods utilized for compound 69 to afford 74
(525 mg, 84%) as a gray solid, mp 170-174 °C; 1H NMR (400 MHz, CDCl3) δ 7.12-7.04
(m, 3H), 6.73 (d, J1 = 7.5 Hz, 1H), 6.34 (3, 2H) 6.02 (s, 1H), 3.35 (m, 4H), 3.24 (m, 4H),
2.69 (m, 8H), 2.12 (s, 3H), 2.10 (m, 8H); 13
C NMR (75 MHz, CDCl3) 150.3, 139.8,
136.1, 132.5, 129.8, 127.9, 127.7, 125.8, 125.0, 119.6, 116.6, 52.1, 51.5, 39.9, 24.8, 20.1,
19.7 19.1, 18.5 (x 2); IR (film) νmax 3270, 2953, 1673, 1471, cm-1
; HRMS (TOF ES+)
m/z 481.2875 (MH+, C32H36O2N2 requires 481.2855).
75
methyl 4-[bis ({8-hydroxy-1-azatricyclo[7.3.1.0{5,13}
]trideca-5,7,9(13)-trien-7-
yl})methyl]-3-methylbenzoate (75)
8-hydroxyjulolidine (73, 500 mg, 2.6 mmol) and 4-formyl-3-methyl-methylbenzoate (58,
234 mg, 1.3 mmol) were dissolved in propionic acid (15 mL) and catalytic p-TsOH acid
was added. Reaction was performed using the same methods as compound 69 to afford

122
75 (605 mg, 87%) as a gray solid, mp 127-129 °C; 1H NMR (300 MHz, CDCl3) δ 7.70 (s,
1H), 7.63 (dd, J1 = 1.5 Hz, J2 = 8.0 Hz, 1H), 6.97 (d, J = 8.0 Hz, 1H), 6.10 (s, 2H), 5.69
(s, 1H), 3.78 (s, 3H), 2.90 (m, 8H), 2.49 (m, 8H), 2.19 (s, 3H), 1.81 (m, 8H); 13
C NMR
(75 MHz, CDCl3) 167.4, 149.5, 147.8, 142.2, 136.7, 130.7, 128.5, 126.9, 126.6, 126.4,
116.2, 113.7, 109.6, 51.4, 49.7, 49.1, 40.7, 26.7, 21.9, 21.3, 20.8, 18.9; IR (film) νmax
3463, 2941, 1713, 1609 cm-1
; HRMS (TOF ES+) m/z 539.2848 (MH+, C34H38O4N2
requires 539.2910).
65
16-(2-methylphenyl)-3-oxa-9,23- diazaheptacyclo [17.7.1.1{5,9}
.0{2,17}
.0{4,15}
.0{23,27}
.0{13,28}
] octacosa-1(27),2(17),4,9(28),13,15,18-heptaen-9-ium (65)
9,9'-[(2-methylphenyl)methylene]bis(2,3,6,7-tetrahydro-1H,5H-pyrido[3,2,1-ij]qui
nolin-8-ol) (74, 91 mg, 0.19 mmol) and chloranil (69 mg, 0.28 mmol) were dissolved in
MeOH / CHCl3 (1:1, 10 mL). The solution was stirred at 23 oC for 1 h. When reaction
was complete as observed by TLC solvent was removed in vacuo and residue was applied
directly to a silica column. Flash chromatography (MeOH / CHCl3, 1:9) afforded 63 (27
mg, 31%) as a purple film; 1H NMR (400 MHz, CDCl3) δ 7.44-7.25 (m, 3H), 7.07 (d, J =
6.9 Hz, 1H), 6.56 (s, 2H), 3.41 (m, 8H), 2.97 (t, J = 6.2 Hz, 4H), 2.58 (t, J = 5.9 Hz, 4H),
2.01 (p, J = 6.3 Hz, 4H), 1.90 (s, 3H), 1.84 (p, J = 5.3 Hz, 4H); 13
C NMR (75 MHz,
CDCl3) 156.0, 153.6, 152.6, 137.2, 133.9, 131.6, 130.2, 127.1 (x 2), 125.5, 113.9, 106.7,

123
51.8, 51.4, 28.5, 21.7, 20.9, 20.8 19.6; IR (film) νmax 2923, 1682, 1596, 1298 cm-1
;
HRMS (TOF ES+) m/z 461.2580 (M+, C32H33ON2 requires 461.2593).
76
16-(4-carboxy-2-methylphenyl)-3-oxa-9,23-diazaheptacyclo [17.7.1.1{5,9}
.0{2,17}
.0{4,15}
.0{23,27}
.0{13,28}
] octacosa-1(27),2(17),4,9(28),13,15,18-heptaen-9-ium (76)
methyl 4-[bis ({8-hydroxy-1-azatricyclo[7.3.1.0{5,13}
]trideca-5,7,9(13)-trien-7-
yl})methyl]-3-methylbenzoate (75, 100 mg, 0.18 mmol) and chloranil (88 mg, 0.366
mmol) were dissolved in MeOH / CHCl3 (1:1, 10 mL). The solution was stirred at 23 oC
for 1 h. When reaction was complete as observed by TLC, solvent was removed in vacuo
and residue was redissolved in MeOH/Water (3:2, 20 mL) and treated with aqueous 1M
KOH (1 mL). Upon complete deprotection of methyl ester the methanol was removed in
vacuo and the remaining aqueous solution was acidified with concentrated HCl (to pH 3-
4), extracted with EtOAc (3 x 50 mL), washed with aqueous saturated sodium chloride
(100 mL) and dried over anhydrous sodium sulfate. Flash chromatography (MeOH /
CHCl3, 1:9) afforded 76 (27 mg, 29%) as a purple film; 1H NMR (400 MHz, CDCl3) δ
8.0 (s, 1H), 7.94 (d, J = 7.7 Hz, 1H), 7.21 (d, J = 7.8 Hz, 1H), 6.54 (s, 2H), 3.43 (m,
8H), 2.99 (t, J = 6.1 Hz, 4H), 2.62 (t, J = 5.6 Hz, 4H), 2.03 (m, 4H), 1.98 (s, 3H), 1.84
(m, 4H); 13
C NMR (75 MHz, CDCl3) 169.0, 154.4, 153.5, 152.7, 138.5, 138.0, 133.3,
132.7, 130.6, 128.3, 126.7, 125.8, 114.8, 106.8, 51.9, 51.4, 28.5, 21.7, 20.9, 20.8 19.6;

124
IR (film) νmax 3422, 2949, 1707, 1648, 1299 cm-1
; HRMS (TOF ES+) m/z 505.2514 (M+,
C33H33O3N2 requires 505.2491).
79
8-methoxy-2,2,4-trimethyl-1-azatricyclo[7.3.1.0{5,13}
]trideca-3,5,7,9(13)-tetraene (79)
7-Methoxy-2,2,4-trimethyl-1,2-dihydroquinoline (78, 1.88 g, 9.3 mmol), 1-bromo-3-
chloro-propane (3.67 mL, 37.2 mmol), NaI (11.08 g, 74.4 mmol) and NaHCO3 (1.5 g,
18.5 mmol) were refluxed in CH3CN (200 mL) for 24 h. After cooling to 23 °C the
solution was filtered and the filtrate was evaporated to leave an oily residue which was
applied to a silica column. Flash chromatography (EtOAc / Hexane, 1:9) afforded 79 as a
solid (1.8 g, 83%), mp 61-64 °C; 1H NMR (300 MHz, CDCl3) δ 6.90 (d, J = 8.4 Hz,
1H), 6.19 (d, J = 8.4 Hz, 1H) 5.19 (d, J = 1.3 Hz, 1H) 3.81 (s, 3H), 3.27 (t, J = 5.6 Hz,
2H ), 2.66 (t, J = 6.5 Hz, 2H ), 1.98 (d, J = 1.3 Hz, 3H ), 1.93 (m, 2H), 1.32 (s, 6H); 13
C
NMR (75 MHz, CDCl3) 159.7, 150.1, 130.1, 128.0, 123.5, 116.5, 109.9, 97.7, 55.7, 55.1,
41.4, 26.7, 21.5, 21.3, 18.7; IR (film) νmax 2937, 1599, 1130 cm-1
; HRMS (TOF ES+)
m/z 244.1701 (MH+, C16H21ON requires 244.1703).
80
10,12,12-trimethyl-1-azatricyclo[7.3.1.0{5,13}
]trideca-5(13),6,8,10-tetraen-6-ol (80)
8-methoxy-2,2,4-trimethyl-1-azatricyclo[7.3.1.0{5,13}
]trideca-3,5,7,9(13)-tetraene (79, 74
mg, 0.3 mmol), was dissolved in dry CH2Cl2 (10 mL) and cooled to -78 oC. BBr3 (0.9
mL of a 1 M solution in CH2Cl2) was added via a gas tight syringe and the solution was

125
allowed to warm to 0 oC over 4 h. The reaction was quenched with water (10 mL),
extracted with CH2Cl2 (3 x 20 mL), dried with sodium sulfate and solvent was removed
in vacuo. Flash chromatography (EtOAc / Hexanes, 1:9) afforded 80 as a dark oil (53 mg,
78%), 1H NMR (300 MHz, CDCl3) δ 6.80 (d, J = 8.2 Hz, 1H), 6.08 (d, J = 8.2 Hz, 1H)
5.13 (s, 1H), 3.28 (t, J = 5.4 Hz, 2H), 2.63 (t, J = 6.4 Hz, 2H ), 1.93 (m, 5H), 1.30 (s,
6H); 13
C NMR (75 MHz, CDCl3) 153.7, 143.0, 128.1, 126.8, 121.8, 116.2, 108.1, 102.3,
55.8, 41.3, 26.7, 21.4, 21.2, 18.7; IR (film) νmax 3395, 2966, 1580, 1320 cm-1
; HRMS
(TOF ES+) m/z 230.1549 (MH+, C15H19ON requires 230.1545).
66
Penn Fluor 609 (66)
10,12,12-trimethyl-1-azatricyclo[7.3.1.0{5,13}
]trideca-5(13),6,8,10-tetraen-6-ol (80, 66
mg, 0.28 mmol) and o-tolualdehyde (54, 16 µL, 0.14 mmol) were dissolved in propionic
acid (1 mL) and catalytic p-TsOH acid was added. The reaction was heated to 80 oC until
starting materials were consumed as visualized by TLC (4-5 h). The solution was allowed
to cool to 23 oC and was poured into excess 3 M sodium acetate. The solution was
extracted with EtOAc (3 x 25 mL), dried over anhydrous sodium sulfate and solvent was
removed in vacuo. The residue was redissolved with MeOH / CHCl3 (1:1, 2 mL) and
chloranil (51 mg, 0.2 mmol) was added. The solution was stirred at 23 oC for 1 h. When
reaction was complete as observed by TLC solvent was removed in vacuo and residue
was applied directly to a silica column. Flash chromatography (MeOH / CHCl3, 1:9)
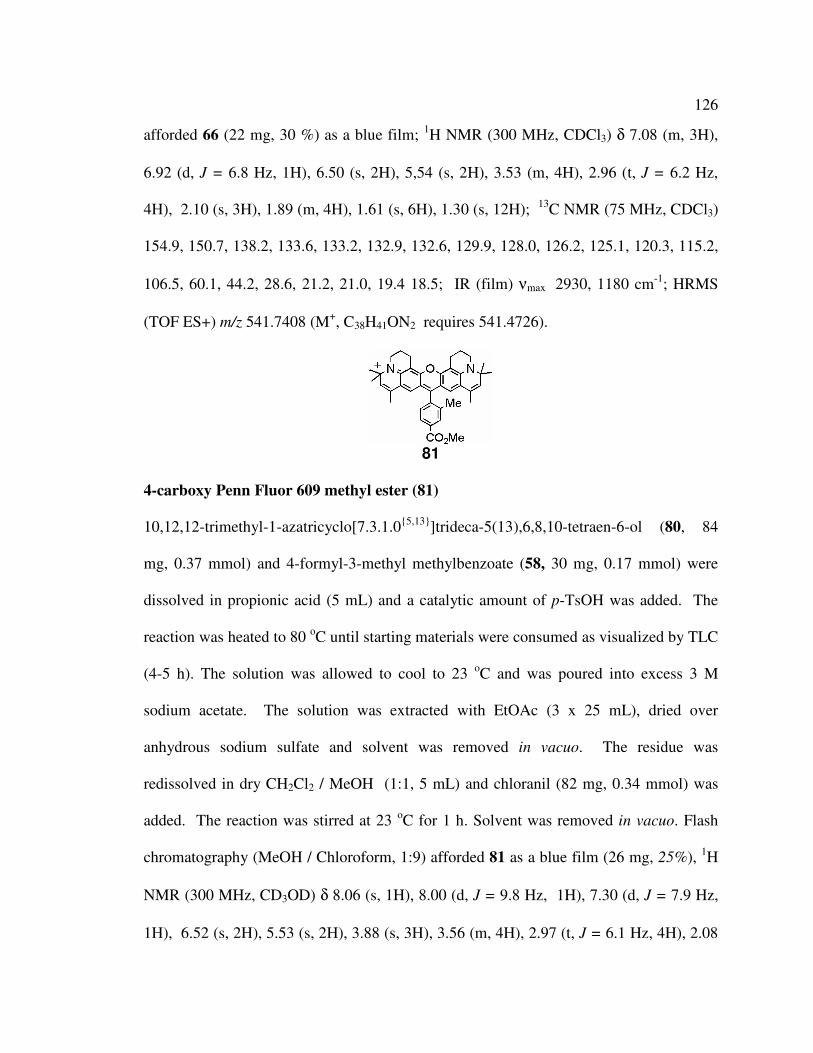
126
afforded 66 (22 mg, 30 %) as a blue film; 1H NMR (300 MHz, CDCl3) δ 7.08 (m, 3H),
6.92 (d, J = 6.8 Hz, 1H), 6.50 (s, 2H), 5,54 (s, 2H), 3.53 (m, 4H), 2.96 (t, J = 6.2 Hz,
4H), 2.10 (s, 3H), 1.89 (m, 4H), 1.61 (s, 6H), 1.30 (s, 12H); 13
C NMR (75 MHz, CDCl3)
154.9, 150.7, 138.2, 133.6, 133.2, 132.9, 132.6, 129.9, 128.0, 126.2, 125.1, 120.3, 115.2,
106.5, 60.1, 44.2, 28.6, 21.2, 21.0, 19.4 18.5; IR (film) νmax 2930, 1180 cm-1
; HRMS
(TOF ES+) m/z 541.7408 (M+, C38H41ON2 requires 541.4726).
81
4-carboxy Penn Fluor 609 methyl ester (81)
10,12,12-trimethyl-1-azatricyclo[7.3.1.0{5,13}
]trideca-5(13),6,8,10-tetraen-6-ol (80, 84
mg, 0.37 mmol) and 4-formyl-3-methyl methylbenzoate (58, 30 mg, 0.17 mmol) were
dissolved in propionic acid (5 mL) and a catalytic amount of p-TsOH was added. The
reaction was heated to 80 oC until starting materials were consumed as visualized by TLC
(4-5 h). The solution was allowed to cool to 23 oC and was poured into excess 3 M
sodium acetate. The solution was extracted with EtOAc (3 x 25 mL), dried over
anhydrous sodium sulfate and solvent was removed in vacuo. The residue was
redissolved in dry CH2Cl2 / MeOH (1:1, 5 mL) and chloranil (82 mg, 0.34 mmol) was
added. The reaction was stirred at 23 oC for 1 h. Solvent was removed in vacuo. Flash
chromatography (MeOH / Chloroform, 1:9) afforded 81 as a blue film (26 mg, 25%), 1H
NMR (300 MHz, CD3OD) δ 8.06 (s, 1H), 8.00 (d, J = 9.8 Hz, 1H), 7.30 (d, J = 7.9 Hz,
1H), 6.52 (s, 2H), 5.53 (s, 2H), 3.88 (s, 3H), 3.56 (m, 4H), 2.97 (t, J = 6.1 Hz, 4H), 2.08

127
(s, 3H), 1.96 (m, 4H), 1.61 (s, 6H), 1.32 (s, 12H); 13
C NMR (75 MHz, CD3OD) 167.8,
155.1, 151.7, 138.4, 138.2, 133.8, 133.4, 132.8, 132.6, 130.7, 128.3, 126.6, 124.1, 121.1,
114.0, 107.3, 61.0, 52.9, 44.5, 28.7, 21.6, 21.0, 19.5, 18.2; IR (film) νmax 2925, 1721,
1689, 1583, 1480 cm-1
; HRMS (TOF ES+) m/z 599.3227 (M+, C40H44O3N2 requires
599.3274).
82
4-Carboxy Penn Fluor 609 (82)
4-carboxy Penn Fluor 609 methyl ester (81, 20 mgs, 0.03 mmol) was dissolved in MeOH
/ Water (3:2, 10 mL) and aqueous KOH (1 mL of 1 M) was added and the reaction was
allowed to stir at 23 oC for 5 h. The MeOH was removed in vacuo and the solution was
acidified with conc. HCl (to pH 3-4). The aqueous solution was extracted with EtOAc (3
x 25 mL), and dried over anhydrous sodium sulfate. Flash chromatography (MeOH /
Chloroform, 1:9) afforded 82 as a blue film (19 mg, 99%), 1H NMR (300 MHz, CD3OD)
δ 8.06 (s, 1H), 8.01 (d, J = 8.1 Hz, 1H), 7.29 (d, J = 7.8 Hz, 1H), 6.50 (s, 2H), 5.53 (s,
2H), 3.55 (m, 4H), 2.97 (m, 4H), 2.03 (s, 3H), 1.98 (m, 4H), 1.89 (s, 6H), 1.41 (s, 12H);
13C NMR (75 MHz, CD3OD) 169.9, 155.1, 151.7, 138.2, 138.0, 133.7, 133.5, 132.8,
130.6, 128.5, 126.6, 124.1, 121.1, 114.1, 107.3, 61.0, 44.5, 30.7, 28.7, 21.6, 21.0, 19.5,
18.3; IR (film) νmax 3342, 2919, 2848, 1713, 1578 cm-1
; HRMS (TOF ES+) m/z 585.44
(M+, C39H41O3N2 requires 585.44).

128
87
4-(2,7-Difluoro-6-hydroxy-3-oxo-3H-xanthen-9-yl)-3-methyl-N-{2-[5-(2-oxo-
hexahydro-thieno [3,4-d]imidazol-4-yl)-pentanoylamino]-ethyl}-benzamide (87)
Pennsylvania Green-NHS ester (60, 27 mg, 0.058 mmol) and biotin ethylene diamine
(Sigma-Aldrich) (20 mg, 0.07 mmol) were dissolved in DMF (1 mL) and a few drops of
DIEA was added. The reaction was allowed to stir at room temperature for 16 hours then
purified by preparative reverse-phase HPLC (gradient: 1% MeCN, 89.9% H2O, and 0.1%
TFA to 89.9% MeCN, 1% H2O, and 0.1% over 20 min) to afford 87 (29 mg, 78%) as an
orange solid, mp 175-180 oC;
1H NMR (300 MHz, CD3OD) δ 7.84 (s, 1H), 7.78 (dd, J =
8.6 Hz, J = 1.3 Hz, 1H), 7.27 (d, J = 7.9 Hz, 1H), 6.82 (d, J = 7.1 Hz, 2H), 6.64 (d, J =
10.8 Hz, 2H), 4.37 (m, 1H), 4.18 (m, 1H), 3.45 (t, J = 5.3 Hz, 2H), 3.35 (t, J = 6.0 Hz,
2H), 3.10 (m, 1H), 2.79 (dd, J = 12.7 Hz, J = 4.9 Hz, 1H), 2.56 (d, J = 12.7 Hz, 1H), 2.13
(t, J = 7.2 Hz, 2H), 2.02 (s, 3H), 1.6-1.2 (m, 6H); 13
C NMR (75 MHz, CD3OD) 176.7,
169.7, 166.1, 156.1, 153.8, 153.7, 152.7, 138.0, 137.5, 136.3, 130.8, 130.5, 126.4, 115.9,
115.8, 112.9, 112.6, 106.37, 106.32, 63.3, 61.6, 56.9, 41.1, 41.0, 40.0, 36.8, 29.7, 29.4,
26.6, 19.6; IR (film) νmax 3348, 2947, 2838, 1673, 1609, 1180 cm-1
; HRMS (TOF ES+)
m/z 673.1954 (MNa+, C33H32F2O6N4S requires 673.1908).

129
88
[6-Dimethylamino-9-(2-methyl-4-{2-[5-(2-oxo-hexahydro-thieno[3,4-d]imidazol-4-
yl)-pentanoylamino]-ethylcarbamoyl}-phenyl)-xanthen-3-ylidene]-dimethyl-
ammonium (88)
9-(4-carboxy-2-methylphenyl)-6-(dimethylamino)-N,N-dimethyl-3H-xanthen-3-imine
(72, 27 mg, 0.065 mmol), DCC (20 mg, 0.097) and N-hydroxysuccinimide (15 mg, 0.13)
were dissolved in THF (10 mL) and allowed to stir for 2 h. After 2 h, the urea byproduct
was removed by filtration and THF was removed in vacuo. The residue was redissolved
in DMF (1 mL) and biotin ethylene diamine (Sigma-Aldrich) (37 mg, 0.13 mmol) along
with a few drops of DIEA were added. The reaction was allowed to stir at 23 oC for 16 h
then purified by preparative reverse-phase HPLC (gradient: 1% MeCN, 89.9% H2O, and
0.1% TFA to 89.9% MeCN, 1% H2O, and 0.1% over 20 min) to afford 88 (30 mg, 70%)
as an purple film; 1H NMR (300 MHz, CD3OD) δ 7.84 (s, 1H), 7.79 (d, J = 7.7 Hz, 1H),
7.27 (d, J = 7.9 Hz, 1H), 7.00 (m, 4H), 6.89 (s, 2H), 4.36 (m, 1H), 4.15 (m, 1H), 3.45
(m, 2H), 3.35 (m, 2H), 3.27 (s, 12H), 3.18 (m, 1H), 2.79 (dd, J = 12.6 Hz, J = 4.8 Hz,
1H), 2.56 (d, J = 12.6 Hz, 1H), 2.14 (t, J = 7.2 Hz, 2H), 2.00 (s, 3H), 1.32-1.19 (m, 6H);
13C NMR (75 MHz, CD3OD) 176.7, 169.5, 166.0, 159.2, 159.1, 158.3, 138.0, 137.3,
136.4, 132.0, 130.7, 130.5, 126.2, 115.9, 114.4, 97.6, 63.2, 61.6, 56.8, 47.8, 41.2, 41.0,
39.9, 36.8, 29.6, 29.4, 26.8, 19.7; IR (film) νmax 3281, 2935, 1688, 1646, 1597, 1187 cm-
1; HRMS (TOF ES+) m/z 669.3219 (M
+, C37H45O4N6S requires 669.3223).

130
89
4-Carboxy Penn Fluor 576-biotin (89)
4-carboxy Penn Fluor 576 (76, 20 mg, 0.039 mmol), DCC (9.6 mg, 0.047) and N-
hydroxysuccinimide (9 mg, 0.078) were dissolved in THF (10 mL) and allowed to stir for
2 h. After 2 h, the urea byproduct was removed by filtration and THF was removed in
vacuo. The residue was redissolved in DMF (1 mL) and biotin ethylene diamine (Sigma-
Aldrich) (13 mg, 0.046 mmol) along with a few drops of DIEA were added. The reaction
was allowed to stir at 23 oC for 16 h then purified by preparative reverse-phase HPLC
(gradient: 1% MeCN, 89.9% H2O, and 0.1% TFA to 89.9% MeCN, 1% H2O, and 0.1%
over 20 min) to afford 89 (24.5 mg, 82%) as a purple solid, mp 120-122 oC;
1H NMR
(300 MHz, CD3OD) δ 7.84 (s, 1H), 7.79 (dd, J = 8.0 Hz, J = 1.4 Hz, 1H), 7.23 (d, J =
7.9 Hz, 1H), 6.60 (s, 2H), 4.37 (m, 1H), 4.22 (m, 1H), 3.46 (m, 12H), 3.10 (m, 1H), 3.00
(t, J = 6.0, 4H), 2.79 (dd, J = 12.6 Hz, J = 4.8 Hz, 1H), 2.61 (m, 4H), 2.55 (d, J = 12.5
Hz, 1H), 2.15 (t, J = 7.2 Hz, 2H), 2.02 (m, 4H), 2.00 (s, 3H), 1.89 (p, J = 5.3 Hz, 4H),
1.60-1.20 (m, 6H); 13
C NMR (75 MHz, CD3OD) 176.7, 169.6, 166.0, 154.6, 153.5,
152.7, 138.0, 137.2, 136.9, 130.6, 130.5, 126.8, 126.0, 125.8, 113.6, 106.8, 63.2, 61.6,
56.9, 51.9, 51.4, 41.2, 41.0, 39.9, 36.8, 29.6, 29.4, 28.8, 26.8, 21.7, 20.9, 20.8, 19.7; IR
(film) νmax 3272, 2926, 1681, 1596, 1496, 1298 cm-1
; HRMS (TOF ES+) m/z 773.3916
(M+, C45H53O4N6S requires 773.3849).

131
90
4-Carboxy Penn Fluor 609-biotin (90)
4-carboxy Penn Fluor 609 (82, 17 mg, 0.029 mmol), DCC (9.0 mg, 0.043) and N-
hydroxysuccinimide (6 mg, 0.058) were dissolved in THF (5 mL) and allowed to stir for
2 h. After 2 h, the urea byproduct was removed by filtration and THF was removed in
vacuo. The residue was redissolved in DMF (1 mL) and biotin ethylene diamine (13 mg,
0.046 mmol) along with a few drops of DIEA were added. The reaction was allowed to
stir at 23 oC for 16 h then purified by preparative reverse-phase HPLC (gradient: 1%
MeCN, 89.9% H2O, and 0.1% TFA to 89.9% MeCN, 1% H2O, and 0.1% over 20 min) to
afford 90 (16.5 mg, 69%) as a blue film; 1H NMR (360 MHz, CD3OD) δ 7.95 (s, 1H),
7.90 (d, J = 7.6 Hz, 1H), 7.37 (d, J = 7.9 Hz, 1H), 6.60 (s, 2H), 5.6 (s, 2H), 4.46 (m,
1H), 4.28 (m, 1H), 3.65 (m, 4H) 3.48 (m, 4H), 3.06 (m, 5H), 2.89 (dd, J = 12.6 Hz, J =
4.3 Hz, 1H), 2.68 (d, J = 12.5 Hz, 1H), 2.21 (t, J = 7.2 Hz, 2H), 2.13 (s, 3H), 2.07 (m,
4H), 1.89 (s, 6H), 1.60-1.20 (m, 6H), 1.43 (s, 12H); 13
C NMR (75 MHz, CD3OD) 176.8,
169.8, 166.1, 155.3, 151.7, 138.7, 138.2, 134.0, 133.5, 132.8, 130.5, 128.6, 126.5, 124.1,
121.6, 114.0, 107.2, 63.2, 61.6, 61.0, 56.9, 44.5, 41.2, 41.0, 39.9, 36.8, 30.7, 29.6, 29.4,
28.7, 26.7, 21.6, 21.0, 19.8, 18.3; HRMS (TOF ES+) m/z 853.4512 (M+, C51H61O4N6S
requires 853.4475).

132
91
2-(2,7-difluoro-6-oxido-3-oxo-3H-xanthen-9-yl)-5-({[2-({5-[(3aS,4S,6aR)-2-oxohex
ahydro-1H-thieno[3,4-d]imidazol-4-yl] pentanoyl} amino)ethyl] amino} carbonyl)
benzoate (91)
Oregon Green-NHS ester (Molecular Probes) (10 mg, 0.019 mmol) and biotin ethylene
diamine (Sigma-Aldrich) (6.7 mg, 0.023 mmol) were dissolved in DMF (1 mL) and a few
drops of DIEA was added. The reaction was allowed to stir at 23 oC for 16 h then
purified by preparative reverse-phase HPLC (gradient: 1% MeCN, 89.9% H2O, and 0.1%
TFA to 89.9% MeCN, 1% H2O, and 0.1% over 20 min) to afford 91 (11.9 mg, 93%) as a
yellow-orange solid, mp 220-222 oC;
1H NMR (300 MHz, CD3OD) δ 8.34 (s, 1H), 8.10
(dd, J = 8.0 Hz, J = 1.5 Hz, 1H), 7.23 (d, J = 8.0 Hz, 1H), 6.73 (d, J = 7.4 Hz, 2H), 6.34
(d, J = 11.1 Hz, 2H), 4.39 (m, 1H), 4.16 (m, 1H), 3.36 (m, 4H), 3.08 (m, 1H), 2.75 (dd, J
= 12.7 Hz, J = 4.9 Hz, 1H), 2.54 (d, J = 12.7 Hz, 1H), 2.11 (t, J = 7.3 Hz, 2H), 1.52-1.20
(m, 6H); 13
C NMR (75 MHz, CD3OD) 176.7, 169.7, 168.6, 167.9, 151.9, 150.8, 148.9,
146.0, 138.2, 137.5, 135.5, 130.8, 126.0, 125.7, 114.5, 114.3, 110.09, 110.06, 106.17,
106.15, 63.3, 61.6, 56.9, 41.1, 41.0, 39.0, 36.8, 29.7, 29.4, 26.7; IR (film) νmax 3299,
3070, 2920, 1766, 1691, 1643, 1190 cm-1
; HRMS (TOF ES+) m/z 681.1857 (MH+,
C33H30F2O8N4S requires 681.1831).
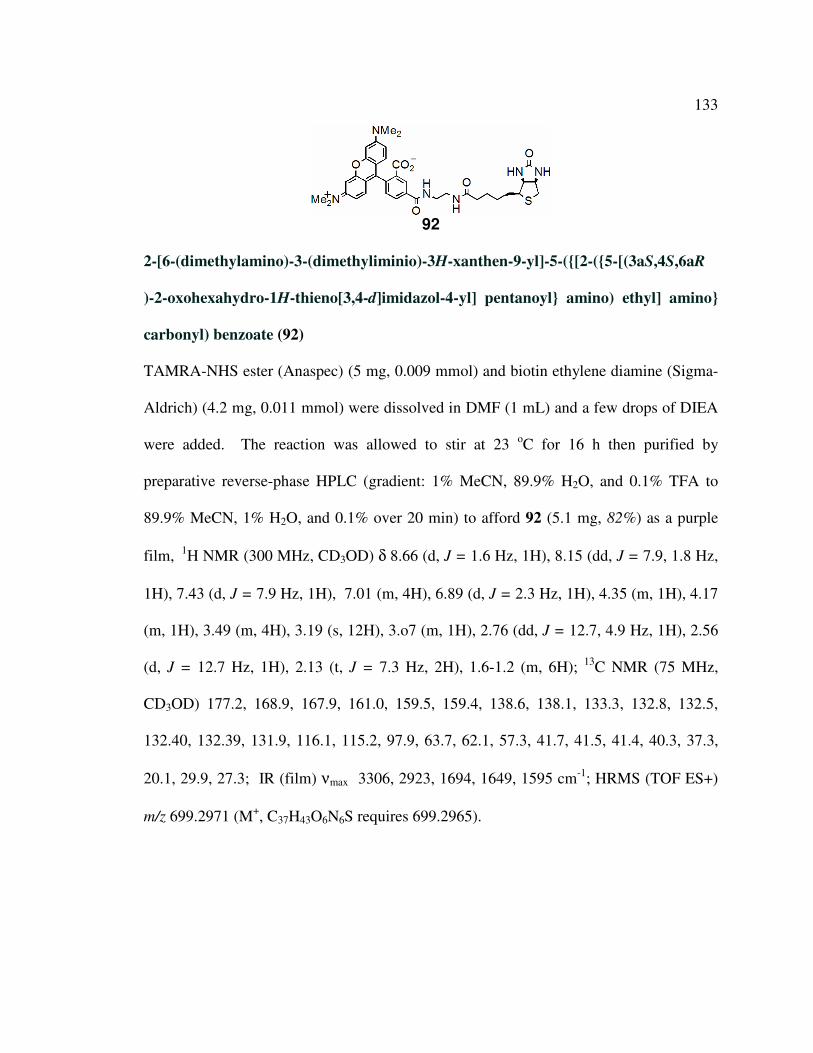
133
92
2-[6-(dimethylamino)-3-(dimethyliminio)-3H-xanthen-9-yl]-5-({[2-({5-[(3aS,4S,6aR
)-2-oxohexahydro-1H-thieno[3,4-d]imidazol-4-yl] pentanoyl} amino) ethyl] amino}
carbonyl) benzoate (92)
TAMRA-NHS ester (Anaspec) (5 mg, 0.009 mmol) and biotin ethylene diamine (Sigma-
Aldrich) (4.2 mg, 0.011 mmol) were dissolved in DMF (1 mL) and a few drops of DIEA
were added. The reaction was allowed to stir at 23 oC for 16 h then purified by
preparative reverse-phase HPLC (gradient: 1% MeCN, 89.9% H2O, and 0.1% TFA to
89.9% MeCN, 1% H2O, and 0.1% over 20 min) to afford 92 (5.1 mg, 82%) as a purple
film, 1
H NMR (300 MHz, CD3OD) δ 8.66 (d, J = 1.6 Hz, 1H), 8.15 (dd, J = 7.9, 1.8 Hz,
1H), 7.43 (d, J = 7.9 Hz, 1H), 7.01 (m, 4H), 6.89 (d, J = 2.3 Hz, 1H), 4.35 (m, 1H), 4.17
(m, 1H), 3.49 (m, 4H), 3.19 (s, 12H), 3.o7 (m, 1H), 2.76 (dd, J = 12.7, 4.9 Hz, 1H), 2.56
(d, J = 12.7 Hz, 1H), 2.13 (t, J = 7.3 Hz, 2H), 1.6-1.2 (m, 6H); 13
C NMR (75 MHz,
CD3OD) 177.2, 168.9, 167.9, 161.0, 159.5, 159.4, 138.6, 138.1, 133.3, 132.8, 132.5,
132.40, 132.39, 131.9, 116.1, 115.2, 97.9, 63.7, 62.1, 57.3, 41.7, 41.5, 41.4, 40.3, 37.3,
20.1, 29.9, 27.3; IR (film) νmax 3306, 2923, 1694, 1649, 1595 cm-1
; HRMS (TOF ES+)
m/z 699.2971 (M+, C37H43O6N6S requires 699.2965).

134
93
ROX-Biotin (93)
ROX-NHS ester (Anaspec) (10 mg, 0.0150 mmol) and biotin ethylene diamine (Sigma-
Aldrich) (5.5 mg, 0.019 mmol) were dissolved in DMF (1 mL) and a few drops of DIEA
were added. The reaction was allowed to stir at 23 oC for 16 h then purified by
preparative reverse-phase HPLC (gradient: 1% MeCN, 89.9% H2O, and 0.1% TFA to
89.9% MeCN, 1% H2O, and 0.1% over 20 min) to afford 93 (11.4 mg, 95%) as a purple
solid, mp 210-214 oC;
1H NMR (300 MHz, CD3OD) δ 8.62 (s, 1H), 8.10 (dd, J = 7.9 Hz,
J = 1.7 Hz, 1H), 7.35 (d, J = 7.9 Hz, 1H), 6.55 (s, 2H), 4.34 (m, 1H), 4.18 (m, 1H),
3.45 (m, 12H), 3.07 (m, 1H), 3.00 (m, 4H), 2.80 (dd, J = 12.7 Hz, J = 4.9 Hz, 1H), 2.56
(m, 5H), 2.14 (t, J = 7.2 Hz, 2H), 2.02 (m, 4H), 1.85 (m, 4H), 1.60-1.20 (m, 7H); 13
C
NMR (75 MHz, CD3OD) 175.7, 167.6, 165.0, 163.0, 155.6, 152.4, 151.7, 137.8, 136.3,
132.0, 131.2, 131.1, 130.3, 125.8, 124.4, 112.9, 105.6, 62.2, 60.6, 55.9, 50.8, 50.4, 40.2,
40.0, 38.8, 35.8, 28.7, 28.4, 27.5, 25.9, 20.7, 19.9, 19.8; IR (film) νmax 3295, 2931,
1695, 1648, 1594, 1237 cm-1
; HRMS (TOF ES+) m/z 803.3591 (M+, C45H51O6N6S
requires 803.3564).

135
4.11.3 Streptavidin Imaging
Confocal Imaging of CHO-K1 Cells:
An inverted Zeiss LSM 5 Pascal confocal laser-scanning microscope fitted with a Plan
Apochromat oil-immersion objective (63 X) was utilized. The 488 nm laser line of the
Ar-ion laser and the 543 nm line of the HeNe laser (1 mW) were used to excite the green
and red fluorophores, respectively. The emitted photons for the green fluorophores were
collected through a 505 nm LP filter while a 560 nm LP filter was employed to collect
emitted photons for the red fluorophores. The cells, seeded on collagen-coated glass
coverslips, were carefully removed from the 6-well plate and mounted on microscope
slides bearing a press-to-seal silicone isolator with cell culture medium to allow for live
cell imaging throughout the course of the experiment.
4.12 References
1. Paoli, M.; Liddington, R.; Tame, J.; Wilkinson, A.; Dodson, G., Crystal structure
of T state haemoglobin with oxygen bound at all four haems. J. Mol. Biol. 1996, 256, (4),
775-792.
2. Haugland, R. P., The Handbook: A guide to Fluorscent Probes and Labeling
Technologues. Invitrogen Corp.: 2005.

136
3. Martin, V. V.; Rothe, A.; Gee, K. R., Fluorescent metal ion indicators based on
benzoannelated crown systems: a green fluorescent indicator for intracellular sodium
ions. Bioorg. Med. Chem. Lett. 2005, 15, (7), 1851-1855.
4. Kauffman, J.; Imbesi, S., Synthesis of Julolidine Derivatives. Organic
Preparations and Procedures Int. 2001, 33, (6), 603-613.
5. Theoclitou, M. E.; Robinson, L. A., Novel facile synthesis of 2,2,4 substituted
1,2-dihydroquinolines via a modified Skraup reaction. Tetrahedron Lett. 2002, 43, 3907-
3910.
6. Van Gompel, J.; Schuster, G. B., Chemiluminescence of organic peroxides:
intramolecular electron-exchange luminescence from a secondary perester. Journal of
Organic Chemistry. 1987, 52, (8), 1465-1468.
7. Kubin, R.; Fletcher, A., Fluorescence Quantum Yields of some Rhodamine Dyes.
Journal of Luminescence. 1982, 27, 455-462.
8. Gruber, H. J.; Kada, G.; Marek, M.; Kaiser, K., Accurate titration of avidin and
streptavidin with biotin-fluorophore conjugates in complex, colored biofluids. Biochim.
Biophys. Acta. 1998, 1381, (2), 203-212.

137
9. Kada, G.; Falk, H.; Gruber, H. J., Accurate measurement of avidin and
streptavidin in crude biofluids with a new, optimized biotin-fluorescein conjugate.
Biochim Biophys Acta. 1999, 1427, (1), 33-43.
10. Wu, M. M.; Llopis, J.; Adams, S.; McCaffery, J. M.; Kulomaa, M. S.; Machen, T.
E.; Moore, H. P.; Tsien, R. Y., Organelle pH studies using targeted avidin and
fluorescein-biotin. Chem Biol. 2000, 7, (3), 197-209.
11. Weber, W.; Stelling, J.; Rimann, M.; Keller, B.; Daoud-El Baba, M.; Weber, C.
C.; Aubel, D.; Fussenegger, M., A synthetic time-delay circuit in mammalian cells and
mice. Proc. Natl. Acad. Sci. 2007, 104, (8), 2643-2648.
12. Gustavsson, M.; Lehtio, J.; Denman, S.; Teeri, T. T.; Hult, K.; Martinelle, M.,
Stable linker peptides for a cellulose-binding domain-lipase fusion protein expressed in
Pichia pastoris. Protein Eng. 2001, 14, (9), 711-715.

138
CHAPTER 5
Small Molecules that Heterodimerize Estrogen Receptors and
Heat Shock Protein 90
5.1 Introduction
Molecular chaperones are proteins and protein complexes that bind to misfolded
or unfolded polypeptide chains and affect the subsequent folding processes of these
chains. The misfolded proteins to which chaperones bind are said to be "non-native,"
meaning that they are not folded into their functional conformation. Chaperones are
found in all types of cells and cellular compartments, and have a wide range of binding
specificities and functional roles. The term “molecular chaperone” was coined by Ron
Laskey in 1978.1 It was determined that chaperone proteins directing correct assembly
were similar to many proteins expressed at high levels when cells are grown at high
temperatures (hence the common alternative name, "heat shock protein," or Hsp). Most
chaperones are abundantly expressed under normal cell growth conditions, where they
recognize non-native conformations occurring during both protein synthesis and later
misfolding events.

139
Figure 5.1. The steroid receptor chaperone cycle illustrating folding of the estrogen
receptor (ER). Adapted from a review by Pratt and Toft.2
As seen in Figure 5.1 and as thoroughly reviewed by Pratt and Toft, the assembly
pathway for the steroid receptor-chaperone complexes can involve at least 10 chaperone
components, five of which are obligatory in vitro.2 Three of the obligatory components
are constitutively expressed forms of Hsp70, DnaJ/Hsp40, and Hsp90. Two co-
chaperone proteins are additionally required: the Hsp90-binding protein p23 and

140
Hsp70/Hsp90 organizing protein (Hop), which brings Hsp70 and Hsp90 together in a
common complex. There are four additional proteins, also nonessential in minimal in
vitro assays, that bind Hsp90 and are recovered in native receptor complexes. These are
the FK506-binding immunophilins FKBP52 and FKBP51, the cyclosporin-A-binding
immunophilin cyclophilin 40 (Cyp40), and the protein phosphatase PP5. Each competes
with Hop for binding to Hsp90.3
Hsp90 is an abundant and essential molecular chaperone, which appears to be the
central protein in the steroid receptor chaperone cycle. Due to its activity and abundance
Hsp90 is currently a sought after target for anti-cancer treatment. Hsp90 is a dimeric
protein consisting of three domains: an N-terminal ATP binding domain, a middle region,
and a C-terminal domain involved in homodimerization.4 Although its ATPase activity is
weak, ATP binding and hydrolysis is crucial to chaperone function. Several drugs that
have been designed to target Hsp90, such as geldanamycin (94), bind the ATP pocket at
the N-terminal domain.
5.2 Hsp90 Inhibitors
The benzoquinone ansamycin family is characterized by a quinone moiety linked
to a planar macrocyclic ansa bridge structure. Geldanamycin (Gdm, 94, Figure 5.2) is an
example of this family isolated from Streptomyces hygroscopicus var geldanus var nova5
that acts as an Hsp90 inhibitor. It binds in the ATP-binding pocket of Hsp90 and alters
the protein’s function.6 Gdm (94) reduces gene expression mediated by hormone-
stimulated steroid receptors, and has been shown to interrupt the steroid receptor

141
chaperone cycle. Short incubations of Gdm (94) with MCF-7 human breast cancer cells
reduced the binding of estradiol to just 3% of control cells.7 Gdm (94) has been shown to
significantly decrease the half-life of the Glucocorticoid Receptor (GR) protein expressed
in HeLa cells, from 4 hours in control cells to 1 hour in treated cells,8 and it prevents
dexamethasone-bound GR from translocating into the nucleus, trapping the receptor at an
intermediate heterocomplex assembly stage.9 Receptor loss results from protein
degradation by the ubiquitin-proteosome pathway.
Figure 5.2. Structures of selected Hsp90 inhibitors.
Although most studies have implicated the proteasome in downregulation of
steroid receptors by Hsp90 inhibitors,10, 11
one recent study found evidence for separate
mechanisms for radicicol- versus E2-induced ER downregulation. Radicicol (96), an
antifungal antibiotic that inhibits various signal transduction proteins such as v-src, ras,
Raf-1, and mos, was found to bind to Hsp90, thus making it the prototype of a second

142
class of Hsp90 inhibitors, distinct from the chemically unrelated benzoquinone
ansamycins.12
17-Allylamino-17-demethoxy-geldanamycin (17-AAG, 97) is a promising anti-
cancer derivative of Gdm and it is the first Hsp90 inhibitor to enter clinical trials. Binding
of this drug to Hsp90 results in the degradation of a number of oncogenic client proteins
including estrogen receptor (ER). 17-AAG (97) displays therapeutic selectivity towards
malignant cells, minimizing toxicity in normal tissues. Part of this selectivity appears to
be due to changes in Hsp90 in transformed cells; Hsp90 from normal cells tends to be
largely uncomplexed, whereas Hsp90 from maligancies is isolated as multichaperone
complexes with much higher affinities for 17-AAG (97).13
5.3 Previously Reported Estradiol-Geldanamycin Dimers
In an effort to specifically affect the interactions between ER and Hsp90, chimeric
compounds comprising Gdm linked to estradiol via short tethers containing seven carbon
atoms were reported in 1999 (Figure 5.3).14
These chimeric compounds selectively
induce degradation of ERs and the HER2 oncoprotein in MCF7 breast cancer cells. The
aim of the study was to target the Hsp90 interaction with the ER in order to provide a
molecule specific for ER degradation. While these compounds were interesting,
geldanamycin alone was shown to induce degradation of the same proteins, with better
IC50 values than that of the synthetic dimers. Due to the short tether used to link the

143
protein ligands, these compounds are unlikely to stabilize heterodimerization of ER and
Hsp90 proteins.
Figure 5.3. Structures of estradiol-geldanamycin dimers synthesized by Kuduk and
coworkers.14
These previously reported molecules have not been shown to heterodimerize ER
and Hsp90. However, a dimer molecule capable of such heterodimerization might affect
ER function through a new mechanism. These compounds could potentially prevent the
dissociation of ERs from Hsp90. If such a molecule could form stable heterodimers in
vivo, leading to specific disruption of estrogen receptor function, it might overcome some
of the limitations of antiestrogen cancer therapy. As long as the ER retains binding
ability for the dimer molecule, this heterodimerization mechanism should still be active.
These studies have the potential to reveal a novel therapeutic strategy effective against
hormone-dependent breast cancers.

144
5.4 Design of Novel Estrone-Geldanamycin Dimers
Figure 5.4. Structures of new synthetic estrone-geldanamycin dimers.
Previous studies in our lab employed x-ray crystal structures of ERβ bound to the
anti-estrogen IC 164,384 and streptavidin (SA) bound to biotin to design molecules that
heterodimerize ER and streptavidin in living yeast cells.15
A similar examination of the
crystal structure of Gdm bound to the ATP binding pocket of Hsp90 suggested that a
linker longer than that used by Kuduk14
would be necessary to prevent steric hindrance if
used to dimerize ER and Hsp90. To that end, we designed and synthesized an estrone-
geldanamycin dimer (100, Figure 5.4) with a 19-atom linker, along with several control
molecules (101, 102). In order to reduce Gdm’s (94) affinity for Hsp90, the carbamate

145
on the 7-position of Gdm of compound 100 was cleaved to provide 101.16
This control
should bind ER but not Hsp90. In order to provide a control that reduces the affinity of
estrone for ER, an ethylated version of E1-Gdm was designed.17
This dimer control (102)
should only bind Hsp90.
5.5 Synthesis of Estrone-Geldanamycin Dimers
Figure 5.5. Synthesis of E1-Gdm (100) and E1-Gdm-OH (101).

146
The synthesis of E1-Gdm (100) is shown in Figure 5.5. The (O-
carboxymethyl)oxime derivative of estrone (103) was prepared in quantitative yield by
treatment with aminooxyacetic acid hydrochloride in pyridine. The resulting carboxylic
acid (104) was converted to its N-hydroxysuccinimidyl ester with DCC and NHS. The
resulting ester was treated with N,N-dimethyl-1,6-hexanediamine. This amine was
treated with the N-hydroxysuccinimidyl ester of Fmoc-aminohexanoic acid to afford
compound 105. Upon Fmoc deprotection with piperidine in DMF, geldanamycin was
coupled to the primary amine to afford E1-Gdm (100). The carbamate at the 7-postion of
Gdm was cleaved18
using potassium t-butoxide in DMSO to afford E1-Gdm-OH (101).
For control 102, the synthesis began with the alkylation of estrone (103) with ethyl
iodide, followed by the steps described above to afford Et-E1-Gdm (Figure 5.6, 102).
Figure 5.6. Synthesis of compound 102.
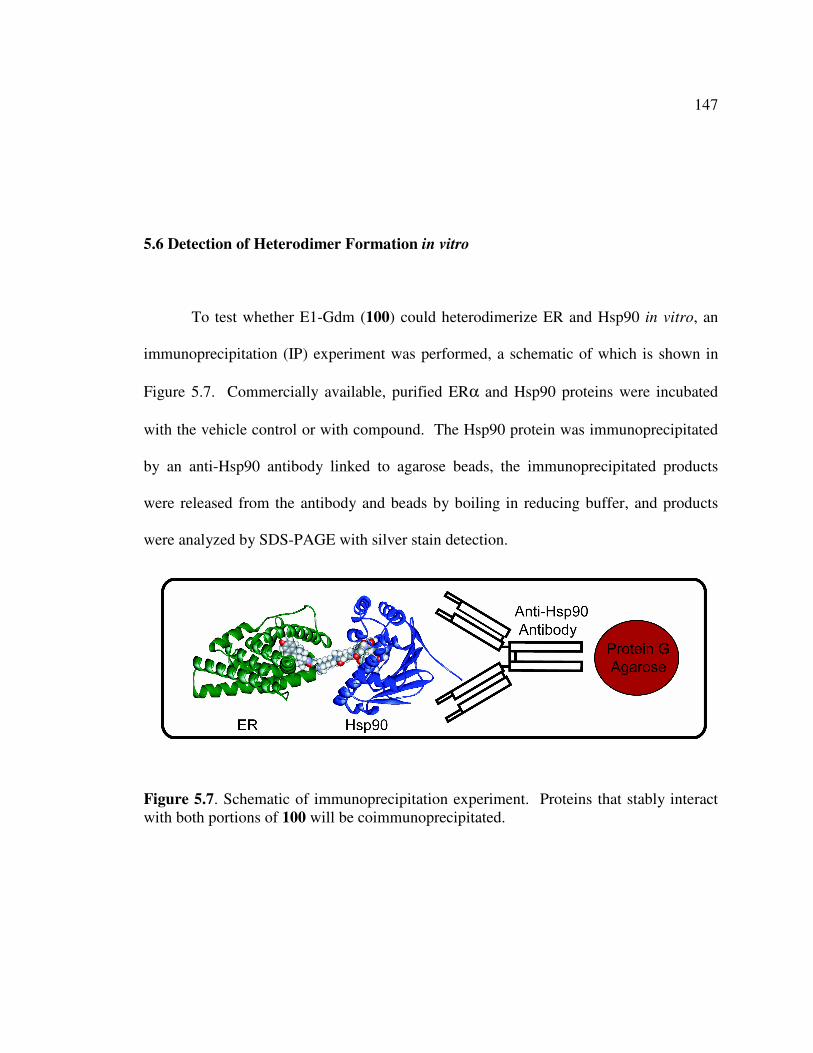
147
5.6 Detection of Heterodimer Formation in vitro
To test whether E1-Gdm (100) could heterodimerize ER and Hsp90 in vitro, an
immunoprecipitation (IP) experiment was performed, a schematic of which is shown in
Figure 5.7. Commercially available, purified ERα and Hsp90 proteins were incubated
with the vehicle control or with compound. The Hsp90 protein was immunoprecipitated
by an anti-Hsp90 antibody linked to agarose beads, the immunoprecipitated products
were released from the antibody and beads by boiling in reducing buffer, and products
were analyzed by SDS-PAGE with silver stain detection.
Figure 5.7. Schematic of immunoprecipitation experiment. Proteins that stably interact
with both portions of 100 will be coimmunoprecipitated.

148
Figure 5.8. Immunoprecipitation experiment. From left to right, lane 1 shows Hsp90
only in the absence of compound. Lane 2 shows Hsp90 and ER with addition of 10 µM
E1-G (100). Lane 3 shows Hsp90 and a slight ER band with addition of 10 µM of the
ethylated estrone control (102). Lane 4 shows Hsp90 only with 10 µM of the cleaved
carbamate control (101). Lane 5 shows Hsp90 with addition of 10 µM 17β-estradiol as a
competitor. Lane 6 shows Hsp90 only with addition of 10 µM Gdm (94) as a competitor.
As can be seen in Figure 5.8, upon addition of vehicle alone (Lane one) only
Hsp90 is immunopreciptated. Lane two shows that both Hsp90 and ER are
immunoprecipitated when 10 µM E1-Gdm (100) is added, showing heterodimerization of
the two proteins. A faint ER band is seen in lane three when Et-E1-Gdm (102) is used.
This indicates that control 102 has a slight affinity for the ER protein but is clearly less
that that of E1-Gdm (100). There was no ER present in lane four, a result expected for a
compound that does not bind Hsp90. Lanes five and six show specificity of 100 for both
ER and Hsp90 as illustrated by the ability of estradiol and Gdm to compete away the
interaction observed in lane two.
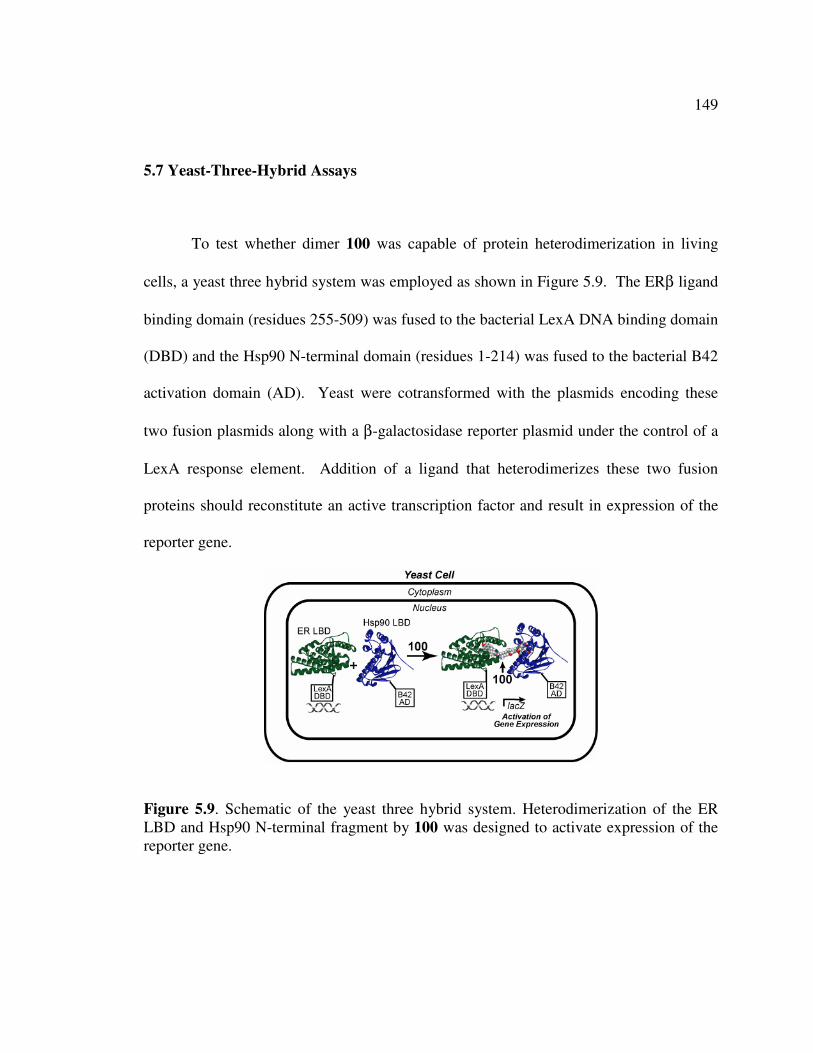
149
5.7 Yeast-Three-Hybrid Assays
To test whether dimer 100 was capable of protein heterodimerization in living
cells, a yeast three hybrid system was employed as shown in Figure 5.9. The ERβ ligand
binding domain (residues 255-509) was fused to the bacterial LexA DNA binding domain
(DBD) and the Hsp90 N-terminal domain (residues 1-214) was fused to the bacterial B42
activation domain (AD). Yeast were cotransformed with the plasmids encoding these
two fusion plasmids along with a β-galactosidase reporter plasmid under the control of a
LexA response element. Addition of a ligand that heterodimerizes these two fusion
proteins should reconstitute an active transcription factor and result in expression of the
reporter gene.
Figure 5.9. Schematic of the yeast three hybrid system. Heterodimerization of the ER
LBD and Hsp90 N-terminal fragment by 100 was designed to activate expression of the
reporter gene.

150
Figure 5.10. Dose response and competition experiments in yeast three hybrid assays.
Panel A: Dose response with E1-Gdm (100), including dropout controls. Panel B: Gdm
(94) competition assay against a fixed concentration of E1-Gdm (100).
E1-Gdm (100) was found to induce reporter activity four-fold over the vehicle
control (Figure 5.10, Panel A). This activity could be effectively competed away by
addition of geldanamycin (94) (Panel B). There is some ligand-activated one hybrid
activity with the ER-LexA fusion protein, but the activity levels are much lower than for
the complete system. There is also some background seen in the absence of any ligand
possibly due a constitutive interaction between Hsp90 and ER.
The decrease in activity seen upon addition of geldanamycin (94) as a competitor
seems to indicate that E1-Gdm (100) mediates heterodimerization of ER and Hsp90.
However, the possibility exists that Gdm (94) is actually decreasing transcription in a
non-specific manner through toxicity. Despite the fact that the assay method takes into
account the optical density of the yeast cell lysate and uses that to normalize for cell
number, for shorter incubation times toxic effects may not be detected. For longer
incubation times, we would expect to see decreased cell density in wells that suffered
from compound cytotoxicity compared to control wells. Further experiments are needed

151
in order to draw a firm conclusion about results obtained with the yeast-three-hybrid
assay.
Whereas yeast can serve as a good model system to study protein-protein
interactions, it has its disadvantages. Compared to mammalian cells, yeast are much less
permeable to small molecules, so compounds that get into a mammalian cell in culture
might be excluded from yeast. There are also differences in the proteins present in yeast
cells, as post-translational modifications often vary in yeast and mammalian cells. For
those reasons, we investigated a more relevant mammalian culture system as a model
system.
5.8 Mammalian Three-Hybrid Assays
We used several different assays to study the effects of estrone-geldanamycin
dimers in mammalian cells. In one case, a three-hybrid system similar to the one used in
yeast was constructed. We expressed both ligand binding domain fragments as well as
full length proteins as fusion proteins. For the shorter fragments, we fused the Gal4 DBD
to the human ERα LBD (residues 305-595) and the Hsp90 N-terminal domain (residues
1-214) to the VP16 activation domain. We also fused the full length hERα (1-595) to the
Gal4 DBD and full length Hsp90 to the VP16 AD. The reporter plasmid used with these
constructs encoded luciferase under the control of five Gal4 recognition sites. A
constitutively active β-galactosidase-expressing plasmid was cotransfected to normalize
transfection efficiency and cell number. The mammalian three-hybrid assays used the

152
CHO-K1 Chinese hamster ovary cell line and were performed by Dr. Megan MacBride
(Penn State).
Figure 5.11. CHO mammalian three-hybrid assay. Panel A: Dose response with
estradiol (E2) and E1-Gdm (100). Panel B: Dropout controls.
The three hybrid assay with Gal4-Hsp90 (1-214) and VP16-hERα (305-595) gave
interesting results, as shown in Figure 5.11. High background activity in the absence of
ligand could be decreased through the addition of either estradiol or E1-Gdm (100). E1-
Gdm (100) could maximally decrease the activity to a greater degree, but was less potent
than estradiol. Dropout controls with the one hybrid experiment using Gal4-Hsp90 (1-
214) also showed a high background in the absence of ligand, but this could not be
decreased by the addition of E1-Gdm (100) or estradiol. The Gal4-Hsp90 (1-214) fusion
protein is apparently able to induce reporter expression by itself, perhaps by recruiting
other transcription factors. That the unliganded one hybrid activity (Figure 5.11, Panel
B), but not the three hybrid activity (Figure 5.11, Panel A), could not be decreased by
ligand would seem to indicate that either ligand causes an interaction between ER and
Hsp90 that blocks transcription in the three-hybrid assay.

153
If the natural chaperone cycle is considered, both unliganded fusion proteins
might be expected to interact, and estradiol may be able to disrupt that interaction.
However, it has been reported that related Gal4-VP16 fusions to the ER hinge and LBD
regions (including a similar 300-595 ER LBD fragment) do not interact with Hsp90 when
transiently expressed in COS-7 cells.19
Recycling of receptors is thought to involve
Hsp90 binding to liganded receptors, particularly with ER, so there may actually be a
greater affinity between Hsp90 and estradiol-bound ER. However, this interaction should
reconstitute an active transcription factor and induce reporter expression, which was not
observed. The decrease in reporter transcription could possibly indicate that estradiol
allows VP16-hERα (305-595) to participate in removing Gal4-Hsp90 (1-214) from DNA,
perhaps through some mechanism involving the natural nuclear shuttling seen in steroid
receptors. In the case of E1-Gdm (100), this three hybrid transcriptional decrease is even
greater. This dimer molecule is expected to heterodimerize the two fusion proteins. If
the mechanism of the transcriptional decrease involves pulling the Gal4 fusion off of
DNA, this compound might do that more effectively by forming a more stable
heterodimer.
Several other sets of mammalian three hybrid experiments were performed, each
with different combinations of the fragment and full length fusion vectors, combining the
Gal4-Hsp90 fragment and full length fusions with the full length human ER protein,
hERα (1-595). The three hybrid assay with the full length fusion proteins gave very little
transcriptional readout, regardless of ligand. Unfortunately, other combinations did not
provide meaningful conclusions about the compounds’ activity.

154
5.9 Mammalian ER Reporter Gene Assays with ERE Sites
Estrogen receptor (ER) transactivation assays were initially designed to study
endogenous mechanisms of steroid hormone action. We wanted to test the effects of the
estrone-geldanamycin dimers in an ER transactivation assay. Full length human ERα
was cotransfected with a luciferase reporter gene under the control of three tandem ERE
sites into SKN-BE(2)-C human neuroblastoma cells. In this assay, addition of an ER
agonist such as 17β-estradiol results in dose-dependent expression of the reporter gene
(Figure 5.12). This activity can be competed away with an ER antagonist such as
tamoxifen or ICI 182,780. These transcriptional assays were performed by Dr. Megan
MacBride.
Figure 5.12. Schematic of ER reporter gene assay. Agonist ligands induce receptor
dimerization, DNA binding, and expression of the downstream reporter gene.

155
As expected, Gdm (94) induces no transactivation in this assay (Figure 5.13). The
E1-Gdm dimer (100) was found to induce reporter expression, but compared to 17β-
estradiol (E2), 100 is much less potent and has lower maximal activity. In a competition
assay against a constant dose of 1 nM 17β-estradiol, Gdm (94) potently and completely
knocks out E2-mediated transactivation in a dose-dependent manner. Although this
compound is clearly toxic at higher doses, the influence of toxicity-induced effects
should be reduced due to normalization of each well through constitutive β-galactosidase
expression. For the lower doses, the decrease in activity should be attributable to actions
of the compound other than cytotoxicity. From the dose response data, it is clear that
Gdm (94) does not activate the ER and presumably thus is not an ER ligand. The
mechanism of decreased transactivation is likely due to decreases in ER protein levels as
a result of the Hsp90-inhibitory effects of Gdm (94) as well as a reduction in ER affinity
for estradiol. E1-Gdm (100) also induces a decrease in the level of E2-mediated
transcription, but is less potent and to a lesser level than Gdm (94). As the maximal
decrease is approximately the maximal level of activation seen in the dose response, E1-
Gdm (100) could be functioning as a classical partial agonist.

156
Figure 5.13. ER reporter gene assays. Panel A: Dose response curves with E1-G (100),
Gdm (94) and the control agonist 17β-estradiol. Panel B: Competition assay against a
constant 1 nM concentration of 17β-estradiol.
5.10 Mammalian Cytoxicity Assays
Cellular proliferation assays were used to assess the toxicity of the estrone-
geldanamycin dimer compared to geldanamycin itself and 17-allylaminogeldanamycin
(17-AAG, 97). 17-AAG is known to display greater selectivity for cancer cells over
normal cells, and thus has less non-specific toxicity. 17-AAG is currently in clinical
trials for the treatment of breast cancer. We used a sulforhodamine B-based assay20
to
measure the total biomass of cells after a four day incubation with compound or vehicle
control. We compared the MCF-7 human breast carcinoma cell line to the HEK293 line,
which is a human embryonic kidney cell line. The cytotoxicity assays were performed by
Dr. Megan MacBride.

157
Figure 5.14. Cellular toxicity assays. Panel A: HEK293 human embryonic kidney cells.
Panel B: MCF-7 human breast cancer cells.
Seen in Figure 5.14, 17-AAG (97) showed less toxicity than Gdm (94) towards
the HEK293 cell line, whereas the toxicities were similar for MCF-7 cells treated with
the other two compounds. E1-Gdm (100) is much less toxic than either 17-AAG (97) or
Gdm (94), particularly at higher concentrations of compound. This result matched well

158
with our visual observations of cells treated with Gdm (94) and E1-Gdm (100). Two
controls are shown to demonstrate that the vehicle causes little to no toxicity on its own;
untreated cells are compared to cells that received 0.1% DMSO as vehicle. In previous
assays, we used 1% DMSO but found that this concentration caused significant toxicity
by itself in these cell lines.
5.11 Subcellular Localization of Fluorescently-tagged ER and Hsp90 in Mammalian
Cells
In order to directly visualize interactions between the estrogen receptor and
Hsp90 in mammalian cells, we constructed vectors for two fluorescent fusion proteins.
We fused the full length human ERα to the monomeric green fluorescent protein AcGFP.
We also fused the monomeric red fluorescent protein mRFP to the full length human
Hsp90β. The red and green fluorescent labels are orthogonal, allowing us to visualize
them without overlap between spectral channels. The monomeric nature of the
fluorescent tags is also important; wild type fluorescent proteins are known to form
dimers and tetramers, which can influence the behavior of the fused protein of interest.21
The two fluorescent fusion proteins were tranfected into SKN-BE(2)-C human
neuroblastoma cells. After treatment with ligand, cells were incubated for 1-24 hours
before fixation and visualization by confocal microscopy. We saw similar results for
experiments performed at 1, 1.5, 2, 4 and 24 hours after compound addition. In the
absence of ligand, with vehicle or with 17β-estradiol treatment, ER is invariably localized
to the nuclear compartment, with Hsp90 primarily found outside the nucleus. Upon

159
addition of either E1-Gdm (100) or Gdm (94), the ER is no longer seen in the nuclear
compartment; colocalized ER and Hsp90 are seen in the cytoplasm, varying from diffuse
to punctate in distribution. Treatment with Gdm (94) seems to always yield a punctuate
pattern, whereas E1-Gdm (100) treatment yields both diffuse and punctate localization in
the same experiment (Figure 5.15). Typically, the cells with higher apparent expression
levels tended to have a more diffuse than punctate cytoplasmic localization of the fusion
proteins. This translocation can be inhibited by addition of 17β-estradiol in the case of
E1-Gdm (100), but not for Gdm (94). The ethylated estrone control compound 102
seems to behave similarly to Gdm (94). The cleaved carbamate ligand 101 acts like an
ER ligand, and the ER is found in the nucleus upon treatment with this control. This is to
be expected if the control compounds are each binding one specific protein.

160
Figure 5.15. Differential
interference contrast (DIC)
and laser scanning confocal
micrographs of SKN-BE(2)-
C human neuroblastoma
cells expressing hERα (1-
595)-AcGFP and mRFP-
Hsp90. Laser settings were
identical for all micrographs.
Scalebar represents 50 µm.
Cells were fixed 90 min after
compound addition. Panel
A: 1% DMSO (vehicle
control). Panel B: 100 nM
E2. Panels C and D: 10 µM
Gdm (94) without (G) and
with (H) coadministration of
100 nM E2 (1). Panels E
and F: 10 µM E1-Gdm (100)
without (E) and with (F)
coadministration of 100 nM
E2. Panel G: 10 µM 101.
Panel H: 10 µM 102. White
arrows illustrate localization
of ER in the nucleus. Yellow
fluorescence in the DIC +
Fluor. panels indicates
colocalization.

161
Figure 5.16. Differential
interference contrast
(DIC) and laser scanning
confocal micrographs of
SKN-BE(2)-C human
neuroblastoma cells
expressing hERα (1-
595)-AcGFP and mRFP-
Hsp90. Laser settings
were identical for all
micrographs. Scalebar
represents 50 µm. Cells
were fixed 24 h after
compound addition.
Panel A: 1% DMSO
(vehicle control). Panel
B: 100 nM E2. Panel C:
10 µM E1-Gdm (100)
displaying punctate
localiz-ation. Panel D:
10 µM E1-Gdm (100)
displaying more diffuse
localization. Panel E: 50
µM E1-Gdm (100)
displaying punctate
local-ization. Panel F:
50 µM E1-Gdm (100)
displaying more diffuse
localization. Panel G: 10
µM Gdm (94). White
arrows illustrate
localization of ER in the
nucleus. Yellow
fluorescence in the DIC
+ Fluor. panels indicates
colocalization.
162
The translocation of ER from the nucleus to the cytoplasm may actually result
from inhibition of nuclear import rather than induction of a new export pathway. Steroid
receptors exist in a dynamic equilibrium where receptors are constantly moving into and
out of the nucleus. Observation of a receptor type predominantly in the nucleus or the
cytoplasm results from processes that favor accumulation in one area of the cell over
another. Thus, the ER is constantly leaving and reentering the nucleus. Gdm (94) and
E1-Gdm (100) may work by somehow trapping the ER in the cytoplasm. Since Hsp90 is
involved in the refolding of proteins and the recycling of nuclear receptors, these
processes may be necessary for ER to return to the nucleus. Changes in conformation or
protein stability influenced by phosphorylation, acetylation or other events may result in
significant differences between newly synthesized ER and ER that has been in the
nucleus and returned to the cytoplasm.
In experiments performed using MCF-7 cells, no apparent degradation or
downregulation of ER was seen, which does not match published observations. One key
difference would be that prior reports used primarily endogenously ER expressed and
detection by immunofluorescence. Despite our careful investigations into the best
possible fusion proteins, it is certainly possible that the ER-AcGFP fusion protein
behaves in a fundamentally different way than natively expressed ER, at least in regards
to Gdm-induced degradation.

163
5.12 Proposed Mechanism of Action of the Estrone-Geldanamycin Dimer
The in vitro immunoprecipitation experiment provides clear evidence that our
new molecule can heterodimerize the full length estrogen receptor and Hsp90 in a
simplified system. Whether that extends to in vivo systems is the central question. The
yeast three hybrid is an imperfect experiment, but it may show heterodimerization of
fragments of the two proteins of interest in a whole cell environment. The ability of E1-
Gdm (100), but not Gdm (94), to activate ER transactivation at ERE sites shows that E1-
Gdm (100) can bind the estrogen receptor in mammalian cells. The lower maximal
activation of E1-Gdm (100) as compared to estradiol could result from several possible
factors. For example, the binding affinity of E1-Gdm (100) for the estrogen receptor may
be low. Alternatively, E1-Gdm (100) bound to the estrogen receptor may potentiate
conformational changes that are suboptimal for transactivation. E1-Gdm (100) bound to
the estrogen receptor could also potentially initiate incomplete nuclear export. E1-Gdm
(100) bound to the ER could activate transcription, then be released from DNA and
exported from the nucleus. Once exported, the receptor seemingly cannot be recycled
and therefore ER may not be able to return to the nucleus. The altered toxicity profile of
E1-Gdm (100) also points to a separate mechanism as compared to Gdm (100). Much of
the literature on steroid receptor chaperone cycle and nucleocytoplasmic shuttling has
used the glucocorticoid receptor and progesterone receptor as model systems. The ER
shows differences in behavior compared with those two proteins, so conclusions drawn
with the GR and PR may not be valid for the ER.

164
5.13 Second Generation Dimers
In an effort to improve the activity of our dimers, we designed a new scaffold to
link estradiol and geldanamycin. This new strategy was initially based on molecules
reported by Katzenellenbogen and co-workers,22
and a biotinylated-estradiol with a
similar linkage that was found to exhibit outstanding activity in a yeast three hybrid
system with ERβ and streptavidin as compared to ERα. To determine whether or not this
new scaffold would efficiently bind ER expressed in mammaliam cells, we designed a
fluorescent probe using Pennsylvania Green. The synthesis of this fluorescent probe is
shown in Figure 5.17.
Figure 5.17. Synthesis of fluorescent estrogen probe (112).

165
Estrone (103) was treated with lithium acetylene ethylenediamine complex to
provide terminal alkyne 109. This alkyne, when subjected to Sonogashira conditions
with 4-iodo-N-methylbenzyamine, CuI, Pd(PPh3)2Cl2, and triethylamine afforded
compound 110. This amine (110) was linked to Pennslyvania Green as shown in Figure
5.17 to afford the fluorescent probe 112.
Figure 5.18. Differential interference contrast (DIC) and laser scanning confocal
micrographs of SKN-BE(2)-C human neuroblastoma cells expressing ERβ-mRFP treated
with 1 µM 112 (Panel A) and ERβ-mRFP (Panel B) . Yellow indicates colocalization of
112 and ERβ-mRFP.
Figure 5.18 shows SKN cells that have been transfected with ERβ-mRFP and
treated with 1 uM 112 for 12 hours. It was evident from the colocalization of the green
and red fluorescence that compound 112 was not only cell permeable but maintained its
affinity for the estrogen receptor. With the knowledge that this linker allowed binding to

166
ER, we used this scaffold to design a new chimeric estradiol-geldanamycin dimer (Figure
5.19, 113). This dimer was synthesized according to the same procedure seen in Figure
5.17, substituting Gdm for Penn Green in the last step. 113 is currently under
investigation in ERβ assays and may be a more potent anti-cancer agent.
Figure 5.19. Structure of the second generation estradiol-geldanamycin dimer 113.
5.14 Conclusions
We designed a novel estrone-geldanamycin dimer (100) molecule capable of
heterodimerization of the estrogen receptor and Hsp90 in vitro. This compound induces
dimerization between the Hsp90 N-terminal region and the ERβ ligand binding domain in
a yeast three hybrid assay. In mammalian cells, the E1-Gdm dimer (100) is less toxic
than either Gdm (94) or 17-AAG (97), and it displays lesser inhibition of 17β-estradiol-
mediated transactivation of the ER compared to Gdm. Confocal microscopy experiments
with dual labeled fluorescent fusion proteins demonstrate colocalization between the ER
and Hsp90 mediated by 100 that can be inhibited by excess estradiol. A second
113

167
generation dimer (113) with potentially higher affinity was synthesized in hopes of
obtaining a more potent anti-cancer agent. As this study is ongoing, some of the
experiments described herein are preliminary, and further controls must be run before
firm conclusions can be drawn. The steroid receptor chaperone cycle is a complex
system, with many partners and steps. Although we can not yet be certain of the exact
mechanism of action of this new dimeric molecule, we have shown that it has interesting
and novel properties. Dimeric compounds of this nature could potentially be developed
as a new class of therapeutic agents directed towards controlling the localization and
function of proteins of interest.
5.15 Experimental Protocols
5.15.1 General
Standard techniques for subcloning were employed.23
Restriction endonucleases
and T4 DNA ligase were from New England Biolabs, and DNA purification kits were
from Qiagen. Pfu polymerase was from Stratagene. Microbiological media (Luria-
Bertani Broth, Lennox Modification) was from Difco. Mammalian media were from
Gibco, and fetal bovine serum (FBS) was from Valley Biomedical.
Penicillin/streptomycin solution was from Hyclone. 16% paraformaldehyde solution was
from EMS.

168
5.15.2 Bacteria and Cell Lines
E. coli DH5-α (Invitrogen) were used for plasmid construction and propagation.
SKN-BE(2)-C human neuroblastoma cells (ATCC #CRL-2268) were a kind gift of Dr.
Nandini Vasudevan (Pennsylvania State University). SKN-BE(2)-C cells were
maintained in 1:1 Ham's F-12 and MEM media supplemented with 15% FBS, penicillin
(100 units/mL) and streptomycin (100 µg/mL). Cricetulus griseus CHO-K1 cells
(Chinese hamster ovary cells, ATCC #CCL-61) were a generous gift of Prof. A. Mastro
(Pennsylvania State University). CHO-K1 cells were maintained in Ham's F-12K media
supplemented with 10% FBS, penicillin (100 units/mL), and streptomycin (100 µg/mL).
HEK293 human embryonic kidney cells cells (ATCC #CRL-1573) and MCF-7 human
breast carcinoma cells (ATCC #HTB-22) were maintained in DMEM containing 10%
FBS, penicillin (100 units/mL) and streptomycin (100 µg/mL).
5.15.3 Synthesis of Dimeric Ligands
All nonaqueous reactions were performed under an atmosphere of dry argon.
Reagents for synthesis were purchased from Aldrich, Acros, Alfa Aesar, or Fisher and
used without further purification. Geldanamycin was obtained from the NCI. Reactions
were monitored by analytical thin-layer chromatography on plates coated with 0.25 mm
silica gel 60 F254 (EM science). Flash column chromatography employed 230-240 mesh
silica gel (EM Science). TLC plates were visualized by UV irradiation (254 nm) or
stained with a solution of phosphomolybdic acid and sulfuric acid in ethanol (1:1:20).

169
Melting points were measured with a Thomas Hoover melting point apparatus and are
uncorrected. All 1H and
13C NMR spectra were recorded using Bruker CDPX-300,
AMX-360 or DRX-400 spectrometers at ambient temperature (22 °C). NMR signals
were referenced to internal CHCl3 (δH 7.27) and CDCl3 (δD 77.0) peaks in parts per
million (ppm). Mass spectra were acquired by the Penn State Huck Institute Mass
Spectrometry Facility on a Mariner APCI instrument. Peaks are reported as m/z.
Compound purities were analyzed with a Hewlett Packard HP1100 HPLC instrument
fitted with a diode array detector and a Hamilton PRP-1 column (7 µm particle size, 25
cm x 4.1 mm). Eluent: nanopure H2O/CH3CN containing 0.1% TFA. Flow rate: 0.8
mL/min. Elution gradient over 30 min: 99:1.0 to 1.0:99.0.
105
{5-[(6-{[2-(3-Hydroxy-13-methyl-6,7,8,9,11,12,13,14,15,16-decahydro-cyclopenta[a]
phenathren-17-ylideneaminooxy)-acetyl]-methyl-amino}-hexyl)-methyl-carbamoyl]-
pentyl}-carbamic acid 9H-fluoren-9-ylmethyl ester (105).
Estrone-oxime (104, 68 mg, 0.2 mmol, synthesized as reported previously24
), N-
hydroxysuccinimide (46 mg, 0.4 mmol) and DCC (49 mg, 0.24 mmol) were dissolved in
dry CH2Cl2 (10 mL). The reaction was stirred at 23 °C for 4 h followed by removal of
dicyclohexylurea by filtration. The filtrate was added to N',N'-dimethyl-1,6-

170
hexanediamine (174 µL, 1.0 mmol) containing DIEA (500 µL). After 2 h the solvent was
removed in vacuo. The residue was added to Fmoc-6-aminohexanoic acid (71 mg, 0.2
mmol), N-hydroxysuccinimide (46 mg, 0.4 mmol) and DCC (49 mg, 0.24 mmol)
dissolved in dry CH2Cl2 (10 mL), which was stirred for 30 min prior to addition. After
16 h the reaction was diluted with aqueous citric acid (10%, 10 mL), extracted with
dichloromethane (3 x 20 mL), washed with aqueous saturated NaCl and dried over
anhydrous Na2SO4. The solvent was removed in vacuo. Flash column chromatography
(MeOH / CH2Cl2, 0.5:9.5) afforded 105 (105 mg, 65% yield) as a waxy solid; 1H NMR
(400 MHz, CDCl3) δ 7.7 (d, J = 7.4 Hz, 2H), 7.5 (d, J = 7.3 Hz, 2H), 7.3 (t, J = 7.3 Hz,
2H), 7.2 (t, J = 7.4 Hz, 2H), 7.0 (d, J = 4.9 Hz, 1H), 6.6 (dd, J = 1.9, 6.2 Hz, 1H), 6.4 (s,
1H), 4.6 (m, 2H), 4.3 (d, J = 7.4 Hz, 2H), 4.1 (t, J = 7.4 Hz, 1H), 3.3-1.2 (m, 43H), 0.8
(s, 3H); 13
C NMR (100 MHz, CDCl3) 173.3, 172.2, 169.9, 156.5, 154.5, 143.8, 141.1,
137.5, 131.06, 131.00, 128.2, 127.5, 126.9, 126.0, 125.6, 119.8, 115.3, 112.9, 77.2 (x 2),
66.5, 52.4, 49.9, 47.7, 47.1, 44.3, 43.7, 40.6, 37.9, 35.3, 33.2, 29.4, 27.0, 26.9, 26.4,
26.36, 26.30, 26.2. 26.0, 24.4, 22.7. 17.0; IR (film) νmax 3407, 2944, 1708, 1598, 1292
cm-1
; HRMS (TOF ES+) m/z 805.4904 (MH+, C49H64N4O6 requires 805.4895).
100
(4E,6Z,8S,9S,10E,12S,13R,14S,16R)-13-hydroxy-19-({6-[{6-[[({[(17E)-3-hydroxy-
estra-1(10),2,4-trien-17-ylidene]amino}oxy)acetyl](methyl)amino]hexyl}(methyl)

171
amino]-6-oxohyxl}amino)-8,14-dimethoxy-4,10,12,16-tetramethyl-3,20,22-trioxo-2-
azabicyclo[16.3.1]docosa-1(21),4,6,10,18-pentaen-9-yl carbamate (100).
Compound 120 (39 mg, 0.04 mmol) was dissolved in piperidine / DMF (1:4, 5 mL) and
stirred for 30 min. After complete deprotection of the Fmoc group, the DMF and
piperidine were removed in vacuo. To the remaining residue was added geldanamycin
(94) (10 mg, 0.02 mmol) in DMSO (1 mL), and the reaction was allowed to stir for 16 h.
The final product was purified by reverse phase HPLC. Flow rate: 0.8 mL/min. Eluent:
nanopure H2O/CH3CN containing 0.1% TFA. Elution gradient over 30 min: 99:1 to 1:99.
This afforded 100 as a purple solid (16 mg, 84% yield), mp 138-140 ºC. 1H NMR (400
MHz, CDCl3) δ 9.1 (s, 1H), 7.1 (m, 1H), 6.9 (d, J = 11.4 Hz, 1H), 6.6 (m, 3H), 5.8 (m,
1H), 5.1 (s, 1H), 4.9 (bs, 1H), 4.7 (s, 2H), 4.3 (d, J = 9.7, 1H) 3.5-.9 (m, 78H); IR (film)
νmax 3300, 2922, 1725, 1462, 1269 cm-1
; HRMS (APCI+) m/z 1111.6690 (MH+,
C62H90N6O12 requires 1111.6663).
101
6-{[(4E,6X,*s,9S,10E,12S,13R,14S,16R)-9,13-dihydroxy-8,14-dimethoxy-4,10,12,16-
tetramethyl-3,20,22-trioxo-2-azabicyclo[16.3.1]docosa-1(21),4,6,10,18-pentaen-19-yl]
amino}-N-{6-[[({[(17E)-3-hydroxyestra-1(10),2,4-trien-17-ylidene]amino}oxy)acetyl]
(methyl)amino]hexyl}-N-methylhexanamide (101).

172
E1-GDM (100, 5.5 mg, 0.005 mmol) was dissolved in DMSO (600 µL). Potassium t-
butoxide (1.1 mg, 0.010 mmol) was added and the reaction was stirred at 23 °C for 16 h.
Reaction progress was monitored by reverse phase HPLC. Upon consumption of E1-
GDM the reaction mix was purified by reverse phase HPLC to provide 101 as a light
purple solid (1.0 mg, 19% yield). Eluent: nanopure H2O/CH3CN containing 0.1% TFA.
Flow rate: 0.8 mL/min. Elution gradient over 30 min: 99:1.0 to 1.0:99.0. HRMS
(APCI+) m/z 1091.3855 (MNa+, C61H89N5O11 requires 1091.3858).
106
3-Ethoxy-13-methyl-6,7,8,9,11,121,13,14,15,16-decahydro-cyclopenta[a]phenanthren
-17-one (106).
Estrone (103, 1.5 g, 5.5 mmol), ethyl iodide (88 µL, 11.1 mmol) and potassium carbonate
(4.5 g, 33 mmol) were dissolved in 100 mL acetonitrile and refluxed for 16 h. After
allowing the reaction to cool to 23 °C, the potassium carbonate was removed by filtration
and solvent was removed in vacuo. The remaining residue was applied directly to a silca
column for purification. Flash chromatography (EtOAc / hexanes, 1:4) afforded 106 as a
white solid (1.49 g, 91% yield), mp 120-122 °C. 1H NMR (300 MHz, CDCl3) δ 7.1 (d, J
= 8.5 Hz, 1H), 6.6 (dd, J = 2.3, 8.4 Hz, 1H), 6.1 (s, 1H), 3.9 (q, J = 6.9 Hz, 2H), 2.8 (m,
2H), 2.4-2.3 (m, 2H), 2.1-1.8 (m, 5H), 1.5-1.2 (m, 9H), 0.8 (s, 3H); 13
C NMR (75 MHz,
CDCl3) 219.7, 156.3, 136.9, 131.2, 125.6, 113.9, 111.4, 62.5. 49.7, 47.3, 43.3, 37.7, 35.2,
31.0, 29.1, 26.0, 25.3, 21.0, 14.4, 13.2; IR (film) νmax 3001, 2915, 1739, 1241, 1054 cm-1
;
HRMS (TOF MS AP+) m/z 299.2017 (MH+, C20H26O2 requires 299.2011).

173
107
(3-Ethoxy-13-methyl-6,7,8,9,11,12,13,14,15,16-decahydro-cyclopenta[a]phenanthren
-17-ylideneaminooxy)-acetic acid (107).
Ethyl estrone (106, 1.49 g, 5 mmol) in pyridine (20 mL) was combined with O-
(carboxymethyl)hydroxylamine hemihydrochloride (1.09 g, 10 mmol) and stirred at 23
°C for 16 h. The reaction mix was then poured into aqueous HCl (10%, 50 mL). The
product was extracted with ethyl acetate (3 x 100 mL), washed with aqueous saturated
NaCl and dried over anhydrous Na2SO4. The solvent was removed in vacuo. Flash
chromatography (20% MeOH in dichloromethane) afforded 107 (1.26 g, 68% yield) as a
white foam. 1H NMR (300 MHz, CDCl3) d 7.1 (d, J = 8.5 Hz, 1H), 6.8 (dd, J = 2.4, 8.3
Hz, 1H), 6.5 (s, 1H), 4.5 (s, 2H), 3.9 (q, J = 6.8 Hz, 2H), 2.8-2.6 (m, 4H), 2.3-1.8 (m,
5H), 1.5-1.1 (m, 9H), 0.9 (s, 3H); 13
C NMR (75 MHz, CDCl3) 173.1, 171.1, 156.2,
138.6, 131.4, 125.6, 113.8, 111.3, 69.9, 62.5, 52.1, 43.7, 43.2, 37.5, 33.4, 29.0, 26.6, 25.6,
25.4, 22.4, 16.6, 14.3; IR (film) νmax 3432, 2929, 1731, 1235, 1108 cm-1
; HRMS (TOF
MS AP+) m/z 372.2164 (MH+, C22H29NO4 requires 372.2175).
108

174
{5-[(6-{[2-(3-Ethoxy-13-methyl-6,7,8,9,11,12,13,14,15,16-decahydro-cyclopenta[a]
phenanthren-17-ylidineaminooxy)-acetyl]-methyl-amino}-hexyl)-methyl-carbamoyl]
-pentyl}carbamic acid 9H-fluoren-9-ylmethyl ester (108).
Ethyl-estrone-oxime (107) (830 mg, 2.2 mmol), N-hydroxysuccinimide (506 mg, 4.4
mmol) and DCC (553 mg, 2.6 mmol) were dissolved in dry CH2Cl2 (25 mL). The
reaction was stirred at 22 °C for 4 h followed by removal of dicyclohexylurea by
filtration. The filtrate was added to N',N'-dimethyl-1,6-hexanediamine (1.9 mL, 11
mmol) and DIEA (~5 mL). After 2 h the solvent was removed in vacuo. The residue
was added to Fmoc-6-aminohexanoic acid (776 mg, 2.6 mmol), N-hydroxysuccinimide
(506 mg, 4.4 mmol) and DCC (553 mg, 2.6 mmol) dissolved in dry CH2Cl2 (50 mL)
which had been stirring for 30 min prior to addition. After 16 h the reaction was diluted
with aqueous citric acid (10%, 50 mL), extracted with dichloromethane (3 x 50 mL),
washed with aqueous saturated NaCl and dried over anhydrous Na2SO4. The solvent was
removed in vacuo. Flash chromatography (MeOH / dichloromethane, 0.5:9.5) afforded
108 (982 mg, 54% yield) as a waxy solid. 1H NMR (300 MHz, CDCl3) δ 7.7 (d, J = 7.5
Hz, 2H), 7.6 (d, J = 7.3 Hz, 2H), 7.39 (t, J = 7.4 Hz, 2H), 7.31 (t, J = 7.4 Hz, 2H), 7.1 (d,
J = 8.5 Hz, 1H), 6.7 (dd, J = 2.4, 8.3 Hz, 1H), 6.6 (s, 1H), 4.7 (s, 2H), 4.3 (d, J = 6.6 Hz,
2H), 4.2 (t, J = 6.7 Hz, 1H) 3.9 (q, J = 6.9 Hz, 2H), 3.3-3.2 (m, 5H), 2.9-2.8 (m, 9H), 2.5
(m, 2H), 2.3-1.8 (m, 7H), 1.6-1.3 (m, 23H) 0.9 (s, 3H); 13
C NMR (75 MHz, CDCl3)
173.1, 172.0, 169.3, 163.9, 156.7, 156.5, 143.8, 141.1, 137.6, 132.0, 131.9, 127.5, 126.9,
126.0, 124.9, 119.8, 114.3, 111.9, 71.1, 70.8, 66.4, 63.1, 53.3, 52.6, 49.0, 48.0, 47.8, 47.1,
44.3, 43.7, 40.5, 38.0, 35.4, 34.0, 33.9, 33.6, 33.0, 32.4, 29.5, 27.1, 26.2, 26.0, 22.8, 17.0,

175
14.7; IR (film) νmax 3317, 2933, 1721, 1633, 1501, 1253 cm-1
; HRMS (TOF MS AP+)
m/z 833.5239 (MH+, C51H68N4O6 requires 833.5212).
102
6-{[(4E,6Z,8S,9S,10E,12S,13R,14S,16R)-9,13-dihydroxy-8,14-dimethoxy-4,10,12,16-
tetramethyl-3,20,22-trioxo-2-azabicyclo[16.3.1]docosa-1(21),4,6,10,18-pentaen-19-yl]
amino}-N-{6-[[({[(17E)-3-hydroxyestra-1(10),2,4-trien-17-ylidene]amino}oxy)acetyl]
(methyl)amino]hexyl}-N-methylhexanamide (102).
Compound 108 (15 mg, 0.018 mmol) was dissolved in piperidine / DMF (1:4, 5 mL) and
stirred for 30 min. After complete deprotection of the Fmoc group, the DMF and
piperidine was removed in vacuo. To the remaining residue was added geldanamycin
(94, 5 mg, 0.009 mmol) in DMSO (1 mL). The reaction was allowed to stir for 16 h.
The final product was purified by reverse phase HPLC eluting in 1% CH3CN to 99%
over 30 minutes to afford 102 as a purple solid (5.4 mg, 53% yield). HRMS (TOF MS
AP+) m/z 1161.6766 (MNa+, C64H94N6O12 requires 1161.6796).
110
17-({4-[(methylamino)methyl]phenyl}ethynyl)estra-1,3,5(10)-triene-3,17-diol (110)
In a dry schlenck flask estrone alkyne 109 (166 mg, 0.56 mmol), 4-
iodomethylbenzylamine (230 mg, 0.93 mmol), CuI (10 mg, .056 mmol) and Pd(PPh3)2Cl2

176
(19 mg, .028 mmol) were dissolved in THF (20 mL) and triethylamine (1 mL) was added.
The reaction was allowed to stir at 23 oC for 12 h. The reaction was quenched with
aqueous HCl (1M, 20 mL) and extracted with EtOAc (3 x 25 mL). The solution was
dried over anhydrous Na2SO4 and solvent was removed in vacuo. Flash chromatography
(MeOH / CH2Cl2, 1:9) afforded 110 (150 mg, 65%). 1H NMR (300 MHz, CDCl3) δ 7.41
(d, J = 8.1 Hz, 2H), 7.30 (d, J = 8.2 Hz, 2H), 7.07 (d, J = 8.5 Hz, 1H), 6.59 (dd, J = 2.5,
8.4 Hz, 1H), 6.50 (d, J = 2.5 Hz, 2H), 3.99 (s, 1H), 2.76 (m, 2H), 2.53 (s, 3H) 2.35-1.2
(m, 13H), 0.85 (s, 3H); 13
C NMR (75 MHz, CDCl3) 154.0, 137.7, 132.0, 131.3, 129.8,
129.5, 126.1, 124.5, 115.0, 112.0, 94.5, 84.2, 79.7, 51.8, 49.6, 47.4, 43.4, 39.3, 38.6, 32.8,
31.6, 29.4, 27.0, 26.2, 22.6, 12.6; HRMS (TOF MS ES+) m/z 416.2562 (MH+,
C28H33O2N requires 416.2590).
111
9H-fluoren-9-ylmethyl [6-({7-[(4-{[3,17-dihydroxyestra-1,3,5(10) -trien-17-yl]
ethynyl} benzyl) (methyl)amino]-7-oxoheptyl}amino)-6-oxohexyl]carbamate (111)
HOBT (45 mg, 0.33 mmol), EDC (69 mg, 0.36 mmol) and Fmoc-6-aminohexanoic acid
(112 mg, 0.32 mmol) were dissolved in CH2Cl2 (10 mL), cooled to 0 oC and allowed to
stir for 30 min. Compound 110 (110 mg, 0.26 mmol) was added and the reaction was
allowed to warm to 23 oC over 1 h. After 1 h solvent was remvoved
oC in vacuo and the
residue was redissolved in 1:4 piperidine:DMF (5mL) and allowed to stir for 1 h. Excess
piperidine and DMF were removed and the solution was once again dissolved in CH2Cl2
(10 mL) and was added to a solution of HOBT (45 mg, 0.33 mmol), EDC (69 mg, 0.36

177
mmol) and FMOC-6-aminohexanoic acid (112 mg, 0.32 mmol) that had been dissolved
in CH2Cl2 (10 mL) and pre-cooled to 0 oC. After allowing the reaction stir for an
additional 1 h, the reaction was quenched with deionized water (10 mL), extracted with
CH2Cl2 (3 x 20 mL), dried over anhydrous Na2SO4 and solvent was removed in vacuo.
Flash chromatography (MeOH / CH2Cl2, 0.5:9.5) afforded 111 (182 mg, 81%). 1H NMR
(300 MHz, CDCl3) δ 7.78 (d, J = 7.5 Hz, 2H), 7.61 (d, J = 7.3 Hz, 2H), 7.34 (m, 7H),
7.11 (m, 2H), 6.67 (dd, J = 2.4, 8.5 Hz, 1H), 6.58 (d, J = 2.5 Hz, 2H), 4.37 (d, J = 6.6
Hz, 2H), 4.24 (s, 2H), 4.19 (t, J = 6.7 Hz, 1H), 2.76 (m, 2H), 3.68 (s, 3H), 3.26-1.3 (m,
35H), 0.92 (s, 3H); 13
C NMR (75 MHz, CDCl3) 173.4, 173.2, 173.1, 156.5, 154.1, 143.9,
141.2, 137.9, 137.4, 136.6, 132.1m 131.8, 131.7, 127.7, 127.6, 126.9, 126.1, 125.0,
122.4, 122.0, 119.9, 115.3, 112.8, 85.4, 80.2, 66.5, 50.6, 49.7, 47.6, 47.2, 43.6, 40.7, 39.4,
39.0, 36.4, 34.0, 33.0, 32.7, 29.6, 29.5, 27.2, 26.4, 26.3, 26.1, 25.5, 25.1, 22.9, 12.8; IR
(film) νmax 3308, 2934, 1704, 1633 cm-1
; HRMS (TOF MS ES+) m/z 864.4962 (MH+,
C55H65O6N3 requires 864.4952).
112
9-[4-({[6-({7-[(4-{[3,17-dihydroxyestra-1,3,5(10)-trien-17-yl] ethynyl} benzyl)
(methyl) amino]-7-oxoheptyl}amino)-6-oxohexyl]amino}carbonyl)-2-methylphenyl]-
2,7-difluoro-3-oxo-3H-xanthen-6-olate (112)

178
Compound 111 (22 mg, 0.025 mmol) was dissolved in piperidine / DMF (1:4, 2 mL) and
allowed to stir for 1 h. Excess piperidine and DMF was removed, the residue was
redissolved in DMF (2 mL) and Pennsylvania Green-NHS ester (60, 12 mg, .025 mmol)
was added. The reaction was allowed to stir at 23 oC for 12 h. The final product was
purified by reverse phase HPLC eluting in 1% CH3CN to 99% over 30 min to afford 112
as an orange solid (20.5 mg, 82%); 1H NMR (300 MHz, CD3OD) δ 7.81 (s, 1H), 7.77 (d,
J = 7.9 Hz, 1H), 7.27 (m, 3H), 7.06 (d, J = 7.9 Hz, 2H), 6.97 (d, J = 8.1 Hz, 1H), 6.83
(d, J = 7.0 Hz, 2H), 6.65 (d, J = 10.9 Hz, 2H), 6.42 (d, J = 8.2 Hz, 2H), 6.35 (d, J = 2.2
Hz, 1H), 4.45 (s, 2H), 3.38 (m, 4H), 3.07 (m, 2H), 2.87 (s, 3H), 2.6-1.2 (m, 29H), 2.01
(s, 3 H), 0.80 (s, 3H); 13
C NMR (75 MHz, CDCl3) 176.0, 175.9, 169.9, 156.0, 159.9,
142.8, 141.2, 138.7, 138.6, 137.9, 137.6, 136.2, 133.0, 132.7, 132.5, 132.2, 130.7, 130.5,
128.8, 127.6, 127.2, 126.3, 116.0, 115.9, 113.7, 112.9, 112.7, 106.5, 85.4, 80.8, 51.1,
45.2, 41.1, 41.0, 40.2, 40.0, 37.0, 35.7, 34.7, 34.5, 34.4, 34.1, 33.8, 30.8, 30.1, 28.8, 27.8,
27.7, 27.5, 26.7, 26.1, 25.9, 23.9, 19.6, 13.5; IR (film) νmax 3318, 2931, 1672, 1642, 1189
cm-1
; HRMS (TOF MS ES+) m/z 1006.4830 (MH+, C61H65O8N3F2 requires 1006.4818).
113
(4E,6Z,8R,9S,10E,12S,13R,14S,16S)-19-{[6-({7-[(4-{[3,17-dihydroxyestra-1,3,5(10)
-trien-17-yl]ethynyl}benzyl)(methyl)amino]-7-oxoheptyl}amino)-6-oxohexyl]amino}-

179
13-hydroxy-8,14-dimethoxy-4,10,12,16-tetramethyl-3,20,22-trioxo-2-azabicyclo[16.
3.1]docosa-1(21),4,6,10,18-pentaen-9-yl carbamate (113)
Compound 111 (22 mg, 0.025 mmol) was dissolved in piperidine / DMF (1:4, 2 mL) and
allowed to stir for 1 h. Excess piperidine and DMF were removed in vacuo, the residue
was redissolved in DMF (2 mL) and geldanamycin (94, 7 mg, .013 mmol) was added.
The reaction was allowed to stir at 23 oC for 12 h. The final product was purified by
reverse phase HPLC eluting in 1% CH3CN to 99% over 30 min to afford 113 as purple
(11.6 mg, 77%); HRMS (TOF MS ES+) m/z 1192.6532 (MNa+, C68H91O12N5 requires
1192.6562).
5.15.4 In vitro Coimmunoprecipitation Assay
To a 0.5 mL polypropylene tube was added recombinant ERα protein (100 nM,
1.32 µg, Sigma), recombinant Hsp90 protein (100 nM, 1.8 µg, Stressgen), E1-GDM (10
µM, 222 µg), BSA (100 µg/mL, 2 µL) and buffer to make up to a final volume of 20 µL.
The buffer comprimised 150 mM NaCl, 50 mM Tris-HCl and 0.1% SDS. This mixture
was incubated at 4 °C for 4-6 h. Mouse anti-Hsp90 monoclonal antibody (0.047 µg/µL,
0.95 µg) was added to the tube and vortexed briefly. This IP mix was incubated for 2 h
with gentle mixing at 4 °C. While mixing proteins and antibody, EZView Red Protein G
affinity Gel (Sigma) 20-50 µL was placed in a separate tube. Beads were washed with
buffer (50 µL) twice and placed on ice. After 2 h or more of incubation, the IP mix was
180
centrifuged and transferred into the tube containing Protein G affinity gel pellet and
vortexed briefly. This was incubated for 2 h or more with gentle mixing at 4 °C. The
beads were washed 2-3 times with buffer (50 µL). To analyze, the beads were
resuspended in reducing buffer (125 mM Tris, 4% SDS, 300 mM mercaptoethanol) and
boiled for 5 min. The sample was centifuged briefly to pellet the protein G beads and 10-
20 µL of supernatant was loaded on a 7.5% Tris-Glycine PAGE gel. The gel was
subjected to SDS PAGE and visualized with silver stain.
5.15.5 Construction of Plasmids for Yeast Three-Hybrid Assays
The polymerase chain reaction (PCR) using Pfu polymerase (Stratagene) was
employed to add 5’ EcoRI and 3’ XhoI-Stop-SalI restriction sites to the gene encoding
Human Hsp90β (1-214). The Hsp90β (1-214) gene was inserted into the EcoRI / XhoI–
digested vector pJG4-5 (Invitrogen), which fused the B42 activation domain and SV40
nuclear localization signal to the Hsp90β N-terminus. Full length Hsp90β (1-726) was
also modified using Pfu polymerase to add 5’ MfeI and 3’ EcoRI-Stop-XhoI restriction
sites to the gene. Plasmid pSH18-34 (Invitrogen), which contains four dimeric LexA
DNA sites driving lacZ expression, was employed as the reporter vector. All new
constructs were confirmed by automated dideoxynucleotide sequencing at the Penn State
University Biotechnology Institute.

181
5.15.6 Construction of Plasmids for Mammalian Three-Hybrid Assays
The fragment 5'-MfeI-VP16-EcoRI-Fos(118-203)-XhoI-3' (obtained from S.
Hussey) was subcloned into the EcoRI/XhoI-digested mammalian expression vector
pCMVTag2B (Stratagene). PCR using Pfu polymerase was used to add 5’ EcoRI and 3’
SalI / XhoI restriction sites to the gene encoding the ligand binding domain fragment and
the full length human ERα protein. The plasmid pCMV5hER (a gift of Prof. B.
Katzenellenbogen, University of Illinois), which confers glycine at position 400,
provided the template (PCR done by S. Hussey). pCMVTag2B-VP16-Fos(118-203) was
digested EcoRI/XhoI and the fragments 5'-EcoRI-hERα(1-595)-SalI or 5'-EcoRI-
hERα(305-595)-SalI were subcloned to provide pCMVTag2B-VP16-hERα(1-595) and
pCMVTag2B-VP16-hERα(305-595).
The polymerase chain reaction (PCR) using pfu polymerase was used to add in-
frame 5'-MfeI-Gal4(1-147)-EcoRI-XhoI-3' restriction sites to the Gal4 DNA binding
domain using GalD-H (E. Wilson) as a template. This fragment was cloned into the
EcoRI/XhoI-digested mammalian expression vector pCMVTag2B (Stratagene) to afford
pCMVTag2B-Gal4. The fragments MfeI-Hsp90β-XhoI or MfeI-Hsp90β(1−214)-XhoI
were subcloned into EcoRI/XhoI-digested pCMVTag2B-Gal4 to afford the plasmids
pCMVTag2B-Gal4-Hsp90 and pCMVTag2B-Gal4-Hsp90(1-214).

182
5.15.7 Construction of Plasmids for Fluorescently-Tagged Fusion Proteins
The polymerase chain reaction (PCR) using pfu polymerase was used to add in-
frame 5'-MfeI-mRFP-EcoRI-XhoI-3' restriction sites to monomeric red fluorescent
protein25
using pRSETBmRFP1 as a template plasmid (a gift of Prof. Roger Tsien,
University of California San Diego). The fragment 5'-MfeI-mRFP-EcoRI-XhoI-3'
(obtained from D. Clark) was subcloned into the EcoRI/XhoI-digested mammalian
expression vector pCMVTag2B. This plasmid was digested EcoRI/XhoI and the
fragment MfeI-Hsp90β-XhoI was subcloned into it to afford the plasmid pCMVTag2B-
mRFP-Hsp90. PCR was used to add in-frame 5'-EcoRI-XhoI-AcGFP-Stop-SalI-3'
restriction sites to the AcGFP monomeric green fluorescent protein (Clontech) using
AcGFP1 as a template. This fragment was subcloned into the EcoRI/XhoI-digested
mammalian expression vector pCMVTag2B to afford pCMVTag2B-AcGFP. The
fragment 5'-EcoRI-hERα(1-595)-SalI (provided by S. Hussey) was subcloned in the
plasmid pCMVTag2B-AcGFP that had been digested EcoRI/XhoI to give plasmid
pCMVTag2B-hERα(1-595)-AcGFP.
5.15.8 Microtiterplate ββββ-Galactosidase Yeast Reporter Gene Assays
S. cerevisiae FY250 was used to assay LexA-driven β-galactosidase reporter gene
expression. Yeast were transformed with pSH18-34, the ER expression vector pAM423-
LexA-ERβ (255-509) and the Hsp90 expression vector pJG4-5 Hsp90β (1-214) by the

183
lithium acetate method26
and yeast transformants, which were derived from multiple
combined colonies, were grown to saturation at 30 °C in selection media (yeast nitrogen
base without amino acids (Difco), appropriate dropout powder (QBiogene), penicillin
(Gibco, 100 units/mL), streptomycin (Gibco, 100 µg/mL), 2% galactose (Sigma), and 1%
raffinose (Sigma)). Aliquots (50 µL) of saturated yeast cultures were diluted in selection
media (175 µL) on a sterile 96-well polystyrene microtiter plate. A solution of the
compound under investigation in DMSO : selection media (1:10, 25 µL) was then added
to afford a final well volume of 250 µL (1% DMSO). The plate was shaken at 30 °C for
16 hours, centrifuged (4300 RPM, 10 min), and the supernatant removed by aspiration.
Z-Lysis buffer (Z-buffer23
containing 2% EtOH and 1% CHCl3, 200 mL) was added, and
the plate was shaken for 5 min. Aliquots of suspended cells (5 µL or 50 µL for high or
low levels of β-galactosidase activity) were transferred to wells that contained sufficient
Z-lysis buffer to provide a final volume of 150 µL. The absorbance at 590 nm (OD590)
was measured to determine cell density, followed by the addition of the substrate
chlorophenol red-β-D-galactopyranoside (Calbiochem, 15 mM, 30 mL) in sodium
phosphate buffer (0.1 M, pH 7.5).23
The plate was shaken at 30 °C with periodic (15
min, 30 min, 60 min, and 120 min) absorbance measurements at 570 nm (OD570). β-
Galactosidase activity was calculated as follows:
Activity = 1000*(OD570–BLANK–OD590)/(TIME*(OD590)). The BLANK value
corresponded to the absorbance (570 nm) of wells containing substrate (30 mL) and Z-
lysis buffer (150 µL) only. The TIME value was expressed in minutes. Values typically

184
represent the mean of six independent experiments. Error bars represent standard errors
of the mean.
5.15.9 Mammalian Three-Hybrid Assays
CHO-K1 cells were transiently transfected with a combination of hybrid vectors
pCMVTag2B-Gal4-Hsp90, pCMVTag2B-Gal4-Hsp90(1-214), pCMVTag2B-VP16-
hERα(1-595), pCMVTag2B-VP16-hERα(305-595) and/or the full length human
estrogen receptor α expression plasmid pSG5-hERα27 (gift of Dr. Nandini Vasudevan).
Also contransfected were the G5E1bLuc reporter vector (gift of Prof. E. Wilson, UNC),
which possesses five Gal4-binding sites upstream of the E1b promoter controlling
expression of luciferase, the constitutively active β-galactosidase expression vector
pCMVβ−gal commercially (Stratagene) and empty pUC19 as carrier DNA (gift of Dr.
Philip Bevilacqua, The Pennsylvania State University). Plasmid pCMVβ-gal was
included to control for variations in transfection efficiency. CHO-K1 cells were seeded
into 24 well clear polystyrene plates (Costar) at 4 x 10⁴ cells/well (from a confluent
culture of trypsinized cells) in media (700 µL, Ham's F-12K containing 10% FBS,
penicillin (100 units/mL), and streptomycin (100 µg/mL)). Cells were grown at 37 °C in
a humidified CO2 incubator for 24 h. Cells were washed with Dulbecco's Phosphate
Buffered Saline (DPBS) and transfected using Effectene (Qiagen) according to the
manufacturer's instructions. The following combined plasmids were used per well:
pCMVTag2B-Gal4-Hsp90 or pCMVTag2B-Gal4-Hsp90(1-214) (1 µL, 20 ng),

185
pCMVTag2B-VP16-hERα(1-595), pCMVTag2B-VP16-hERα(305-595) or pSG-hERα
(1 µL, 20 ng), G5E1bLuc (5 µL, 100 ng), pCMVβ-gal (1 µL, 20 ng), pUC19 (2 µL, 40
ng). This DNA cocktail was incubated with Buffer EC (50 µL) and enhancer (1.6 µL) for
5 min at 23 °C. This mixture was added to Effectene (2 µL) and incubated for 15 min at
23 °C prior to addition of media (700 µL) followed by addition to wells containing
washed cells. Efficient transfection was typically observed within 18-24 h. 24 h post-
transfection, the media was discarded, cells were washed twice with DPBS, and cells
were treated with 100x and 1000x compound stocks in DMSO (7.7 µL, 1.1% final
DMSO concentration) diluted in Opti-MEM media lacking phenol red (693 µL) but
containing 10% charcoal dextran-stripped FBS, penicillin (100 units/mL), and
streptomycin (100 µg/mL). These cells were incubated for 18-24 h at 37 °C in a
humidified CO2 incubator before being harvested with Glo-lysis buffer (150 µL,
Promega). The plate was centrifuged (3500 rpm, 5 min) to pellet cellular debris and a
portion of the supernatant (70 µL) was transferred to a 96 well plate (white polystyrene,
Corning). Bright Glo substrate (70 µL, Promega) was added to this lysate and
luminescence was measured on a Packard Fusion microtiterplate reader. Separate
fractions of lysate (50 µL) were transferred to a clear 96-well polystyrene microtiter plate
(Nunc). Additional Glo-lysis buffer was added to provide a final volume of 150 µL. The
substrate chlorophenol red-β-D-galactopyranoside (Calbiochem, 15 mM, 30 µL) in
sodium phosphate buffer (0.1 M, pH 7.5) was added and the absorbance at 570 nm was
measured immediately (OD5700min). The plate was shaken at 30 °C for 60 min and
absorbance measured at 570 nm (OD57060min). β-Galactosidase activity was calculated as

186
follows: Activity = 1000*(OD57060min–OD5700min)/(TIME)). The TIME value was
expressed in minutes. Luciferase activity was normalized based on β-galactosidase
expression (to control for variations in transfection efficiency). Values represent the
mean of two independent experiments. Error bars represent standard errors of the mean.
Dose response curves were calculated by nonlinear regression with a one-site competition
model (GraphPad Prism 3.0).
5.15.10 Reporter Gene Assays with Full Length Estrogen Receptor αααα and ERE Sites
SKN-BE(2)-C cells were transiently transfected with a combination of expression
plasmid pSG5-hERα and reporter plasmid 3x-ERE-luc (both kind gifts of Dr. Nandini
Vasudevan), the constitutively active β-galactosidase expression vector pCMVβ-gal
commercially (Stratagene) and empty pUC19 as carrier DNA (a kind gift of Dr. Philip
Bevilacqua, The Pennsylvania State University). pSG5-hERα expresses the full length
human estrogen receptor α. The 3x-ere-luc reporter plasmid has three tandem estrogen
response elements upstream of the luciferase reporter gene. Plasmid pCMVβ-gal was
included to control for variations in transfection efficiency. SKN-BE(2)C cells were
seeded at 8 x 10⁴ cells/well (from a confluent culture of trypsinized cells) in media (700
µL, 1:1 Ham's F-12 and MEM containing 15% FBS, penicillin (100 units/mL) and
streptomycin (100 µg/mL)). Cells were grown at 37 °C in a humidified CO2 incubator
for 24 h. Cells were washed with Dulbecco's Phosphate Buffered Saline (DPBS) and
transfected using Effectene (Qiagen) according to the manufacturer's instructions. The

187
following combined plasmids were used per well: pSG5-hERα (1 µL, 20 ng), 3x-ere-luc
(4 µL, 80 ng), pCMVβ-gal (1 µL, 20 ng), pUC19 (4 µL, 80 ng). This DNA cocktail was
incubated with Buffer EC (50 µL) and enhancer (1.6 µL) for 5 min at 23 °C. This
mixture was added to Effectene (2 µL) and incubated for 15 min at 23 °C prior to
addition of media (700 µL) followed by addition to wells containing washed cells.
Efficient transfection was typically observed within 18-24 h. 24 h post-transfection, the
media was discarded, cells were washed twice with DPBS, and cells were treated with
100x and 1000x compound stocks in DMSO (7.7 µL, 1.1% final DMSO concentration)
diluted in 1:1 Ham's F-12 and MEM media lacking phenol red (692.3 µL) but containing
10% charcoal-dextran stripped FBS, penicillin (100 units/mL) and streptomycin (100
µL/mL). These cells were incubated for 18-24 h at 37 °C in a humidified CO2 incubator
before being harvested with Glo-lysis buffer (150 µL, Promega). Luciferase and β-
galactosidase assays were done as in Section 3.13.9. Values represent the mean of three
independent experiments. Error bars represent standard errors of the mean. Dose
response curves were calculated by nonlinear regression with a one-site competition
model (GraphPad Prism 3.0). 17β-estradiol (1 nM) was the agonist for the competition
experiments.
5.15.11 Mammalian Cytotoxicity Assays
MCF-7 or HEK293 cells were seeded in 96-well tissue culture treated clear
polystyrene plates (Falcon) at 7500 cells/well (from a confluent culture of trypsinized

188
cells) in media (200 µL, DMEM containing 10% FBS, penicillin (100 units/mL) and
streptomycin (100 µg/mL)). Cells were grown at 37 °C in a humidified CO2 incubator
for 24 h. Cells were washed twice with Dulbecco's Phosphate Buffered Saline (DPBS)
before receiving 1000x compound stocks in DMSO (0.2 µL, 0.1% final DMSO
concentration) diluted in DMEM media lacking phenol red (199.8 µL) but containing
10% charcoal-dextran stripped FBS, penicillin (100 units/mL) and streptomycin (100
µL/mL). These cells were incubated for 4 days at 37 °C in a humidified CO2 incubator
before fixation with ice cold 50% trichloroacetic acid (50 µL, Sigma) added directly to
wells with media. Cells were fixed for 1 h at 4 °C, then washed 5x with double distilled
water (200 µL) and air dried. Sulforhodamine B solution (100 µL, 0.4% sulforhodamine
B in 1% acetic acid, Sigma) was added to wells and allowed to stain for 1 hr at RT. Cells
were washed 3x with 1% acetic acid (200 µL), and 10 mM Tris was added (100 µL) to
solubilize the dye. The plate was shaken for 5 min at 30 °C before the absorbance at 570
nm was measured using a Perkin-Elmer HTS Bioassay Reader.20
5.15.12 Expression of Fluorescent Fusion Proteins and Confocal Microscopy
12 mm German glass coverslips (Bellco Glass Inc.) that had been sterilized by
treatment with 70% ethanol and flaming were placed in the wells of a 24-well tissue
culture treated polystyrene plate (Corning). SKN-BE(2)-C cells were seeded at 3 x 10⁴
cells/well (from a confluent culture of trypsinized cells) in media (700 µL, 1:1 Ham's F-
12 and MEM containing 15% FBS, penicillin (100 units/mL) and streptomycin (100

189
µg/mL)). Cells were grown at 37 °C in a humidified CO2 incubator for 24 h. Cells were
washed with Dulbecco's Phosphate Buffered Saline (DPBS) and transfected using
Effectene (Qiagen) according to the manufacturer's instructions. The following
combined plasmids were used per well: pCMVTag2B-hERα(1-595)-AcGFP (5 µL, 100
ng), pCMVTag2B-mRFP-Hsp90 (5 µL, 100 ng). This DNA cocktail was incubated with
Buffer EC (50 µL) and enhancer (1.6 µL) for 5 min at 23 °C. This mixture was added to
Effectene (2 µL) and incubated for 15 min at 23 °C prior to addition of media (700 µL)
followed by addition to wells containing washed cells. Efficient transfection was
typically observed within 18-24 h. 24 h post-transfection, the media was discarded, cells
were washed twice with DPBS, and cells were treated with 100x and 1000x compound
stocks in DMSO (7.7 µL, 1.1% final DMSO concentration) diluted in 1:1 Ham's F-12 and
MEM media lacking phenol red (692.3 µL) but containing 10% charcoal-dextran stripped
FBS, penicillin (100 units/mL) and streptomycin (100 µL/mL). These cells were
incubated for 1-24 h at 37 °C in a humidified CO2 incubator before washing twice with
DPBS and fixing with 4% paraformaldehyde in DPBS (500 µL/well) for 20 min. After
fixation, cells were washed 4x with double distilled water. The coverslips were removed
from the wells and mounted on glass slides using Vectashield mounting medium (Vector
Laboratories). Cells were imaged using a Zeiss LSM 5 Pascal laser scanning confocal
microscope with a 63x oil immersion objective. Images were processed with Adobe
Photoshop 7.0.

190
5.16 References
1. Laskey, R. A.; Honda, B. M.; Mills, A. D.; Finch, J. T., Nucleosomes are
assembled by an acidic protein which binds histones and transfers them to DNA. Nature.
1978, 275, (5679), 416-420.
2. Pratt, W. B.; Toft, D. O., Steroid receptor interactions with heat shock protein and
immunophilin chaperones. Endocr. Rev. 1997, 18, (3), 306- 360.
3. Cheung, J.; Smith, D. F., Molecular chaperone interactions with steroid receptors:
an update. Mol. Endocrinol. 2000, 14, (7), 939-946.
4. Maruya, M.; Sameshima, M.; Nemoto, T.; Yahara, I., Monomer arrangement in
HSP90 dimer as determined by decoration with N and C-terminal region specific
antibodies. J. Mol. Biol. 1999, 285, (3), 903-907.
5. DeBoer, C.; Meulman, P. A.; Wnuk, R. J.; Peterson, D. H., Geldanamycin, a new
antibiotic. J. Antibiot. (Tokyo). 1970, 23, (9), 442-447.
6. Prodromou, C.; Roe, S. M.; O'Brien, R.; Ladbury, J. E.; Piper, P. W.; Pearl, L. H.,
Identification and structural characterization of the ATP/ADP-binding site in the Hsp90
molecular chaperone. Cell. 1997, 90, (1), 65-75.
191
7. Segnitz, B.; Gehring, U., The function of steroid hormone receptors is inhibited
by the hsp90-specific compound geldanamycin. J. Biol. Chem. 1997, 272, (30), 18694-
18701.
8. Whitesell, L.; Cook, P., Stable and specific binding of heat shock protein 90 by
geldanamycin disrupts glucocorticoid receptor function in intact cells. Mol. Endocrinol.
1996, 10, (6), 705-712.
9. Czar, M. J.; Galigniana, M. D.; Silverstein, A. M.; Pratt, W. B., Geldanamycin, a
heat shock protein 90-binding benzoquinone ansamycin, inhibits steroid-dependent
translocation of the glucocorticoid receptor from the cytoplasm to the nucleus.
Biochemistry. 1997, 36, (25), 7776-7785.
10. Alarid, E. T.; Bakopoulos, N.; Solodin, N., Proteasome-mediated proteolysis of
estrogen receptor: a novel component in autologous down-regulation. Mol. Endocrinol.
1999, 13, (9), 1522-1534.
11. Nawaz, Z.; Lonard, D. M.; Dennis, A. P.; Smith, C. L.; O'Malley, B. W.,
Proteasome-dependent degradation of the human estrogen receptor. Proc. Natl. Acad. Sci.
U.S.A. 1999, 96, (5), 1858-1862.
12. Schulte, T. W.; Akinaga, S.; Murakata, T.; Agatsuma, T.; Sugimoto, S.; Nakano,
H.; Lee, Y. S.; Simen, B. B.; Argon, Y.; Felts, S.; Toft, D. O.; Neckers, L. M.; Sharma, S.

192
V., Interaction of radicicol with members of the heat shock protein 90 family of
molecular chaperones. Mol Endocrinol. 1999, 13, (9), 1435-1448.
13. Kamal, A.; Thao, L.; Sensintaffar, J.; Zhang, L.; Boehm, M. F.; Fritz, L. C.;
Burrows, F. J., A high-affinity conformation of Hsp90 confers tumour selectivity on
Hsp90 inhibitors. Nature. 2003, 425, (6956), 407-410.
14. Kuduk, S. D.; Zheng, F. F.; Sepp-Lorenzino, L.; Rosen, N.; Danishefsky, S. J.,
Synthesis and evaluation of geldanamycin-estradiol hybrids. Bioorg. Med. Chem. Lett.
1999, 9, (9), 1233-1238.
15. Hussey, S. L.; Muddana, S. S.; Peterson, B. R., Synthesis of a beta-estradiol-
biotin chimera that potently heterodimerizes estrogen receptor and streptavidin proteins
in a yeast three-hybrid system. J. Am. Chem. Soc. 2003, 125, (13), 3692-3693.
16. Roe, S. M.; Prodromou, C.; O'Brien, R.; Ladbury, J. E.; Piper, P. W.; Pearl, L. H.,
Structural basis for inhibition of the Hsp90 molecular chaperone by the antitumor
antibiotics radicicol and geldanamycin. J. Med. Chem. 1999, 42, (2), 260-266.
17. Anstead, G. M.; Carlson, K. E.; Katzenellenbogen, J. A., The estradiol
pharmacophore: ligand structure-estrogen receptor binding affinity relationships and a
model for the receptor binding site. Steroids. 1997, 62, (3), 268-303.

193
18. Schnur, R.; Corman, M., Tandem [3,3]-Sigmatropic Rearrangements in an
Ansamycin. J. Org. Chem. 1994, 59, 2581-2584.
19. Lee, H. S.; Aumais, J.; White, J. H., Hormone-dependent transactivation by
estrogen receptor chimeras that do not interact with hsp90. Evidence for transcriptional
repressors. J. Biol. Chem. 1996, 271, (42), 25727-25730.
20. Skehan, P.; Storeng, R.; Scudiero, D.; Monks, A.; McMahon, J.; Vistica, D.;
Warren, J. T.; Bokesch, H.; Kenney, S.; Boyd, M. R., New colorimetric cytotoxicity
assay for anticancer-drug screening. J. Natl. Cancer Inst. 1990, 82, (13), 1107-1112.
21. Tsien, R. Y., The green fluorescent protein. Annu. Rev. Biochem. 1998, 67, 509-
544.
22. Harrington, W. R.; Kim, S. H.; Funk, C. C.; Madak-Erdogan, Z.; Schiff, R.;
Katzenellenbogen, J. A.; Katzenellenbogen, B. S., Estrogen dendrimer conjugates that
preferentially activate extranuclear, nongenomic versus genomic pathways of estrogen
action. Mol. Endocrinol. 2006, 20, (3), 491-502.
23. Ausubel, F. M., Short protocols in molecular biology : a compendium of methods
from Current protocols in molecular biology. 3rd ed.; Wiley: New York, 1995; p 1 v.

194
24. Muddana, S. S.; Peterson, B. R., Facile synthesis of cids: biotinylated estrone
oximes efficiently heterodimerize estrogen receptor and streptavidin proteins in yeast
three hybrid systems. Org. Lett. 2004, 6, (9), 1409-1412.
25. Campbell, R. E.; Tour, O.; Palmer, A. E.; Steinbach, P. A.; Baird, G. S.;
Zacharias, D. A.; Tsien, R. Y., A monomeric red fluorescent protein. Proc. Natl. Acad.
Sci. U.S.A. 2002, 99, (12), 7877-7882.
26. Chen, D. C.; Yang, B. C.; Kuo, T. T., One-step transformation of yeast in
stationary phase. Curr. Genet. 1992, 21, (1), 83-84.
27. Green, S.; Issemann, I.; Sheer, E., A versatile in vivo and in vitro eukaryotic
expression vector for protein engineering. Nucleic Acids Res. 1988, 16, (1), pg 369.

195
Chapter 6
Synthesis and Biological Evaluation of Bis(trifluoromethyl)pyrazole Derivatives for
Identification of Immunosuppressive Drug Targets
6.1 Introduction
Cytokines are growth factor proteins secreted primarily by white blood
cells involved in the immune response. Expression of these proteins is often controlled
by members of the nuclear factor of activated T-cell (NFAT) family of transcription
factors.1 NFAT proteins were originally described as nuclear proteins that bind DNA
sequences controlling the human interleukin 2 (IL-2) promoter and are considered to be
the regulatory proteins of the immune system.2, 3
Upon activation by an extracellular
stimulus, the T-cell receptor is activated, leading to an increase in levels of intracellular
Ca2+
and activation of calmodulin. Under these conditions the Ca2+
/calmodulin-
dependent cellular phosphatase calcineurin is activated. Calcineurin binds to NFAT at its
regulatory domain and dephosphorylates NFAT, causing a conformational change that
unmasks its nuclear localization signal. NFAT translocates to the nucleus, where it binds
to NFAT response elements (Figure 6.1).
NFAT is activated by the calcium-dependent phosphatase calcineurin (CaN),
which is inhibited by the immunosuppressive drugs cyclosporin A (CsA, 114) and FK506
(115) (Figure 6.2).4 Their direct target is calcineurin. CsA combines with the cellular
protein cyclophilin to inhibit calcineurin; FK506 combines with FKBP (FK506 binding

196
protein) to inhibit the phosphatase. These immunosuppressant drugs, although effective,
also have negative side effects such as high toxicity, which limits their utility as agents
that prevent rejection of organ transplants.5-7
Given the increasing importance of organ
transplants in modern medicine, the toxicity of CsA and FK506 necessitates the
development of safer immunosuppressive drugs.
Figure 6.1. General signaling pathway for NFAT. Upon activation by an
extracellular stimulus, T-cell receptor is activated, leading to an increase in levels of
intracellular Ca2+ and activation of calmodulin. Under these conditions the
Ca2+/calmodulin-dependent cellular phosphatase calcineurin is activated. Calcineurin
binds to NFAT at its regulatory domain and dephosphorylates NFAT, causing a

197
conformational change that unmasks its nuclear localization signal. NFAT translocates to
the nucleus, where it binds to NFAT response elements.
Figure 6.2. Structures of Immunosuppresant Drugs CsA (114) and FK506 (115).
6.2 Bis(trifluoromethyl)pyrazoles as a Novel Class of Immunosuppresants
Bis(trifluoromethyl)pyrazoles (116 and 117, Figure 6.3) (BTPs) comprise a recently
discovered series of NFAT regulators that were initially identified as inhibitors of
interleukin-2 (IL-2) synthesis. These low molecular weight compounds block the
activation-dependent nuclear localization of NFAT with greater potency than either
FK506 or CsA. They are also selective for NFAT over the related transcription factors
AP-1 and NF-κB.8, 9
Yet unlike FK506 and CsA, BTPs do not inhibit the phosphatase
calcineurin. However, the mechanism of action for these compounds is not known and
their protein target has not been reported.

198
Figure 6.3. Structure of select BTP molecules.
6.3 Design and Synthesis of BTP derivatives for Identification of Drug
Targets
To investigate the mechanism of action of BTPs, we designed a BTP derivative
(BTP-biotin, 118, Figure 6.4) potentially useful for identification of proteins that may
interact with these small molecules. Towards this end, we synthesized this biotinylated
BTP for use as an affinity chromatography reagent to probe potential target proteins
(Figure 6.5). To synthesize derivatives of BTP, modification of the para-chloro group of
116 was chosen based on previously reported structure-activity relationship information.8
The compounds were synthesized from a pyrazolyl aniline (122) as shown in Figure 6.5.
This was accomplished by condensation of 4-nitrophenylhydrazine (119) and 1,1,1,5,5,5-
hexafuoro-2,4-pentanedione (120) in refluxing ethanol under acidic conditions to afford
121. Subsequent hydrogenation afforded the corresponding aniline (122).8 Coupling of
122 with para-iodo-benzoic acid (123) activated by conversion to the acid chloride
afforded an iodonated BTP analogue (124) that could be easily modified. Addition of 5-
Boc-propargyl amine (125) under Sonagashira conditions10
installed a linker for synthesis
of compound 118.

199
Figure 6.4. Structure of BTP-biotin for use in affinity chromatography.
The biotinylated-BTP derivative 118 was prepared by removal of the Boc group
of 126 with TFA in CH2Cl2 followed by coupling with a commercially available,
pegylated, biotin N-hydroxysuccinimidyl ester.
Figure 6.5. Synthesis of BTP-biotin (118).
6.4 BTP-Biotin Retains Inhibitory Activity
As an initial evaluation of the potential immunomodulatory activity of the BTP
analogues, a luciferase reporter assay was employed (Jason Mercer, August Lab). In this

200
assay, primary NFAT-luciferase transgenic mouse thymocytes were stimulated in the
presence of the indicated concentration of 118 with PMA/ionomycin for 24 hrs prior to
assaying for luciferase activity (Figure 6.6). The inhibitory activity of BTP-biotin was
slightly reduced as compared to 2,4-dichloro-bis(trifluoromethyl)pyrazole, a known
inhibitor of NFAT mediated gene expression. This is likely due to the large linker and the
biotin group. However, compound (118) still had significant activity in these cells with
an IC50 of approximately 600 nM compared to 15 nM for the parent compound. This
assay demonstrated that modification of the benzoic amide functionality only moderately
decrese potency.
Figure 6.6. NFAT-luciferase transgenic mouse thymocytes were stimulated in the
prescence of the indicated concentration of BTP-biotin (118) with PMA/ionomycin for
24 hours prior to assaying for luciferase activity.
6.5 Affinity Chromatography using Biotinylated BTP

201
BTP-biotin (118) was used to identify protein targets of BTPs by affinity
chromatography (Jason Mercer, August Lab). Figure 6.7 shows an overview of the
affinity purification of putative NFAT-inhibitory proteins. Jurkat cells were lysed,
incubated with streptavidin-coated agarose beads to remove
streptavidin-binding proteins, and subsequently incubated with
streptavidin agarose beads treated with BTP-biotin. After the
incubation period, the beads were washed and boiled in reducing buffer
to denature and release bound proteins. These proteins were loaded
onto a SDS-acrylamide gel and stained with coomasie blue dye to
visualize interacting proteins (Figure 6.8). Proteins isolated from
this gel were sent to Yale Microchemistry facility and Penn State
University to be analyzed by mass spectrometry for identification. Mass
spectrometry identified the proteins drebrin, 17β HSD 4, and actin as
putative interacting proteins.
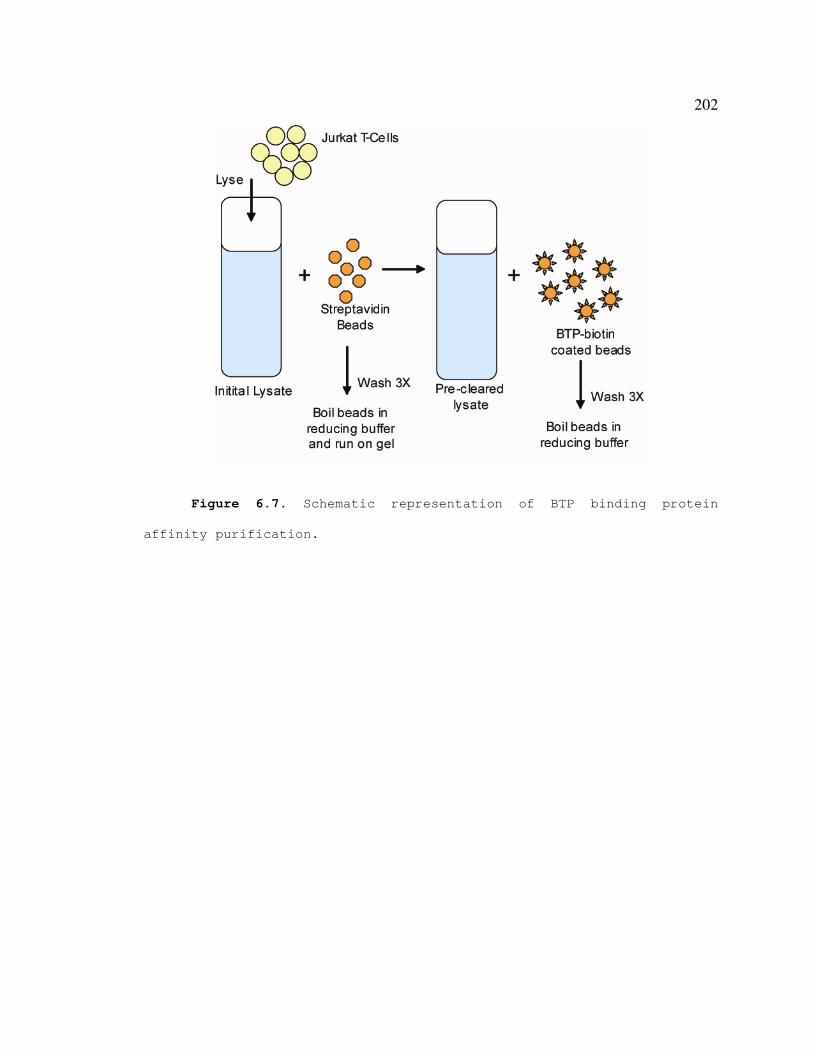
202
Figure 6.7. Schematic representation of BTP binding protein
affinity purification.

203
Figure 6.8. Purification of BTP-binding proteins. Lanes 1-3 are
precleared lysates incubated with only strepavidin-agarose beads. Lane
4 is beads incubated with BTP-biotin (118) coated beads.
6.6 Interaction of BTP with Drebrin
BTP binding to drebrin was further confirmed by Western blotting (Figure 6.9).
The affinity chromatography experiment shown in Figure 6.7 was repeated comparing
BTP-biotin (118) coated beads with control beads that were coated with the commercially
available, pegylated biotin (no BTP moiety) to confirm that drebin wasn't preferentially
binding the linker of compound 118. Proteins from this gel were electro-blotted to a
PVDF membrane and then probed with anti-drebrin antibody. As seen in Figure 6.9,
drebin was confirmed to bind the BTP moiety of compound 118 and not the linker.
Additionally, RNAi mediated knock-down of drebrin expression was shown to block
NFAT activity (August Lab, data not shown). These results have allowed us to identify
drebrin as a potential target of BTPs involved in the activation of NFAT.

204
Figure 6.9. Western blot anaylsis with anti-drebrin antibody confirming drebrin
binds to the BTP portion of 118 and not the linker region of this molecule.
6.7 BTP Blocks Drebrin Function
It has been shown that drebin causes the formation of long, branched extension
and curved thick actin bundles when it is over-expressed in fibroblasts.11
It was reasoned
that this phenomenon may be inhibited in cells overexpressing drebrin if BTP does in fact
block drebrin function. In order to test this hypothesis, a GFP-tagged drebrin was
expressed in CHO cells, which caused cells to develop long, highly branched membrane
extensions (Figure 6.10, middle row). When these cells were treated with BTP there was
a large reduction in these long extensions (bottom row) however, drebrin co-localization
with actin was not effected, suggesting that although the actin-binding site within drebrin
forms part of the BTP binding domain, this does not affect actin co-localization with
drebrin.

205
Figure 6.10. Confocal laser micrographs of CHO cells transfected with either
GFP (top) or GFP-drebrin (middle and bottom) and treated with DMSO (middle) or BTP
(bottom) prior to staining for F-actin (red).
6.8 Novel BTP Derivatives
In order to better understand the mechanism of action of BTP molecules, we
designed novel BTP derivatives. We designed a series that modifies the trifluoromethyl
pyrazole ring, by replacing the trifluoromethyl goups with methyl groups and hydrogens.
These analogues were synthesized using the same synthetic route shown in Figure 6.5 for

206
BTP-Biotin (Figure 6.11). Based on previous reports, we expect that the trifluoromethyl
pyrazole ring is important for the compound’s potency.8 These compounds are being
tested for their ability to inhibit NFAT activation in the luciferase system as well as their
ability to inhibit Ca2+ influx. Once this information is obtained, it may be useful in
optimizing BTPs for use as immunosuppressive drugs.
Figure 6.11. Synthesis of novel BTP derivatives.
6.9 Conclusions

207
We have designed, synthesized and evaluated a biotinylated BTP derivative (118)
in an attempt to identify the binding target of this new class of immunosuppressant drugs.
Through affinity chromatography, drebrin was identified as a potential target of BTPs.
Drebrin was further confirmed to bind BTP in a western blot. Confocal micrographs of
CHO cells expressing GFP-drebrin show drastic changes in drebrin when cells treated
with BTP were compared to those with DMSO alone. We have also synthesized a series
of derivatives in order to elucidate a structure activity relationship. As this study is
ongoing, the information obtained thus far will be crucial in identifying a mechanism of
action that possibly involves the protein drebrin for BTPs.
6.10 Experimental Section
6.10.1 General
All nonaqueous reactions were performed under an atmosphere of dry argon.
Reagents for synthesis were purchased from Aldrich, Acros, Alfa Aesar, or Fisher and
used without further purification. Biotin-PEG4-NHS ester was purchased from Quanta
BioDesigns. Dichloromethane (CH2Cl2) and Triethylamine (TEA) were distilled from
calcium hydride under nitrogen. Reactions were monitored by analytical thin-layer
chromatography on plates coated with 0.25 mm silica gel 60 F254 (EM science). Flash
column chromatography employed 230-240 mesh silica gel (EM Science). TLC plates
were visualized by UV irradiation (254 nm) or stained with a solution of
phosphomolybdic acid and sulfuric acid in ethanol (1:1:20). Melting points were

208
measured with a Thomas Hoover melting point apparatus and are uncorrected. All 1H
and 13
C NMR spectra were recorded using Bruker DPX-300, AMX-360 or DRX-400
spectrometers at ambient temperature (23 °C). NMR signals were referenced to internal
CDCl3 (δH 7.27) and CDCl3 (δD 77.0) peaks in parts per million (ppm). Mass spectra
were acquired by the Penn State Huck Institute Mass Spectrometry Facility on a Mariner
APCI instrument. Peaks are reported as m/z.
6.10.2 Synthetic Procedures and Characterization
124
N-[4-(3,5-Bis-trifluoromethyl-pyrazol-1-yl)-phenyl]-4-iodo-benzamide (124)
A solution of p-iodobenzoic acid (541 mg, 2.18 mmol) in SOCl2 (25 mL) was
refluxed for 3 h. Excess SOCl2 was removed by distillation and CH2Cl2 (25 mL) was
added. 4-[3,5-Bis(trifluoromethyl)1H-pyrazole]aniline (123, 625 mg, 2.12 mmol) and
DIEA (350 µL, 2.12 mmol) were added. After 2 h at 23 °C, the reaction was quenched
with deionized H2O (25 mL) and extracted with CH2Cl2 (3 x 20 mL). The organic layer
was dried over anhydrous Na2SO4 and solvent was removed in vacuo. Flash
chromatography (hexanes / ethyl acetate, 3:1) afforded 124 (0.93 g, 83%), mp 217-219
°C; 1H NMR (360 MHz, CDCl3) δ 7.88-7.82 (m, 4H), 7.6 (d, J = 8.4 Hz, 2H) 7.4 (d, J =
8.8 Hz, 2H), 7.0 (s, 1H); 13
C NMR (100 MHz, CDCl3) 166.2, 144.2 (q, J = 39.3 Hz, -
CCF3), 140.1, 137.5, 134.4 (q, J = 40.2 Hz, -CCF3), 133.7, 133.4, 128.8, 126.1, 125.8 (q,
J = 268.4 Hz, -CF3), 120.5, 119.4 (q, J = 268.0 Hz, -CF3), 106.8, 98.8; IR (film) νmax

209
3285, 1650, 1243, 1149 cm-1
; HRMS (APCI+) m/z 525.9877 (MH+, C18H10N3OIF6
requires 525.9845)
126
(3-{4-[4-(3,5-Bis-trifluoromethyl-pyrazol-1-yl)-phenylcarbamoyl]-phenyl}-
prop-2-ynyl)-carbamic acid tert-butyl ester (126)
Cuprous iodide (17 mg, 0.09 mmol) was added to
bis(triphenylphosphine)palladium dichloride (31 mg, 0.045 mmol), N-[4-(3,5-bis-
trifluoromethyl-pyrazol-1-yl)-phenyl]-4-iodo-benzamide (124, 0.50 g, 0.90 mmol) and t-
butyl N-propargyl carbamate (125, 173.2 mg, 1.12 mmol, prepared as described in J. Am.
Chem. Soc., 1999, 121, 4704) in triethylamine (75 mL) under Ar in a Schlenk flask.
After 1 h at 23 °C, the reaction was quenched with deionized H2O (50 mL) and extracted
with CH2Cl2 (3 x 50 mL). The organic layer was dried over anhydrous Na2SO4 and
solvent was removed in vacuo. Flash chromatography (hexanes / ethyl acetate, 3:1)
afforded 126 (0.40 g, 80%), mp 158-160 °C; 1H NMR (300 MHz, CDCl3) δ 7.84 (m, 4H),
7.49 (m, 4H), 7.00 (s, 1H), 4.15 (d, J = 5.4 Hz, 2H), 1.47 (s, 9H); 13
C NMR (100 MHz,
CDCl3) 166.3, 155.8, 142.2 (q, J = 39.4 Hz, -CCF3), 140.1, 134.3(q, J = 40.0 Hz, -CCF3),
133.5, 133.3, 131.4, 127.2, 126.3, 126.0, 121.5 (q, J = 267.4 Hz, -CF3), 120.5, 118.7 (q, J
= 267.9 Hz, -CF3), 106.7, 88.1, 81.6, 79.9, 30.5, 27.9; IR (film) νmax 3363, 3293, 2986,
1692, 1649 cm-1
; HRMS (APCI+) m/z 553.1642 (MH+, C26H22F6N4O3 requires 553.1669)

210
N-[4-(3,5-Bis-trifluoromethyl-pyrazol-1-yl)-phenyl]-4-[3-(3-{2-[2-(2-{2-[5-(2-
oxo-hexahydro-thieno[3,4-d]imidazol-6-yl)-pentanoylamino]-ethoxy}-ethoxy)-
ethoxy]-ethoxy}-propionylamino)-prop-1-ynyl]-benzamide (118)
(3-{4-[4-(3,5-Bis-trifluoromethyl-pyrazol-1-yl)-phenylcarbamoyl]-phenyl}-prop-
2-ynyl)-
carbamic acid tert-butyl ester (126, 44.8 mg, 0.097 mmol) was treated with TFA
in CH2Cl2 (8%, 5 mL). After 2 h at 23 °C, solvent was removed in vacuo. To the residue
was added CH2Cl2 (10 mL), PEG4-Biotin NHS ester (40 mg, 0.067 mmol), and DIEA (8
µL, 0.046 mmol). After 2 h at 23 °C, the reaction was quenched by addition of deionized
H2O (15 mL) and extracted with CH2Cl2 (3 x 15 mL). The organic layer was dried over
anhydrous Na2SO4 and solvent was removed in vacuo. Flash chromatography (CH2Cl2 /
MeOH / TEA, 8.5:1:0.5) afforded BTP-Biotin (118, 45 mg, 72%), mp 70-72 °C; 1H
NMR (400 MHz, CDCl3 / CD3OD, 99:1) 7.97 (d, J = 8.9 Hz, 2H), 7.88 (d, J = 8.4 Hz,
2H), 7.47-7.41 (m, 4H) 6.97 (s, 1H), 4.39 (m, 1H), 4.26 (d, J = 5.3 Hz, 2H), 4.23 (m, 1H),
3.71 (t, J = 5.8 Hz, 2H), 3.58-3.56 (m, 12H), 3.47 (t, J = 5.0 Hz, 2H), 3.37-3.33 (m, 2H),
3.04 (q, J = 4.5 Hz, 1H), 2.82-2.76 (m, 2H), 2.49 (t, J = 5.7 Hz, 2H), 2.14 (t, J = 7.3 Hz,
2H), 1.61-1.55 (m, 4H) 1.42-1.31 (m, 2H); 13
C NMR (100 MHz, CDCl3 / CD3OD 99:1)
173.7, 171.5, 165.9, 163.8, 143.5 (q, J = 39.4 Hz, -CCF3), 140.6, 134.3 (q, J = 40.1 Hz, -

211
CCF3), 134.0, 133.5, 131.7, 127.7, 126.3, 126.2, 121.4 (q, J = 267.7 Hz, -CF3), 120.6,
118.7 (q, J = 268.0 Hz, -CF3), 107.0, 88.3, 81.9, 77.2, 70.3 (x 2), 70.1, 69.9, 67.0, 61.7,
60.0, 55.4, 40.4, 39.1, 36.6, 35.6, 29.6, 29.2, 28.4, 27.9, 27.8, 25.5; IR (film) νmax 3288,
2921, 1690, 1651, 1141 cm-1
; HRMS (APCI+) m/z 926.3294 (MH+, C42H49F6N7O8S
requires 926.3340)
General Procedure for pyrazole formation (Compounds 127a-e)
(127a and 127b)
4-nitrophenyl hydrazine (1.0 g, 6.5 mmol) was dissolved in ethanol (100 mL).
1,1,1-trifluoromethyl-2,4-pentane dione (780 µL, 6.5 mmol) was added dropwise along
with the addition of concentrated HCl (3 mL). The solution was refluxed for 3 d at 110
oC. The ethanol was removed in vacuo and the residue was dissolved in CH2Cl2 and
washed with water (3 X 15 mL). The organic layer was dried over anhydrous Na2SO4 and
solvent was removed in vacuo. Flash chromatography (Hexanes / EtOAc, 7:3) afforded
127a and 127b (1:1, 75%)
5-Methyl-1-(4-nitro-phenyl)-3-trifluoromethyl-1H-pyrazole (127a)

212
(0.6544 g), mp 69-70 oC;
1H NMR (360 MHz, CDCl3) 8.23 (d, J = 8.8 Hz, 2H),
7.64 (d, J = 8.8 Hz, 2H), 6.50 (s, 1H), 2.41 (s, 3H); 13
C NMR (100 MHz, CDCl3) 146.6,
143.5, 143.5 q, 141.3, 124.7, 124.4, 120.9 q, 106.0, 12.2; LRMS (APCI +) m/z 272.1
(MH+ C11H8O2N3F3 requires 272.1)
3-Methyl-1-(4-nitro-phenyl)-5-trifluoromethyl-1H-pyrazole (127b)
(0.67 g), mp 68-70 oC;
1H NMR (360 MHz, CDCl3) 8.18 (d, J = 9.0 Hz, 2H),
7.57 (d, J = 9.0 Hz, 2H), 6.58 (s, 1H), 2.23 (s, 3H); 13
C NMR (100 MHz, CDCl3) 150.3,
146.9, 143.7, 132.6 q, 124.9, 124.2, 119.4 q, 110.3, 12.7; LRMS (APCI +) m/z 272.0
(MH+ C11H8O2N3F3 requires 272.0)
3,5-Dimethyl-1-(4-nitro-phenyl)-1H-pyrazole (127c)
4-nitrophenyl hydrazine (1.0 g, 6.5 mmol), 2,4-pentane dione (670 µL, 6.5 mmol)
afforded 127c (1.097 g, 78%), mp 101 oC;
1H NMR (400 MHz, CDCl3) 7.99 (d, J = 8.5
Hz, 2H), 7.42 (d, J = 8.5 Hz, 2H), 5.83 (s, 1H), 2.19 (s, 3H), 2.09 (s, 3H); 13
C NMR (100
MHz, CDCl3) 150.0, 144.6, 144.3, 139.3, 123.9, 122.4, 109.0, 12.7, 12.4; LRMS (APCI
+) m/z 218.1 (MH+ C11H11O2N3 requires 218.1)
1-(4-nitro-phenyl)-3-trifluoromethyl-1H-pyrazole (127d)
4-nitrophenyl hydrazine (1.0 g, 6.5 mmol), 4-Ethoxy-1,1,1-trifluoro-3-butene-2-
one (926 uL, 6.5 mmol) afforded 127d and 127e (6:1, 72%), 127d: mp 121-122 oC;
1H
NMR (300 MHz, CDCl3) 8.32 (m, 2H), 8.08 (d, J = 1.74 Hz, 1H), 7.89 (m, 2H), 6.78 (d,
J = 2.5 Hz, 1H); 13
C NMR (75 MHz, CDCl3) 146.2, 145.3 (q, -CCF3), 143.4, 128.7,

213
125.2, 120.7 (q, -CF3) 119.4, 107.2; LRMS (APCI +) m/z 528.1 (MH+ C10H6O2N3F3
requires 528.1)
1-(4-nitro-phenyl)-5-trifluoromethyl-1H-pyrazole (127e)
mp 70-72 oC;
1H NMR (300 MHz, CDCl3) 8.26 (m, 2H), 7.69 (m, 3H), 6.82 (d, I
= 1.74 Hz, 1H); 13
C NMR (75 MHz, CDCl3) 147.3, 143.5, 140.3, 132.3 (q, -CCF3),
125.4, 124.3, 119.5 (q, -CF3) 110.4; LRMS (APCI +) m/z 528.1 (MH+ C10H6O2N3F3
requires 528.1)
Genral Procedure for Compounds 128a-e
4-(5-Methyl-3-trifluoromethyl-pyrazol-1-yl)-phenylamine (128a)
127a (550 mg, 2.02 mmol) was dissolved in ethanol (50 mL) and Pd(C) (catalytic
amt.) was added. The round bottom flask was flushed with nitrogen and hydrogen gas
was allowed to bubble through the solution for 2 h. Pd(C) was filtered off and solvent
was removed in vacuo. The residue was added directly to a silica column. Flash
chromatography (Hexanes / EtOAc, 7:3) afforded 128a (454.6 mgs, 93%) mp 90-92 oC;
1H NMR (360 MHz, CDCl3) 7.06 (d, J = 8.6 Hz, 2H), 6.57 (d, J = 8.6 Hz, 2H), 6.36 (s,

214
1H), 3.88 (s, 2H) 2.24 (s, 3H); 13
C NMR (90 MHz, CDCl3) 147.2, 141.5 q, 140.7, 129.1,
126.3, 121.4 q, 114.6, 103.8, 11.6; LRMS (APCI +) m/z 242.0 (MH+ C11H10N3F3
requires 242.0)
4-(3-Methyl-5-trifluoromethyl-pyrazol-1-yl)-phenylamine (128b)
127b (537 mg, 1.98 mmol) afforded 128b (451.3 mg, 94%) mp 84-85 oC;
1H
NMR (360 MHz, CDCl3) 7.13 (d, J = 8.6 Hz, 2H), 6.56 (d, J = 8.6 Hz, 2H), 6.48 (s, 1H),
3.83 (s, 2H) 2.78 (s, 3H); 13
C NMR (90 MHz, CDCl3) 148.1, 147.3, 138.8 q, 129.6,
126.8, 119.7 q, 114.2, 107.5, 12.9; LRMS (APCI +) m/z 242.0 (MH+ C11H10N3F3
requires 242.0)
4-(3,5-Dimethyl-pyrazol-1-yl)-phenylamine (128c)
Dimethyl-pyrazole (127c) (548 mg, 2.5 mmol) afforded 128c (381 mg, 82%) mp
98 oC;
1H NMR (400 MHz, CDCl3) 6.98 (d, J = 6.7, 2h), 6.45 (d, J = 6.5, 2H), 5.82 (s,
1H), 3.89 (s, 2H) 2.17 (s, 3H), 2.07 (s, 3H); 13
C NMR (100MHz, CDCl3) 147.4, 145.9,
138.9, 129.9, 125.7, 114.2, 105.2, 12.9, 11.1; LRMS (APCI +) m/z 188.2 (MH+ C11H13N3
requires 188.2)
4-(3-Trifluoromethyl-pyrazol-1-yl)-phenylamine (128d)
127d (231 mg, 0.98 mmol) afforded 128d (155 mg, 77%) mp 98-99 oC;
1H NMR
(300 MHz, CDCl3) 7.74 (d, J = 1.4, 1H), 7.37 (d, J = 8.3, 2H), 6.46 (m, 3H), 3.73 (bs,
2H); 13
C NMR (75 MHz, CDCl3) 146.3, 143.1 (q, -CCF3), 131.0, 128.2, 123.1 (q. –CF3),
121.6, 115.1, 105.2; LRMS (APCI +) m/z 228.0 (MH+ C10H8N3F3 requires 228.0)

215
4-(5-Trifluoromethyl-pyrazol-1-yl)-phenylamine (128e)
127e (524 mg, 2.0 mmol) afforded 128e (386 mg, 83%) as a yellow oil; 1H NMR
(300 MHz, CDCl3) 7.58 (d, J = 1.4, 1H), 7.14 (d, J = 8.6, 2H), 6.68 (d, J = 1.8, 1H), 6.53
(m, 2H), 3.98 (bs, 2H); 13
C NMR (75 MHz, CDCl3) 148.0, 138.6, 132.3 (q, -CCF3),
129.0, 127.0, 119.6 (q. –CF3), 114.3, 107.9; LRMS (APCI +) m/z 228.0 (MH+
C10H8N3F3 requires 228.0)
General Procedure for Compounds 129a-e
A solution of p-chlorobenzoic acid in SOCl2 was refluxed for 3 h. Excess SOCl2
was removed by distillation and CH2Cl2 was added to the remaining residue. Appropriate
pyrazole aniline and DIEA were added. After 2 h at 23 °C, the reaction was quenched
with deionized H2O and extracted with CH2Cl2. The organic layer was dried over
anhydrous Na2SO4 and solvent was removed in vacuo. Flash chromatography (Hexanes /
EtOAc, 3:1) afforded 129.
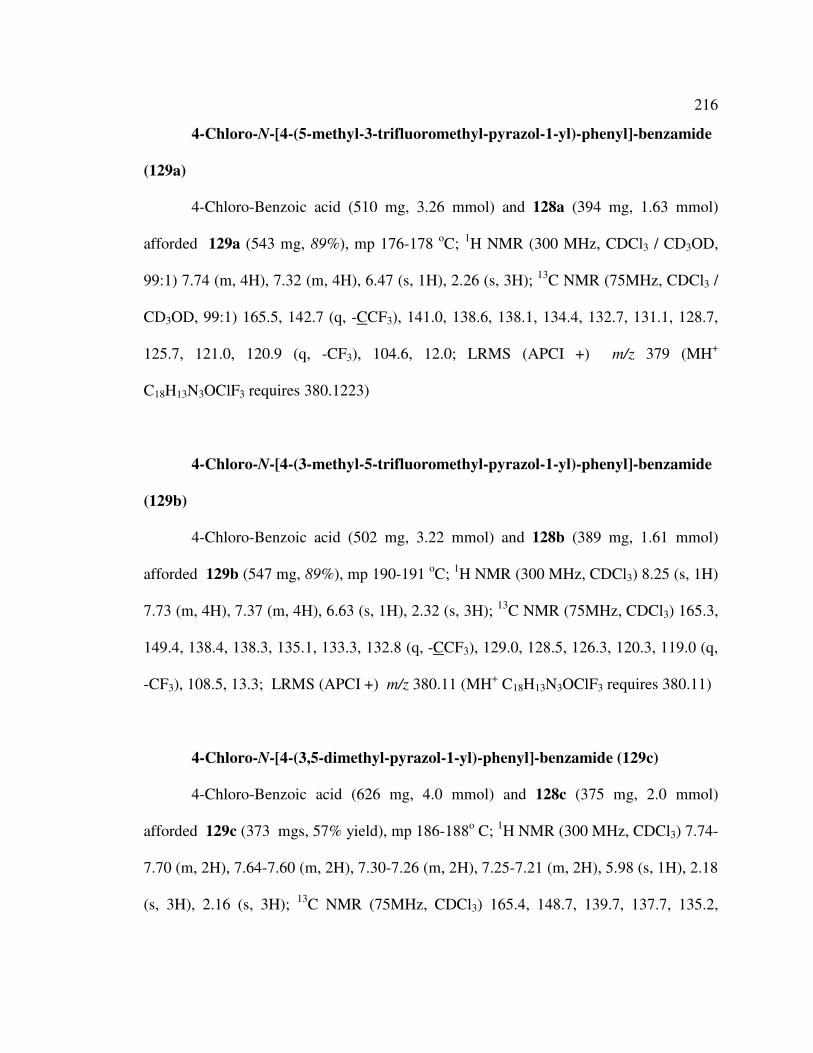
216
4-Chloro-N-[4-(5-methyl-3-trifluoromethyl-pyrazol-1-yl)-phenyl]-benzamide
(129a)
4-Chloro-Benzoic acid (510 mg, 3.26 mmol) and 128a (394 mg, 1.63 mmol)
afforded 129a (543 mg, 89%), mp 176-178 oC;
1H NMR (300 MHz, CDCl3 / CD3OD,
99:1) 7.74 (m, 4H), 7.32 (m, 4H), 6.47 (s, 1H), 2.26 (s, 3H); 13
C NMR (75MHz, CDCl3 /
CD3OD, 99:1) 165.5, 142.7 (q, -CCF3), 141.0, 138.6, 138.1, 134.4, 132.7, 131.1, 128.7,
125.7, 121.0, 120.9 (q, -CF3), 104.6, 12.0; LRMS (APCI +) m/z 379 (MH+
C18H13N3OClF3 requires 380.1223)
4-Chloro-N-[4-(3-methyl-5-trifluoromethyl-pyrazol-1-yl)-phenyl]-benzamide
(129b)
4-Chloro-Benzoic acid (502 mg, 3.22 mmol) and 128b (389 mg, 1.61 mmol)
afforded 129b (547 mg, 89%), mp 190-191 oC;
1H NMR (300 MHz, CDCl3) 8.25 (s, 1H)
7.73 (m, 4H), 7.37 (m, 4H), 6.63 (s, 1H), 2.32 (s, 3H); 13
C NMR (75MHz, CDCl3) 165.3,
149.4, 138.4, 138.3, 135.1, 133.3, 132.8 (q, -CCF3), 129.0, 128.5, 126.3, 120.3, 119.0 (q,
-CF3), 108.5, 13.3; LRMS (APCI +) m/z 380.11 (MH+ C18H13N3OClF3 requires 380.11)
4-Chloro-N-[4-(3,5-dimethyl-pyrazol-1-yl)-phenyl]-benzamide (129c)
4-Chloro-Benzoic acid (626 mg, 4.0 mmol) and 128c (375 mg, 2.0 mmol)
afforded 129c (373 mgs, 57% yield), mp 186-188o C;
1H NMR (300 MHz, CDCl3) 7.74-
7.70 (m, 2H), 7.64-7.60 (m, 2H), 7.30-7.26 (m, 2H), 7.25-7.21 (m, 2H), 5.98 (s, 1H), 2.18
(s, 3H), 2.16 (s, 3H); 13
C NMR (75MHz, CDCl3) 165.4, 148.7, 139.7, 137.7, 135.2,

217
132.8, 128.7, 128.4, 125.1, 120.8, 106.6, 13.0, 11.9; LRMS (APCI +) m/z 326.79 (MH+
C18H16N3OCl requires 326.79)
4-Chloro-N-[4-(3-trifluoromethyl-pyrazol-1-yl)-phenyl]-benzamide (129d)
4-Chloro-Benzoic acid (211 mg, 1.35 mmol) and 128d (154 mg, 0.67 mmol)
afforded 129d (188 mg, 77%), mp 190-191 oC;
1H NMR (400 MHz, CDCl3 / CD3OD,
99:1) 7.85 (s, 1H), 7.70 (m, 4H), 7.54 (d, J = 8.9 Hz, 2H), 7.31 (d, J = 8.4 Hz, 2H), 6.60
(d, J = 2.3 Hz, 1H); 13
C NMR (100 MHz, CDCl3 / CD3OD, 99:1) 165.7, 142.7 (q, -
CCF3), 137.9, 137.8, 135.3, 132.8, 128.7, 128.5, 121.3, 120.9 (q, -CF3), 120.2, 105.7;
LRMS (APCI +) m/z 366.1 (MH+ C17H11N3OClF3 requires 366.1)
4-Chloro-N-[4-(5-trifluoromethyl-pyrazol-1-yl)-phenyl]-benzamide (129e)
4-Chloro-Benzoic acid (469 mg, 3.0 mmol) and 128e (351 mg, 1.5 mmol)
afforded 129e (482 mg, 82%), mp 210-212 oC;
1H NMR (400 MHz, CDCl3 / CD3OD,
99:1) 7.73 (m, 4H), 7.57 (d, J = 1.4 Hz, 1H), 7.31 (m, 4H), 6.71 (d, J = 1.8 Hz, 1H); 13
C
NMR (100 MHz, CDCl3 / CD3OD, 99:1) 165.8, 139.3, 137.9, 134.4, 132.8, 132.5 (q, -
CCF3), 128.7, 128.5, 126.0, 120.6, 119.5 (q, -CF3), 108.6; LRMS (APCI +) m/z 366.1
(MH+ C17H11N3OClF3 requires 366.1)
4-Chloro-N-(4-pyrazol-1-yl-phenyl)-benzamide (129f)
4-Chloro-Benzoic acid (393 mg, 2.5 mmol) and pyrazoylaniline (200 mg, 1.25
mmol) afforded 129f (197 mg, 53%), mp 242-245 oC;
1H NMR (300 MHz, D6-DMSO)
10.09 (s, 1H), 7.99 (d, J = 2.4 Hz, 1H), 7.78 (dt, J = 8.0, J = 1.9 Hz, 2H), 7.69 (dt, J = 9.0

218
Hz, J = 2.0, 2H), 7.50 (dt, J = 9.0, J = 2.1 Hz, 2H), 7.45 (d, J = 1.6 Hz, 1H), 7.29 (dt, J =
8.5, J = 1.9 Hz, 2H), 6.25 (t, J = 2.3 Hz, 1H); 13
C NMR (100 MHz, D6-DMSO) 164.3,
140.1, 137.0, 136.5, 135.5, 133.3, 129.2, 128.0, 126.7, 120.9, 118.5, 107.0; LRMS
(APCI +) m/z 298.7 (MH+ C16H12N3OCl requires 298.7 )
6.10.3 Assays and Protocols
Western Blot.
Samples for western blot were first separated by size using SDS-PAGE. Briefly,
samples were boiled at 100 °C for 10 min in 2X SDS-PAGE reducing buffer (0.499 M
Tris, 20% glycerol, 4% sodium dodecyl-sulfate, 2% 2-mercapto-ethanol, 0.025%
bromophenol blue). Proteins were then separated by electrophoresis through
polyacrylamide/SDS gel and transferred to PVDF membrane prior to blocking in 5%
milk/Tris-buffered Saline + 0.1% Tween-20 (TBS-T) for 1 hour at room temperature with
rocking. Membranes were then incubated in 5 mL of 5% milk/TBS-T plus primary
antibody, normally diluted 1:500-1:2000, for 1 h at 23 oC with rocking. Following three
15 min washes in TBS-T, secondary antibody solution (5 ml 5% milk/TBS-T plus HRP
linked secondary antibody (1:10,000-1:100,000 dilution)) was added and incubated for 30
min at 23 oC with rocking. Following three final 15 min washes in TBS-T, ECL plus
substrate (Amersham Biosciences, Piscataway, NJ) was added in order to visualize

219
protein bands that reacted with the antibodies. The membrane was then exposed to blue
sensitive X-ray film to visualize bands.
Coomasie Stain.
Proteins in SDS-PAGE were visualized by staining with GelCode Blue colloidal
Coomasie (Pierce Biotechnology, Rockford, IL). Briefly, gels were washed in distilled,
deionized water for 1 h with three changes of water. The gels were then covered in
GelCode Blue solution until proteins bands were visible (15 min-1 h). Bands were further
developed by washing in water for 1 h to 16 h with several changes of water until the
background became nearly clear.
In-gel digest and mass spectrometry.
For protein identification bands were excised from the SDS-PAGE gel and in-gel
tryptic digest was performed following kit instructions (In-gel tryptic digestion kit, Pierce
Biotechnology, Rockford, IL) prior to submission to The Proteomics and Mass
Spectrometry Core Facility at Penn State University (University Park, PA) for mass spec
analysis. Briefly, 200 µL of destaining solution (57.14% (w/v) ammonium bicarbonate,
14.29% (v/v) acetonitrile) was added to the excised gel slice and incubated at 37 °C for
30 min. This solution was then removed and this step repeated once. The sample was
then reduced by addition of 30 µL reducing buffer (25 mM ammonium bicarbonate, 50
mM Tris[2-carboxyethyl]phosphine (TCEP)) and incubation at 60 °C for 10 min.
Samples were then cooled to 23 oC and the reducing buffer was removed from the gel
slice. Alkylation of the sample was performed by incubating the gel slice in 30 µL

220
alkylation buffer (25 mM ammonium bicarbonate, 100 mM iodoacetamide) in the dark
for 1 h at 23 oC. Following removal of the alkylation buffer, the sample was washed
twice in 200 µL of 25 mM ammonium bicarbonate at 37 °C for 15 min each with
shaking. Following final wash the gel slice was shrunk by adding 50 µL acetonitrile for
15 min at room temperature. Following removal of acetonitrile, the samples were air
dried for 5-10 min. Next samples were digested in 10 µL activated trypsin solution (10
ng/µL trypsin, 25 mM ammonium bicarbonate) for 15 min at room temperature, followed
by addition of 25 µL of 25 mM ammonium bicarbonate and further incubation at 37 °C
for 4 h. The digestion mix was then collected in a clean tube. A second extraction was
then performed on the gel slice by addition of 10 µL trifluoroacetic acid for 5 min. This
solution was then added to the digestion mixture. This sample was then submitted to the
Penn State Mass Spectrometry facility for LC-ESI-MS peptide identification.
Alternatively, excised bands were sent to W.M. Keck Foundation Biotechnology
Resource Laboratory at Yale University (New Haven, CT) for in-gel digestion and mass
spec analysis (MALDI-MS). Peptide masses were used to search either the ProFound
(http://prowl.rockefeller.edu/profound_bin/WebProFound.exe) or Mascot (Matrix
Science, Boston, MA, http://www.matrixscience.com) databases for matching proteins.
6.11 References
1. Brivanlou, A. H.; Darnell, J. E., Jr., Signal transduction and the control of
gene expression. Science. 2002, 295, (5556), 813-818.

221
2. Rao, A., NF-ATp: a transcription factor required for the co-ordinate
induction of several cytokine genes. Immunol. Today. 1994, 15, (6), 274-281.
3. Rao, A.; Luo, C.; Hogan, P. G., Transcription factors of the NFAT family:
regulation and function. Annu. Rev. Immunol. 1997, 15, 707-747.
4. Morris, R. E., Transplantation of the Liver; New Immunosuppresive
Drugs. In Busuttil, R. W.; Klintmalm, G. B., Eds. Saunder Co.: Philadelphia, 1995; pp
760-786.
5. Ferraccioli, G. F.; Bambara, L. M.; Ferraris, M.; Perpignano, G.; Cattaneo,
R.; Porzio, F.; Accardo, S.; Mattara, L.; Zoppini, A.; Benucci, M.; Ostuni, P. A.; Pasero,
G., Effects of cyclosporin on joint damage in rheumatoid arthritis. The Italian
Rheumatologists Study Group on Rheumatoid Arthritis. Clin. Exp. Rheumatol. 1997, 15
Suppl 17, S83-S89.
6. Thomson, A. W.; Carroll, P. B.; McCauley, J.; Woo, J.; Abu-Elmagd, K.;
Starzl, T. E.; Van Thiel, D. H., FK 506: a novel immunosuppressant for treatment of
autoimmune disease. Rationale and preliminary clinical experience at the University of
Pittsburgh. Springer Semin. Immunopathol. 1993, 14, (4), 323-344.

222
7. Fung, J. J.; Alessiani, M.; Abu-Elmagd, K.; Todo, S.; Shapiro, R.; Tzakis,
A.; Van Thiel, D.; Armitage, J.; Jain, A.; McCauley, J.; et al., Adverse effects associated
with the use of FK 506. Transplant. Proc. 1991, 23, (6), 3105-3108.
8. Djuric, S. W.; BaMaung, N. Y.; Basha, A.; Liu, H.; Luly, J. R.; Madar, D.
J.; Sciotti, R. J.; Tu, N. P.; Wagenaar, F. L.; Wiedeman, P. E.; Zhou, X.; Ballaron, S.;
Bauch, J.; Chen, Y. W.; Chiou, X. G.; Fey, T.; Gauvin, D.; Gubbins, E.; Hsieh, G. C.;
Marsh, K. C.; Mollison, K. W.; Pong, M.; Shaughnessy, T. K.; Sheets, M. P.; Smith, M.;
Trevillyan, J. M.; Warrior, U.; Wegner, C. D.; Carter, G. W., 3,5-
Bis(trifluoromethyl)pyrazoles: a novel class of NFAT transcription factor regulator. J.
Med. Chem. 2000, 43, (16), 2975-2981.
9. Trevillyan, J. M.; Chiou, X. G.; Chen, Y. W.; Ballaron, S. J.; Sheets, M.
P.; Smith, M. L.; Wiedeman, P. E.; Warrior, U.; Wilkins, J.; Gubbins, E. J.; Gagne, G.
D.; Fagerland, J.; Carter, G. W.; Luly, J. R.; Mollison, K. W.; Djuric, S. W., Potent
inhibition of NFAT activation and T cell cytokine production by novel low molecular
weight pyrazole compounds. J. Biol. Chem. 2001, 276, (51), 48118-48126.
10. Sonogashira, K.; Tohda, Y.; Hagihar, N., A convenient synthesis of
acetylenes: catalytic substitutions of acetylenic hydrogen with bromoalkenes, iodoarenes
and bromopyridines. Tetrahedron Lett. 1975, 16, (50), 4467-4470.

223
11. Shirao, T.; Hayashi, K.; Ishikawa, R.; Isa, K.; Asada, H.; Ikeda, K.;
Uyemura, K., Formation of thick, curving bundles of actin by drebrin A expressed in
fibroblasts. Exp. Cell. Res. 1994, 215, (1), 145-153.
Appendix A
List of cell lines and bacterial strains used in the research.
Name Media Growth Organism Tissue
Type
Source
E. coli DH5α
LB
37 oC
Bacteria
Novagen
FY250
YPD
30 oC
yeast
M. Ptashne
CHO-K1
F12K + 10 %
FBS +
Pen/Strep
37 oC
Adherent
Chinese
Hamster
Ovary
Cells
ATCC
#CCL-61
HEK293
DMEM + 10
% FBS +
37 oC
Adherent
Human
embryonic
kidney
ATCC
#CRL-

224
Pen/Strep
1573
SKN-BE(2)-C
1:1 Ham’s F-
12: MEM + 15
% FBS +
Pen/Strep
37 oC
Adherent
Human
Neuro-
blastoma
N.
Vasudevan
Jurkat
RPMI + 10%
FBS + Penn/
Strep
37 oC
Suspension
Human
T-Cell
Lympho-
cytes
ATCC
TIB-152

225
Appendix B
Protein and Nucleic Acid Sequences

226

227

228

229
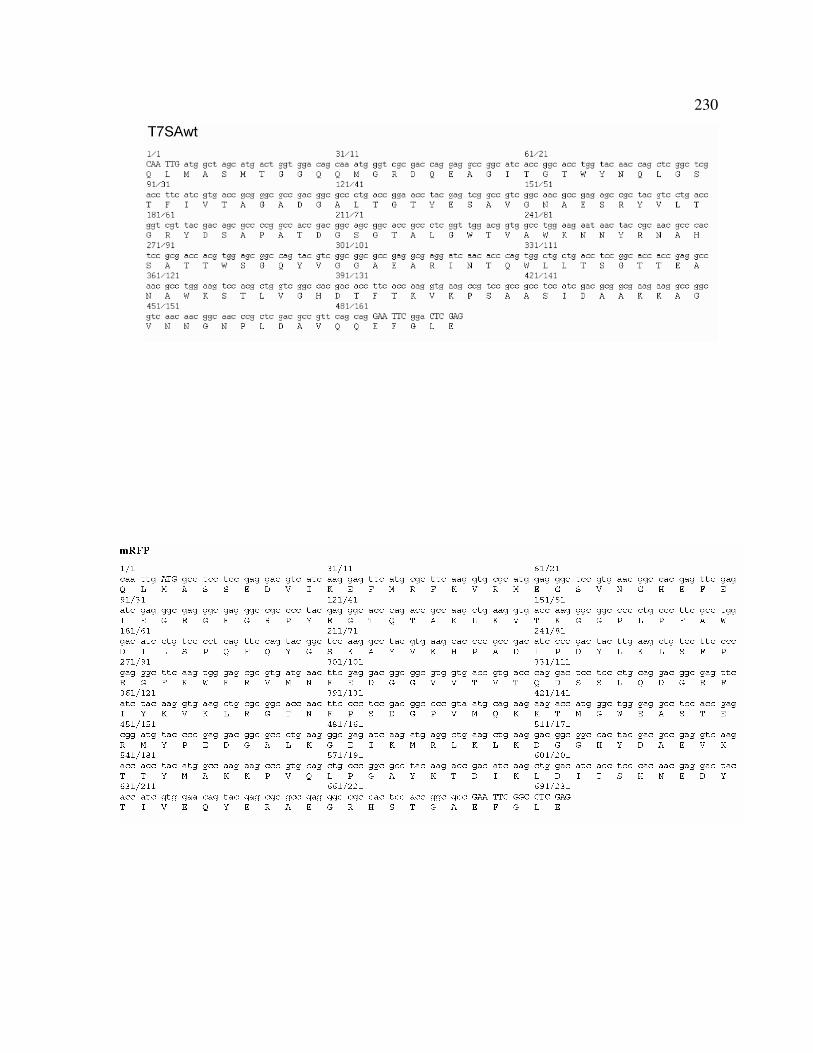
230

229
Appendix C
Plasmids
Name Source Gene
Classification
Plasmid
Type Restriction Sites
Notebook
Reference Parent Vector
Bacteria
Resistance
Yeast
Marker Seq. Primers
AHLuc G. Perdew Luciferase
Mammalian
Expression
Vector
SV40-SmeI-
XbaI-Luc-XbaI-
BamHI
SSM-4-
238 p232AL-A5' Amp
hERbeta N.
Vasudevan/E. Enmark
full length
ERbeta (1450 bp
insert)
Mammalian
Expression Plasmid
EcoRI-hERbeta-
PstI-KpnI-HindI-PstI-SalI-XbaI-
BamHI-SmaI
MMM-1-
142 pCMV5 Amp
3x-ere-luc N.
Vasudevan/D.
McDonnell
luciferase
reporter
under control
of 3 tandem
ERE sites
Mammalian
Expression
Vector
cut BglII/HindIII
to get 100 bp
insert
MMM-1-
142 pGL2 Amp
pAcGFP1 Clontech Momomeric
AcGFP
Bacterial Expression
Vector
SA 4-146
Amp
pAM423 Brent Lab
N-terminal
HA Tag-SV40
NLS fusion
vector
Yeast
Expression
Vector
KpnI-Gal1
Promoter- HA
Tag- SV40 NLS-
EcoRI-Stuffer-XhoI-ADH1
Terminator-
BamHI-XbaI-
NotI-SphI-PstI (No SalI site)
Sikorski/Heiter
2 uM vector Amp His3
5' Gal1, 3'
ADH1
pAM423-LexA G. Verdine
N-terminal
LexA-HA
Tag- SV40 NLS Fusion
Vector
Yeast
Expression
Vector
KpnI-Gal1
Promoter- HA
Tag- SV40 NLS- LexA-EcoRI-
Stuffer-XhoI-
ADH1
Terminator-BamHI-XbaI-
NotI-SphI-PstI
(No SalI site)
pAM423 Amp His3 5' Gal1, 3'
ADH1
pAM423LexA
hERalpha(305-
595)
S. Hussey
Yeast
Expression
Vector
EcoRI-
hERalpha(305-
595)-XhoI
AMP-1-
48 Amp His 3' ADHI
pAP1(PMA)-TA-Luc
Clontech Luciferase reporter
Mammalian Reporter
Plasmid
MMM-1-244
Amp
pCMV-AcGFP M. MacBride
N-terminal
Flag fusion
vector with
monomeric GFP
Mammalian
Expression
Vector
Flag-SrfI-
BamHI-PstI-
EcoRI-XhoI-
AcGFP-Stop-ApaI
MMM-5-
74 pCMVTag2B Kan
5' pCMV 3'
pCMV
pCMV-Gal4-
hERalpha(305-595)
M. MacBride
N-terminal
Flag fusion with Gal4
DBD and ER
alpha LBD
Mammalian
Expression Vector
Flag-SrfI-
BamHI-PstI-Gal4-EcoRI-
hERalpha(305-
595)
MMM-1-
266 pCMVTag2B Kan
5' pCMV 3'
pCMV
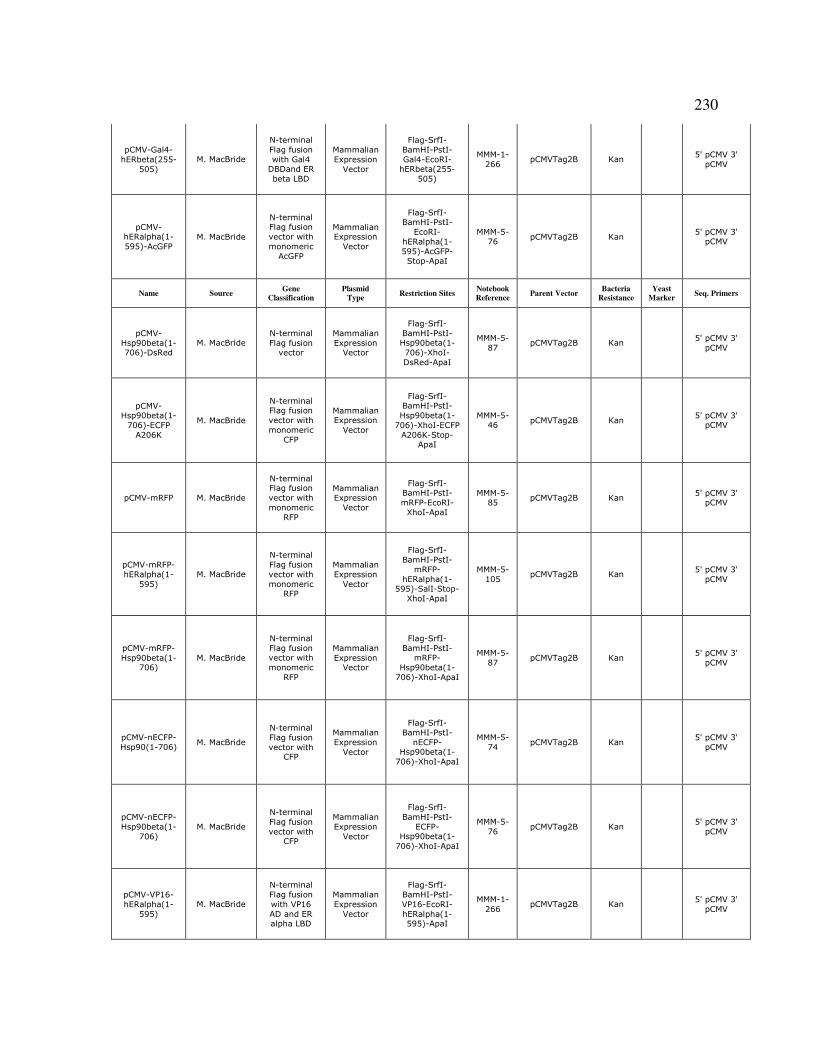
230
pCMV-Gal4-
hERbeta(255-
505)
M. MacBride
N-terminal
Flag fusion
with Gal4 DBDand ER
beta LBD
Mammalian
Expression
Vector
Flag-SrfI-
BamHI-PstI-
Gal4-EcoRI-hERbeta(255-
505)
MMM-1-
266 pCMVTag2B Kan
5' pCMV 3'
pCMV
pCMV-hERalpha(1-
595)-AcGFP M. MacBride
N-terminal Flag fusion
vector with
monomeric
AcGFP
Mammalian Expression
Vector
Flag-SrfI-BamHI-PstI-
EcoRI-
hERalpha(1-
595)-AcGFP-Stop-ApaI
MMM-5-76
pCMVTag2B Kan 5' pCMV 3'
pCMV
Name Source Gene
Classification
Plasmid
Type Restriction Sites
Notebook
Reference Parent Vector
Bacteria
Resistance
Yeast
Marker Seq. Primers
pCMV-
Hsp90beta(1-706)-DsRed
M. MacBride N-terminal
Flag fusion vector
Mammalian
Expression Vector
Flag-SrfI-
BamHI-PstI-Hsp90beta(1-
706)-XhoI-
DsRed-ApaI
MMM-5-
87 pCMVTag2B Kan
5' pCMV 3'
pCMV
pCMV-Hsp90beta(1-
706)-ECFP
A206K
M. MacBride
N-terminal Flag fusion
vector with
monomeric
CFP
Mammalian Expression
Vector
Flag-SrfI-BamHI-PstI-
Hsp90beta(1-
706)-XhoI-ECFP
A206K-Stop-ApaI
MMM-5-46
pCMVTag2B Kan 5' pCMV 3'
pCMV
pCMV-mRFP M. MacBride
N-terminal Flag fusion
vector with
monomeric
RFP
Mammalian Expression
Vector
Flag-SrfI-BamHI-PstI-
mRFP-EcoRI-
XhoI-ApaI
MMM-5-85
pCMVTag2B Kan 5' pCMV 3'
pCMV
pCMV-mRFP-
hERalpha(1-
595)
M. MacBride
N-terminal
Flag fusion
vector with
monomeric RFP
Mammalian
Expression
Vector
Flag-SrfI-
BamHI-PstI-
mRFP-
hERalpha(1-595)-SalI-Stop-
XhoI-ApaI
MMM-5-
105 pCMVTag2B Kan
5' pCMV 3'
pCMV
pCMV-mRFP-
Hsp90beta(1-706)
M. MacBride
N-terminal
Flag fusion vector with
monomeric
RFP
Mammalian
Expression Vector
Flag-SrfI-
BamHI-PstI-mRFP-
Hsp90beta(1-
706)-XhoI-ApaI
MMM-5-
87 pCMVTag2B Kan
5' pCMV 3'
pCMV
pCMV-nECFP-
Hsp90(1-706) M. MacBride
N-terminal
Flag fusion
vector with CFP
Mammalian
Expression
Vector
Flag-SrfI-
BamHI-PstI-
nECFP-Hsp90beta(1-
706)-XhoI-ApaI
MMM-5-
74 pCMVTag2B Kan
5' pCMV 3'
pCMV
pCMV-nECFP-
Hsp90beta(1-
706)
M. MacBride
N-terminal
Flag fusion
vector with CFP
Mammalian
Expression
Vector
Flag-SrfI-
BamHI-PstI-
ECFP-Hsp90beta(1-
706)-XhoI-ApaI
MMM-5-
76 pCMVTag2B Kan
5' pCMV 3'
pCMV
pCMV-VP16-
hERalpha(1-
595)
M. MacBride
N-terminal
Flag fusion
with VP16
AD and ER alpha LBD
Mammalian
Expression
Vector
Flag-SrfI-
BamHI-PstI-
VP16-EcoRI-
hERalpha(1-595)-ApaI
MMM-1-
266 pCMVTag2B Kan
5' pCMV 3'
pCMV

231
pCMV-VP16-
hERalpha(305-
595)
M. MacBride
N-terminal
Flag fusion
with VP16 AD and ER
alpha LBD
Mammalian
Expression
Vector
Flag-SrfI-
BamHI-PstI-
VP16-EcoRI-hERalpha(305-
595)-ApaI
MMM-1-
266 pCMVTag2B Kan
5' pCMV 3'
pCMV
pCMV-VP16-hERbeta(255-
505)
M. MacBride
N-terminal Flag fusion
with VP16
AD and ER
beta LBD
Mammalian Expression
Vector
Flag-SrfI-BamHI-PstI-
VP16-EcoRI-
hERbeta(255-
505)
MMM-1-266
pCMVTag2B Kan 5' pCMV 3'
pCMV
Name Source Gene
Classification
Plasmid
Type Restriction Sites
Notebook
Reference Parent Vector
Bacteria
Resistance
Yeast
Marker Seq. Primers
pCMVbeta-Gal Stratagene
constitutive
expressing
beta-gal for
normalization of
transfection
Mammalian
expression
vector
linearize with
HindIII, 7 kb in
length
Amp
pCMVTag2B Stratagene
N-terminal
Flag fusion
vector
Mammalian
Expression
Vector
Flag-SrfI-
BamHI-PstI-
EcoRI-EcoRV-HindIII-AccI-
SalI-XhoI-ApaI
Kan 5' pCMV 3'
pCMV
pCMVTag2B-
Gal4 S. Hussey
N-terminal
Flag fusion
vector with Gal4 DBD
Mammalian
Expression
Vector
Flag-SrfI-
BamHI-PstI-
Gal4-EcoRI-XhoI-ApaI
SLH-3-
31 pCMVTag2B Kan
5' pCMV 3'
pCMV
pCMVTag2B-
Gal4-
Hsp90beta(1-
214)
L. Mottram
N-terminal
Flag fusion
vector with
Gal4 DBD
Mammalian
Expression
Vector
Flag-SrfI-
BamHI-PstI-
Gal4-
Hsp90beta(1-214)-ApaI
pCMVTag2B Kan 5' pCMV 3'
pCMV
pCMVTag2B-
Gal4-
Hsp90beta(1-706)
L. Mottram
N-terminal
Flag fusion
vector with Gal4 DBD
Mammalian
Expression
Vector
Flag-SrfI-
BamHI-PstI-
Gal4-Hsp90beta(1-
706)-ApaI
pCMVTag2B Kan 5' pCMV 3'
pCMV
pCMVTag2B-VP16
M. MacBride VP16 viral activation
domain
Mammalian Expression
Vector
Flag-SrfI-BamHI-PstI-
EcoRI-VP16-
EcoRI-XhoI
pCMVTag2B Kan 5' pCMV 3'
pCMV
pCMVTag2B-
VP16-Fos(118-203)
M. MacBride
N-terminal
Flag fusion with VP16
viral AD
Mammalian
Expression Vector
Flag-SrfI-
BamHI-PstI-VP16-EcoRI-Fos-
XhoI-ApaI
MMM-1-
265 pCMVTag2B Kan
5' pCMV 3'
pCMV
pDC1 D. Clark
N-terminal
6His Fusion
vector with XhoI-Stop-
SalI
Bacterial
Expression
Plasmid
Xba1-MRGS-
6HisP-BamHI-
NcoI-KpnI-MfeI-EcoRI-Stop-
XhoI-Stop-SalI-
Stop-HindIII
DDC-1-
235 pBP7-7 Amp
5' pLM 3'
pLM
pDC1 mRFP stop
S Athavankar 6x His-
mRFP1- stop
Bacterial Expression
Plasmid
XbaI-MRGSHHHHHHP-
BamHI-NcoI-
KpnI-MfeI-
EcoRI(KO) mRFP1-EcoRI-
XhoI-Stop-SalI
Amp
5'/3' pLM

232
pJG4-5 B. Peterson
N-terminal
SV40 NLS-
B42 AD- HA Tag Fusion
Vector
Yeast
Expression
Vector with 2µm origin
Gal1 Promoter -
HindIII-
MGAPKKKRKV-B42 Activation
Domain-HA Tag-
EcoRI-Stuffer-
XhoI-HindIII-ADH1
Terminator
Amp Trp1 5' pJG4-5, 3'
ADHI
pPA2 P. Andrade
Mammalian
Expression Plasmid
SacI-EcoRI-SalI-
XhoI pCMV Tag2B Kan
5'CMV/3'MV
pPA2 T7SAwt G(TP)x4-TG
mRFP1stop
S Athavankar T7-SAwt-
G(TP)x4TG-
mRFP1 stop
Mammalian Expression
Plasmid
MfeI(ko)-T7-SAwt-G(TP)x4-
TG-mRFP1-
EcoRI- XhoI-
Stop-SalI(ko)
SA 4-204
CMV Kan
5'CMV/3'CMV
pPA2 T7SAwt
G(TP)x4-TG
AcGFP
L. Mottram T7-SAwt-
G(TP)x4TG-
AcGFP
Mammalian
Expression
Plasmid
T7-SA(wt)-
mfe(ko)-
G(TP)x4-TG-AcGFP-xho1(ko)
LM 5-
146 CMV Kan
5'CMV/3'CMV
pRF4-6 B. Peterson N-terminal
HA-Tag Fusion Vector
Yeast
Expression Vector with
2µm origin
Amp Trp1 5' Gal1, 3'
ADH1
pRSETbmRFP1 R. Tsien monomeric
RFP
pSA1 S.
Athavankar
Based on pRF4-6, no
HA tag or
NLS
Yeast Expression
Vector
KpnI-GalI pro-EcoRI-XhoI-
ADHI terminator
pRF4-6 Amp TRP1 5' GalI, 3'
ADHI
pSH18-34 Brent Lab
Yeast
Reporter Gene for
LexA/LacZ
Assays
Yeast
Reporter Gene
(LacZ),
with 2µm
origin
No MCS Amp Ura3
pSLH4-T7-SA S. Hussey
No His tag, no flag tag,
fuses MRGS
to
streptavidin
Bacterial Expression
Vector
Xba1-MRGS-Kpn1-Mfe1-T7-
SA-EcoR1-Xho1-
Stop-Sal1-
HindIII
SLH-4-207
pSLH4 Amp 5' pLM, 3'
pLM
pSM1 GTP
linker-AcGFP
no stop
S.
Athavankar
MRGSTLE-
G(TP)x4-TG-
AcGFP-noStop-
Bacterial
Expression
Plasmid
MRGSTLE-Mfe1-
-G(TP)x4-TG-
EcoRI-XhoI-AcGFP-no Stop-
SalI
SA 4-
201 T7 Amp
5'/3' pLM
pSVbeta-Gal N.
Vasudevan/
Promega
constitutively
expressing
beta-gal for
transfection normalization
Mammalian
Expression
Vector
EcoRI (not
unique)-SV40-
HindIII-lacZ-
BamHI-SalI-PstI
MMM-1-
142 Amp

VITA
Laurie Frances Mottram
Education
2002-present Ph.D. candidate, Chemistry. The Pennsylvania State University
1998-2002 B.S., Chemistry, The College of New Jersey (Cum Laude)
Research and Scientific Experience
2002-present Research Assistant, The Pennsylvania State University
� Research Advisor: Prof. Blake R. Peterson
2002-2003 Teaching Assistant, The Pennsylvania State University
2001-2002 Quality Control Analyst, United Chemical Technologies, Bristol PA
2001-2002 Undergraduate Researcher
� Research Advisor: Prof. Jan Fleischer
� Senior thesis title: "Electronic and Steric Effects of dichloro-N',N''-
dimethylbenzamides and their reactions with Li metal"
Publications 1. Mottram, L. F., Maddox, E., Schwab, M., Beaufils, F., Peterson, B. R. “A Concise
Synthesis of the Pennsylvania Green Fluorophore and Labeling of Intracellular Targets
with O6-Benzylguanine Derivatives” Org. Lett. 2007, submitted
2. Mercer, J., Mottram, L. F., Hiroyuki, Y., Tomoaki, S., Peterson, B. R., August, A.,
"The actin binding protein Drebrin regulates calcium activated store-operated channels”
2007, submitted
3. Mottram L. F., Boonyarattanakalin, S. Kovel, R. E. and Peterson, B. R. “The
Pennsylvania Green Fluorophore: A Hybrid of Oregon Green and Tokyo Green for the
Construction of Hydrophobic and pH-Insensitive Molecular Probes” Org. Lett. 2006, 8,
581-584.
Highlights of manuscript #3:
"New Fluorescein adds to cellular probe arsenal" Chem. Eng. News, 2006, 84, p.
33.
"PSU Student Refines Method" Penn State Daily Collegian, 2006, April 25th.