Design Project Report - CSPI · Design Project Report Creek Crossing, ... design does not provide...
111
Design Project Report Creek Crossing, 11 April 2016 NCdt Aithal, NS 26859 OCdt Conrad, SM 26734 OCdt Savage, ST 26323 Prepared for: Dr. Lamarche, P Date: 11 April 2016
Transcript of Design Project Report - CSPI · Design Project Report Creek Crossing, ... design does not provide...

Design Project Report
Creek Crossing,
11 April 2016
NCdt Aithal, NS 26859
OCdt Conrad, SM 26734
OCdt Savage, ST 26323
Prepared for: Dr. Lamarche, P
Date: 11 April 2016

CEE 493 – Creek Crossing Design Project, Final Report
11 April 2016
1/111
DISCLAIMER
This document was prepared by fourth year students enrolled in the Royal Military College of
Canada’s Civil Engineering program. The design specifications described herein reflect the best
judgement of the design team, in light of the information available, at the time of preparation.
Any third party making use of this document, or any design decisions made based on its
recommendations, are the responsibility of such third parties. The design project team accepts no
responsibility for damages, if any, suffered by any third party as a result of decisions made, or
actions taken, based on this document.
Note: All electronic files including, HEC-RAS numerical modelling and spreadsheet
calculations, are available upon request.
ACKNOWLEDGMENTS
We would like to thank the staff of the Civil Engineering department for their contributions to this
capstone design project. Specifically, we would like to thank the following individuals for their
time and assistance throughout the project:
Subject Matter Experts Mr. Sean Watt
Dr. Mike Hulley
Capt. Cameron Whitehead
Dr. Gordon Wight
Mr. Ray Wilcock
Project Supervisor Dr. Philippe Lamarche
CEE 493 Course Coordinators Dr. Nicholas Vlachopoulos
Capt. Omar Hadad
CEE 493 – Creek Crossing Design Project, Final Report
11 April 2016
2/111
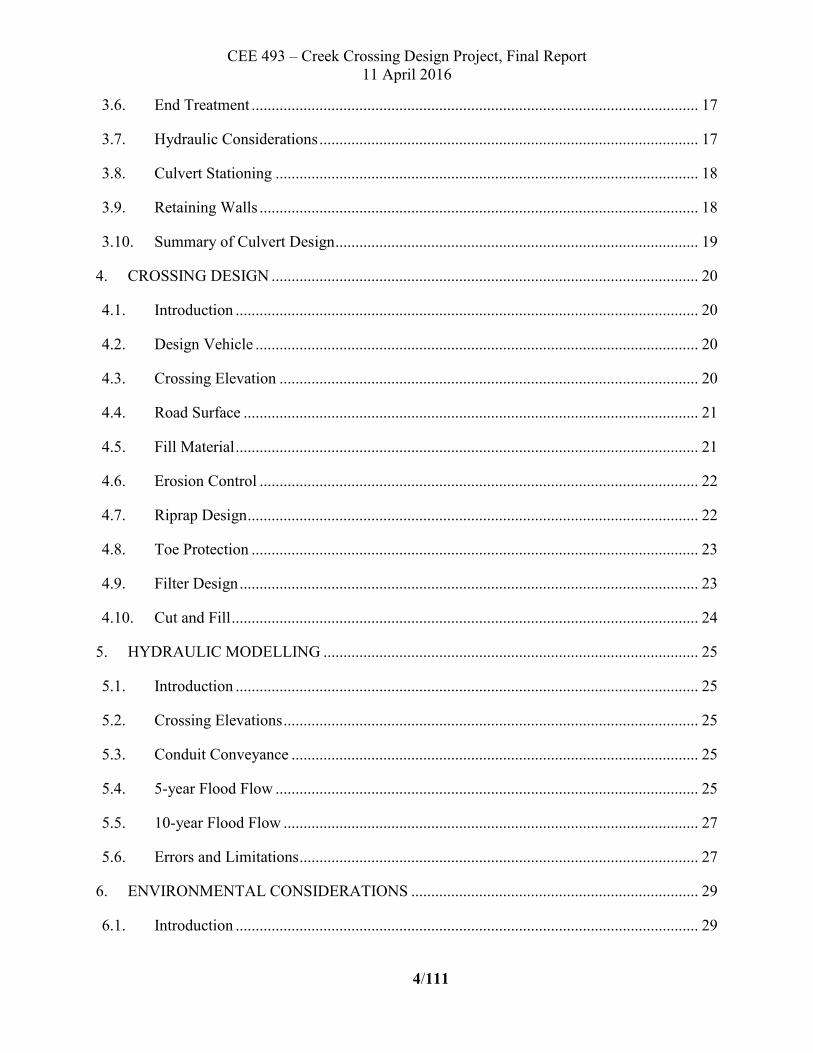
ABSTRACT
An existing crossing is located on a creek which is a tributary to a larger regional river. This
crossing serves as a secondary access point to several important pieces of infrastructure and is
used in emergencies.
The current infrastructure consists of an unpaved road over circular culverts made of corrugated
steel pipe. Every year during the spring months the creek basin tends to flood, damaging the
crossing and road, which subsequently require significant maintenance. The current crossing
design does not provide sufficient conveyance during these floods, resulting in significant on-
going costs to the client organization. It has been determined that the current crossing needs to be
repaired or re-designed.
In order to provide a design which will resist damage due to flooding, meet provincial codes and
enable continued operational access to the area, a numerical model of the creek system was built.
The critical flood states which incur most of the damage to the crossing may be caused by
backwater from the larger river rather than runoff events from the creek’s watershed. Through
modelling, the high water level and critical state for this design were determined.
This design was provided to the client in order to enable remediation or replacement of the
infrastructure at the crossing site and ensure continued operations in the areas accessed via this
crossing.

CEE 493 – Creek Crossing Design Project, Final Report
11 April 2016
3/111
TABLE OF CONTENTS
DISCLAIMER ................................................................................................................................ 1
ACKNOWLEDGMENTS .............................................................................................................. 1
ABSTRACT .................................................................................................................................... 2
TABLE OF CONTENTS ................................................................................................................ 3
LIST OF TABLES .......................................................................................................................... 7
LIST OF FIGURES ........................................................................................................................ 8
1. PROJECT OVERVIEW ......................................................................................................... 9
1.1. Introduction ...................................................................................................................... 9
1.2. Project Background .......................................................................................................... 9
1.3. Revised Client’s Problem Statement .............................................................................. 12
1.4. Environmental Assessment Screening ........................................................................... 12
2. WATERSHED CONDITIONS ............................................................................................ 13
2.1. Introduction .................................................................................................................... 13
2.2. Creek Watershed ............................................................................................................ 13
2.3. Flow Conditions ............................................................................................................. 14
2.4. Backwater Conditions .................................................................................................... 14
2.5. Independent Flow Modelling ......................................................................................... 14
3. CULVERT DESIGN ............................................................................................................ 15
3.1. Introduction .................................................................................................................... 15
3.2. Culvert Requirements ..................................................................................................... 15
3.3. Estimate Mean Service Life ........................................................................................... 15
3.4. Hydraulic Evaluation...................................................................................................... 16
3.5. Structural Evaluation ...................................................................................................... 16
CEE 493 – Creek Crossing Design Project, Final Report
11 April 2016
4/111
3.6. End Treatment ................................................................................................................ 17
3.7. Hydraulic Considerations ............................................................................................... 17
3.8. Culvert Stationing .......................................................................................................... 18
3.9. Retaining Walls .............................................................................................................. 18
3.10. Summary of Culvert Design ........................................................................................... 19
4. CROSSING DESIGN ........................................................................................................... 20
4.1. Introduction .................................................................................................................... 20
4.2. Design Vehicle ............................................................................................................... 20
4.3. Crossing Elevation ......................................................................................................... 20
4.4. Road Surface .................................................................................................................. 21
4.5. Fill Material .................................................................................................................... 21
4.6. Erosion Control .............................................................................................................. 22
4.7. Riprap Design ................................................................................................................. 22
4.8. Toe Protection ................................................................................................................ 23
4.9. Filter Design ................................................................................................................... 23
4.10. Cut and Fill ..................................................................................................................... 24
5. HYDRAULIC MODELLING .............................................................................................. 25
5.1. Introduction .................................................................................................................... 25
5.2. Crossing Elevations ........................................................................................................ 25
5.3. Conduit Conveyance ...................................................................................................... 25
5.4. 5-year Flood Flow .......................................................................................................... 25
5.5. 10-year Flood Flow ........................................................................................................ 27
5.6. Errors and Limitations .................................................................................................... 27
6. ENVIRONMENTAL CONSIDERATIONS ........................................................................ 29
6.1. Introduction .................................................................................................................... 29

CEE 493 – Creek Crossing Design Project, Final Report
11 April 2016
5/111
6.2. Species Present ............................................................................................................... 29
6.3. Swimming Velocity for Sensitive Aquatic Species ....................................................... 29
6.4. Spawning Seasons .......................................................................................................... 30
6.5. Fish Wait Time ............................................................................................................... 30
6.6. Department of Fisheries and Oceans Development Proposal Review ........................... 30
6.7. Channel Alteration ......................................................................................................... 31
6.8. Standing Pools and Blockages ....................................................................................... 31
7. GEOTECHNICAL CONSIDERATIONS ............................................................................ 33
7.1. Introduction .................................................................................................................... 33
7.2. Estimation of In-Situ Soil Strata .................................................................................... 33
7.3. Retaining Wall Design ................................................................................................... 33
7.4. Modes of Failure Considered ......................................................................................... 35
7.5. Geotechnical Data Used ................................................................................................. 35
7.6. Factors of Safety for Crossing ........................................................................................ 35
7.7. Factors of Safety for Retaining Walls ............................................................................ 36
7.8. Summary of Evaluated Factors of Safety ....................................................................... 37
8. COST ESTIMATE................................................................................................................ 38
8.1. Introduction .................................................................................................................... 38
8.2. Existing Crossing ........................................................................................................... 38
8.3. New Crossing Design ..................................................................................................... 38
8.4. Cost Savings ................................................................................................................... 39
8.5. Recommendations .......................................................................................................... 39
9. CONSTRUCTION PROCESS ............................................................................................. 40
9.1. Introduction .................................................................................................................... 40
9.2. Coffer Dams ................................................................................................................... 40

CEE 493 – Creek Crossing Design Project, Final Report
11 April 2016
6/111
9.3. Fill Lifts & Compaction ................................................................................................. 40
9.4. Placement of Conduits ................................................................................................... 41
REFERENCES ............................................................................................................................. 42
APPENDIX No. 1: Statement of Requirements ........................................................................... 46
Client 47
Introduction ................................................................................................................................. 47
Project Background ..................................................................................................................... 47
Objectives & Constraints ............................................................................................................. 48
Objectives ............................................................................................................................. 48
Constraints ............................................................................................................................ 48
Design Criteria ............................................................................................................................ 48
Constraints ................................................................................................................................... 49
Deliverables ................................................................................................................................. 49
APPENDIX No. 2: Environmental Assessment Screening ............................................................ 3
APPENDIX No. 3: Watershed Details ......................................................................................... 15
APPENDIX No. 4: Flood Flow Assessments ............................................................................... 17
APPENDIX No. 5: Culvert Design .............................................................................................. 20
APPENDIX No. 6: Crossing & Culvert Group Drawings ............................................................ 36
APPENDIX No. 7: Filter Design .................................................................................................. 40
APPENDIX No. 8: Hydraulic Modelling Results ........................................................................ 48
APPENDIX No. 9: Cost Estimates ............................................................................................... 57
CEE 493 – Creek Crossing Design Project, Final Report
11 April 2016
7/111
LIST OF TABLES
Table 1. Crossing Options Analysis………………………………………………………………10
Table 2. Crossing Options Analysis Descriptions………………………………………………...11
Table 3. Watershed Land Cover………………………………………………………………….12
Table 4. Summary of Culvert Group Design……………………………………………………..20
Table 5. Estimated Soil Strata at Project Site……………………………………………………..31
Table 6. Dimensions of retaining wall design…………………………………………………….35
Table 7. Summary of factors of safety for crossing design………………………………………..38
Table 8. Summary of factors of safety for retaining wall design………………………………….38

CEE 493 – Creek Crossing Design Project, Final Report
11 April 2016
8/111
LIST OF FIGURES
Figure 1. MLC 30W Design Vehicle……………………………………………………………..21
Figure 2. Nominal Stone Size for Low Volume Roads……………….…………………………..24
Figure 3. 5-year flood modelling results………………………………………………………….27
Figure 4. 10-year flood modelling results………………………………………………………...28
Figure 5. Burst velocities of the Northern Pike…………………………………………………...31
Figure 6. Retaining wall design…………………………………………………………………..35
Figure 7. Diagram of hydrostatic uplift forces……………………………………………………37

CEE 493 – Creek Crossing Design Project, Final Report
11 April 2016
9/111
1. PROJECT OVERVIEW
1.1. Introduction
The purpose of this document is to provide a detailed design report of the requirements as
requested by the client. This report includes design considerations and criteria used for the
selection and detailing of design components. Additional environmental assessments would be
required by the client organization in order to move forward with construction.
1.2. Project Background
This project proposes a design to replace the existing crossing at the design site specified by
the client to accommodate frequent flooding in the area. The crossing is considered critical for
operations within the area.
The creek drains into the main regional river system. Due to the proximity of the crossing to
this junction the river may pose further flood risks due to backwater conditions. Furthermore,
the design considers sensitive aquatic species in the area.
Four options were considered for the replacement design:
Option 1: Construct a new causeway crossing, incorporating culverts;
Option 2: Construct a new crossing using concrete box-culverts;
Option 3: Construct a bridge at the crossing site; and,
Option 4: Maintain the status quo.

CEE 493 – Creek Crossing Design Project, Final Report
11 April 2016
10/111
After a review of these options, option 1 was selected due to:
1. Flow capacity
2. Ease of installation
3. Longevity
Tables 1 and 2 describe the criterion used for project selection.
Table 1: Creek Crossing Options Analysis.
Causeway & Culvert
Box Culvert w/ RC Abutments
Bridge Remediate
existing crossing
Materials 2 1 2 3
Cost 3 2 1 2
Environmental Impact
2 2 2 1
Complexity 2 1 1 2
Construction Time 2 1 1 3
Flood Protection 2 2 2 1
TOTAL SCORE: 13 9 9 12
RANK: 1 3 3 2

CEE 493 – Creek Crossing Design Project, Final Report
11 April 2016
11/111
Table 2: Creek Crossing Options Analysis Descriptions.
Proposed Metrics: 0 1 2 3 Comments
Materials 100% externally
sourced
70% or more externally sourced
40 - 70% externally sourced
Only unavailable materials externally sourced
Estimated % of total project not readily available on site or which
cannot be fabricated using on site materials
Cost
Cost exceeds on-going
maintenance costs in current
state
Cost is approximately
equal to on-going maintenance in
current state
Cost reduced 20-49% less than on-
going maintenance in
current state
Cost reduced by 50% or more
compared to on-going
maintenance
Cost of construction and
maintenance over the design period
Environmental Impact
Creates flooding of local basin,
redirects river or prevents wildlife
passage
Challenging conditions to some species,
prolongs flooding or other
significant changes
Allows passage of fish and wildlife, minimal changes
in local environment
No predicted significant effects
on local environment
Complexity
Highly complex, most components
require precise fabrication
Many components require high
precision design and external fabrication
Some components
require precision design,
Engineering supervision may
be required during installation
Can be fabricated and installed by
existing personnel
Construction Time
30 or more days 21 - 30 Days 14 - 21 days Less than 14 days
During low water conditions,
weather permitting
Flood protection
Erosion & flood induced failure
likely during significant runoff
events
Remains usable following a flood
event but requires
significant maintenance.
Minimal erosion, minor reparations may be required following a flood
Resist erosion & flood induced
failures, can be built higher than
HWL

CEE 493 – Creek Crossing Design Project, Final Report
11 April 2016
12/111
The 4th year class of RMCC Civil Engineering proposes a design for a new crossing for this
creek. This project, as stipulated by the client, will allow MLC 30 vehicles to cross the creek’s
flood plain and will resist damage due to hydraulic activity in the area.
1.3. Revised Client’s Problem Statement
A design project to support operations in the operating area was given to the RMCC civil
engineering department. A supervisor was designated as the representative for the client. The
current crossing is incapable of allowing the passage of sufficient flood flow, consequently it
becomes unserviceable too frequently. The installation of a new crossing design has been
selected as the most viable solution. The new design must:
Accommodate an MLC 30 vehicle;
Allow conveyance of a 5-year flood stage; and,
Minimize damage from a 10-year flood stage.
A complete statement of requirements is included in Appendix 1.
1.4. Environmental Assessment Screening
As part of any Department of National Defence (DND) project, and environmental assessment
(EA) is required; as the design team is comprised of DND students, this was considered a
requirement. The environmental assessment screening form, provided to the project team, was
completed with the information available. The results of the EA screening form were that the
project may be able to be constructed, however information available is insufficient to draw
any conclusions. It is strongly recommended that a complete EA be conducted by the local
personnel. The EA screening form is included in Appendix 2.

CEE 493 – Creek Crossing Design Project, Final Report
11 April 2016
13/111
2. WATERSHED CONDITIONS
2.1. Introduction
This section describes the creek watershed and flow conditions occurring within the flood
plain. Using information from the Ontario provincial government a description of the
watershed and estimation of flow conditions were established. The conditions of the watershed
and its flood stages are considered critical design factors for this project. The characteristics
used to describe the watershed were obtained from OFAT III.
2.2. Creek Watershed
The creek watershed is a forested area of land in south eastern Ontario. The watershed consists
of a drainage area of 124.62 km2, or 12462 hectares. The main channel of the creek is 62.7km
long with a mean slope of 0.32% and experiences an annual precipitation of 888mm. Land
cover in the area is overwhelmingly undeveloped forest, described by Table 3.
Table 3. Watershed Land Cover (OFAT III, 2016.)
Area (km2) Percentage Cover Type
45.52 36.5 Coniferous treed land
36.01 28.9 Mixed treed land
21.11 16.9 Sparse treed land
1.81 1.4 Deciduous treed land
0.42 0.3 Community & infrastructure
The slope of the floodplain was also calculated using survey point data provided by the client
organization. The floodplain in which the crossing will be constructed has a local mean slope
of 0.1% and is approximately 250 meters across at the location of the crossing. A watershed
map, land cover map and elevation model showing surveyed cross sections are included in
Appendix 3.
CEE 493 – Creek Crossing Design Project, Final Report
11 April 2016
14/111
2.3. Flow Conditions
Flood stage flows were determined for the 5 and 10-year stages in order to determine design
requirements for the crossing. A rational method was used to estimate flows using an IDF
curve from Environment Canada and a runoff coefficient was estimated using United States
Geological Survey (USGS) guidelines. These flow estimates were then compared to results
from OFAT III to support the accuracy of the flow values obtained. OFAT III provides flow
estimates using several models; the Moin Shaw Multiple Regression and Moin Shaw 85 Index
Flood with Expected Probability Adjustment were used for this comparison.
The most conservative (largest) flood flows were selected for use as design parameters. From
the Moin Shaw Multiple Regression, a 5-year flood flow of 30.7 m3/s and 10-year flood flow
of 38.2 m3/s were used for selection of design parameters. Appendix 4 details flood flow
analysis.
2.4. Backwater Conditions
The crossing to be designed is in close proximity to the creek’s junction with the main river.
Spaced approximately 200 m away, the flood conditions at the crossing may be significantly
impacted by backwater conditions from the River. The backwater conditions for the river were
estimated using geomorphological information from the Rosgen Stream Classification
Technique. The bankfull discharge of a river typically represents a 1.5-2 year return period,
with little difference between a 2 and 5-year flood level. A flood stage water surface was used
to represent the backwater conditions, with a surface elevation of 156.2 m.
2.5. Independent Flow Modelling
Independent flow modelling, using HEC-HMS, was attempted for this design project. Snow
melt is believed to be responsible for the largest flows in the watershed and would therefore
govern design estimates. Due to a lack of data from the nearest weather reporting stations,
modelling of this type was not possible. In order to support and confirm these design
considerations, it is recommended that in-situ measurements are made during high flows and
that improvement of the reporting of snow pack conditions be examined.

CEE 493 – Creek Crossing Design Project, Final Report
11 April 2016
15/111
3. CULVERT DESIGN
3.1. Introduction
Section 3 of this report outlines the culvert design process used for the proposed design. The
Ministry of Transportation of Ontario (MTO) Gravity Pipe Design Guidelines were followed
for the complete design process of the culverts selected. These were supplemented by the use
of Ontario Provincial Standard Drawings (OPSDs), design guides from the Corrugate Steel
Pipe Institute (CSPI) and Province of Québec design guides. Table 4, at the end of this section,
summarizes characteristics of selected CSP culverts.
3.2. Culvert Requirements
The culverts to be used for this project were selected to meet the client’s design requirements.
Culverts used must provide a total flow capacity of 30.71 m3/s or greater flow, match the
natural slope of the waterway and exceed both the cross design service life (DSL) of 10 years
and MTO requirement for estimate mean service life (EMSL) of 25 years. The MTO EMSL
requirement will govern selection of a culvert. The required flow capacity and pipe diameters
(to avoid debris blockage) restrict the design to the use of corrugate steel pipe (CSP) or
structural plate corrugated steel pipe (SPCSP). Polymer laminated pipes were not considered
for this project due to cost. Appendix 5 details the complete design process, including formulae
and calculations, for the culvert design.
3.3. Estimate Mean Service Life
The EMSL of the normally galvanized CSP was determined using the California Method.
Chart B5 in the MTO Gravity Pipe Design Guidelines provides the most conservative estimate
of service life using the California Method. The selected CSP arch-pipe has an EMSL of 89
years. As the EMSL significantly exceeds the DSL requirements, no life cycle cost analysis
for the restoration or replacement of the culvert is required.
MTO guidelines provide resistivity ranges for surface water and soil for design purposes. PH
ranges for EMSL calculations were determined using Environment Canada charts. Resistivity
was calculated using the extremes of the soil ranges (30,000 – 50,000 ohm-cm) and the surface

CEE 493 – Creek Crossing Design Project, Final Report
11 April 2016
16/111
water (5000 ohm-cm), as well as PH intervals of 0.1 for the range of 4.4-7. It has been shown
PH as high as 9.5 has minimal effect on the service life of galvanized CSP, however ranges
above 7 were not included as they are believed to be unlikely.
Abrasion concerns are not significant, as culvert flows do not approach or exceed 5 m/s.
Additionally, the modest slope of the culvert should serve to minimize abrasion. The primary
source of abrasion will be debris in the main channel, however the embedment of the culvert
base will improve abrasion protection for the base of the culvert.
3.4. Hydraulic Evaluation
MTO specifies the estimation of pipe flow capacity using Manning’s equation. Manning’s
number is provided by the MTO design guidelines and other parameters are obtained from
standard design tables. As arch-pipes are formed by bending an equivalent diameter circular
pipe to the appropriate shape, the hydraulic radius was determined using the perimeter of the
equivalent diameter pipe. To meet the required flow capacity for a 5-year storm, 2 3890 mm
(span) by 2690 mm (rise) arch pipes were selected, providing an estimated flow capacity of
32.3 m3/s. In order to remain in normal CSP ranges, this section requires a thickness of 4.2mm
and 125 x 25 mm corrugation profile. Structural plate CSP is undesirable due to significant
cost increases associated with a change to this type of component.
Advantages contributing to the selection of the arch-pipe are:
Greater flow capacity at the full-flow state compared to circular pipes;
Better debris passage; and,
Smaller surface exposed to corrosive and abrasive forces during normal or low flows.
3.5. Structural Evaluation
The structural evaluation of the culvert was conducted with several methods. MTO requires
simply that a depth of cover, required to provide the structural strength of the CSP conduit, be
selected from OPSD 805.020. Additionally, the design team conducted the CSPI structural
calculations and it was determined that the conduits have sufficient strength to support the load

CEE 493 – Creek Crossing Design Project, Final Report
11 April 2016
17/111
from the MLC design vehicle considered for this project. The minimum height of fill was
determined to be 679mm of granular A compacted to 95% standard proctor density. The
crossing design provides 730mm of cover. Structural requirements also specify the edge-to-
edge spacing of the conduits, which was determined to be 1.4m. The stress from factored thrust
loading on the conduits was determined to be 48.27. The conduits were determined to have an
ultimate strength of 176.27 MPa.
Longitudinal seam strength was also considered in the structural evaluation. The total factored
thrust load was determined to be 218.23 kN/m. Using a seam joint consistent of 10 mm rivets
with a single row, 68 x 13 mm layout, seam strength was determined to be 260.4 kN/m. A
double riveted seam would significantly increase the strength of the seam but would be cost
ineffective.
3.6. End Treatment
End treatments usually improve hydraulic performance of CSP conduits. CSPI recommends
step bevels for all sizes of pipe sections. To provide resistance to hydraulic forces, particularly
during periods of rapid change in hydraulic activity within the conduit, a concrete collar is
recommended. The collar provides resistance to hydraulic uplift forces, horizontal movement,
piping and buckling at the end of the conduit section. For the arch pipe selected, a 0.4 m x 0.6
m concrete collar is recommended with a stepped bevel cut. The cost of cutting the sections,
form work and pouring concrete for the collar has been estimated at approximately $1000 per
m3. The end treatment should be anchored to the fill material using anchor hooks.
Due to time constraints, the project design team was unable to fully design this feature.
3.7. Hydraulic Considerations
Hydraulic forces can cause considerable damage to the culvert group structure, leading to
failure. Uplifting forces at the inlet of the culvert, during high flows, result from a variety of
hydraulic factors and may be counteracted with structural anchorage at the end of the conduit.

CEE 493 – Creek Crossing Design Project, Final Report
11 April 2016
18/111
For the collared bevel recommended for this design, hook anchors should be embedded in the
slope protection to provide this anchorage and protect against bending.
Hydraulic piping is the other major hydraulic concern for this design. Piping describes the
erosion of fill, typically fine material, from the fill along the conduit and typically may occur
during high flows, where the conduit group is submerged and hydrostatic pressure is increased.
The concrete collar previously mentioned will help resist this effect. Additionally, a 300 mm
clay cap will be placed along the fill slope at the ends of the culvert group to prevent water
from infiltrating and eroding backfill.
A 2.0 mm thick HDPE geomembrane is recommended to prevent vertical infiltration, from
rainfall and seepage, in order to avoid piping and the development of voids along the conduits.
These membranes will be anchored to the retaining walls (discussed later in this report) on
either side of the conduit group. The lower membrane will have a total area of 431.2 m2 (15.4
x 28 m). The lower membrane will be 183.4 m2 (15.4 x 11.9 m). These membranes are expected
to cost $10/m2. Due to time constraints in the design of this project, price estimates were not
obtained and detailed design of the anchoring of the membranes was not possible.
3.8. Culvert Stationing
The culvert group will be stationed on the natural channel’s path in order to minimize impact
on the area and help prevent changes to the channels path. Note that the stations described
herein are based upon the survey data provided by the client, which has been modeled so that
the zero point along each survey cross section is located on the north bank. As the channel
stations were estimated within the numerical model, they should be confirmed on site before
construction begins. The centerline of the conduits will be located at 183.9 m and 189.2 m
respectively.
3.9. Retaining Walls
As part of the design, the culvert group is confined by two retaining walls running
longitudinally parallel to the conduits. Military vehicles typically impose much higher dynamic
CEE 493 – Creek Crossing Design Project, Final Report
11 April 2016
19/111
loads than those from more common civilian vehicles. As a result, this dynamic loading may
displace fill around the culverts, eventually leading to a structural failure within the culvert
group as a result of voids developed by this loading. As no design standard was found for the
spacing between the culvert edge and the retaining wall, it was assumed that the structural
requirements for fill around the culvert should be the same as those applied to groups of
multiple culverts. The retaining walls will therefore be placed at a 1.4m edge to edge spacing
from the culverts. Note that the retaining wall design is described in section 7.
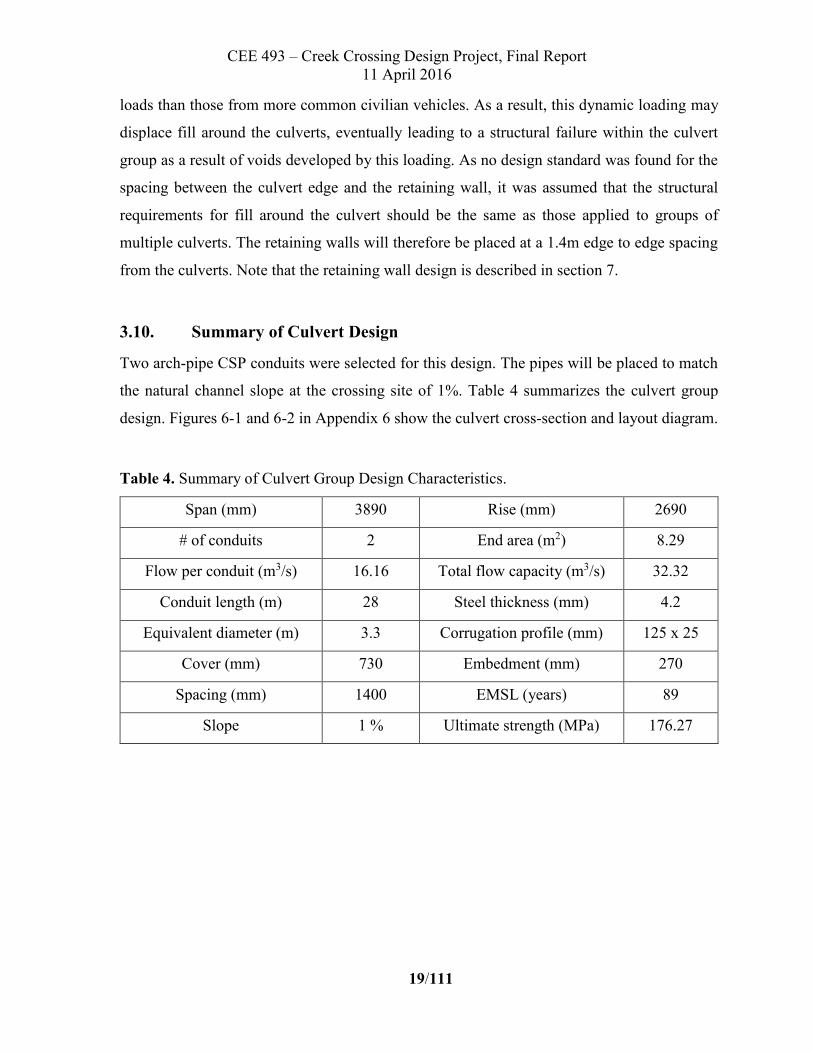
3.10. Summary of Culvert Design
Two arch-pipe CSP conduits were selected for this design. The pipes will be placed to match
the natural channel slope at the crossing site of 1%. Table 4 summarizes the culvert group
design. Figures 6-1 and 6-2 in Appendix 6 show the culvert cross-section and layout diagram.
Table 4. Summary of Culvert Group Design Characteristics.
Span (mm) 3890 Rise (mm) 2690
# of conduits 2 End area (m2) 8.29
Flow per conduit (m3/s) 16.16 Total flow capacity (m3/s) 32.32
Conduit length (m) 28 Steel thickness (mm) 4.2
Equivalent diameter (m) 3.3 Corrugation profile (mm) 125 x 25
Cover (mm) 730 Embedment (mm) 270
Spacing (mm) 1400 EMSL (years) 89
Slope 1 % Ultimate strength (MPa) 176.27
CEE 493 – Creek Crossing Design Project, Final Report
11 April 2016
20/111
4. CROSSING DESIGN
4.1. Introduction
The design of the floodplain crossing is described in this section. The crossing was designed
to provide the minimum structural requirements of the conduit group, meet MTO guidelines
and ensure when design flows are exceeded that damage to the conduit group is minimized.
The crossing will act as a causeway in most cases, and allow weir flow to occur on the north
side when design flows for the conduit group are exceeded. Details of the crossing design and
conduit group are shown in Appendix 6.
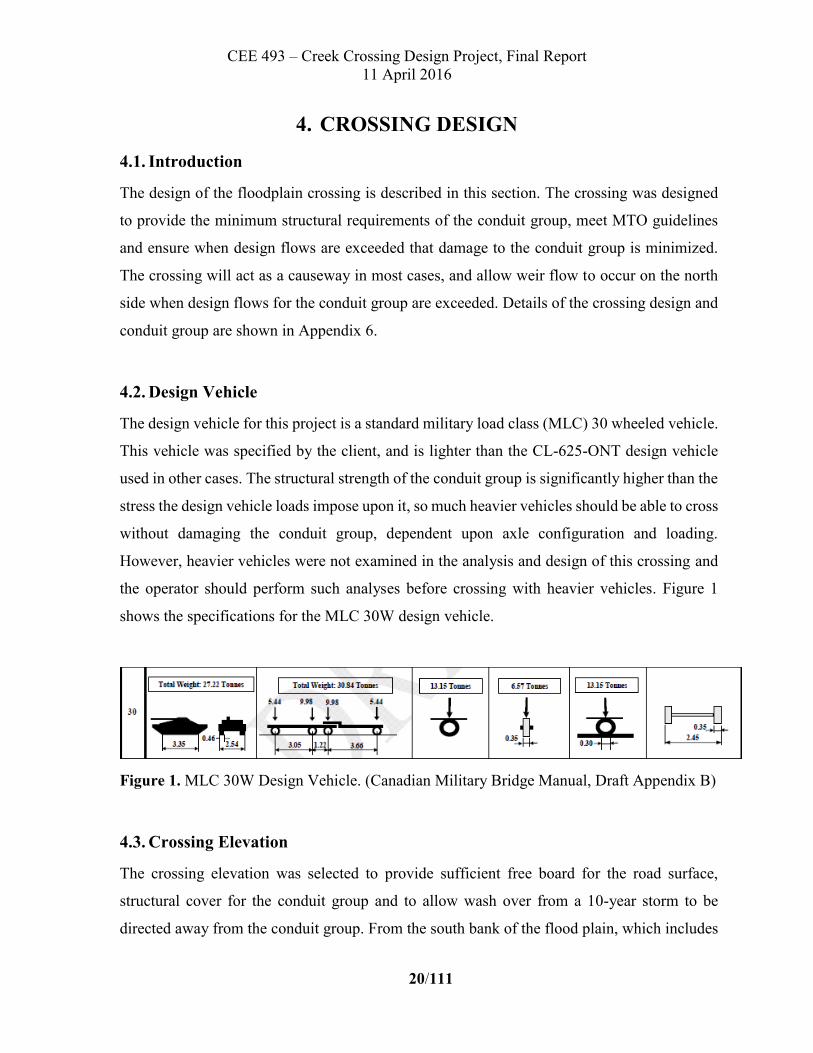
4.2. Design Vehicle
The design vehicle for this project is a standard military load class (MLC) 30 wheeled vehicle.
This vehicle was specified by the client, and is lighter than the CL-625-ONT design vehicle
used in other cases. The structural strength of the conduit group is significantly higher than the
stress the design vehicle loads impose upon it, so much heavier vehicles should be able to cross
without damaging the conduit group, dependent upon axle configuration and loading.
However, heavier vehicles were not examined in the analysis and design of this crossing and
the operator should perform such analyses before crossing with heavier vehicles. Figure 1
shows the specifications for the MLC 30W design vehicle.
Figure 1. MLC 30W Design Vehicle. (Canadian Military Bridge Manual, Draft Appendix B)
4.3. Crossing Elevation
The crossing elevation was selected to provide sufficient free board for the road surface,
structural cover for the conduit group and to allow wash over from a 10-year storm to be
directed away from the conduit group. From the south bank of the flood plain, which includes

CEE 493 – Creek Crossing Design Project, Final Report
11 April 2016
21/111
the culvert group, the crossing elevation is 158.3 m for a distance of 81 m. A 3% slope over
67 meters transitions the crossing to an elevation of 156.75 m. This section continues for 114
m where it meets the north bank. The crossing will intersect the in-situ road at both banks.
Refer to Appendix 6 for crossing and culvert group drawings, and Appendix 8 for hydraulic
modelling of the crossing.
4.4. Road Surface
Vehicles will travel on a road surface running the 250 m length of the crossing. The road
surface will be a granular course, composed of granular A material compacted to 95% standard
proctor density and adhering to Ontario Provincial Standard Specification, Material
Specification For Aggregates – Base, Subbase, Select Subgrade, and Backfill Material
(OPSS.MUNI 1010).
The road will be 4 m wide in order to safely accommodate the design vehicle and provide
clearance in the event of wider loads. Additionally, this road width will permit troops to walk
alongside vehicles for inspection, maintenance and training purposes. The road will not have
shoulders. Road geometry is based on OPSD 206.010. A crown at the center of the roadway
will provide a 2% slope to the edges of the road. The sides of the road and crossing will have
a slope of 3H:1V. This slope results in a base width of 26.8 m at the south bank and conduit
group and a width of 14.8m at the north bank. Figure 6-3 in Appendix 6 shows the cross-
section of the crossing.
4.5. Fill Material
This design assumes granular A material, compacted to 95% standard proctor density and
adhering to OPSS.MUNI 1010 will be used for the entire fill of the crossing. As a cost saving
measure, the existing crossing and fill have been assumed as granular B, based on the available
information at the time of design, and have been included in the design parameters. The
granular A specification is mandatory for the conduit group fill. The 730 mm cover in the
conduit section will continue the length of the full crossing as the road structure and will be

CEE 493 – Creek Crossing Design Project, Final Report
11 April 2016
22/111
granular A. Quality assurance specifications for the fill material require sampling every 5000
tonnes to ensure material quality and consistency.
4.6. Erosion Control
Erosion control measures are an important safeguard to ensure the stability and effectiveness
of the crossing. Rip-rap and reinforced concrete abutments were considered for this
application. As a result of the length of the span, the abutment option was less economical.
Additionally, the complexity of installing form work, arranging reinforcing bars and pouring
the concrete would not only increase the construction time, but require labour not readily
available from local personnel. Consequently, rip-rap was chosen as the desired erosion control
method.
4.7. Riprap Design
Riprap is used on the sides of embankments in order to minimize the amount of erosion done
to the embankment surface. The riprap layer was designed in accordance with the Riprap
Design and Construction Guide from the Public Safety Section of the Water Management
Branch. The selected design standard also meets the requirements of OPSD 801.010. In
addition to the considerations for the rip-rap layer, toe protection and the design of a filter layer
were required. (These are described later in this section.)
Riprap normally has a density between 2400kg/m3 and 2800kg/m3. Many factors play a role in
the thickness and slope required for the riprap. A slope of two horizontals to one vertical is the
steepest a riprap cover should be. The steepness of the slope is reduced further if there is ice
or debris that is typically present. A slope of three horizontals to one vertical was selected due
to the frequent presence of debris in the creek flow.
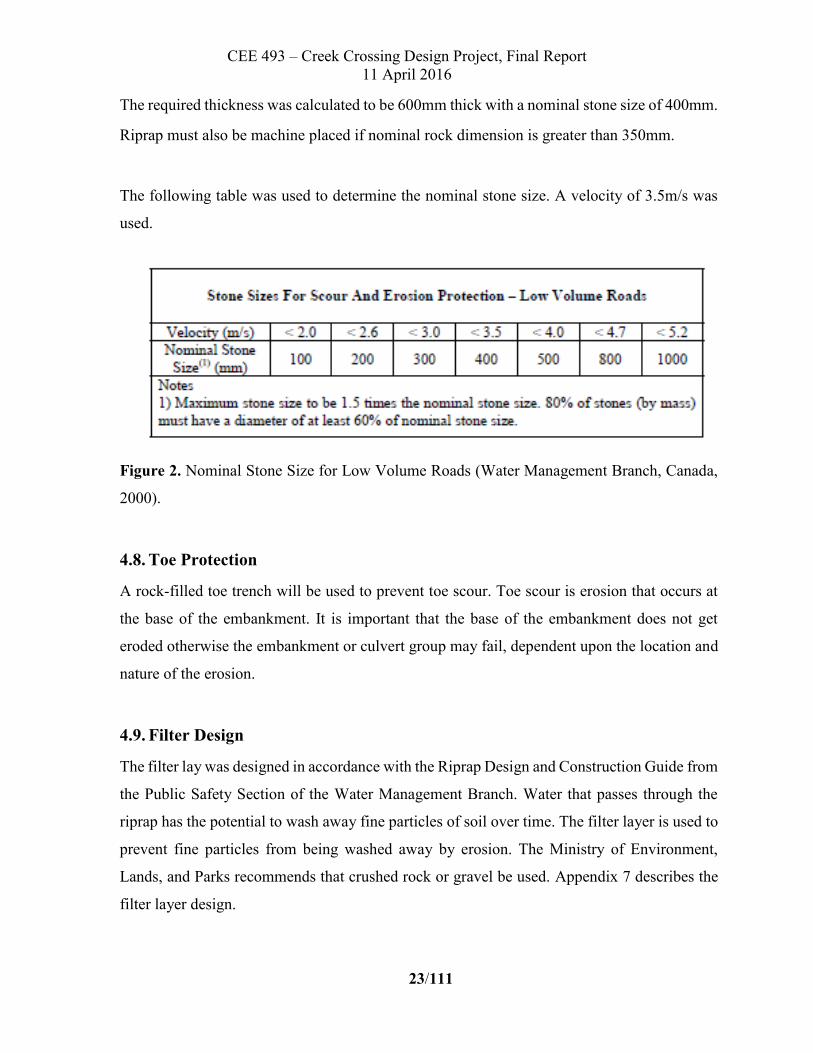
The required thickness and nominal stone size was determined using a table from the Riprap
Design and Construction Guide and some other considerations:
The thickness cannot be less than 350mm or more than 1.5 times the nominal stone size.
CEE 493 – Creek Crossing Design Project, Final Report
11 April 2016
23/111
The required thickness was calculated to be 600mm thick with a nominal stone size of 400mm.
Riprap must also be machine placed if nominal rock dimension is greater than 350mm.
The following table was used to determine the nominal stone size. A velocity of 3.5m/s was
used.
Figure 2. Nominal Stone Size for Low Volume Roads (Water Management Branch, Canada,
2000).
4.8. Toe Protection
A rock-filled toe trench will be used to prevent toe scour. Toe scour is erosion that occurs at
the base of the embankment. It is important that the base of the embankment does not get
eroded otherwise the embankment or culvert group may fail, dependent upon the location and
nature of the erosion.
4.9. Filter Design
The filter lay was designed in accordance with the Riprap Design and Construction Guide from
the Public Safety Section of the Water Management Branch. Water that passes through the
riprap has the potential to wash away fine particles of soil over time. The filter layer is used to
prevent fine particles from being washed away by erosion. The Ministry of Environment,
Lands, and Parks recommends that crushed rock or gravel be used. Appendix 7 describes the
filter layer design.
CEE 493 – Creek Crossing Design Project, Final Report
11 April 2016
24/111
4.10. Cut and Fill
Cut and fill for this design was determined to be 5600 m3 of granular A material. This assumes
the existing crossing and fill material will be used wherever possible to reduce cost materials.
Rip rap material requires a fill volume of approximately 1300 m3 and he filter material requires
a fill volume of 430 m3. Additionally, the clap cap layer, which is restricted only to the culvert
group, requires a fill volume of 40m3.

CEE 493 – Creek Crossing Design Project, Final Report
11 April 2016
25/111
5. HYDRAULIC MODELLING
5.1. Introduction
The crossing was modelled using the United States Army Corps of Engineers Hydrologic
Engineering Center (HEC) River Analysis System (RAS). HEC-RAS models the floodplain
from surveyed cross sections (provided to the design team by MCE) and the crossing using
input design data. This software is routinely used throughout North America for this type of
application. For this project, modelling in HEC-RAS was used to help guide and confirm
design decisions. Appendix 7 summarizes the HEC-RAS results for this design and includes
visual representations of the crossing for the 5 and 10-year flood stages.
5.2. Crossing Elevations
The 5 and 10-year flood flows were modelled in HEC-RAS to determine initial estimates of
crossing height and ensure that when the flood stage becomes excessive weir action would
occur in the region of the crossing intentionally designed for this use. Iteration was then used
to refine the elevations.
5.3. Conduit Conveyance
Using HEC-RAS, the capacity of the conduit group when in full flow was also confirmed. The
model shows the conduit group having a capacity slightly higher than expected, with 32.6 m3/s
in full flow at the 10-year flood stage. The model also allowed determination of the controlling
flow state. In both cases (5 and 10-year floods) the conduit group is in a state of outlet control
when including the effects of backwater conditions.
5.4. 5-year Flood Flow
The 5-year flood flow for this watershed is 30.7 m3/s. During this flow, the crossing is subject
to minimal submersion and there is a change of 0.19 m in elevation of the water surface in the
culverts. The results for the modelling of the 5-year flood are show in figure 2. Further
information is shown in Appendix 8.

CEE 493 – Creek Crossing Design Project, Final Report
11 April 2016
26/111
Figure 3. 5-year flood modelling results.
CEE 493 – Creek Crossing Design Project, Final Report
11 April 2016
27/111
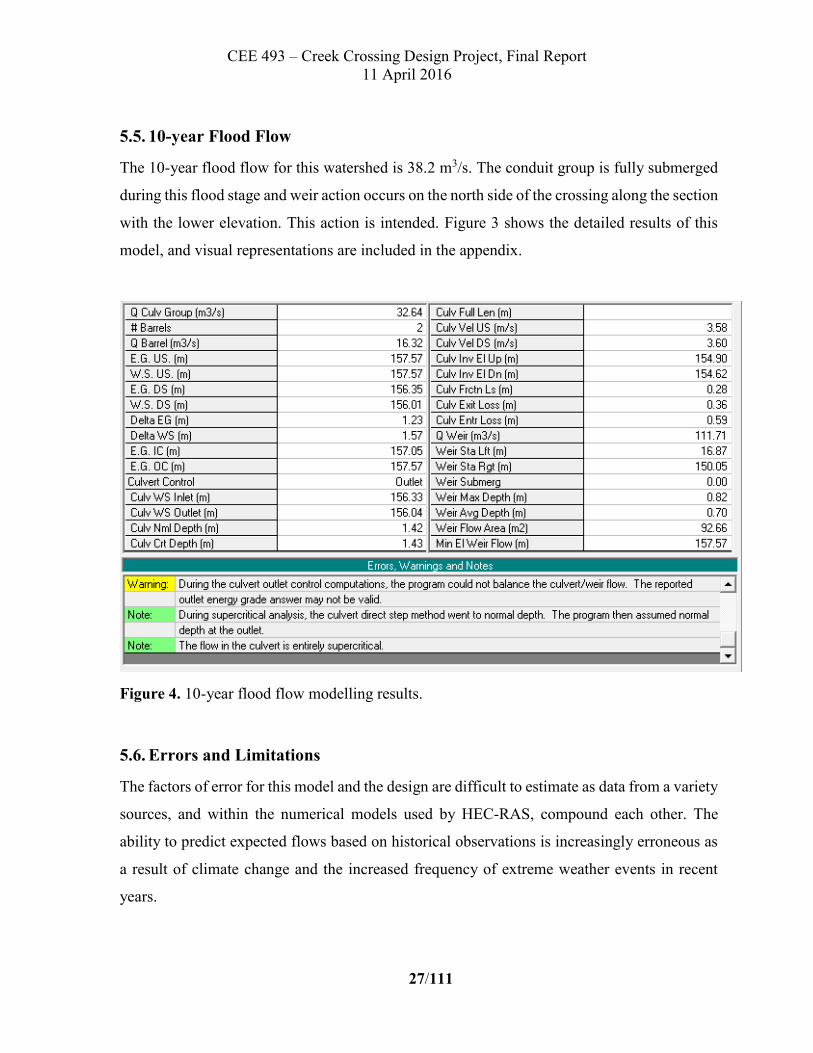
5.5. 10-year Flood Flow
The 10-year flood flow for this watershed is 38.2 m3/s. The conduit group is fully submerged
during this flood stage and weir action occurs on the north side of the crossing along the section
with the lower elevation. This action is intended. Figure 3 shows the detailed results of this
model, and visual representations are included in the appendix.
Figure 4. 10-year flood flow modelling results.
5.6. Errors and Limitations
The factors of error for this model and the design are difficult to estimate as data from a variety
sources, and within the numerical models used by HEC-RAS, compound each other. The
ability to predict expected flows based on historical observations is increasingly erroneous as
a result of climate change and the increased frequency of extreme weather events in recent
years.
CEE 493 – Creek Crossing Design Project, Final Report
11 April 2016
28/111
Additionally, HEC-RAS assumes linearized cross-sections for the modelled river systems and
calculates only 1-dimensional flow. The resolution level of survey data available to the design
team at the time of the project was limited, resulting in a probable increase in error in the
numerical modelling of the design. While 1-dimensional flow analysis can approximate the
system being modeled for practical purposes, this results in a limitation in the accuracy of the
model. As a result of the uncertainty of these errors and their compounding effects, the total
accuracy of the design and numerical model has not been determined.

CEE 493 – Creek Crossing Design Project, Final Report
11 April 2016
29/111
6. ENVIRONMENTAL CONSIDERATIONS
6.1. Introduction
Environmental considerations were required during the design of the creek crossing. As it is
located in a flood plain, there is potential for significant impacts on local fauna, the watercourse
and sensitive species in the area. This section details these considerations
6.2. Species Present
There are two species present in the main river which may use the creek as a spawning site.
Consequently, they are considered sensitive aquatic species for the potential impacts of this
project. The species of concern are the Brook Trout and Northern Pike.
It is important to note that a proper assessment is recommended to determine the presence (or
lack thereof) of these species. At the time of this design project, no confirmation of their
presence or use of the creek as a spawning bed was available.
6.3. Swimming Velocity for Sensitive Aquatic Species
The Brook Trout and Northern Pike both have different swimming velocities. The Brook Trout
is the weaker swimmer of the two species, since the Northern Pike is a predatory fish, it is able
to swim at higher velocities for limited periods of time. Belford and Gould (1989) reported that
brook trout could swim distance of 30 metres against bottom water velocities up to 80.0 cm/s.
No information of swimming endurance of northern pike could be located; however, maximum
swimming capacity appears to be at least 174 cm/s. Figure 5 shows the burst velocities of the
Northern Pike.

CEE 493 – Creek Crossing Design Project, Final Report
11 April 2016
30/111
Figure 5. Burst velocities of the Northern Pike (Oceans and Habitat Management Branch,
Canada, 2008).
6.4. Spawning Seasons
The spawning seasons of the two fish species vary region by region. For the Southern Region
of Ontario, the spawning seasons of the Brook Trout and Northern Pike are October 1st to May
31st, and March 15th to May 31st respectively. Construction time is limited to the period of time
between June 1st and September 30th, in order to avoid interference with these spawning
seasons.
6.5. Fish Wait Time
Fish will wait up to three days if conveyance is not possible. When flows at peak flood stages
are too high to allow for fish passage, fish will wait up to three days for the flow to slow to a
rate at which they can pass. Therefore, the flow should not be greater than the maximum
allowable flow rate for fish passage for a period of time exceeding three days.
6.6. Department of Fisheries and Oceans Development Proposal Review
The development proposal review and decision-making process is a process that is used to
decide if the project requires authorization. Below are the factors taken into consideration.
Are there potential impacts to fish or fish habitat that are part of or support a
commercial, recreational and Aboriginal fishery?
Will impacts be avoided or mitigated?
Will impacts result in serious harm to fish?
CEE 493 – Creek Crossing Design Project, Final Report
11 April 2016
31/111
The Department interprets serious harm to fish as:
the death of fish;
a permanent alteration to fish habitat of a spatial scale, duration or intensity that limits
or diminishes the ability of fish to use such habitats as spawning grounds, or as nursery,
rearing, or food supply areas, or as a migration corridor, or any other area in order to
carry out one or more of their life processes;
the destruction of fish habitat of a spatial scale, duration, or intensity that fish can no
longer rely upon such habitats for use as spawning grounds, or as nursery, rearing, or
food supply areas, or as a migration corridor, or any other area in order to carry out one
or more of their life processes.
The creek is not used by any fisheries, nor for recreational fishing. The impacts to the fish are
avoided by planning construction outside of their spawning season. No fish should be seriously
injured during the construction of the culvert or during its extended use.
6.7. Channel Alteration
The introduction of this crossing design has the potential to alter the natural course of the
stream. Alterations to the natural course of the stream may result in changes to its depth and
velocity and may subsequently impact the local ecosystem as a result. In order to minimize the
probability of altering the channel’s course, the conduits have been placed directly on the main
channel of the creek. On site confirmation at the time of construction is required.
6.8. Standing Pools and Blockages
As the crossing is located in the flood plain of the creek, standing pools are not uncommon as
water levels recede. During the flood stage, the presence of the crossing may result in the
development of standing pools on the upstream side; these pools already develop as a result of
the existing crossing. The new crossing should not significantly impact the presence of
standing pools.

CEE 493 – Creek Crossing Design Project, Final Report
11 April 2016
32/111
Blockages of the conduits may, however, cause problems. In addition to the creation, or
extension of the life of standing pools in the flood plain, they may result in damage to the
crossing. There are two primary sources of blockages the design team has considered:
Debris; and,
Beaver activity.
Debris build up was a problem with the previous crossing design. Due to the nature of the
floodplain and area where the crossing is located, using boulders or other physical blocking
mechanisms upstream of the inlet was considered impractical and uneconomical. The use of
the arch-pipe shape for the conduits should significantly reduce debris caught by the inlet and
minimize this concern, though the site should be inspected from time to time to ensure no
blockage issues arise.
Beaver activity is known to occur in the area. If a beaver dam is built at the inlet of the conduits,
water levels may rise sufficiently to cause the north portion of the crossing to experience wash
over during events much smaller than the 10-year design intention, resulting in damage and
increased maintenance. Beaver dams should be avoided by inspection of the site, and when
required, removal of any apparent damming.

CEE 493 – Creek Crossing Design Project, Final Report
11 April 2016
33/111
7. GEOTECHNICAL CONSIDERATIONS
7.1. Introduction
In order to ensure stability and safety of the crossing design, several geotechnical
considerations needed to be examined. Ensuring that the crossing, retaining walls and in-situ
soil will not experience any of several modes of failure was a significant factor in this design.
This section details those considerations and the determined factors of safety. Sample
calculations are shown in Appendix 8.
7.2. Estimation of In-Situ Soil Strata
Accurate information on the in-situ soil strata at the project site was not available to the design
team and procuring boreholes was not possible. Consequently, the team estimated the strata at
the site for design purposes. The strata were estimated using a project proposal for a temporary
modular bridge at a nearby site. Using the borehole logs from that report and the elevation at
the project site, as well as information provided by the client, the design strata shown in Table
5 was determined.
Table 5. Estimated soil strata at project site.
Sandy Silt 1 m
Sandy Gravel 3 m
Impermeable bedrock
7.3. Retaining Wall Design
The retaining walls confining the culvert group were designed to resist movement from forces
within the culvert group and from the crossing fill outside it. The dimensions of the retaining
wall are detailed in table 6 and the design is shown in figure 6.
CEE 493 – Creek Crossing Design Project, Final Report
11 April 2016
34/111
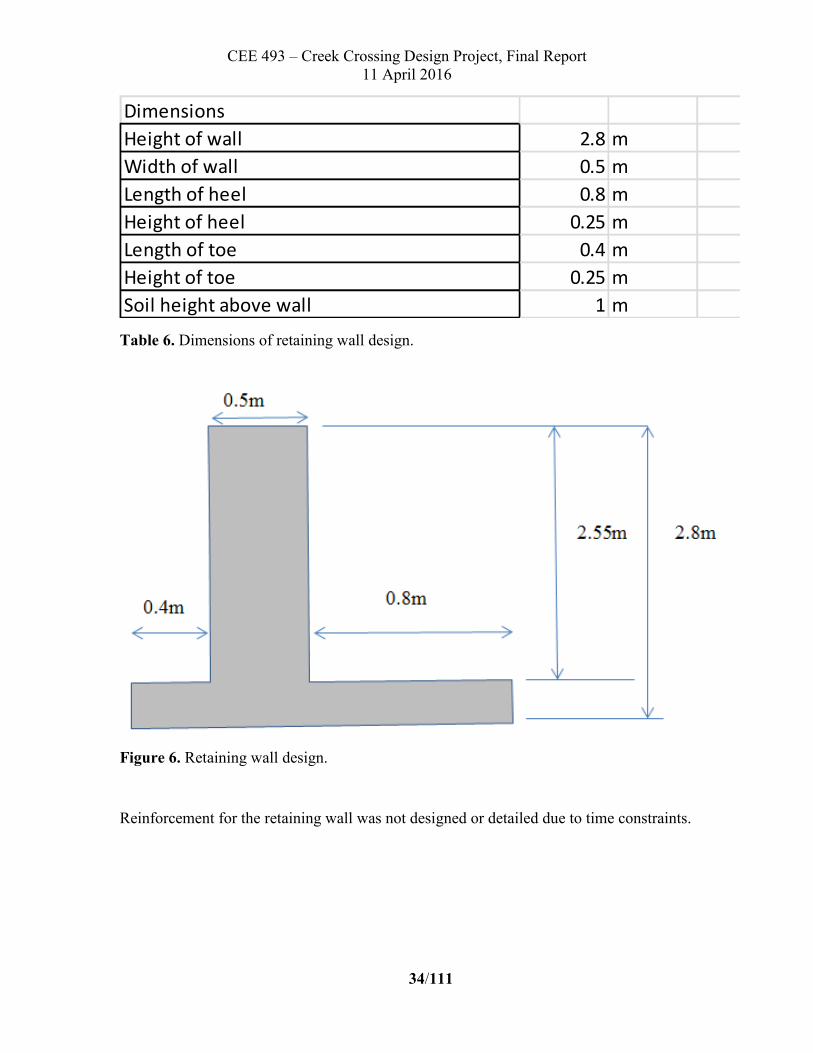
Table 6. Dimensions of retaining wall design.
Figure 6. Retaining wall design.
Reinforcement for the retaining wall was not designed or detailed due to time constraints.
Dimensions
Height of wall 2.8 m
Width of wall 0.5 m
Length of heel 0.8 m
Height of heel 0.25 m
Length of toe 0.4 m
Height of toe 0.25 m
Soil height above wall 1 m

CEE 493 – Creek Crossing Design Project, Final Report
11 April 2016
35/111
7.4. Modes of Failure Considered
Modes of failure for the project had to be considered for both the crossing itself and the
retaining walls within the conduit group. Bearing capacity, slope stability and hydrostatic uplift
were examined for the crossing. For the retaining walls, bearing capacity, sliding and
overturning were examined.
7.5. Geotechnical Data Used
Soil geotechnical data such as unit weights, friction angles, etc., were obtained from a
geotechnical borehole log report from a nearby area in Ontario. The accuracy of these numbers
were confirmed from soil density databases online.
7.6. Factors of Safety for Crossing
Equations for the factor of safety of the embankment against Bearing capacity and Hydrostatic
uplift were taken from the Recommended Design Guideline for EPS Embankments by the
National Cooperative Highway Research Program (NCHRP). Although for Geo-foam
embankments, the equations are the same since they are based upon material weights and
geometries of the embankment. Since the minimum recommended design Factor of Safety for
embankments is 2.5, the chosen design was aimed towards having a Factor of Safety of 3.0.
The factor of safety for bearing capacity was found to be significantly greater than 3 and the
loading of the embankment was found out to be approximately 42 kPa. The allowable loading
was in excess of a 100 kPa.
The Factor of safety for slope stability was calculated using charts developed by Dr. Bathurst
and Mr. Sina Javankhoshdel. Since Granular soils have minimal cohesion, a value of zero was
assumed. The angle of the slope for 3:1 (H:V) slope, β was calculated to be 18.43o. With a
friction angle of 35 degrees for the granular A type soil, a Factor of safety was determined to
be 1.84, which was higher than the minimum required 1.5.

CEE 493 – Creek Crossing Design Project, Final Report
11 April 2016
36/111
For a conservative estimation of the factor of safety against hydrostatic uplift, the height of the
water was taken to be at the very edge of the road, which surpasses the 10-year design life of
the embankment. In addition, the concrete collars were not considered. The concrete collars
add further mass to the embankment, thereby increasing the factor of safety. The FoS against
floatation or hydrostatic uplift was found to be 1.35 which is higher than the minimum required
factor of safety of 1.2 (NCHRP, 2004). Figure 6 illustrates hydrostatic uplift forces.
Figure 7. Diagram of hydrostatic uplift forces.
7.7. Factors of Safety for Retaining Walls
Bearing capacity failure, sliding failure and overturning were examined for the retaining walls.
The factor of safety requirement against sliding is typically 1.5 and is determined by the driving
forces. In this case, the driving forces are the forces that translate the retaining wall on either
side of the culvert to the outer extremities. The resisting forces were determined to be 354 kN
while the driving forces were determined to be 230 kN, providing a factor of safety against
sliding of 1.55. The factor of safety of overturning uses moments resulting from driving forces.
The minimum factor of safety against overturning is 2.0 and the factor of safety of the design
was determined to be 2.1. Bearing capacity factor of safety in a cohesive soil environment is
required to be greater than 2.5 and was determined to be 4.5 for the retaining walls.

CEE 493 – Creek Crossing Design Project, Final Report
11 April 2016
37/111
7.8. Summary of Evaluated Factors of Safety
The factors of safety determined for the crossing and the retaining walls are shown in tables 6
and 7.
Factor of Safety requirement Minimum by guideline Embankment design FoS
Bearing Capacity 2.5 >>3
Sliding (Slope Stability) 1.5 1.84
Hydrostatic uplift 1.2 1.35
Table 7. Summary of factors of safety for crossing design.
FoS Condition Minimum FoS Design FoS
Bearing Capacity 2.5 4.5
Overturning 2.0 2.1
Sliding 1.5 1.55
Table 8. Summary of factors of safety for retaining wall design.

CEE 493 – Creek Crossing Design Project, Final Report
11 April 2016
38/111
8. COST ESTIMATE
8.1. Introduction
Cost estimates were conducted for both the existing crossing and this design. Cost estimates
were then compared to determine the feasibility of this project. A detail cost estimate is
provided in Appendix 9.
8.2. Existing Crossing
The cost of the existing crossing, over the 10-year design period, was evaluated for comparison
to the construction cost of this design. It is important to note that the cost of the existing
crossing may be significantly higher than the estimates provided herein, as little information
was available on the real costs. The costs used were estimated by the design team assuming
the dimensions, fill material, required equipment and costs of labour. (Dimension estimates
were provided by the client.) The final estimate for the cost of the existing crossing is a present
value of $800,000.
8.3. New Crossing Design
The new crossing design cost was estimated using RSMeans 2012. Appropriate contingencies
and location factors were included in the analysis. The cost of labour is likely higher than the
estimate costs, as it was not made clear to the design team the cost of, or quantity of labour
which would be performed by existing personnel, nor the type and volume of fill material
available on the base itself. The new crossing design is estimated to cost $790,000.
It should be noted that this cost estimate assumes the fill for the existing crossing will be used
wherever possible. This results in significant cost savings. The majority of materials will be
transported from a local contractor, located an estimated 32 km from the project site. The cost
estimates provided include transportation costs and utilize estimate quotes from ES Hubbell
for the cost of culverts, provided on 17 Nov 2015.

CEE 493 – Creek Crossing Design Project, Final Report
11 April 2016
39/111
8.4. Cost Savings
Cost savings for this design is therefore determined to be approximately $10,000 over the 10-
year design return period. The actual savings are likely much higher, as intermittent
maintenance costs will be lower with this design and it is probable that the cost estimate of the
existing design is significantly undervalued. Furthermore, the probability of the design event
occurring during the 10-year design period is only 65%. This event should only require partial
repair of the road surface on the north side of the crossing. If the 10-year flood event does not
occur for a longer period of time, cost savings are only increased with this design.
If the client wishes to further reduce costs, removal of the geomembranes around the culvert
group may be considered, as the water levels a the 10-year flood stage should be similar on
each side of the crossing, resulting in minimal seepage. Removal of the retaining wall
confinement is not recommended due to the increased potential for failure of the crossing.
8.5. Recommendations
Based on the analysis of the existing crossing and the new design described herein, the design
team believes this project to be a viable improvement to the creek crossing. However, a detailed
cost analysis of the existing crossing and investigation of the other items noted within this
report should be conducted before a final recommendation can be made.
CEE 493 – Creek Crossing Design Project, Final Report
11 April 2016
40/111
9. CONSTRUCTION PROCESS
9.1. Introduction
The considerations required during construction the crossing is described briefly in this section.
As a result of the significant number of considerations required and time constraints imposed
upon the design team, a complete construction plan is not provided.
9.2. Coffer Dams
Coffer dams must be established for construction purposes, in order to “work in the dry”.
Hydraulic activity can significantly complicate any construction activities. A coffer dam is a
barrier established around the construction site to block water flow. A pump is then used to
move the water around the dammed area to the next section of the natural channel.
A coffer dam should be established around the construction site. The feasibility of a single dam
versus two, working inwards, has not been evaluated and should be considered. The significant
span of the crossing may result in a single coffer dam being both impractical and uneconomical.
The pumps used for the coffer dam should be able to accommodate the flows of the creek.
Mean annual flow is approximately 1.2 m3/s. The pumps provided should be able to displace
this flow plus a reasonable volume of run off. Pumps should not be located more than 20 meters
from the main channel.
9.3. Fill Lifts & Compaction
As described previously in this report, the design criteria for this crossing calls for compaction
to 95% standard proctor density. The fill should be placed and compacted in lifts of 200mm
until the appropriate grade is achieved.
Following excavation of the site to be occupied by the culvert and retaining wall group, a layer
of 0.5m granular a, compacted to 95% standard proctor density must be placed. This layer
should be shaped to the form of the base of the arch-pipes to be placed. Fill around the base of

CEE 493 – Creek Crossing Design Project, Final Report
11 April 2016
41/111
the arch-pipes, in particular the corners, should be placed by shovel and compacted by hand.
Care must be taken to prevent voids and soft spots from occurring around the haunches of the
pipes as they may allow for the development of a structural failure. Lifts around the conduits
should again be 200mm, however it is also important to ensure that the difference in fill on
either side of the arch-pipe does not exceed a single lift in height. No vehicle should be
permitted to pass over or near the conduit group until the crossing has been built up to its
specified height and adequately compacted.
9.4. Placement of Conduits
The placement of the conduits should occur before placement of fill, but not until the reinforced
concrete for the retaining walls has adequately hardened. While the CSP arch-pipe is fairly
robust and designed to be resistant to rough handling, care should be taken during unloading
and placement to ensure no damage occurs and the placement is correct.
Once placed, the formwork for the end treatments should be constructed and the concrete
poured. These should also be allowed to harden adequately before the placement of the fill
material.

CEE 493 – Creek Crossing Design Project, Final Report
11 April 2016
42/111
REFERENCES
Belford, D.A. and Gould, W.R. 1989. An evaluation of trout passage through six highway
culverts in Montana. North American Journal of Fisheries Management 9: 437-445
Canadian Army, Canada. Canadian Military Bridge Manual Draft Appendix B.
Corrugated Steel Pipe Institute, 2010. Handbook of Steel Drainage and Highway Construction
Products. Cambridge, Ontario. Design Handbook.
Davidian, J., 1984.Computation of water-surface profiles in open channels. Department of the
Interior, US Geological Survey.
Department of Oceans and Fisheries Canada,2013, Ontario Restricted Activity Timing Windows
for the Protection of Fish and Fish Habitat.
Frith, H.R. and Blake, R.W. 1995. The mechanical power output and hydromechanical efficiency
of northern pike (Esox lucius) fast-starts. Journal of Experimental Biology 198: 1863-1873.
Golder Associates, Ontario, 2012. Foundation Investigation and Design, Proposed Temporary
Modular Bridge, Petawawa River Bridge, Highway 17. Ontario: Petawawa. Report.
Hadad, O. January 2016. Personal communication.
Harper, D.G. and Blake, R.W. 1990. Fast-start performance of rainbow trout Salmo gairdneri
and northern pike Esoc lucius. Journal of Experimental Biology 150: 321-342

CEE 493 – Creek Crossing Design Project, Final Report
11 April 2016
43/111
Javankhoshdel, S. and Bathurst, R. 2014. Simplified probabilistic slope stability design charts for
cohesive and cohesive-frictional (c-) soil, Canadian Geotechnical Journal, Vol. 51, No. 9 (April):
1033-1045
Lupo, J.F., 2010. Liner system design for heap leach pads. Geotextiles and Geomembranes, 28(2),
pp.163-173.
Ministry of Transportation, Ontario, 2008. Highway Drainage Design Standards. Ontario:
Province of Ontario. Design Manual.
Ministry of Transportation, Ontario, 2007. MTO Gravity Pipe Design Guidelines (Circular
Culverts and Storm Sewers). Ontario: Province of Ontario. Design Manual.
Ministry of Transportation, Ontario, 2009. Ontario Provincial Standard Drawing 805.020.
Ontario: Province of Ontario. Design Table.
Ministry of Transportation, Ontario, 2009. Ontario Provincial Standard Drawing 206.010.
Ontario: Province of Ontario. Design Drawing.
Ministry of Transportation, Ontario, 2013. Ontario Provincial Standard Drawing 810.010.
Ontario: Province of Ontario. Design Drawing.
Ministry of Transportation, Ontario, 2013. Ontario Provincial Standard Drawing 810.030.
Ontario: Province of Ontario. Design Drawing.
Ministry of Transportation, Ontario, 2013. Ontario Provincial Standard Specification, Material
Specification for Aggregates – Base, Subbase, Select Subgrade, and Backfill Material
(OPSS.MUNI 1010). Ontario: Province of Ontario. Standard Specification.

CEE 493 – Creek Crossing Design Project, Final Report
11 April 2016
44/111
Ministry of Transportation, Ontario, 2013. Ontario Provincial Standard Specification,
Construction Specification for Rip-Rap, Rock Protection, and Granular Sheeting (OPSS 511).
Ontario: Province of Ontario. Standard Specification.
National Cooperative Highway Research Program, United States of America, 2004.Guideline
and Recommended Standard for Geofoam Applications in Highway Embankment. Washington:
Transportation Research Board. Design Manual.
Oceans and Habitat Management Branch, Canada, 2008. Swimming performance and behaviour
of fish species endemic to Newfoundland and Labrador: A literature review for the purpose of
establishing design and water velocity criteria for fishways and culverts. Canada: Fisheries and
Oceans Canada. Canadian Manuscript Report of Fisheries and Aquatic Sciences No. 2843
Spencer, E. R., 2011, Heavy construction cost data 2012. Norwell, MA: RSMeans.
United States Department of Agriculture, 2007. Rosgen Stream Classification Technique –
Supplemental Materials. Technical Supplement 3E.
United States Geological Survey, New York, 1998. Estimation of Roughness Coefficients for
Natural Stream Channels with Vegetated Banks. New York: U.S. Geological Survey in
cooperation with New York State Department of Transportation.
Ven Te Chow, Illinois, 1959. Open-Channel Hydraulics. Illinois: University of Illinois.
Textbook.
Water Management Branch, Canada, 2000. Riprap Design and Construction Guide. Canada:
Ministry of Environment. Design and construction manual.
Watt, S. Nov 2015. Personal communication.

CEE 493 – Creek Crossing Design Project, Final Report
11 April 2016
45/111
Webb, P.W. 1978a. Fast-start performance and body form in seven species of teleost fish. Journal
of Experimental Biology 74: 211-226.
Wight, G. Jan 2016. Personal communication.
Wilcock, R. March 2016. Personal communication.
Xeneca, Ontario, 2013. Environmental Report, Big Eddy (Petawawa River), Hydroelectric
Generating Station Project. Ontario: Petawawa. Draft for discussion purposes.
CEE 493 – Creek Crossing Design Project, Final Report
11 April 2016
APPENDIX No. 1: Statement of Requirements

CEE 493 – Creek Crossing Design Project, Final Report
11 April 2016
Client
Redacted at the client’s request.
Introduction
This statement of requirements is proposed as the guidelines for a potential project to
design a replacement for the creek crossing. The proposed design for the crossing should
reduce damage and washout caused by annual flooding or significant runoff events at the
creek crossing.
Project Background
The creek crossing is a causeway type crossing in southeastern Ontario. It has been
subjected to significant damage on a near annual basis as a result of flooding and large
runoff events, placing a high demand on maintenance resources and requiring frequent
remediation.
No official design records exist for the creek crossing and there are no detailed records of
past failures or remediation performed at this site. The site allows alternate access to several
live weapon ranges and has on occasion been used as an egress route for vehicles and
troops. While it sees relatively low traffic load, vehicles using the site have been identified
up to Military Load Class (MLC) 30 and include Light Armored Vehicles (LAVs),
Buffalos, various heavy equipment and HWW tractor trailers.
The site is located in a relatively undisturbed area of wilderness in southerneastern Ontario.
The surrounding area is mostly comprised of forest with a few roads use for operational
purposes. Materials used in the construction and maintenance of the site have typically
been available locally and were likely extracted from locations in the area.

CEE 493 – Creek Crossing Design Project, Final Report
11 April 2016
Objectives & Constraints
Objectives
The primary objective of this project is to design a replacement crossing for this location
to allow land vehicles to pass the creek. Specific objectives are as follows:
a. Use modelling to determine the high water level and minimum conveyance
requirement at the creek.
b. Design the conveyance channel:
i) To provide sufficient conveyance to eliminate flood damage.
ii) To minimize impact on the environment, such as local wildlife and sensitive
species.
c. Design the crossing:
i) To resist erosion and minimize maintenance requirements.
ii) To accommodate a single traffic lane, year round.
Constraints
a. Design the conveyance channel:
i) To provide a minimum conveyance determined from modelling.
ii) To permit passage of local aquatic species.
iii) Without significant diversion of natural stream flow.
b. Design the crossing:
i) Utilizing local and provincial codes as guidelines.
ii) To exceed the high water level modelled by at least 1m.
iii) To use local materials whenever possible.
iv) To accommodate an MLC 30 design vehicle.
Design Criteria
The crossing should meet requirements for a MLC 30 vehicle load. Standard practice in
the area is to cross one vehicle at a time; therefore, the crossing should accommodate 1
lane of traffic. Provincial and local codes are to be used as guidelines wherever possible in
the design process.

CEE 493 – Creek Crossing Design Project, Final Report
11 April 2016
Constraints
The client has identified that the continued access to live ranges through the gate, accessed
by the creek crossing, is an operational imperative. The crossing must not be relocated. The
project must minimize impact on the local ecosystem and allow passage for local fish
which may use the creek as a spawning area, specifically the Brook Trout. The design
should place the road surface on the crossing above the high water level of the flood plane.
The design should be as cost effective as possible and require minimal maintenance.
Deliverables
The deliverable for this project will be a formal engineering report. It will consider the
hydrological characteristics of the area, impacts on sensitive species, and environmental
effects. The report will include design specifications for a replacement crossing, along with
the accompanying drawings of bridges and roads. Hydrological modelling will also be
included, along with minimal conveyance requirements and expected return periods for the
design. Throughout the design process, the team will also provide two design presentations,
a project poster presentation and each presentation will be accompanied by an interim
report detailing the progress of the project.

CEE 493 – Creek Crossing Design Project, Final Report
11 April 2016
APPENDIX No. 2: Environmental Assessment Screening

CEE 493 – Creek Crossing Design Project, Final Report
11 April 2016
DND EA REPORT
PART I PROJECT IDENTIFICATION
Note: This part must be submitted to the Base/Wing Environmental Officer for registration on the
Canadian Environmental Assessment Registry within 14 days of the commencement of the
environmental assessment.
Project Title: CREEK CROSSING
Description of the project: At the crossing annual snowmelt, backwater flow from the main river
and flow from the creek causes stress on existing infrastructure, damaging the crossing as the
culverts placed are not sufficient to accommodate flow.
The aim of project is to redesign the crossing to accommodate the flow at the crossing. Arch pipe
culverts were used with addition of rip-rap slopes and measures such as fish baffles to let fish
passage.
Project schedule: May 2016 - October 2016
Project Location: REDACTED
Originating Directorate, Base, or Unit: N/A
EA Start Date: January 2016
Type of Project:
a) Physical work Yes [ X ] No [ ]
b) Physical Activity Yes [ X ] (Part VII: 43, 45, 46, Part VIII: 48.1) No [ ]
EA “Trigger”:
a) Proponent Yes [ X ] No [ ]
b) Funding Yes [ ] No [ X ]
c) Land Yes [ ] No [ X ]
d) Permit Yes [ X ] No [ ]

CEE 493 – Creek Crossing Design Project, Final Report
11 April 2016
OPI’s EA/project File reference #:
CEA Registry # : (provided through NDHQ/DGE after registration)
Other Responsible Federal authorities: Fisheries Act (Ministry of Fisheries and Oceans)

CEE 493 – Creek Crossing Design Project, Final Report
11 April 2016
Federal Environmental Assessment Coordinator:
Contacts:
FEAC Point of Contact: The principle initial point of contact between DND and the
public on environmental concerns relating to the EA, the EA report and follow-up.
Project OPI/principle point of contact: The person who is responsible for ensuring that the
environmental assessment is conducted for the project.
a) Phil Lamarche, Dr, and Professor
b) Sawyer Building, RMCC Kingston
Public Notification:
Due to the time constraint of the project there were no requests for public input on the
project, excluding 3 design review boards consisting of civilian engineers and
professors with expertise on the subject.

CEE 493 – Creek Crossing Design Project, Final Report
11 April 2016
PART II ASSESSMENT OF EFFECTS AND CONCLUSIONS
Note: This part must be submitted to the Base/Wing Environmental Officer for
registration on the Canadian Environmental Assessment Registry.
Assessment of environmental effects
The detailed assessment of environmental effects and supporting documentation is at
Annex A (with additional annexes or enclosures as necessary)
Executive Summary
After a detailed EA conducted by local personnel, sufficient data must be available to
know if the project is carry on. An inspection of proposed design is recommended every
two years for erosion control. Inspection of site is also recommended to assess flow
pattern and impact of infrastructure on fish species due to flow rates.
EA Determination
On the basis of this EA Report, it has been determined that the impact of this project on the
environment is as follows (indicate with an X):
The project is likely to cause significant adverse environmental effects. The project cannot
proceed without a detailed environmental assessment and data collection by the client [ X ]
Follow-up
Is a follow up or monitoring program required? Yes [x ] No [ ]

CEE 493 – Creek Crossing Design Project, Final Report
11 April 2016
After a detailed EA conducted by the client, sufficient data must be available to know if
the project is carry on. An inspection of proposed design is recommended every two years
for erosion control. Inspection of site is also recommended to assess flow pattern and
impact of infrastructure on fish species due to flow rates.

CEE 493 – Creek Crossing Design Project, Final Report
11 April 2016
PART III RECOMMENDATIONS AND SIGN-OFF
EA Report prepared by:
NCdt Aithal – Group 3 with OCdt Savage, OCdt Conrad (07/04/2016)
______________________________________________________________
Signature block, signature, and date
EA Report reviewed by (with recommendation by NDHQ, Formation or Base/Wing
Environmental Specialist Staff if applicable)
______________________________________________________________
Signature block, signature, and date
EA Report accepted and approved by
The undersigned accepts the determination and recommendations of this environmental
screening report.
______________________________________________________________
Signature block, signature, and date of the DND/CF decision-making authority for the
project

CEE 493 – Creek Crossing Design Project, Final Report
11 April 2016
ANNEX A ASSESSMENT OF ENVIRONMENTAL EFFECTS
Project Description and Scope
a. General Description of the project: New culverts are proposed to be added at the
crossing in addition to increasing the slope of the embankment from a 1:1 (H:V) to a
3:1(H:V) embankment. The proposed design is meant for a 10-year design period.
b. Project components, scope, and timeframe: Major considerations in design are the
impact of placement of culverts on stream flow, size of culverts on flow rates, which in
turn impact the spawning period of the fish species native to creek area. The proposed
construction time frame from May to October 2016 is deliberately chosen to avoid the
spawning period of the fish species.
Description of the existing environment
a. Sources of information, including site visits: Site visits were never done due to
time constraints, budget. The client has requested to remediate the problem. Existing flow
data was given from client. Environmental details on fish species effected were found on
online databases
b. General description: The area of the flood basin was considered was above 12000
ha, feeding water to the main river. Backflow was a consideration during the assessment
of flow rates. A Moin-Shaw regression was used to estimate the flow rates in the existing
infrastructure and matched with an approximation using the rational method. Peak flow

CEE 493 – Creek Crossing Design Project, Final Report
11 April 2016
rates due to snow melt and run-off affect fish species and erosion control in the area with
existing infrastructure, leading to a destruction of the existing embankment every year.
c. Valued Ecosystem Components: Existing flora surrounding the embankment area
will need to be modified during the construction process due to excavation, utilising
compaction equipment as well as establishing of a coffer-dam to minimize flooding of
construction area. Disruption of flow during the construction process will have an impact
on the fish species as well as vegetation in the area.
Consultation
a. Consultation within DND:
b. Consultation with the Public:
c. Consultation with other Dept.’s, agencies or jurisdictions: Throughout the
process of the design professors from the Department of Civil Engineering at the Royal
Military College of Canada were consulted for guidance. The proposed embankment
design was evaluated in three design review boards.
Environmental Effects
Environmental effects are detailed in the matrix below. Major environmental impacts are
- Fill material pile
- Excavation of existing culverts
- Compaction of soil (noise, dust)

CEE 493 – Creek Crossing Design Project, Final Report
11 April 2016
- Clearing of area for cofferdam
- Change in stream flow during construction

CEE 493 – Creek Crossing Design Project, Final Report
11 April 2016
ENVIRONMENTAL EFFECTS MATRIX

CEE 493 – Creek Crossing Design Project, Final Report
11 April 2016
Follow-up program
Follow-up program required for the project Yes [ x ] No [ ]
If yes, provide details of the program.
Conclusions
The area of the flood basin was considered was above 12000 ha, feeding water to the
main river. Peak flow rates due to snow melt and run-off affect fish species and erosion
control in the area with existing infrastructure, leading to a destruction of the existing
embankment every year.
New culverts are proposed to be added at the crossing in addition to increasing the slope
of the embankment from a 1:1 (H:V) to a 3:1(H:V) embankment. The proposed design is
meant for a 10-year design period.
After a detailed EA conducted by the client, sufficient data must be available to know if
the project is carry on. An inspection of proposed design is recommended every two years
for erosion control. Inspection of site is also recommended to assess flow pattern and
impact of infrastructure on fish species due to flow rates.

CEE 493 – Creek Crossing Design Project, Final Report
11 April 2016
APPENDIX No. 3: Watershed Details

CEE 493 – Creek Crossing Design Project, Final Report
11 April 2016
Appendix redacted for CSPI Student Paper contest submission at request of the client.

CEE 493 – Creek Crossing Design Project, Final Report
11 April 2016
APPENDIX No. 4: Flood Flow Assessments

CEE 493 – Creek Crossing Design Project, Final Report
11 April 2016
Figure 4-1. IDF curve redacted for CSPI Student Paper contest submission at request of
client..
Equation 4-1. FAA Rational Equation, where:
c: Runoff coefficient
S: Watercourse slope
L: Longest flow length
t: Time of concentration
G: FAA constant, G=1.8
Time of concentration:
G 1.8 m/s2
c 0.1
L 62273 m
S 0.0032 m/m
t = 656.71 min
Table 4-1. Time of concentration.
𝑄 = 0.00278𝐶𝐼𝐴
Equation 4-2. Rational method, where:
A: Area, in hectares
I: Intensity, mm/hr
C: Runoff coefficient
Area: 12467.8 hectares
C range: 0.1-0.3
C used: 0.2
𝑡 =𝐺(1.1 − 𝑐)𝐿0.5
(100𝑆)13

CEE 493 – Creek Crossing Design Project, Final Report
11 April 2016
Flood stage
(years)
IDF Flow
(m3/s)
Moin-Shaw Multiple Regression (m3/s)
Moin & Shaw 85 Index Flood with Expected Probability Adjustment (m3/s)
IDF Intensity (mm/h)
2 31.2 20.1 22.1 4.5
5 34.7 30.7 27.3 5
10 41.6 38.2 31.7 6
20 47.1 46.1 36.9 6.8
50 55.5 54.4 43.9 8
100 62.4 62.3 49.4 9
Table 4-2. Flood flows for creek watershed.

CEE 493 – Creek Crossing Design Project, Final Report
11 April 2016
APPENDIX No. 5: Culvert Design

CEE 493 – Creek Crossing Design Project, Final Report
11 April 2016
Culvert Design Steps & Calculations
As described by MTO Gravity Pipe Design Guidelines (May, 2007)
Step 1 - Project Description
Use at least 1 culvert on main channel.
Main channel must have at least 1 pipe which allows fish passage by limiting velocity to:
0.8 m/s (Brook trout passing a 30m length governing.)
Crossing design service life (DSL): 10 years, from MTO Highway Drainage Manual
Culvert DSL: 25 years (Table C5.0, MTO Gravity Pipe Design Guidelines)
Required total flow at 5-year flood stage: 30.71 m3/s (From OFAT 3)
Pipe locations on crossing: Stationing to be determined in numerical model.
Pipes to be placed at base of crossing (ground elevation of selected station).
Slope to approximately match stream slope.
For this design, replacement of pipes is not considered an option. Therefore, EMSL must exceed
DSL requirements for the culvert.
Step 2 - Selection/Elimination of Pipe Types
Required diameters eliminate non-reinforced concrete, HDPVC and other options.
For this project, we are considering normally galvanized CSP and reinforced concrete box culverts.
RC Box Culvert analysis will be conducted separately.
The limitation to normally galvanized CSP is in adherence to the clients request to use materials
available on site as much as possible, as the client has indicated CSP is available on site
through existing stores and contracts.
MTO design guidelines indicate that polymer laminated pipe can be assumed to
add 50 years to the EMSL of a normally galvanized pipe.
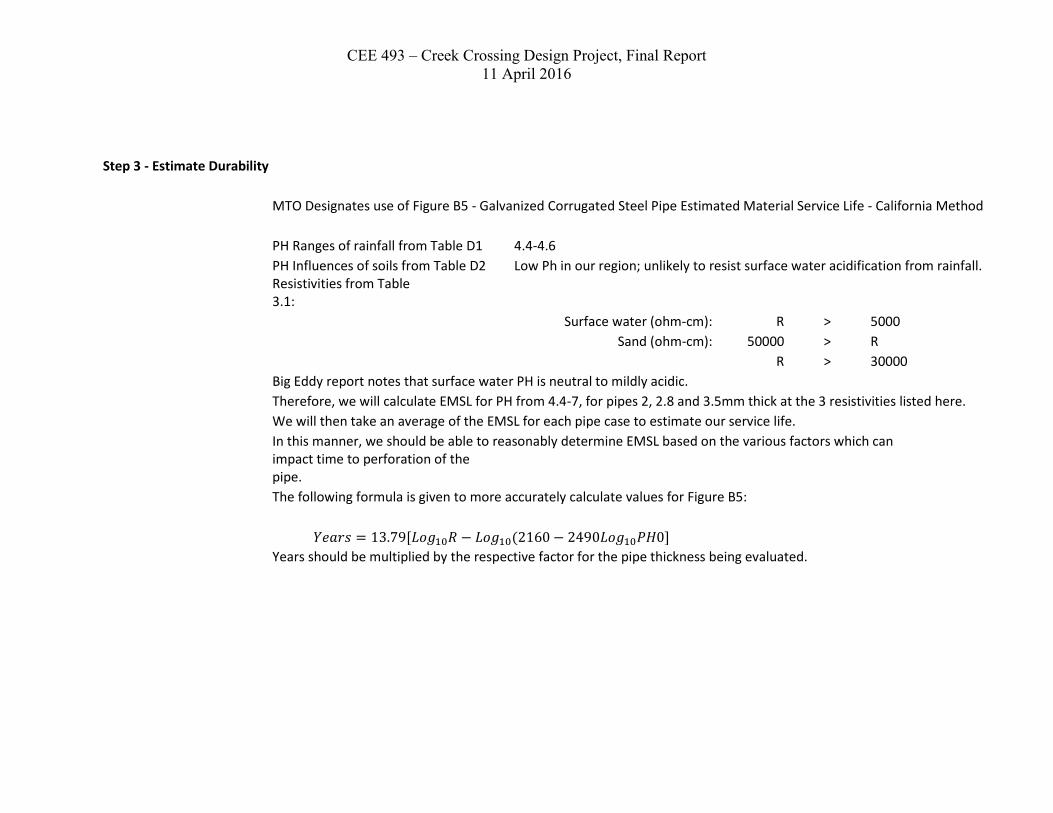
CEE 493 – Creek Crossing Design Project, Final Report
11 April 2016
Step 3 - Estimate Durability
MTO Designates use of Figure B5 - Galvanized Corrugated Steel Pipe Estimated Material Service Life - California Method
PH Ranges of rainfall from Table D1 4.4-4.6
PH Influences of soils from Table D2 Low Ph in our region; unlikely to resist surface water acidification from rainfall.
Resistivities from Table 3.1:
Surface water (ohm-cm): R > 5000
Sand (ohm-cm): 50000 > R
R > 30000
Big Eddy report notes that surface water PH is neutral to mildly acidic.
Therefore, we will calculate EMSL for PH from 4.4-7, for pipes 2, 2.8 and 3.5mm thick at the 3 resistivities listed here.
We will then take an average of the EMSL for each pipe case to estimate our service life.
In this manner, we should be able to reasonably determine EMSL based on the various factors which can
impact time to perforation of the pipe.
The following formula is given to more accurately calculate values for Figure B5:
Years should be multiplied by the respective factor for the pipe thickness being evaluated.
𝑌𝑒𝑎𝑟𝑠 = 13.79[𝐿𝑜𝑔10𝑅 − 𝐿𝑜𝑔10(2160 − 2490𝐿𝑜𝑔10𝑃𝐻0]

CEE 493 – Creek Crossing Design Project, Final Report
11 April 2016
Years EMSL Based on R =
Thickness (mm) Factor Ph 5000 30000 50000 EMSL (years)
2 1.6
4.4 21.01572362 38.184853 43.079724
42.1
4.5 21.44256515 38.611694 43.506565
4.6 21.87926374 39.048393 43.943264
4.7 22.32674444 39.495874 44.390744
4.8 22.78602632 39.955156 44.850026
4.9 23.25823836 40.427368 45.322238
5 23.74463857 40.913768 45.808639
5.1 24.24663705 41.415766 46.310637
5.2 24.76582427 41.934953 46.829824
5.3 25.30400587 42.473135 47.368006
5.4 25.86324607 43.032375 47.927246
5.5 26.4459223 43.615051 48.509922
5.6 27.05479476 44.223924 49.118795
5.7 27.69309627 44.862225 49.757096
5.8 28.3646497 45.533779 50.42865
5.9 29.07402422 46.243153 51.138024
6 29.82674641 46.995876 51.890746
6.1 30.62959172 47.798721 52.693592
6.2 31.49099543 48.660125 53.554995
6.3 32.42164779 49.590777 54.485648
6.4 33.43538194 50.604511 55.499382
6.5 34.55054657 51.719676 56.614547
6.6 35.79222039 52.96135 57.85622
6.7 37.19597582 54.365105 59.259976
6.8 38.81470689 55.983836 60.878707
6.9 40.73210899 57.901238 62.796109
7 43.09251358 60.261643 65.156514

CEE 493 – Creek Crossing Design Project, Final Report
11 April 2016
2.8 2.2
4.4 28.89661998 52.504173 59.23462
57.9
4.5 29.48352708 53.09108 59.821527
4.6 30.08398765 53.69154 60.421988
4.7 30.69927361 54.306826 61.037274
4.8 31.33078619 54.938339 61.668786
4.9 31.98007775 55.58763 62.318078
5 32.64887804 56.256431 62.986878
5.1 33.33912594 56.946679 63.677126
5.2 34.05300837 57.660561 64.391008
5.3 34.79300807 58.400561 65.131008
5.4 35.56196335 59.169516 65.899963
5.5 36.36314316 59.970696 66.701143
5.6 37.2003428 60.807895 67.538343
5.7 38.07800737 61.68556 68.416007
5.8 39.00139334 62.608946 69.339393
5.9 39.9767833 63.584336 70.314783
6 41.01177632 64.619329 71.349776
6.1 42.11568862 65.723241 72.453689
6.2 43.30011871 66.907671 73.638119
6.3 44.57976571 68.187318 74.917766
6.4 45.97365017 69.581203 76.31165
6.5 47.50700153 71.114554 77.845002
6.6 49.21430304 72.821856 79.552303
6.7 51.14446676 74.752019 81.482467
6.8 53.37022197 76.977775 83.708222
6.9 56.00664986 79.614202 86.34465
7 59.25220618 82.859759 89.590206

CEE 493 – Creek Crossing Design Project, Final Report
11 April 2016
3.5 2.8
4.4 36.77751634 66.823492 75.389516
73.7
4.5 37.52448901 67.570465 76.136489
4.6 38.28871155 68.334688 76.900712
4.7 39.07180277 69.117779 77.683803
4.8 39.87554606 69.921522 78.487546
4.9 40.70191714 70.747893 79.313917
5 41.5531175 71.599094 80.165117
5.1 42.43161484 72.477591 81.043615
5.2 43.34019247 73.386169 81.952192
5.3 44.28201027 74.327986 82.89401
5.4 45.26068063 75.306657 83.872681
5.5 46.28036403 76.32634 84.892364
5.6 47.34589084 77.391867 85.957891
5.7 48.46291847 78.508895 87.074918
5.8 49.63813698 79.684113 88.250137
5.9 50.87954238 80.925518 89.491542
6 52.19680623 82.242782 90.808806
6.1 53.60178551 83.647762 92.213786
6.2 55.109242 85.155218 93.721242
6.3 56.73788364 86.78386 95.349884
6.4 58.5119184 88.557894 97.123918
6.5 60.46345649 90.509433 99.075456
6.6 62.63638569 92.682362 101.24839
6.7 65.09295769 95.138934 103.70496
6.8 67.92573706 97.971713 106.53774
6.9 71.28119073 101.32717 109.89319
7 75.41189877 105.45787 114.0239

CEE 493 – Creek Crossing Design Project, Final Report
11 April 2016
4.2 3.4
4.4 44.6584127 81.142812 91.544413
89.4
4.5 45.56545094 82.04985 92.451451
4.6 46.49343545 82.977835 93.379435
4.7 47.44433194 83.928731 94.330332
4.8 48.42030593 84.904705 95.306306
4.9 49.42375652 85.908156 96.309757
5 50.45735696 86.941756 97.343357
5.1 51.52410373 88.008503 98.410104
5.2 52.62737657 89.111776 99.513377
5.3 53.77101247 90.255412 100.65701
5.4 54.95939791 91.443797 101.8454
5.5 56.19758489 92.681984 103.08358
5.6 57.49143887 93.975838 104.37744
5.7 58.84782957 95.332229 105.73383
5.8 60.27488062 96.75928 107.16088
5.9 61.78230146 98.266701 108.6683
6 63.38183613 99.866236 110.26784
6.1 65.08788241 101.57228 111.97388
6.2 66.91836528 103.40276 113.80437
6.3 68.89600156 105.3804 115.782
6.4 71.05018663 107.53459 117.93619
6.5 73.41991145 109.90431 120.30591
6.6 76.05846833 112.54287 122.94447
6.7 79.04144862 115.52585 125.92745
6.8 82.48125214 118.96565 129.36725
6.9 86.5557316 123.04013 133.44173
7 91.57159136 128.05599 138.45759
Table 5-1. Estimated Mean Service Life (EMSL) based on steel thickness.

CEE 493 – Creek Crossing Design Project, Final Report
11 April 2016
STEP 4 - List pipes which meet criteria thus far.
All cases significantly exceed the design life requirement.
Therefore, all pipes proposed in the price list at the start of this document are suitable alternatives.
Diameters required for flow and structural requirements will govern pipe thickness.
STEP 5 - Hydraulic evaluation of pipe alternatives
MTO designates the use of Manning's Equation for the analysis of pipe flow:
Q Flow in m3/s
n Manning's number
A Inside area of pipe (m2)
R Hydraulic radius
S Slope of pipe (m/m)
Assume full flow state for each pipe case.
We will use several different slopes, since velocities may differ in each pipe at full flow state.
Mannings number, n, obtained from MTO Gravity Pipe Design Guidelines Table C2.0
𝑄 =𝐴𝑅
23𝑠
12
𝑛
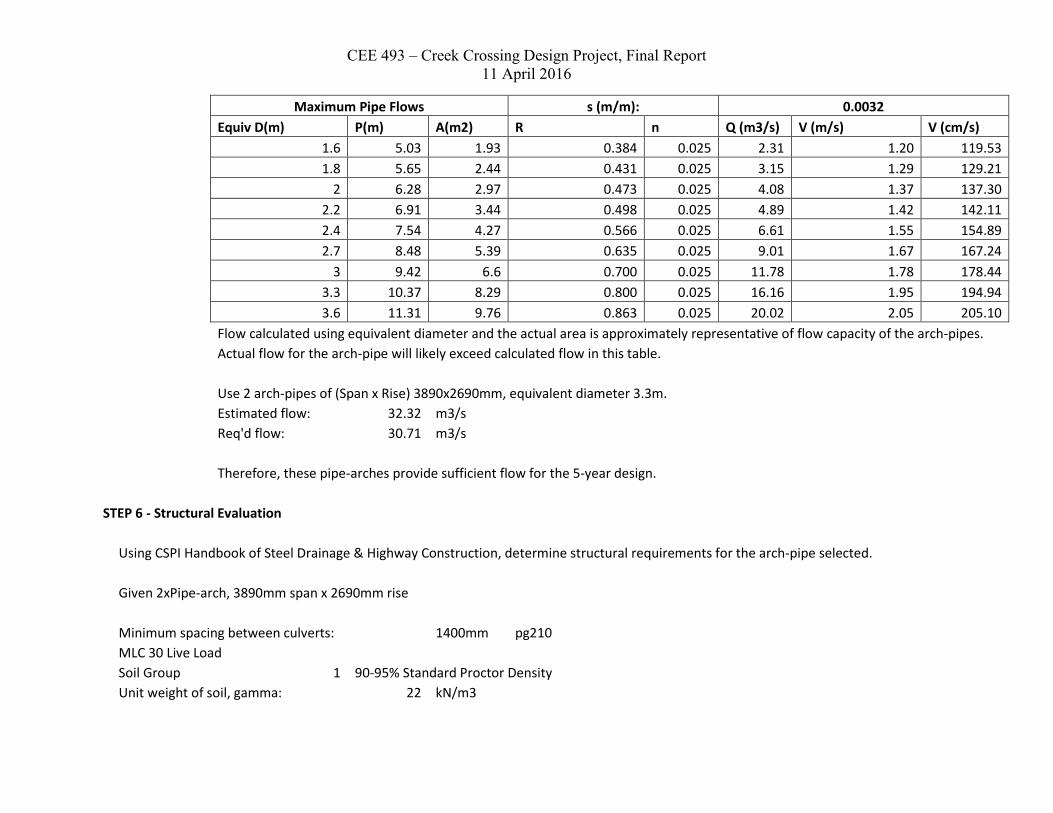
CEE 493 – Creek Crossing Design Project, Final Report
11 April 2016
Maximum Pipe Flows s (m/m): 0.0032
Equiv D(m) P(m) A(m2) R n Q (m3/s) V (m/s) V (cm/s)
1.6 5.03 1.93 0.384 0.025 2.31 1.20 119.53
1.8 5.65 2.44 0.431 0.025 3.15 1.29 129.21
2 6.28 2.97 0.473 0.025 4.08 1.37 137.30
2.2 6.91 3.44 0.498 0.025 4.89 1.42 142.11
2.4 7.54 4.27 0.566 0.025 6.61 1.55 154.89
2.7 8.48 5.39 0.635 0.025 9.01 1.67 167.24
3 9.42 6.6 0.700 0.025 11.78 1.78 178.44
3.3 10.37 8.29 0.800 0.025 16.16 1.95 194.94
3.6 11.31 9.76 0.863 0.025 20.02 2.05 205.10
Flow calculated using equivalent diameter and the actual area is approximately representative of flow capacity of the arch-pipes.
Actual flow for the arch-pipe will likely exceed calculated flow in this table.
Use 2 arch-pipes of (Span x Rise) 3890x2690mm, equivalent diameter 3.3m.
Estimated flow: 32.32 m3/s
Req'd flow: 30.71 m3/s
Therefore, these pipe-arches provide sufficient flow for the 5-year design.
STEP 6 - Structural Evaluation
Using CSPI Handbook of Steel Drainage & Highway Construction, determine structural requirements for the arch-pipe selected.
Given 2xPipe-arch, 3890mm span x 2690mm rise
Minimum spacing between culverts: 1400mm pg210
MLC 30 Live Load
Soil Group 1 90-95% Standard Proctor Density
Unit weight of soil, gamma: 22 kN/m3

CEE 493 – Creek Crossing Design Project, Final Report
11 April 2016
Secant modulus, Es: 12 Mpa
Required:
Determine minimum cover
Check wall thickness is sufficient for MLC 30 live load
Geometric Properties:
B (N.A.) 915 mm
Rt 1975 mm
Rc 815 mm
Rb 6015 mm
A 8.29 m2
Dh 3890 mm
Dv 3550 mm Note: Equal to 2(Rise-B)
1. Minimum Cover (Hmin)
Largest of:
0.6 m = 600 mm
(Dh/6)(Dh/Dv)^(1/2) = 679 mm Governs
0.4(Dh/Dv)^2 = 480 mm
Hmin = 679 mm
H = 730 mm
Therefore, cover provided is sufficient for structural requirements.

CEE 493 – Creek Crossing Design Project, Final Report
11 April 2016
2. Dead Load Thrust (Td)
Dh/Dv = 1.10
H/Dh = 0.188
Af = 1.48 Fig 6.13 p232
Note: Approximating area between springline & crown as no formula to determine this has been found.
A = 8.29 m2
B = 0.915 m2
Span = 3.89 m2
Area between springline & crown = A - (B x Span) = 4.73065 m2
Gamma: 22 kN/m3
W = 166.55 kN/m
Cs = 0.0942 E 200000 MPA
Es 24 MPA Secant modulus of stiffness, Tb 6.6 p 209
Plate area: 4.521 mm2/mm Tb 6.2 p206
Td = 122.1
3. Live Load Thrust (TL)
Note: Only calculate 1 lane case, as design is a single lane crossing.
𝐶𝑆 =1000𝐸𝑆𝐷𝑉
𝐸𝐴
𝑇𝐷 = 0.5(1.0 − 0.1𝐶𝑆)𝐴𝑓𝑊
𝑊 = 𝛾[(𝐻𝐷𝐻) + 𝐴𝑟𝑒𝑎 𝑏𝑒𝑡𝑤𝑒𝑒𝑛 𝑠𝑝𝑟𝑖𝑛𝑔𝑙𝑖𝑛𝑒 & 𝐶𝑟𝑜𝑤𝑛]
𝑇𝐿 = 0.5(𝑙𝑒𝑠𝑠𝑒𝑟 𝑜𝑓 𝐷𝐻 𝑎𝑛𝑑 𝑙𝑡)𝜎𝐿𝑚𝑓
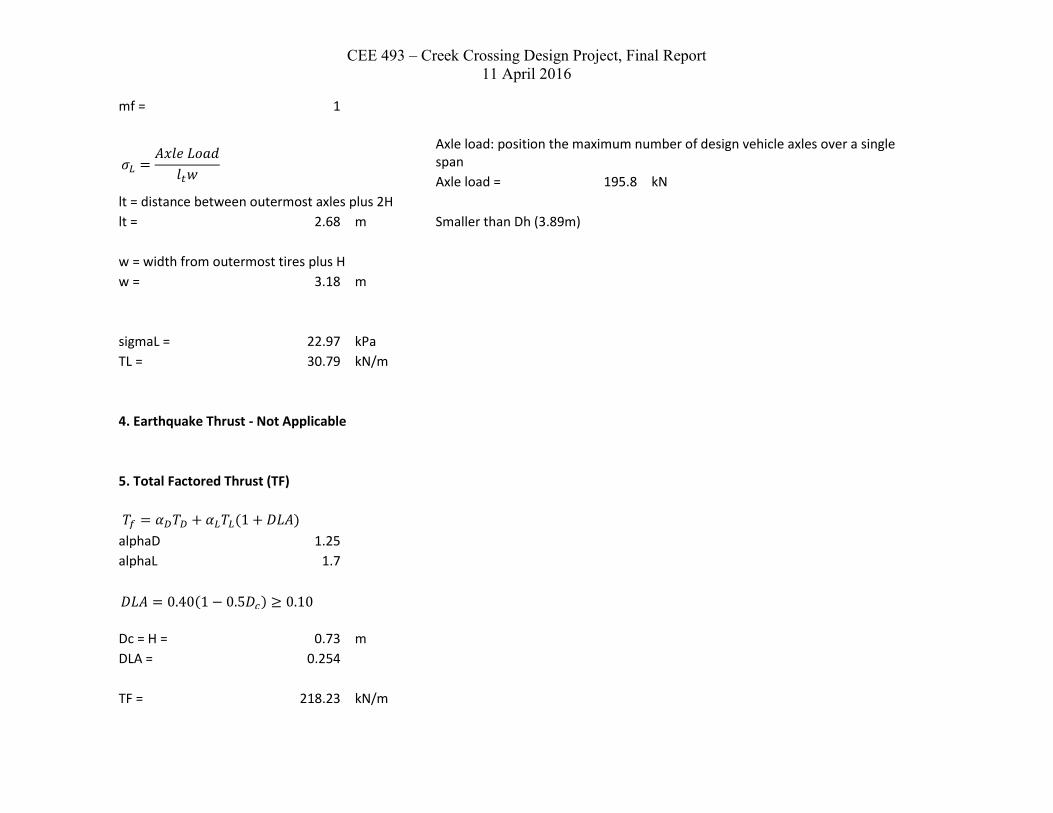
CEE 493 – Creek Crossing Design Project, Final Report
11 April 2016
mf = 1
Axle load: position the maximum number of design vehicle axles over a single span
Axle load = 195.8 kN
lt = distance between outermost axles plus 2H
lt = 2.68 m Smaller than Dh (3.89m)
w = width from outermost tires plus H
w = 3.18 m
sigmaL = 22.97 kPa
TL = 30.79 kN/m
4. Earthquake Thrust - Not Applicable
5. Total Factored Thrust (TF)
alphaD 1.25
alphaL 1.7
Dc = H = 0.73 m
DLA = 0.254
TF = 218.23 kN/m
𝜎𝐿 =𝐴𝑥𝑙𝑒 𝐿𝑜𝑎𝑑
𝑙𝑡𝑤
𝑇𝑓 = 𝛼𝐷𝑇𝐷 + 𝛼𝐿𝑇𝐿(1 + 𝐷𝐿𝐴)
𝐷𝐿𝐴 = 0.40(1 − 0.5𝐷𝑐) ≥ 0.10

CEE 493 – Creek Crossing Design Project, Final Report
11 April 2016
6. Compressive Stress at ULS (sigmaU)
where Area is the plate Area
sigmaU = 48.27 MPA
7. Wall Strength in Compression (fb)
Definition of upper zone:
i)
radians, where:
Es 24 Mpa
R = Rt 1975 mm
H 0.73 m
H' 887.5 m
I 394.84 mm4/mm Tb 6.2 p206
Em = 24.00 Mpa
Sigma-o = 0.326 radians
ii)
𝜎𝑢 =𝑇𝑓
𝐴𝑟𝑒𝑎
𝜃𝑜 = 1.6 + 0.2𝑙𝑜𝑔 [𝐸𝐼
𝐸𝑚𝑅3]
𝐸𝑚 = 𝐸𝑠 [1 − [𝑅𝑡
𝑅𝑡 + 1000(𝐻 + 𝐻′)]
2
]
𝜆 = 1.22 [1.0 + 1.6 [𝐸𝐼
𝐸𝑚𝑅𝑡3]
0.25
]

CEE 493 – Creek Crossing Design Project, Final Report
11 April 2016
Lamda = 1.366
iii)
K = 5.835E-07
iv)
rho = 21.207
Therefore, use:
rho = 1
v)
Fy 230 Mpa
r 9.345 mm, Tb 6.2 p206
Re = 3658 mm
vi) Two conduits, therefore:
S = 1.4 m
Fm = 0.958 < 1
𝐾 = 𝜆 [𝐸𝐼
𝐸𝑚𝑅𝑐3]
𝜌 = [1000(𝐻 + 𝐻′)
𝑅𝑡]
0.5
≤ 1.0
𝑅𝑒 =𝑟
𝐾[6𝐸𝜌
𝐹𝑦]
0.5
𝐹𝑚 = (0.85 +0.3𝑆
𝐷ℎ) ≤ 1.0

CEE 493 – Creek Crossing Design Project, Final Report
11 April 2016
vii) R < Re
Phit 0.8 Tb 6.14 p228
fb = 176.27 Mpa
SigmaU 48.27
Since SigmaU is less than fb, 4.2mm plate thickness satisfies compressive stress criteria in the upper zone (where R=815m).
vii) Check Lower Zone Arcs for Wall Strength in Compression
Lambda 1.22
Em = Es 24 Mpa
Rho 1
R1 (top) 1975 mm
R2 (corner) 815 mm
R3 (bottom) 6015 mm
R1 R2 R3
K 5.835E-07 7.42E-06 1.845E-08
Re (mm) 3658 288 115721
Fb (Mpa) 176.27 176.27 176.27
4.2mm plate satisfies compressive stress criteria for all radii within the lower zone of the culvert.
8. Strength Requirements During Construction
Should not be required, as vehicle loads should not be applied to arch-pipes during construction and retaining wall
reinforcement should provide sufficient confinement to ensure full structural strength of corrugated pipe is
𝑓𝑏 = 𝜙𝑡𝐹𝑚 [𝐹𝑦 −(𝐹𝑦𝐾𝑅)
2
12𝐸𝑟2𝜌]

CEE 493 – Creek Crossing Design Project, Final Report
11 April 2016
achieved.
9. Factored Longitudinal Seam Strength, Sf
Phij 0.7
Ss 372 kN/m Tb 6.4a p207
Sf 260.4 kN/m
Tf 218.23 kN/m
Seam strength is sufficient using single 10mm rivets with a 68x13mm seam.
10. Radius of Curvature
Rt 1975
Rc 815
Rt/Rc 2.423 < 5.0, OK
𝑆𝑓 = 𝜙𝑗𝑆𝑆 ≥ 𝑇𝑓
𝑅𝑡
𝑅𝑐≤ 5.0

CEE 493 – Creek Crossing Design Project, Final Report
11 April 2016
APPENDIX No. 6: Crossing & Culvert Group Drawings
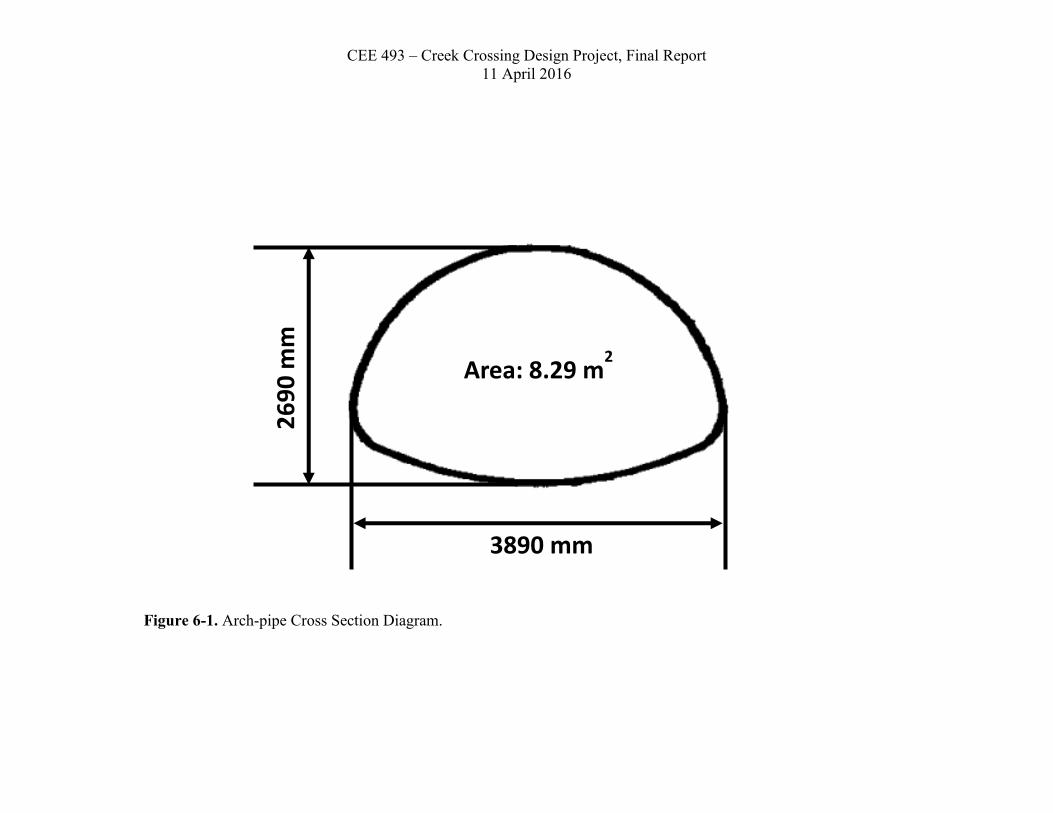
CEE 493 – Creek Crossing Design Project, Final Report
11 April 2016
Figure 6-1. Arch-pipe Cross Section Diagram.
26
90
mm
3890 mm
Area: 8.29 m2
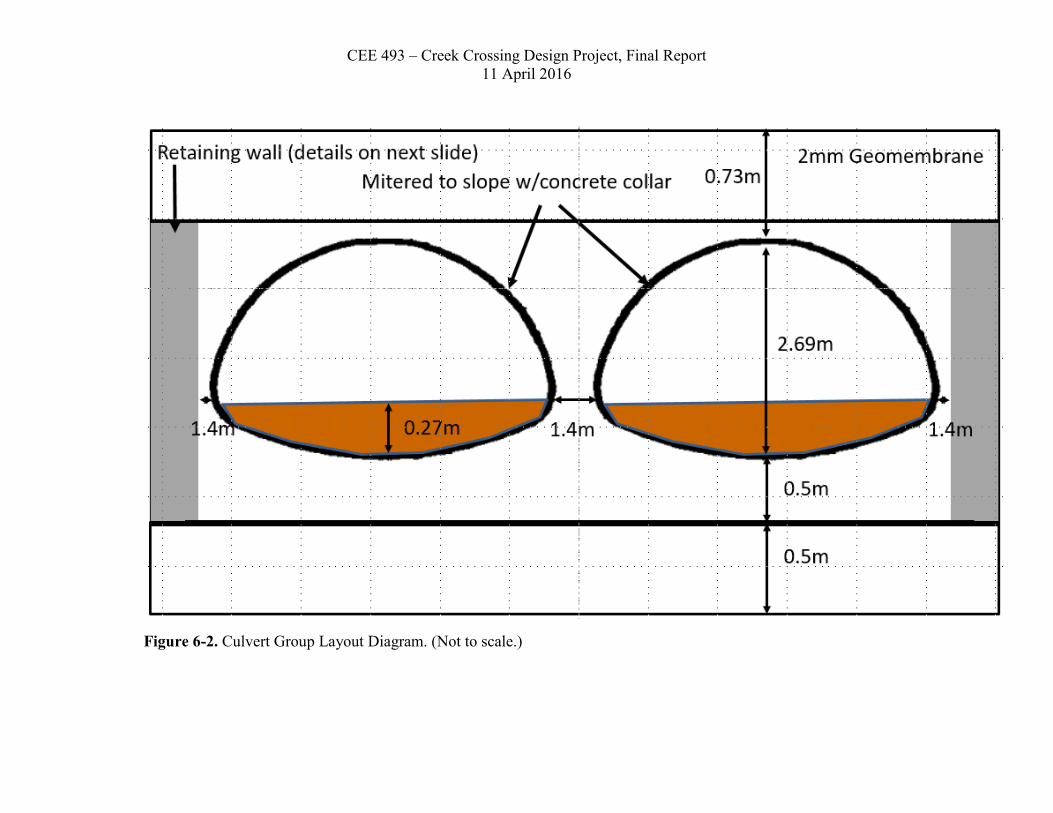
CEE 493 – Creek Crossing Design Project, Final Report
11 April 2016
Figure 6-2. Culvert Group Layout Diagram. (Not to scale.)
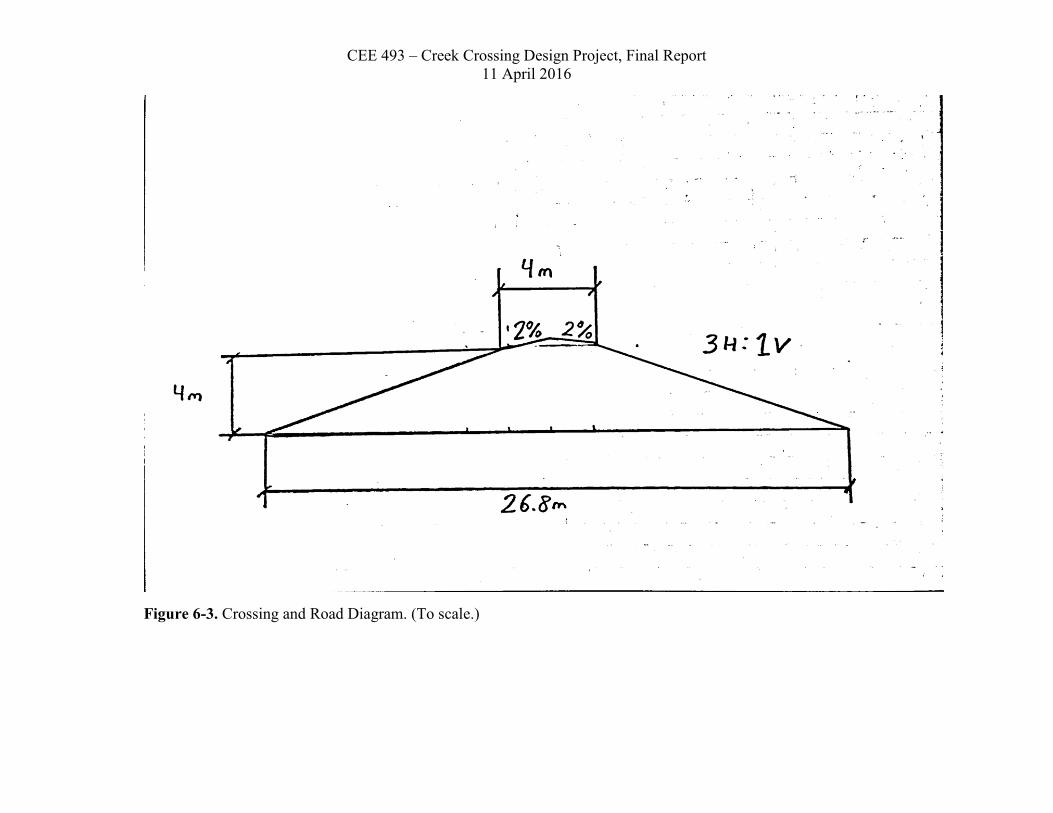
CEE 493 – Creek Crossing Design Project, Final Report
11 April 2016
Figure 6-3. Crossing and Road Diagram. (To scale.)

CEE 493 – Creek Crossing Design Project, Final Report
11 April 2016
APPENDIX No. 7: Filter Design

CEE 493 – Creek Crossing Design Project, Final Report
11 April 2016
Filter
Layer
Sieve #
or inches
Size
(mm)
Retained
Percent
%
Cumulative
percent
Pass Percentage
%
5 125 1 1 99.0
4 100 3 4 96.0
3.00 75 4 8 92.0
2.12 53 2 10 90.0
1.75 45 6 16 84.0
1.25 31.5 3 19 81.0
1 25 5 24 76.0
0.75 19 3 27 73.0
0.53 13.2 4 31 69.0
0.44 11.2 5 36 64.0
0.3125 8 4 40 60.0
0.25 6.3 6 46 54.0
No. 4 4.75 2 48 52.0
No. 6 3.35 9 57 43.0
No. 8 2.36 5 62 38.0
No. 12 1.68 9 71 29.0
No. 16 1.18 2 73 27.0
No. 20 0.85 3 76 24.0
No. 30 0.6 5 81 19.0
No. 40 0.425 2 83 17.0
No. 50 0.3 2 85 15.0
No. 60 0.25 3 88 12.0
No. 80 0.18 4 92 8.0
No. 100 0.15 2 94 6.0
No. 140 0.106 3 97 3.0
No. 200 0.075 0 97 3.0
No. 270 0.053 3 100 0.0
Table 7-1. Sieve analysis for filter design.

CEE 493 – Creek Crossing Design Project, Final Report
11 April 2016
Figure 7-1. Filter layer sieve analysis graph.
0.0
20.0
40.0
60.0
80.0
100.0
120.0
0.01 0.1 1 10 100 1000
Filter

CEE 493 – Creek Crossing Design Project, Final Report
11 April 2016
Coarse
Fraction
Sieve #
Size
(mm)
Retaine
d
Percent
%
Cumulativ
e percent
Pass
Percentag
e %
5 125 1.03 1.03 98.97
4 100 3.09 4.12 95.88
3.00 75 4.12 8.25 91.75
2.12 53 2.06 10.31 89.69
1.75 45 6.19 16.49 83.51
1.25 31.5 3.09 19.59 80.41
1 25 5.15 24.74 75.26
0.75 19 3.09 27.84 72.16
0.53 13.2 4.12 31.96 68.04
0.44 11.2 5.15 37.11 62.89
0.3125 8 4.12 41.24 58.76
0.25 6.3 6.19 47.42 52.58
No. 4 4.75 2.06 49.48 50.52
No. 6 3.35 9.28 58.76 41.24
No. 8 2.36 5.15 63.92 36.08
No. 12 1.68 9.28 73.20 26.80
No. 16 1.18 2.06 75.26 24.74
No. 20 0.85 3.09 78.35 21.65
No. 30 0.6 5.15 83.51 16.49
No. 40 0.425 2.06 85.57 14.43
No. 50 0.3 2.06 87.63 12.37
No. 60 0.25 3.09 90.72 9.28
No. 80 0.18 4.12 94.85 5.15
No. 100 0.15 2.06 96.91 3.09
No. 140 0.106 3.09 100.00 0.00
Table 7-2. Coarse fraction sieve analysis of filter layer design.

CEE 493 – Creek Crossing Design Project, Final Report
11 April 2016
Figure 7-2. Coarse fraction sieve analysis of filter layer design graph.
0.00
20.00
40.00
60.00
80.00
100.00
120.00
0.01 0.1 1 10 100 1000
Coarse
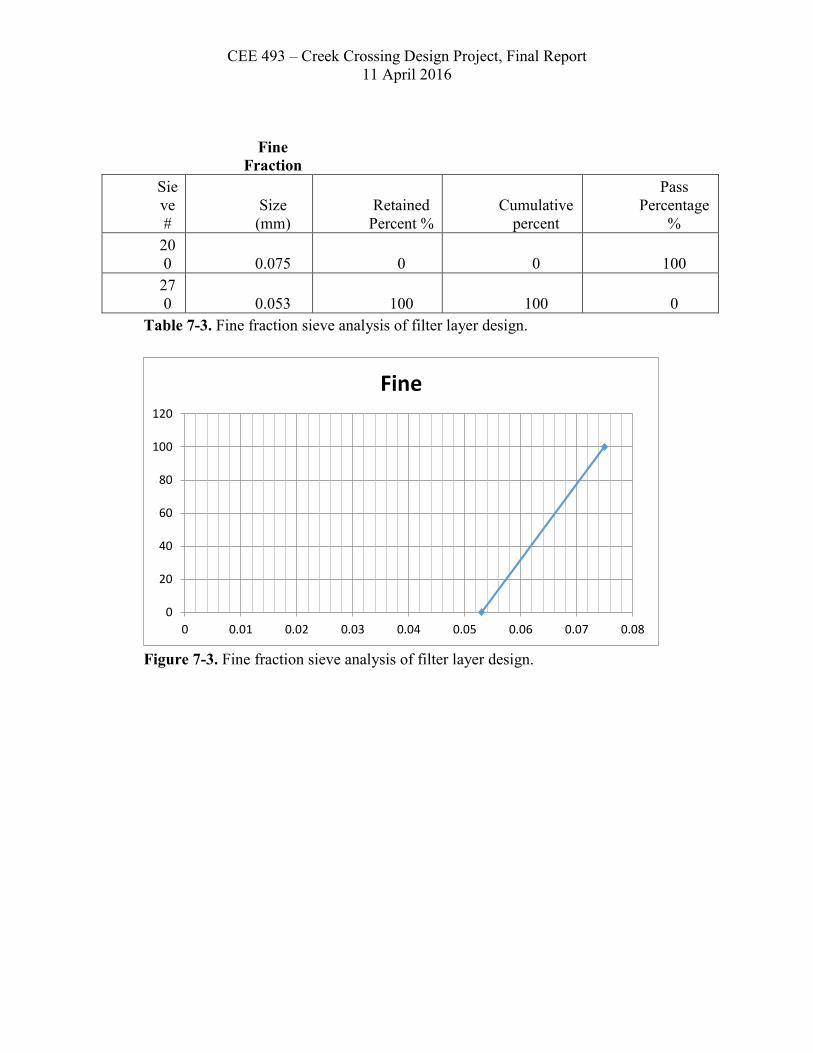
CEE 493 – Creek Crossing Design Project, Final Report
11 April 2016
Fine
Fraction
Sie
ve
#
Size
(mm)
Retained
Percent %
Cumulative
percent
Pass
Percentage
%
20
0 0.075 0 0 100
27
0 0.053 100 100 0
Table 7-3. Fine fraction sieve analysis of filter layer design.
Figure 7-3. Fine fraction sieve analysis of filter layer design.
0
20
40
60
80
100
120
0 0.01 0.02 0.03 0.04 0.05 0.06 0.07 0.08
Fine

CEE 493 – Creek Crossing Design Project, Final Report
11 April 2016
Calculations
Filter Layer Calculations
There are three formulas that govern the design of the filter layer.
𝐷15𝑐
𝐷85𝑓 < 5
𝐷15𝑐
𝐷15𝑓> 5
𝐷15𝑐
𝐷15𝑓< 40
c refers to coarse layer
f refers to fine layer
15 and 85 refer to 15% and 85% sieve passing sizes
From these graphs the following values were obtained;
D15c = 0.3mm
D15f = 0.056mm
D85f = 0.072mm
𝐷15𝑐
𝐷85𝑓 < 5 value obtained 4.17
𝐷15𝑐
𝐷15𝑓> 5 value obtained 5.36
𝐷15𝑐
𝐷15𝑓< 40 value obtained 5.36
The thickness of the filter layer must be between 150-380mm.
250mm was chosen
Toe Scour Calculations
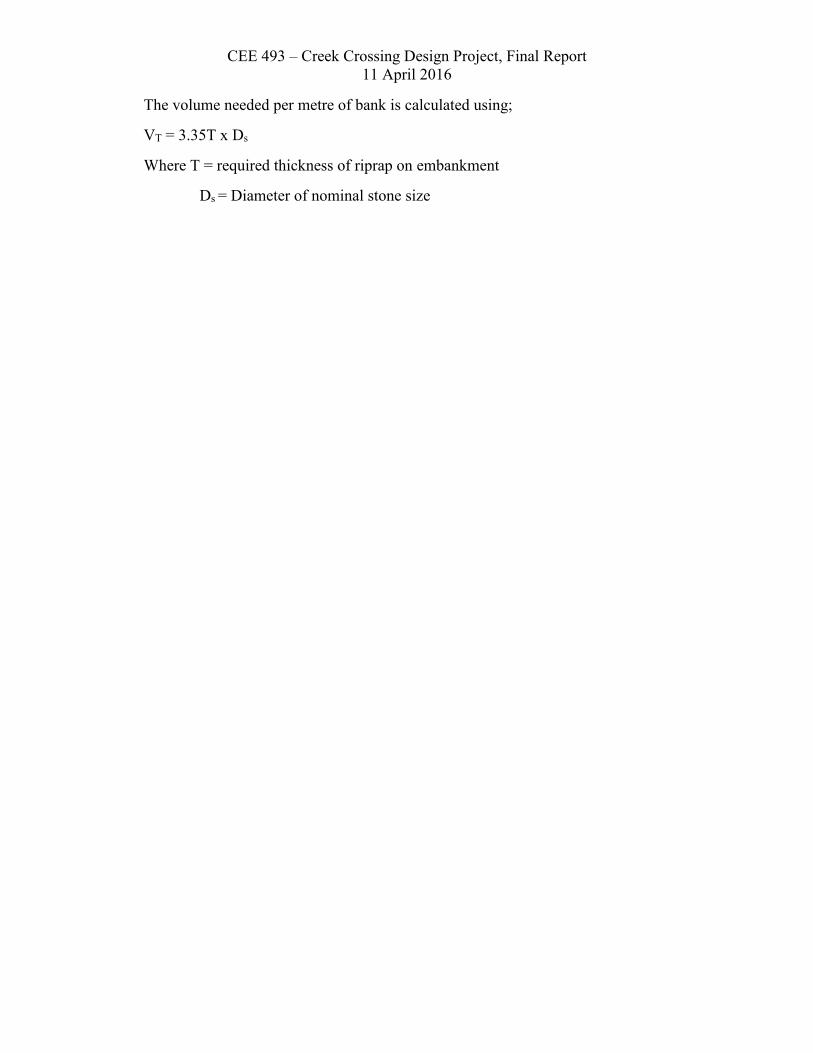
CEE 493 – Creek Crossing Design Project, Final Report
11 April 2016
The volume needed per metre of bank is calculated using;
VT = 3.35T x Ds
Where T = required thickness of riprap on embankment
Ds = Diameter of nominal stone size
CEE 493 – Creek Crossing Design Project, Final Report
11 April 2016
APPENDIX No. 8: Hydraulic Modelling Results
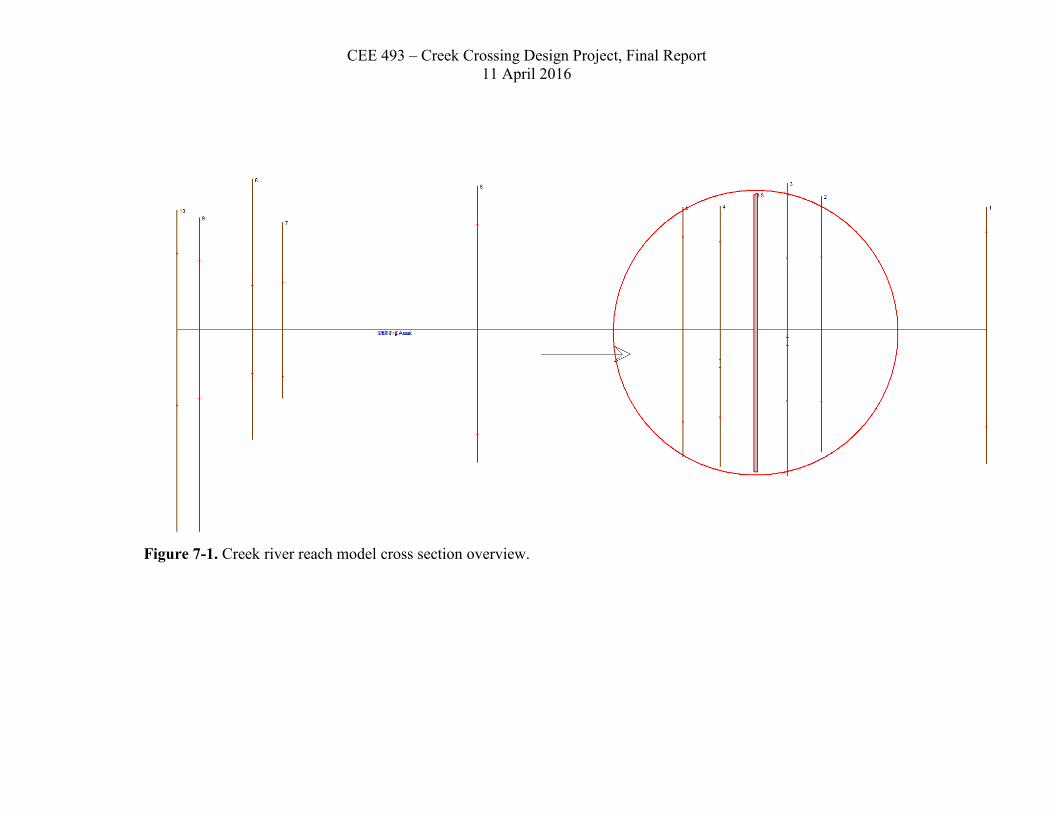
CEE 493 – Creek Crossing Design Project, Final Report
11 April 2016
Figure 7-1. Creek river reach model cross section overview.
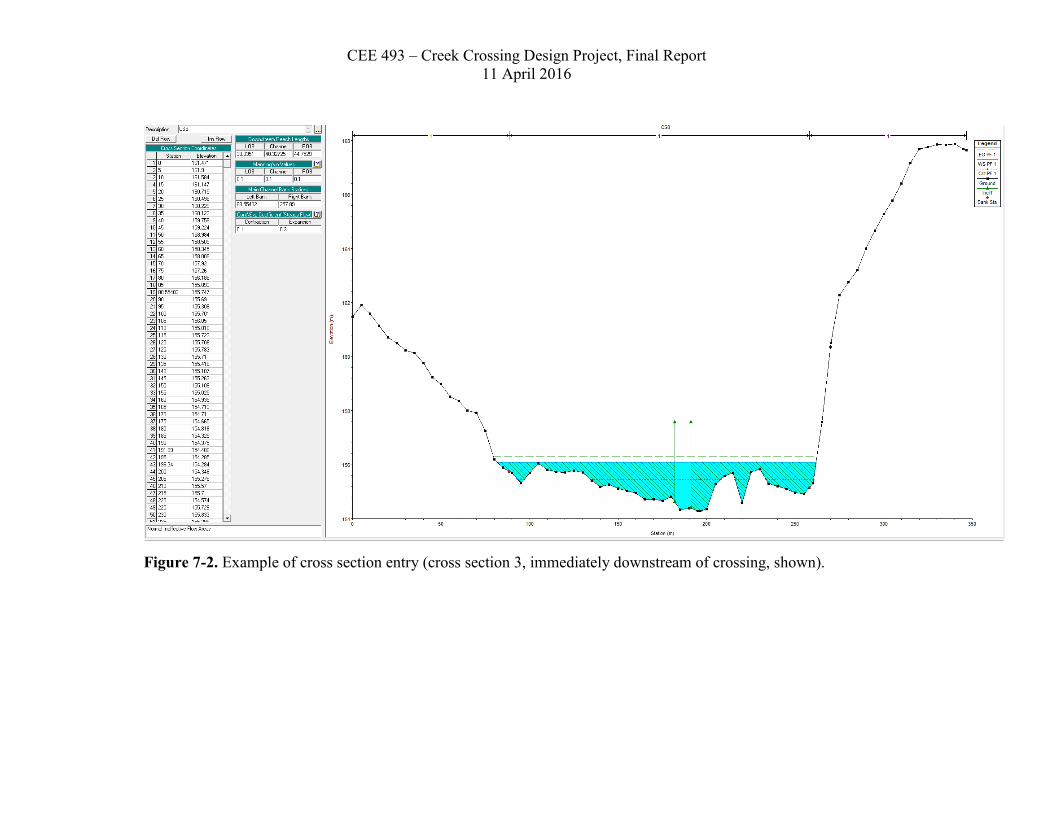
CEE 493 – Creek Crossing Design Project, Final Report
11 April 2016
Figure 7-2. Example of cross section entry (cross section 3, immediately downstream of crossing, shown).

CEE 493 – Creek Crossing Design Project, Final Report
11 April 2016
Figure 7-3. Crossing upstream side at 5-year flood stage.

CEE 493 – Creek Crossing Design Project, Final Report
11 April 2016
Figure 7-4. Crossing, downstream side at 5-year flood stage.
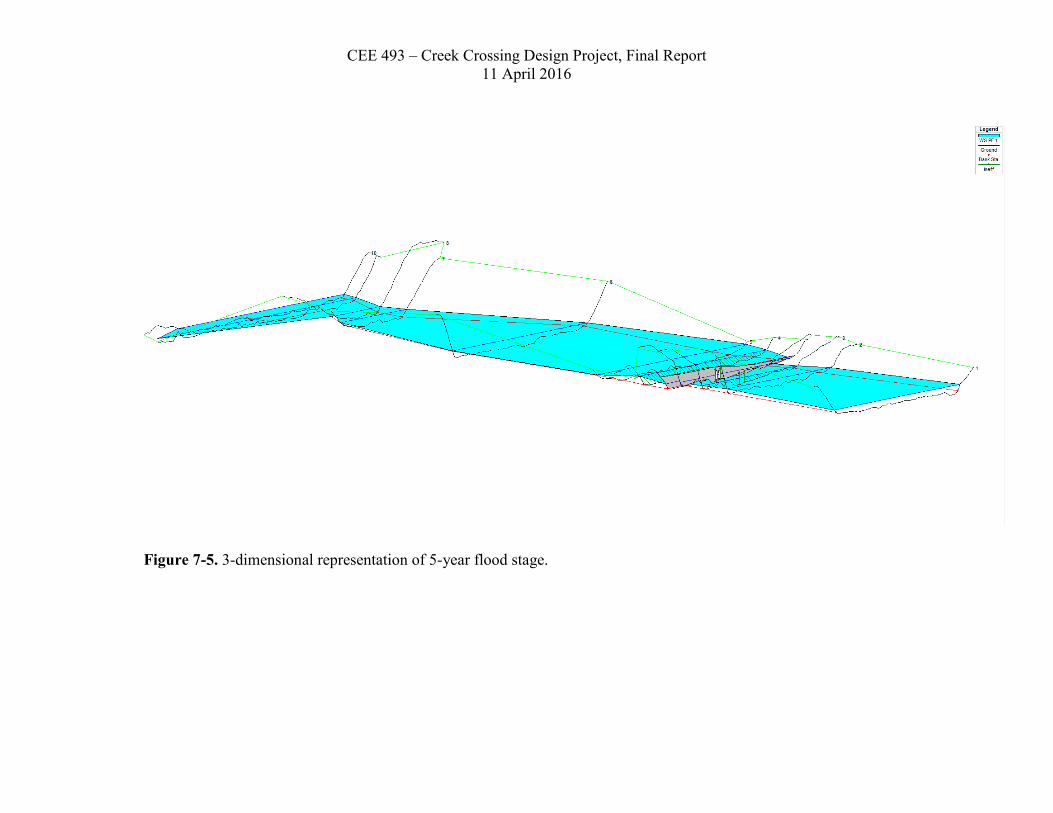
CEE 493 – Creek Crossing Design Project, Final Report
11 April 2016
Figure 7-5. 3-dimensional representation of 5-year flood stage.

CEE 493 – Creek Crossing Design Project, Final Report
11 April 2016
Figure 7-6. Crossing, upstream side at 10-year flood stage.

CEE 493 – Creek Crossing Design Project, Final Report
11 April 2016
Figure 7-7. Crossing, downstream side at 10-year flood stage.

CEE 493 – Creek Crossing Design Project, Final Report
11 April 2016
Figure 7-8. 3-dimensional representation of wash over at 10-year flood stage.

CEE 493 – Creek Crossing Design Project, Final Report
11 April 2016
APPENDIX No. 9: Cost Estimates

CEE 493 – Creek Crossing Design Project, Final Report
11 April 2016
Line Number Description Qty Unit Material Labor Equipment Total
01 45 23.50 5550 Technician for inspection, per day, earthwork 2 Ea. $640.00 $640.00
Quality Control Subtotal $640.00
01 54 16.50 0100 All-terrain forklift, 45' lift, 35' reach, 9000 lb.
capacity 3.00 Week $309.00 $5,400.00 $7,200.00 $309.00
01 54 36.50 0020 Dozer, loader, backhoe, excav., grader, paver,
roller, 70 to 150 H.P. 1.00 Ea. $70.50 $126.00 $196.50
01 54 36.50 0100 Above 150 HP 2 Ea. $188.00 $566.00 $754.00
01 54 39.70 0010 Small Tools % Total 0.50%
Construction Aids Subtotal $1,259.50
01 71 23.13 1400 Crew for roadway layout, 4 person crew 5 Day $7,500.00 $392.50 $7,892.50
01 71 23.19 0010 Surveyor Stakes
01 71 23.19 0100 2" x 2" x 18" long 2 C $148.00 $148.00
01 71 23.19 0150 2" x 2" x 24" long 2 C $260.00 $ 260.00
Examination and Preparation
Subtotal $8,300.50
02 32 13.10 0020 Borings, initial field stake out and
determination of elevations 1 Day $705.00 $78.50 $783.50
02 32 13.10 0100 Drawings showing boring details 1 Total $310.00 $310.00
02 32 13.10 0200 Report and recommendations from P.E. 1 Total $720.00 $720.00
02 32 13.10 0300 Mobilization and demobilization 1 Total $209.00 $246.00 $455.00
Geotechnical Investigations
Subtotal $2,268.50
31 23 16 Excavation (maybe)
31 23 23.17 0011 General Fill by dozer, no compaction 1100 L.C.Y $561.00 $1,364.00 $1,925.00
Crew B-10B 1 Equip. Oper., .5 Laborer, 1 Dozer, 200 H.P. 1 Day $1,755.80
31 23 23.20 4272 20 C.Y. truck 20 mi. wait/Ld./Uld., 35MPH ave,
cycle 40 miles 1100 L.C.Y $3,102.00 $7,260.00 $10,362.00
Crew B-34D 1 Truck Driver (heavy), 1 Truck tractor, 6x4,
380 H.P., 1 Dump Trailer, 20 C.Y. 1 Day $942.40
31 23 23.23 5050 Riding, vibrating roller, 6'' lifts, 2 passes 1100 E.C.Y $143.00 $143.00 $286.00

CEE 493 – Creek Crossing Design Project, Final Report
11 April 2016
Crew B-10Y 1 Equip. Oper. (med.), .5 Laborer, 1 Dozer. 105
H.P. 2 Day $2,055.20
Gran A Fill Gran A Fill 1100 B.C.Y $23,650.00 $23,650.00
Excavation and Fill Subtotal $14,628.20
Table 9-1. Biennial cost breakdown of replacement of existing crossing.
Material Labor Equipment Total
Estimate Subtotal
$
24,367.00 $
22,246.71 $
17,376.00 $
63,989.71
Gen. Requirements $
3,655.05 $
3,337.01 $
2,606.40 $
9,598.46 Gen. Requirements
0% Sales Tax 0.00 0.00 0.00 0.00 Sales Tax
Subtotal $
28,022.05 $
25,583.71 $
19,982.40 $
73,588.16 Subtotal
10% GC O & P $
2,802.21 $
2,558.37 $
1,998.24 $
7,358.82 GC O & P
Subtotal $
30,824.26 $
28,142.08 $
21,980.64 $
80,946.98 Subtotal
5% Contingency $
1,541.21 $
1,407.10 $
1,099.03 $
4,047.35 Contingency
Subtotal $
32,365.47 $
29,549.19 $
23,079.67 $
84,994.33 Subtotal
1% Bond $
323.65 $
295.49 $
230.80 $
849.94 Bond
Subtotal $
32,689.12 $
29,844.68 $
23,310.47 $
85,844.27 Subtotal
Location Adjustment 1.23 0.91 1.00 1.07 Location Adjustment
Grand Total $
40,174.93 $
27,069.12 $
23,310.47 $
90,554.52 Grand Total
Table 9-2. Biennial cost total of replacement of existing crossing.

CEE 493 – Creek Crossing Design Project, Final Report
11 April 2016
Line Number Description Qty Unit Material Labor Equipment Total
01 45 23.50 5550
Technician for inspection, per day, earthwork 2 Ea. $640.00 $640.00
Quality Control Subtotal $640.00
01 54 16.50 0100
All-terrain forklift, 45' lift, 35' reach, 9000 lb. capacity
3 Week $309.00 $5,400.00 $7,200.00 $12,909.00
01 54 36.50 0020
Dozer, loader, backhoe, excav., grader, paver, roller, 70 to 150 H.P.
1 Ea. $70.50 $126.00 $196.50
01 54 36.50 0100
Above 150 HP 3 Ea. $282.00 $849.00 $1,131.00
01 54 39.70 0010
Small Tools % Total 0.50%
Construction Aids
Subtotal $14,236.50
01 71 23.13 1400
Crew for roadway layout, 4 person crew 5 Day $7,500.00 $392.50 $7,892.50
01 71 23.19 0010
Surveyor Stakes
01 71 23.19 0100
2" x 2" x 18" long 2 C $148.00 $148.00
01 71 23.19 0150
2" x 2" x 24" long 2 C $260.00 $260.00
Examination and Preparation
Subtotal $8,300.50
02 32 13.10 0020
Borings, initial field stake out and determination of elevations
1 Day $705.00 $78.50 $783.50
02 32 13.10 0100
Drawings showing boring details 1 Total $310.00 $310.00
02 32 13.10 0200
Report and recommendations from P.E. 1 Total $720.00 $720.00
02 32 13.10 0300
Mobilization and demobilization 1 Total $209.00 $246.00 $455.00
Geotechnical Investigations
Subtotal $2,268.50

CEE 493 – Creek Crossing Design Project, Final Report
11 April 2016
31 23 16 Excavation
(maybe)
31 23 23.17 0011
General Fill by dozer, no compaction 7200 L.C.Y $3,672.00 $8,928.00 $12,600.00
Crew B-10B 1 Equip. Oper., .5 Laborer, 1 Dozer, 200 H.P. 7 Day $12,290.60 $12,290.60
31 23 23.20 4272
20 C.Y. truck 20 mi. wait/Ld./Uld., 35MPH ave, cycle 40 miles
7200 L.C.Y $20,304.00 $47,520.00 $67,824.00
Crew B-34D 1 Truck Driver (heavy), 1 Truck tractor, 6x4,
380 H.P., 1 Dump Trailer, 20 C.Y. 1 Day $942.40 $942.40
31 23 23.23 5050
Riding, vibrating roller, 6'' lifts, 2 passes 7200 E.C.Y $936.00 $936.00 $1,872.00
Crew B-10Y 1 Equip. Oper. (med.), .5 Laborer, 1 Dozer. 105
H.P. 2 Day $2,055.20 $2,055.20
Gran A Fill Gran A Fill 7200 B.C.Y $154,800.00 $154,800.00
Excavation and Fill
Subtotal $252,384.20
31 37 13.10 0200
Riprap and Rock Lining, Machine Placed for slope protection, 18" thickness min.
2000 S.Y $39,500.00 $80,000.00 $26,300.00 $145,800.00
Crew B-13 1 Labor Foreman (outside), 4 Laborers, 1 Equip. Oper. (crane), 1 Equip. Oper. Oiler
1 Hyd. Crane, 25 Ton 2 Day $5,659.20 $5,659.20
Riprap Subtotal $151,459.20
Crew B-13 1 Labor Foreman (outside), 4 Laborers, 1 Equip. Oper. (crane), 1 Equip. Oper. Oiler
1 Hyd. Crane, 25 Ton 2 Day $
Archpipes Custom Archpipes $56,052.86 $56,052.86
Culverts Subtotal $ 56,052.86
31 32 19.16 1500
Geotextile fabric, Heavy Duty, 600 lb. tensile strength
2000 S.Y $3,700.00 $440.00 $4,140.00
Crew 2 Clab Common Laborer 12 Hour $421.20 $421.20
Soil Stabilization
Subtotal $4,561.20

CEE 493 – Creek Crossing Design Project, Final Report
11 April 2016
35 31 16.19 0210
Steel sheeting, with 4' x 4' x 8" concrete deadmen, @ 10' O.C. 12' high, shore driven
90 L.F $ 9,090.00 $9,450.00 $11,520.00 $30,060.00
Pump $13,400.00 $13,400.00
Cofferdam Subtotal $43,460.00
03 31 05.35 0300
Concrete Ready Mix, 4000 psi 60 C.Y $6,183.60 $6,183.60
Common Laborer 24 Hour $842.40 $842.40
Retaining Wall Subtotal $7,026.00
Table 9-3. Cost estimate breakdown of proposed design.
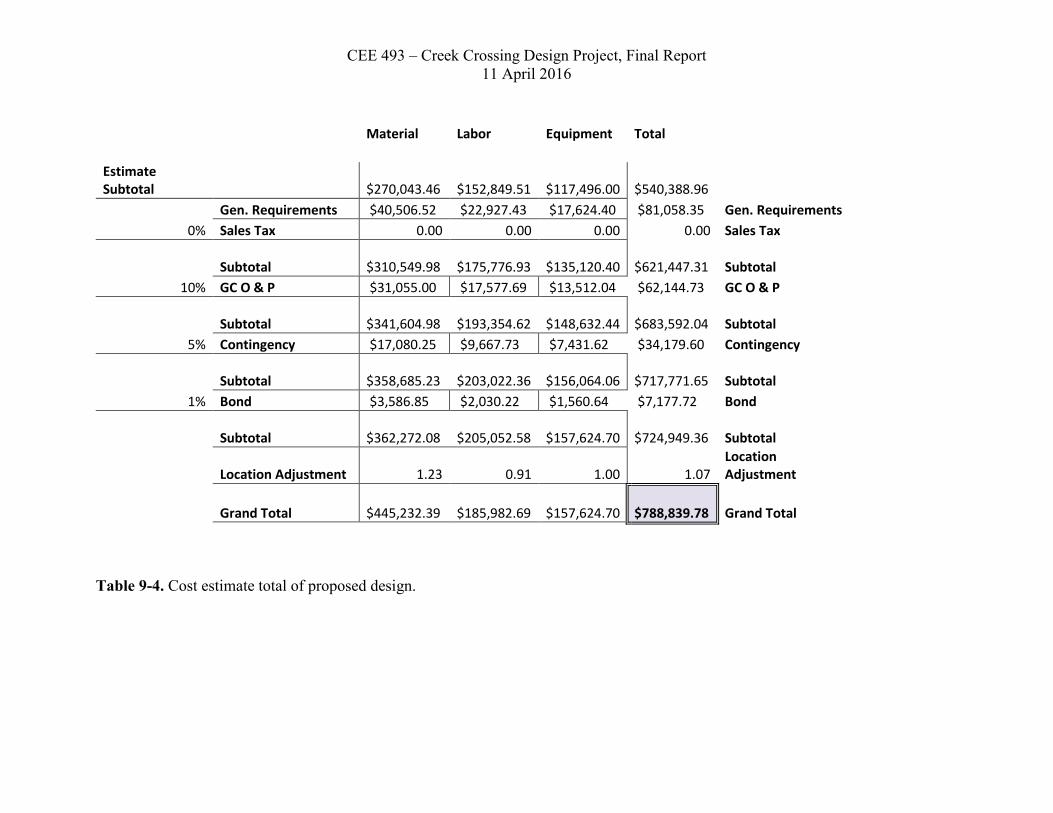
CEE 493 – Creek Crossing Design Project, Final Report
11 April 2016
Material Labor Equipment Total
Estimate Subtotal
$270,043.46
$152,849.51
$117,496.00
$540,388.96
Gen. Requirements $40,506.52 $22,927.43 $17,624.40 $81,058.35 Gen. Requirements
0% Sales Tax 0.00 0.00 0.00 0.00 Sales Tax
Subtotal $310,549.98
$175,776.93
$135,120.40
$621,447.31 Subtotal
10% GC O & P $31,055.00 $17,577.69 $13,512.04 $62,144.73 GC O & P
Subtotal $341,604.98
$193,354.62
$148,632.44
$683,592.04 Subtotal
5% Contingency $17,080.25 $9,667.73 $7,431.62 $34,179.60 Contingency
Subtotal $358,685.23
$203,022.36
$156,064.06
$717,771.65 Subtotal
1% Bond $3,586.85 $2,030.22 $1,560.64 $7,177.72 Bond
Subtotal $362,272.08
$205,052.58
$157,624.70
$724,949.36 Subtotal
Location Adjustment 1.23 0.91 1.00 1.07 Location Adjustment
Grand Total $445,232.39
$185,982.69
$157,624.70
$788,839.78 Grand Total
Table 9-4. Cost estimate total of proposed design.