Design of The University of Akron's 2015 FSAE Electric ...
57
e University of Akron IdeaExchange@UAkron Honors Research Projects e Dr. Gary B. and Pamela S. Williams Honors College Spring 2015 Design of e University of Akron's 2015 FSAE Electric Vehicle Braking System Nicholas D. Galbincea University of Akron Main Campus, [email protected] Please take a moment to share how this work helps you through this survey. Your feedback will be important as we plan further development of our repository. Follow this and additional works at: hp://ideaexchange.uakron.edu/honors_research_projects Part of the Automotive Engineering Commons , Heat Transfer, Combustion Commons , and the Materials Science and Engineering Commons is Honors Research Project is brought to you for free and open access by e Dr. Gary B. and Pamela S. Williams Honors College at IdeaExchange@UAkron, the institutional repository of e University of Akron in Akron, Ohio, USA. It has been accepted for inclusion in Honors Research Projects by an authorized administrator of IdeaExchange@UAkron. For more information, please contact [email protected], [email protected]. Recommended Citation Galbincea, Nicholas D., "Design of e University of Akron's 2015 FSAE Electric Vehicle Braking System" (2015). Honors Research Projects. 27. hp://ideaexchange.uakron.edu/honors_research_projects/27
Transcript of Design of The University of Akron's 2015 FSAE Electric ...
The University of AkronIdeaExchange@UAkron
Honors Research Projects The Dr. Gary B. and Pamela S. Williams HonorsCollege
Spring 2015
Design of The University of Akron's 2015 FSAEElectric Vehicle Braking SystemNicholas D. GalbinceaUniversity of Akron Main Campus, [email protected]
Please take a moment to share how this work helps you through this survey. Your feedback will beimportant as we plan further development of our repository.Follow this and additional works at: http://ideaexchange.uakron.edu/honors_research_projects
Part of the Automotive Engineering Commons, Heat Transfer, Combustion Commons, and theMaterials Science and Engineering Commons
This Honors Research Project is brought to you for free and open access by The Dr. Gary B. and Pamela S. WilliamsHonors College at IdeaExchange@UAkron, the institutional repository of The University of Akron in Akron, Ohio,USA. It has been accepted for inclusion in Honors Research Projects by an authorized administrator ofIdeaExchange@UAkron. For more information, please contact [email protected], [email protected].
Recommended CitationGalbincea, Nicholas D., "Design of The University of Akron's 2015 FSAE Electric Vehicle Braking System" (2015).Honors Research Projects. 27.http://ideaexchange.uakron.edu/honors_research_projects/27

Design of the 2015University of Akron’sFSAE Electric Vehicle
Braking System
By: Nicholas D. Galbincea

2 | P a g e
Abstract
The following report encompasses the design of the 2015 University of Akron’s FSAEformula electric braking system. The system is one based on hydraulic braking and designed fora one man performance racing vehicle. The objective of the system is to convert the kineticenergy of the vehicle into thermal energy, allowing the vehicle to decelerate optimally andsafely. The design includes three major categories: calculation and evaluation of the hydraulicsystem in order to select calipers and master cylinders, the design of the pedal box, and thedesign of the rotors.
The results and findings of the proceeding report rendered a symmetrical front and rearbraking system. The Wilwood Single Dynalite two piston floating caliper and the 77-Series Tiltonmaster cylinders with a 1 inch bore were selected for the system. An optimized pedal box wasdesigned consisting of two pedals, (gas and brake), eight mounting tabs for the two pedals andmaster cylinders, and two electrical sensor supports (one for the throttle sensor and the otherfor the emergency stop switch). The pedal box was optimized for minimal mass and satisfiedthe design criteria (later defined in the text). Lastly, custom rotors were designed based on theoptimal material choice, analyzing thermal effects and considering cost.

3 | P a g e
Acknowledgments
I would like to thank Dr. Siamak Farhad for being my primary advisor for this designproject and Dr. Richard Gross for being my secondary advisor for this project and making thisexperience challenging and enjoyable.
A special thanks to Mike, Bill and Dale in the machine shop for all of their help andadvice in fabricating the pedal box.
I would like to dedicate this project to my family, my father David, mother Annette andsister Hannah.

4 | P a g e
Table of ContentsAbstract ........................................................................................................................................................2
Acknowledgments ........................................................................................................................................ 3
Introduction..................................................................................................................................................5
Braking System Theory, Calculation & Design ............................................................................................5
Design Objective and Overview ................................................................................................................5
Theory for Design...................................................................................................................................... 6
Results from Calculations & Selection of Components ............................................................................8
Pedal Box Design ........................................................................................................................................15
Design Criteria.........................................................................................................................................15
Material Selection...................................................................................................................................16
Initial Design............................................................................................................................................18
Optimization & Weight Reduction..........................................................................................................18
Finite Element Analysis .......................................................................................................................23
FEA Verification...................................................................................................................................28
Final Design .............................................................................................................................................30
Rotor Design ...............................................................................................................................................31
Design Criteria.........................................................................................................................................31
Material Selection...................................................................................................................................31
COMSOL Simulations: Rotor Sensitivity Analysis ................................................................................33
Rotor Geometry ......................................................................................................................................36
COMSOL Simulation: Actual Trial............................................................................................................38
COMSOL Actual Trial Verification .......................................................................................................39
Manufacturing ............................................................................................................................................41
Drawings .................................................................................................................................................42
Conclusion ..................................................................................................................................................54
References ..................................................................................................................................................56

5 | P a g e
Introduction
The braking system was designed as a hydraulic system for a one man performanceracing vehicle. Generic parameters of the vehicle that were used in the system design were atotal vehicle weight, including the driver, of 625 and a maximum velocity of 60 ℎ.Further details of parameters will be defined in the report corresponding to the braking system.
The three main categories/ components designed and analyzed for this system are thefollowing: calculation and evaluation of the hydraulic system in order to select calipers andmaster cylinders, the design of the pedal box and the design of the rotors. For the firstcomponent, the overall functionality and free variables of the braking system will be analyzedfor optimum caliper, master cylinder and rotor size selection. The second main component ofthe design encompasses the pedal box design. This design includes the gas pedal, brake pedaland master cylinder orientation as well as the throttle senor and emergency stop placementand orientation. The third and final main component involves the design of the rotors. The mainfocus on the design of the rotors was material selection as well as the geometry of the rotors.
The constraints and limitations based on the competition rules of these components willbe defined later in each of their sections. The objective of these major component designs wasto minimize the weight for the lightest design possible while at the same time designing to all ofthe mechanical and thermal conditions that the system would be subjected to. In the pedal boxand rotor design sections the optimization processes will be discussed as well as the finiteelement analysis that support the final design. In the final sections of the report themanufacturing of the pedal box and rotors will be discussed.
Braking System Theory, Calculation & Design
Design Objective and Overview
The main objective of the braking system is to convert the kinetic energy of the vehicleinto thermal energy, thus allowing the vehicle to decelerate. The braking system was designedas a hydraulic system with two master cylinders, one for the braking of the front two tires andone for braking of the rear two tires. Attached to each master cylinder are two floating calipers,one located at each of the tires for a total of four calipers for the system, as well as four rotorsor brake disks.
The flow of the braking system is as follows: the driver exerts a force on the brake pedal,the brake pedal channels that force to the master cylinders, thus displacing the braking fluid inthe master cylinders. The displaced fluid then exerts a pressure on each of the calipers allowing

6 | P a g e
the caliper pistons to exert a clamping force on the rotors. Therefore, the input of the system isthe driver’s applied foot force and the output is the clamping force of the calipers exerted onthe rotors.
Based on the competition rules and conditions the designed braking system must beable to lock all four tires of the vehicle completely during an emergency stop braking scenario.What this translates to physically is that the moment generated from the caliper force placedon the rotor must be equal to or greater than the moment the tire exerts on the surface of theroad.
Therefore for this braking hydraulic system design the main objective is to design thesystem so that the driver has to place a substantial, but not excessive force on the brake pedalin order to completely lock the tires of the vehicle. The system was designed for this foot forceto approximately be 150 lbs. This value was decided upon by referencing other design teamsand Dr. Richard Gross.
Theory for Design
During braking, under the condition the vehicle is moving in the direction of its front tires, thegreatest deceleration rate will translate as a weight transfer from the rear tires to the front tires.Therefore, it is necessary to calculate this weight transfer based on the average coefficient of frictionbetween the tires and the road , the weight of the vehicle , the height of the center of mass abovethe road , and the wheelbase . This weight transfer will be denoted as and calculated [1]:=
From this weight transfer calculation the normal force exerted on the front two tires ( ) andthe rear two tires ( ) are calculated [1]: = +
= −Where & are the lengths of the front and rear axles to the center of mass of the vehicle
[1].
Neglecting the weight on the tires, wheels and rotors and taking a summation of momentsabout the center of rotation of one of the tires, it is observed for the front and rear systems [1]:Σ = 0
(1)
(2)
(3)

7 | P a g e
Front: − = 0Rear: − = 0
Where, & are the sum of the friction forces generated from the front two calipers andrear two calipers, & are the mean radii of these friction forces, and & are the radii ofthe front and rear tires [1].
The total friction force of the calipers for the front and rear can be written in terms of thenormal force or “clamping force” that the calipers exert on the rotor multiplied by the brake padcoefficient of friction [1]: ==
The normal forces of each set of calipers, both front and rear, can be written in terms of thepressure in each brake line and the area of each caliper piston [1]:= (# )= (# )Thus, the pressure in both the front and rear braking lines can be written [1]:= # ∗= # ∗
The forces on both master cylinders can then be expressed from the pressure in the front andrear lines multiplied by the bore area of each master cylinder [1]:==
Taking a moment about the braking pedal, the foot force applied to the pedal can be written interms of the forces from the master cylinders [1]:= ( + )
Where is the distance from the foot force to the pivot point and is the distance from wherethe master cylinder mounts to the brake pedal to the pivot point [1].
(4)(5)
(6)
(12)
(7)
(8)
(9)
(10)
(11)
(13)
(14)

8 | P a g e
Results from Calculations & Selection of Components
The above theory and equations were implemented in the following calculations and the results& selection of the calipers, brake pads, rotor size and master cylinders are as follows:
Based on the calculations from the teams lead suspension engineer the following values of, & were used: = 1.8, = 11 , = 61 , = 29 & = 32From these values the force transferred was determined:= 203The normal forces applied to the front and rear tires during breaking:= 531= 94
From the suspension engineer the radii of the tires for both the front and rear were givenas 9.5 . Given the hollow rim design, where the rotor sits inside of the rim with the caliper mounted,the rotor’s diameter was restricted. The inner diameter of the rim was approximated to 12 and thecaliper clearance was approximated to be 1.5 , (given a final selection has not been made yet). Aftermodeling the rotor, caliper and hub in SolidWorks the largest rotor diameter that could fit the assemblywas 8.25 . This was diameter used, as the largest rotor diameter would produce the greatest torquefrom the caliper, for a lower line pressure, during braking. Thus the friction forces for the front and rearcalipers could be solved for:
= = (1.8)(531 )(9.5 )3.5 = 2594.3= = (1.8)(94 )(9.5 )3.5 = 459.3

9 | P a g e
At this stage in the design, it was necessary to select a caliper and brake pad. The number ofpistons in the caliper and the coefficient of friction of the brake pads were the free variables for theseselections. After researching on the internet possible caliper choices and drafting a caliper selectionmatrix (see below) based on number of pistons, weight, size and cost, the Wilwood Billet Dynalite Singlecaliper was selected [2] & [3].
Figure 1: Comparative Caliper Matrix [2] & [3]

10 | P a g e
After selecting a Wilwood caliper, a Wilwood brake pad was chosen that would fit the style andsize of the caliper. The Polymatrix Compund A Wilwood brake pad was chosen for its overall highcoefficient of friction. Based off of the company’s performance chart (see below) between temperaturesof 100℉& 700℉ the average coefficient of friction was approximated as 0.6215 [2].
Figure 2: Wilwood Brake Pad Performance Graph [4]

11 | P a g e
The normal forces of the calipers then could then be solved:= = 4218.4= = 746.8
The pressure in both the front and rear braking lines could be solved:
= # ∗ = 4218.44 × (2.4 ) = 439= # ∗ = 746.84 × (2.4 ) = 78At this step in the design is was necessary to select a set of master cylinders. The bore area of
the master cylinder is the free variable in this selection. The bore area of the master cylinder, in additionto the pressure in each of the lines, dictate the total applied foot force needed to lock the tires duringbraking. After researching on the internet and drafting a master cylinder selection matrix, (see below),the Tilton 77-Series master cylinders with a 1”diameter bore were selected for both the front and rearsystems [4], [5], [6] & [7]. This larger bore size was chosen because the selection rendered an appliedfoot force of just under 150 , which was the target applied force. Have to minimal of an applied footforce would cause the braking system to be very sensitive, thus making braking and overall operationnot optimal for the driver.

12 | P a g e
Figure 3: Master Cylinder Selection Matrix [5], [6], [7] & [8]
Master CylinderComponent Matrix Part #
Price-each
Strokein. Bore in.
Length (end of rod tocenter of bearing) MC Area
Tilton77-Series 395-340 1.1 1 5.66 0.78577-Series 395-340 1.1 0.9375 5.66 0.69077-Series 395-340 1.1 0.8750 5.66 0.60177-Series 395-340 1.1 0.8125 5.66 0.51877-Series 395-340 1.1 0.7500 5.66 0.44277-Series 395-340 1.1 0.7000 5.66 0.38577-Series 395-340 1.1 0.6250 5.66 0.307
Brembo 0.000BRE-XA3G144 827.45 .906 .669 0.352BRE-XA3G145 827.45 .907 .75 0.442BRE-XA2L2A8 827.45 .908 .886 0.617BRE-XA2L2A9 827.45 .909 .789 0.489
AP Racing 0.000CP7855-88PRTE 291.54? 1.1 .5 6.13 0.196CP7855-89PRTE 291.54? 1.1 .59 6.13 0.273CP7855-90PRTE 291.54? 1.1 .625 6.13 0.307CP7855-905PRTE 291.54? 1.1 .66 6.13 0.342CP7855-91PRTE 291.54? 1.1 .7 6.13 0.385CP7855-92PRTE 291.54? 1.1 .75 6.13 0.442CP7855-93PRTE 291.54? 1.1 0.8125 6.13 0.518CP7855-94PRTE 291.54? 1.1 0.8750 6.13 0.601CP7855-95PRTE 291.54? 1.1 0.9375 6.13 0.690CP7855-96PRTE 291.54? 1.1 1.0000 6.13 0.785
Alcon USA 0.000MAR52xxHM161MBB 865.19 1 6.34 0.785Charted DWG 865.19 .9375 6.34 0.690Charted DWG 865.19 .875 6.34 0.601Charted DWG 669.97 .812 6.34 0.518Charted DWG 669.97 .85 6.34 0.567Charted DWG 669.97 .7 6.34 0.385Charted DWG 669.97 .625 6.34 0.307

13 | P a g e
In order to calculate the applied foot force, the last free variable that needed to be selected wasthe mechanical advantage of the pedal, from Equ.14, / . This factor is determined upon how themaster cylinders are mounted to the pedal. This leads to the pedal box geometry design. The mainconstraints of this design were prescribed from the team’s lead frame engineer, who requested that thesurface area space of the pedal box be reduced as much as possible. Due to the allotted width and forthe comfort of the driver, the frame engineer requested that the width of the pedal box be no morethan 10 . Further details of the pedal box design will be discussed later in the text. Based on the frameengineer’s requests it was decided that the most optimal way to mount the master cylinders would beat an angle. A kinematic diagram was drafted of the set up (see below) where the lengths aredenoted as well as , the distance between the pivot point of the pedal and the master cylinders, , thedistance the pedal or foot of driver travels and , the original master cylinder stroke and thedisplaced master cylinder stroke.
Applying the Law of Cosines and Pythagorean Theorem to the above diagram the followingequations can be derived: = + − 2 cos= += + − 2 cos( )
(15)
(16)
(17)
Figure 4: Kinematic Diagram of Brake Pedal and Master Cylinders

14 | P a g e
As recommended by Dr. Richard Gross, the value of the displacement of each caliper pistonshould approximately be 0.03125 . Therefore, the only remaining free variables in the pedal boxgeometry are lengths , .
After running a parametric sweep on these variables to find the optimal combination of thethree, the following lengths were selected: = 8.5= 3.54= 6.72Substituting these values into Equ.15, 16 & 17 rendered:= 0.3= 7.77= 7.39= 0.11 6.3= 1.46 83.65
Based upon the selected pedal box geometry and master cylinder setup the mechanicaladvantage and applied foot force can be solved for:= 0.3412= 139Based on the above results and data, the torque generated from each front and rear caliper are:
= 4538 −= 806 −

15 | P a g e
Pedal Box Design
Design Criteria
The constraints of the pedal box design are as follows:
- The pedal box needed to be designed around the geometry constraints set in the resultsfrom the braking system calculations. That is the master cylinder mount height and thedistance between the master cylinder pivot and the brake pedal are fixed.
- The team’s frame engineer also asked that the total width be no more than 10 .- The length of both the gas and the brake pedal need to be approximately the length of a
human foot (~ 9.5 ).- The competition rules designate that the brake pedal must be able to withstand a force
of 2000 .o Due to this constraint the material selection of the brake pedal and the overall pedal
box must be strong, stiff and have high toughness.
The objective of the pedal box design was to satisfy all of the constraints mentioned above andoptimize for minimal weight.
A recommendation from the team members was that the pedal box be easily adjustable in thelateral direction, that is be comfortable for a taller driver as well as a smaller driver. Thus, the first stagein the design was this adjustment. The first draft was to have a tension line with retractable shafts in thebase plate of the pedal box. That is the driver would push a button or grip a handle causing tension inthe line that the shafts, which connected the pedal box to the floor of the vehicle, would retract and thepedal box could be slide into a new set of holes making it closer or further away from the driver. It wasdecided that this design would be too time consuming and a more robust design was desired. Thesecond draft was similar to the first, however, omitted the tension lines and quick release pins would beused in place and the pedal box could be slide and adjusted just as before. However, this design wasdismissed as an even more rigid design would be favorable. The third and chosen design, was simplyadjustable pedal heads. Where the pedal would have extended mounts to accommodate additionalholes and quick release pins would be used for easy adjustment.
The rest of the design encompassed mounting both pedals, mounting the master cylinders andmounting the throttle sensor and emergency stop switch to the pedal box.
The pedal box was designed with a single base plate; that is, all of the mounts would be fixed tothis single plate. The brake pedal and master cylinder mounts were designed to be symmetrical for easeof manufacturing and were short, approximately 1.5 in height. The brake pedal would be supportedby this mount as well as the support of the master cylinders; accordingly the moment generated fromthe applied foot force would be supported. The gas pedal however, would only be supported by themounts and therefore were designed to be taller, approximately 4.5 in height. The throttle sensormount would be subjected to very little force, but the height of it needed to be able to accommodate

16 | P a g e
for the sensor’s ability to rotate and move in a full stroke without being restricted by the rotation of thegas pedal. The throttle sensor mount would also provide a support for a tension spring, which would beused to keep the gas pedal at a neutral state and provide some resistance during rotation. Theemergency stop mount needed to be positioned where, under the circumstance that there was a leak inthe brake line and there was no longer substantial pressure in the line, the pedal would strike the switchat approximately 90% displacement of the master cylinders.
Material Selection
The material selection process of the pedal box was based around the initial constraints of thedesign mentioned prior, but more specifically, the component of the pedal box that would be subjectedto the most stress, the brake pedal. Based on the type of loading the pedal box would be subjected to itwas modeled as a beam in bending and was decided that the desired material needed to have thefollowing mechanical properties:
- High Strength and be stiff- Good toughness- Machinability
From these constraints it was decided that metals, composites and possibly some polymerswould make optimal choices. From these constraints, two objective functions were derived bysubstituting the equations for bending stress of a beam and the stiffness of a beam into the equation forthe mass of the brake pedal. From these objective equations two material indices, & could bederived; with corresponding to the Elastic Modulus and corresponding to Yield Strength:
Using the material selection software, Granta CES EduPack 2014 [9], a graphical approach tomaterial selection was chosen. The first material index was plotted on the y-axis and the secondmaterial index as plotted on the x-axis. Optimal material selection resulted in the lowest possible valuesfor both these indices, thus the area of interest on the graph is in the lower-left corner of the graph.
= /
= /
(18)
(19)

17 | P a g e
Analysis of this chart rendered the optimal choice was, based on the material properties thatwere most dependent on functionality and taking cost into consideration, carbon steel, cast iron or analuminum alloy. Since out of the three, the aluminum alloys are the lightest, this material group wasselected for the design. 6061 T6 Aluminum was the final selection as the material choice of the pedalbox and the material properties for 6061 T6 Aluminum will be used from this point on in design of thecomponents of the pedal box.
Figure 5: Pedal Box Material Selection Chart [9]
18 | P a g e
Initial Design
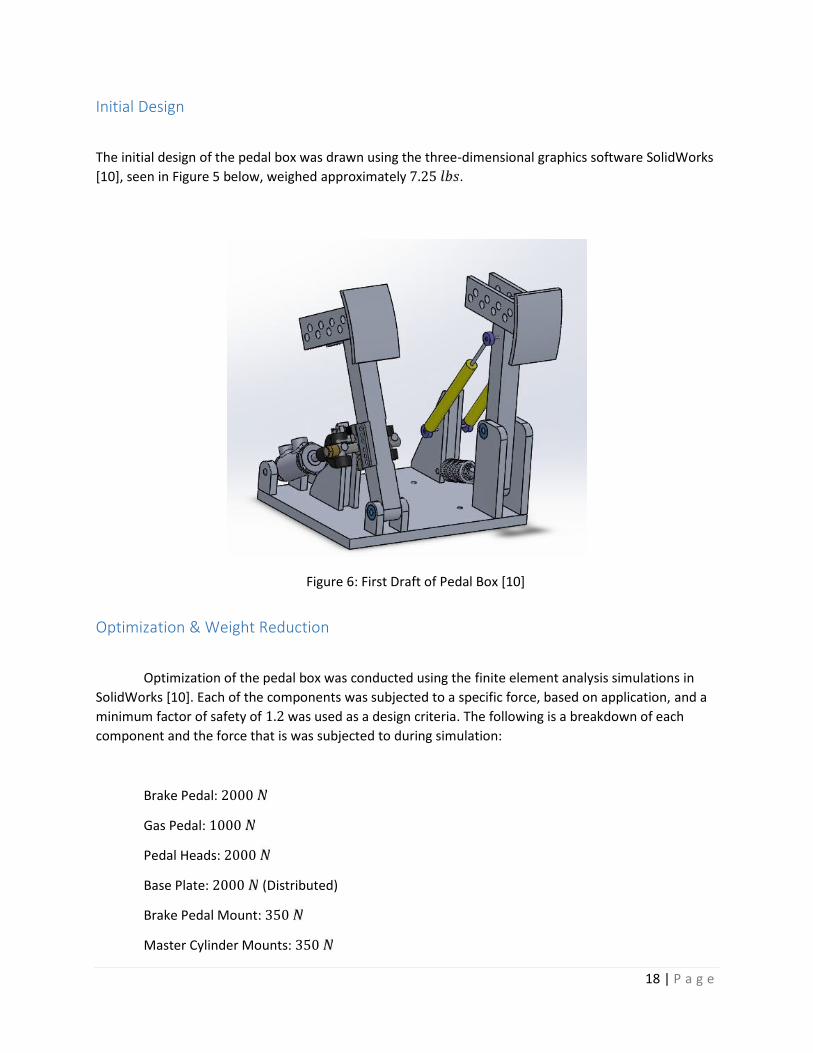
The initial design of the pedal box was drawn using the three-dimensional graphics software SolidWorks[10], seen in Figure 5 below, weighed approximately 7.25 .
Optimization & Weight Reduction
Optimization of the pedal box was conducted using the finite element analysis simulations inSolidWorks [10]. Each of the components was subjected to a specific force, based on application, and aminimum factor of safety of 1.2 was used as a design criteria. The following is a breakdown of eachcomponent and the force that is was subjected to during simulation:
Brake Pedal: 2000Gas Pedal: 1000Pedal Heads: 2000Base Plate: 2000 (Distributed)
Brake Pedal Mount: 350Master Cylinder Mounts: 350
Figure 6: First Draft of Pedal Box [10]

19 | P a g e
Gas Pedal Mount: 500Throttle Sensor Mount: 500Emergency Stop Switch Mount & Shield: 500After running FEA on the individual components, sections of each component, where the least
amount of stress occurred, were removed. This process resulted in many holes and skeletal cuts in mostof the components. FEA was conducted again on these optimized components to verify each still passedthe force criteria. This process was repeated until each component was reduced to its minimal mass andstill passed the FEA simulations. The original components are shown below as well as the optimized finalcomponents:
Brake Pedal
Gas Pedal
OriginalSide Front
Optimized
Original
Side Front
Side Front
Optimized
Side Front
Figure 7: Initial & Optimized Brake Pedal [10]
Figure 8: Initial & Optimized Gas Pedal [10]

20 | P a g e
Pedal Heads
Base Plate
Brake Pedal Mount
Original
Side Front
OptimizedSide Front
Original Optimized
Original & Optimized
Figure 9: Initial & Optimized Pedal Head [10]
Figure 10: Initial & Optimized Base Plate [10]
Figure 11: Initial & Optimized Brake Pedal Mount [10]

21 | P a g e
Master Cylinder Mount
Gas Pedal Mount
Throttle Sensor Mount
Original & Optimized
Original Optimized
Original Optimized
Figure 12: Initial & Optimized MC Mount [10]
Figure 13: Initial & Optimized Gas Pedal Mount [10]
Figure 14: Initial & Optimized Throttle Sensor Mount [10]

22 | P a g e
Emergency Stop Mount & Shield
The only major design change between the first and the final draft was the emergency stopmount and shield. Originally the mount was directly behind the brake pedal. This design was changedafter realizing the potential of destroying the switch if the pedal exceeded its designed rotation. In thefinal design the emergency stop switch was changed from a push button to a two stage switch and wasmounted perpendicular to the brake pedal. With this design if the brake pedal exceeded its rotation theemergency stop switch would be flipped and not crushed from brake failure.
Original OptimizedSide Front Side Front
Figure 15: Initial & Optimized Emergency Stop Mount & Shield [10]

23 | P a g e
Finite Element Analysis
The following figures show the FEA stress results on all of the optimized pedal box components [10]:
Brake Pedal
Minimum Factor of Safety: 1.4
Gas Pedal
Minimal Factor of Safety: 1.6
Figure 16: FEA Stress Analysis of Brake Pedal [10]
Figure 16: FEA Stress Analysis of Gas Pedal
Figure 17: FEA Stress Analysis of Gas Pedal [10]

24 | P a g e
Pedal Heads
Minimum Factor of Safety: 1.8
Base Plate
Minimum Factor of Safety: 8
Figure 18: FEA Stress Analysis of Pedal Head [10]
Figure 19: FEA Stress Analysis of Base Plate [10]

25 | P a g e
Brake Pedal Mount
Minimum Factor of Safety: 21
Master Cylinder Mount
Minimum Factor of Safety: 19
Figure 20: FEA Stress Analysis of Brake Pedal Mount [10]
Figure 21: FEA Stress Analysis of MC Mount [10]

26 | P a g e
Gas Pedal Mount
Minimum Factor of Safety: 8.2
Throttle Sensor Mount
Minimum Factor of Safety: 8.6
Figure 22: FEA Stress Analysis of Gas Pedal Mount [10]
Figure 23: FEA Stress Analysis of Throttle Sensor Mount [10]

27 | P a g e
Emergency Stop Mount & Shield
Mount
Minimum Factor of Safety: 11
Shield
Minimum Factor of Safety: 9
Figure 24: FEA Stress Analysis of Emergency Stop Mount [10]
Figure 25: FEA Stress Analysis of Emergency Stop Shield [10]

28 | P a g e
FEA Verification
In order to verify that FEA software was rendering appropriate results, the maximum stress onthe most critical component, the brake pedal, was calculated by hand. The following are the results:
The area of max stress of the brake pedal was near the half inch hole just above where themaster cylinders connect to the pedal, denoted by the red dashed line, see Figure 25.
The Brake Pedal was modeled as a beam in bending due to the applied foot force. The bendingstress can be calculated from the following equation:
Where , is the stress concentration factor, is the moment induced by the applied foot force, , is thedistance from the neutral axis of the cross-section to the point at which the stress is being calculatedand is the second moment of Inertia of the cross-section.
The second moment of inertia was calculated using the following cross section, see Figure 26,with = 1 & = 0.25 .
Figure 26: Max Area Section of Brake Pedal
= × × (20)
29 | P a g e
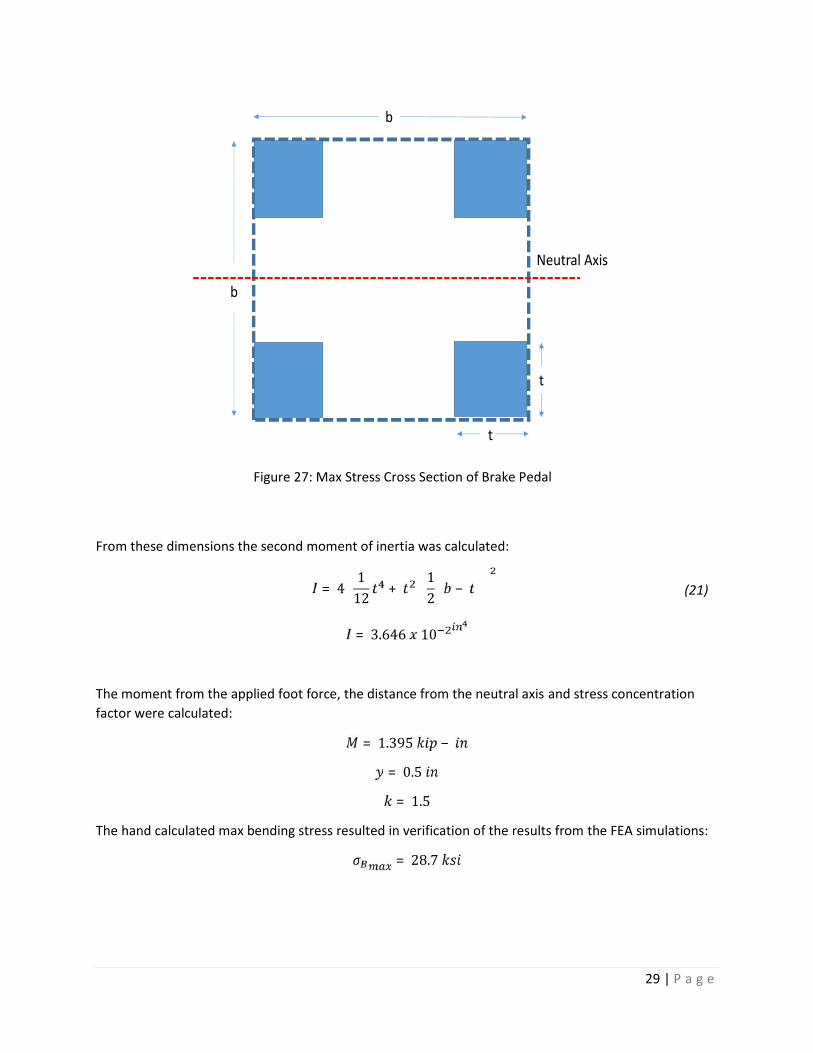
From these dimensions the second moment of inertia was calculated:
= 3.646 10The moment from the applied foot force, the distance from the neutral axis and stress concentrationfactor were calculated: = 1.395 −= 0.5= 1.5The hand calculated max bending stress resulted in verification of the results from the FEA simulations:= 28.7
Neutral Axis
b
b
t
t
Figure 27: Max Stress Cross Section of Brake Pedal
= 4 112 + 12 − (21)

30 | P a g e
Final Design
The final optimized design of the pedal box weighed approximately 4.25 , excluding themaster cylinders and throttle sensors and can be seen below in Figure 27 & 28.
Figure 28: Final Design of Pedal Box [10]
Figure 29: Final Design of Pedal Box (Side View) [10]

31 | P a g e
Rotor Design
Design Criteria
The rotors of the vehicle are the medium in which the kinetic energy from the motion of thevehicle is converted into thermal energy and then dissipated. From the braking system calculationsearlier in the text the geometrical constraints of the rotors are:
- 8.25 in diameter- Thickness between 0.38 & 0.25 , (dependent on caliper selection)
Based on the application the other constraints that will be imposed on design are:
- Mechanical endurance at high temperatures- Ability to dissipated or with stand high temperatures
Material Selection
The following rotor calculations were done in metric units for ease of conversion and calculation.
The most crucial selection in the design of the rotors based on the above constraints was thematerial choice. Based on the application, a metal, ceramic or composite material was assumed to beoptimal, however based on the team’s budget a metal was the only realistic choice. In order to make aselection, the conservation of energy was employed only for the linear motion of the vehicle at itsmaximum velocity to compare the temperature change of the rotors between materials. In thiscalculation it was assumed that each rotor would share evenly in the overall heat transfer. This is not theactual case, however for the purpose of comparison this method was utilized.
= ℎ= (# ) Δ
Where denotes mass, denotes linear velocity, is heat capacity and Δ denotestemperature change. The following know values were substituted into the equation:
(22)

32 | P a g e
= 283.5= 26.8
# = 4Thus the remaining variables, & , were strictly dependent on material choice.
Evaluating the conservation of energy equation established and solving for Δ , the equation becomes:
Δ = .Using this model, several different metals were input and the results were graphed [11].
Materials with the lowest temperature change were favored as these materials would increase intemperature the least during braking.
(23)
Figure 30: Rotor Temperature Change vs. Rotor Material
63.4 63.6
39.9 39.148.2
44.949.5
40.3 40.1 39.2 38.2 40.9 40.9 40.8
10.0
20.0
30.0
40.0
50.0
60.0
70.0
80.0
Tem
pera
ture
Diff
eren
ce (C
elsi
us)
Material
Temperature Change in Rotors vs. RotorMaterial

33 | P a g e
Based on this graph, the optimal choice are:
- High Carbon Steel- Nickel Steel- Stainless Steel
The cheapest of these was selected for the rotor material, thus the high carbon steel waschosen. However, the final material choice was A36 Carbon Steel, a low carbon steel. This was due to adonation, by a local steel vender; once again the team’s budget ultimately factored into the final design.
COMSOL Simulations: Rotor Sensitivity Analysis
In addition to the conservation of energy equation, the multi-physics software, COMSOL [12],was used to run heat transfer simulations modeling a brake pad and a rotor during emergency braking.The example used was a tutorial example from the software and therefore the rotor geometry andvehicle simulation were not exact to the electric vehicle’s. However, the COMSOL simulations wereexplicitly used to run parametric sweeps on the different material variables of the rotor. The tutorialsimulation was for a 1800 Kg vehicle traveling at 25 m/s which suddenly decelerates at 10 m/s^2 for twoseconds and then coasts at 5 m/s for eight seconds. The results would determine which variables hadthe greater impact on the rotor or the rotor’s sensitivity to these variables. From these results a betterunderstanding of the heat transfer could be observed and therefore translated into an optimal rotordesign.
The variables of the rotor that the parametric sweeps were conducted for were the following:
- Thermal Conductivity- Heat Capacity- Density*Heat Capacity
The maximum rotor temperature of each scenario was used among the parametric sweeps forcomparative and rotor sensitivity analysis.
The results from the rotor thermal density parametric sweep rendered a decreasing powerfunction, see below; as the thermal conductivity of the rotor increased the maximum temperature ofthe rotor deceased. However, it can be observed from the graph that between the thermal conductivityvalues of 50 & 200 the rate at which the maximum temperature decreases is reduced severallyand the graph appears to plateau. The overall temperature range of this parametric sweep was anaproximate maximum of 400℃and a minimum of 125℃.

34 | P a g e
Figure 31: COMSOL Parametric Sweep of Rotor Thermal Conductivity [12]
The results from the rotor heat capacity parametric sweep rendered another decreasing powercurve, however this one behaving more linearly; as the heat capacity of the rotor increased themaximum rotor temperature decreased. The overall temperature range of this parametric sweep was anaproximate maximum of 183℃and a minimum of 120℃.
Figure 32: COMSOL Parametric Sweep of Rotor Heat Capacity [12]
0.0050.00
100.00150.00200.00250.00300.00350.00400.00450.00
0 50 100 150 200 250
Max
imum
Rot
or T
empe
ratu
re (ᵒ
C)
Thermal Conductivity (W/m K)
Maximum Rotor Temperature vs. Rotor ThermalConductivity
0.0020.0040.0060.0080.00
100.00120.00140.00160.00180.00200.00
0 200 400 600 800 1000
Max
imum
Rot
or T
empe
raut
e (ᵒC)
Heat Capacity (J/ Kg K)
Maximum Rotor Temperature vs. Rotor Geat Capacity

35 | P a g e
The results from the rotor density*heat capacity parametric sweep rendered an approximatedeceasing line, see below; as the density*capacity increased the maximum rotor temperaturedecreased. The overall temperature range of this parametric sweep was an aproximate maximum of183℃and a minimum of 150℃.
Figure 33: COMSOL Parametric Seep of Rotor Density*Heat Capacity [12]
After analyzing and comparing these parametric sweeps, it was concluded that the mostsensitive parameter was the rotor’s thermal conductivity, followed by the rotor’s heat capacity and thenthe rotor’s density*heat capacity, because the temperature ranges decease in the same order. Analyzingwhere the material selection of A36 carbon steel, from the previous section, falls in these graphs, it isconcluded that it is in fact an optimal choice based on the following values from the graphs:
= 50 , = 173℃= 480 , = 140℃
∗ = 3744000 , = 148℃
0.0020.0040.0060.0080.00
100.00120.00140.00160.00180.00200.00
2000000 2500000 3000000 3500000 4000000
Max
imum
Rot
or T
empe
ratu
re (ᵒC)
Rotor Density*Heat Capacity (J/ m^3 K)
Maximum Rotor Temperature vs. RotorDensity*Heat Capacity

36 | P a g e
Rotor Geometry
In most rotor designs there are cuts or holes in the surface where the rotor comes in contactwith the brake pad. The main intension of these cuts is to reduce brake fad during braking. As thetemperature of the brake pad begins reaching its design limit a faint layer of gas from the deteriorationof the brake pad forms between the pad and the rotor. The effect of this gas layer is a severe decreasein the brake pad coefficient of friction, which translates as an ineffective brake to the driver. This effectgives the driver a spongy feel to the brake pedal; as the applied foot force of the driver is use to applyingbarley brakes, thus hindering the deceleration of the vehicle.
Having cuts or holes in the rotor creates a vent or fan like effect, which flushes out this gas layerthat forms. Two side effects of having these cuts in the rotor are reduced mass and an increase in thecooling. Thus, it was decided that the rotor would have a cut geometry. The initial method ofattachment of the rotor to the hub was a bolted design, as seen by the following initial rotor designs Athrough G:
Design A Design B Design C
Design D Design E Design F

37 | P a g e
In selecting a rotor geometry there were two concepts that were taken into account:
1) The cut pattern needed to wear the brake pad relatively uniformly, as a deformed padwould cause the contact surface between the pad and the rotor to decrease, thus inhibitingthe effectiveness of the braking system.
2) Decreasing the mass of the rotor needed to be optimal; that is, there is a certain amount ofmaterial that can be removed where the rotor has enough mass to endure the heat transferand there are enough cuts for venting.
After consulting with the team’s hub engineer, the rotor attachment design was changed from a“bolt on” design to a “button pin” design. This design allowed there to be less rotor material formounting, as well as less hub material for mounting. In addition, the stress endured from the torque ofthe braking system would be spread amongst the rotor, hub and button pin as opposed to the “bolt ondesign”, where the bolt would be the only component enduring stress. The final rotor design is shownbelow. In order to accommodate the button pins an inner lip needed to cut into the inner radius of therotor just past the button pin holes.
Design G
Figure 35: Final Rotor Design [10]
Figure 34: Initial Rotor Designs [10]

38 | P a g e
COMSOL Simulation: Actual Trial
Once the final rotor geometry and material were selected, a COMSOL simulation was runmimicking an emergency stop of the electric vehicle. The above rotor geometry from Figure 34 wasinput along with the necessary material properties for A36 carbon steel. The input parameters of thesimulation were changed for the electric vehicle: the mass was changed to 283.5 Kg and the brake padcoefficient of friction was changed to 0.615. The rest of the parameters from the parametric sweepwere kept, that is the vehicle started at 25 m/s, decelerated at 10 m/s^2 for 2 seconds and then coastedat 5 m/s for eight seconds with the initial temperature of the entire system at 27ᵒC.
As noted from prior section, a weight transfer from the rear to the front of the vehicle occursduring braking. Because of this weight transfer the front rotors will be subjected to more weight andtherefore more heat transfer. Thus, one of the front rotor will be targeted during this simulation.
The following is a graphical representation of the maximum temperature versus time of therotor and a thermal rendering of the rotor at its peak temperature throughout the simulation.
The maximum temperature during the entire simulation was found to be 62.7 ᵒC
0
10
20
30
40
50
60
70
0 2 4 6 8 10 12
Max
Rot
or T
emp
(ᵒC)
Time (Seconds)
Max Rotor Temperature vs. Time
Figure 36: Maximum Rotor Temperature from Actual COMSOL Simulation [12]

39 | P a g e
COMSOL Actual Trial Verification
The COMSOL simulation was verified using the conservation of energy. In this calculation thelinear kinetic of the vehicle was accounted for along with the rotational kinetic energy of the rotors andtires. = ℎ12 + 12 + 12 = Δ
Where denotes moment of inertia of the rotating parts, denotes the angular velocity of therotating parts, is the mass, is linear velocity, is heat capacity and Δ denotes temperaturechange. The following know values were substituted into the equation:
Figure 37: Thermal Rendering of rotor at maximum temperature (62.7 ᵒC) [12]
(24)

40 | P a g e
= 0.03632= 190.89 1= 0.25= 80 1= 283.5= 20Thus the remaining variables, & , were strictly dependent on material choice.
Evaluating the conservation of energy equation established and solving for Δ , the equation becomes:Δ = .
Inputting the mass of the rotors and the heat capacity of A36 carbon steel, the temperaturedifference is calculated to be:
Δ = 25.82 ᵒAdding this to the initial temperature of the system (27 ᵒC) renders a maximum rotor temperature of:= 52.82 ᵒ
The COMSOL simulation rendered a maximum rotor temperature of 62.7 ᵒC. However, thistemperature is observed early in the simulation. From the data, the temperature increased immenselyinitially and then decreased rapidly, increased at a more gradual and reasonable rate, then reached atemperature of 51.5 ᵒC at time 1.6 seconds. It was concluded that the initial results of the COMSOLsimulation are inaccurate and after 0.25 seconds the results are reasonable. Therefore, the maximum rotortemperature was taken as approximately 52 ᵒC and the simulation was verified.
(25)

41 | P a g e
Manufacturing
Manufacturing of the rotors and pedal box components was performed by a water jetting process.In this process, a water and sand mixture is forced through a nozzle at approximately 60,000 , cuttingthe raw material into the desired components. This process was chosen because the opportunity ofwarping was minimal, which was crucial for the rotor manufacturing. The rest of the manufacturing wasdone in the university’s machine shop by the braking system designer, which included: final touches onweight reduction cuts for pedal components, fabricating of pins for pedal and master cylinder, spacers andcutting the inner diameter lip out of the rotors. The components of the pedal box were TIG-welded to baseplate. The use of a drill press, vertical mill, lathe and arc welder were used to accomplish these tasks.

42 | P a g e
Drawings

Figure 38: Brake Pedal Drawing

44 | P a g e
Figure 39: Gas Pedal Drawing

45 | P a g e
Figure 40: Pedal Head Drawing

46 | P a g e
Figure 41: Base Plate Drawing

47 | P a g e
Figure 42: Brake Pedal Mount

48 | P a g e
Figure 43: Master Cylinder Mount Drawing

49 | P a g e
Figure 44: Gas Pedal Mount

50 | P a g e
Figure 45: Throttle Sensor Mount

51 | P a g e
Figure 46: Emergency Stop Mount
52 | P a g e
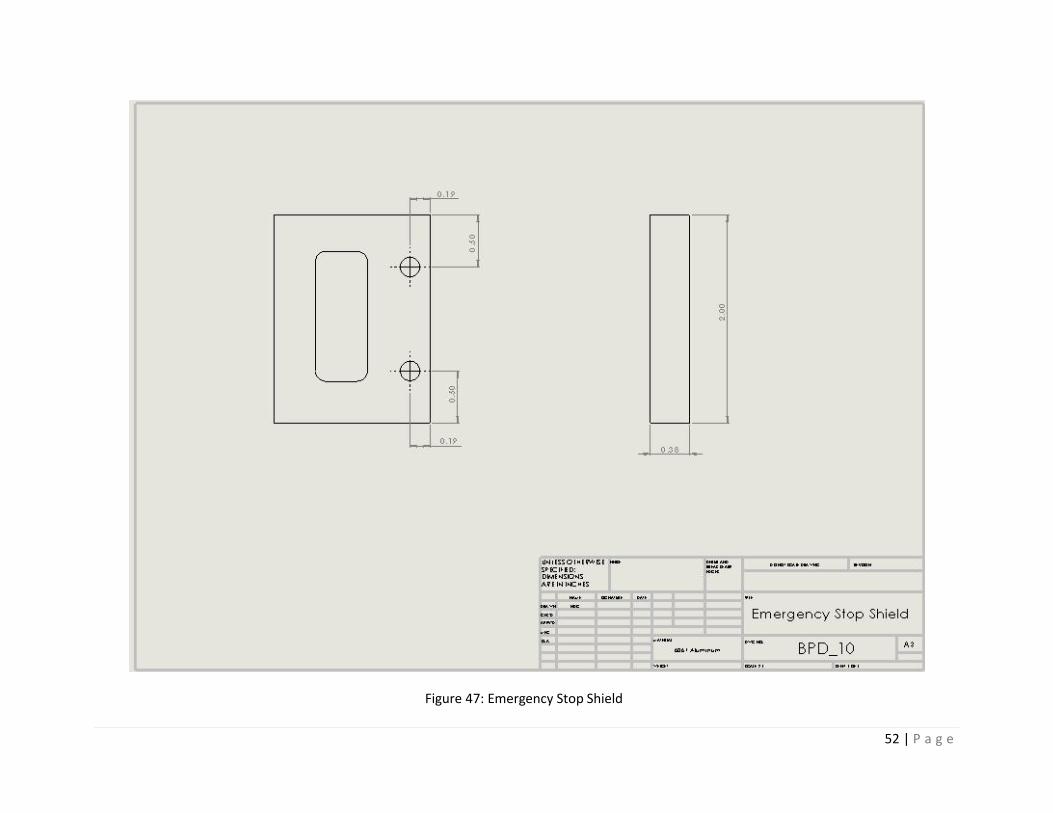
Figure 47: Emergency Stop Shield

53 | P a g e
Figure 48: Rotor Drawing

Conclusion
In conclusion, the University of Akron’s FSAE Electric Vehicle Braking System was designed for aweight of 625 , including driver. The front and rear braking systems were symmetrical and consistedof two 1 ℎbore, Tilton 77-series master cylinders, four Wilwood Billet Dynalite Single calipers andfour 8.25 diameter spline vented rotors. The pedal box was manufactured from 6061 T6 Aluminumand consisted of two pedals and mountings for the pedals along with mountings for the master cylindersand throttle sensor. The final design of the entire system weighed approximately 22.81 , reducingthe weight by approximately 24.4% from the initial design.
SolidWorks was used to draw all of the components of the pedal box and also to run FEA oneach component. After subjecting each component to the stress criteria mentioned earlier in the textthe following factors of safety were found:
Brake Pedal: 1.4
Gas Pedal: 1.6
Pedal Head: 1.8
Base Plate: 8
Brake Pedal Mount: 21
Master Cylinder Mount: 19
Gas Pedal Mount: 8.2
Throttle Sensor Mount: 8.6
Emergency Stop Mount: 11
Emergency Stop Shield: 9
The component of the pedal box that would be subjected to the maximum stress, the brakepedal, was verified through hand calculations for this finding. The brake pedal arm was modeled as abeam in bending and the maximum stress was found to be:= 28.7
COMSOL was utilized to perform heat transfer simulations on the rotors, specifically targetingone of the front rotors. The results from the COMSOL simulations rendered a maximum rotortemperature during an emergency stop scenario: = 62.7ᵒ

55 | P a g e
However, after verification of this finding using the conservation of energy, it was concludedthat the maximum rotor temperature on of the front rotors would experience during an emergency stopwould be approximately 52.8 ᵒC.

56 | P a g e
References
[1] Richard Gross, “Chapter 9: Design of A Braking System”, FSAE Racing Vehicle Dynamics
[2] Wilwood Engineering Inc., Wilwood Calipers, Available:http://www.wilwood.com/Calipers/CaliperListLanding.aspx
[3] AP Racing, Brake Calipers, Available:https://www.apracing.com/products/race_car/brake_calipers.aspx
[4] Wilwood Engineering Inc., Cf vs. Temperature: Brake Pad Material [Graph], Available:http://www.wilwood.com/brakepads/BrakePadsApp.aspx?compound=PolyMatrix%20A
[5] Tilton Engineering, Mater Cylinders, Available: http://tiltonracing.com/product-category/brake/master-cylinders/
[6] Brembro, Master Cylinders, Available: http://www.brembo.com/en/bike/Original-Equipment/Products/Pages/Moduli.aspx
[7] AP Racing, Master Cylinders, Available:https://www.apracing.com/products/race_car/master_cylinders.aspx
[8] Alcon USA, Brake & Clutch Master Cylinders, Available:http://www.alconusa.com/index.cfm?template=specs_list_1&getProduct=16
[9] Granta CES, EduPack 2014
[10] SolidWorks, 2014-2015 Education Edition
[11] Frank Kreith, Raj Manglik, Mark Bohn, Principles of Heat Transfer, 1959
[12] COMSOL Multiphysics, Version 5.0