Design of the dilemma zone protection system -...
56
Design, Deployment, and Evaluation of the Dilemma Zone Protection System Sung Yoon Park, Ph.D. Candidate Directed by Professor Gang-Len Chang Department of Civil and Environmental Engineering University of Maryland, College Park
Transcript of Design of the dilemma zone protection system -...
Design, Deployment, and Evaluation of
the Dilemma Zone Protection SystemSung Yoon Park, Ph.D. Candidate
Directed by Professor Gang-Len Chang
Department of Civil and Environmental Engineering
University of Maryland, College Park
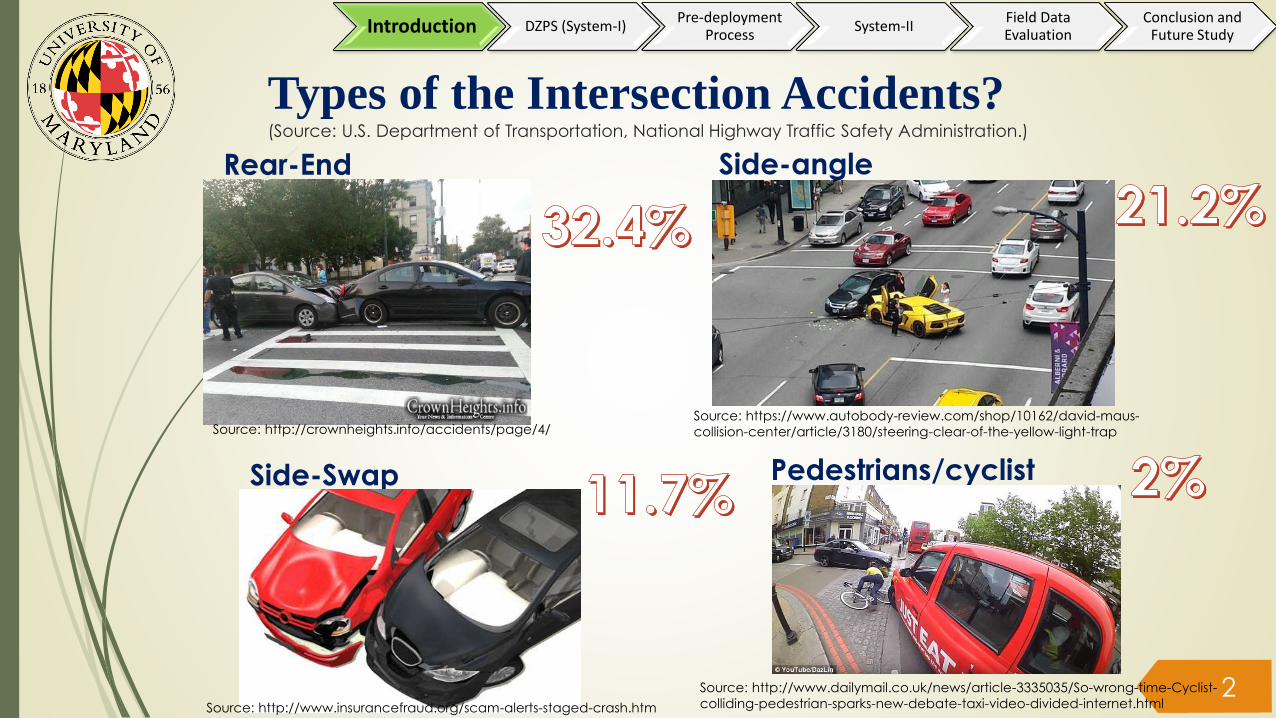
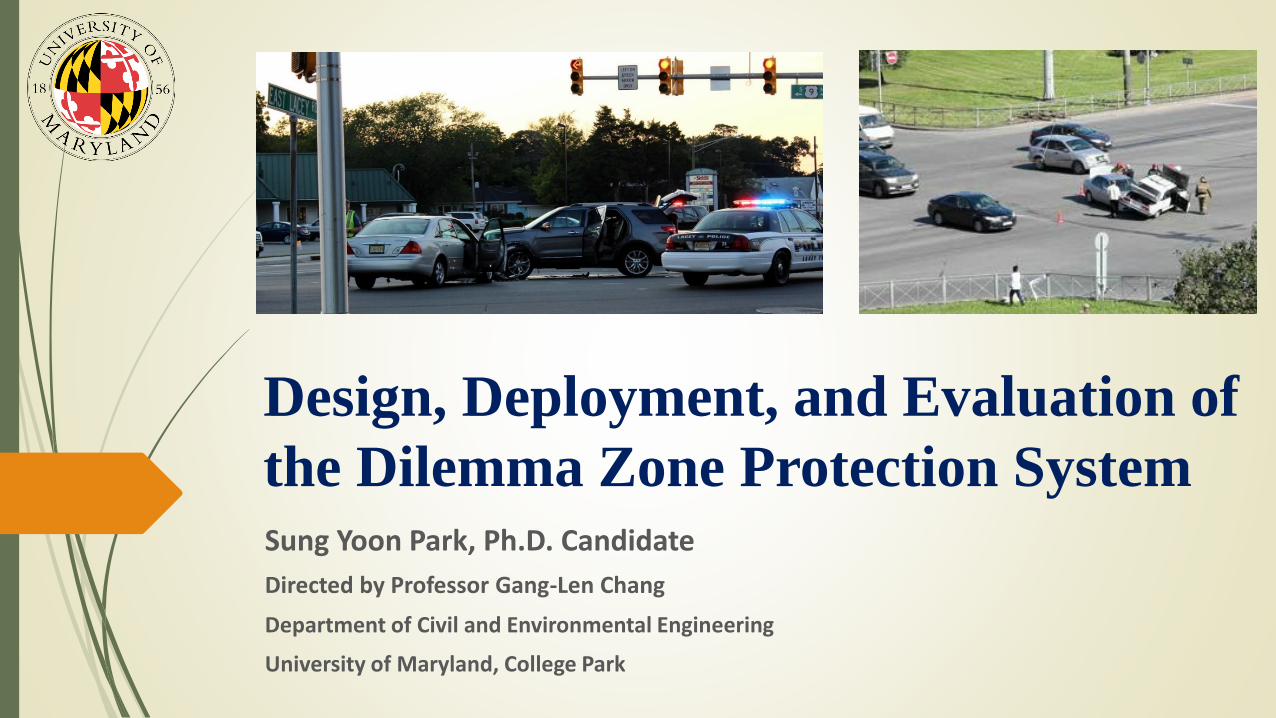
Types of the Intersection Accidents? (Source: U.S. Department of Transportation, National Highway Traffic Safety Administration.)
Source: https://www.autobody-review.com/shop/10162/david-maus-
collision-center/article/3180/steering-clear-of-the-yellow-light-trap
Side-angle
Side-Swap
Source: http://www.insurancefraud.org/scam-alerts-staged-crash.htm
Source: http://crownheights.info/accidents/page/4/
Rear-End
Pedestrians/cyclist
Source: http://www.dailymail.co.uk/news/article-3335035/So-wrong-time-Cyclist-
colliding-pedestrian-sparks-new-debate-taxi-video-divided-internet.html2
Introduction DZPS (System-I)Pre-deployment
ProcessSystem-II
Field Data Evaluation
Conclusion and Future Study
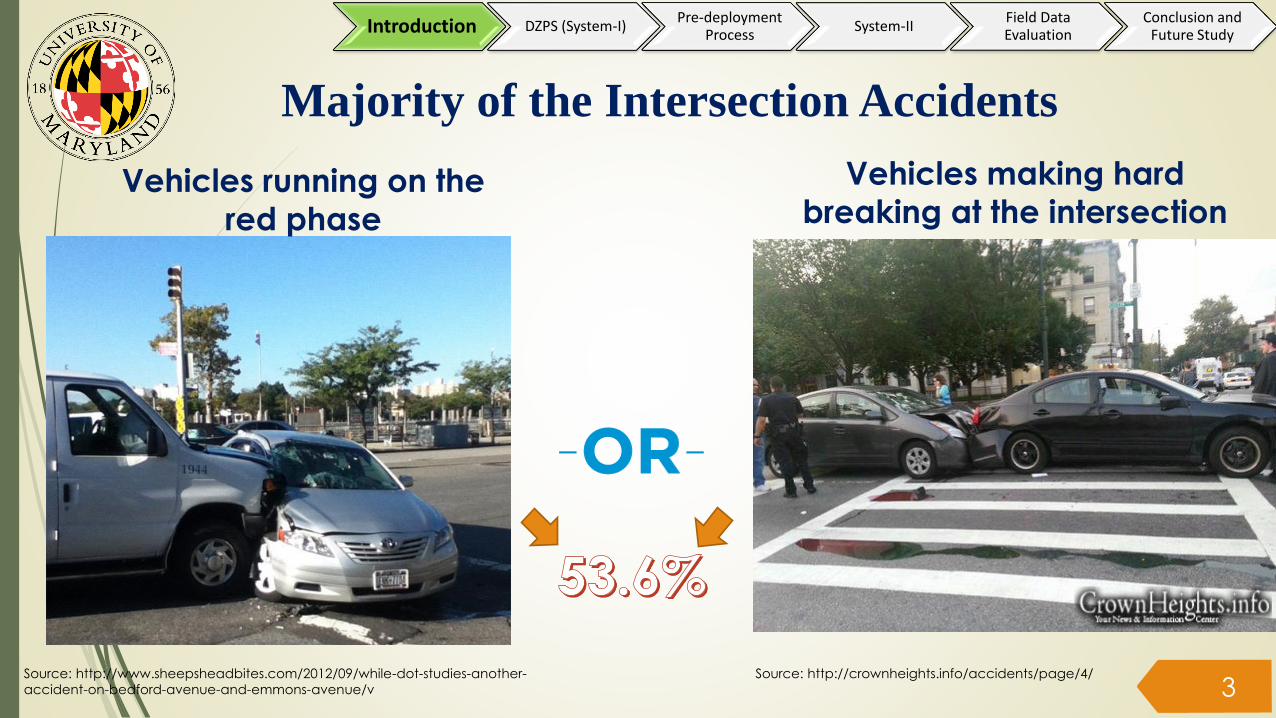
Majority of the Intersection Accidents
Source: http://www.sheepsheadbites.com/2012/09/while-dot-studies-another-
accident-on-bedford-avenue-and-emmons-avenue/v
Vehicles running on the
red phase
Vehicles making hard
breaking at the intersection
Source: http://crownheights.info/accidents/page/4/
3
Introduction DZPS (System-I)Pre-deployment
ProcessSystem-II
Field Data Evaluation
Conclusion and Future Study

Contributing Factors to Intersection Accidents ?
Potential contributors to Dilemma Zone related accidents
Insufficient duration of the yellow phase
Aggressiveness of drivers
High speed
Short sight distance
Driver’s characteristics
PRT, age, gender
Deceleration rate of vehicles
Cannot Stop .
Cannot Pass
Dilemma
Zone
4
Introduction DZPS (System-I)Pre-deployment
ProcessSystem-II
Field Data Evaluation
Conclusion and Future Study
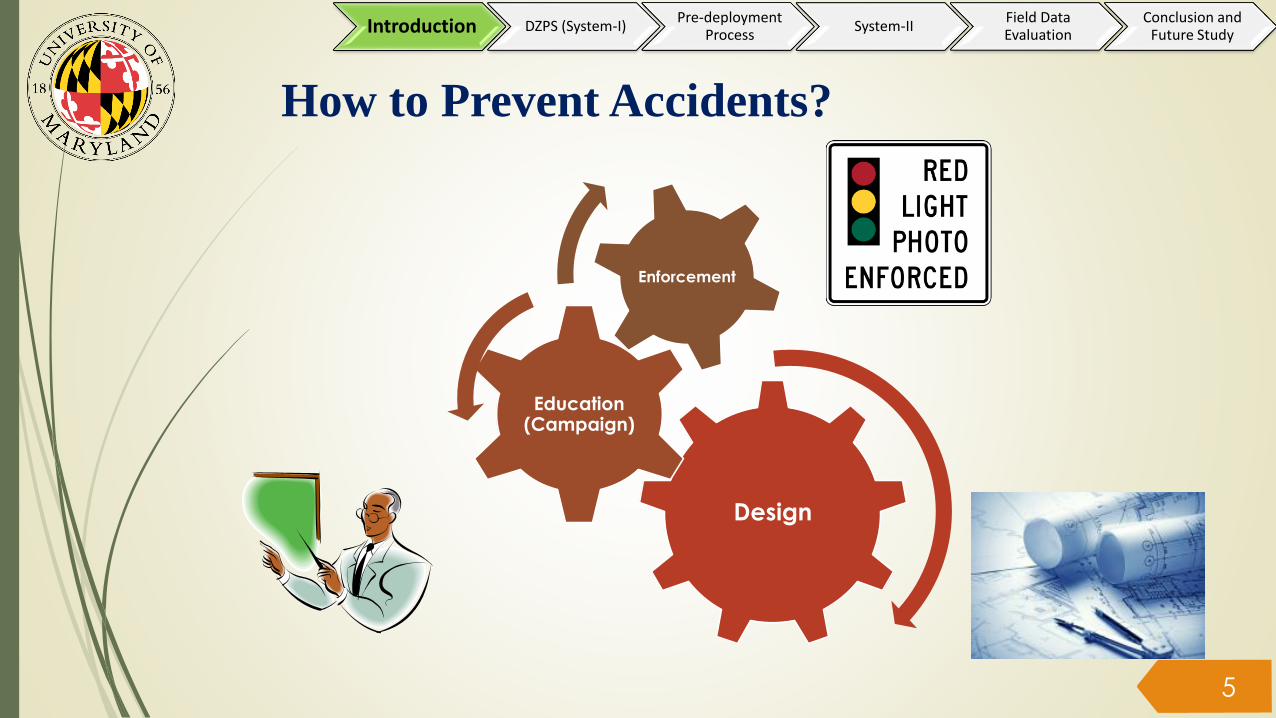
How to Prevent Accidents?
Design
Education (Campaign)
Enforcement
5
Introduction DZPS (System-I)Pre-deployment
ProcessSystem-II
Field Data Evaluation
Conclusion and Future Study
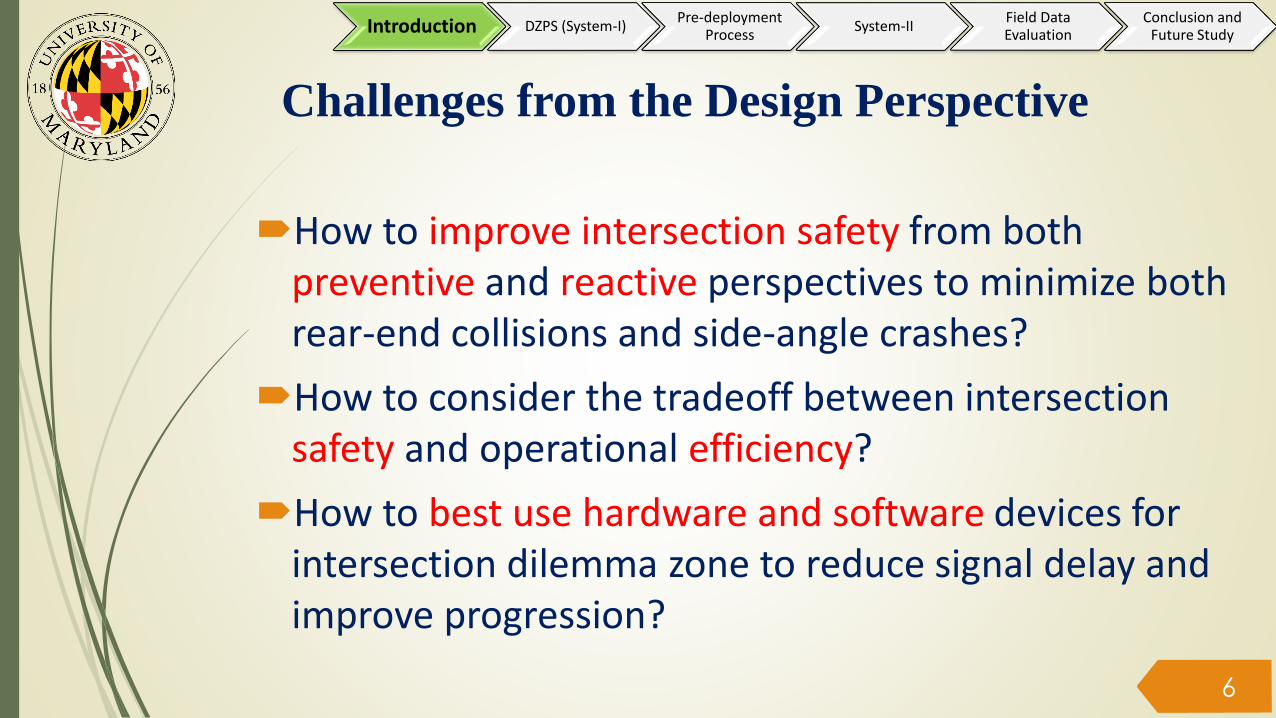
Challenges from the Design Perspective
How to improve intersection safety from both preventive and reactive perspectives to minimize both rear-end collisions and side-angle crashes?
How to consider the tradeoff between intersection safety and operational efficiency?
How to best use hardware and software devices for intersection dilemma zone to reduce signal delay and improve progression?
6
Introduction DZPS (System-I)Pre-deployment
ProcessSystem-II
Field Data Evaluation
Conclusion and Future Study
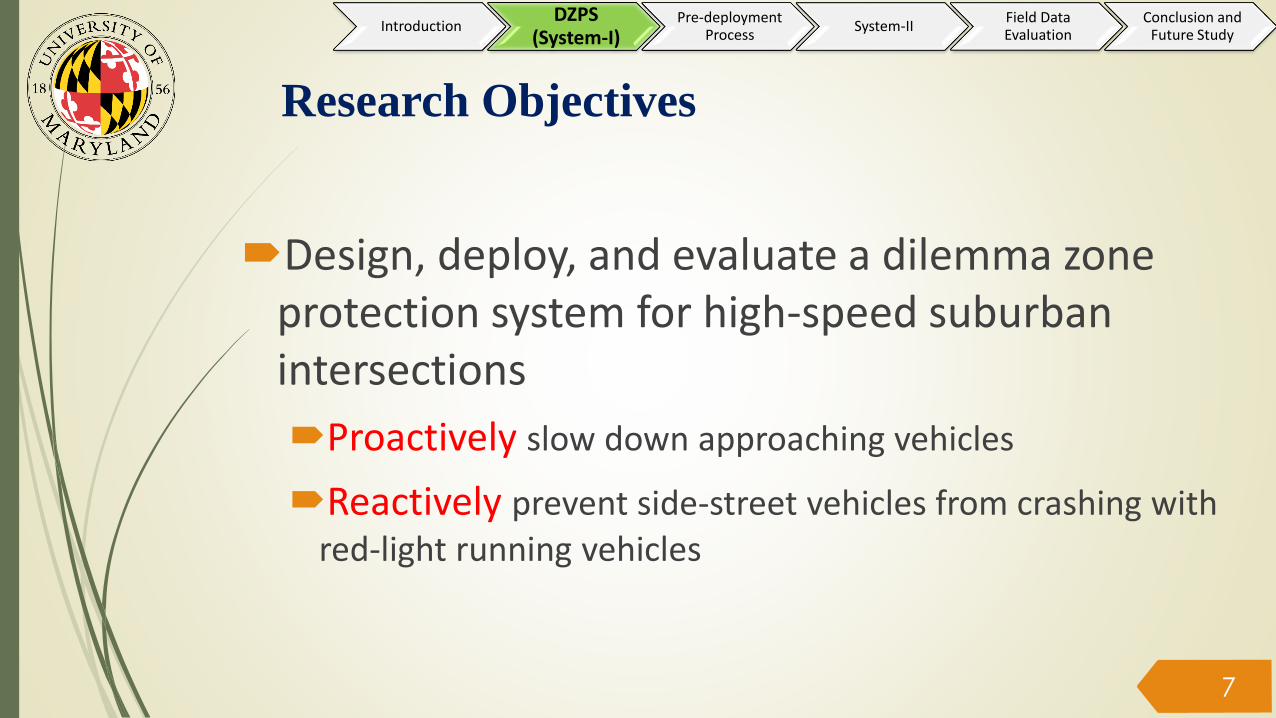
Research Objectives
Design, deploy, and evaluate a dilemma zone protection system for high-speed suburban intersections
Proactively slow down approaching vehicles
Reactively prevent side-street vehicles from crashing with red-light running vehicles
7
IntroductionDZPS
(System-I)Pre-deployment
ProcessSystem-II
Field Data Evaluation
Conclusion and Future Study
Functional Requirements for the DZPS
Provide Real-time traffic information within a monitoring zone (tracking each individual vehicle’s speed and location)
Identify potential red-light running vehicles
Predict a driver’s reaction to the yellow phase
Extend an all-red phase to identified red-light running vehicles
Reactive control strategies to prevent aggressive drivers from side-angle crash
Provide advanced warning message to approaching vehicles
Proactive control strategies to slowdown speeds of approaching vehicles
8
IntroductionDZPS
(System-I)Pre-deployment
ProcessSystem-II
Field Data Evaluation
Conclusion and Future Study
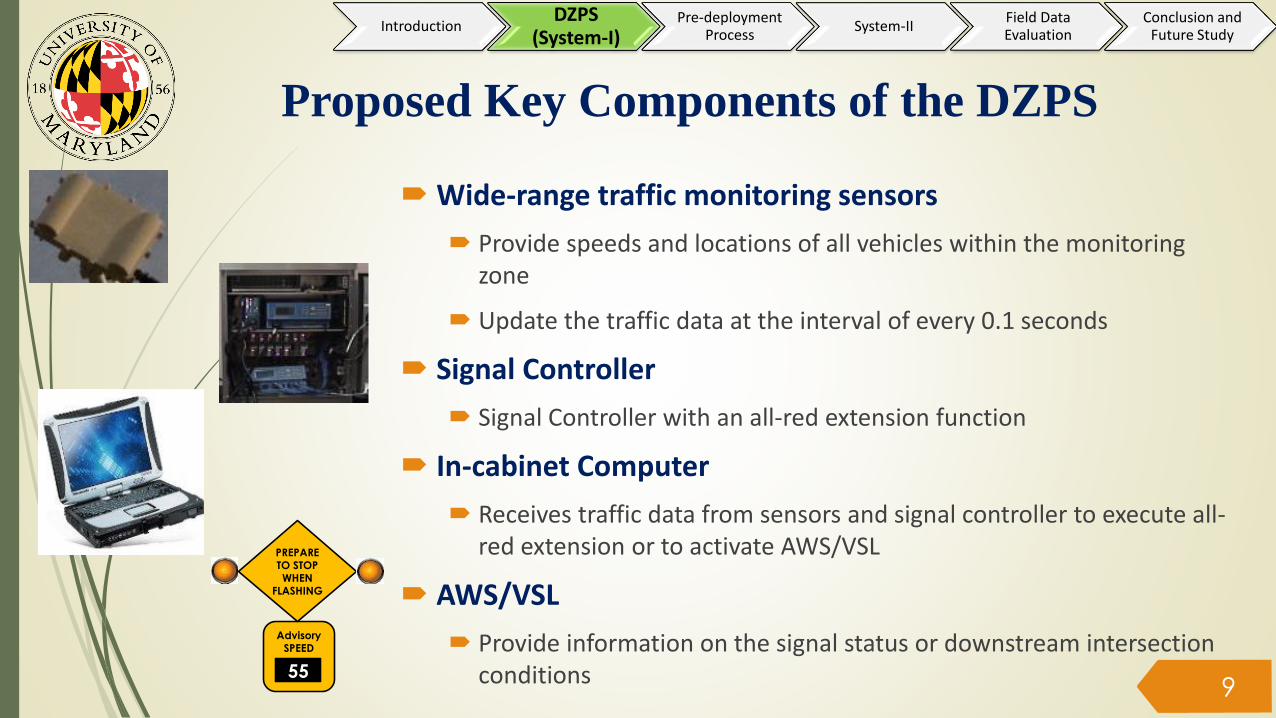
Proposed Key Components of the DZPS
Wide-range traffic monitoring sensors
Provide speeds and locations of all vehicles within the monitoring zone
Update the traffic data at the interval of every 0.1 seconds
Signal Controller
Signal Controller with an all-red extension function
In-cabinet Computer
Receives traffic data from sensors and signal controller to execute all-red extension or to activate AWS/VSL
AWS/VSL
Provide information on the signal status or downstream intersection conditions
9
Advisory SPEED
55
PREPARE TO STOP WHEN
FLASHING
IntroductionDZPS
(System-I)Pre-deployment
ProcessSystem-II
Field Data Evaluation
Conclusion and Future Study
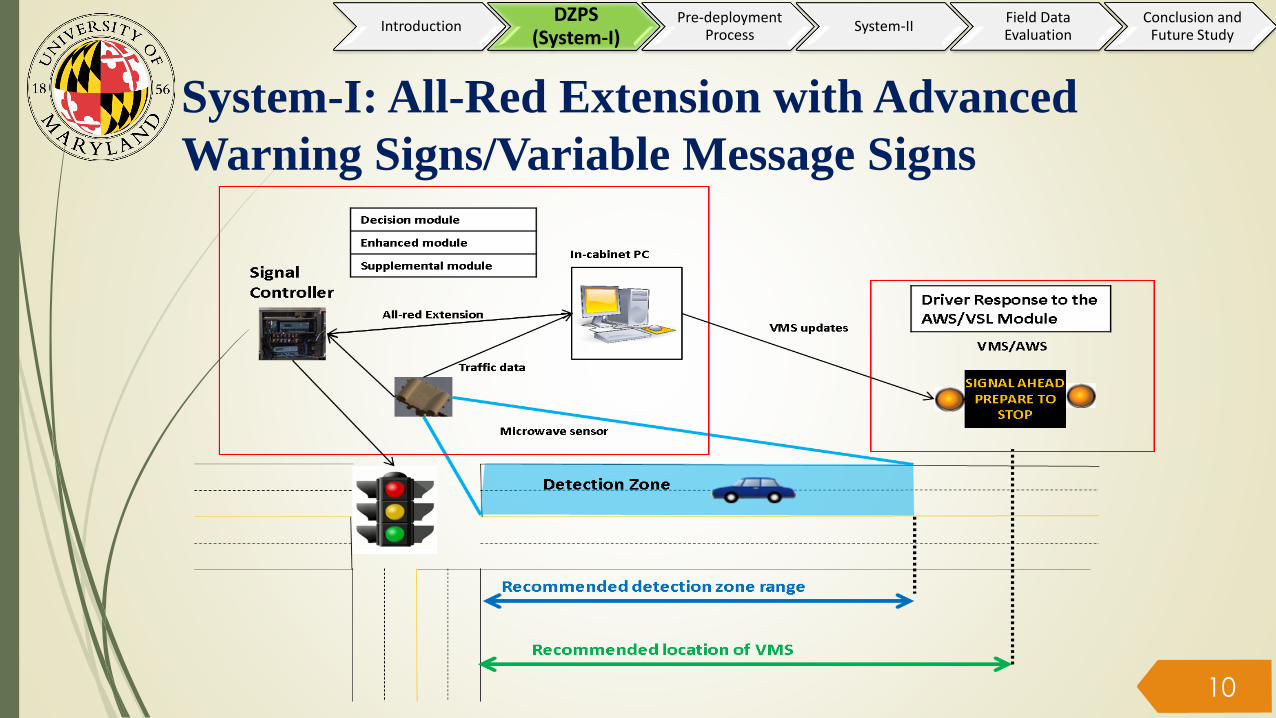
System-I: All-Red Extension with Advanced
Warning Signs/Variable Message Signs
10
IntroductionDZPS
(System-I)Pre-deployment
ProcessSystem-II
Field Data Evaluation
Conclusion and Future Study
Key Tasks for the System-I Design
Develop an all-red extension algorithm
Identify potential-red light running vehicles
Pre-deployment analysis
Develop a simulation platform
Analyze potential issues
Evaluate the system performance
Post-deployment analysis
Analyze field data
Evaluate system performance11
IntroductionDZPS
(System-I)Pre-deployment
ProcessSystem-II
Field Data Evaluation
Conclusion and Future Study

All-Red Extension Algorithm 1 (individual-based)
• Step 1Identify which vehicles are trapped in their respective dilemma zones based on their speeds and locations detected by the deployed wide-range sensors
• Step 2Calculate the required clearance time for each vehicle trapped in its DZ to pass the intersection
• Step 3Estimate the probability for vehicles identified in step 1to take the passing decision
• Step 4Identify vehicles with a passing probability greater than the preset threshold
• Step 5Find the maximum required clearance time among all vehicles identified from step 4
• Step 6Compute the all-red extension based on the maximum clearance time calculated from step 5
• Step 7Onset of the red phase, identify vehicles cannot stop safely, andCompare all-red extension duration and update if necessary 12
IntroductionDZPS
(System-I)Pre-deployment
ProcessSystem-II
Field Data Evaluation
Conclusion and Future Study
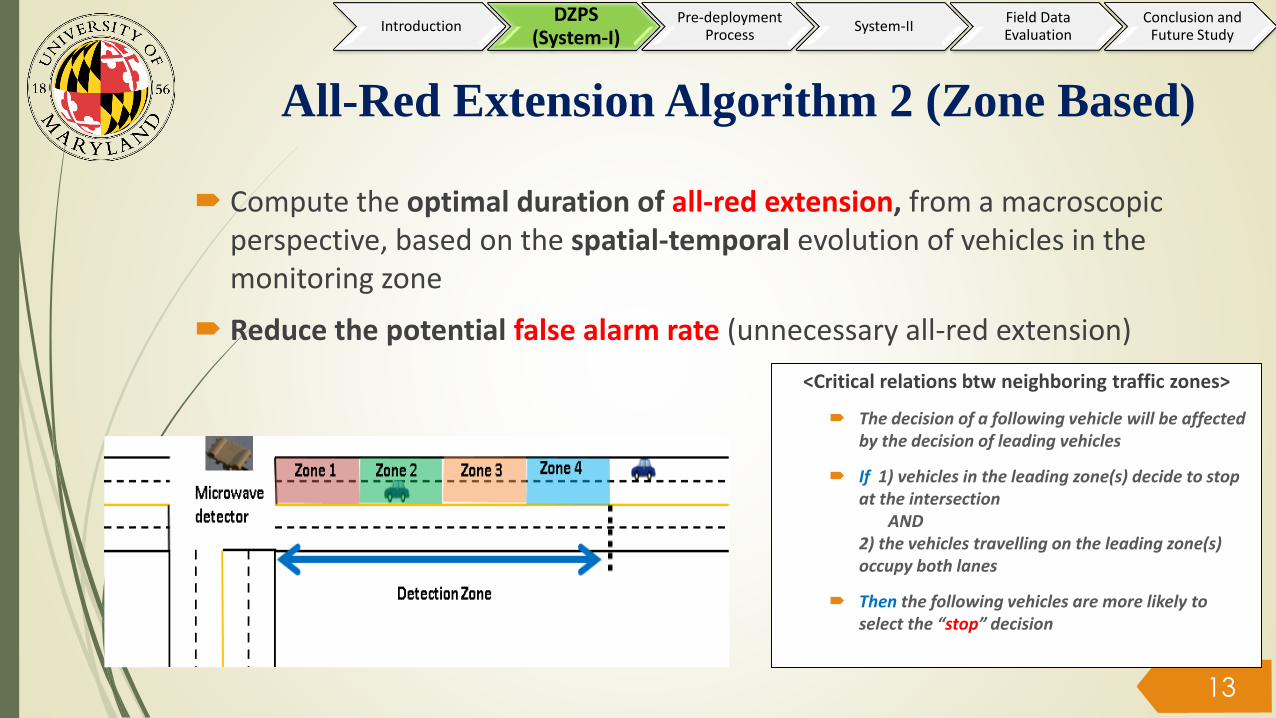
All-Red Extension Algorithm 2 (Zone Based)
<Critical relations btw neighboring traffic zones>
The decision of a following vehicle will be affected by the decision of leading vehicles
If 1) vehicles in the leading zone(s) decide to stop at the intersection
AND 2) the vehicles travelling on the leading zone(s) occupy both lanes
Then the following vehicles are more likely to select the “stop” decision
13
Compute the optimal duration of all-red extension, from a macroscopic perspective, based on the spatial-temporal evolution of vehicles in the monitoring zone
Reduce the potential false alarm rate (unnecessary all-red extension)
IntroductionDZPS
(System-I)Pre-deployment
ProcessSystem-II
Field Data Evaluation
Conclusion and Future Study

Pre-Deployment Assessment
Purpose:
Identify issues prior to the field deployment
Tasks:
Collect field data
Develop a simulation platform for experimental analysis
Validate an all-red extension algorithm
Identify potential issues14
Introduction DZPS (System-I)Pre-deployment
ProcessSystem-II
Field Data Evaluation
Conclusion and Future Study
Simulation Platform?
Evaluate the effectiveness prior to the deployment
Identify potential deployment issues
Validate of the developed algorithms
Provide data for experimental analysis
Cost effective
Ensure the success of the deployed DZPS
15
Introduction DZPS (System-I)Pre-deployment
ProcessSystem-II
Field Data Evaluation
Conclusion and Future Study
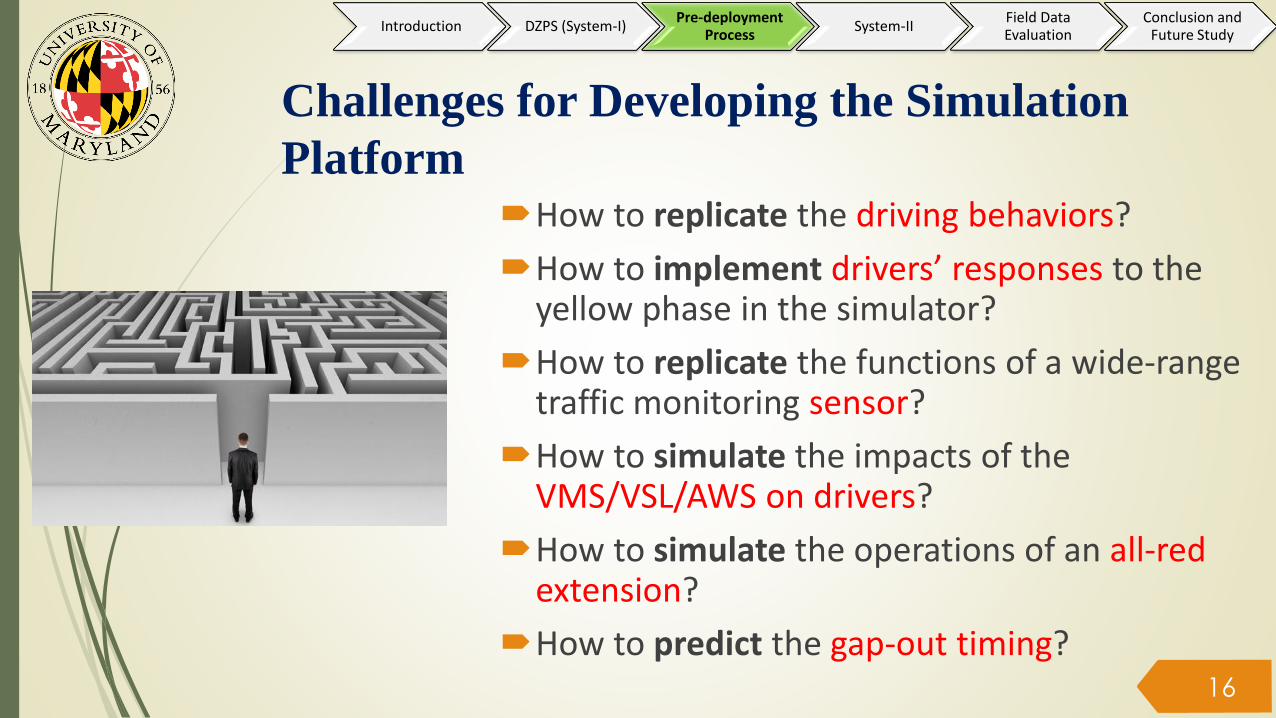
Challenges for Developing the Simulation
PlatformHow to replicate the driving behaviors?
How to implement drivers’ responses to the yellow phase in the simulator?
How to replicate the functions of a wide-range traffic monitoring sensor?
How to simulate the impacts of the VMS/VSL/AWS on drivers?
How to simulate the operations of an all-red extension?
How to predict the gap-out timing?16
Introduction DZPS (System-I)Pre-deployment
ProcessSystem-II
Field Data Evaluation
Conclusion and Future Study

Development of the Simulation Platform
Objectives
Replicate the real-world traffic distributions and driver characteristics
Integrate all key components of the proposed system into the simulation platform for experimental analysis
Evaluate the resulting effectiveness on safety improvement
17Data flowchart in the Simulation Platform

Embedded Components in the Simulation Platform
18
• Geometric features
• Traffic flow rate
• Driving behaviors
• Reactions to the yellow signal
VISSIM Network
•Wide-range traffic monitoring sensors•Advanced warning sign/advisory speed sign•Response to the AWS/advisory speed sign•Signal Controller (signal phases, logic, and all-red extension)•Advisory speed module•Queue evolution module
Control Module
Simulation Platform
Components
Introduction DZPS (System-I)Pre-deployment
ProcessSystem-II
Field Data Evaluation
Conclusion and Future Study
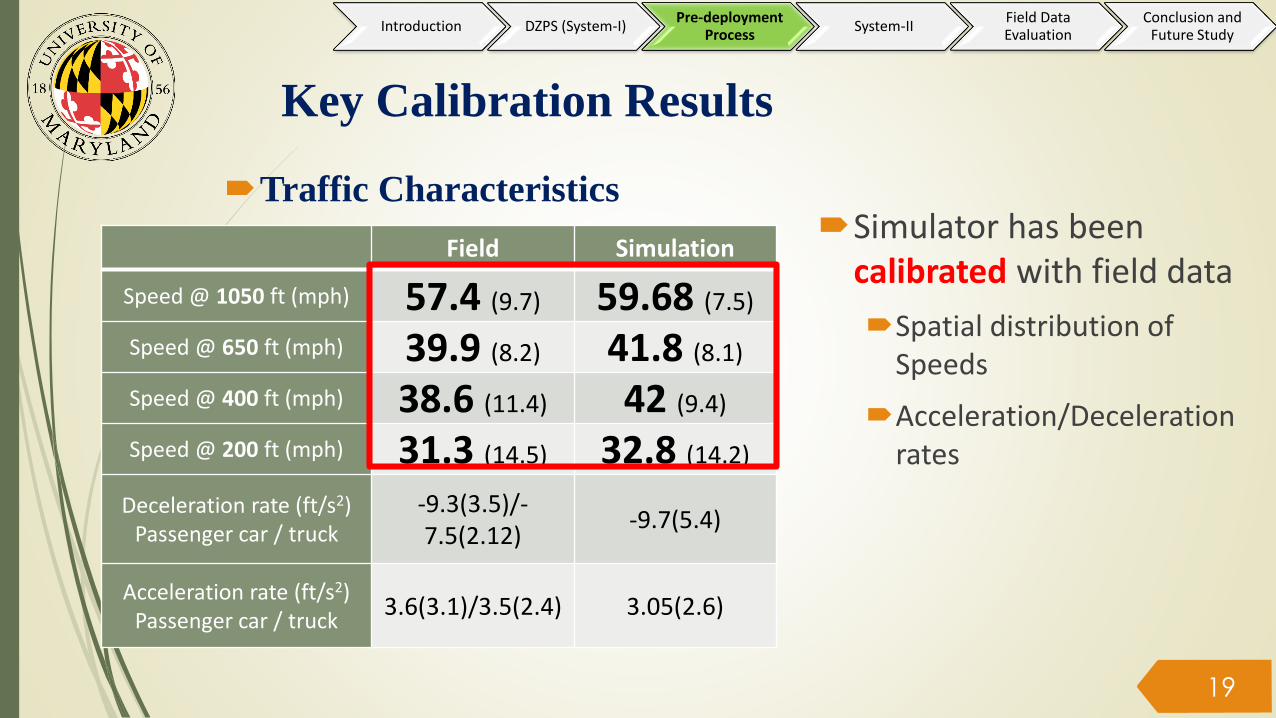
Key Calibration Results
Field Simulation
Speed @ 1050 ft (mph) 57.4 (9.7) 59.68 (7.5)
Speed @ 650 ft (mph) 39.9 (8.2) 41.8 (8.1)
Speed @ 400 ft (mph) 38.6 (11.4) 42 (9.4)
Speed @ 200 ft (mph) 31.3 (14.5) 32.8 (14.2)
Deceleration rate (ft/s2)Passenger car / truck
-9.3(3.5)/-7.5(2.12)
-9.7(5.4)
Acceleration rate (ft/s2)Passenger car / truck
3.6(3.1)/3.5(2.4) 3.05(2.6)
19
Traffic CharacteristicsSimulator has been
calibrated with field data
Spatial distribution of Speeds
Acceleration/Deceleration rates
Introduction DZPS (System-I)Pre-deployment
ProcessSystem-II
Field Data Evaluation
Conclusion and Future Study
Speed of vehicle on set of yellow
Location of vehicle from stop line onset of yellow
0 - 100 ft 100 - 200 ft 200 - 300 ft 300 - 400 ft 400 - 500 ft
Field Final Field Final Field Final Field Final Field Final
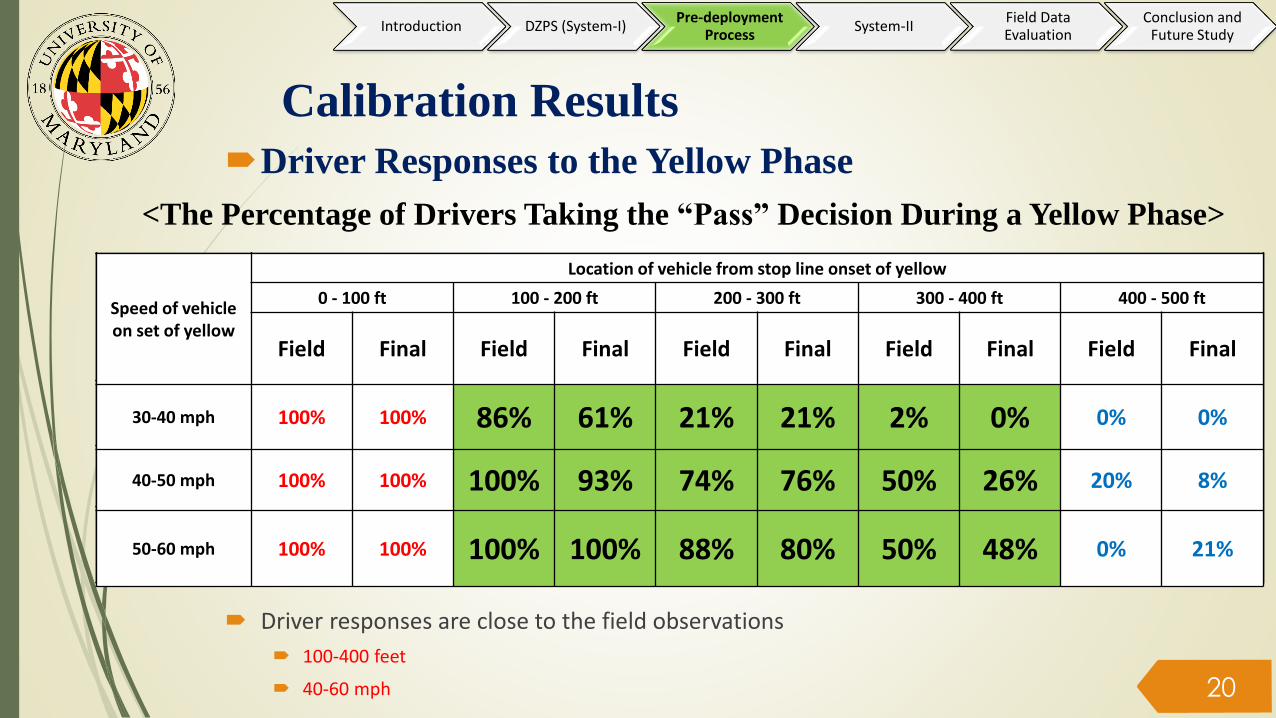
30-40 mph 100% 100% 86% 61% 21% 21% 2% 0% 0% 0%
40-50 mph 100% 100% 100% 93% 74% 76% 50% 26% 20% 8%
50-60 mph 100% 100% 100% 100% 88% 80% 50% 48% 0% 21%
<The Percentage of Drivers Taking the “Pass” Decision During a Yellow Phase>
20
Calibration Results
Driver Responses to the Yellow Phase
Driver responses are close to the field observations
100-400 feet
40-60 mph
Speed of vehicle on set of yellow
Location of vehicle from stop line onset of yellow
0 - 100 ft 100 - 200 ft 200 - 300 ft 300 - 400 ft 400 - 500 ft
Field Final Field Final Field Final Field Final Field Final
30-40 mph 100% 100% 86% 61% 21% 21% 2% 0% 0% 0%
40-50 mph 100% 100% 100% 93% 74% 76% 50% 26% 20% 8%
50-60 mph 100% 100% 100% 100% 88% 80% 50% 48% 0% 21%
Introduction DZPS (System-I)Pre-deployment
ProcessSystem-II
Field Data Evaluation
Conclusion and Future Study

Simulation Scenarios
Base scenario: No DZPS Base line for comparing the performance of different DZPS algorithms
Scenario 1: Base algorithm Divide the detection zone into two zones
If a vehicle running at the speed greater than 27 mph in the first zone or a vehicle running at the speed greater than 56 mph in the second zone is detected during the all-red phase, then extend the all-red phase.
Scenario 2: The Proposed Algorithm-1 (Individual based)
Scenario 3: The Proposed Algorithm-2 (Zone based)
*Each scenario has been simulated 40 hours of simulation
21
Introduction DZPS (System-I)Pre-deployment
ProcessSystem-II
Field Data Evaluation
Conclusion and Future Study

MOEs and Result Analysis
MOE No Control Default Algorithm-I
(Individual based)
Algorithm-II
(Zone based)
Red-light running(RLR) rate (# of RLR vehs / 100 cycle)
8.9 8.9 9.5 9.1
Extension call rate(extension calls / 100 cycle)
- 52 30 25
False alarm rate
(false alarm frequency/ cycle)
- 47 % 21 % 16 %
Detection rate
(# of protected RLR vehs/ total # of RLR vehs ) 4
- 56% 100% 100% 22
Algorithm 1 : 100 % detection rate, 21 % false alarm rate
Algorithm 2: 100 % detection rate, 16 % false alarm rate
Introduction DZPS (System-I)Pre-deployment
ProcessSystem-II
Field Data Evaluation
Conclusion and Future Study

Sensitivity Analysis
(False Alarm Rate and Detection Rate)
Trade off between the false alarm and detection rates
Intersection safety is the main objective
P = 0.8 (probability)
Detection rate 100%
False alarm rate 16%0%
10%
20%
30%
40%
50%
60%
70%
80%
90%
100%
0.6 0.7 0.8 0.9
Pe
rce
nta
ge
Probability of Pass
Trade-off between detection rate and false
alarm rate (P= 0.6,0.7,0.8,0.9)*
Detection Rate False Alarm Rate 23
Introduction DZPS (System-I)Pre-deployment
ProcessSystem-II
Field Data Evaluation
Conclusion and Future Study

Enhancements of System-I to System-II
How to fully utilize existing hardware?
Can the “warning message” be replaced with an advisory speed?
Can Safety and mobility be currently improved?
How to compute the advisory speed?
Can the “advisory speed” be displayed in advance under the actuated signal control? Development of a gap-out prediction methodology
24
Introduction DZPS (System-I)Pre-deployment
ProcessSystem-II
Field Data Evaluation
Conclusion and Future Study
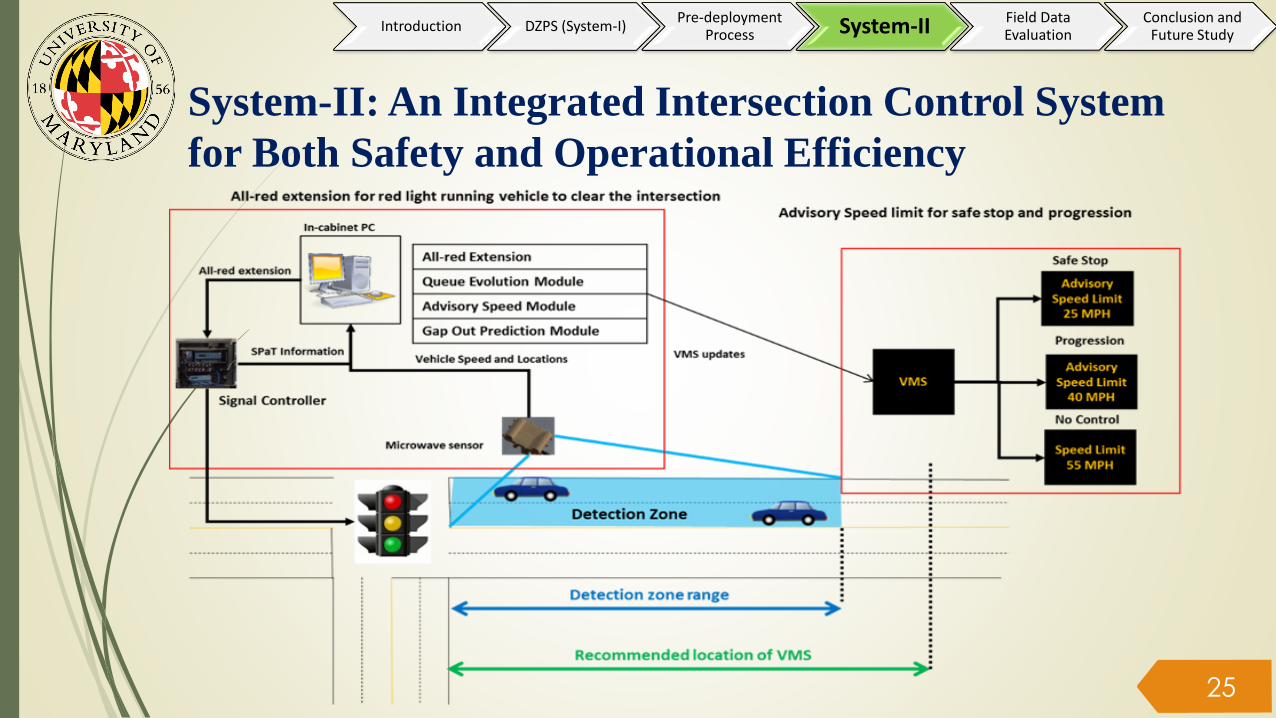
System-II: An Integrated Intersection Control System
for Both Safety and Operational Efficiency
25
Introduction DZPS (System-I)Pre-deployment
Process System-II Field Data Evaluation
Conclusion and Future Study

Variable Advisory Speed Provide advisory speed for:
Safe stop to vehicles during the yellow and red phase
Progression to vehicles at the end of the red phase or beginning of a green phase
26
Safe Stop Progression
Introduction DZPS (System-I)Pre-deployment
Process System-II Field Data Evaluation
Conclusion and Future Study

Gap-out Prediction Strategies
To estimate the gap-out timing for an actuated signal control
To provide advisory speeds for vehicles either arriving at the start or the end of the green (progression and safe stop)
• Step 1
• Calculate the Avg acceleration rate
• Calculate the current trajectory
• Step 2
• Check for potential conflicts with the leading vehicle
• Step 3
• Estimated the ETA time
• Step 4
• Determine the green termination time by compared with a min green and a max green
27
Introduction DZPS (System-I)Pre-deployment
Process System-II Field Data Evaluation
Conclusion and Future Study
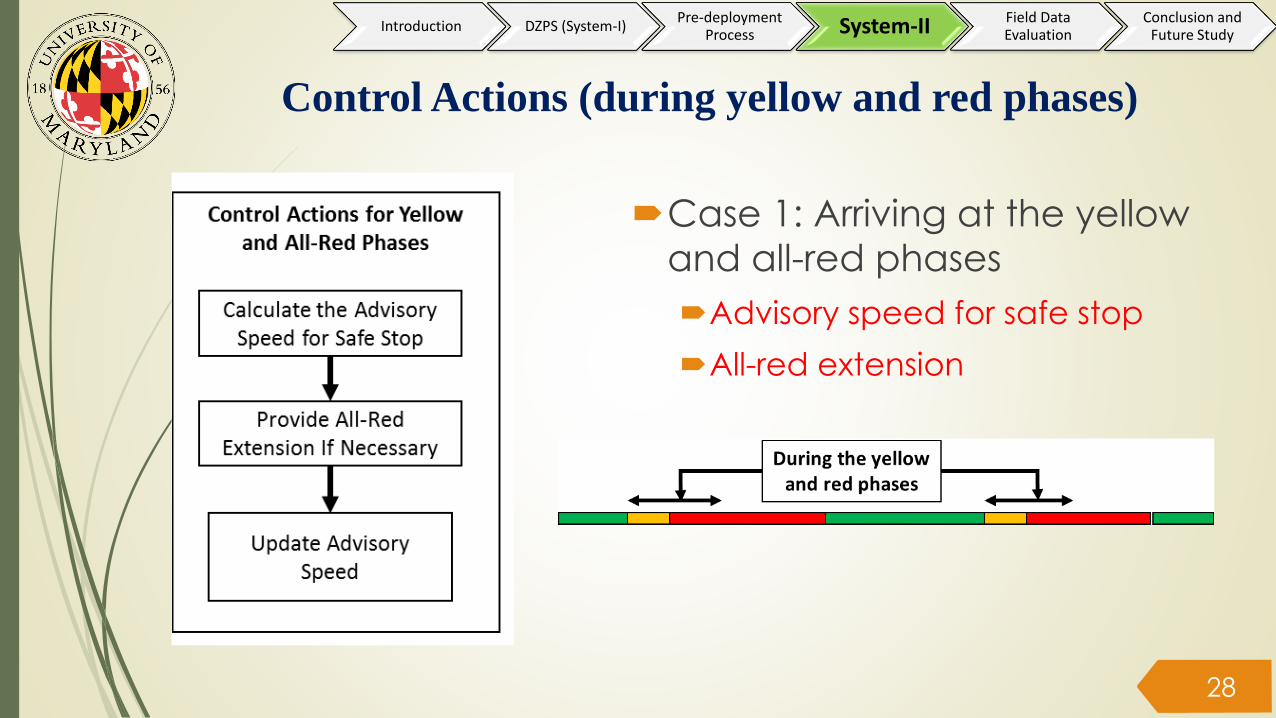
Control Actions (during yellow and red phases)
Case 1: Arriving at the yellow
and all-red phases
Advisory speed for safe stop
All-red extension
28
Introduction DZPS (System-I)Pre-deployment
Process System-II Field Data Evaluation
Conclusion and Future Study
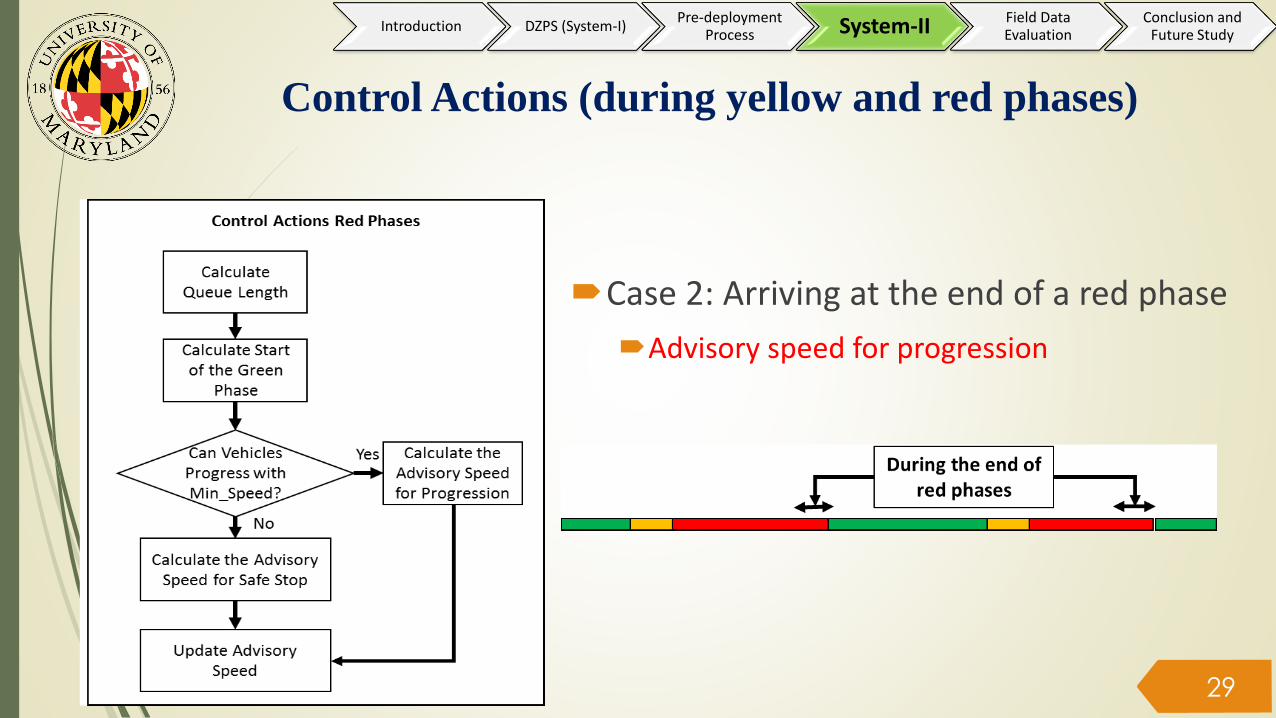
Control Actions (during yellow and red phases)
Case 2: Arriving at the end of a red phase
Advisory speed for progression
29
Introduction DZPS (System-I)Pre-deployment
Process System-II Field Data Evaluation
Conclusion and Future Study
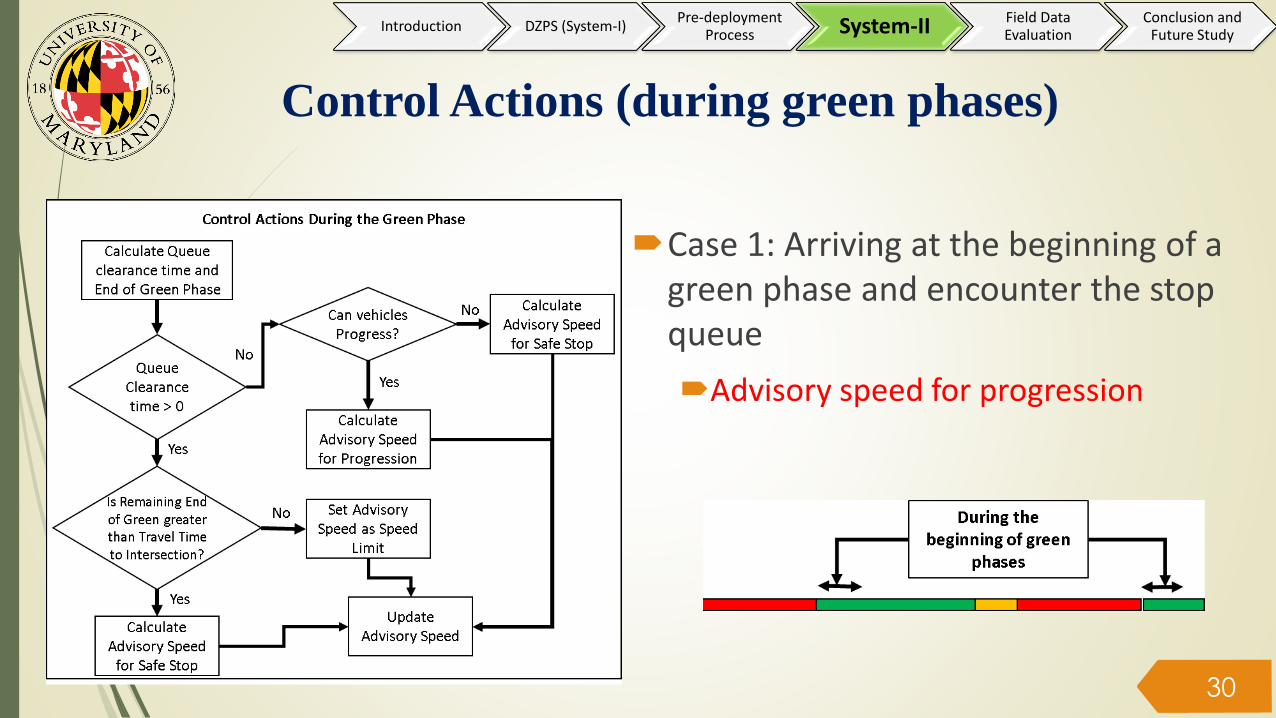
Control Actions (during green phases)
Case 1: Arriving at the beginning of a green phase and encounter the stop queue
Advisory speed for progression
30
Introduction DZPS (System-I)Pre-deployment
Process System-II Field Data Evaluation
Conclusion and Future Study
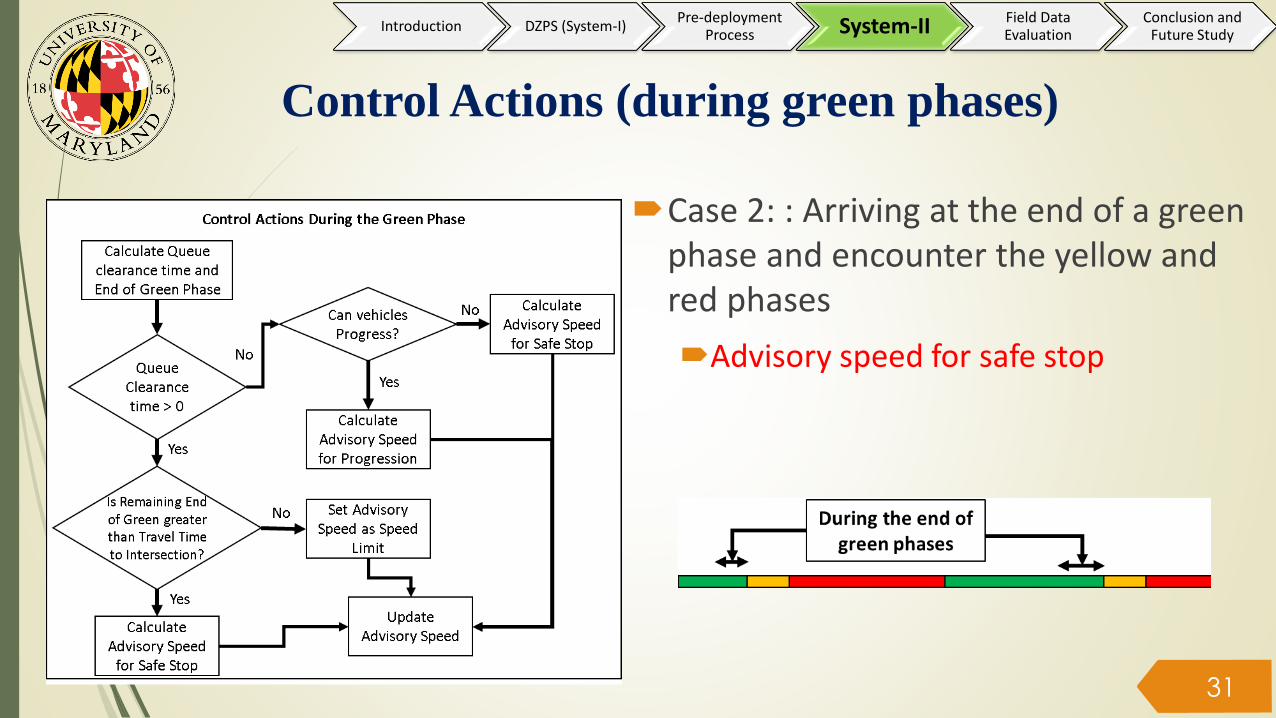
Control Actions (during green phases)
Case 2: : Arriving at the end of a green phase and encounter the yellow and red phases
Advisory speed for safe stop
31
Introduction DZPS (System-I)Pre-deployment
Process System-II Field Data Evaluation
Conclusion and Future Study

Experimental Scenarios for simulation
analysisBase scenario:
Without any proactive/reactive protection system
Scenario 1: System-I only
Scenario 2: System-II
Scenario 2-1: Set the driver compliance rate to 100%.
Scenario 2-2: Set the driver compliance rate to 50%.
Scenario 2-3: Set the driver compliance rate to 25%.
32
Introduction DZPS (System-I)Pre-deployment
Process System-II Field Data Evaluation
Conclusion and Future Study
Result Analysis
34
Scenarios
MOEs
Base CaseAll-Red
Extension Only(System-I)
All-Red Extension and Advisory Speed (System-II)
100% compliance
50% compliance
25% compliance
Safety
Average number of hard-braking
vehicles per cycle 0.66 (0.76) 0.66 (0.77) 0.15 (0.18) 0.24 (0.21) 0.29 (0.26)
Total number of vehicles in dilemma
zone892 (792) 862 (770) 540 (525) 702 (596) 790 (622)
The average number of red-light running
vehicles per cycle (RLR / cycle)0.11 (0.094) 0.11 (0.097) 0.06 (0.064) 0.08 (0.08) 0.09 (0.087)
Detection rate for red-light running
vehicles-(-) 100% (100%) 100% (100%) 100% (100%) 100% (100%)
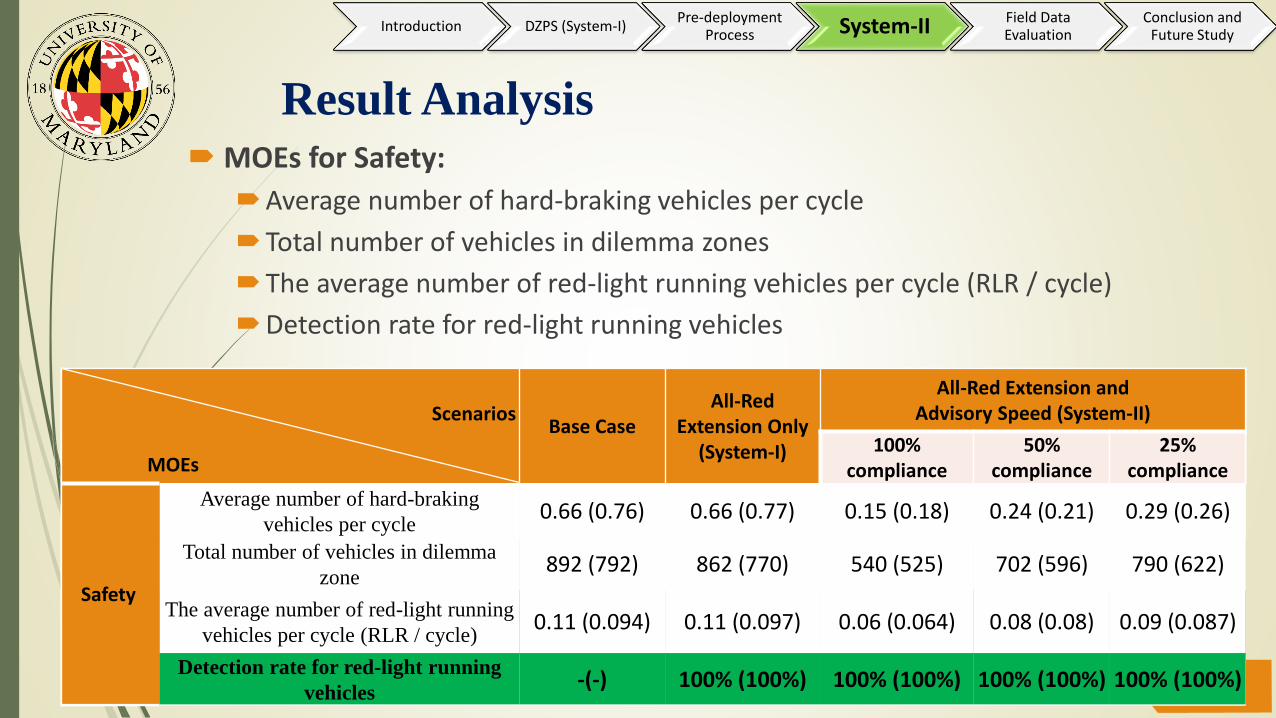
MOEs for Safety:
Average number of hard-braking vehicles per cycle
Total number of vehicles in dilemma zones
The average number of red-light running vehicles per cycle (RLR / cycle)
Detection rate for red-light running vehicles
Scenarios
MOEs
Base CaseAll-Red
Extension Only(System-I)
All-Red Extension and Advisory Speed (System-II)
100% compliance
50% compliance
25% compliance
Safety
Average number of hard-braking
vehicles per cycle 0.66 (0.76) 0.66 (0.77) 0.15 (0.18) 0.24 (0.21) 0.29 (0.26)
Total number of vehicles in dilemma
zone892 (792) 862 (770) 540 (525) 702 (596) 790 (622)
The average number of red-light running
vehicles per cycle (RLR / cycle)0.11 (0.094) 0.11 (0.097) 0.06 (0.064) 0.08 (0.08) 0.09 (0.087)
Detection rate for red-light running
vehicles-(-) 100% (100%) 100% (100%) 100% (100%) 100% (100%)
Introduction DZPS (System-I)Pre-deployment
Process System-II Field Data Evaluation
Conclusion and Future Study
Result Analysis
34
Scenarios
MOEs
Base CaseAll-Red
Extension Only(System-I)
All-Red Extension and Advisory Speed (System-II)
100% compliance
50% compliance
25% compliance
Mobility
Average number of stops per cycle 6.4 (6.4) 6.5 (6) 4.2 (4.5) 4.5 (5.1) 4.6 (6.89)
Average stopped delay for all
vehicles per cycle (second)45.7 (76) 48.6 (77) 38.0 (54) 40.5 (59) 42.1 (63)
Average fuel consumption per cycle
(Gallon)0.239 (0.24) 0.226 (0.022) 0.13 (0.14) 0.16 (0.15) 0.167 (0.17)
False alarm rate for the all-red
extension- (-) 14% (16%) 5% (4%) 10% (7%) 12% (7%)
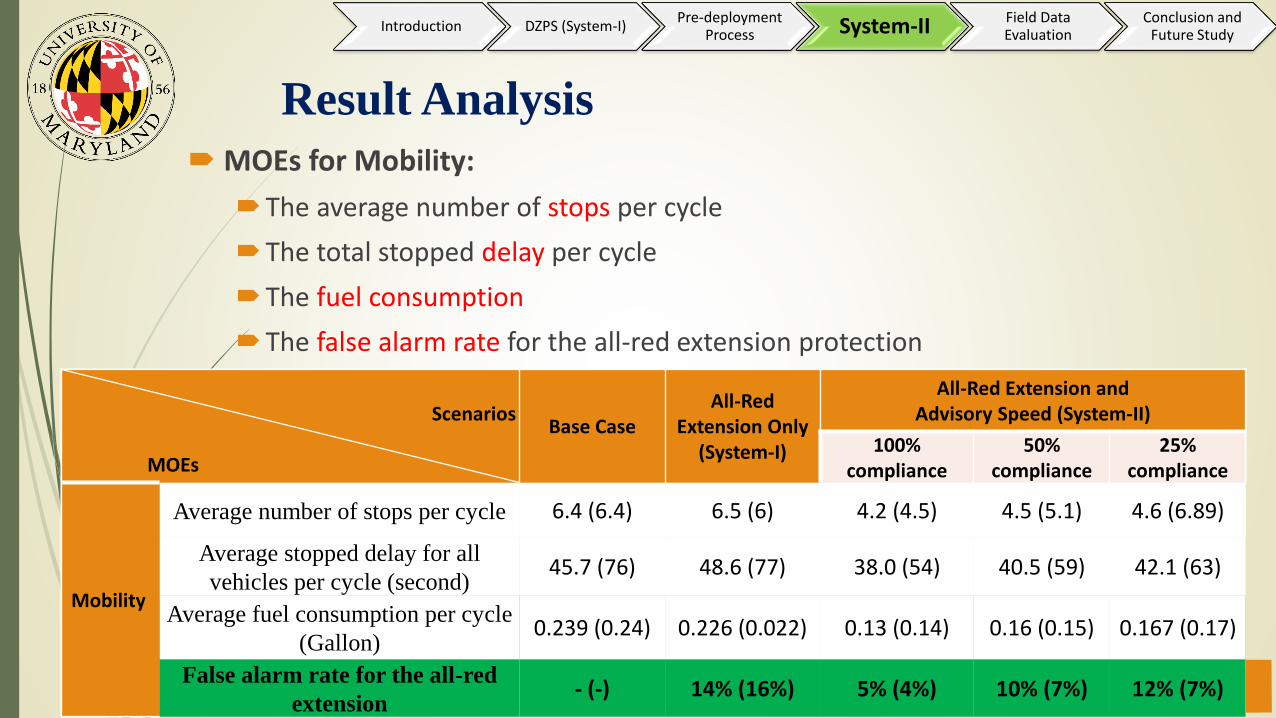
MOEs for Mobility:
The average number of stops per cycle
The total stopped delay per cycle
The fuel consumption
The false alarm rate for the all-red extension protection
Scenarios
MOEs
Base CaseAll-Red
Extension Only(System-I)
All-Red Extension and Advisory Speed (System-II)
100% compliance
50% compliance
25% compliance
Mobility
Average number of stops per cycle 6.4 (6.4) 6.5 (6) 4.2 (4.5) 4.5 (5.1) 4.6 (6.89)
Average stopped delay for all
vehicles per cycle (second)45.7 (76) 48.6 (77) 38.0 (54) 40.5 (59) 42.1 (63)
Average fuel consumption per cycle
(Gallon)0.239 (0.24) 0.226 (0.022) 0.13 (0.14) 0.16 (0.15) 0.167 (0.17)
False alarm rate for the all-red
extension- (-) 14% (16%) 5% (4%) 10% (7%) 12% (7%)
Scenarios
MOEs
Base CaseAll-Red
Extension Only(System-I)
All-Red Extension and Advisory Speed (System-II)
100% compliance
50% compliance
25% compliance
Mobility
Average number of stops per cycle 6.4 (6.4) 6.5 (6) 4.2 (4.5) 4.5 (5.1) 4.6 (6.89)
Average stopped delay for all
vehicles per cycle (second)45.7 (76) 48.6 (77) 38.0 (54) 40.5 (59) 42.1 (63)
Average fuel consumption per
cycle (Gallon)0.239 (0.24) 0.226 (0.022) 0.13 (0.14) 0.16 (0.15) 0.167 (0.17)
False alarm rate for the all-red
extension- (-) 14% (16%) 5% (4%) 10% (7%) 12% (7%)
Scenarios
MOEs
Base CaseAll-Red
Extension Only(System-I)
All-Red Extension and Advisory Speed (System-II)
100% compliance
50% compliance
25% compliance
Mobility
Average number of stops per cycle 6.4 (6.4) 6.5 (6) 4.2 (4.5) 4.5 (5.1) 4.6 (6.89)
Average stopped delay for all
vehicles per cycle (second)45.7 (76) 48.6 (77) 38.0 (54) 40.5 (59) 42.1 (63)
Average fuel consumption per cycle
(Gallon)0.239 (0.24) 0.226 (0.022) 0.13 (0.14) 0.16 (0.15) 0.167 (0.17)
False alarm rate for the all-red
extension- (-) 14% (16%) 5% (4%) 10% (7%) 12% (7%)
Introduction DZPS (System-I)Pre-deployment
Process System-II Field Data Evaluation
Conclusion and Future Study
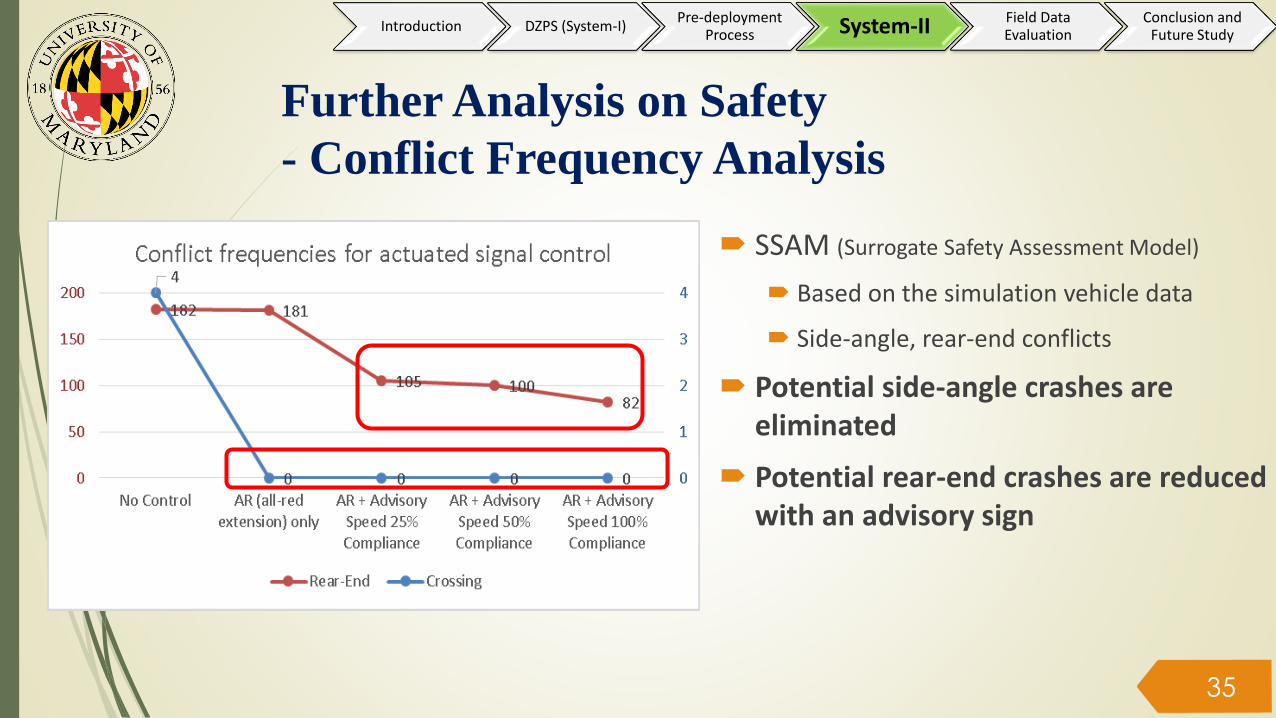
Further Analysis on Safety
- Conflict Frequency Analysis
SSAM (Surrogate Safety Assessment Model)
Based on the simulation vehicle data
Side-angle, rear-end conflicts
Potential side-angle crashes are eliminated
Potential rear-end crashes are reduced with an advisory sign
35
Introduction DZPS (System-I)Pre-deployment
Process System-II Field Data Evaluation
Conclusion and Future Study

Post-Deployment Evaluation
for System-I
36
Introduction DZPS (System-I)Pre-deployment
ProcessSystem-II
Field Data Evaluation
Conclusion and Future Study
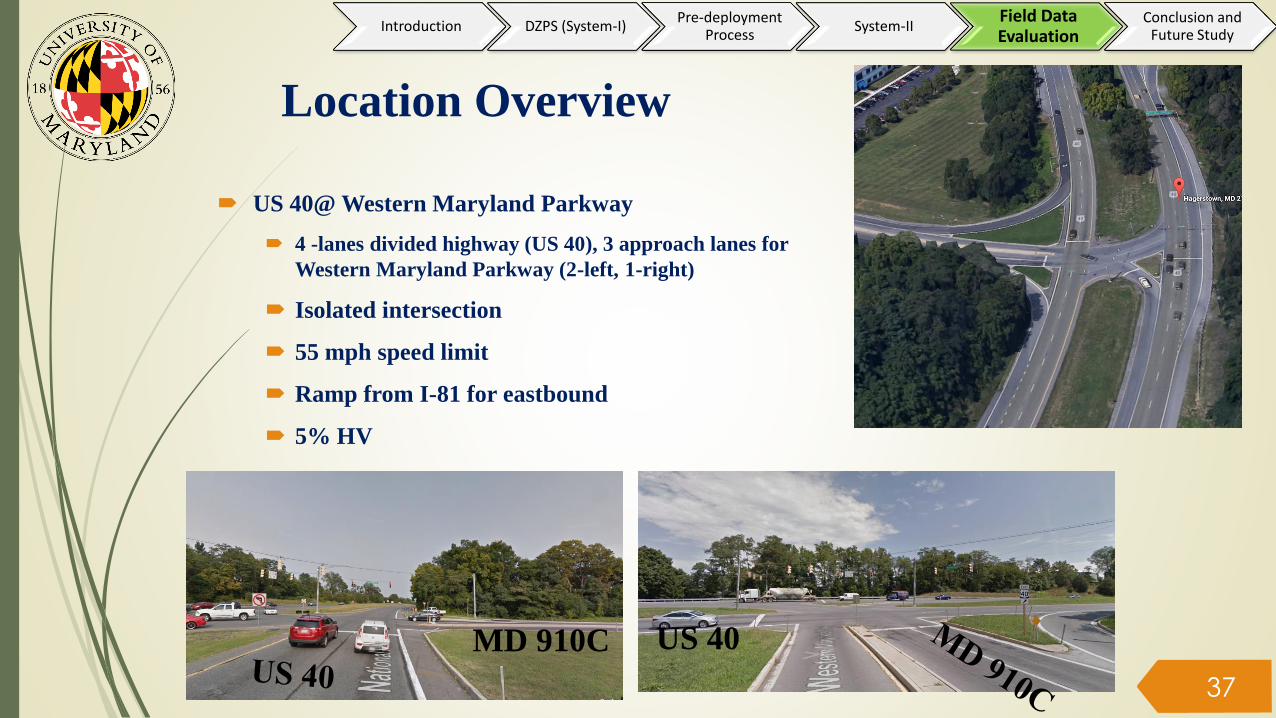
Location Overview
US 40@ Western Maryland Parkway
4 -lanes divided highway (US 40), 3 approach lanes for
Western Maryland Parkway (2-left, 1-right)
Isolated intersection
55 mph speed limit
Ramp from I-81 for eastbound
5% HV
US 40MD 910C
37
Introduction DZPS (System-I)Pre-deployment
ProcessSystem-II
Field Data Evaluation
Conclusion and Future Study

Accident history diagram
Accident History (2011-2013)
7 crashes potentially
related to dilemma zone
decisions for 3 years
(side-angle crashes)
3 injuries
38
Introduction DZPS (System-I)Pre-deployment
ProcessSystem-II
Field Data Evaluation
Conclusion and Future Study
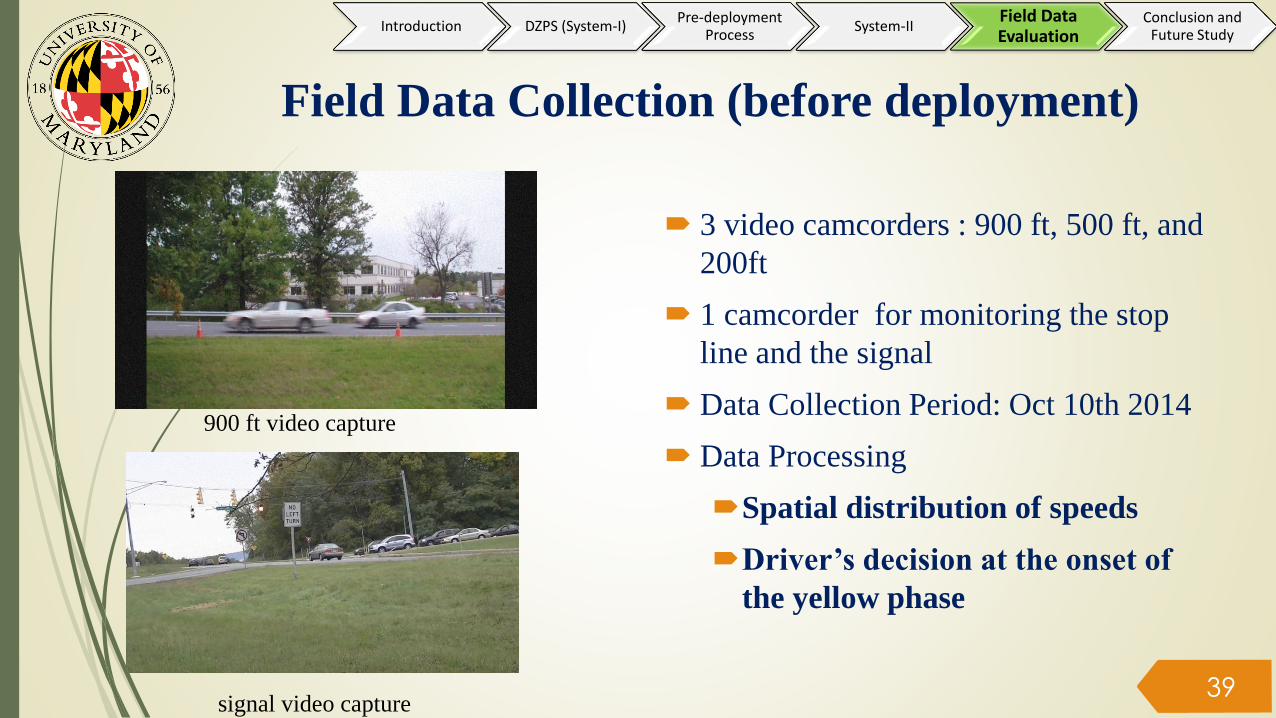
Field Data Collection (before deployment)
3 video camcorders : 900 ft, 500 ft, and
200ft
1 camcorder for monitoring the stop
line and the signal
Data Collection Period: Oct 10th 2014
Data Processing
Spatial distribution of speeds
Driver’s decision at the onset of
the yellow phase
900 ft video capture
signal video capture39
Introduction DZPS (System-I)Pre-deployment
ProcessSystem-II
Field Data Evaluation
Conclusion and Future Study
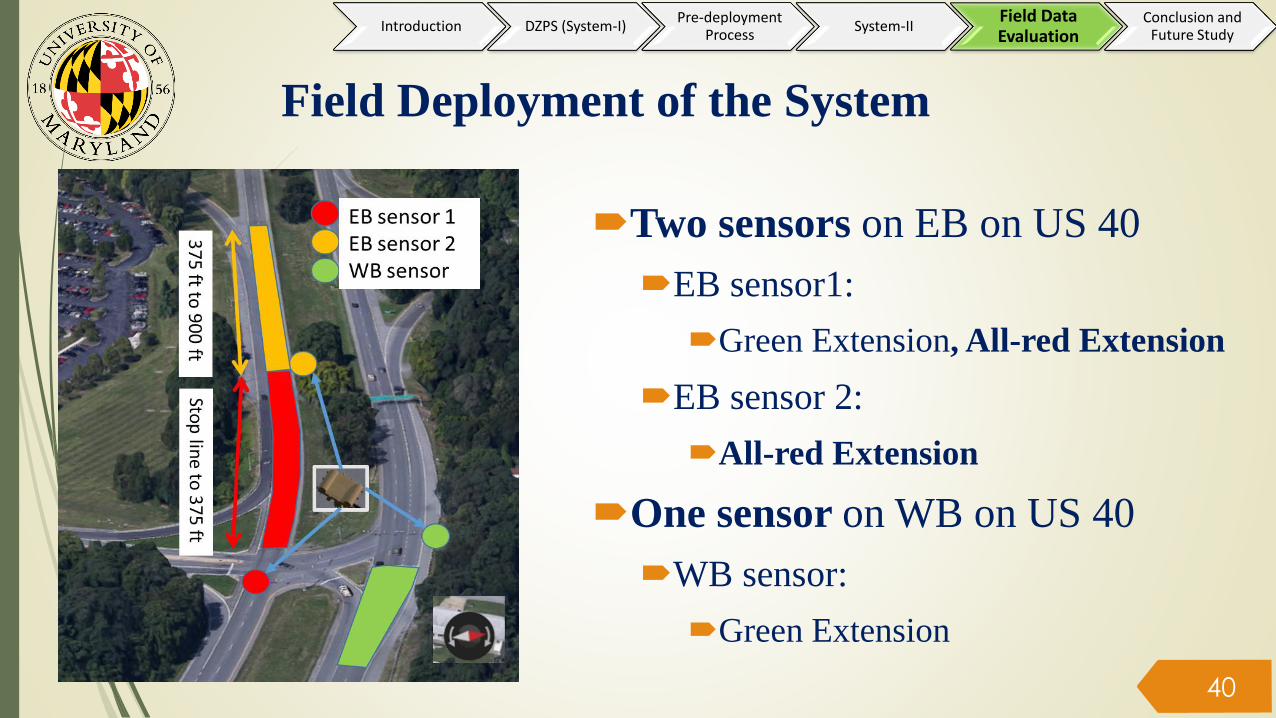
Field Deployment of the System
Two sensors on EB on US 40
EB sensor1:
Green Extension, All-red Extension
EB sensor 2:
All-red Extension
One sensor on WB on US 40
WB sensor:
Green Extension
40
Introduction DZPS (System-I)Pre-deployment
ProcessSystem-II
Field Data Evaluation
Conclusion and Future Study
Key deployment Activities
Check the sensor’s functions
Validate the speed and location of approaching vehicles with sensor data
Checked whether or not the sensor sending proper calls to the signal controller
Using camcorders record to measure signal timings
Identify if there are all-red extension calls from the recorded video
Identify red-light running vehicles
Compare all-red extensions and red-light running vehicles to identify missed calls, false alarm, and correct calls
41
Introduction DZPS (System-I)Pre-deployment
ProcessSystem-II
Field Data Evaluation
Conclusion and Future Study

Field Data Collection after Deployment
Signal timings (camcorders)
Traffic speeds and locations
(sensors)
Decisions of drivers during the
yellow phase
System’s performance
42
Date Time Veh ID Speed Location Signal
10/14/2016 57:56.5 28168 49 465 Green
10/14/2016 57:56.7 28168 49 455 Yellow
10/14/2016 57:56.9 28168 49 445 Yellow
10/14/2016 57:57.0 28168 49 430 Yellow
10/14/2016 57:57.2 28168 49 420 Yellow
10/14/2016 58:01.5 28168 46 120 Yellow
10/14/2016 58:01.7 28168 46 115 Red
10/14/2016 58:01.8 28168 46 105 Red
10/14/2016 58:02.0 28168 46 90 Red
10/14/2016 58:02.2 28168 45 80 Red
….
Introduction DZPS (System-I)Pre-deployment
ProcessSystem-II
Field Data Evaluation
Conclusion and Future Study
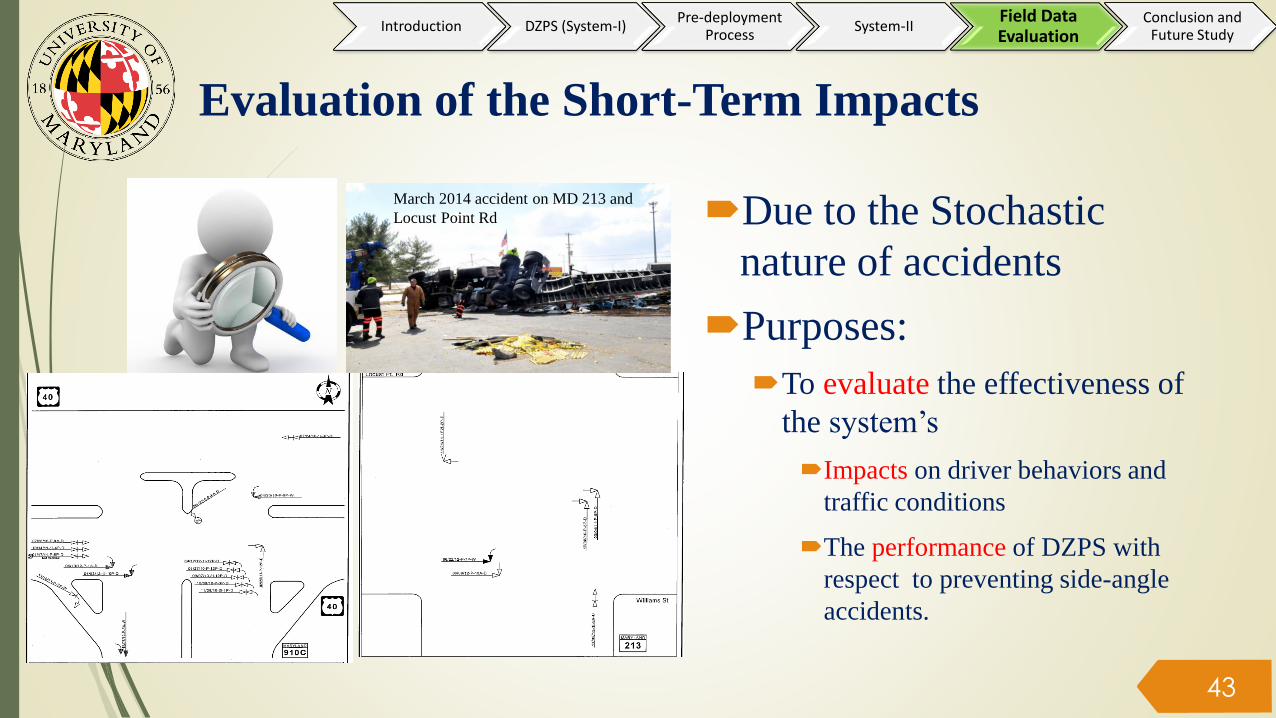
Evaluation of the Short-Term Impacts
Due to the Stochastic
nature of accidents
Purposes:
To evaluate the effectiveness of
the system’s
Impacts on driver behaviors and
traffic conditions
The performance of DZPS with
respect to preventing side-angle
accidents.
March 2014 accident on MD 213 and
Locust Point Rd
43
Introduction DZPS (System-I)Pre-deployment
ProcessSystem-II
Field Data Evaluation
Conclusion and Future Study

Impacts by the Roadside Sensors?
Impacts on the traffic?
Change in the Speed?
Change in
acceleration/deceleration rates?
Change on decisions of drivers
during the yellow phase?
Roadside Sensors44
Introduction DZPS (System-I)Pre-deployment
ProcessSystem-II
Field Data Evaluation
Conclusion and Future Study
30
35
40
45
50
55
60
900 ft 500 ft 200 ft
Sp
ee
d (
MP
H)
Before After
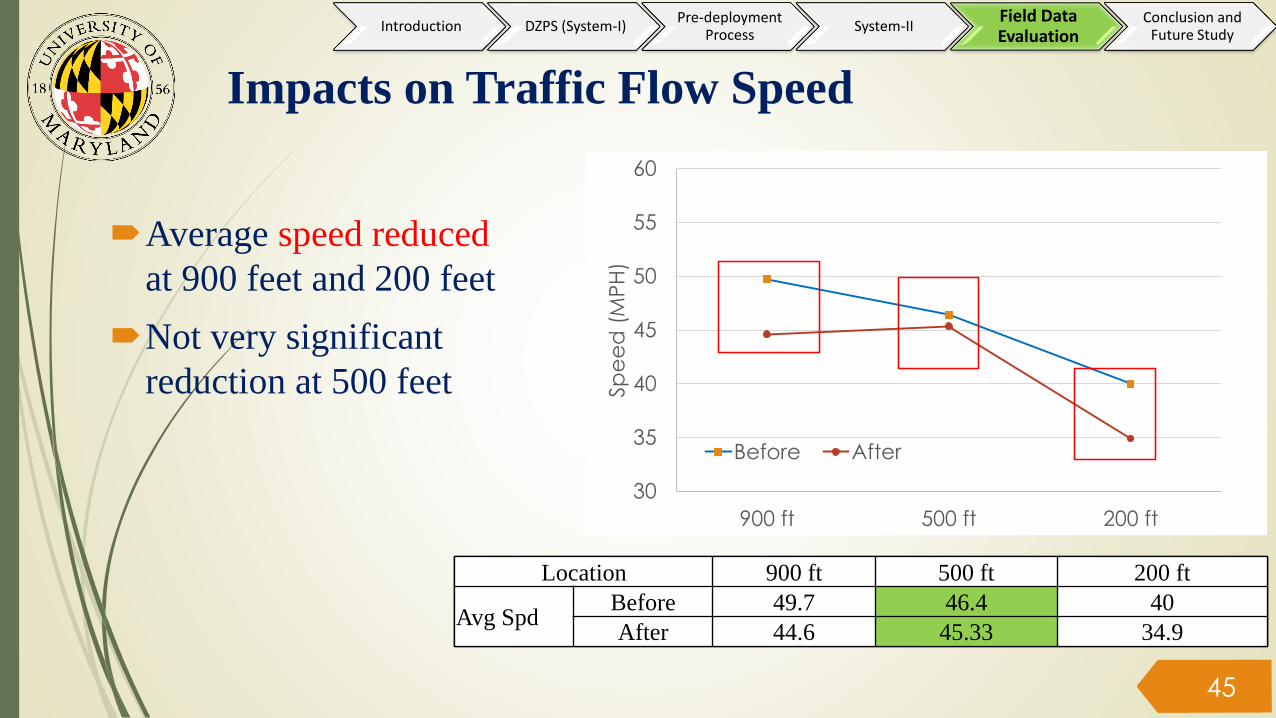
Impacts on Traffic Flow Speed
Average speed reduced
at 900 feet and 200 feet
Not very significant
reduction at 500 feet
45
Location 900 ft 500 ft 200 ft
Avg SpdBefore 49.7 46.4 40
After 44.6 45.33 34.9
Location 900 ft 500 ft 200 ft
Avg SpdBefore 49.7 46.4 40
After 44.6 45.33 34.9
Location 900 ft 500 ft 200 ft
Avg SpdBefore 49.7 46.4 40
After 44.6 45.33 34.9
Introduction DZPS (System-I)Pre-deployment
ProcessSystem-II
Field Data Evaluation
Conclusion and Future Study

Impacts on Traffic Flow Speed
Percentage of the high-speed drivers
(above speed limit at 900 feet) reduced
from 29 % to 16%
Vehicles mostly choose to slow down
when approaching the intersection
46
SpeedBefore After
Frequncy Percentage Frequncy Percentage
75 14 1% 0 0%
70 36 3% 3 0%
65 58 5% 6 0%
60 92 7% 94 3%
55* 160 13% 375 13%
50 189 15% 850 29%
45 206 17% 951 32%
40 236 19% 432 15%
35 153 12% 166 6%
30 68 6% 56 2%
25 19 2% 10 0%
Total 1231 100% 2943 100%
* Speed limit: 55 MPH
SpeedBefore After
Frequncy Percentage Frequncy Percentage
75 14 1% 0 0%
70 36 3% 3 0%
65 58 5% 6 0%
60 92 7% 94 3%
55* 160 13% 375 13%
50 189 15% 850 29%
45 206 17% 951 32%
40 236 19% 432 15%
35 153 12% 166 6%
30 68 6% 56 2%
25 19 2% 10 0%
Total 1231 100% 2943 100%
* Speed limit: 55 MPH
Introduction DZPS (System-I)Pre-deployment
ProcessSystem-II
Field Data Evaluation
Conclusion and Future Study
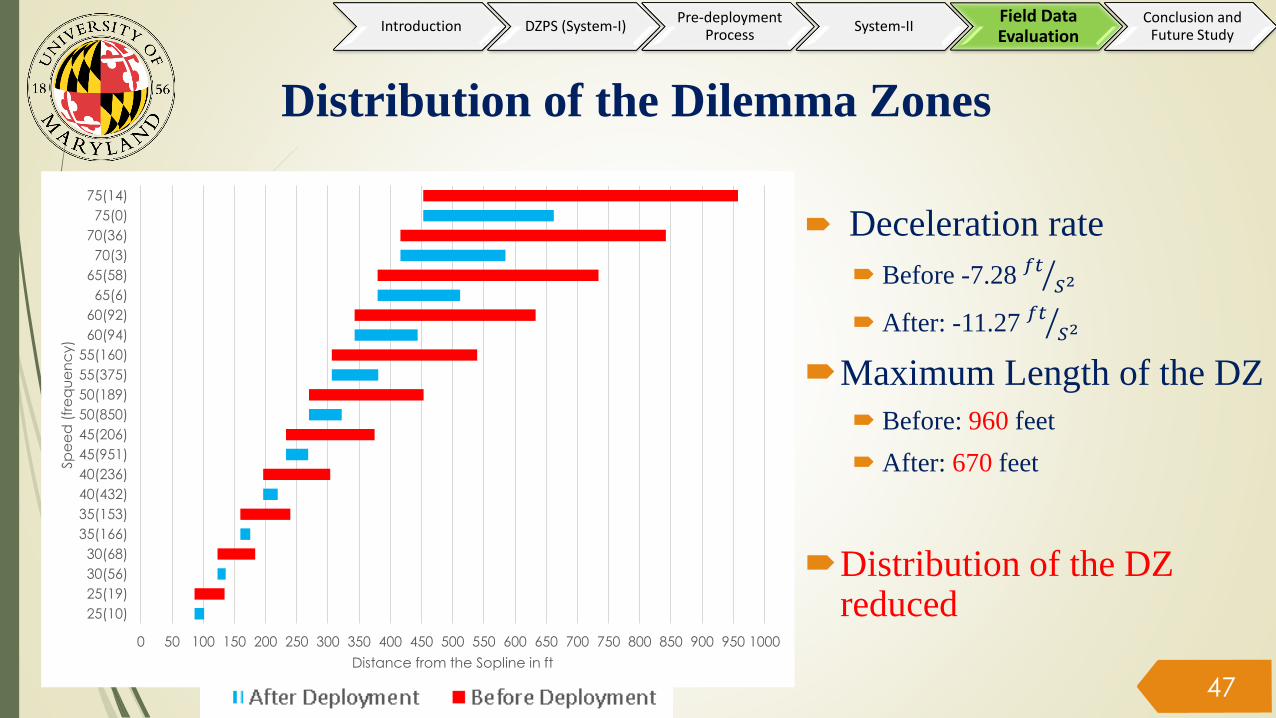
Distribution of the Dilemma Zones
Deceleration rate
Before -7.28 𝑓𝑡𝑆2
After: -11.27 𝑓𝑡𝑆2
Maximum Length of the DZ
Before: 960 feet
After: 670 feet
Distribution of the DZ reduced
47
0 50 100 150 200 250 300 350 400 450 500 550 600 650 700 750 800 850 900 950 1000
25(10)
25(19)
30(56)
30(68)
35(166)
35(153)
40(432)
40(236)
45(951)
45(206)
50(850)
50(189)
55(375)
55(160)
60(94)
60(92)
65(6)
65(58)
70(3)
70(36)
75(0)
75(14)
Distance from the Sopline in ft
Sp
ee
d (
fre
qu
en
cy)
Introduction DZPS (System-I)Pre-deployment
ProcessSystem-II
Field Data Evaluation
Conclusion and Future Study
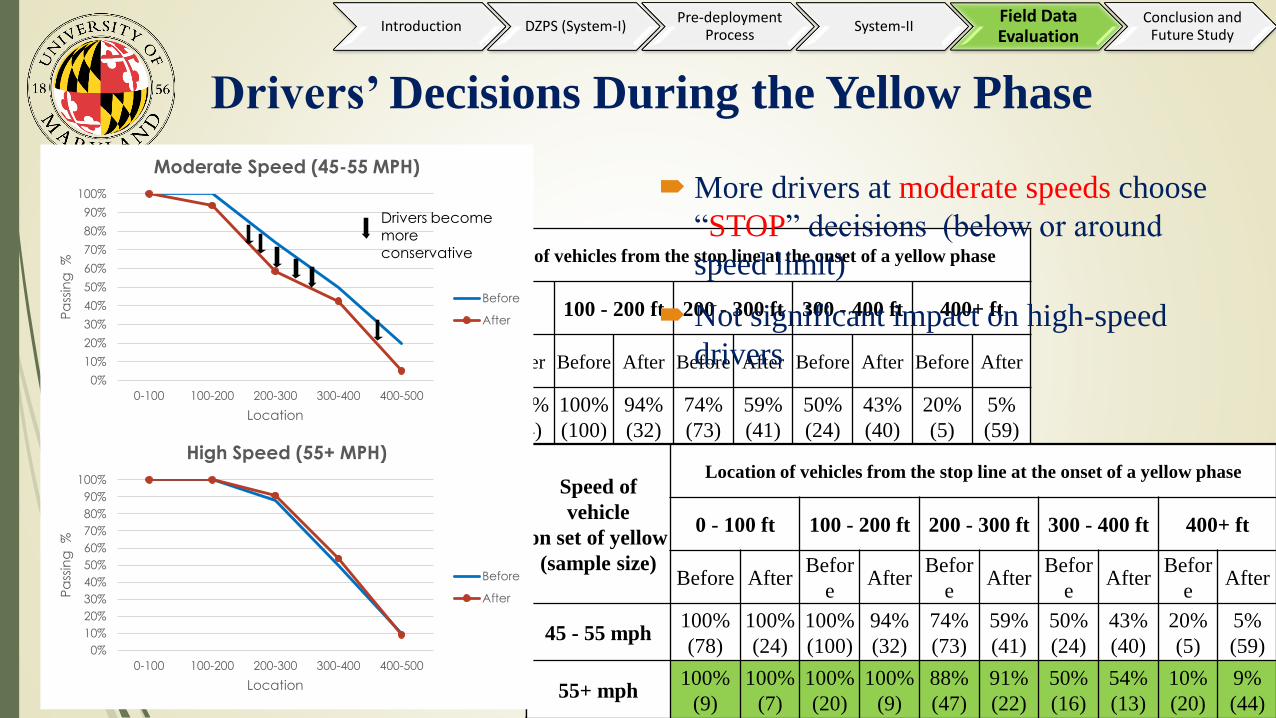
Speed of
vehicle
on set of yellow
(sample size)
Location of vehicles from the stop line at the onset of a yellow phase
0 - 100 ft 100 - 200 ft 200 - 300 ft 300 - 400 ft 400+ ft
Before After Before After Before After Before After Before After
45 - 55 mph100%
(78)
100%
(24)
100%
(100)
94%
(32)
74%
(73)
59%
(41)
50%
(24)
43%
(40)
20%
(5)
5%
(59)
55+ mph100%
(9)
100%
(7)
100%
(20)
100%
(9)
88%
(47)
91%
(22)
50%
(16)
54%
(13)
10%
(20)
9%
(44)
Drivers’ Decisions During the Yellow Phase
More drivers at moderate speeds choose
“STOP” decisions (below or around
speed limit)
Not significant impact on high-speed
drivers
48
Speed of
vehicle
on set of yellow
(sample size)
Location of vehicles from the stop line at the onset of a yellow phase
0 - 100 ft 100 - 200 ft 200 - 300 ft 300 - 400 ft 400+ ft
Before AfterBefor
eAfter
Befor
eAfter
Befor
eAfter
Befor
eAfter
45 - 55 mph100%
(78)
100%
(24)
100%
(100)
94%
(32)
74%
(73)
59%
(41)
50%
(24)
43%
(40)
20%
(5)
5%
(59)
55+ mph100%
(9)
100%
(7)
100%
(20)
100%
(9)
88%
(47)
91%
(22)
50%
(16)
54%
(13)
10%
(20)
9%
(44)
0%
10%
20%
30%
40%
50%
60%
70%
80%
90%
100%
0-100 100-200 200-300 300-400 400-500
Pa
ssin
g
%
Location
Moderate Speed (45-55 MPH)
Before
After
Drivers become more conservative
0%
10%
20%
30%
40%
50%
60%
70%
80%
90%
100%
0-100 100-200 200-300 300-400 400-500
Pa
ssin
g
%
Location
High Speed (55+ MPH)
Before
After
Introduction DZPS (System-I)Pre-deployment
ProcessSystem-II
Field Data Evaluation
Conclusion and Future Study

Performance Evaluation on
Detection and Activation
5 vehicles ran on the red
phases
System provides all-red
extension to all such
vehicles
100% detection rate
30% false alarm rate
49
MOE SimulationField
Operation*
Detection rate (protected RLR)
100% 100%
False alarm rate(false alarm / 100 cycle)
21 30
Introduction DZPS (System-I)Pre-deployment
ProcessSystem-II
Field Data Evaluation
Conclusion and Future Study
Summary of Findings from Field Evaluation
Deployed DZPS can
Reduce the average approaching vehicle speed
Reduce the percentage of high-speed vehicles
Reduce the range of dilemma zones
Encourage drivers to take the “stop” action during the
yellow phase
High-Speed vehicles
Are more likely to be reduced
Side-street vehicles are protected by all-red extensions50
Introduction DZPS (System-I)Pre-deployment
ProcessSystem-II
Field Data Evaluation
Conclusion and Future Study

Additional Findings from Design and
Deployment of DZPS
A function to track each individual vehicle’s speed and location
(Wide-range traffic monitoring sensor) over a monitoring
zone is the essential input for the proposed system’s computing
module
Design of intersection safety issue should be based on behaviors
of driving population
Field observations are essential for understanding key factors
contributing to accidents
A set of robust behavior models are needed for predicting
driver behaviors51
Introduction DZPS (System-I)Pre-deployment
ProcessSystem-II
Field Data Evaluation
Conclusion and Future Study
Additional Findings from Design and
Deployment of DZPS
The behavior of aggressive drivers is unlikely to change
significantly from the roadside sensor or AWS– justify the need of
a reactive control
To ensure the success of a system and to identify any potential
issues, it is beneficial to have a well-calibrated traffic simulator
A well-designed all-red extension algorithm can effectively
predict red-light running vehicles to prevent potential side-
crashing accidents
Enhancement of the DZPS for all-red extension to speed
harmonization can be implemented with minimal additional
hardware 52
Introduction DZPS (System-I)Pre-deployment
ProcessSystem-II
Field Data Evaluation
Conclusion and Future Study
Additional Findings from Design and
Deployment of DZPS
An integrated system can improve both intersection safety and
mobility
Effective monitoring of the evolution of intersection traffic
queues and gap-out timing are critical input for computing
advisory speed
Proper display of the VMS/VSL can effectively reduce the number
of vehicles trapped in the dilemma zone and thereby reduce
number of rear-end and side-angle crashes
A higher compliance rate under the displayed message/advisory
speed will often result in a safer and more efficient traffic
environment 53
Introduction DZPS (System-I)Pre-deployment
ProcessSystem-II
Field Data Evaluation
Conclusion and Future Study
Future Studies
Impacts of the VMS and AWS on driver behaviors
Additional in-depth analysis and development of behavior models to
reflect the discrepancies of driver behaviors under different VMS and
AWS
Integration of the system with connected vehicles
Integrate the proposed DZPS under different penetration rates of
connected vehicles so as to improve the reliability of the system’s
operational functions
More field studies on the impacts of roadside sensors on the
driving behaviors
The impact of roadside sensor may vary with different driving
populations 54
Introduction DZPS (System-I)Pre-deployment
ProcessSystem-II
Field Data Evaluation
Conclusion and Future Study
Future Studies
Development of an intersection safety evaluation
function
To promote the deployment of proposed systems from the
cost/benefit perspective
A reliable function with critical data associated with accidents to
facilitate short-term performance analyses
Long-term analysis on safety
The learning impacts (i.e., any changes on short-term impact) of
driving populations over time with respect to the roadside
sensors or any deployed system deserve further understanding
with more field studies.
55
Introduction DZPS (System-I)Pre-deployment
ProcessSystem-II
Field Data Evaluation
Conclusion and Future Study

Questions and Comments?
Thank You
56