Design of Temporary Slopes and Excavations in Residual Soils · unsaturated residual soils, and...
91
Design of Temporary Slopes and Excavations in Residual Soils NCDOT Project 2013-07 FHWA/NC/2013-07 August 2016 Roy H. Borden, PhD, PE Mohammed A. Gabr, PhD, PE Jungmok Lee, PhD Chien-Ting Tang Cheng Wang, PhD Department of Civil, Construction, and Environmental Engineering North Carolina State University
Transcript of Design of Temporary Slopes and Excavations in Residual Soils · unsaturated residual soils, and...

0
Design of Temporary Slopes and
Excavations in Residual Soils
NCDOT Project 2013-07
FHWA/NC/2013-07
August 2016
Roy H. Borden, PhD, PE
Mohammed A. Gabr, PhD, PE
Jungmok Lee, PhD
Chien-Ting Tang
Cheng Wang, PhD
Department of Civil, Construction, and Environmental
Engineering
North Carolina State University

0
Design of Temporary Slopes and Excavations in Residual
Soils
______________________________________________________________________________
By
Roy H. Borden, PhD, PE
Mohammed A. Gabr, PhD, PE
Jungmok Lee, PhD
Chien-Ting Tang
Cheng Wang, PhD
Department of Civil, Construction, and Environmental Engineering
North Carolina State University
In Cooperation with the North Carolina Department of Transportation

i
1. Report No. FHWA/NC/2013-07
2. Government Accession No. …
3. Recipient’s Catalog No.
4. Title and Subtitle Design of Temporary Slopes and Excavations in NC Residual Soils
5. Report Date August 2016
6. Performing Organization Code
7. Author(s) Roy H. Borden, Ph.D, P.E. Mohammed A. Gabr, Ph.D, P.E. Jungmok Lee, Ph.D Chien-Ting Tang Cheng Wang, Ph.D
8. Performing Organization Report No.
9. Performing Organization Name and Address: Department of Civil, Construction, and Environmental Engineering North Carolina State University Campus Box 7908 Raleigh, NC 27695
10. Work Unit No. (TRAIS) …
11. Contract or Grant No. …
12. Sponsoring Agency Name and Address: North Carolina Department of Transportation Research and Development Unit 104 Fayetteville Street Raleigh, North Carolina 27601
13. Type of Report and Period Covered Final Report January,2013-August, 2016
14. Sponsoring Agency Code 2013-07
Supplementary Notes: …
16. Abstract In general, current design methods and procedures for temporary slopes and temporary excavation support systems do not consider the suction-induced characteristics of unsaturated residual soils, and therefore may result in overly conservative designs and unnecessary construction costs. The main objective of this research project was investigating the possibility of a more cost-effective design of temporary slopes and retaining structures in residual soils based on the incorporation of matric suction in the analyses approach. The components of this research project included: field and laboratory testing program, evaluation and development of predictive models, and analysis of cut slopes and sheet pile walls in excavation and considering water infiltration effect on suction. A full-scale field experimental program was conducted in Greensboro, NC, and included the excavation of three slopes (1:1, 0.5:1 and 0.25:1) and the construction of a cantilever sheet pile wall. Installed sensors included tensiometers for matric suction and moisture content measurements, inclinometer casings, strain gauges and pressure cells. Collected field data included suction measurements, and deformation data and the changes occurring in such data due to three excavation levels (4.6m, 6.1m and 6.7m) as well as due to water infiltration. Laboratory tests were performed on retrieved undisturbed specimens taken from the test site. Laboratory testing included measuring soil water characteristic curves, unsaturated shear strength and the physical properties of the site soils. Models for predicting matric suction as a function of volumetric water content, and shear strength as a function of matric suction were developed based on the experimental results. Utilizing the database of field and laboratory test data, as well as the developed predictive models, slope stability analyses and PLAXIS numerical models of the tested sheet pile wall in the unsaturated site conditions were performed and verified with field measurements. Both stage-excavation and infiltration effect were analyzed. Based on the results of the numerical analyses, a simplified approach for determining the required depth of embedment of a cantilever wall incorporating the effect of matric suction is proposed. The proposed approach is termed Suction Stability Number (SSN) and accounts for the stabilizing influence of matric suction in a similar manner to cohesion in the conventional stability number.
17. Key Words Infiltration, Road, Slope, Soil, Strength, Suction, Unsaturated, Wall
18. Distribution Statement
19. Security Classif. (of this report) Unclassified
20. Security Classif. (of this page) Unclassified
21. No. of Pages 91
22. Price
Form DOT F 1700.7 (8-72) Reproduction of completed page authorized

ii
Disclaimer
The contents of this report reflect the views of the authors and not necessarily the views of the
University. The authors are responsible for the facts and the accuracy of the data presented
herein. The contents do not necessarily reflect the official views or policies of either the North
Carolina Department of Transportation or the Federal Highway Administration at the time of
publication. This report does not constitute a standard, specification or regulation.

iii
Acknowledgments
The authors would like to thank the members of the NCDOT Geotechnical, Materials, and
Construction divisions who worked on this project. The time, expertise and guidance of NCDOT
engineers were invaluable to this project. Special thanks are due to the members of the steering
committee:
Kyung J. Kim, Ph.D., P.E. (Chair)
Mark R. Freeman, P.E.
J. Dean Hardister, P.E
Chris Kreider, P.E.
Chun Kun Su
Michael D. Valiquette, P.E.
John L. Pilipchuk, P.E., L.G.
Ernest Morrison, P.E.
Additionally, special thanks are due to:
Dr. K. J. Kim for coordinating overall project for the NCDOT;
Mr. Michael Valiquette, Christopher A. Kreider, and Neil Roberson for helping us with the
installation of field instruments;
Gary P. Crowder for obtaining field LiDAR scans and assisting with their interpretation;
Chun Kun Su and Suriyati Supaat of the NCDOT Geotechnical lab for their significant help
in soil characterization and the valuable experimental data on saturated triaxial compression
test specimens which they provided for this research;
Numerous other NCDOT personnel for their generous help with the field work; and finally,
former postdoc, Dr. Carlos Cary and lab technicians Jake Rhoads and Jerry Atkinson, for
suggestions and assistance in the laboratory testing set-up for the unsaturated soil testing.

iv
Executive Summary
The main objective of this research project was investigating the utilization of matric suction for
a more economical design of temporary slopes and retaining structures in unsaturated North
Carolina residual soils. In general, current design methods and procedures for temporary slopes
and temporary excavation support systems do not consider the suction-induced characteristics of
unsaturated residual soils, and therefore often result in overly conservative designs and
unnecessary construction costs.
The components of this research project were: the performance of field and laboratory tests, the
evaluation and development of prediction models, the mathematical modeling of slopes and
sheet pile walls during excavation and surface-water infiltration situations. A field experimental
program was conducted in Greensboro, NC, and included the performance monitoring of three
cut slopes (1:1, 0.5:1 and 0.25:1) and a cantilever sheet pile wall. Successive excavation stages
of the slopes as well as the 1-month infiltration period on the top of the slopes were induced and
the performance monitored for 30 days after construction is completed. Sensors for matric
suction and moisture content measurement, as well as inclinometer casings, strain gauges and
pressure cells were installed and the changes in measured parameters due to three excavation
depths (4.6m, 6.1m and 6.7m) and infiltration were recorded.
A series of laboratory tests were performed on undisturbed specimens from Shelby tubes taken
from the test site; these specimens were used to develop soil water characteristic curves,
unsaturated shear strength and physical properties for the site materials encountered. Models for
predicting matric suction as a function of volumetric water content and shear strength as a
function of matric suction were developed based on the experimental results.
Utilizing the extensive database of the field measurements and the comprehensive program of
laboratory testing, along with the developed prediction models, numerical analyses were
performed for establishment of the effect of matric suction on the temporary slopes and walls.
These included stability analyses of the three cut-slopes and finite element modeling of the sheet
pile wall in the natural, unsaturated condition. The models were verified with data from the field
measurements. The successive excavation stages as well as the 1-month infiltration period were
analyzed. Base on the FEM results, a simplified method for cantilever wall design incorporating
the effect of matric suction was developed.

v
This document presents a summary of the main findings of the research program in an
abbreviated manner. The details and the data are included in Appendices A through I. The main
chapters of the report include approaches for the more economical design of temporary slopes
and excavation support walls in unsaturated residual soils. The work product includes validated
models for estimation the Soil Water Characteristic Curves (SWCC). The SWCC data are then
used to estimate the unsaturated shear strength of residual soils, with proposed approaches that
are applicable to the soils tested in this study. The main findings of the field instrumentation and
monitoring components are coupled with the approach for estimating the shear strength to
provide guidance on the stability of temporary steep slopes in residual soils with water
infiltration. The work extends the monitored field data to develop an approach for estimating the
lateral earth pressure diagram for cantilever sheep pile walls in unsaturated residual soils.

vi
TableofContentsExecutive Summary ................................................................................................................. iv
List of Tables ........................................................................................................................... ix
List of Figures ........................................................................................................................... x
CHAPTER 1. Introduction ..................................................................................................... 1
1.1. Background ......................................................................................................... 1
1.2. Purpose and scope ............................................................................................... 1
1.3. Organization of the report ................................................................................... 2
CHAPTER 2. Site Description and Laboratory Testing Program .......................................... 4
2.1. Site description and field test program ............................................................... 4
2.2. Laboratory testing program ................................................................................. 7
CHAPTER 3. Measured and Modeled Soil Water Characteristic Curves ........................... 10
3.1. Evaluation of existing models ........................................................................... 10
3.2. Proposed prediction model ............................................................................... 13
CHAPTER 4. Measured and Modeled Unsaturated Shear Strength .................................... 17
4.1. Evaluation of existing models ........................................................................... 17
4.2. Development of an empirical model ................................................................. 23
4.3. Application of the empirical approach to effective stress concept ................... 26
CHAPTER 5. Unsaturated Slope Stability ........................................................................... 28
5.1. Factor of safety of test slopes with initial suction profile ................................. 28
5.2. Surface-water infiltration .................................................................................. 30
CHAPTER 6. Measured Behavior and Modeling of Cantilever Sheet Pile Wall ................ 34
6.1. Modeling of cantilever sheet pile wall at initial matric suction condition ........ 34
6.2. Modeling of sheet pile wall with the effect of rainfall infiltration ................... 40
6.3. Estimating net pressure diagram for sheet pile wall from PLAXIS analyses ... 44
CHAPTER 7. Proposed Design Method for Cantilever Sheet Pile Walls ........................... 57
7.1. Factor of safety analysis of Greensboro test wall ............................................. 57
7.2. Development of a design chart for cantilever sheet pile walls ......................... 62

vii
CHAPTER 8. Findings and Conclusions ............................................................................. 69
CHAPTER 9. References ..................................................................................................... 74
Contents of Appendices .......................................................................................................... vii
Appendix A. Literature Review ............................................................................................ 1
A.1 Matric suction measurement and prediction ...................................................................... 1
A.2 Determination of unsaturated soil shear strength ............................................................. 11
A.3 Lateral earth pressured used in the design of temporary retaining structures .................. 20
Appendix B. Test site and field test program ..................................................................... 29
B.1 Description of test site ...................................................................................................... 29
B.2 Field test program............................................................................................................. 31
B.3 SPT, CPT and PMT data .................................................................................................. 34
Appendix C. Field monitoring instruments ........................................................................ 58
C.1 Moisture and matric suction monitoring .......................................................................... 60
C.2 Inclinometer measurements .............................................................................................. 67
C.3 LiDAR scans .................................................................................................................... 81
C.4 Strain gauge measurements on sheet piles ....................................................................... 94
C.5 Vibrating wire push-in pressure cell measurements ...................................................... 100
Appendix D. Laboratory testing program ......................................................................... 102
D.1 Tested soil ...................................................................................................................... 104
D.2 Laboratory testing devices ............................................................................................. 112
Appendix E. Suction measurement and prediction of SWCC .......................................... 121
E.1 Verification of measuring time of tensiometer ............................................................... 121
E.2 Measured soil water characteristic curves ...................................................................... 128
Appendix F. Measurement and prediction of unsaturated shear strength ........................ 140
F.1 Measured stress strain curves from unsaturated triaxial tests ......................................... 140
F.2 Unsaturated triaxial lateral extension tests ..................................................................... 168
Appendix G. Application of matric suction to slope stability .......................................... 172
Appendix H. Modeling of cantilever sheet pile wall in unsaturated residual soil ............ 179

viii
H.1 Deformation analysis for unsaturated soil .................................................................... 180
H.2 Hardening soil model .................................................................................................... 182
H.3 Estimation of ......................................................................................................... 183
H.4 Amount of stress dependency, m .................................................................................. 185
H.5 determined for each layer ...................................................................................... 186
H.6 Optimization process to estimate unloading/reloading modulus value ........................ 187
H.7 Interface properties ........................................................................................................ 188
H.8 Infiltration and rainfall infiltration analysis .................................................................. 189
H.10 Soil properties in the sheet pile area ............................................................................ 194
H.11 Sheet pile properties ..................................................................................................... 195
Appendix I. Test data from NCDOT’s lab ...................................................................... 196
oK
50refE

ix
List of Tables
Table 2-1 Test program ................................................................................................................... 7
Table 2-2 Properties of major group of soil in this research ........................................................... 9
Table 3-1 Correlation Coefficients to Quantify Fitness of Proposed Model ................................ 13
Table 3-2 Suggested Shifts of Inflection Point between Drying and Wetting Curves for Various
Soils (Fredlund et al. 2011) ........................................................................................................... 16
Table 4-1 Equations of each method ............................................................................................ 20
Table 4-2 Properties of the Soils in Model Calculation ................................................................ 21
Table 5-1 Factors of Safety for Different Initial Matric Suction Profile Conditions .................... 28
Table 5-2 Van Genuchten SWCC Parameters for Slopes area ..................................................... 30
Table 6-1 Material Properties for Sheet pile wall area ................................................................. 35
Table 6-2 Summary of required D/H for FS=1 (including wall friction) ..................................... 50
Table 6-3 Summary of D/H without considering wall friction ..................................................... 52
Table 7-1 Summary of FS analyses for excavation stages ........................................................... 59
Table 7-2 Summarized case conditions for FS of 1.5, 1.7, and 2 ................................................. 63

x
List of Figures
Figure 2-1 Location of test site in this research .............................................................................. 4
Figure 2-2 Plan view of the test site ................................................................................................ 5
Figure 2-3 View of site after 22-ft excavation ................................................................................ 6
Figure 2-4 Locations and depths of sensors in sheet pile area ........................................................ 6
Figure 2-5 Locations of Shelby tubes ............................................................................................. 8
Figure 3-1 Soil water characteristic curves of A-7-5 (MH) soil samples ..................................... 10
Figure 3-2 Measured vs predicted suction by Zapata model ........................................................ 12
Figure 3-3 Measured vs predicted suction by SoilVision ............................................................. 12
Figure 3-4 Measured vs predicted suction using suction prediction model .................................. 14
Figure 3-5 Suggested correction for the predicted suction ........................................................... 15
Figure 4-1 Total cohesion intercept vs. matric suction for: (a) G1; (b) G2; (c) G3; (d) G4 ......... 19
Figure 4-2 Measured versus predicted total cohesion from Houston et al. (2008) ....................... 20
Figure 4-3 Measured versus predicted apparent cohesion due to suction by applying: (a)
Fredlund et al. (1996) and (b) Vanapalli et al. (1996) models ...................................................... 22
Figure 4-4 κ from best-fit analysis on measured data vs. κ from prediction equations ................ 25
Figure 4-5 Measured versus computed apparent cohesion by the proposed method ................... 25
Figure 4-6 MIT p'-q plots of the four soils (a. A-7-5 soil; b. A-4 soil; c. A-5 soil; d. A-2-6 soil) 27
Figure 5-1 Pore water pressure change over time along section A-A’ in Figure 5-2 (a) .............. 29
Figure 5-2 Pore water pressure profiles at (a) 30 days and (b) 57 days after adding water to ponds
for 0.25:1 slope (100 kPa = 2000 psf) .......................................................................................... 31
Figure 5-3 Effects of infiltration on slope stability for 0.25:1 and 0.5:1 slopes ........................... 32
Figure 6-1 Geometry of numerical analysis .................................................................................. 35
Figure 6-2 Comparisons between measured inclinometer data and numerical analysis results after
6.7 m excavation without suction profile change ......................................................................... 37
Figure 6-3 Comparison between measured deflections of sheet pile wall and numerical analysis
results with initial suction profile ................................................................................................. 38
Figure 6-4 Comparisons between measured bending moments and numerical analysis results
with initial suction profile ............................................................................................................. 39
Figure 6-5 Matric suction profiles using different runoff coefficients as used for calibration of the
net precipitation equation for the A-7-5 soils (BH3) .................................................................... 41

xi
Figure 6-6 Developed suction profiles for A-4 soil (BH2) ........................................................... 42
Figure 6-7 Suction profiles in front of sheet pile wall (BH1) during excavation stages .............. 43
Figure 6-8 Comparisons between measured inclinometer data and numerical analysis results after
6.7 m excavation with suction profile change .............................................................................. 45
Figure 6-9 Comparison of measured deflections of sheet pile wall and numerical analysis results
with infiltration ............................................................................................................................. 46
Figure 6-10 Comparisons between measured bending moments and numerical analysis results
with suction profile changes ......................................................................................................... 47
Figure 6-11 PLAXIS-predicted total and net lateral pressures on sheet pile wall with excavation
depth .............................................................................................................................................. 48
Figure 6-12 (a) Excavation to 9 m to produce FS=1 with initial suction profile and (b) excavation
to 7.6 m depth to produce FS=1 with suction profile at the end of field test (both (a) and (b)
include wall friction) ..................................................................................................................... 51
Figure 6-13 (a) Excavation to 9 m to produce FS=1 with initial suction profile and (b)
excavation to 7.6 m to produce FS=1 with suction profile at the end of field test (without
considering wall friction in Lu and Likos approach) .................................................................... 53
Figure 6-14 D/H required for a FS=1 as a function of infiltration depths (Di) for excavation to a
depth of 7.6 m. .............................................................................................................................. 54
Figure 7-1 Initial suction profile for A-4 area (BH2) ................................................................... 58
Figure 7-2 FS as a function of excavation depth .......................................................................... 60
Figure 7-3 (a) Maximum lateral displacement of sheet pile vs. excavation depth and (b) FS
corresponding to each stage of excavation with infiltration analysis ........................................... 61
Figure 7-4 Design chart for cantilever sheet pile wall including matric suction .......................... 64
Figure 7-5 (a) Maximum lateral displacement of 10.7 m length of sheet pile wall and (b) 4.6 m
length of sheet pile wall ................................................................................................................ 67
Figure 7-6 (a) Maximum bending moment of 10.7 m length of sheet pile wall and (b) 4.6 m
length of sheet pile wall ................................................................................................................ 68

1
CHAPTER 1. Introduction
1.1. Background
In the Piedmont region of North Carolina, excavated slopes and temporary retaining
structures are often constructed in unsaturated soils. However, the education and practice of
many engineers have focused on saturated soil mechanics, which is based on the concept of
positive pore water pressure and the corresponding effective stress (Terzaghi and Peck in 1967).
However, in unsaturated soils, the matric suction force must be taken into account when
considering soil behavior that includes shear strength, volume change, and seepage.
The unsaturated soil matrix consists of water, air, and solid soil particles. The pressure
difference between the air and water drive capillary tension forces and affect the soil’s behavior,
especially for soils that contain finer particles. For example, silty and clayey soils conform to
unsaturated soil behavior because their water contents paired with fines content generate
capillary force, which is related to matric suction. The contribution of suction to the behavior of
unsaturated soil depends on the degree of saturation. Piedmont residual soil contains fines
content (silty clay), and therefore unsaturated soil mechanics should be used to explain the
behavior and perform the appropriate design and analysis of temporary slopes and excavation
support systems in such profiles.
1.2. Purpose and scope
This research report includes the presentation of experimental data from both laboratory
testing and field construction and monitoring program. In addition, the evaluation of prediction
models for matric suction and unsaturated shear strength is presented along with methods for
incorporating the effect of matric suction into slope stability analysis and sheet pile wall design.
Full-scale field testing and extensive laboratory and in situ tests were conducted for this
study to investigate the effects of matric suction on the behavior of unsaturated Piedmont
residual soils. Furthermore, the study examines the inclusion of matric suction in the design of
temporary slope and retaining wall systems. An additional objective is to provide a better
understanding of the behavior of unsaturated residual soils that are subjected to surface-water
infiltration, and how such quantity may be used for a better design of temporary slope and
excavation support systems.

2
The specific objectives of this research were to:
1. Characterize unsaturated Piedmont residual soil profiles at a selected test site where three slopes and a wall were constructed and monitored. Retrieve samples for physical and engineering characterization of the sites soils and integrate all the test and monitored data into a comprehensive database.
2. Develop prediction models to estimate the matric suction as a function of volumetric water content for the tested residual soils.
3. Develop prediction models to estimate the increase in shear strength as a function of matric suction for the undisturbed residual soils tested.
4. Perform deformation analyses with consideration of the unsaturated condition for temporary retaining wall systems and develop lateral earth pressure diagram including the effect of matric suction.
5. Investigate the appropriate incline (angle) of unsaturated temporary slopes and the duration period of construction based on the results of stability and infiltration analyses.
6. Evaluate shear strength and deformation behavior of the constructed geostructures at the site including the influence of changing soil suction with rainfall infiltration.
1.3. Organization of the report
The work performed for this research project was completed between January, 2013 and
June, 2016. The report is organized into 9 chapters, as follows:
Chapter 1: Introduction
Chapter 2: Site description and laboratory testing program
Chapter 3: Prediction of matric suction as a function of volumetric water content
Chapter 4: Prediction of shear strength as a function of matric suction
Chapter 5: Application of unsaturated soil properties to slope stability analysis.
Chapter 6: Modeling deformation of the sheet pile wall during excavation and infiltration.
Chapter 7: A simplified design method for cantilever wall design in unsaturated soil.
Chapter 8: Findings and conclusions
Chapter 9: References

3
A comprehensive record of all measured data from laboratory and field tests, and
background information on modeling are presented in Appendices A thru G. Content in each
appendix is listed below:
Appendix A: Literature Review
Appendix B: Test site and field test program
Appendix C: Field monitoring instruments
Appendix D: Laboratory testing program
Appendix E: Suction measurement and prediction of SWCC
Appendix F: Measurement and prediction of unsaturated shear strength
Appendix G: Application of matric suction to slope stability
Appendix H: Modeling of cantilever sheet pile wall in unsaturated residual soil
Appendix I: Test data from NCDOT’s lab

4
CHAPTER 2. Site Description and Laboratory Testing Program
This chapter presents a general overview of the field test and the laboratory testing
program. A comprehensive description of each type of sensor installed at the site and the data
measured during each of the three stages of excavation and subsequent period of surface-water
infiltration are presented in Appendix B. The details of tested soil in each Shelby tube and
introduction of each experimental device used in this research project are presented in Appendix
C.
2.1. Site description and field test program
Location of test site In order to accomplish the stated objectives of developing a database of residual soil
shear strength and suction parameters, an experimental program was undertaken on samples
retrieved from a construction site in Greensboro, North Carolina. The test site location is shown
in Figure 2-1. The Project was given a No. 39406.1.1, and the construction site is located at
Alamance Road, Greensboro, Guilford County, North Carolina.
Figure 2-1 Location of test site in this research
The field testing program included the cutting of three slopes of varying steepness
(0.25:1, 0.5:1, and 1:1) on one side, and the installation of one cantilever sheet pile wall on the
other side of the proposed roadway cut, as shown schematically in Figure 2-2. The soil between
the intended slopes and the sheet pile wall was excavated in three stages to a final depth of 22
feet. Figure 2-2 shows a plan view of the entire test site, in which the locations of the three
slopes with their respective inclinations as well as the location of the sheet pile wall are marked.
A photograph of the test site after excavation is shown in Figure 2-3.

5
Soil profiles with SPT-N values are shown in Figures B-7 through B-13 in Appendix B,
and CPT measurements are in Figures B-8 to B-11, for each location shown in Figure 2-2. Field
monitoring devices, including FTC-200 (matric suction sensor) and moisture content sensors,
inclinometer casings, pressure cells and strain gauges were installed. Figure 2-4 shows the
location and depth of the instruments in the sheet pile area. A detailed description of each
instrument and the locations in each slope is listed in Appendix B.3.
Figure 2-2 Plan view of the test site
0.5: 1
Slope
0.25: 1
1: 1
Sheet
pile

6
Figure 2-3 View of site after 22-ft excavation
Figure 2-4 Locations and depths of sensors in sheet pile area
404.35
404.45
404.55
404.65
85 90 95 100 105
‐L‐Sta.
Offset (ft)
FTC‐100 Moisture content
sheet pile Inclinometer
Strain gauge Pressure cell
0.6 m3.7 m
6.1 m 3.0 m 1.2 m
0.8 m1.7 m
4.2 m 1.7 m 0.9 m
1.6 m
0.3 m

7
The measured changes in sensor readings due to the excavation process and subsequent
surface-water infiltration will be discussed and used in modeling the behavior of both the sheet
pile wall and slopes.
2.2. Laboratory testing program
A total of ninety-four Shelby tubes were retrieved from the test site, from 10 borings, and
at depth that ranged from 0.6 to 15.5 m (2 to 52 ft). Twenty Shelby tubes were sent to the
NCDOT laboratory for consolidated undrained triaxial tests, and 66 Shelby tubes were sent to
CFL lab at NC State University for testing. The laboratory testing program included matric
suction measurements (filter paper, pressure plate and potentiometer tests) and unsaturated
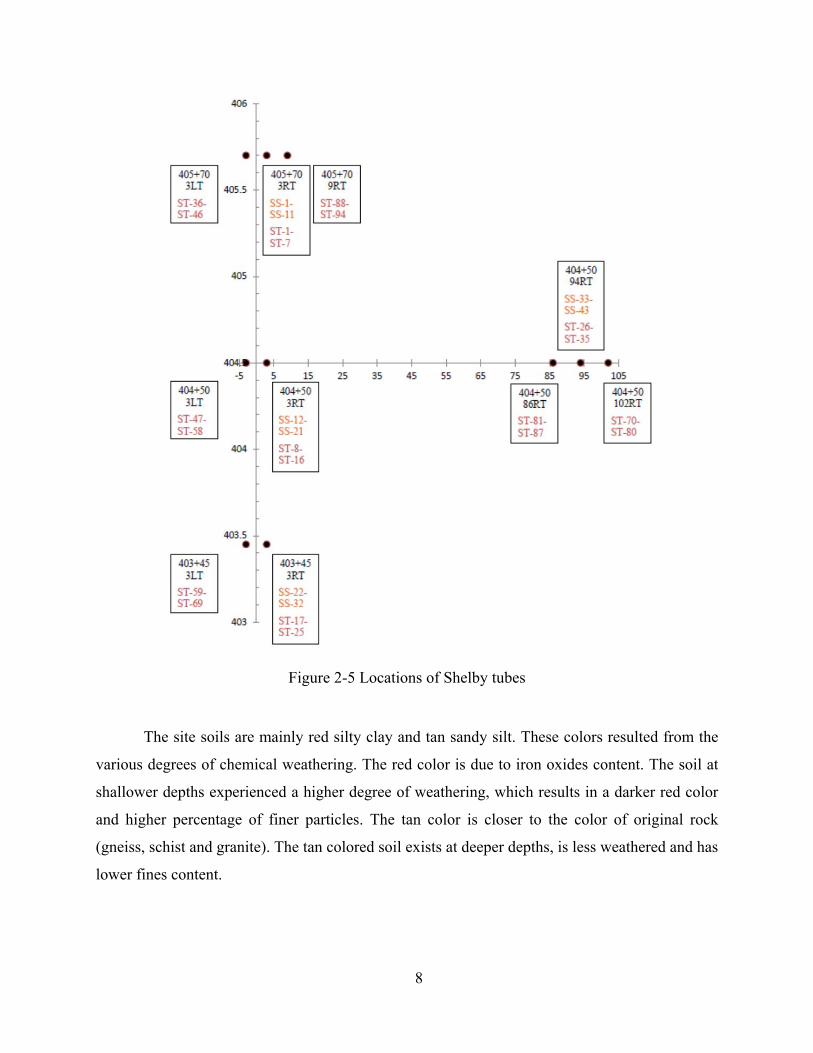
triaxial tests. The testing program is summarized in Table 2-1, and the locations of Shelby tubes
are shown in Figure 2-5.
Table 2-1 Test program
Tube number Test types # of test Note
NCDOT Geotechnical
Lab
ST-1 to ST-25, ST-27, ST-29, ST-31, ST-33
and ST-35
Consolidation test 1 per tube
CIU triaxial test 1~3 per
tube
Permeability test 1 ST-27 (A-4 soil)
NCState CFL Soil
Lab
ST-28, ST-30, ST-32, ST-34 and ST-36 to
ST-94
Matric suction measurement
Every tube Measured by tensiometer
Pressure plate test 10
Unsaturated triaxial test 46 20 single stage; 26 multistage
8
Figure 2-5 Locations of Shelby tubes
The site soils are mainly red silty clay and tan sandy silt. These colors resulted from the
various degrees of chemical weathering. The red color is due to iron oxides content. The soil at
shallower depths experienced a higher degree of weathering, which results in a darker red color
and higher percentage of finer particles. The tan color is closer to the color of original rock
(gneiss, schist and granite). The tan colored soil exists at deeper depths, is less weathered and has
lower fines content.

9
According to ASSHTO classification, four major groups of soil were found at this site,
A-7-5, A-4, A-5 and A-2-6. The properties of the site soils are listed in Table 2-2 along with the
corresponding USCS classifications (MH, ML and SC). For a detailed record, soil properties for
each Shelby tube are listed in Tables C-3 to C-9, in Appendix C.
Table 2-2 Properties of major group of soil in this research
Test devices used in this research at the NCSU CFL Geotechnical Lab included:
1. Tensiometers: for measuring the matric suction in each Shelby tube, to obtain the existing
matric suction.
2. Pressure plate: for measuring soil water characteristic curves (SWCC)
3. Unsaturated triaxial test: for measuring unsaturated shear strength
Measured data and developed models for predicting matric suction are presented in
Chapter 3 and measured data and developed models for predicting unsaturated shear strength are
presented in Chapter 4.
SymbolSoil Type
(USCS)Soil Type (AASHTO)
Depth (ft)
GsLL (%)
PI (%)
< #200 (%)
Clay (%)
Silt (%)
Sand (%)
φ' (deg)
c' (psi)
G1 MH A-7-5 5‐12 1.11 2.76 61 22 88 15 73 12 27 1.9G2 ML A-4 24‐50 1.61 2.70 40 6 60 4 56 45 30 2.8G3 ML A-5 13‐27 1.65 2.73 45 10 84 6 78 16 28 2.5G4 SC A-2-6 2‐7 1.75 2.68 34 11 32 10 22 68 36 0
(g/ )

10
CHAPTER 3. Measured and Modeled Soil Water Characteristic Curves
3.1. Evaluation of existing models
Utilizing the experimental data generated from pressure plate tests, and the procedure
presented in Appendix C, the soil water characteristic curves (SWCC) were curve-fitted using
the Fredlund and Xing (1994) model shown in Equation 3-1.
1
ψ
ψ
ψ
ψ (3-1)
where ψ = matric suction; ψr = the residual matric suction and ap, np, mp are the fitting
parameters.
The SWCC data for the A-7-5 soil samples are shown in Figure 3-1. The SWCCs of the
other soil types and the parameters a, n, and m for the Fredlund-Xing model are presented in
Appendix D.
Figure 3-1 Soil water characteristic curves of A-7-5 (MH) soil samples
0
0.1
0.2
0.3
0.4
0.5
0.6
0.7
0.1 1 10 100 1000 10000
θ
ψ (kPa)
A-7-5 (MH), 2.2ft, ST36
ST36 fitting
A-7-5 (MH), 2.2ft ST47
ST47 fitting
A-7-5 (MH), 5.2ft, ST70
ST70 fitting
A-7-5 (MH), 8.2ft, ST38
ST38 fitting
A-7-5 (MH), 10.2ft,ST50

11
Two existing suction prediction models, Zapata et al. (2000) and Fredlund et al. (1997),
were used to predict the suction of the tested residual soils. In the model proposed by Zapata, a
weighted plasticity index (PI), i.e., wPI, is used as the main variable to correlate the SWCC
parameters. wPI is expressed as the percentage passing the #200 sieve (as a decimal) multiplied
by the PI, as a percentage. The equations for the Fredlund and Xing 1994 SWCC parameters as a
function of wPI are shown as Equations 3-2 to 3-5:
a 0.00364 . 4 11 3 2
2.313 . 5 3 3
m 0.0514 . 0.5 3 4
32.44 . 3 5
Fredlund et al. (1997) model was used to estimate the SWCCs using grain size
distribution data and volume-mass properties. The grain size distribution of the soil is divided
into small ranges of relatively uniform particles. The data points of applied matric suction and
measured volumetric water content of each soil specimen are summed to generate the final
SWCC. The predicted SWCCs were generated by inputting the grain size distribution data and
volume-mass properties into SoilVision software, from Soilvision Systems Ltd.
The suction values determined from the twelve pressure plate tests were compared to
those predicted from the Zapata model and SoilVision database, as shown in Figure 3-2 and
Figure 3-3, respectively. The results from both the Zapata model and SoilVision software show
a significant amount of deviation from the measured data, which have coefficients of
determination, R2, of 0.51 and 0.48, respectively. Because these existing models did not provide
very high confidence levels in the suction predictions, an empirical model based on grain size
distribution and a soil volume-mass relationship was explored. That is, a new model specifically
designed for the North Carolina residual soil tested is proposed herein.

12
Figure 3-2 Measured vs predicted suction by Zapata model
Figure 3-3 Measured vs predicted suction by SoilVision
1
10
100
1000
1 10 100 1000
ψm
easu
red
(kP
a)
ψpredicted (kPa)
A-7-5 (MH), 2.2ft, ST36
A-7-5 (MH), 2.2ft, ST47
A-7-5 (MH), 5.2ft, ST70
A-7-5 (MH), 8.2ft, ST38
A-7-5 (MH), 10.2ft, ST50
A-7-5 (ML), 18ft, ST40
A-4 (ML), 10ft, ST61
A-4 (ML), 15.2ft, ST28
A-7-5 (ML), 27ft, ST64
A-4 (ML), 34.2ft, ST32
A-4 (ML), 44.2ft, ST79
A-4 (ML), 44.3ft, ST34R2=51%
1
10
100
1000
1 10 100 1000
ψm
easu
red
(kP
a)
ψpredicted (kPa)
A-7-5 (MH), 2.2ft, ST36
A-7-5 (MH), 2.2ft, ST47
A-7-5 (MH), 5.2ft, ST70
A-7-5 (MH), 8.2ft, ST38
A-7-5 (MH), 10.2ft, ST50
A-7-5 (MH), 18ft, ST40
A-4 (ML), 10ft, ST61
A-4 (ML), 15.2ft, ST28
A-7-5 (ML), 27ft, ST64
A-4 (ML), 34.2ft, ST32
A-4 (ML), 44.2ft, ST79
A-4 (ML), 44.3ft, ST34R2=48%

13
3.2. Proposed prediction model
For the model development, SWCCs from twelve samples were used and included six
high plasticity and six low plasticity silty soils. The corresponding soil properties, such as grain
size distribution, were also assessed. The first step was to include as many properties as possible
in the statistical analysis because no physical theory was available to support which properties
should be included or excluded. Also, some of the possible parameters might have an effect on
the curvature of the SWCCs. Three categories of soil properties were included for the new model
development: grain size distribution, Atterberg limits, and volume-mass relationships.
The prediction models for each Fredlund-Xing a, n, and m parameters were developed
and are shown in Equation 3-6 to 3-8:
a 17.21.89D
0.363D
0.063D
2.5 ∗DD
(3-6)
n 0.105 0.018 ∗ P200 9.55 ∗ D0.012
0.057 ∗DD
1.203 ∗ ρ (3-7)
m 11.24 0.0074 ∗ P200 0.075 ∗ 5μm 2.665 ∗ G 1.452 ∗ ρ (3-8)
Due to the limitation of the data used for generating the model, the bounds for the
parameter are designated and the correlation coefficients used to quantify the fitness of the model
as shown in Table 3-1.
Table 3-1 Correlation Coefficients to Quantify Fitness of Proposed Model
R2 (%) Adjusted- R2 (%) Predicted-R2 (%) Bound
a 86.5 78.8 50 (14, 74)
n 93.7 88.4 67.4 (0.7, 2.1)
m 97.6 96.2 93.9 (0.3, 1.8)
The predicted suction values determined by the proposed model were compared to the
measured suction values, as shown in Figure 3-4. The figure indicates that most of the data

14
points for predicted suction versus measured suction fall on the 1:1 ratio line and that the R-
square value is 93%, which indicates a better fit than both the Zapata model (R2 is 51%) and
SoilVision (R2 is 48%).
Figure 3-4 Measured vs predicted suction using suction prediction model
Suggested correction for design purpose
In order to consider the variability of the data from an engineering design point of view, a
suggested correction factor, based on 95% confidence limits of the data, should be applied to the
predicted suction values.
The comparison of the suction values obtained by the prediction model and the actual
measurements, as shown in Figure 3-4, is transposed to Figure 3-5. Knowing the predicted
suction values from the Equation 3-1 with parameters, a, n and m utilizing Equation 3-6 to
Equation 3-8, the best-fit function of the actual suction can be expressed as
ψ 3.572 0.972ψ (3-9)
1
10
100
1000
1 10 100 1000
ψm
easu
red
(kP
a)
ψpredicted (kPa)
A-7-5 (MH), 2.2ft, ST36
A-7-5 (MH), 2.2ft, ST47
A-7-5 (MH), 5.2ft, ST70
A-7-5 (MH), 8.2ft, ST38
A-7-5 (MH), 10.2ft, ST50
A-7-5 (MH), 18ft, ST40
A-4 (ML), 10ft, ST61
A-4 (ML), 15.2ft, ST28
A-7-5 (ML), 27ft, ST64
A-4 (ML), 34.2ft, ST32
A-4 (ML), 44.2ft, ST79
A-4 (ML), 44.3ft, ST34
R2=93%

15
In order to account for the variability (scatter) in the measured data, a lower bound
model, such as one that includes a 95% confidence limit, could be used as shown in Equation 3-
10:
3.57 0.97 59.4 0.012146.5
10
.
(3-10)
However, instead of using Equation 3-11, a simple correction factor of 0.94 that is based
on the lower prediction at the mean of the data is shown in Figure 3-5 to provide a very
reasonable approximation of the more complex function. Thus, the following model is derived:
0.94 (3-11)
Figure 3-5 Suggested correction for the predicted suction
Field SWCC curve shift
0
50
100
150
200
250
300
350
400
450
500
0 100 200 300 400 500
ψm
easu
red
ψpredicted
Data
Fitting
95% confidence limit
95% confidence limit
Suggestion

16
A field curve concept based on actual tensiometer suction measurements is also
proposed. The basis for the field curve concept is the fact that the actual suction conditions in the
field are different from the suction on the drying curve due to the existence of hysteresis. To
define the wetting curve from the drying curve data, Fredlund et al. (2011) recommended
shifting the drying curve as shown in Table 3-2.
Table 3-2 Suggested Shifts of Inflection Point between Drying and Wetting Curves for Various
Soils (Fredlund et al. 2011)
Soil Type Range of Typical Shifts
(% of a log cycle)
Average Shift
(% of a log cycle)
Sand 15-35 25
Silt and loam 35-60 50
Clay - Up to 100
In order to consider the actual suction conditions in the soil, a procedure to determine the
field curve of the soil is proposed. First, the drying curve of the sample is determined using the
pressure plate test or another prediction model. The Fredlund-Xing curve-fitting parameters then
are determined.
Second, the suction and water content of the natural soil are determined using a
tensiometer on the retrieved soil specimens. Then, the one-point data from the tensiometer
measurements is plotted with the drying curve. Third, in order to shift the drying curve to pass
through the tensiometer measured suction at the known moisture content, a series of drying
curves must be generated by reducing the a value in the Fredlund-Xing equation. The reduction
of the a value can be stepwise at a rate of 5 percent. After the third step, two shifted curves that
are closest to the point of the tensiometer reading can be determined. Then, in between the two
chosen curves, a set of ten decomposed curves is generated. The best fit to the one-point
tensiometer measurement is quantified using the least-square method. Thus, in practical usage,
the SWCCs obtained from the suction prediction model are shifted to pass through the
tensiometer measured suction, at its measured volumetric water content. This process was used
to develop the SWCCs incorporated into the numerical analyses to be described in subsequent
chapters.

17
CHAPTER 4. Measured and Modeled Unsaturated Shear Strength
In order to evaluate the unsaturated shear strength of the residual soils from the
Greensboro test site, a total of 19 unsaturated triaxial tests, including 8 single stage tests and 11
multistage tests, were performed on the four groups of soils of three types (MH, ML and SC).
The stress-strain curves and values of deviatoric stress at failure for each test are in Appendix E.
The results presented in this section are from four major groups of soils from the site.
Each group has several specimens with very similar soil properties. However, test results of
specimens with properties different from the four groups are also presented in Appendix E.
4.1. Evaluation of existing models
As anticipated from the literature, the measured data indicate that both increases in net
confining pressure and matric suction result in an increase of shear strength. The total cohesion is
defined for each individual test from the intercept of the Mohr-Coulomb failure envelope based
on the effective friction angle obtained from saturated tests for each soil group. Therefore, the
increase in total cohesion intercept represents the contribution of matric suction to shear strength,
apart from the effect of net confining pressure. Figure 4-1 (a, b, c and d) presents the total
cohesion values as a function of matric suction for each of the four soil groups.
In conjunction with the measured data, the predicted total cohesions from three existing
models, computed at zero net confining pressure, are plotted. The first method is based on the
Fredlund et al. (1996) approach, utilizing an exponent kappa (κ) on the degree of saturation term,
with the values of ‘κ’ based on recommendations by Vanapalli and Fredlund (2000). Methods 2
and 3 were proposed by Vanapalli et al. (1996) and Houston et al. (2008), respectively. The
equation and parameters of each method are listed in Table 4-1.
The first two methods were both applied utilizing the matric suction from the appropriate
SWCCs and the effective friction angle to predict the magnitude of total cohesion. Method 3, by
Houston et al. (2008), was applied on the basis of the grain size distribution parameters D30, D60
and percentage of sand, instead of using the SWCC.

18
0
20
40
60
80
100
0 20 40 60 80 100 120 140 160
Total cohesion (kPa)
Matric suction (kPa)
Test DataMethod 1Method 2Method 3
0
20
40
60
80
100
0 20 40 60 80 100 120 140 160
Total cohesion (kPa)
Matric suction (kPa)
Test DataMethod 1Method 2Method 3
(a)
(b)

19
Figure 4-1 Total cohesion intercept vs. matric suction for: (a) G1; (b) G2; (c) G3; (d) G4
0
20
40
60
80
100
0 20 40 60 80 100 120 140 160
Total cohesion (kPa)
Matric suction (kPa)
Test DataMethod 1Method 2Method 3
0
20
40
60
80
100
0 20 40 60 80 100 120 140 160
Total cohesion (kPa)
Matric suction (kPa)
Test DataMethod 1Method 2Method 3
(c)
(d)

20
Table 4-1 Equations of each method
Of the three applied prediction models, Method 3 yields computed values closest to the
measured data points, in comparison to those from Methods 1 and 2. Figure 4-2 shows the
comparison between measured and predicted data by Method 3. The use of Method 3 provides
predictions within +/- 15% of the measured data, with an R2 value of 0.77.
Figure 4-2 Measured versus predicted total cohesion from Houston et al. (2008)
0
10
20
30
40
50
60
70
80
90
0 10 20 30 40 50 60 70 80 90Predicted total cohesion (kPa)
Measured total cohesion (kPa)
G1 (MH)G2 (ML)G3 (ML)G4 (SC)

21
The residual soil samples tested in this research are classified as MH, ML and SC. Test
data from the literature were included to extend the range of soils involved in the discussion of
the prediction models. These literature data cover five soil types, and their properties and
parameters are shown in Table 4-2. The evaluation of shear strength prediction herein uses the
term “apparent cohesion due to suction” to represent the increase of shear strength due to
increase of matric suction.
Table 4-2 Properties of the Soils in Model Calculation
The comparisons between values predicted by the Fredlund et al. (1996) and Vanapilli et
al. (1996) models and measured values, both from the current research and that reported in the
literature, are shown in Figure 4-3 a and Figure 4-3 b, respectively. The ability of the two
models to estimate the measured apparent cohesion due to suction at increasing levels of matric
suction is indicated by the proximity of points to the 1:1 line. Not all the data from the literature
were plotted in Figure 4-3 (b), because the value of the residual water content was not reported
in each reference. The Houston et al. (2008) model is not shown here because limitations were
found for the SM and SM-SW soils from literature. The SM soil has D30 of 0.2 mm, D60 of 0.8
mm and 58 percent of sand; the SM-SW soil has D30 of 0.2 mm, D60 of 0.5 mm and 75 percent of
sand. The calculation for the “a” parameter in Equation 5 leads to values of -6.7 for the SM soil
and -2.2 for the SM-SW soil. In these two cases, because of the negative values of “a”, the
equation no longer yields a hyperbolic shape for predicting the increase of total cohesion. In
addition, detailed grain size data were not available for other soils in published data in Table 4-2.
φ' c' Fines LL PI
USCS ASSHTO (°) (kPa) (%) (%) (%)G1 in this research Residual soil in NC MH A-7-5 27 13 0.16 88 58 22 2.37 1.08G2 in this research Residual soil in NC ML A-4 30 19 0.05 60 34 6 1.53 0.25G3 in this research Residual soil in NC ML A-4 28 17 0.08 84 45 10 1.82 0.80G4 in this research Residual soil in NC SC A-2-6 36 0 0.09 32 34 11 1.88 0.77Miao, et al., 2002 Nanyang soil MH A-7-5 21 42 0.09 93 58 32 2.48 1.41Lee, et al., 2004 Weathered granite SM A-2-4 42 19 n/a 12 1.00 1.40Rahardgo, et al., 2004 Jurong sedimentary CL A-6 32 0.0 0.06 66 36 15 2.09 0.61Kayadelen, et al., 2007 Residual clay MH A-7-5 22 25 0.05 95 77 32 2.48 1.85Burrage et al., 2012 Residual soil ML A-4 32 16 n/a 71 38 3 1.28 0.42Schnellmann, et al., 2013 Coasrse sand SM-SW A-2-4 34 0 0.08 11 1.00 1.34
= the value calculated from Equation 3 = the value by best-fit analysis on measured data
NP
NP
Reference Soil nameSoil Classification
θ κ κ
κκ

22
Figure 4-3 Measured versus predicted apparent cohesion due to suction by applying: (a)
Fredlund et al. (1996) and (b) Vanapalli et al. (1996) models
0
20
40
60
80
100
0 20 40 60 80 100
Predicted apparent cohesion due to
suction (kPa)
Measured apparent cohesion due to suction (kPa)
G1 (MH)
G2 (ML)
G3 (ML)
G4 (SC)
Miao, et al. (2002)
Kayadelen, et al. (2007)
Burrage, et al. (2012)
Rahardjo, et al. (2004)
Lee, et al (2005)
Schnellmann, et al. (2013)
0
20
40
60
80
100
0 20 40 60 80 100
Predicted apparent cohesion due to
suction (kPa)
Measured apparent cohesion due to suction (kPa)
G1 (MH)
G2 (ML)
G3 (ML)
G4 (SC)
Miao, et al. (2002)
Kayadelen, et al. (2007)
Rahardjo, et al. (2004)
Schellmann, et al, (2013)
(a)
(b)

23
In Figure 4-3 (a), where the Fredlund et al. (1996) model with the κ value provided by
Vanapalli and Fredlund (2000) is applied, the majority of data fall under the 1:1 slope line;
except for the SM and SM-SW soils, for which the apparent cohesion due to matric suction is
overestimated. Best-fit lines can also be found by separating the soils into groups on the basis of
the PI value. Curve fitting a linear regression line with zero intercept for the two soils with PI of
32% yields a 0.83 slope, which indicates that the model underestimates the apparent cohesion
due to suction of this MH soil group by 17%.
Excluding data for the two sandy soils, the model yields results that under-predict the
measured values by more than 40%. Accordingly, it seems that the Fredlund et al. (1996) model
provides a better prediction when the test soil has a relatively high PI value of 32%, but does not
well estimate the increase of apparent cohesion with increasing matric suction for lower PI soils.
Data in Figure 4-3 (b) show that the Vanapalli et al. (1996) model underestimates nearly
the entire data set with a regression slope of 0.8. Not all of the measured data from the literature
is shown in this plot due to the lack of having SWCCs presented with the strength data. If only
the soils classified as MH are used for the regression analysis, the slope is 1, which indicates on
the average an accurate prediction by the model in this type of soil. For the G2 and CL soils from
literature, the Vanapalli et al. (1996) model underestimates the increase of apparent cohesion due
to matric suction.
4.2. Development of an empirical model
Based on the application of the existing models to the above data, the Fredlund et al.
(1996) model predictions showed significant variation from the measured values; the Vanapalli
et al. (1996) model requires a good estimation of residual water content; and the Houston et al.
(2008) has limitation of input parameters. Therefore, an empirical model to provide more
accurate predictions and to be utilized with parameters from conventional soil tests was explored.
Statistical analyses to find the κ values that produced the best-fit with the measured data
from this research produced an average R2 value of 0.9. It can be concluded that the increase of
total cohesion can be modeled by determining the fitting parameter, κ, from test data. Therefore,
in an effort to improve the quality of total cohesion estimation using the first and third terms of

24
Equation 4-1, an improved equation for estimating the κ value from measured soil parameters
was explored.
The best-fit κ value from each data set was seen to produce a good fit in predicting shear
strength via Equation 4-1. Therefore, after obtaining the value of κ for each soil, a regression
analysis was performed exploring multiple soil properties as variables in order to obtain a
predictive equation for κ. A number of different combinations of parameters were tested, with
Equation 4-2 providing the best fit.
′ 4 1
κ 0.39 ∙ %100
% 0.018 ∙ 1.33 ∙11
4 2
This equation utilizes the percentage of fines, PI and a ratio between PI and LL (with all
values expressed as whole numbers and values for LL and PI taken as zero for non-plastic soils).
The comparison between κ values obtained from best-fit analysis of the test data and the values
predicted by Equation 4-2 is shown in Figure 4-4, as well as values predicted by Method 1. The
values of the “best-fit κ” from each data set are shown in Table 4-2. The diamond symbols
shown in Figure 4-4, indicate that the use of Method 1 leads to the over prediction of the κ
parameter, for the ten sets of data presented herein. However, the solid circles indicate that
Equation 4-2 is able to explain the existing variability in the data.
The computed values of κ were then used in Equation 4-1 to predict the suction-induced
cohesion. The measured values and values computed on the basis of Equation 4-1, with κ values
obtained from Equation 4-2, are compared in Figure 4-5.
The best-fit line to the entire data set shown in Figure 4-5 yields a slope of 0.94, which
indicates that the computed values slightly underestimate the measured data, with an R2 value of
0.9. Accordingly, it can be seen that use of the proposed regression equation for predicting κ
provides the ability to estimate cohesion values that are consistent with those measured in the 10
data sets presented herein.

25
Figure 4-4 κ from best-fit analysis on measured data vs. κ from prediction equations
Figure 4-5 Measured versus computed apparent cohesion by the proposed method
0
1
2
3
0 1 2 3
κfr
om b
est-
fit o
n m
easu
red
data
κ from Vanapalli and Fredlund (2000) and proposed equation
κ in literature (Equation 3)
Proposed κ (Equation 8)
0
20
40
60
80
100
0 20 40 60 80 100
Predicted cohesion due to m
atric
suction (kPa)
Measured cohesion due to matric suction (kPa)
G1 (MH)
G2 (ML)
G3 (ML)
G4 (SC)
Miao, et al. (2002)
Kayadelen, et al. (2007)
Burrage, et al. (2012)
Rahardjo, et al.(2004)
Lee, et al. (2005)
Schnellmann, et al. (2013)

26
4.3. Application of the empirical approach to effective stress concept
The incorporation of matric suction into the effective stress equation is another method
for accounting for the effect of matric suction on shear strength. An estimation equation,
developed based on the utilization of effective degree of saturation by Lu and Liko (2006), is
shown in Equation 4-3. The effective stress concept using Equation 4-3 is presented and
compared to the empirical approach, Equation 4-4, presented in the prior section.
∗1
4 3
∗ 4 4
*note: σ’ in this equation represents effective stress with matric suction incorporated.
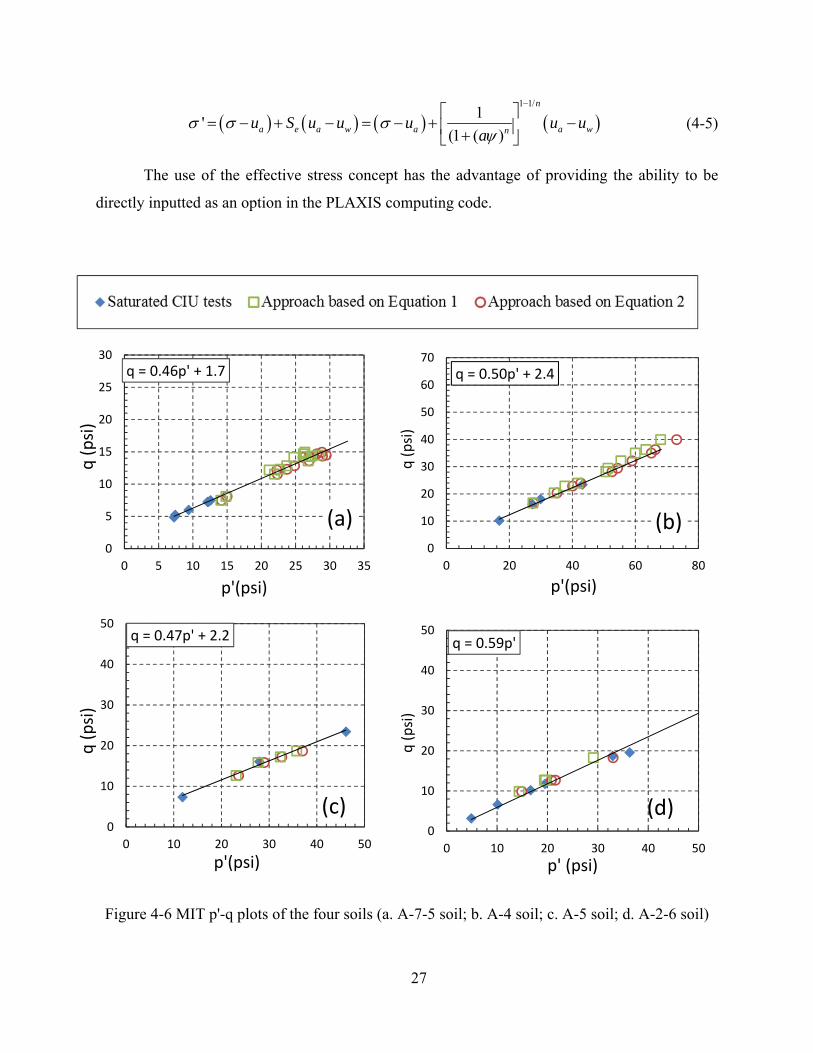
Equations 4-3 and 4-4 were used to calculate the mean effective stress, and then p’-q
diagrams is plotted for the failure stress points (for the four soil types) as shown in Figure 4-6.
The p’ in Figure 4-6 represents both saturated and unsaturated effective stress: in the saturated
case, p’ was total stress minus pore water pressure, shown as diamond symbols; in the
unsaturated case, Equation 4-3 and 4-4 both were applied, shown as square and circle symbols,
respectively.
The Kf line in each plot was obtained from saturated triaxial test results. The similar slope
based on both the saturated and unsaturated test results indicates the feasibility of the concept of
unsaturated effective stress. The pore water pressures generated in CIU tests result in different p’
values at failure. The unsaturated triaxial tests are performed as constant matric suction tests, so
the p’ values have a constant suction stress while shearing.
The two approaches for calculating unsaturated effective stress (Equation 4-3 and 4-4)
provide a similar prediction, with each having an advantage. The use of Equation 4-4 does not
rely on the measurement or estimation of the residual degree of saturation, and the equation can
be utilized by knowing soil properties obtained from basic index tests. For Equation 4-3, a
closed-form relationship is developed based on Equation 4-3 and Van Genuchten equation for
SWCC model, so the effective stress as a function of matric suction can be obtained by knowing
fitting parameters, α and n.
27
(4-5)
The use of the effective stress concept has the advantage of providing the ability to be
directly inputted as an option in the PLAXIS computing code.
Figure 4-6 MIT p'-q plots of the four soils (a. A-7-5 soil; b. A-4 soil; c. A-5 soil; d. A-2-6 soil)
1 1/
1'
(1 ( )
n
a e a w a a wnu S u u u u u
a
q = 0.46p' + 1.7
0
5
10
15
20
25
30
0 5 10 15 20 25 30 35
q (psi)
p'(psi)
(a)
q = 0.50p' + 2.4
0
10
20
30
40
50
60
70
0 20 40 60 80
q (psi)
p'(psi)
(b)
q = 0.47p' + 2.2
0
10
20
30
40
50
0 10 20 30 40 50
q (psi)
p'(psi)
(c)
q = 0.59p'
0
10
20
30
40
50
0 10 20 30 40 50
q (psi)
p' (psi)
(d)

28
CHAPTER 5. Unsaturated Slope Stability
5.1. Factor of safety of test slopes with initial suction profile
Slope stability analyses were conducted using SEEP/W and SLOPW/W platforms (GEO-
SLOPE International, Ltd.). The initial matric suction distribution within the modeled soil
profiles and any subsequent variation induced by infiltration were simulated by SEEP/W. Then,
using the generated pore water pressure contours and calculated unsaturated shear strength
values, SLOPE/W was used to estimate the FS of the slope according to the Bishop’s Method of
Slices.
Table 5-1 summarizes the FS for each of the different initial matric suction profile
assumptions. As shown, when using the effective shear strength (effective friction angle of 27°
and effective cohesion of 10 kPa) but without the inclusion of matric suction, the FS of the
0.25:1 slope is 0.80, which implies failure would have taken place. However, this steep slope
remained stable over the three-month project duration when matric suction was included.
Table 5-1 Factors of Safety for Different Initial Matric Suction Profile Conditions
Initial matric suction profile FS
0.25:1 slope 0.5:1 slope 1:1 slope Measured 1.55 1.75 1.91
Hydrostatic equilibrium from water table
2.01 2.26 2.87
No matric suction 0.80 1.02 0.86
The FS for the 1:1 slope without matric suction is 0.86, which is lower than the FS of the
0.5:1 slope without matric suction, because the upper part of the 1:1 slope consisted of A-2-6
material that has a friction angle of 36 degrees but zero effective cohesion. In this case, the
calculated failure surface was close to the slope face; however, in the field, no shallow failure
was observed.
When the initial matric suction profile was generated linearly based on the pore water
pressure at the bottom of the deepest soil layer, as shown in Table 5-1, the FS was computed to
be over 2.0 for all slopes. However, this is due to the significantly over-estimated matric suction
values. It is interesting that the tensiometer-measured suction increase (at the zero day, or
equilibrium condition) from depths of approximately 9 m to 1.5 m is essentially parallel to the
hydrostatic line, but clearly relatively little increase in suction occurred between 15 m and 9 m.

29
These analysis results and the data generated from this site demonstrate the need for more depth-
specific estimations of suction value, either measured or predicted from empirical models, in
order to obtain an accurate assessment of stability. Evaporation and surface-water infiltration
will certainly affect the near-surface suction values, as evidenced in the initial suction profile.
Figure 5-1 Pore water pressure change over time along section A-A’ in Figure 5-2 (a)
Results of the numerical analyses, which incorporate field-measured matric suction
values, show FS values in excess of 1.5 for even the steepest slope of 0.25:1. As the steep slope
was observed to be stable throughout the field monitoring duration of three months, the
calculated results seem reasonable, despite the fact that even these results are likely to be
considered conservative, as the model-calculated shear strengths values are less than those
measured from laboratory tests, as shown in Figure 4-1 (a).
0
2
4
6
8
10
12
14
16
‐200 ‐150 ‐100 ‐50 0 50Depth (m)
Pore water pressure (kPa)
0 days
10 days
20 days
30 days

30
A simple analysis of the measured and predicted strength values over the range of suction
values from 25 kPa to 80 kPa that is appropriate for the test slopes suggests that the shear
strength values are conservative and underestimated by 1 to 30 percent at 25 kPa and 20 to 85
percent at 80 kPa; thus, an approximate underestimation of the shear strength by 30 percent to 50
percent might be expected.
5.2. Surface-water infiltration
The cut slopes were observed over a period of two months after excavation to a depth of
6.7 m. During the second month, 152 mm of water was added to ponds constructed at the top of
the slopes and used to induce the effects of surface-water infiltration. Infiltration analyses were
performed using the Van Gunuchten model, with the SWCC parameters shown in Table 5-2, in
SEEP/W to estimate permeability as a function of matric suction. The SEEP/W-generated pore
water pressure contours were then used as inputs to SLOPE/W in order to conduct the stability
analysis. As infiltration, and therefore wetting, occurred, the degree of saturation increased,
resulting in an increase in the soil weight, which also must be considered. The procedure
described above for the 0.25:1 slope also was applied for the 0.5:1 and 1:1 slopes.
Table 5-2 Van Genuchten SWCC Parameters for Slopes area
SLOPE angle
Depth (m)
Soil type s r a (1/kPa)
n m
0.25 : 1 0-1.2 A-7-5 (1) 0.615 0.17 0.098 1.359 0.263
1.2-8.5 A-7-5 (2) 0.594 0.17 0.022 1.725 0.42 8.5-15.2 A-4 (1) 0.509 0.038 0.050 1.589 0.37
0.5 : 1
0-1.8 A-7-5 (3) 0.541 0.17 0.165 1.29 0.224 1.8-4.3 A-7-5(4) 0.611 0.17 0.051 1.706 0.413 4.3-8.5 A-7-5 (3) 0.541 0.17 0.165 1.29 0.224
8.5-15.2 A-4 (2) 0.456 0.038 0.057 1.678 0.404
1 : 1 0-3 A-2-6 0.384 0.11 0.752 1.186 0.157
3-9.1 A-7-5 (5) 0.442 0.17 0.030 1.622 0.383 9.1-15.2 A-4 (2) 0.456 0.038 0.057 1.678 0.404
Infiltration analyses were conducted using SEEP/W, as previously described, for each of
the three temporary cut-slope inclinations (0.25:1, 0.5:1, and 1:1 slopes). In these analyses, the
150 mm water level on top of the slope crest was assumed as constant over time. Figure 5-2 (a)
and (b) present the predicted pore water pressure levels after one month and two months of

31
infiltration, respectively. Figure 5-1 shows the changes in pore water pressure values from the
initial matric suction profile at the cross section A-A’ after 10, 20, 30 and 50 days of continuous
infiltration. The data used to generate the pore pressure contours were then carried over to the
stability analysis (from SEEP/W to SLOPE/W) to investigate infiltration-induced changes in the
FS over time.
Figure 5-2 Pore water pressure profiles at (a) 30 days and (b) 57 days after adding water to ponds for 0.25:1 slope (100 kPa = 2000 psf)
A
(a)
(b)

32
Figure 5-3 presents the results of the stability analyses. These were performed to
represent different times over a three-month period for the 0.25:1, 0.5:1 and 1:1 slopes, although
the field infiltration period lasted only one month. After 30 days, the FS for the 0.25:1 slope was
found to be close to 1.25. After 57 days of continuous infiltration (a worst-case scenario), the FS
reduced to 1.0 for the 0.25:1 slope. Based on the results of similar analyses, an allowable
construction period for a temporary slope could be estimated. However, the analysis results
reported in this paper would produce a very conservative construction period, because they
represent a condition in which a constant 150 mm water level was maintained at the top of the
slopes. More site specific analyses could be performed with periods of infiltration followed by
periods of evaporation to produce an appropriate design.
As shown by the inclinometer data, the lateral displacement profiles (Figure F-3 in
Appendix F) obtained after the 30-day infiltration period show very little additional movement.
The magnitude of these seepage-induced changes suggests that one month of infiltration could
not induce significant shear deformations within the slopes.
Figure 5-3 Effects of infiltration on slope stability for 0.25:1 and 0.5:1 slopes
0
0.2
0.4
0.6
0.8
1
1.2
1.4
1.6
1.8
2
0 10 20 30 40 50 60 70 80 90 100
Factor of safety
Time (days)
0.25 : 1 SLOPE
0.5 : 1 SLOPE
1 : 1 SLOPE

33
From analyses and evaluations presented in this chapter, the following observations can
be concluded:
1. Compared to assuming no matric suction, the inclusion of a matric suction profile that
decreased from approximately 80 kPa near the ground surface to 25 kPa at the base of a
6.7 m cut in an A-7-5 soil profile caused the calculated FS of 0.25:1 and 0.5:1 slopes to
increase from 0.8 to 1.55 and 1.02 to 1.75, respectively.
2. The effect of continuous surface-water infiltration was shown to decrease both the matric
suction and the resulting FS, with the 0.25:1 slope FS decreasing from 1.55 to 1.25 after
30 days and to 1.0 after 57 days, while the 0.5:1 slope FS decreased from 1.75 to 1.55
and 1.42 after 30 and 57 days of infiltration, respectively.
3. Predicted shear strength using the Vanapalli et al. model (2000), which incorporates the
SWCC via Van Genuchten’s model, was shown to under predict the laboratory measured
unsaturated shear strength by an average of 30 to 50 percent over the range of matric
suction from 25 kPa to 80 kPa applicable to the suction values found in the in situ slopes.
The FS would increase by 30 to 50 percent by taking into account the under estimation of
the model-predicted strength.
4. Measured inclinometer data 1 m behind the crest of each slope showed lateral
displacements less than 0.5 inches, even after one month of surface-water infiltration.
After one month, the FS was calculated to be1.25, and could have been 30 to 50%
greater, which appears reasonable given the small displacements.
5. The initial matric suction profile generated linearly from the water table produced
computed values of FS that were over 2 for all slopes, due to the significantly over-
estimated matric suction values. In order to appropriately conduct slope stability analysis,
more depth-specific estimation of the suction profile is needed.

34
CHAPTER 6. Measured Behavior and Modeling of Cantilever Sheet
Pile Wall
6.1. Modeling of cantilever sheet pile wall at initial matric suction condition
This section presents the details of the wall data as a case study documenting the
performance of a cantilever sheet pile wall installed to a depth of 10.7m below ground
surface. After installation, the soil in front of the retaining wall was excavated to a depth of
6.7 m. Numerical analyses of the soil-sheet pile wall system were performed in PLAXIS and
incorporated the suction profile based on measured suction data. Assigned parameters were
obtained from an extensive site investigation that included laboratory tests, in situ tests, and
instrumentation monitoring of the behavior of the sheet pile and soil behind the sheet pile
wall. The results of the numerical analyses were validated based on measured data and,
subsequently, the lateral earth pressure on the sheet pile wall was estimated.
Background studies are recorded in Appendix G, including Bishop’s effective stress
concept, hardening soil model, estimation of Ko, unsaturated shear strength, magnitude of
stress dependency, m, for each layer, optimization process used, interface properties and
the logic behind the rainfall infiltration analysis.
Model of subsurface profile
Based on the results obtained from the subsurface exploration and laboratory testing
program, an idealized profile was developed with 15 discrete layers to a depth of 15 m.
Figure 6-1 shows the geometry of the sheet pile wall used in the analyses; the associated soil
properties are recorded in Table 6-1. Based on sensitivity trials, the extent to the lateral
boundaries from the sheet pile wall was chosen as three times the depth of excavation (6.7m),
and the distance to the vertical boundary as two times the depth of excavation (6.7 m). The
layers were defined according to the variations in soil properties and the measured initial
matric suction values. Each layer was assigned its own SWCC, which was selected based on
the soil properties, including dry density, percentage of fines and the PI. The water table was
not observed in the upper 15 m of the profile.
50refE

35
Figure 6-1 Geometry of numerical analysis
Table 6-1 Material Properties for Sheet pile wall area
Layer Soil type
Layer thickness sat dry Fines PI E50
ref 'c '
(m) 3( / )kN m 3( / )kN m % ( )MPa ( )kPa (deg.)
1 A-4 1 17 11 61 7 13 0 30 2 A-4 1 17 11 61 7 10 0 30 3 A -4 1 18 13 61 8 15 0 30 4 A-4 1 18 13 61 7 13 0 30 5 A-4 1 18 13 64 6 10 0 30 6 A-4 2 18 13 64 7 14 0 30 7 A-4 1.5 19 14 64 7 7 0 30 8 A-4 1.5 19 14 57 8 19 19 30 9 A-7-5 1 18 13 72 19 8 10 27
10 A-7-5 1 18 13 72 19 7 10 27 11 A-7-5 1 20 16 75 19 10 10 27 12 A-7-5 1 20 16 77 14 10 10 27 13 A-7-5 1 19 14 60 11 7 10 27 14 A-7-5 5 18 13 64 33 9 10 27 15 A-4 10 20 16 57 6 6 19 30
12 11
15
13
14
10 9 1
2 3 4 5
8
6
7

36
Initial matric suction
Based on an optimization process using measured data, after the 4.6 m excavation
stage, an unloading/reloading modulus ratio of 6.0 was determined and applied to the
subsequent excavation steps (to depths of 6.1 m and 6.7 m) without considering any changes
in the suction profile. The lateral displacements predicted by the numerical analysis matched
well the soil displacements measured by the inclinometers behind the sheet pile wall until an
excavation depth of 6.1 m was reached. However, as shown in Figure 6-2, upon excavation
to 6.7 m, the predicted lateral displacements of the soil, especially at 0.6 m and 1.5 m behind
the sheet pile wall, are significantly different than that measured.
The predicted and measured lateral deflections of the sheet pile also did not match
each other, as shown in Figure 6-3. The deflections of the sheet pile wall determined from
the numerical analysis were significantly less than that measured, especially after excavation
to 6.7 m. Using the initial matric suction profile (no change in matric suction), the shear
strength of the soil due to matric suction was large enough to inhibit the development of
significant shear deformations in the retained soil mass, according to the numerical analysis
results. After the 6.7 m excavation, however, relatively large cracks appeared behind the
sheet pile wall in the field where the A-4 soil areas were located. These cracks were evidence
of large shear deformations and an indication that the numerical analysis was unable to
capture the large shear deformation of the soil behind the sheet pile wall, because the shear
strength of the soil as modeled was higher than that actually existing, at that time.
As shown in Figure 6-4, the maximum bending moments in the sheet pile wall
(determined from strain gauges mounted to the back of sheeting sections) after the 4.6 m and
6.1 m excavation depths are seen to be somewhat larger than those predicted by the
numerical analysis, with the locations of the maximum bending moments moving downward
as the excavation depth increases. After excavation to the 6.7 m excavation, the bending
moments were more significantly underestimated in the results of the numerical analysis
compared to those determined from the measured data. It appeared very likely that surface-
water infiltration over the project duration was influencing the existing suction profile,
reducing the soil strength and responsible for increasing lateral deflections and bending
moments in the sheeting and that these factors must be included in the analyses.

37
4 m 2.7 m 1.5 m 0.6 m
Figure 6-2 Comparisons between measured inclinometer data and numerical analysis results after 6.7 m excavation without
suction profile change
0
2
4
6
8
10
12
14
16
0 100 200Depth (m)
Lateral displacement (mm)
Inclinometer
FEM
0 100 200
Lateral displacement (mm)
0 100 200
Lateral displacement (mm)
0 100 200
Lateral displacement (mm)

38
Figure 6-3 Comparison between measured deflections of sheet pile wall and numerical
analysis results with initial suction profile
‐2
‐1
0
1
2
3
4
5
6
7261
262
263
264
265
266
267
268
269
270
‐50 0 50 100 150 200 250
Ele
vati
on (
m)
Lateral displacement (mm)
Before excavation After 4.6m excavation
After 6.1m excavation After 6.7m excavation
approximate initial line FEM_after 4.6m excavation
FEM_after 6.1m excavation FEM_after 6.7m excavation
Dep
th

39
4.6 m excavation 6.1 m excavation 6.7 m excavation
Figure 6-4 Comparisons between measured bending moments and numerical analysis results with initial suction profile
‐2
0
2
4
6
8
10
12
‐50 0 50 100 150 200 250 300
Depth (m)
Bending moment (kN‐m/m)
Strain gauge (A)
Strain gauge (B)
FEM
‐2
0
2
4
6
8
10
12
‐50 0 50 100 150 200 250 300
Depth (m)
Bending moment (kN‐m/m)
‐2
0
2
4
6
8
10
12
‐50 0 50 100 150 200 250 300
Depth (m)
Bending moment (kN‐m/m)
4.6 m 6.1 m 6.7 m

40
6.2. Modeling of sheet pile wall with the effect of rainfall infiltration
Rainfall infiltration results
Suction profiles were developed using the results of numerical analysis and measured
data. The suction profiles for the A-7-5 soil area were developed using runoff coefficients of
0, 0.2 and 0.3, as shown in Figure 6-5, with a value of 0.2 found to produce results that
matched well with the measured suction profiles at the end of the field work (February 20,
2014). The suction profile for A-7-5 (BH3) could then be estimated over time, as shown
Figure 6-5 (b), with time increments of one month for each stage of excavation.
For the A-4 soil (BH2), where surface cracks were observed, the installed FTC sensor
data were used to infer suction profile change over time (Figure 6-6 (a)). Reduction factors
were calculated from the changes in suction value obtained from the FTC sensors (Figure
6-6 (b)) on June 27, 2014 and were applied to the seepage analysis to develop a new suction
profile with infiltration. The calculated reduction factors were only applied to the initial
suction profile, and the incremental changes in the suction profile over time were computed
(Figure 6-6 (c)). Especially after the third stage of excavation, the matric suction
dramatically decreased over depths from 0 m to 5 m. The monitored field reduction in the
matric suction profiles in the A-4 soils was caused by stormwater infiltration through soil
cracks and a gap between the soil and sheet pile wall. The FTC sensors captured the reduced
suction values, which were close to 0 from depths of 0 m to 5 m after the third stage of
excavation. The loss of matric suction led to a decrease in shear strength and modulus values
in the A-4 soil and subsequently allowed the development of larger shear deformations.
Suction profile changes over time in front of the sheet pile wall were also taken into
account, as analyses showed that the suction in front of the sheet pile affected the
deformation of the sheet pile wall. As shown in Figure 6-7, over time the suction value
changes due to rainfall were estimated using the seepage analyses based on net precipitation,
using the same runoff coefficient of 0.2. However, when compared with the measured data,
the measured suction values are relatively lower than the predicted values at the end stage of
the excavation. This outcome can be explained by the local water retention in front of the
sheet pile wall and the fact that suction measurements were taken at the ground surface,
which is a sensitive location for suction measurements with the occurrence of ponded water.

41
(a) a= 0 (b) a=0.2 (c) a=0.3
Figure 6-5 Matric suction profiles using different runoff coefficients as used for calibration of the net precipitation equation for the
A-7-5 soils (BH3)
0
2
4
6
8
10
12
14
0 50 100 150 200 250D
epth
(m
)
Suction (kPa)
Initial @ BH3Final @ BH30 m4.6 m6.1 m6.7 m
0 50 100 150 200 250Suction (kPa)
0 50 100 150 200 250Suction (kPa)

42
Figure 6-6 Developed suction profiles for A-4 soil (BH2)
0
2
4
6
8
10
12
14
0 50 100 150 200
Dep
th (
m)
FTC suction (kPa)
0
2
4
6
8
10
12
14
0 50 100% Reduction
0
2
4
6
8
10
12
14
0 50 100 150 200Caculated suction (kPa)
(a) (b) (c)

43
Figure 6-7 Suction profiles in front of sheet pile wall (BH1) during excavation stages
Variation of suction profile over time
The suction profiles that were developed from the infiltration analyses were manually
assigned to the numerical deformation analyses. With these revised suction profiles, the
results of the numerical analysis after the 6.7 m excavation were seen to match well the
measured data.
Figure 6-8 shows the lateral displacement of the soil behind the sheet pile wall after
the 6.7 m excavation. The lateral displacements at 0.6 m and 1.5 m behind the sheet pile wall
from the numerical modeling match well with the measured inclinometer data. The reduction
0
2
4
6
8
10
12
14
0 50 100 150
Dep
th (
m)
Suction (kPa)
Initial@ BH1Final_1Final_20 m4.6 m6.1 m6.7 m
4.6 m
6.1 m 6.7 m

44
in the suction values within the A-4 soil caused significantly larger shear deformations in the
retained soil mass during excavation from 6.1 to 6.7 m.
As shown in Figure 6-9, the predicted lateral deflection profile of the sheet pile wall
also matches well with measured data from LiDAR scans after excavation to the 6.7 m depth.
Finally, Figure 6-10 shows the predicted sheet pile wall bending moment diagram
determined from these updated numerical analyses in comparison with the values back-
calculated from the strain gauge data. Comparing Figures 6-10 and 6-4, it is shown that the
reduction in matric suction which did occur in the field, and was incorporated into the current
analyses, enabled the numerical results to more closely approximate the field-measured
bending moments. Overall, it can be seen that the results of numerical analyses, which
account for appropriate changes in matric suction profile changes over time, can produce
lateral deflection and bending moment profiles that match the measured data reasonably well.
6.3. Estimating net pressure diagram for sheet pile wall from PLAXIS analyses
As shown in Figure 6-8, Figure 6-9 and Figure 6-10, the measured lateral
displacements of the soil behind the sheet pile wall, the deflections of the sheet pile wall and
the bending moments in the sheeting determined from the PLAXIS analyses are in
reasonably good agreement with the field measured values. This suggests that the numerical
model is well calibrated with the measured data. At this stage, the next objective was to use
these numerical analyses to estimate a net soil-pressure diagram acting on the sheet pile wall
and to validate or suggest a procedure that could be used for design purposes.
Net pressure diagrams for the sheet pile wall were generated based on the total soil
pressure acting on both the retained and the excavated soil sides. As shown in
Figure 6-11, the analyses suggested that no pressure was exerted on the upper parts of the
sheet pile during excavation from the ground surface to depths of 4.6 m and 6.1 m,
respectively. This behavior can be attributed to the magnitude of the matric suction force
within the soil that reduced the lateral pressure on the sheet pile wall.

45
4 m 2.7 m 1.5 m 0.6 m
Figure 6-8 Comparisons between measured inclinometer data and numerical analysis results after 6.7 m excavation with suction
profile change
0
2
4
6
8
10
12
14
16
0 100 200Depth (m)
Lateral displacement (mm)
Inclinometer
FEM
0 100 200
Lateral displacement (mm)
0 100 200
Lateral displacement (mm)
0 100 200
Lateral displacement (mm)

46
Figure 6-9 Comparison of measured deflections of sheet pile wall and numerical analysis
results with infiltration
-2
-1
0
1
2
3
4
5
6
7261
262
263
264
265
266
267
268
269
270
-50 0 50 100 150 200 250
Ele
vati
on (
m)
Lateral displacement (mm)
Before excavation After 4.6m excavation
After 6.1m excavation After 6.7m excavation
approximate initial line FEM_after 4.6m excavation
FEM_after 6.1m excavation FEM_after 6.7m excavation
Dep
th (m
)

47
4.6 m excavation 6.1 m excavation 6.7 m excavation
Figure 6-10 Comparisons between measured bending moments and numerical analysis results with suction profile changes
‐2
0
2
4
6
8
10
12
‐50 0 50 100 150 200 250 300
Depth (m)
Bending moment (kN‐m/m)
Strain gauge (A)
Strain gauge (B)
FEM
‐50 0 50 100 150 200 250 300
Bending moment (kN‐m/m)
‐50 0 50 100 150 200 250 300
Bending moment (kN‐m/m)
4.6 m
6.1 m 6.7 m

48
4.6 m excavation 6.1 m excavation 6.7 m excavation
Figure 6-11 PLAXIS-predicted total and net lateral pressures on sheet pile wall with excavation depth
‐2
0
2
4
6
8
10
12
‐200 ‐100 0 100 200
Depth (m)
Pressure (kN/m2)
‐200 ‐100 0 100 200
Pressure (kN/m2)
‐200 ‐100 0 100 200
Pressure (kN/m2)
4.6 m 6.1 m 6.7 m

49
However, after excavation to a depth of 6.7 m, pressure was generated on the sheet pile
wall. This response was due to the reduced suction that occurred over time from wetting, which
caused increased shear deformation and resulted in the soil pushing against the sheeting.
As shown in Figure 6-10, the maximum bending moments in the sheeting increased and
occurred at increasing depths below the excavated ground surface as the depth of the excavation
increased. Based on the bending moments, the lateral earth pressure could be estimated using the
differential equation of the deflection curve, as shown in Equation (6-1).
Pressure on sheet pile wall =
2
2
d M
dz (6-1)
where M is the bending moment, and z is the depth along the sheet pile wall.
Although the pressure diagram can be estimated using differentiation of the best fit curve
to the strain -calculated bending moments, the number of data points was relatively sparse and a
few gauges appeared to produce erratic results. Therefore, the field-measured data were used to
validate the results of the numerical analyses. Once the bending moments and deflections of the
sheet pile wall obtained from results of the numerical analysis agreed with those measured in the
field, the bending moments from the numerical analysis were used to estimate the lateral
pressure on the sheet pile wall.
Comparison between results of PLAXIS and Lu and Likos approach (2004) to predict lateral
pressure on sheet pile wall
The goal of this task was to compare the pressure diagrams generated from PLAXIS and
based on measurement data with the pressure diagrams generated using the approach proposed
by Lu and Likos (2004). Lu and Likos (2004) proposed the active and passive pressure equations
accounting for matric suction based on Bishop’s effective stress concept with Rankine’s theory
as shown in Equations (6-2) and (6-3).
Active earth pressure: ( ) 2 ' ( )(1 )h a v a a a a w au u K c K u u K (6-2)

50
Passive earth pressure: ( ) 2 ' ( )( 1)h a v a p p a w pu u K c K u u K (6-3)
Where,1 sin '
1 sin 'aK
,
1 sin '
1 sin 'pK
, and eS
However, since the PLAXIS analyses reported thus far have incorporated wall friction, a
modification to the proposed equations was required. Therefore, for the purposes of this study,
the Lu and Likos equations are used with the Coulomb values for Ka and Kp, with = 2/3
(thus, Ka = 0.279 and Kp = 5.75). For comparison purposes, the following analyses investigate
two different conditions: the first assumes that the initial suction profile remains constant during
the excavation process; and the second incorporates the time-dependent changes in suction due
to surface-water infiltration previously described. Figure 6-12 (a) compares the net pressure
diagrams developed utilizing the initial suction profile from the results of the PLAXIS analysis
to that from the Lu and Likos approach, after excavation to a depth of 9 m, where the FS is
approximately equal to 1.
The results from PLAXIS show that the depth of embedded sheet pile, expressed as (D)/
Height of excavation (H), is 26 percent smaller than the D/H obtained from the Lu and Likos
approach to obtain a FS=1. This means that excavation to a depth of 9 m requires the embedded
depth of the sheet pile wall to be 1.7 m for a FS of 1 based on the PLAXIS analysis, while only
1.3 m is needed for a FS of 1 based on the Lu and Likos approach. Both pressure diagrams show
that the pressure on the sheet pile wall down to a depth of 6 m is close to 0, due to the matric
suction force that decreases the potential active pressure on the sheet pile wall. Conventional
sheet pile wall analysis often calculates the value of D required for a FS=1 and then increases
this value by 20-40% to provide the desired margin of safety.
Table 6-2 Summary of required D/H for FS=1 (including wall friction)
H (m) Method D/H D (m) Difference (%) 9
(Fig. 3.19 (a)) PLAXIS 0.19 1.7
26 Lu & Likos 0.14 1.3
7.6 w Infiltration (Fig. 3.19 (b))
PLAXIS 0.41 3.1 17
Lu & Likos 0.34 2.6

51
(a) (b)
Figure 6-12 (a) Excavation to 9 m to produce FS=1 with initial suction profile and (b) excavation
to 7.6 m depth to produce FS=1 with suction profile at the end of field test (both (a) and (b)
include wall friction)
When the detailed infiltration and evaporation analysis over time is performed, as
previously described, the suction profile changed for each stage of excavation in the PLAXIS
analysis. Figure 6-13 (b) was developed using the estimated suction profiles existing at the
respective times associated with each depth of excavation at the field test site. This figure shows
‐2
0
2
4
6
8
10
12
‐1500 ‐500 500
Depth (m)
Pressure (kN/m2)
PLAXIS Pressure, D/H = 0.19
Lu & Likos (2004), D/H = 0.14
‐2
0
2
4
6
8
10
12
‐1500 ‐500 500
Depth (m)
Pressure (kN/m2)
PLAXIS_Pressure, D/H = 0.41
Lu & Likos (2004), D/H = 0.34
9 m 7.6 m
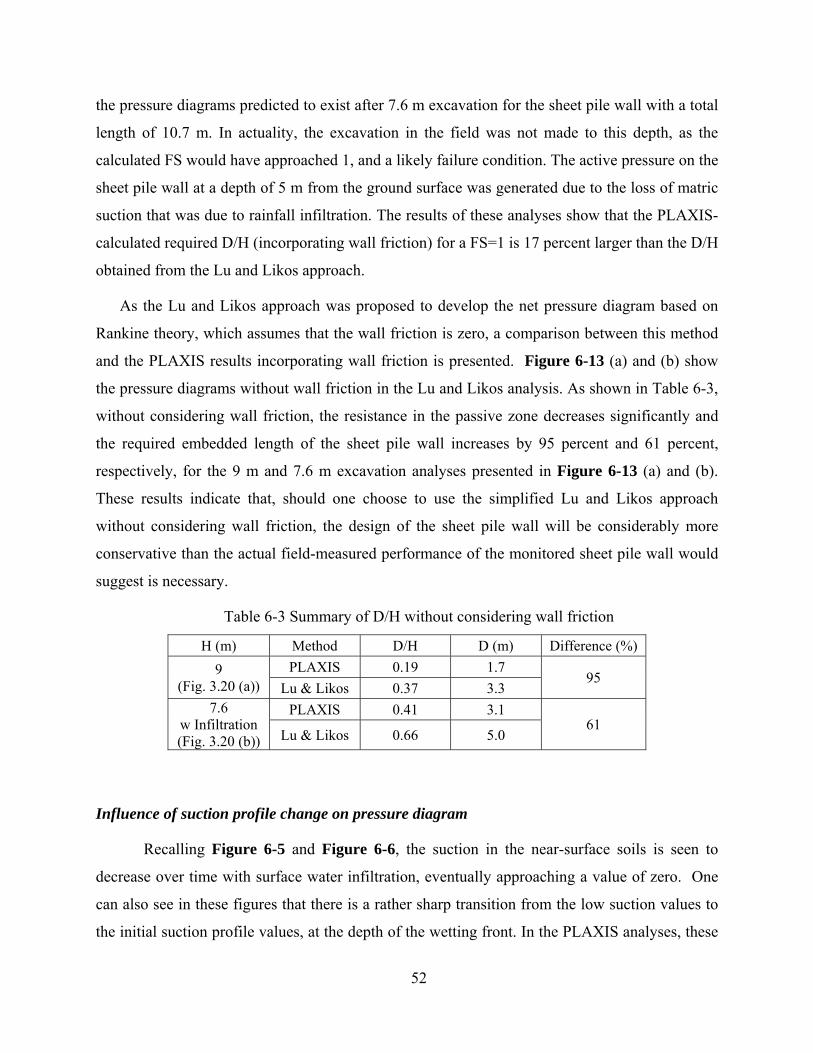
52
the pressure diagrams predicted to exist after 7.6 m excavation for the sheet pile wall with a total
length of 10.7 m. In actuality, the excavation in the field was not made to this depth, as the
calculated FS would have approached 1, and a likely failure condition. The active pressure on the
sheet pile wall at a depth of 5 m from the ground surface was generated due to the loss of matric
suction that was due to rainfall infiltration. The results of these analyses show that the PLAXIS-
calculated required D/H (incorporating wall friction) for a FS=1 is 17 percent larger than the D/H
obtained from the Lu and Likos approach.
As the Lu and Likos approach was proposed to develop the net pressure diagram based on
Rankine theory, which assumes that the wall friction is zero, a comparison between this method
and the PLAXIS results incorporating wall friction is presented. Figure 6-13 (a) and (b) show
the pressure diagrams without wall friction in the Lu and Likos analysis. As shown in Table 6-3,
without considering wall friction, the resistance in the passive zone decreases significantly and
the required embedded length of the sheet pile wall increases by 95 percent and 61 percent,
respectively, for the 9 m and 7.6 m excavation analyses presented in Figure 6-13 (a) and (b).
These results indicate that, should one choose to use the simplified Lu and Likos approach
without considering wall friction, the design of the sheet pile wall will be considerably more
conservative than the actual field-measured performance of the monitored sheet pile wall would
suggest is necessary.
Table 6-3 Summary of D/H without considering wall friction
Influence of suction profile change on pressure diagram
Recalling Figure 6-5 and Figure 6-6, the suction in the near-surface soils is seen to
decrease over time with surface water infiltration, eventually approaching a value of zero. One
can also see in these figures that there is a rather sharp transition from the low suction values to
the initial suction profile values, at the depth of the wetting front. In the PLAXIS analyses, these
H (m) Method D/H D (m) Difference (%)
9 (Fig. 3.20 (a))
PLAXIS 0.19 1.7 95
Lu & Likos 0.37 3.3 7.6
w Infiltration (Fig. 3.20 (b))
PLAXIS 0.41 3.1 61
Lu & Likos 0.66 5.0

53
variations over time were explicitly incorporated. Should one choose to use the Lu and Likos
calculated lateral earth pressures and a conventional sheet pile design approach to determine the
required depth of embedment, a way of incorporating infiltration-induced reductions in the
suction stress is needed.
(a) (b) Figure 6-13 (a) Excavation to 9 m to produce FS=1 with initial suction profile and
(b) excavation to 7.6 m to produce FS=1 with suction profile at the end of field test (without
considering wall friction in Lu and Likos approach)
‐2
0
2
4
6
8
10
12
14
‐800 ‐300 200
Depth (m)
Pressure (kN/m2)
PLAXIS_Pressure, D/H = 0.19
Lu and Likos (2004), D/H = 0.37
‐2
0
2
4
6
8
10
12
14
‐800 ‐300 200
Depth (m)
Pressure (kN/m2)
PLAXIS_Pressure, D/H = 0.41
Lu and Likos (2004), D/H = 0.66
9m7.6m

54
In order to approximate the observed reductions in suction, a simplified approach is
explored herein, where the initial suction profile is modified by setting all suction values above a
certain depth equal to zero. This depth of infiltration, Di , represents the depth to which the matric
suction is zero, and is applied to the retained soil side. As the depth of the saturated zone
increases, the required embedded depth of the sheet pile wall to produce a FS=1 increases, as
shown in Figure 6-14.
However, if one compares the results presented in these analyses with those presented in
Figure 6-13 (b), a difference in the required D/H for a FS=1 is seen. The prior analyses
suggested that D/H needed to be 0.41 to produce a FS=1, while the current analyses suggest 0.36.
The reason for this difference is that in the prior analyses infiltration on the excavated soil
surface was also taken into account, while in the current analyses the initial suction value of 65
kPa at the depth of 7.6m was maintained constant. This suggests that design decisions must also
be made regarding appropriate suction losses to incorporate on the excavated soil side, not just
the retained soil side.
Figure 6-14 D/H required for a FS=1 as a function of infiltration depths (Di) for excavation
to a depth of 7.6 m.
0
1
2
3
4
5
6
7
8
0 0.1 0.2 0.3 0.4
Di(m
)
D/H

55
The integration of field measurements with the numerical analyses discussed in this
Chapter and in Appendix G, produced the following observations:
1. Based on the optimization process for the unloading/reloading modulus ratio 50/ref refurE E ,
used as input to PLAXIS, a reasonable value of the ratio was determined to be 6.0.
2. Based on regression analysis, the relationship between E50 from unsaturated triaxial tests
and modulus values from PMTs, was found to be: 50 0.76 PMTE E . The at-rest lateral
earth pressure coefficients (Ko_ψ) as a function of depth can be determined by
considering the matric suction profile and the total lateral pressure obtained from the
PMT. The Ko_ψ values for the Greensboro test site ranged from 0.4 to 2.1.
3. It was possible to develop a suction profile based on measured data and calculated net
precipitation (from weather records) in conjunction with deformation analyses of the soil
behind and in front of the sheet pile wall. The suction values in the A-4 soil area (BH2)
decreased to zero over the depth from 0 m to 5 m after excavation to 6.7 m because
rainfall infiltrated surface soil cracks and the gap between the sheet pile wall and soil.
4. The measured lateral displacement of the soil at 0.4 m behind the sheet pile wall was
observed to be 170 mm, and the lateral deformation of the cantilever sheet pile wall at the
ground surface was 200 mm after the 6.7 m excavation step. The numerical analyses
accounting for the suction decrease in the A-4 soil produced both soil deflections and
sheet pile wall deflections that were in reasonable agreement. This outcome indicates that
the loss of matric suction over the upper 5 m of the profile caused reduced shear strengths
and significant shear deformations and reduced the modulus values, which subsequently
generated the larger displacements. The numerical modeling produced results that
matched reasonably well the measured deflection data and strain gauge calculated
bending moments of the sheet pile wall.
5. After verifying the numerical analyses with the soil and sheet pile wall measured
deformations, a net lateral earth pressure diagram was produced. The predicted bending
moments in the sheet pile wall also were validated by comparing them to the calculated
bending moments determined from the measured strain-gauge data. The net pressure

56
accounted for the matric suction profile in the soil mass and the approach described can
be used in the design of temporary excavation support systems.
6. The results of PLAXIS analyses predicted values of D/H required to reach a FS of 1 on
the order of 26 and 17 percent smaller than the values obtained using the Lu and Likos
approach, for an excavation depth of 9 m with initial suction profile and an excavation
depth of 7.6 m with suction profile predicted to exist at the end of field test, respectively,
when wall friction is incorporated in calculating Ka and Kp.
7. If one uses the Lu and Likos approach without incorporating wall friction, the resulting
depths of embedment will be on the order of 95 and 61 percent greater than that
determined from numerical analyses and confirmed by the performance of the field test
wall for an excavation depth of 9 m with initial suction profile and an excavation depth of
7.6 m with suction profile predicted to exist at the end of the field test, respectively
8. Analyses showed that the suction profile on the excavated side of the sheet pile is
important to the design of a temporary retained wall system, and appropriate reductions
in suction due to anticipated surface water infiltration is required. These results also
suggest that grading sites to divert water away from both the top of the retained soil side
and the bottom of the excavated soil wall face will enhance the matric suction
strengthening effect.

57
CHAPTER 7. Proposed Design Method for Cantilever Sheet Pile Walls
7.1. Factor of safety analysis of Greensboro test wall
In order to explore the reduction in FS that occurs with increasing depth of excavation,
analyses were conducted for the monitored cantilever sheet pile wall system. The “safety
calculation method” provided as an option in PLAXIS was used. This method computes the
global safety factor using the “phi/c reduction approach”, in which the strength parameters,
tan ' and c’, of the soil are successively reduced at the same ratio until failure of the structure
occurs, or instability prevents numerical convergence. For the application of this approach in
unsaturated soil conditions, the suction-strength term is also decreased by the same ratio, as the
term contains the tan ' value, as shown in Equation (7-1).
' ( ) tan ' ( ) tan '.
' ( ) tan ' ( ) tan 'n a a w e
failure n a failure a w e failure
c u u u SF S
c u u u S
(7-1)
Based on the measured initial suction profile for April 10th, as shown in Figure 7-1, and
the suction profile changes predicted due to rainfall infiltration, FS values were calculated as a
function of excavation depth. The conditions for which these analyses were performed, including
the time after initiation of excavation, and the resulting values of FS are tabulated in Table 7-1
and plotted in Figure 7-2. The FS is seen to decrease nonlinearly with excavation depth.
The solid circles displayed in Table 7-1 represent the first case, in which the initial
suction profile is maintained constant over time. Excavation Stage 1 in Table 7-1 indicates a FS
of 5.25 after 3 m of excavation, for a sheet pile total length of 10.7 m (D/H=2.57). Excavation
Stage 4 shows a FS of 1.93 after 6.7 m of excavation, which represents same height of
excavation as the final field condition. After 9 m of excavation (D/H = 0.19), defined as
excavation Stage 9, the FS is 1.13. The rate of decrease in FS is seen to change abruptly after the
7 m excavation depth because the 80 kPa suction layer in front of the sheet pile wall was
excavated, and below the 7 m depth the suction value is approximately 40 kPa. It can be
observed that the change in suction values on the excavated side, as well as the depth of the
excavation, significantly influences the FS.

58
Figure 7-1 Initial suction profile for A-4 area (BH2)
The second case, which is represented by the open triangles and solid squares, explores
the influence of surface water infiltration (the net of precipitation minus evaporation) and
modifications to the matric suction profile on resulting values of FS. The open triangles describe
the condition just after excavation to a given depth and take into account the suction profile
changes just prior to excavation based on the infiltration analyses. The solid squares represent
the resulting FS after the noted additional infiltration period is completed. Excavation Stage 4 in
Table 7-1 shows FS of 1.73 for the open triangle case, which represents 6.7 m excavation
(D/H=0.6) with the suction profile corresponding to that existing at the moment after the
excavation. The solid square represents a FS of 1.28 with the suction profile which was
developed after three additional months of infiltration, which was the same condition
experienced at the field test site previously described. During the three month simulation, the FS
was calculated to have decreased from 1.73 to 1.28 due to the loss of suction caused by rainfall
infiltration. The FS is generally seen to decrease after a period of infiltration, except for the one-
month period after the 6.1 m excavation depth (Excavation Stage 3), because during that period
the amount of rainfall was relatively small and evaporation was dominant, which caused
essentially no change in the matric suction profile and therefore the resulting FS.
0
2
4
6
8
10
12
14
0 100 200
Dep
th (
m)
Suction (kPa)
APRIL_10FEM_JUNE_27

59
The final part of the infiltration simulation is represented by the open squares. In Stages 5
and 6, excavation proceeds to 7 m (D/H =0.53) and 7.6 m (D/H =0.41), respectively, while the
suction profile from the end of Stage 4 is maintained unchanged. These analyses were performed
to find the excavation depth at which the FS approached 1, while still maintaining convergence
(a FS=1.05 was obtained) for D/H= 0.41.
Comparing the FS values obtained using the initial suction profile with those analyses
incorporating infiltration, it is estimated that infiltration causes the FS to decrease more rapidly
at greater excavation depths. This result is due to the infiltration-induced loss of suction and
resultant decrease in shear strength of soil surrounding the sheet pile wall.
Table 7-1 Summary of FS analyses for excavation stages
Excavation Stage
Depth, H (m)
D/H Symbol AnalysisTime*
(months)F.S Period of infiltration
1 3 2.57 ● 1 0 5.25 None
2 4.6 1.33
● 1 0 3.21 None ∆ 2 4 3.02 4 months
3 6 2.912 additional months of
infiltration @ 4.6 m depth
3 6.1 0.75
● 1 0 2.23 None ∆ 2 6 2.03 6 months
3 7 2.001 additional months of
infiltration @ 6.1 m depth
4 6.7 0.60
● 1 0 1.93 None ∆ 2 7 1.73 7 months
3 10 1.283 additional months of
infiltration @ 6.7 m depth
5 7 0.53
● 1 0 1.65 None
□ 2 10 1.20No additional months of infiltration after 6.7 m
depth
6 7.6 0.41 □ 1 10 1.05No additional months of infiltration after 6.7 m
depth 7 8.5 0.26 ● 1 0 1.29 None 8 8.8 0.22 ● 1 0 1.21 None 9 9 0.19 ● 1 0 1.13 None
*Time after establishment of initial suction profile.

60
Figure 7-2 FS as a function of excavation depth
From the results of the deformation analyses incorporating the infiltration modified
suction profile, the maximum lateral displacement of the sheet pile wall as a function of
excavation depth and the FS as a function of D/H were plotted, as shown in Figures 7-3 (a) and
7-3 (b), respectively.
The lateral displacement of the sheet pile wall is predicted to gradually increase with
excavation to a depth of 6 m, after which the rate of movement increases dramatically, resulting
in a lateral displacement of 900 mm at an excavation depth of 7.6 m. As described previously,
after the 6.7 m excavation depth the suction profile was not changed, as the excavation was
assumed to rapidly proceed to the final depth of 7.6 m (D/H= 0.41), where the FS was calculated
to be 1.05, as shown in Figure 7-3 (b).
0
1
2
3
4
5
6
7
8
9
10
0 1 2 3 4 5 6
Excavation depth, H
(m)
Factor of safety
w/ initialsuction
H
D

61
(a)
(b)
Figure 7-3 (a) Maximum lateral displacement of sheet pile vs. excavation depth and (b) FS corresponding to each stage of excavation with infiltration analysis
0
100
200
300
400
500
600
700
800
900
1000
0 1 2 3 4 5 6 7 8 9 10
Max. lateral displacement (m
m)
Excavation depth (m)
0.0
0.2
0.4
0.6
0.8
1.0
1.2
1.4
0 0.5 1 1.5 2 2.5 3 3.5
D/H
Factor of safety
H (m) 4.6 6.1 6.7 7 7.6
D (m) 6.1 4.6 4 3.7 3.1
D/H 1.33 0.75 0.60 0.53 0.41
FS 2.91 2 1.28 1.2 1.05

62
7.2. Development of a design chart for cantilever sheet pile walls
In order to develop a design approach for incorporating matric suction into cantilever
sheet pile wall design in unsaturated soils, the idea of using an average matric suction value over
the length of the proposed sheeting was explored. Suction values of 0 kPa, 30 kPa, and 50 kPa
were assigned for each analysis for sheet piles having lengths of 4.6 m and 10.7 m (the length of
the field-test piles). The analyses conducted for the two length sheet piles and three average
matric suction profiles produced decreasing FS values with increasing excavation depth (or
decreasing D/H values).
The concept of a Suction Stability Number (SSN) was introduced to account for the
stabilizing influence of matric suction, in a similar manner to cohesion in the conventional
stability number. Therefore, the SSN is defined as the absolute value of ψ/(γH), where the
suction, ψ , is taken as the average matric suction over the length of the sheeting, γ is the average
total unit weight and H is the depth of excavation. As would be expected, different suction
conditions and D/H values produce different FS values. The results of stability analyses show
that as D/H decreases, the FS of the sheet pile wall decreases linearly as a function of the SSN,
as can be seen in Figure 7-4. Based on the simplified average suction profile assumption, the
design chart for a cantilever sheet pile wall has been developed.
Using the observed linear relationships, and using linear regression on the data set for
each average suction value, values of D/H can be predicted corresponding to FS values of 1.5,
1.7, and 2, and the SSN can be estimated for each condition, as shown in Table 7-2. As would be
expected, the data in Table 7-2 show increasing values of D/H for any desired FS as the average
matric suction decreases from 50 kPa to 30 kPa to 0 kPa. These results clearly show that design
in unsaturated soils will be more economical if the matric suction is included.

63
Table 7-2 Summarized case conditions for FS of 1.5, 1.7, and 2
FS =1.5 FS =1.7 FS =2
Symbol L ψ H D/H ψ/(γH) H D/H ψ/(γH) H D/H ψ/(γH)
▪ 10.7 50 7.28 0.47 0.46 6.57 0.63 0.51 5.81 0.84 0.57
∆ 4.6 50 4.31 0.07 0.77 3.94 0.17 0.85 3.49 0.32 0.95
● 10.7 30 6.67 0.60 0.30 6.09 0.76 0.33 5.38 0.99 0.37
◊ 4.6 30 3.76 0.22 0.53 3.44 0.34 0.58 3.04 0.51 0.66
* 10.7 0 5.03 1.13 0.00 4.59 1.33 0.00 4.06 1.64 0.00
+ 4.6 0 2.19 1.10 0.00 2.00 1.30 0.00 1.77 1.60 0.00
Utilizing the tabulated data presented in Table 7-2 and second order polynomial
regression, contours for required D/H as a function of the SSN for values of FS values equal to
1.5, 1.7 and 2.0 were developed and plotted on Figure 7-4. This design chart can be used to
estimate the required embedded sheet pile wall length for a desired FS for the case of a known
excavation height (H) and average suction value for the soil surrounding the sheet pile wall. For
using this chart, the height of excavation, average total unit weight of soil, and average suction
value surrounding the sheet pile wall are needed to be known to estimate the SSN. Using the
calculated SSN and the desired FS, the required the depth ratio (D/H) can be predicted. The
required length of embedded sheet pile wall (D) can be determined by simply multiplying the
intended excavation depth (H) by D/H.
In a similar manner, the sequential infiltration and excavation case was investigated.
From Figure 7-2, and using the infiltration case (solid squares), the FEM analyses predict that a
FS=1.5 existed at an excavation depth of approximately 6.5 m. Thus, to obtain a FS of 1.5 in this
condition, a depth of embedment of 4.2 m was required. In order to produce a predicted
embedment depth from the proposed design procedure for the excavation height of 6.5 m, an
average matric suction value is needed. Using the FEM calculated matric suction profile for the
excavation depth of 6.1 m shown in Figure 6-6 (c), a calculated average matric suction value of
40 kPa was determined. The reason for selecting the suction profile corresponding to the 6.1 m
excavation depth, rather than that for the 6.7 m depth was that the former occurred at a point in
time closer to that at which the excavation to 6.5m was made.

64
Figure 7-4 Design chart for cantilever sheet pile wall including matric suction
Using the values for H and average suction, a SSN of 0.38 is calculated. For this SSN
and a FS=1.5, a D/H value of 0.5 is obtained from the design chart. As a result, a D of 3.25 m is
suggested to be needed for a FS=1.5. This value is seen to be 23 percent shorter than that
resulting from the FEM analyses and very close to the 22 percent under-prediction observed for
the non-infiltration case. Accordingly, at the present time, it appears prudent to suggest that for a
FS=1.5 the embedment depths predicted from the proposed method (Figure 7-4) be increased by
22 to 23 percent, or approximately a factor of 1.25.
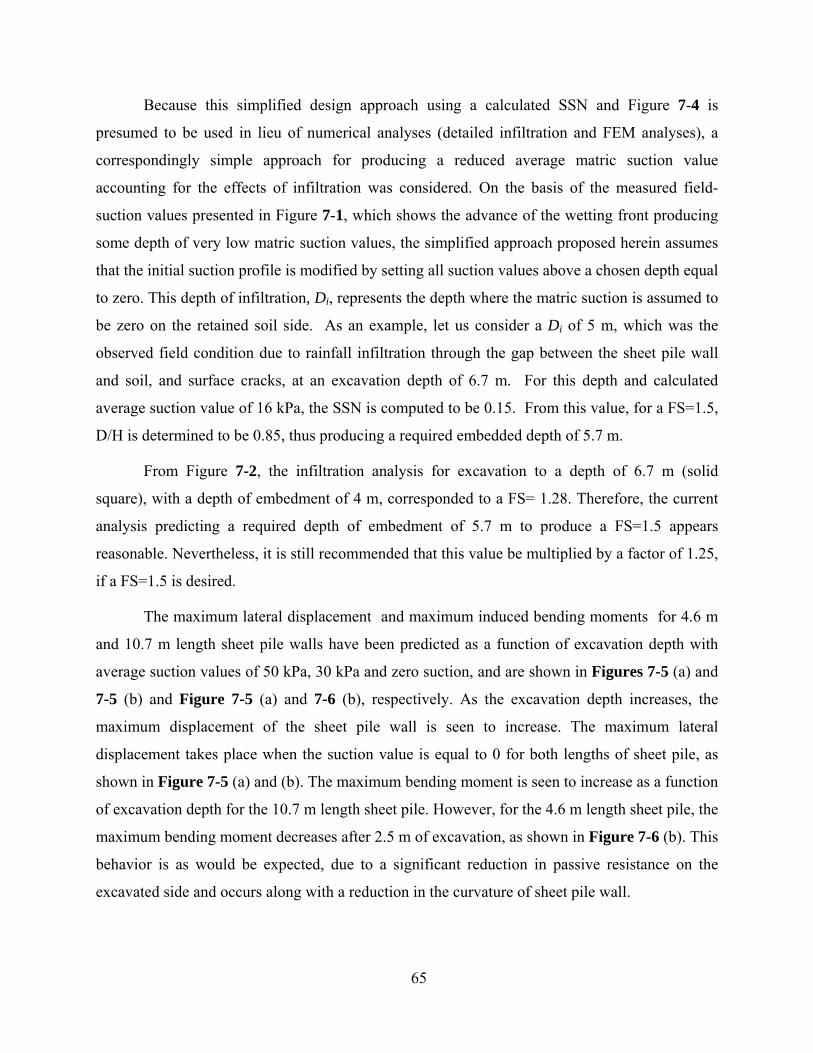
65
Because this simplified design approach using a calculated SSN and Figure 7-4 is
presumed to be used in lieu of numerical analyses (detailed infiltration and FEM analyses), a
correspondingly simple approach for producing a reduced average matric suction value
accounting for the effects of infiltration was considered. On the basis of the measured field-
suction values presented in Figure 7-1, which shows the advance of the wetting front producing
some depth of very low matric suction values, the simplified approach proposed herein assumes
that the initial suction profile is modified by setting all suction values above a chosen depth equal
to zero. This depth of infiltration, Di, represents the depth where the matric suction is assumed to
be zero on the retained soil side. As an example, let us consider a Di of 5 m, which was the
observed field condition due to rainfall infiltration through the gap between the sheet pile wall
and soil, and surface cracks, at an excavation depth of 6.7 m. For this depth and calculated
average suction value of 16 kPa, the SSN is computed to be 0.15. From this value, for a FS=1.5,
D/H is determined to be 0.85, thus producing a required embedded depth of 5.7 m.
From Figure 7-2, the infiltration analysis for excavation to a depth of 6.7 m (solid
square), with a depth of embedment of 4 m, corresponded to a FS= 1.28. Therefore, the current
analysis predicting a required depth of embedment of 5.7 m to produce a FS=1.5 appears
reasonable. Nevertheless, it is still recommended that this value be multiplied by a factor of 1.25,
if a FS=1.5 is desired.
The maximum lateral displacement and maximum induced bending moments for 4.6 m
and 10.7 m length sheet pile walls have been predicted as a function of excavation depth with
average suction values of 50 kPa, 30 kPa and zero suction, and are shown in Figures 7-5 (a) and
7-5 (b) and Figure 7-5 (a) and 7-6 (b), respectively. As the excavation depth increases, the
maximum displacement of the sheet pile wall is seen to increase. The maximum lateral
displacement takes place when the suction value is equal to 0 for both lengths of sheet pile, as
shown in Figure 7-5 (a) and (b). The maximum bending moment is seen to increase as a function
of excavation depth for the 10.7 m length sheet pile. However, for the 4.6 m length sheet pile, the
maximum bending moment decreases after 2.5 m of excavation, as shown in Figure 7-6 (b). This
behavior is as would be expected, due to a significant reduction in passive resistance on the
excavated side and occurs along with a reduction in the curvature of sheet pile wall.

66
From the analyses and evaluations presented in this chapter, the following observations
can be made:
1. The FS of a cantilever wall in unsaturated soil decreases nonlinearly with excavation
depth. This behavior was observed for both the initial suction profile and one that was
developed using an infiltration analysis based on net precipitation data, including both
measured precipitation and predicted evaporation. Due to the loss of suction during
rainfall infiltration, the FS is seen to decrease faster with excavation depth for the
infiltration case than for the constant initial suction profile.
2. The developed design chart (Figure 7-4), which incorporates the average suction profile
thru the SSN, can be used to estimate the required embedded depth of sheet pile wall for
a desired FS. However, the predicted depths for two cases were found to be
approximately 23 percent shorter than results predicted from the FEM analyses of the
field tests. Accordingly, at this time, it is considered prudent to apply a factor of 1.25 to
the embedment depth obtained from the design chart to produce the desired FS.
3. The maximum lateral displacements and maximum bending moments of the sheet pile
wall increase with decreasing values of suction. For the shorter, 4.6 m length, sheet pile
wall, the maximum bending moment decreased after a 2.5 m excavation depth due to the
reduction in passive resistance on the excavated side.

67
(a)
(b)
Figure 7-5 (a) Maximum lateral displacement of 10.7 m length of sheet pile wall and (b) 4.6 m
length of sheet pile wall
0
50
100
150
200
250
0 1 2 3 4 5 6 7 8 9 10
Max. lateral displacement (m
m)
Excavation depth (m)
L = 10.7 m & ψ =50 kPa
L = 10.7 m & ψ =30 kPa
L = 10.7 m & ψ =0 kPa
0
50
100
150
200
250
0 1 2 3 4 5 6 7 8 9 10
Max. lateral displacement (m
m)
Excavation depth (m)
L = 4.6 m & ψ =50 kPa
L =4.6 m & ψ =30 kPa
L = 4.6 m & ψ =0 kPa

68
(a)
(b)
Figure 7-6 (a) Maximum bending moment of 10.7 m length of sheet pile wall and (b) 4.6 m
length of sheet pile wall
0
50
100
150
200
250
0 1 2 3 4 5 6 7 8 9 10
Maxim
um bending moment (kN‐m
/m)
Excavation depth (m)
L = 10.7 m & ψ =50 kPa
L = 10.7 m & ψ =30 kPa
L = 10.7 m & ψ =0 kPa
0
50
100
150
200
250
0 1 2 3 4 5 6 7 8 9 10
Maxim
um bending moment (kN‐m
/m)
Excavation depth (m)
L = 4.6 m & ψ =50 kPa
L =4.6 m & ψ =30 kPa
L = 4.6 m & ψ =0 kPa

69
CHAPTER 8. Findings and Conclusions
The research reported herein was undertaken to provide the data, analyses and measured
field performance required to support the more economical design of temporary slopes and
retaining structures (with an emphasis on sheet pile walls) in unsaturated residual soils. To
accomplish this goal, an extensive program of field and laboratory tests were undertaken, the
results of which are summarized in this report and accompanying Appendices. The specific areas
of study included the measurement and prediction of matric suction, the measurement and
prediction of unsaturated shear strength as a function of matric suction, the incorporation of
matric suction into slope stability analyses, a comparison of PLAXIS numerical analyses with
the measured performance of a cantilever sheet pile wall, and the evaluation of approaches for
predicting lateral earth pressures to be used in the design of temporary retaining structures. As an
aspect of the final task, a design chart was developed for the determination of the required
embedment depth of cantilever sheeting in an unsaturated soil profile.
Based on the body of work completed in this research study, a number of findings and
significant conclusions were reached. The following points are arranged according to the order of
topics and chapters presented in this report.
Prediction models for matric suction
Compared with the published suction prediction models of Zapata (R2 = 51%) and SoilVision
(R2 = 48%), the proposed model from the current research is shown better able to represent
the measured test data, with R2 = 93%. The reasonableness of the model was verified using
previously published data.
It is proposed that SWCC curves representative of the field conditions, or “field curves,”
should be used in numerical analyses to more accurately predict existing matric suction.
These field curves can be constructed by shifting the pressure-plate determined SWCC
drying curve, if the actual suction is known at the existing field water content. Miniature
potentiometers have been shown to be able to produce this data (in a field cut or tube sample)
in less than 5 minutes.

70
Prediction models for unsaturated shear strength
An extensive database of unsaturated shear strength data was developed, with a total of
19 unsaturated triaxial tests, including 8 single stage tests and 11 multistage tests performed on
the four groups of soils of the three types encountered at the test site, A-7-5, A-4 and A-2-6
(MH, ML and SC). Analysis of these data, as well as data reported in the literature on other
residual soils, and evaluation of existing models for predicting unsaturated shear strength led to
the following observations:
Regression analyses on the Vanapalli et al. (1966) model-predicted values yielded a best-fit
slope of 0.8, thus underestimating the measured values by approximately 20%. However, the
values predicted are shown to be significantly influenced by the definition of the residual
volumetric water content.
Regression analysis on the Houston, et al. (2008) model yielded a prediction capability
within +/- 15% of the measured data from the four groups of soil in this research. However,
when additional SM and SM-SW data from the literature were evaluated, the “a” model
parameter became a negative value; thus the model no longer yielded a hyperbolic equation
and was therefore not able to provide reasonable shear strength predictions.
In an effort to produce a model with better predictive capability for both the Greensboro test
site soils and other residual soils reported in the literature, an improved empirical model for
the κ parameter in the Fredlund (1996) strength equation was explored. Based on multivariate
statistical analysis, a model including the soil parameters percent fines, Liquid Limit and
Plasticity Index wa developed. Using the proposed equation for κ along with the Fredlund et
al. (1996) model yielded the best estimation of apparent cohesion due to suction, with an
average underestimation of 6 % and an average R2 value of 0.9.
The empirical equation developed in this research for κ was applied to Fredlund’s
independent variable concept, for estimating the increase of total cohesion as a function of
matric suction. However, Kf lines on an MIT p’-q plot are presented to validate that the
empirical equation can also be applied into a model that uses the effective stress concept.

71
Stability analysis of unsaturated soil slopes
The slope stability analyses were conducted using SEEP/W and SLOPW/W platforms
(GEO-SLOPE International, Ltd.). The initial matric suction distribution within the modeled soil
profiles and any subsequent variation induced by infiltration were simulated by SEEP/W. Then,
using the generated pore water pressure contours and calculated unsaturated shear strength
values, SLOPE/W was used to estimate the FS of the slope according to Bishop’s Method of
Slices. As discussed in Chapter 5, if an analyst chooses to perform stability analyses in a manner,
or with a computer code, that does not accommodate the introduction of a soil-suction profile to
use in an effective-stress analysis, then the total cohesion induced by the existing suction in any
modeled soil layer can be determined and used as input with the effective friction angle to model
the soil strength in the stability analysis.
Compared to results with assuming no matric suction, the inclusion of a matric suction
profile led to an increase in the stability FS. A matric suction that decreased from
approximately 80 kPa near the ground surface to 25 kPa at the base of a 6.7 m cut in an A-7-
5 soil profile caused the calculated FS of 0.25:1 and 0.5:1 slopes to increase from 0.8 to 1.55
and 1.02 to 1.75, respectively.
The effect of continuous surface-water infiltration was shown to decrease both the matric
suction and the resulting FS, with the 0.25:1 slope FS decreasing from 1.55 to 1.25 after 30
days and to 1.0 after 57 days, while the 0.5:1 slope FS decreased from 1.75 to 1.55 and 1.42
after 30 and 57 days of infiltration, respectively.
Modeling of a cantilever sheet pile wall
A numerical model of the Greensboro test site cantilever sheet pile wall was constructed in
PLAXIS. After demonstrating that the deformations within the retained soil and those of the
sheet pile wall reasonably matched the field-measured data, net soil pressure diagrams were
estimated. The bending moments in the sheet pile wall also were validated by comparing
model-predicted values to those calculated from measured strain-gauge data. The results of
the numerical analyses matched reasonably well the measured data to the maximum 6.7 m

72
excavation depth. It is shown that the net pressure diagram on the sheet pile wall over the
excavation stages could be determined from the numerical analysis and then these values
could be used for the design of a temporary retaining wall system.
Apart from performing numerical analyses, similar to those performed using PLAXIS for this
research, the approach proposed by Lu and Likos (2004) for calculating lateral earth
pressures in unsaturated soils was evaluated. The results of PLAXIS analyses on the test site
sheet pile wall show that the D/H required to reach a FS of 1 is on the order of 26% and 17%
smaller than the D/H obtained from the Lu and Likos approach, for an excavation depth of 9
m with initial suction profile and an excavation depth of 7.6 m with suction profile
representative of the end of field test condition, respectively, when wall friction is
incorporated in calculating Ka and Kp. If one uses the Lu and Likos approach without
incorporating wall friction, the resulting depths of embedment will be on the order of 95%
and 61% greater than the values determined from numerical analysis and confirmed by the
monitored field wall performance data.
Analyses show that the suction profile on the excavated side of the sheet pile is important to
the design of a temporary retained wall system, and appropriate reductions in suction due to
anticipated surface water infiltration is required.
Development of a simplified design method for cantilever sheet pile walls in unsaturated
soils
The FS of a cantilever wall in unsaturated soil decreases nonlinearly with excavation depth.
This behavior was observed for both the initial suction profile and one that was developed
using an infiltration analysis based on net precipitation data, including both measured
precipitation and predicted evaporation. Due to the loss of suction during rainfall infiltration,
the FS is seen to decrease faster with excavation depth for the infiltration case than for the
constant initial suction profile.
The developed design chart, incorporating the average suction profile thru the concept of a
Suction Stability Number (SSN) can be used to estimate the required embedded depth of
sheet pile wall for a desired FS. However, the predicted depths for two cases were found to

73
be approximately 23 percent shorter than predicted from the FEM analyses of the field tests.
Accordingly, at this time, it is considered prudent to apply a factor of 1.25 to the embedment
depth obtained from the design chart to produce the desired FS.
The maximum lateral displacements and maximum bending moments of the sheet pile wall
increase with decreasing values of suction. For the shorter, 4.6 m length, sheet pile wall, the
maximum bending moment decreased after the 2.5 m excavation depth due to the reduction
in passive resistance on the excavated side.

74
CHAPTER 9. References
ASTM, D422; D854; D3080; D4318; D4767; D6838; D7181, Annual Book of ASTM Standards,
ASTM International, West Conshohocken, PA
Anderson, M. G., and Richards, K. S. (1987). Slope stability: geotechnical engineering and geomorphology. John Wiley & Sons.
Arya, L. M., and Paris, J. F. (1981). "A physicoempirical model to predict the soil moisture characteristic from particle-size distribution and bulk density data." Soil Sci.Soc.Am.J., 45(6), 1023-1030.
Au, S. (1998). "Rain-induced slope instability in Hong Kong." Eng.Geol., 51(1), 1-36.
Bittelli, M., and Flury, M. (2009). "Errors in Water Retention Curves Determined with Pressure Plates." Soil Science Society of America Journal, 73(5), 1453-1460.
Bouma, J. (1989). "Using soil survey data for quantitative land evaluation." Advances in soil science, Springer, 177-213.
Chandler, R. J., and Gutierrez, C. I.,. (1986). "Filter-paper method of suction measurement." Géotechnique, 36(2), 265-268.
Chin, K., Leong, E., and Rahardjo, H. (2010). "A simplified method to estimate the soil-water characteristic curve." Canadian Geotechnical Journal, 47(12), 1382-1400.
Cornelis, W. M., Ronsyn, J., Van Meirvenne, M., and Hartmann, R. (2001). "Evaluation of pedotransfer functions for predicting the soil moisture retention curve." Soil Sci.Soc.Am.J., 65(3), 638-648.
Cui, Y. J., Tang, A. M., Mantho, A. T., and De Laure, E. (2008). "Monitoring field soil suction using a miniature tensiometer." Geotechnical Testing Journal, 31(1), 95-100.
Diaz-Padilla, J., and Vanmarcke, E. H. (1974). Settlement of Structures on Shallow Foundations: A Probabilistic Analysis. Department of Civil Engineering, Massachusetts Institute of Technology.
Feng, M. (1999). "The effects of capillary hysteresis on the matric suction measurement using themral conductivity sensors". Maser of science. Department of Civil Engineering, University of Saskatchewan.
Feng, M., Fredlund, D. G., and Shuai, F. (2002). "A Laboratory Study of the Hysteresis of A Thermal Conductivity Soil Suction Sensor." Geotechnical Testing Journal, 25(3), 1-12.
Feng, M., and Fredlund, D. G. (2003). "Calibration of thermal conductivity sensors with consideration of hysteresis." Canadian Geotechnical Journal, 40(5), 1048-1055.
Fredlund, D. G., Rahardjo, H., and Fredlund, M. D. (2012). Unsaturated Soil Mechanics in Engineering Practice. Wiley, New Jersey.
Fredlund, D. G., and Morgenstern, N. R. (1977). "Stress state variables for unsaturated soils." J.Geotech.Geoenviron.Eng., 103.

75
Fredlund, D. G., Rahardjo, H., and Fredlund, M. D. (2012). Unsaturated soil mechanics in engineering practice. Wiley.
Fredlund, D. G., Sheng, D., and Zhao, J. (2011). "Estimation of soil suction from the soil-water characteristic curve." Canadian Geotechnical Journal, 48(2), 186-198.
Fredlund, D. G., and Xing, A. (1994). "Equations for the soil-water characteristic curve." Canadian Geotechnical Journal, 31(4), 521-532.
Fredlund, D., Morgenstern, N., and Widger, R. (1978). "The shear strength of unsaturated soils." Canadian Geotechnical Journal, 15(3), 313-321.
Fredlund, M. D., Fredlund, D. G., and Wilson, G. (1997). "Prediction of the soil-water characteristic curve from grain-size distribution and volume-mass properties." Proc., 3rd Brazilian Symp. on Unsaturated Soils, Rio de Janeiro, 13-23.
Fredlund, M. D., Fredlund, D., and Wilson, G. W. (2000). "An equation to represent grain-size distribution." Canadian Geotechnical Journal, 37(4), 817-827.
Guan, Y., and Fredlund, D. (1997). "Use of the tensile strength of water for the direct measurement of high soil suction." Canadian Geotechnical Journal, 34(4), 604-614.
Gupta, S., and Larson, W. (1979). "Estimating soil water retention characteristics from particle size distribution, organic matter percent, and bulk density." Water Resour.Res., 15(6), 1633-1635.
He, L., Leong, E. C., and Elgamal, A. (2006). "A miniature tensiometer for measurement of high matric suction." Geotech Spec Publ, 147(2), 1897.
Heartz, William. (1986). "Properties of a Piedmont residual soil". PhD. North Carolina State University, Raleigh, N.C.
Houston, S. L., Houston, W. N., and Wagner, A. M. (1994). "Laboratory Filter Paper Suction Measurements." Geotechnical Testing Journal, 17(2), 185-194.
Houston, W., Dye, H., Zapata, C., Perera, Y., and Harraz, A. (2006). "Determination of SWCC using one point suction measurement and standard curves." Unsaturated Soils 2006, ASCE, 1482-1493.
Iyer, K., Jayanth, S., Gurnani, S., and Singh, D. (2012). "Influence of initial water content and specimen thickness on the SWCC of fine-grained soils." International Journal of Geomechanics, 13(6), 894-899.
Johari, A., Habibagahi, G., and Ghahramani, A. (2006). "Prediction of soil–water characteristic curve using genetic programming." J.Geotech.Geoenviron.Eng., 132(5), 661-665.
Leong, E. C., He, L., and Rahardjo, H. (2002). "Factors Affecting the Filter Paper Method for Total and Matric Suction Measurements." Geotechnical Testing Journal, 25(3), 322-333.
Leong, E. C., and Rahardjo, H. (1997). "Review of soil-water characteristic curve equations." J.Geotech.Geoenviron.Eng., 123(12), 1106-1117.
Leong, E. C., Zhang, X. -., and Rahardjo, H. (2012). "Calibration of a thermal conductivity sensor for field measurement of matric suction." Geotechnique, 62(1), 81-85.

76
Likos, W. J., and Lu, N. (2002). "Filter paper technique for measuring total soil suction." Transportation Research Record: Journal of the Transportation Research Board, 1786(1), 120-128.
Lu, N., and Likos, W. J. (2004). Unsaturated soil mechanics. Wiley.
Mahler, C. F., and Mendes, C. A. R. (2005). "Measurement of Suction of Thick Textured Soil using Filter Paper Method and Equivalent Tensiometer - EQT." Proceedings of the International Conference" From Experimental Evidence towards Numerical Modeling of Unsaturated Soils,", Springer, Weimar, Germany, 183-192.
Marinho, F., and da Silva Gomes, J. E. (2012). "The Effect of Contact on the Filter Paper Method for Measuring Soil Suction." Geotechnical Testing Journal, 35(1), 1-10.
Meilani, I., Rahardjo, H., Leong, E., and Fredlund, D. G. (2002). "Mini suction probe for matric suction measurements." Canadian Geotechnical Journal, 39(6), 1427-1432.
Monroy, R., Zdravkovic, L., and Ridley, A. (2012). "Random Uncertainty in the Measurement of Matric Potential Using the Miniature Tensiometer." ASTM Geotechnical Testing Journal, 35(1), 41-49.
Mualem, Y. (1976). "A new model for predicting the hydraulic conductivity of unsaturated porous media." Water Resour.Res., 12(3), 513-522.
Mundorff, M. J. (1948). Geology and ground water in the Greensboro area, North Carolina. North Carolina, Department of Conservation and Development.
Neter, J., Kutner, M. H., Nachtsheim, C. J., and Wasserman, W. (1996). "Applied linear regression models, 1996." Irwin, Chicago, USA.p, 1050.
Nichol, C., Smith, L., and Beckie, R. (2003). "Long-term measurement of matric suction using thermal conductivity sensors." Canadian Geotechnical Journal, 40(3), 587-597.
Noguchi, T., Mendes, J., and Toll, D. G. (2011). "Comparison of soil water retention curves obtained by filter paper, high capacity suction probe and pressure plate." Unsaturated soils : theory and practice : proceedings of the 5th Asia-Pacific Conference on Unsaturated Soils, Pattaya, Thailand, 409414.
Perera, Y., Zapata, C., Houston, W., and Houston, S. (2005). "Prediction of the soil–water characteristic curve based on grain-size-distribution and index properties." Advances in Pavement Engineering (Ed.EM Rathje), Geotechnical Special Publication, 130 49-60.
Perera, Y. Y., and Fredlund, D. G. (2004). "Measurement of Soil Suction In Situ Using the Fredlund Thermal Conductivity Sensor." Presentation Material for Mining and Waste Management Short Course, 1-17.
Pham, H. Q. (2002). "An engineering model of hysteresis fro the soil-water characteristic curve". Master. University of Saskatchewan, Saskatoon, SK.
Pham, H., Fredlund, D., and Barbour, S. (2003). "A practical hysteresis model for the soil-water characteristic curve for soils with negligible volume change." Géotechnique, 53(2), 293-298.
Power, K. C., Vanapalli, S. K., and Garga, V. K. (2008). "A Revised Contact Filter Paper Method." Geotechncial Testing Journal, 31(6), 461-469.

77
Rahardjo, H., Satyanaga, A., Leong, E. C., Ng, Y. S., and Tam, H. (2012). "Variability of residual soil properties." Engineering Geology, 141-142 124-140.
Rahardjo, H., Satyanaga, A., and Leong, E. C. (2011). "Unsaturated soil mechanics for slope stabilization." .
Randy Rainwater, N., Mcdowell, L. A., and Drumm, E. C. (2001). "Measurement of total soil suction using filter paper: investigation of common filter papers, alternative media, and corresponding confidence." Geotechncial Testing Journal, 35(2), 295-304.
Rawls, W., Brakensiek, D., and Saxton, K. (1982). "Estimation of soil water properties." Trans.ASAE, 25(5), 1316-1320.
Ridley, A., and Burland, J. (1996). "A pore water pressure probe for the in situ measurement of a wide range of soil suctions." ADVANCES IN SITE INVESTIGATION PRACTICE. PROCEEDINGS OF THE INTERNATIONAL CONFERENCE HELD IN LONDON ON 30-31 MARCH 1995. .
Ridley, A., and Burland, J. (1993). "A new instrument for the measurement of soil moisture suction." Géotechnique, 43(2).
Ryan, T. A., Joiner, B. L., and Ryan, B. F. (1982). Minitab reference manual. Pennsylvania State University, Statistics Department..
Sattler, P., and Fredlund, D. G. (1989). "Use of thermal conductivity sensors to measure matric suction in the laboratory." Canadian Geotechnical Journal, 26 491-498.
Saxton, K., Rawls, W., Romberger, J., and Papendick, R. (1986). "Estimating generalized soil-water characteristics from texture." Soil Sci.Soc.Am.J., 50(4), 1031-1036.
Scheinost, A., Sinowski, W., and Auerswald, K. (1997). "Regionalization of soil water retention curves in a highly variable soilscape, I. Developing a new pedotransfer function." Geoderma, 78(3), 129-143.
Shuai, F., Clements, C., Ryland, L., and Fredlund, D. G. (2002). "Some factors that influence soil suction measurements using a thermal conductivity sensor." UNSAT 2002, Proceedings of the 3rd international conference on unsaturated soils, Recife, Brazil, 325-329.
Sillers, W. S., and Fredlund, D. G. (2001). "Statistical assessment of soil-water characteristic curve models for geotechnical engineering." Canadian Geotechnical Journal, 38(6), 1297-1313.
Sowers, G., and Richardson, T. (1983). "Residual Soils of Piedmont and Blue Ridge." Transp.Res.Rec., (919),.
Sweeney, D. (1982). "Some in situ soil suction measurements in Hong Kong’s residual soil slopes." Proceedings of the 7th Southeast Asian Geot. conference, Hong Kong, 91-106.
Take, W. A., and Bolton, M. D. (2003). "Tensiometer saturation and the reliable measurement of soil suction." Géotechnique, 53(2), 159-172.
Tan, E., Fredlund, D. G., and Marjerison, B. (2007). "Installation procedure for thermal conductivity matric suction sensors and analysis of their long-term readings." Canadian Geotechnique Journal, 44(2), 113-125.
Tarantino, A., and De Col, E. (2008). "Compaction behaviour of clay." Géotechnique, 58(3), 199-213.
78
Tarantino, A., Gallipoli, D., Augarde, C. E., De Gennaro, V., Gomez, R., Laloui, L., Mancuso, C., El Mountassir, G., Munoz, J. J., Pereira, J. -., Peron, H., Pisoni, G., Romero, E., Raveendiraraj, A., Rojas, J. C., Toll, D. G., Tombolato, S., and Wheeler, S. (2011). "Benchamark of experimental technique for measuring and controlling suction." Geotechnique, 61(4), 303-312.
Thakur, V. K., Sreedeep, S., and Singh, D. N. (2007). "Evaluation of various pedo-transfer functions for developing soil-water characteristic curve of a silty soil." Geotech Test J, 30(1), 25.
Tietje, O., and Tapkenhinrichs, M. (1993). "Evaluation of pedo-transfer functions." Soil Sci.Soc.Am.J., 57(4), 1088-1095.
Townsend, F. C. (1985). "Geotechnical characteristics of residual soils." J.Geotech.Eng., 111(1), 77-94.
Triola, M. F. (1998). Elementary Statistics, School Version. Addison-Wesley. .
Van Genuchten, M. T. (1980). "A closed-form equation for predicting the hydraulic conductivity of unsaturated soils." Soil Sci.Soc.Am.J., 44(5), 892-898.
Vanapalli, S. K., Fredlund, D. G., and Pufahl, D. E. (1999). "The influence of soil structure and stress history on the soil-water characteristics of a compacted till." Géotechnique, 49(2), 143-159.
Vanapalli, S. K., Fredlund, D. G., Pufahl, D. E., and Clifton, A. W. (1996). "Model for the prediction of shear strength with respect to soil suction." Canadian Geotechnical Journal, 33(3), 379-392.
Vereecken, H., Maes, J., Feyen, J., and Darius, P. (1989). "Estimating the soil moisture retention characteristic from texture, bulk density, and carbon content." Soil Sci., 148(6), 389-403.
Wang, C. E., and Borden, R. H.,. (1996). "Deformation characteristics of piedmont residual soils." Journal of of Geotechnical Engineering, 122(10), 822-830.
Wang, X., and Benson, C. (2004). "Leak-Free Pressure Plate Extractor for Measuring the Soil Water Characteristic Curve." Geotechncial Tesing Journal, 27(2), 1-10.
Yang, H., Rahardjo, H., Leong, E., and Fredlund, D. G. (2004). "Factors affecting drying and wetting soil-water characteristic curves of sandy soils." Canadian Geotechnical Journal, 41(5), 908-920.
Zapata, C. E., and Houston, W. N. (2008). Calibration and validation of the enhanced integrated climatic model for pavement design. Transportation Research Board..
Zapata, C. E., Houston, W. N., Houston, S. L., and Walsh, K. D. (2000). "Soil-water characteristic curve variability." Geotech Spec Publ, (99), 84-124.
Zhai, Q., and Rahardjo, H. (2012). "Determination of soil–water characteristic curve variables." Comput.Geotech., 42 37-43.