
Design of Propulsion Systems for High-Speed Craft - Blount, Bartee 1997
17
DESIGN OF PROPULSION SYSTEMS FOR HIGH-SPEED CRAFT DONALD L. BLOUNT,' and ROBERT J. BARTEE2 The demand for increased speed it7 medizrm and large croji challenges the designer to select proprlsion systems which meet performance requirements econonzical!y throzrghozrt ever-widening operational projles. The combined hydrodynamic characteristics of hull andpropulsors result in a speed-thrust relationship for the environment in which the vessel operates. This speed-thrust relationship requires rmique values of power and RPIM input for each type and number of propulsors. Power and RPM are also sensitive to the mode of operation of the vessel whether at constant speed, accelerating to a greater speed or towing an object. Most vessels utilize $xed-pitch submerged propellers. Surface propellers are jilted to vessels designed to perfornr at very high speeds and waterjet propulsors are being utilized with increasing frequency on larger vessels with high-speed operational projle. This paper discusses brake horsepower @HP) and propulsor miid relationships for vessel speed requirements based on the hydrodynamic characteristicsof three types ofproplsors: submerged propellers, surface propellers and waterjets. An example of predicted vessel performance regarding speed, power and propulsor RPM is presented which includes engine characteristics and BHP versus RPhL This latterformat depicts the d~flerences in power demandfor three types of propulsors on a monohull vessel with regard to engine characteristics. INTRODUCTION The speed-power relationship of a craft is of prime interest to all partics involved in the development and operation of a marine craft. The initial c o s ~ of both the engines and propulsors must be considered along with reliability, maintenance and operating eqenses. In addition, individual vessel requirements such as shallow navigation draft and/or low on-board vibration and noise influence both enginc and propulsor selection. The designdecision matrix for cach craft design may have combinations of requirements that necessitate unique solutions. No single type of propulsor is likely to be "the best" solution for varied marine applications. Trends for selecting submerged propellers, surface propellers andlor flush-inlet mutejets for craft have evolved over time. Current trends for propulsor applications are indicated in Fig. 1, which relates craft displacement and design speed This figure only indicates Likely applications of propulsors since the data used to develop the figure did not include information of specialized o~ncrloperator requirements. However, it should not be surprising to find some examples of propulsor applications outside of the general trends indicated. Mosl vcsscls utilize fixed-pitch, submerged propellers. Surface propellers are fitted to vcsscls designed to perform aL high speed or to those ivith an operational drdt limitation. At presenf watcjct propulsors are being used more fiquently with their applications expected to increase at the expense of submerged propellers. Waterjets are 'Naval Arclliteq Professional Engineer. Donald L. Blount and Associates, Norfolk, Virginia ZChiefEngimeer, Donald L. Blount and .bsociatcs, Norfolk, Virginia Presented at tl~e Febn~ary 23. 1936 meeting of the Harnpton Roads SwZion of TIE SOClElY OF NAVAI. ARCHITECTS .AXD X,liwE ENGKEERS.
-
Upload
leandro-meili -
Category
Documents
-
view
324 -
download
13
Transcript of Design of Propulsion Systems for High-Speed Craft - Blount, Bartee 1997
DESIGN OF PROPULSION SYSTEMS FOR HIGH-SPEED CRAFT
DONALD L. BLOUNT,' and ROBERT J. BARTEE2
The demand for increased speed it7 medizrm and large croji challenges the designer to select proprlsion systems which meet performance requirements econonzical!y throzrghozrt ever-widening operational projles. The combined hydrodynamic characteristics of hull andpropulsors result in a speed-thrust relationship for the environment in which the vessel operates. This speed-thrust relationship requires rmique values of power and RPIM input for each type and number of propulsors. Power and RPM are also sensitive to the mode of operation of the vessel whether at constant speed, accelerating to a greater speed or towing an object.
Most vessels utilize $xed-pitch submerged propellers. Surface propellers are jilted to vessels designed to perfornr at very high speeds and waterjet propulsors are being utilized with increasing frequency on larger vessels with high-speed operational projle. This paper discusses brake horsepower @HP) and propulsor miid relationships for vessel speed requirements based on the hydrodynamic characteristics of three types ofproplsors: submerged propellers, surface propellers and waterjets.
An example of predicted vessel performance regarding speed, power and propulsor RPM is presented which includes engine characteristics and BHP versus RPhL This latter format depicts the d~flerences in power demand for three types of propulsors on a monohull vessel with regard to engine characteristics.
INTRODUCTION
The speed-power relationship of a craft is of prime interest to all partics involved in the development and operation of a marine craft. The initial c o s ~ of both the engines and propulsors must be considered along with reliability, maintenance and operating eqenses. In addition, individual vessel requirements such as shallow navigation draft and/or low on-board vibration and noise influence both enginc and propulsor selection.
The designdecision matrix for cach craft design may have combinations of requirements that necessitate unique solutions. No single type of propulsor is likely to be "the best" solution for varied marine applications.
Trends for selecting submerged propellers, surface
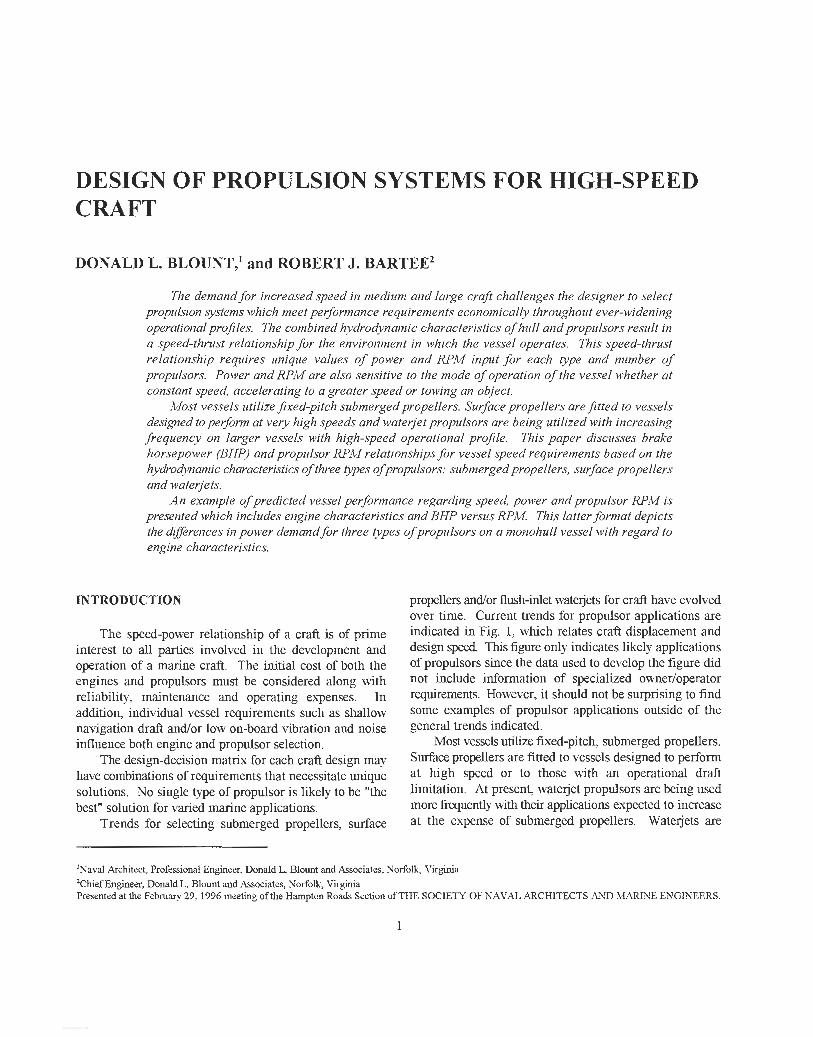
propellers andlor flush-inlet mute jets for craft have evolved over time. Current trends for propulsor applications are indicated in Fig. 1, which relates craft displacement and design speed This figure only indicates Likely applications of propulsors since the data used to develop the figure did not include information of specialized o~ncrloperator requirements. However, it should not be surprising to find some examples of propulsor applications outside of the general trends indicated.
Mosl vcsscls utilize fixed-pitch, submerged propellers. Surface propellers are fitted to vcsscls designed to perform aL high speed or to those ivith an operational drdt limitation. At presenf watc jct propulsors are being used more fiquently with their applications expected to increase at the expense of submerged propellers. Waterjets are
'Naval Arclliteq Professional Engineer. Donald L. Blount and Associates, Norfolk, Virginia ZChiefEngimeer, Donald L. Blount and .bsociatcs, Norfolk, Virginia Presented at t l ~e Febn~ary 23. 1936 meeting of the Harnpton Roads SwZion of T I E SOClElY OF NAVAI. ARCHITECTS .AXD X,liwE ENGKEERS.
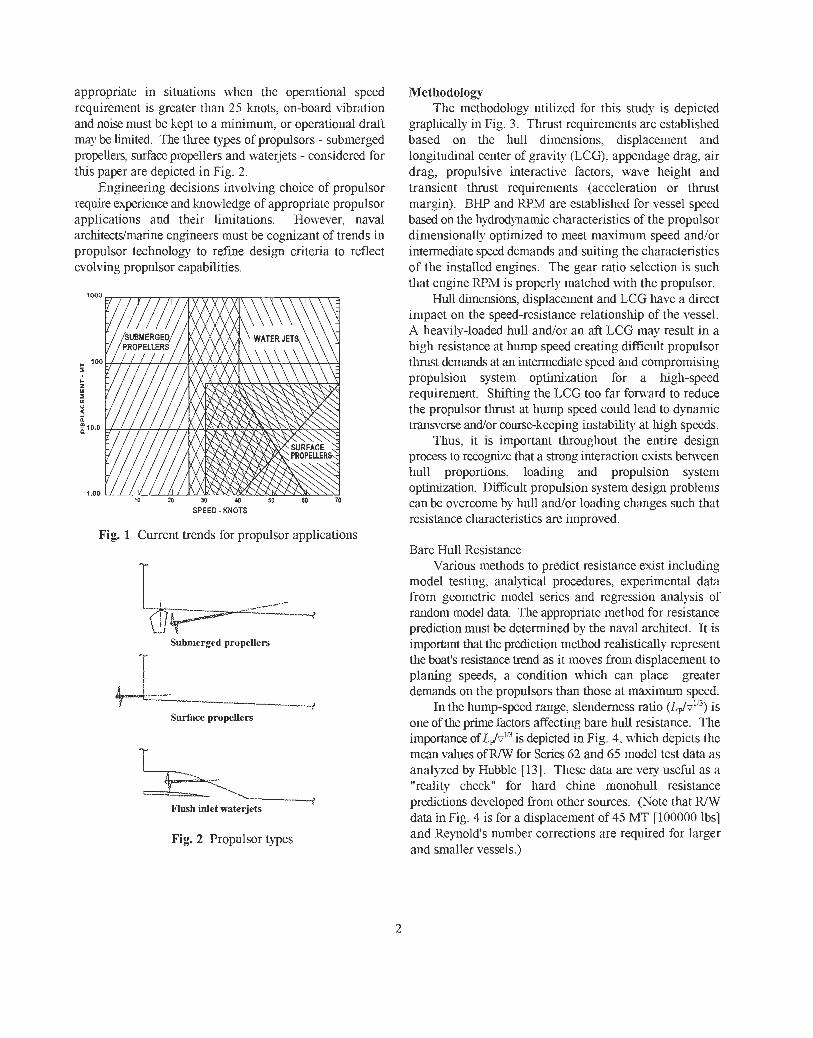
appropriate in situations \\hen the operational speed requirement is greater than 25 knots, on-board vibration and noise must be kept to a minimum, or operational draft may be limited The thee types of propulsors - submerged propellers, surfacc propellers and waterjets - considcrcd for this paper are depicted in Fig. 2.
Engineering decisions involving choice of propulsor require expcricnce and howledge of appropriate propulsor applications and their limitations. However; naval architects/rnarine engineers must be cognirrant of trends in propulsor technology to refine design criteria to reflect evolving propulsor capabilities.
SPEED -KNOTS
Fig. I Current wends for propulsor applications
Submerged propellers
Surfce propellers
Fig. 2 Propulsor Lypes
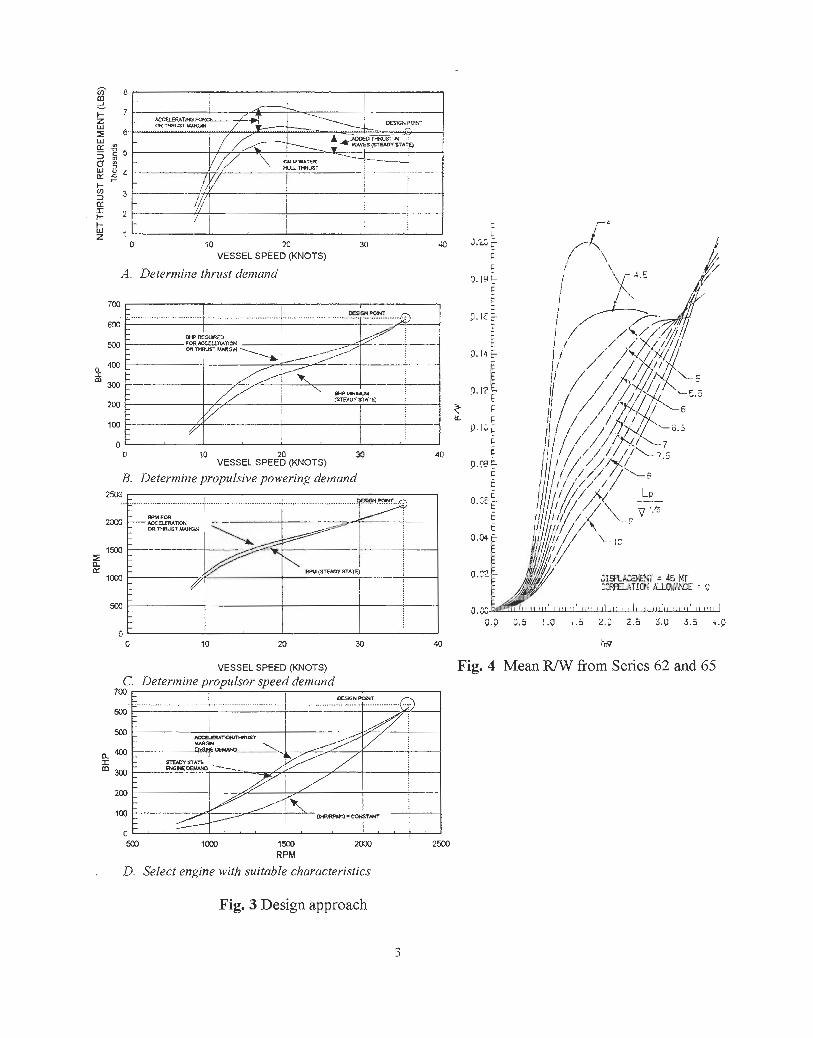
Methodology The methodology utilized for this study is depicted
graphically in Fig. 3. Thrust requirements are established based on the hull dimensions, displacement and longitudinal center of gravity (LCG), appendage drag, air drag, propulsive interactive factors, wave height and transient thrust rquirements (acceleration or thrust margin). BHP and RPM are established for vessel speed based on the hydrodynamic characteristics of the propulsor dimensionally optimized to meet maximum speed andfor intermehate speed demands and suiting the characteristics of the installed engmes. The gear ratio selection is such that engine RPi\/l is properly matched with the propulsor.
Hull dimensions, displacement and LCG have a direct impact on the speed-rcsistance relationship of the vessel. A heavily-loaded hull and/or an aft LCG may result in a high resistance at hump speed creating difficult propulsor t1lIUSL demands at an intermediate speed and compromising propulsion system optimization for a high-speed requirement. Shifting the LCG too far fonmd to reduce the propulsor thrust at hump speed could lead to dynamic transverse and/or come-keeping instabihty at high speeds.
Thus, it is important Uuoughout the entire design process lo recognix that a strong interaction exists between hull proportions, loading and propulsion system optimization. Difficult propulsion system design problems can be overcome by hull and/or loading changes such that resistance characteristics are improved.
Bare Hull Resistance Various methods to predict resistance exist including
model testing, analytical procedures, experimental data from geometric model series and regression analysis 01 random model data The appropriate method for resistance prediction must bc dctcrrnined by the naval architect. It is important that the prediction method realistically rcpresent the boat's resistance trend as it moves from displacement to planing speeds, a condition whlch can place greater demand$ on the propulsors than those at maximum speed.
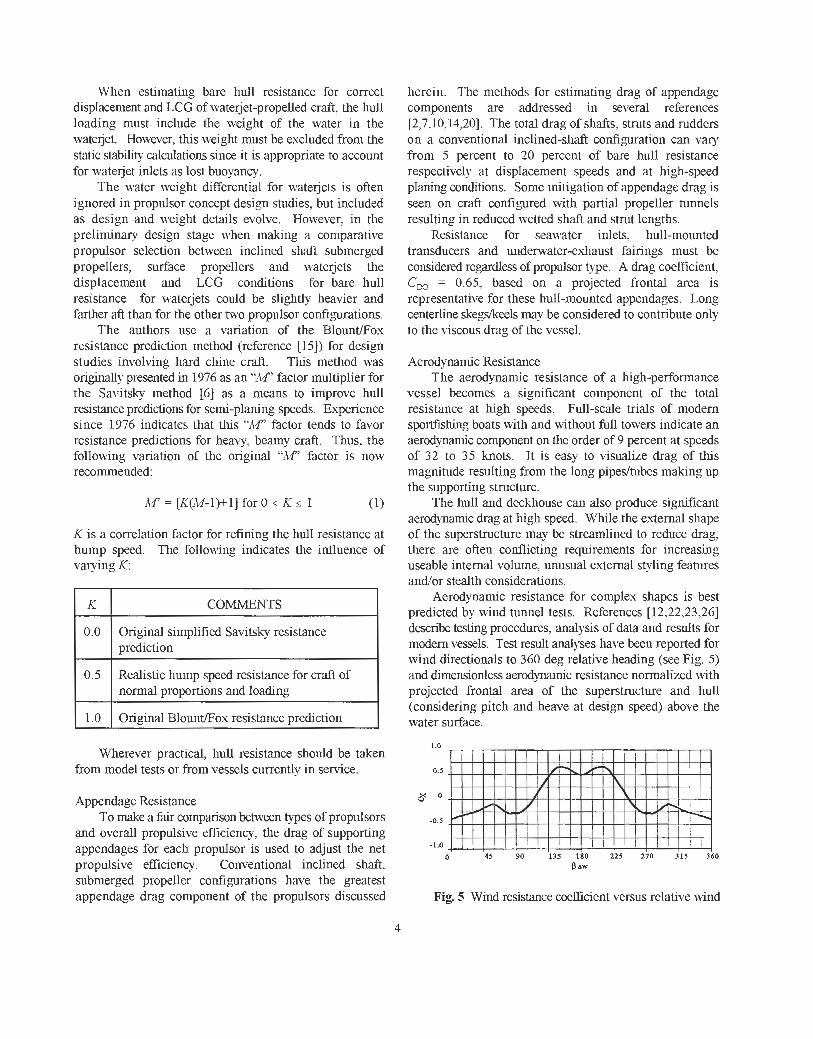
In the hump-speed range, slenderness ratio is one of the prime factors affecting bare hull resistance. The importance of Ldv'" is depicted in Fig. 4, wluch depicts Ihc mean values of R N for Scrics 62 and 65 model test data as analyzed by Hubble [13]. These data are very usehl as a "reality check" for hard chine monohull resistance predictions developed from other sources. (Note that M V data in Fig. 4 is for a dsplacement of 45 MT [100000 lbs] and Reynold's number corrections are required for larger and smaller vessels.)
VESSEL SPEED (KNOTS)
A. Determine thrust demand
0 10 20 30 40 VESSEL SPEED (KNOTS)
R. Determine proptilsive powering demand
VESSEL SPEED (KNOTS) Fig. 4 Mean R/W from Series 62 and 65 C. Determine proptdsor speed demand
700
600
XO
a m 1 " 300
200
100
0 XO loo0 1m XKX) 2500
RPM
D. Select engine with suitable characteristics
Fig. 3 Design approach
When estimating bare hull resistance for correct displacement and LCG of wate jet-propelled craft: the hull loading must include the wight of the water in the wate j e t Howevcr. this weight must be escludcd from the static stabhty calculations since it is appropriate to account for wate jet inlets as lost buoyancy.
The watcr weight differential for waterjcts is often ignored in propulsor concept design studes, but included as design and neight details evolve. However, in the preliminary design stage when making a comparative propulsor selection between inclined shaft submerged propellers, surface propellers and waterjets the displacement and LCG conditions for bare hull resistance for watcrjets could be slightly heavier and farthcr aft than for the other two propulsor confi,wations.
The authors use a variation of the Blount/Fox resistance prediction method (reference [I 51) for des i~q studies involving hard chine craft. This method was origmally presented in 1976 as an "M' factor multiplier for the Savitsky method 161 as a means to improve hull resistance predictions for sexni-planing speeds. Eqerience since 1976 indicates that this "IW factor tends to favor rcsistance predictions for heavy, beamy craft. Thus. the following variation o l thc original "ib" factor is now recommended:
IW = [K(M-l)+l] for 0 K < 1 (1)
K is a correlation factor for refining the hull resistance at hump speed. The follo\+lng indicates the influence of vaqing E
K
0.0
0.5
Wherever practical, hull resistance should be taken from model tests or from vesscls currently in service.
COMMENTS
Original simplilicd Savitsky resistance prcdiction
Realistic hump speed resistance for craft of normal proportions and loading
1.0
Appendage Resistance To nuke a fair comparison between types of propulsors
and overall propulsive efficiency, the drag of supporting appendages for each propulsor is used to adjust the net propulsive efficiency. Conventional inclined shaft,
Original BlountEos resistance prediction
herein. The methods for estimating drag of appendage components are addressed in several references [2,7,10,14,20]. The total drag of shafts, struts and rudders on a conventional inclined-sluft confi,wation can vary from 5 percent to 20 perccnt of bare hull resistance respectively at displacement speeds and at high-speed planing conditions. Somc mitigation of appendage drag is seen on craft configured with partial propeller tunnels resulting in reduced wetted shaft and strut lengths.
Resistance for seawater inlets, hull-mounted transducers and underwater-exhaust fairings must be considered regardless of propulsor type. A drag coefficient, C,, = 0.65, based on a projected frontal area is representative for these hull-mountcd appendages. Long centerline skegs/keels may be considered to contribute only to the viscous drag of the vessel.
Aerodynamic Resistance The aerodynamic resistance of a high-performance
vessel becomes a sigmficant component of the total resistance at high speeds. Full-scale trials of modern sportfishing boats with and without full tonas indicate an aerodynamic component on lllc order of 9 percent at speeds of 32 to 35 knols. Jt is easy to visualize drag of this magnitude resulting from the long pipesltubcs making up the supporting structure.
The hull and dcckhouse can also produce sigmficant aerodynamic drag at high speed. While the external shape of the superstructure may be streamlined to reduce drag, there are often conflicting requirements for increasing useable internal volunle, unusual external styling features andlor stealth considcrations.
Aerodynamic resistance for complex shapcs is best predicted by wind tunnel teas. References [12,22,23,26] describe testing procedures, analysis of data and results lor modem vessels. Test result analyses have been reported for wind directionals to 360 deg relative heading (sec Fig. 5) and dunensionless aeroctynarmc resistance normalized 111th projected frontal area of the superstructure and hull (considering pitch and heave at design speed) above the water surface.
- -
submerged propeller configurations have the greatest appendage drag component of the propulsors discussed Pig. 5 Wind resistance coefficient vcrsus relative mind
The aerodynamic resistance coefficienl is defined as:
For streamlined vessels, a resistance of 0.5 C, < 0.8 is likely at a zero relative wind heading with peak values occumng for a relative head wind of about 30 deg to the centerline of the vessel.
Added Resistance in Waves Added resistance in waves (RJ must be considered for
sea conditions stated for the vessel's operational requirerncnts. Model testing is helpful in determining the drag component. However, the Hoggard approach [19] for cstimating these data provides rcalistic values for known significant wave height, HI,. Operating trim can be cstirnated from standard series data, thc Savitsky method or available model tests.
If H,, is unspecified, the authors recommended
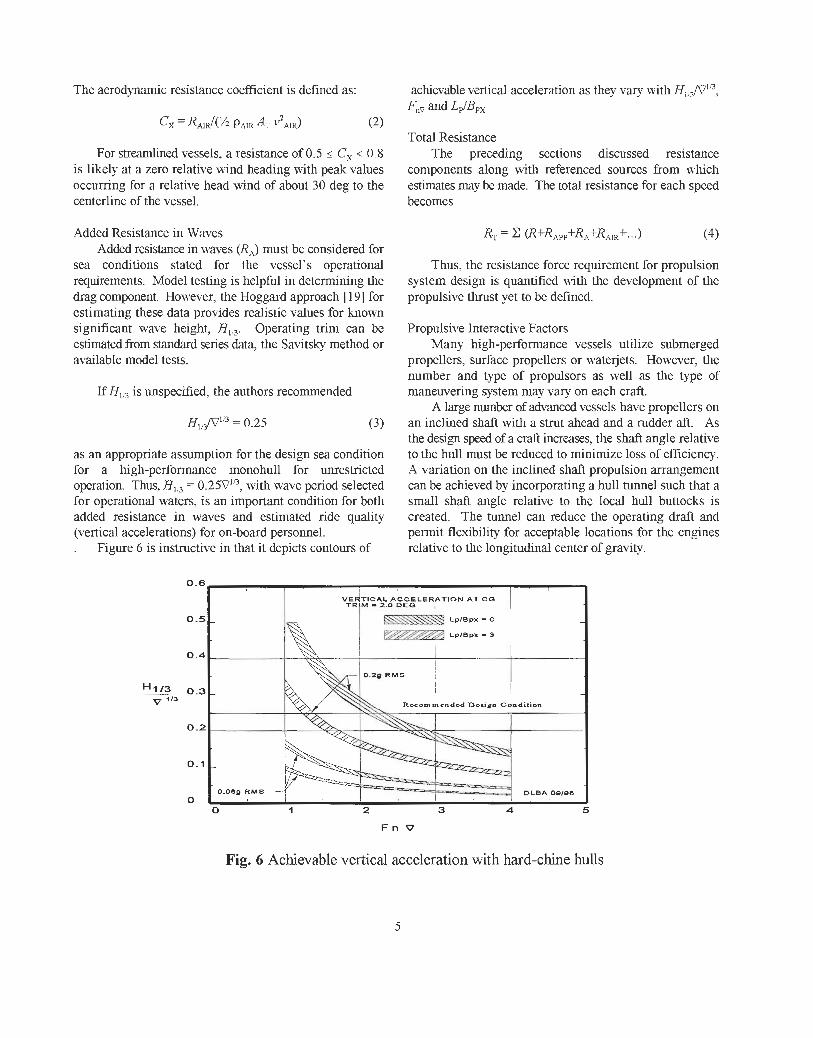
as an appropriate assumphon for the design sea condition for a high-performance monohull for unrestriclcd operation. Thus, HI, = 0.25VIA, with wavc pcriod selected for operational waters, is an important condition for both added resistance in waves and estimated ride quality (vertical accelerations) for on-board personnel. . Figure 6 is instructive in that it depicts contours of
achievable vertical acceleration as they vary with H,,,JC7ID, F,, and L J B P X
Total Resistance The preceding scclions discussed resistance
componcnts along with referenced sourccs from which estimates may bc made. The total resistance for each speed becomes
Thus, the resistance force requirement for propulsion system design is quamfied with the development of thc propulsive thrust yet to be defincd.
Propulsive interactive Factors Many high-perfonmnce vessels utilize submerged
propellers, surface propellers or wale jets. However, the number and type of propulsors as well as the type of maneuvering system may vary on each craft.
A large number of advanced vessels have propellers on an inclined shaft with a strut ahead and a rudder aft. As the design speed of a craft increases, the shaft angle relative to thc hull must be reduced to minimize loss of cficiency. A variation on the inclined shafl propulsion arrangement can be achieved by incorporating a hull tunnel such that a small shaft angle relative to the local hull bullocks is created. The tunnel can reduce the operating draft and permit flexibility for acceptable locations for the engines relative to the longitudinal center of gravity.
Fig. 6 Achievable vertical acceleration with hard-chine hulls
6 SPEED IWSGE
DIsPLAcEMEsT I SEM-PLAhWG I rLA.lTNG II
Waterjets are being utilizcd on large, high-speed vessels with increasing frequency. In some applications, such as gas-turbine-powered vessels, watc jets may be the only propulsor which oITcrs steering, reversing, quiet noise levels and shallow draft in a single system. Whilc wate jet efficicncies are increasing for high-horsepower units, steering and reversing capabilities for more than 18600 kW (25000 hp) are in operation in only a limited number of vessels.
Surface propellers mounted close to the transom and/or on shafts exqended aft of the transom have proven their effectiveness on operational craft. For steering, somc surfacc propellers are mounted on articulated shafts and others have rudders which are often located aft of the propeller. A pair of surface propellers, each with input of 4800 kW (6500 hp), may be the highest powered units demonstrated on an operational craft to date.
When efficient performance is the sole criterion, submerged propellers are the preferred choice for applications 25 knots (13 d s ) or less and waterjets the preferred choice for applications 43 knots (22 d s ) or morc. Bctween these speeds. waterjets should be given serious consideration. Whenever propulsors are selcctcd, hull motions in rough seas, tluust production at hump speed, hydro-acoustics, cost and reliability must also be considered.
It is especially important to be aware of both hull drag and thrust characteristics of the propulsors when a craft transitions from displacement speed to a dynamically- supported condition. Dynamically supported craft may
have a thrust-loading condition morc demanding at transition speed than at the operational maximum speed requirement.
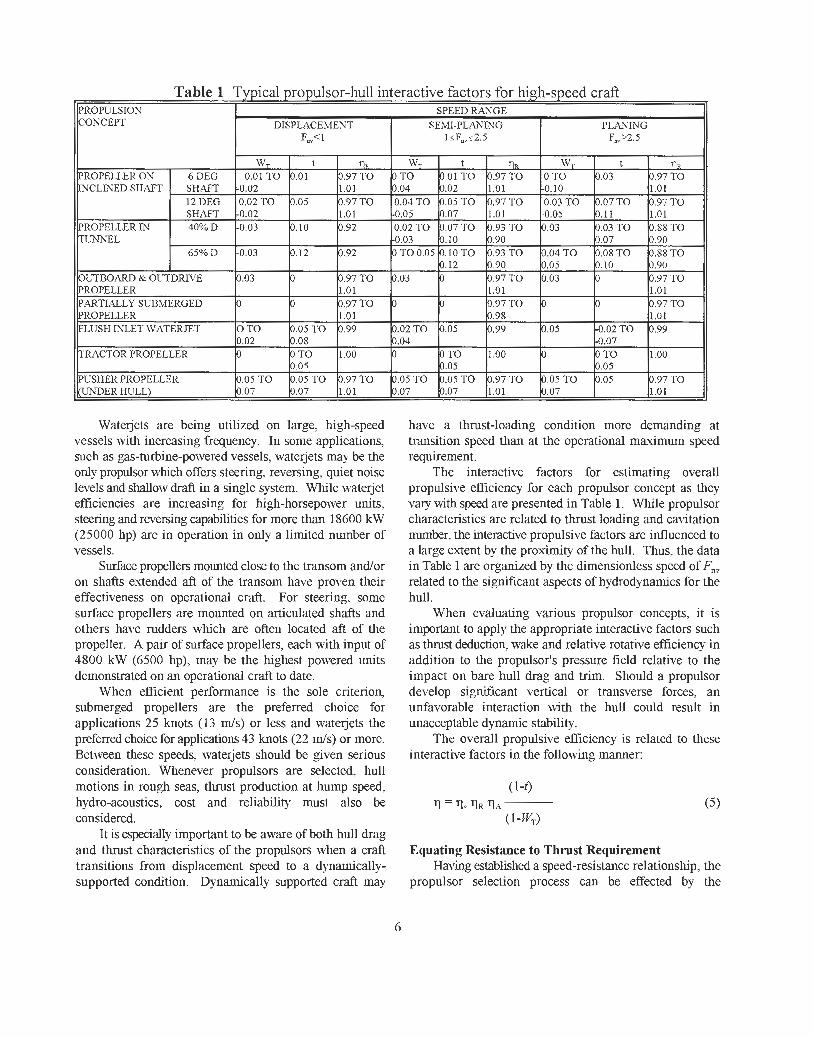
The interactive factors for cslimating overall propulsive efficiency for cach propulsor concept as thcy vary with speed are presented in Table 1. While propulsor characteristics are related to thrust loading and cavitation number, the interactive propulsive factors are influenced to a large extent by the proximity of the hull. Thus, the data in Table 1 are organized by the dimensionless speed of Fnv related to the significant aspects of hydrodynamics for the hull.
When evaluating various propulsor concepts, it is imprlant to apply the appropriate interactive factors such as thrust deduction, wake and rclative rotative efficiency in addition to the propulsor's pressure field relative to the impact on bare hull drag and trim. Should a propulsor develop significant vertical or transverse forces, an unfavorable interaction with the hull could result in unacceptable dynamic stability.
The overall propulsive efficiency is related to these interactive factors in the following manner:
Equating Resistance to Thrust Requirement Having established a speed-resistance relationship, the
propulsor selection process can be effected by thc
appropriate use of interactive factors from Table 1. Utilizing these interactive faclors, a steady-state speed- thrust relationship can be developed for each type of propulsor.
Transient Conditions The measure of vessel performance is more than
meeting steady-slate operational requirements throughout the entire speed range; poor acceleration characteristics could result in poorly perceived performance even though design speed may be attained. Therefore, some consideration must be made for transienthonsteady operalions. An initial approach to determining engine loads is based on propulsors thrusting a vessel forward from low speed at a constant accclcration rate to above planing hump speeds.
Accelerating propulsive force is determined by the following equation:
F = ma (6 ) Where F = the accelerating force
m = the mass of the vessel including the added mass o l thc entrained water (longitudinal added mass of 5 percent of displacement is suggested lor hard chine vessels)
a = longitudinal acceleration
U W g a design procedure for propulsion machinery which must meet a longitudinal acceleration requirement often results in excessive torquelengine power at low speed since unrealistically high propulsive thrust is usually predictcd. Design with longitudmal accclcralion greater than 0.05 g can result in a total propulsive force (accelerating lorce plus steady-stale thrust) that dominates maximum installed horsepower.
Full-scale trial data indicates that longitudinal acceleration is likely to be at its maximum value near planing hump speed and decreascs at higher and lower specds rather than remaining conslanl below hump speed. This pealung acceleration can be simulated by applying a thrust margin to the propulsive thrust at hump spced.
The incorporation of a thrust margin in the design proccss enables the resultant vesscl Lo accelerate, to tow and to overcome additional drag resulting liom overloading> hull fouling, degraded engine performance or minor propulsor damage. Thus, the thrust margin approach is vcry useful in selecting an engine ~ l t h suitable characteristics throughout its operational RPM range. With an assumed design thrust margin of 20 percent, a peak acceleration of about 0.03 g can generally be attained at the pIaning hump speed; a design thrust margin o l 50 percent
can yield an 0.08 g acceleration at the planing hump speed. Ofthe two inethods considered for transient situations,
the thrust margin approach produccs realistic information with respect lo powering hard chine planing hulls. The propulsor powcr dcmands on the engine arc realistic at lower speeds using the thrust margin approach and arc confinned by acceleration curves measurcd during full- scale trials. Therelore, a thrust margin of 20 percent of the total steady-state thrust requirement at hump speed is recommended for the design of propulsion systems. For design purposes, the thrust margin percentage should increase in a linear inanncr from zero at zero speed to the 20 percent maximum at hump speed and then decrease in a linear manner to zcro at dcsign speed.
Propulsion Systcm Integration Thc goal of a propulsion system design is to best
integrate characteristics and capabilities of the propulsors and engines. The methodology to define propulsor forces has already been described. Information in Appendices 1 and 2 will assist in the decision process for selecting the size of the three types of propulsors.
Eslablishing minimum size of a propulsor is an important factor when technical feasibility is an issue: this becomes the lowcr dimensional limit for making an optimal size sludy. This is especially important for higher spxdlplaning vessels since small propulsors often result in the best overall performance. It should also be noted that "optimal size" may not be the same as "most efficient" when all requirements are considered. In addilion to efficiency at required speed, the design process must consider such requirements as navigational draft, propulsion system wciglit, efficiency at maximum range, noise, vibration, cost and availability within program schedule.
Appendix 2 recommends criteria which may be used for eslablishing minimum dimensional sizes for submerged propellers, surface propellers and flush inlet waterjets. Take notc that the submerged propeller loading criteria, equation (2-6), is higher than the frequently referenced Gawn Burrill criteria [l]. This increase in propeller loading has been provcn on a number of operational vcsscls.
In addtion to diameter being an important factor with regard to propulsor sizing, expandcd area ratio (EAR) and the number of propulsors interact signilicantly for establishing an optimal system. The increased availability of high EAR propellers (up lo EAR = 1.2) has greatly improved the designer's options for propeller specifications.
An often-overlooked factor is thc number of propulsors; tluee or bur propulsion shaft lines frequently
are the most cost effective, lightest weigh1 and efficient propulsion configuration for high-speed vessels. The importance of the number of propulsors on reducing thrust loading is demonstraled in equation (1-6) and thc significance of EAR is seen as it influences A, in equation (2-1).
As part of the propulsion system integration process, the propulsor size and the gear ratio are established together. Ncither the gear ratio nor propulsor dimensions should be established without considering impact on performance throughout the speed range. The gear ratio is in [act the transfer function behvecn engine and propulsor characteristics.
0 10 2@ 30 40 50 60 70 80 90 100 Percent Engine RPM
5 LEGEND 1 BH?IRPM'= CGNSTANT
- WATERJET, X 3 - SURFACE PROPS, X 2.65 DLBA . SUBMERGED PROPS, X = 2.15 10125194
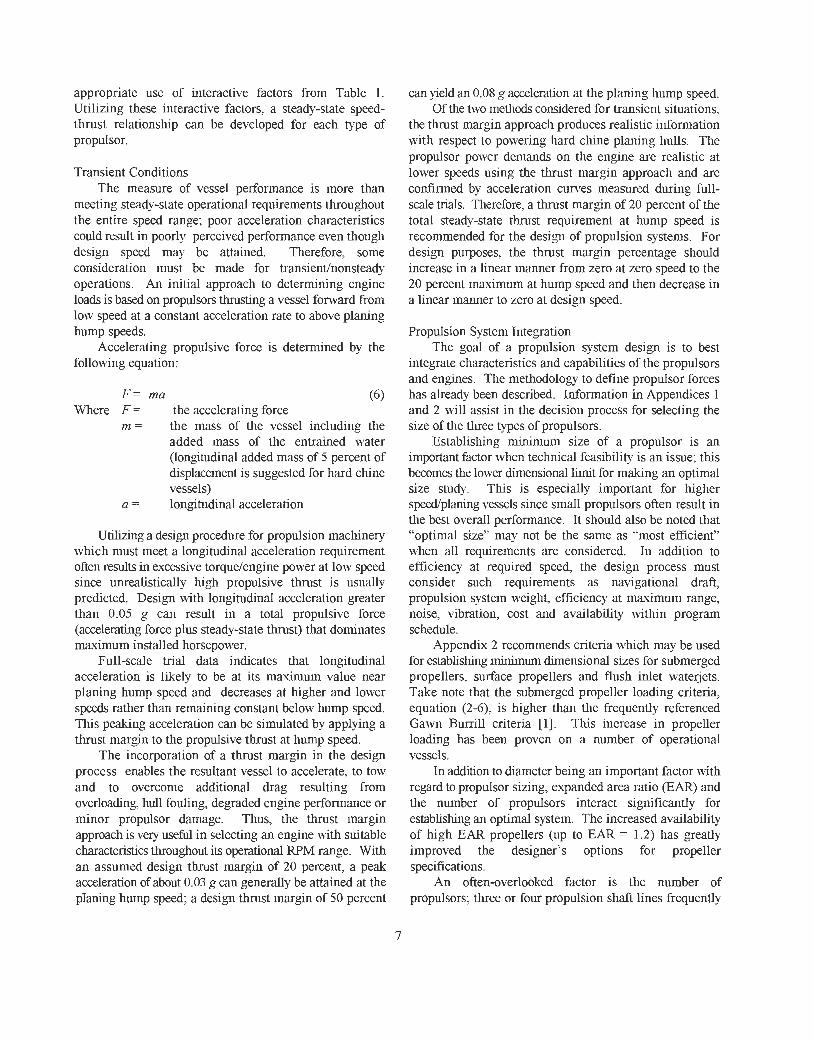
Fig. 7 Power and RPM requi~mcnts for various propulsors on hard-chine monohulls
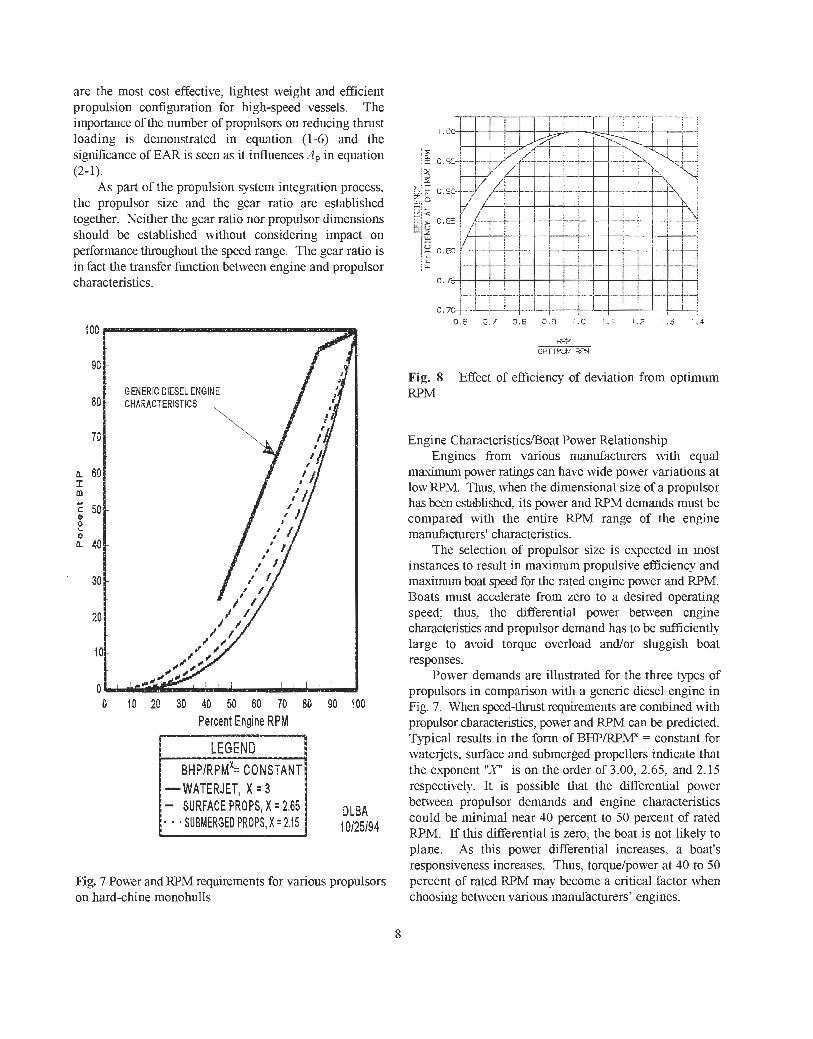
Fig. 8 Effect of efficiency of deviation from optimum RPM
Engine CharaclcristicsA3oat Power Relationship Engines from various manufaclurcrs with equal
maximum power ratings can haw wide power variations at low RPM. Thus, when the dimensional size of a propulsor has been established, its power and RPM demands must be compared with the entire RPM range of the engine manufacturers' characteristics.
The selection of propulsor size is expected in most instances to result in maximum propulsive efficiency and maximum boat speed for the rated engine powcr and RPM. Boats must accelerate from zcro to a desired operating speed; thus, thc differential power between cngine characteristics and propulsor demand has lo be sufficiently large to avoid torque overload andlor sluggish boat responses.
Power demands are illustrated for the three types of propulsors in comparison with a generic diesel engine in Fig. 7. When speed-thrust requirements are combined wilh propulsor characteristics, power and RPM can be predicted. Typical results in the form oT B F P / ' W = constant for wate rjcts, surface and submerged propellers indicate that the exponent I Y is on the order of 3.00, 2.65, and 2.15 rcspcctively. It is possible that the differential power between propulsor demands and engine characteristics could be minimal ncar 40 percent to 50 percent of rated RPM. If tlus differential is zero, the boat is not likely to plane. As this power differential increases, a boat's responsiveness increases. Thus, torquelpower at 40 to 50 percent or rated RPM may become a critical faclor when choosing between various manuracturers' engines.
It is essential to understand that the propulsor controls the amount of power the engine uill deliver. Failure to take this into account can lead to inappropriate technical decisions regarding the design of the propulsion system.
Influence of Non-Optimum Propulsor RPM Thc maximum e5ciency of a propulsor may be limited
by physical constraints of the vessel's operational requirements. The propulsor, if optimized without constraints can provide a measure of trade-off or penalty resulting from imposed or real limitations.
Stock reduction gear ratios may not always meet the optimum requirements of the engine and propulsor. Figure 8 illustrates an csample of the effect on clliciency of deviation from optimum shaft speed. The depiction illustrates that efficiency loss is less than onc percent from 95 percent to 105 percent of thc optimum RPM. Outside these limits the loss of propulsor esciency may be appreciable and custom gear ralio or new propulsor parameters should be considered.
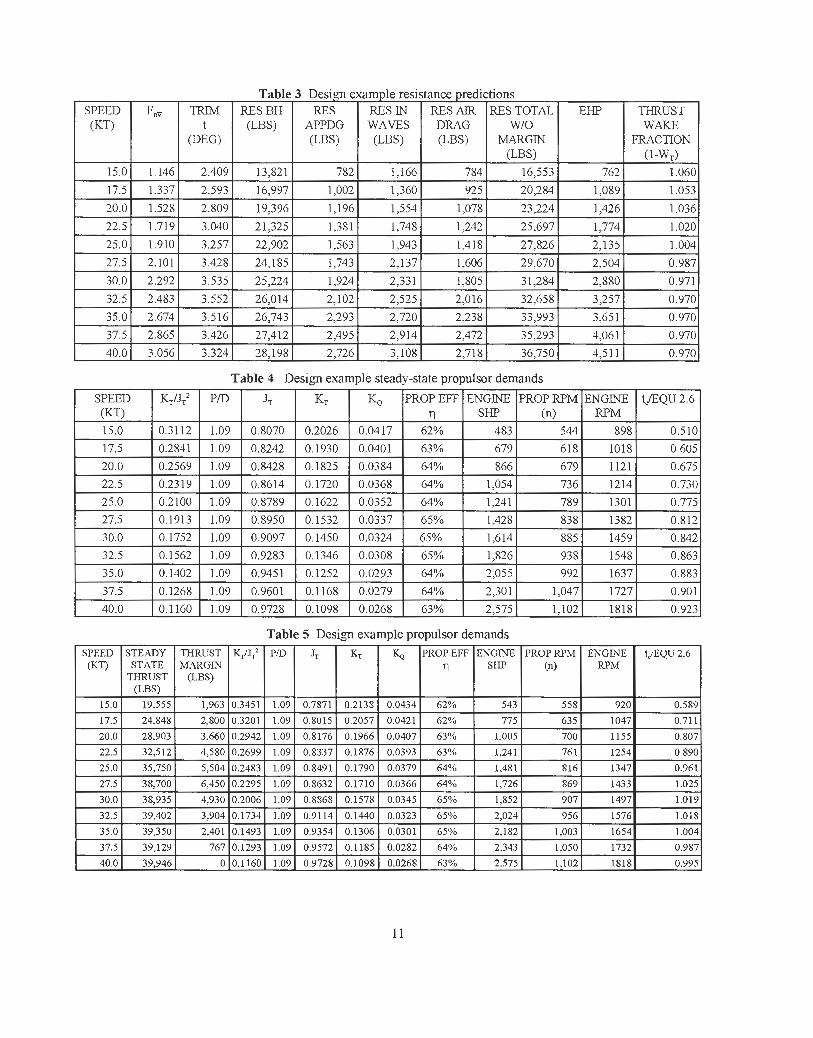
Design Example Table 2 lists the design parameters of a 100 LT vessel
with submerged propellers and 35-knot speed requircmcnt. 'The data stated in the table represcnt the information necessary for the design examplc.
The vessel dimensions, loading and environmenlal variables determine the resistance components and dynamic trim angle for various speeds. Bare hull, appendage, wave and aerodynamic resistances are calculated throughout the sped range and summed for the lotal resistance. Table 3 presents the hull resistance components. dynamic trim angle and EHP for the craft.
For this example, the propeller characteristics were derived irom reference [21]. Had surface propcllcrs or flush inlet watejets been selected for the example, references [27,29] or [IS] would have been used.
Knowing the propeller diameter and propulsive interactive factors, the propcller thrust loading (KT/./:) is calculated. Appendix 1 summarizes the development and advantages of using thrust loading, KT/J; to eliminate RPM as a variable when selecting minimum propcller diameter when cavitation is a consideration. The thrust coefficient (KT), propeller advance coefficient cJT), torque coefficient (KQ)and the propcllcr efficiency can be detcrmined from thc propeller data Propeller rotational speed is calculated from JT The propeller horsepower (SHP) demand is calculated from the EHP and the propulsive efficiency. Table 4 summarizes the propulsor demands on the engines.
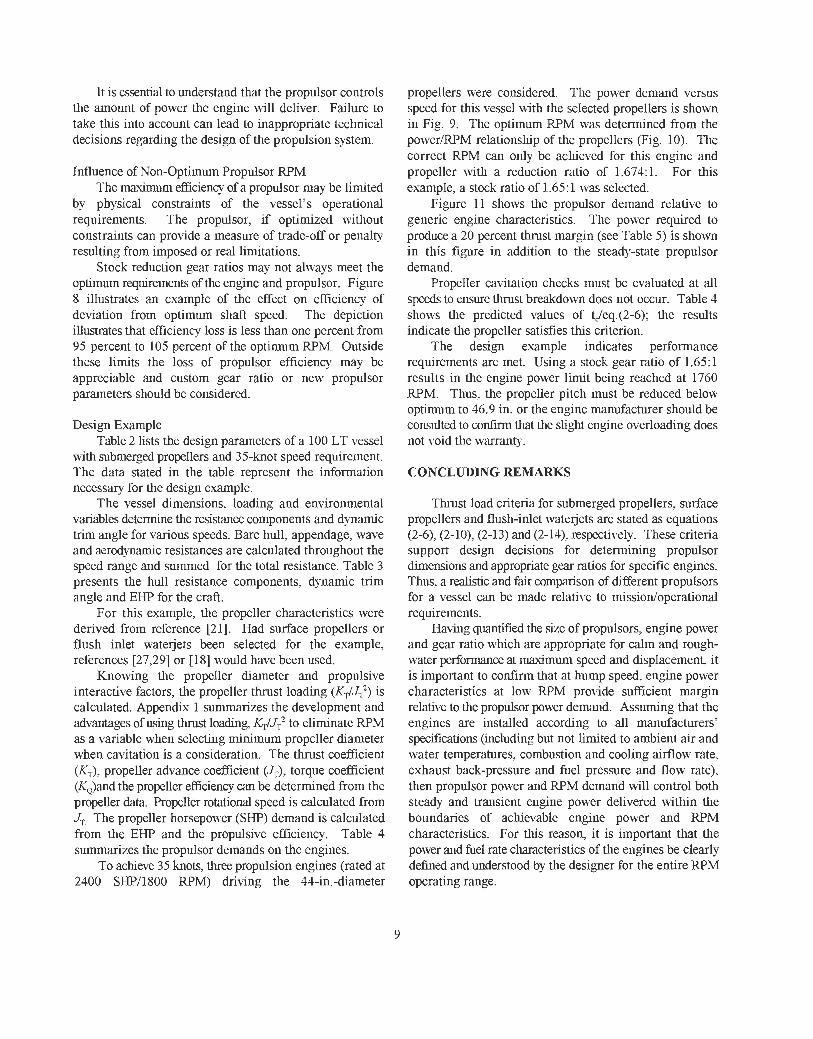
To achieve 35 hots, three propulsion engines (rated at 2400 SHPl1800 RPM) driving the 44-in.-diameter
propellers were considered. The pourer demand versus speed for t h ~ s vessel ndth the sclected propellers is shown in Fig. 9. The optimum W M was determined from the powcrIRPM relationship of the propellers (Fig. 10). Thc correct RPM can only be achievcd for this engine and propeller with a reduction ratio of 1.674:l. For this example, a stock ratio of 1.65: 1 was selected.
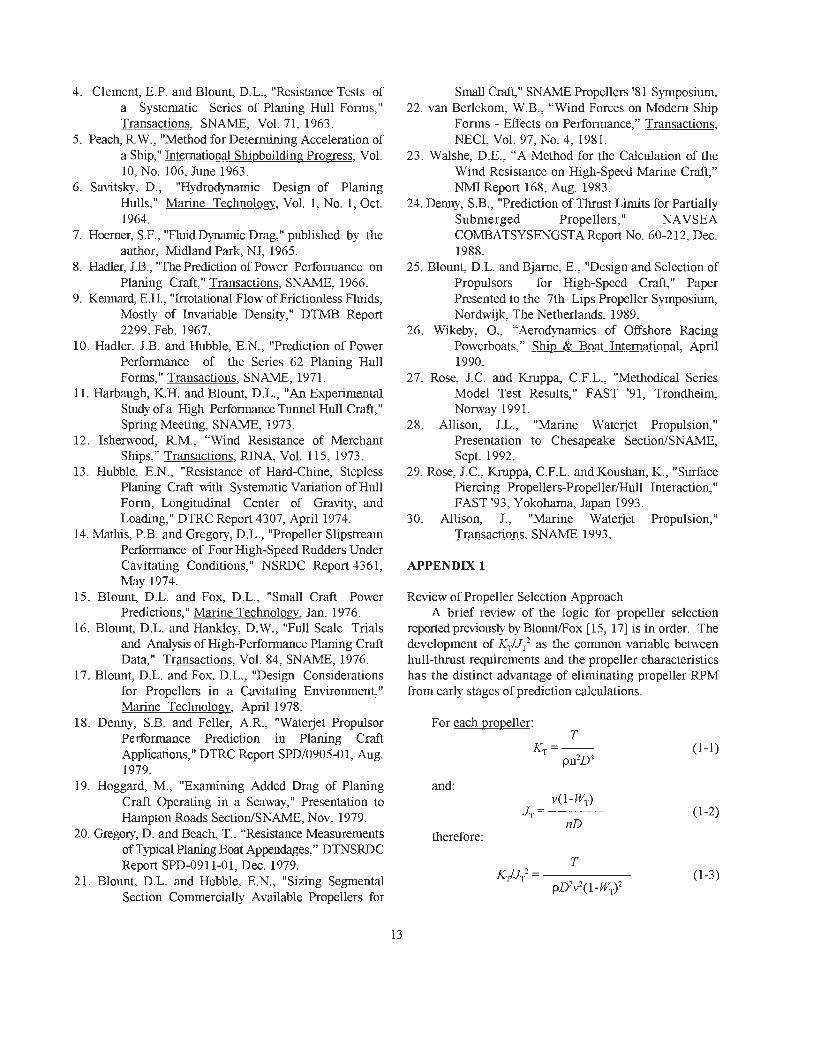
Figure 11 shows the propulsor demand relative to generic engine characteristics. The power required to produce a 20 percent thrust margin (see Table 5) is shown in this figure in addition to the steadystate propulsor demand.
Propeller cavitation checks must be evaluated at all speeds to ensure thrust breakdown does not occur. Table 4 shows the predicted values of tJeq(2-6); the results indlcate the propcller satisfies this criterion.
The design example indicates performance requirements are met. Using a stock gear ratio of 1.65: 1 results in the engine power limit being reached at 1760 RPM. Thus. the propeller pitch must be reduced below optimum to 46.9 in. or the engine manufacturer should be consulted to confirm that the slight engine overloading does not void the warranty.
CONCLUDING REMARKS
Thrust load criteria for submerged propellers. surface propellers and flush-inlet wate jets are stated as equations (2-6), (2-lo), (2-13) and (2-141, respectively. These criteria support design decisions for determining propulsor dimensions and appropriate gear ratios for specific engines. Thus, a realistic and fair comparison of different propulsors for a vessel can bc made relative to rnission/opcralionaI requirements.
Having q u a n ~ e d the sizc of propulsors, engine power and gear ratio which are appropriate for calm and rough- water performance at maximum speed and displacement, it is important to corlfirm that at hump speed, engine power characteristics at low RPM provide sufficient margin relative to the propulsor power demand. Assuming that the engines are installed according to all manufacturers' specifications (including but not limited to ambienl air and water temperatures, combustion and cooling airflow rate, exhaust back-pressure and fuel pressure and flow rate), then propulsor power and RPM demand uill control both steady and transient engine power delivered within the boundaries of achievable engine power and RPM characteristics. For this reason, it is important that thc power and fuel rate characteristics of the engines be clearly defined and understood by the desibaer for the entire RPM operating range.
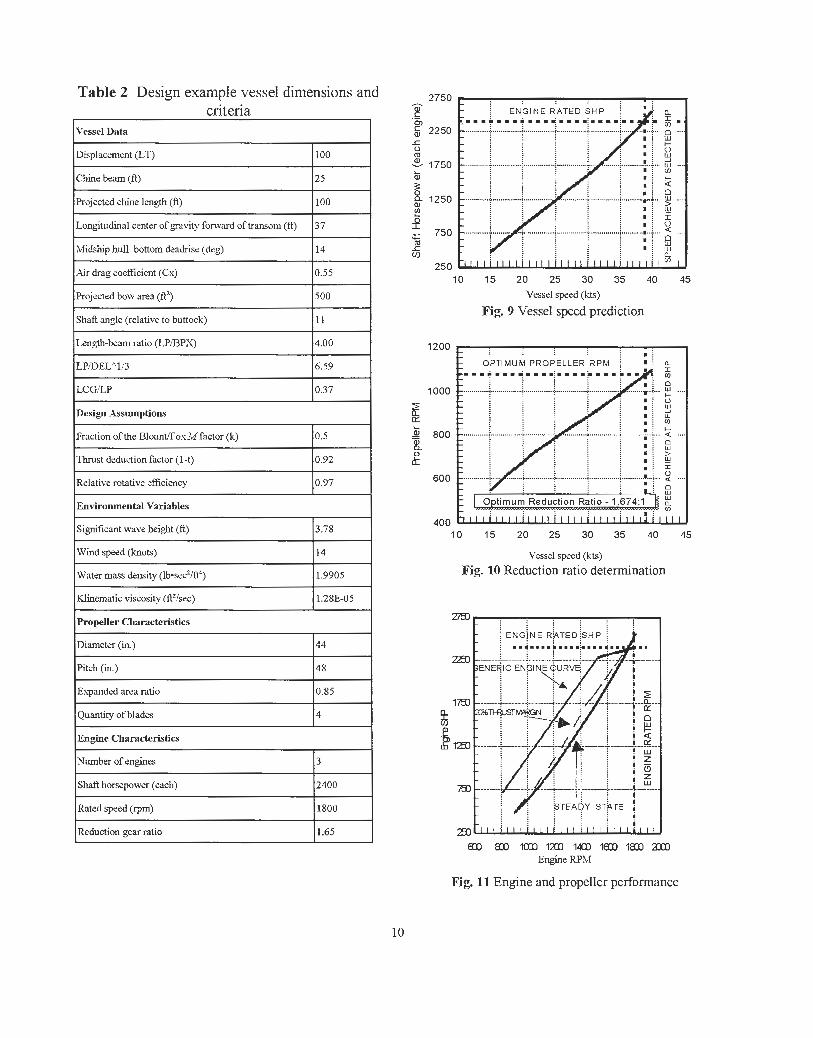
Table 2 Design example vessel dimensions and criteria
l~rojected chine length (A) boo I
- - --
Displacement (LT)
Chine bam (ft)
Longitudinal ccnter of gravity forward of transom (ft)
Midship hull bottom deadrisc (dcg)
Air drag coefficient (Cs) 0.55
100
25
I ~ h a f i an& (relative to buttock) I I hg th-beam ratio (LPBPX) 14.00 1
I k s t da iudon factor (1-1) 10.92 1
- - -
LPn>ELAli3
LCGLP
I~elative rotativc cfficicncy 10.97 I
6.59
0.37
I ~nvirolunental Variables I I significant wave height (A) 13.78 1
Desigu ..issumptiom
1 wind speed (knots) 1 l 4 1
Fraction of the BlounflosMfactor (k)
IKlincmatic viscosity (AZ/sec) 1 1 . 2 8 ~ 0 5 1
0.5
Propeller Characteristics
I ~ u a n t i t ~ of blades 14 I
Diameter (ia)
Pitch (in.)
Eqanded arca ratio
I ~ u m b e r of engines l 3 I
44
45
0.85
1 0 1 5 2 0 25 30 35 40 45
Vessel sped w) Fig 9 Vessel sped prediction
-
Rated speed (rpm)
Reduction gear ratio
Vesszl speed (kts)
Fig. 10 Reduction ratio determination
1800
1.65 m m lrn lan la la 183 m
Engine RPM
Fig. 11 Engine and propeIIer performance
SPEED I (KT)
Table 3 Design example resistance predictions F, TRGM RESBH RES RES IN RES AIR RES TOTAL
t (LBS) APPDG WAVES DRAG WIO (DEG) (TBS) (LBS) (LEIS) MARGlN
(LBS)
Table 4 Design example steady-state propulsor demands
EHP THRUST WAKE
FRACTION 1 -WvI
I SPEED
Table 5 Design example propulsor demands

NOMENCLATURE
longitudinal acceleration EAR = expanded area of propeller blades nD214 = dlsk area of propeller projected area of propeller blades projected frontal area of superstructure and
hull (considering pitch and 1lea1.e at design speed) abovc water surface
brake horsepower overall beam projcctcd chine beam vlBp3 = beam load coefficient aerodynamic drag coefficient normalized on
maximum projcctcd fiontal area drag coefficient for hull-mounted
appendages propeller diameter waterjet inlet diameter A,l.4, = expanded area ratio Rtv1550 = total effective horsepower
(English) Rv1550 = effective horsepower, bare hull
(English) accelerating force vl(g X vln)" = volume Froude number acceleration due to gravity depth of propulsor below water surface significant wave height v/nD = propeller advance coefficient based
on boat speed v(1- WT)lnD = propeller advance coefficient
based on thrust measurements v(1-IYQ)lnL> = propeller advance coefficient
based on torque measurements hump speed resistance correlation factor Tlpn2D4 - Lhrust coefficient Qlpn2D5 - torque coefficient longitudinal center of gravity overall length Blounfiox "iW factor from rcfcrence [lj] ' revised Blounfiox ''lW' factor mass of vessel plus entrained water number of propulsors propulsor rotational speed projected chine length propeller pitch atmospheric pressure pgh = static walcr pressure
umbers in brackets designate date-ordered Rcfcrenccs at end of text.
vapor pressure of n ater propulsor torque torque load cocfficicnt bare hull resistance added resistance in naves appcndagc rcsislance aerodynamic resistance total resistance engine rotational speed shaft horsepower thrust of each propulsor thrust dcduction fraction jet velocity at bollard conditions velocity of craft resultant velocity of wind and boat speed resultant velocity of flow at tip of propeller resultant velocity of flow at 0.7 radius of
propeller weight of craft at rest torque wake fraction thrust wake fraction number of propeller blades relative wind direction EIIP,&IIP = ovcrall propulsive cllicicnq efficiency of propulsor in absence of hull
influencc appendage drag factor relative rotative efficiency mass density of liquid mass density of air displacement of craft at rest volume of displaced walcr a1 rest cavitation number at a depth of H below
static water surface cavitation nurnbcr bascd on rcsullanl
velocity at propeller tip cavitation number based on resultant
velocity at 0.7 radius of propeller Lhrusl load coeflicient
BIBLIOGRAPHY
1. Gam, R. W.L. and Burrill, L.C., "Effect of Cavitation On thc Performance of a Series of 16-Inch Modcl Propellers," Transactions, INA, Vol. 99, 1957.
2. Clement, E.P., "Scale Effecl on the Drag of a Typical Set of Planing Boat Appendages," DTMB Report 1165, Aug. 1957.
3. Motora, S., "On the Measurement of Added Mass and Added Moment of Lnertia of Ships in Steering Motion," DTMR Report 1461, Oct. 1960.
4. Clement, E.P. and Blounf D.L., "Resistance Tests of a Systematic Series of Planing Hull Forms," Transactions, SNAME, Vol. 71; 1963.
5. Peach RW., "Method for Determining Acceleration of a Ship," International Shipbuildine Proeress, Vol. 10, No. 106, June 1963.
6. Savitslcy, D., "Hydrodynamic Design of Planing Hulls," Marine Technolo~v, Vol. 1, No. 1, Oct. 1964.
7. Hoerner, S.F., "Fluid Dpamic Drag," published by the author, mdland Park, NJ, 1965.
8. Hadler, J.B., "The P d c t i o n of Power Performance on Planing Craft:" Transactions, SNAME, 1966.
9. Kennard, E.H., "Irrolational Flow of Frictionless Fluids, Mostly of Invariable Density," DTM3 Report 2299, Feb. 1967.
10. Hadler, J.B. and Hubble, E.N., "Prediction of Power Performance of the Series 62 Planing Hull Fonns," Transactions, SNAME, 197 1.
11. Harbaugh, K.H. and Blount, D.L., "An Experimental Study of a High Performance Tunnel Hull Craft," Spring Meeting, SNAlME, 1973.
12. Ishenvood, R.M.? "Wind Resistance of merchant Ships," Transactions, RINA, Vol. 115, 1973.
13. Hubblc, E.N., "Resistance of Hard-Chine, Stepless Planing Craft mlth Systematic Variation of Hull Form, Longitudinal Center of Gravity, and Loading." DTRC Report 4307, April 1974.
14. iMathis, P.B. and Gregory, D.L., "Propeller Slipstream Performance of Four High-speed Rudders Under Cavitating Conditions," NSRDC Report 4361, May 1374.
15. Blount, D.L. and Fox, D.L., "Small Craft Power Predictions," Marine Technolo% Jan. 1976.
16. Bloumt, D.L. and Hanklcy, D. W., "Full Scalc Trials and Analysis of High-Performance Planing Craft Data," Transactions, Vol. 84, SNAME, 1976.
17. Bloumf D.L. and Fox, D.L., "Design Considerations for Propellers in a Cavitating Environ~nenf" Marine Technologv, April 1978.
18. Denny, S.B. and Feller, A.R., "Watejet Propulsor Performance Prediction in Planing Craft Applications," DTRC Rcport SPDl0905-01, Aug. 1979.
19. Hoggard, M., "Examining Added Drag of Planing Craft Operating in a Seaway," Presentation to Hampton Roads SectiodSNAME, Nov. 1979.
20. Gregory, D. and Beach, T., "Resistance Measurements of Typical Planing Boat Appendages," DTNSRDC Report SPD-0911-01, Dec. 1379.
21. Blount, D.L. and Hubble, E.N., "Sizing Segmental Section Colnmercially Available Propellers for
Sinall craft" SNAME Propellers '8 1 Symposium. 22. van Berlekom, W.B., "Wind Forces on Modern Ship
Forms - EKects on Performance," Transactions, h'ECI, Vol. 97, No. 4; 1981.
23. Walshe, D.E., "A Method for the Calculation of the Wind Rcsistance on High-speed Marine Craft," h'MI Report 168, Aug. 1983.
24. Demy, S.B., "Prediction of Thrust Limits for Partidly Submerged Propellers," NAVSEA COMBATSYSENGSTA Report No. 60-212, Dec. 1988.
25. Bloumb D.L. and Bjarnc, E., "Design and Selection of Propulsors for High-speed Craft," Paper Presented to the 7th Lips Propeller Symposium, Nordwijk, The Netherlands, 1989.
26. Wikeby, O., "Aerodynamics of Offshore Racing Powerboats," Ship & Boat International, April 1990.
27. Rose, J.C. and Kruppa, C.F.L., "Methodical Series lModel Test Results," FAST '91, Trondheim Norway 199 1.
28. Allison, J.L., "Marine Waterjet Propulsion," Presentation to Chesapeake SectiodSNAME, Sept. 1992.
29. Rose, J.C., Kruppa, C.F.L. and Koushan, K., "Surface Piercing Propellers-Propeller/Hull Interaction" FAST '93, Yokohama, Japan 1993.
30. Allison, J., "Marine Waterjet Propulsion," Transactions, SNAME 1993.
APPENDIX 1
Review of Propeller Selection Approach A brief review of the logic for propeller selection
rcporlcd previously by BlounUFox [15, 171 is in order. The development of E;;JJ: as the common variable between hull-thrust requirements and the propeller characteristics has the distinct advantage of eliminating propeller RPM Gom early stages of prediction calculations.
For each wopeller: T
and:
I
nD therefore:
for the hull: APPENDM 2
Propulsor Loading Criteria
Assuming that each propeller produces equal thrust for a mdti-screw craft, thc thrust required by each propeller would be:
Equating the tlu-ust requirements that each propeller must produce to that required to satis@ the hull resistance leads to:
(Ifunequal thrust is produced by each of several propellers of a multiscrew craft, A\, should be oinitted from equations ( 1-5) and (1 -6)) and instead multiplied by the fraction of total thrust each propeller is expected to produce.)
When hull shape, displacemenl, LCG and appendage configurations are established, then total resistance as a function of speed is fixed. Then as the number of propellers is established, the only sigmfkant variable that can influence KT/J; is the propeller diameter (D). This relationship indicated by equation (1-6) is the basis for the format change in propeller characteristics previously reported in the two Blount/Fox papers [15, 171 and can be used for any type of propeller such as thc Gawn-Bunill Series, Wageningen B Series and Supercavitating CRP Series.
Once Lhrust loading (KTlsJ;) has bccn cstablishcd, thc equilibrium between hull requirements and propeller capability generally results in a unique value of open-water propeller efficiency (q,,) and advance coefficient (JT) for that craft speed and corresponding cavitation numbcr a .
The application of propcllcr characlcristic data in thc qo and J , versus KrlJ,2 format have been described in detail in [15, 13 . The \due of thc method is addressed by Blount and Hankley [16], who, in noting the importance of cavitation effects at speeds above 25 knots, suggest that RPM for conventional flat-faced propellers could be underpredicted by up to 8 percent at high speeds.
Submcrgcd Propcllcr Loading The abilib of a given propeller to develop thrust and
absorb power has a finite limit under speclf~c operating conditions. This limit requires quantification to establish minimum propeller diameter and blade area. Gawn-Bunill provided acceptable limits based on dimensionless thrust and speed coefficients (z, and a,,). There are other sources axid formats for cavitation limits. Using the Gawn- Bunill format, maximum and recommended thrust limits are needed for Ihc othcr propcllcr scrics data when catitation beconles si,onificant. Since the maximu~n thrust limit is a tenuous design criterion, a inorc realistic mcthod needs to be established for each propeller type much as the 10 percent back-cavitation curve is used as an erosion-free design goal for the Gam-Bunill Series.
Under some circumstances. such as analyzing full- scale torque and RPM trial data, it is necessary to make assumptions to derive propcller thrust to ascerlain if thrust limits or thrust breakdown are being approached. To offer an alternative approach to estimating performance limits, dimensionless torque and spccd rclationshps were dcveloped for thcse propeller data based on the following consideration. If tlmst limits are quantifiable, it can be deduced that torque limits (niithout considering scale effects) for a propeller also can be defined. Since z, is dcfined as:
T 'LC =
1/2pAp(vo 7R)2 (2-1)
An analogous form of a torquc load cocllicicnt, Q,, was derived as follows:
0 Oc =
1 / 2 p ~ ~ , ( v o & 2 (2-2)
By definition:
A, = EAR (xD214)(1 -067-0.229 PID) (2-3)
The development of these equations is discussed in Appendix 4 of reference [17].
The procedure to establish the appropriate propeller diameter and pitch must consider the blade area relative to cavitation effects, taking into account other operational
aspects in addition to performance. Important factors affecting both the hull structural design in the vicinity of the propeller and potential bladedtat ion damage must be considered. Blade rate-induced hull pressures on the order of 4 to 5 psi can be generated by a badly cavitating propeller and can fatigue (crack) the hull plating after short periods of operation. Likewise, these blade cavities can be destructive to both the propellers and rudders, eroding blade material which could require frequent replaccment.
For most planing craft it is desirable to minimize these effects for submerged propellers by carefully selecting diameter and EAR such that zc does not exceed the 10 percent back-cavitation relationship of Gann-Burrill publislled in 1957. An approsimation of this Gma-Bum11 10 percent back-cavitation criterion is represcntcd as:
Advances in propeller design and manufacturing technology as confirmed by full-scale tests of various planing craft indicate that the thrust load criteria, r,, may be increased to:
rc 5 0.6 ((ao,do~w (2-6)
Submcrgcd supercavitating propellers are not included in the subject matter of this paper. However, it is important to note that if submerged, supercavitating propellers are Lhe design choice. The diameter, pitch and EAR must be selected such that s m c minimum load in^ r,. is exceeded in order to establish stable blade cavities in addition to not exceeding a maximum loading condition.
Surfacc Propeller Loading Surface (partidly submerged) propeller applications for
marine vehicles have bccome commonplace within recent years. Steerable and fixed variations of these propulsion devices offer the advantage of minimal shafting, struts, and control surfaces arrayed underwater as opposed to conventional propulsion system appendages which, in high- speed applications, can account for substantial craft resistance. Along with the many successes therc havc also been instances in which partially submerged propellers would simply not produce adcquatc thrust to propel thc craft at desired speeds. This latter matter prompted Denny 1241, to invcstigatc and dcvclop a criterion for establishing practical thrust limits for surface propellers.
Denny developed the same general concept for thrust load limits for submerged propellers, but assumed only the submerged, wetted disk area developed propulsive h s t . A general equation was developed with the percentage of propeller diameter immersion includcd as a variable. Correlation with trial data indicated that most successful
craft achieved the best high-speed performance with approkimatcly 50 percent propeller diameter submergence.
For v, being the water advance velocity (feet per second) at the planc of lhc propcller and the atmospheric pressure (2117 lb/ft2) in the cavity of the propcllcr, the Qpical maximum thrust load has been:
In the r, format this masimum thrust load becomes:
zc = 0.7 a,, (2-8)
It should be noted that W, (Tablc 1) for partially submerged propellers is usually zero. For this condition, v, is equal to boat speed and J, = J,.
This maximum-thrust load limit, equations (2-7) and (2-S), for sizing a surface propeller and selecting a gear ratio leaves little margin for error. Thus, if the total resistance is too optimistic because of the prediction method utilized or the as-built boat weight andlor LCG exceed design expectations, then performance is likely to be very much different Lhan anticipatcd. For Lhis rcason the recommcnded design criteria should be no more than 80 percent of the maximum values. This approach will reduce the technical risk for surface-propeller applications. Tlws, the recommended thrust load-design criteria for surface propellers depicted in equations (2-7) and (2-8) become:
and: rc = 0.56 a,, (2-10)
Surface propellers generate significant vertical and horizontal forces in addition to propulsive thrust. Two definitive papers by Rose et a1 [27, 291, provide experimental characteristics for a family of four-bladed surface propellers. These two sources provide su&cient detail to account for vcrtical and horizontal forces generated by surface propellers.
Flush-Inlet Wate jet Loading Flush-inlet wate jets have made sigruficant inroads as
the preferred propulsors for craft requiring operational speeds of greater than 25 knots. Considering overall propulsive efficiency, they offer a distinct advantage at higher speeds. In addition, requirements for reduced vibration and navigational draft often support the decision to select waterjets in favor of other propulsors.
1-1 -INLET VELOCITY
I \ L! + I . DIAMETER
I V, -JET VELOCITY I I VS -VELOCITY OF
WATER AT FLUSH INLET
f I+ ,,,- INPUT POWER .
f
EXIT JET -1 - . . . . - - . DIAMETER
(DJ ) IMPELLER DIAMETER
(D)
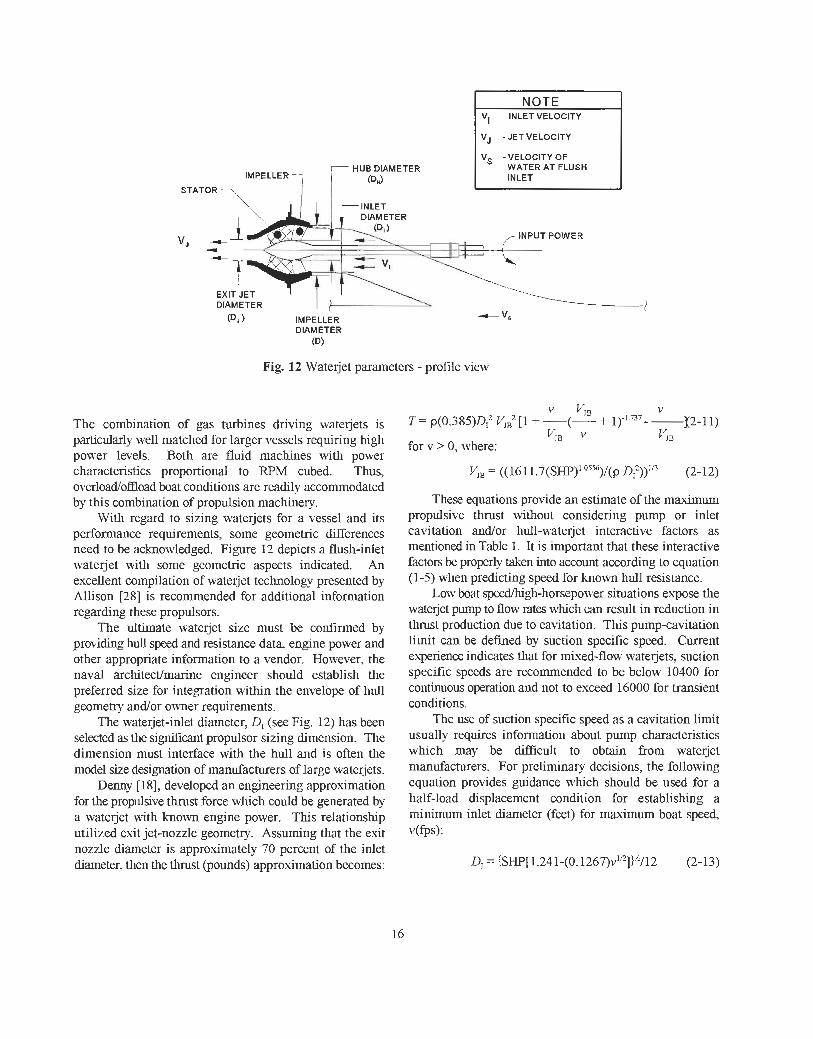
Fig. 12 Wate jet parameters - profile view
The combination of gas turbines driving watejets is particularly well matched for larger vessels requiring high power levels. Both are fluid machines with power characteristics proportional to RPM cubed. Thus, overloadoffload boat conditions are readily accommodated by this combination of propulsion machinery.
With regard to sizing waterjets for a vessel and its performance requirements, some geometric differences need to be acknowledged. Fi,w 12 depicts a flush-inlet wate j e t with some geometric aspects indicated. An excellent compilation of wate jet technology presented by Allison [28] is recommended for additional information rcgardmg these propulsors.
The ultimate watcjcl s i ~ c must be confirmed by providing hull speed and resistance data, engine power and other appropriate information to a vendor. However, the naval architectlmarine engineer should establish the prefened size for integration within the envelope of hull geometry andor owner requirements.
The wate jet-inlet diamctcr, Dl (see Fig. 12) has been selected as the sipdicant propulsor sizing dimcnsion. The dimension must inlcrface with the hull and is often the model size designation of manufacturers of largc ualc jcts.
Demy [IS], developcd an engineering approximation for the propulsive thrust force which could be generated by a wvatejet with known engine power. This relationshp utilized exit jet-nozzle geometry. Assuming that the exit nozzle diameter is approximately 70 percent of the inlet diameter, then the thrust bounds) approximation becomes:
v v,, v T = p(0.385)D12 VJB2 [ l + -(- + 11-1.737 - - 12-1 1)
B v v,, for v > 0, where:
V,, = ((16 1 1 .7(SHP)L.0556)/(p D5):))"' (2-12)
These equations provide an estimate of the maximum propulsive thrust without considering pump or inlet cavitation andlor hull-waterjet interactive faclors as mentioned in Table 1. I1 is important that these interactive factors be properly taken into account according to equation (1 -5) when predicting speed for known hull resistance.
Low boat spccdhgh-horsepower situations expose the wate jet pump to flow rates whch can resull in reduction in thrusl production due to cavitation. This pump-cavitation limit can be defined by suction spccilic speed. Current experience indicates that for mixed-flow wate jets, suction specific speeds are recommended to be below 10400 for continuous operation and not to exceed 16000 for transient conditions.
The use of suction specific speed as a cavitation limit usually requires information aboul pump characteristics which may be d8icult to obtain from waterjct manufacturers. For prcliminw decisions, the following cqualion provides guidance which should be used for a half-load displacement condition for establishing a minimum inlet diameter (feet) for maximum boat speed, v(fPs1:
for: 10 5 v 5 85 fps
After the minimum inlet diameter is established, speed, thrust and power characteristics should be calculated foIlo'u.ing equations (2-1 1) and (2- 12) to comparc with hull resistance and to evaluate the margin at hump speed. It is likely that slightly larger inlet diameters than that indicated by equation (2-13) may result in improved overall propulsive coefficients.
As with propellers, the design RPM must also be established simultaneously with the watejet size. There
will be some RPM variation behveen wate jets supplied by different manufacturers. However, the following equation serves as an approximation for rotational speed:
n = u(SHP)'I3 (2- 14) where:
u = -0.01341 + 4.01 [L),J-'.62S (2-15)
As a final reminder, a natejet's thrust, speed and power relationships must eventually be obtained from the supplier.
dschleicher
Note
n=revolutions per second Di in feet