DESIGN OF POST PROJECT ANALYSIS AND RISK MANAGEMENT ...
26
DESIGN OF POST PROJECT ANALYSIS AND RISK MANAGEMENT PROCESSES FOR R&D PROJECTS Sema Nur Altuğ Fayda TUBITAK-UEKAE P.K. 74, Gebze 41470 Kocaeli, Turkey Tel. ++90 262 6481967 Fax ++90 262 6481100 [email protected] Gündüz Ulusoy Faculty of Engineering and Natural Sciences Sabancı University Orhanlı, Tuzla, 81474 Istanbul, Turkey Tel. ++90 216 4839503 Fax ++90 216 4839550 [email protected] Iffet Iyigün Meydanlı Arçelik A.Ş. Research & Development Center R & TD Group Leader Technology and Project Management Çayırova, Istanbul, Turkey Tel. ++90 216 5858393 Fax ++90 216 4233045 [email protected] May 2003
Transcript of DESIGN OF POST PROJECT ANALYSIS AND RISK MANAGEMENT ...

DESIGN OF POST PROJECT ANALYSIS
AND RISK MANAGEMENT PROCESSES
FOR R&D PROJECTS
Sema Nur Altuğ Fayda
TUBITAK-UEKAE P.K. 74, Gebze 41470 Kocaeli, Turkey
Tel. ++90 262 6481967 Fax ++90 262 6481100 [email protected]
Gündüz Ulusoy
Faculty of Engineering and Natural Sciences Sabancı University
Orhanlı, Tuzla, 81474 Istanbul, Turkey Tel. ++90 216 4839503 Fax ++90 216 4839550
Iffet Iyigün Meydanlı
Arçelik A.Ş. Research & Development Center R & TD Group Leader
Technology and Project Management Çayırova, Istanbul, Turkey
Tel. ++90 216 5858393 Fax ++90 216 4233045 [email protected]
May 2003

1
DESIGN OF POST PROJECT ANALYSIS
AND RISK MANAGEMENT PROCESSES
FOR R&D PROJECTS
ABSTRACT
This study has been performed as a project management process improvement
project in the R&D Department of a leading white goods manufacturer in Turkey.
Data related to 93 projects executed and finished during 1994-2001 in the R&D
Department is compiled. These projects are analyzed to determine the factors that
affect the project performance and to identify the risks encountered in the past and to
compile a Risk Checklist as an input to the proposed risk management process. Then,
a risk management process and a post project analysis process are designed for
introducing risk management and organizational learning practice to the R&D Center.
The risk management and project analysis processes are tested on a project close to its
initiation and on two recently completed projects, respectively. It is observed that
learning points are identified upon analyzing risk issues and the risk management
process outcomes may provide insights into the weaknesses in the project
management process. Thus, both processes are intertwined and evolve around each
other.
Keywords: Managing Projects, Processes, Risk Management, Post Project Analysis,
R&D Projects

2
INTRODUCTION This study has been performed for the improvement of processes in project
management activities of the Research and Development (R&D) Department of a
leading white goods manufacturer in Turkey. This R&D Department was established
in 1991. All R&D projects are performed in-house. Occasionally some work-packages
of the projects are outsourced but the whole project. Since 1992, there has been a
standardized project management system, including the definition of project life
cycle, tracking mechanisms and documentation for resource usage. By the year 1997,
a database has been developed for use in the planning and monitoring of the projects.
Currently employed project planner software Stage GateTM, was introduced in 1999.
There are nearly 100 employees from different science and technology disciplines
working for the R&D Department. Different science and technology disciplines are
grouped under the title “families” in the organizational structure of the R&D
Department. A Project Office within the R&D Department provides support to project
leaders in the planning and monitoring of projects and maintains an archive and a
database for completed projects.
This paper focuses on the post project analysis and risk management processes
for R&D projects, aiming to ensure the proper analysis and documentation of the
information generated and experience gained throughout the project life. Particularly
for a project organization, it is crucial to devise means of accumulating such valuable
information and experience. A systematic post project analysis process fulfils this
requirement and should be considered a major component of the corporate learning
process. The post project analysis is considered to be one of the two outputs of a
project; the other being the project itself [1].
The post project analysis process consists of activities performed by a team at
the completion of a project to gather information on what worked well and what did
not, so that future projects can benefit from that learning. It aims to find out best
practices and documenting “lessons learned”. Documentation of lessons learned is
essential for their dissemination within the organization. Case studies can be written
from best practices, important issues drawn both from successes and failures can be
collected in booklets, lessons learned can be captured in a knowledge base such that
similar future projects can benefit from them [2,3,4]. A database consisting of past
project data is beneficial to learn what types of problems are unique, what types are

3
characteristic or systemic, how often do they occur, what has been done to deal with
them, things well done by chance and should be repeated [5].
The steps of the post project analysis process differ among users, but still it is
possible to discern the main steps referring to different studies [2,6,7]: (i) Data
collection, (ii) analysis, (iii) establishing lessons learned, (iv) verification, (v)
documentation, (vi) information dissemination.
Subjects to be dealt with and included in a post project analysis process can be
described as follows [8,9,10,11,12,13,14,15]: (i) Basic project information, (ii) project
management process, (iii) performance, (iv) teamwork evaluation, and (v) customer
feedback.
The lessons learned during the post project analysis process contribute greatly in
putting the risk management issues into proper perspective. It is necessary to apply an
information capturing process concerning the experiences on project risks gained
during the execution of a project for improved risk management in the future projects.
Project risk is an uncertain event or condition that, if it occurs, has a positive or
a negative effect on a project objective [16]. In the study reported here, only the
negative aspects of project risks are considered. The project risks are defined as the
uncertain events that may cause delays, unexpected costs, or unsatisfactory outcomes.
Although a relatively new topic, there are a large number of studies on risk
management in the project management setting. But yet one cannot claim that risk
management techniques have become part of the mainstream practices in project
management like work breakdown structure or scheduling techniques based on critical
path analysis [17].
Risk management is the systematic process of identifying, analyzing, and
responding to project risks. There are different approaches proposed for risk
management process in the literature. But the main steps are common in most
approaches and include risk assessment (i.e., risk identification and risk analysis), risk
response development, and risk monitoring and control [16,18,19,20,21,22,23,24].
At project termination, the project risks encountered and the experiences gained
through various responses to these risks should be integrated into the organization’s
project management knowledge repository. In future projects, this knowledge base
can serve as the starting point for risk identification and analysis. Project managers
can use these past real-world experiences to improve the productivity of the project
management process and to increase the likelihood of success.

4
OUTLINE OF THE STUDY As the initial step of the study, data related to 160 R&D projects conducted and
completed during 1994-2001 is compiled and verified with the staff of the R&D
Department. Sixty-seven projects are eliminated from further consideration mainly
due to improper documentation and lack of crucial data. The remaining 93 projects
are analyzed to determine the factors that affect the project performance and to
identify the risks encountered during the conduct of these projects. Then, in order to
standardize and to systematize the risk identification process, a Risk Checklist is
compiled. The Risk Checklist is not only derived from past projects’ analysis but also
from a review of relevant R&D management literature [16,21,22,25,26,27,28,29].
After the analysis of the current project management system, the post project
analysis and risk management processes are designed and integrated into the current
process. Finally, the risk management process is tested on a project close to its
initiation and the post project analysis process is tested on two recently completed
projects.
PROJECT MANAGEMENT PERFORMANCE ANALYSIS Project management performance is defined here as the amount of deviations
from the baseline project duration and manpower usage, where the baseline
corresponds to the project plan adopted at the initiation of the project.
Deviations (DEV) are calculated according to expression [Eq. 1]:
DEV = | Baseline – Actual | / Baseline [Eq. 1]
To determine the factors that affect project management performance, past
projects are analyzed through a series of hypothesis tests.
Formulation of the Hypothesis Tests With the definition of project management performance in mind, five
hypotheses are formulated for testing it. The first two are related to the size of the
project; namely, the planned project duration and the amount of manpower to be
employed during the project. The next three are associated with the project leader and
the project team, i.e., related to organizational issues.
H1: The length of project duration has a positive impact on project management
performance.
H2: Amount of manpower employed expressed in terms of man-months has a
positive impact on project management performance.

5
H3: The experience of the project leader has a positive impact on project
management performance.
H4: The size of the project teams has a positive impact on project management
performance.
H5: Multi-disciplinary approach to project team formation has a positive
impact on project management performance.
To test these hypotheses, t-tests and one-way ANOVA are used at a level of
significance α=95%. Each hypothesis is tested once with respect to each component
of project management performance, i.e., project duration and manpower usage.
Results of the Hypothesis Tests
The results of the t-tests and the one-way ANOVA are grouped in Table 1 and
Table 2, respectively.
_____________________
Tables 1 and 2 about here _____________________
H1: The length of project duration has a positive impact on project management performance. H1.1: Duration deviation of the projects that lasted less than 2 years (Group 1)
are less than that of the projects that lasted 2 years and more (Group 2). Thus,
H0: µ2-µ1≥0 versus HA: µ2-µ1<0.
where µi stands for the mean duration deviation of Group i.
Since p<0.05, H0: µ2-µ1≥0 is rejected. Schedule performance is better in the
projects with duration of 2 years or more.
H1.2: Manpower deviation of the projects that lasted less than 2 years (Group
1) are less than that of the projects that lasted 2 years and more (Group 2). Thus,
H0: µ2-µ1≥0 versus HA: µ2-µ1<0.
where µi stands for the mean manpower deviation of Group i.
Since p<0.05, H0: µ2-µ1≥0 is rejected. Manpower usage performance is better in
the projects with duration of 2 years and more.

6
H2: Amount of manpower resource employed has a positive impact on project management performance. H2.1: Duration deviations of the projects that employed less than 6 man-months
manpower resource (Group 1) are less than that of the projects that employed 6 man-
months or more manpower resource (Group 2). Thus,
H0: µ2-µ1≥0 versus HA: µ2-µ1<0.
where µi stands for the mean duration deviation of Group i.
Since p<0.05, H0: µ2-µ1≥0 is rejected. Schedule performance is better in the
projects that employed 6 man-months or more manpower resource.
H2.2: Manpower deviation of the projects that employed less than 6 man-month
manpower resource (Group 1) are less than that of the projects that employed more
than 6 man-months (Group 2). Thus,
H0: µ2-µ1≥0 versus HA: µ2-µ1<0.
where µi stands for the mean manpower deviation of Group i.
Since p<0.05, H0: µ2-µ1≥0 is rejected. Manpower usage performance is better in
projects that employed 6 man-months or more manpower resource.
H3: The number of years of experience of the project leader has a positive impact on project management performance. The mean experience of the project leaders in the projects analyzed is about 4
years of participation in project work in the Company. Based on this observation, a
project leader is classified as inexperienced if his/her experience is less than 4 years
(Group 1); and as experienced if his/her experience is 4 years or more (Group 2).
H3.1: For schedule performance, the hypothesis is formulated as:
H0: µ2-µ1 ≥ 0 versus HA: µ2-µ1 < 0
where µi stands for the mean duration deviation of Group i.
Since p<0.05, we can reject H0: µ2-µ1 ≥ 0. It is concluded that the schedule
performance is better in projects directed by project leaders with more than 4-years of
experience.
H3.2: For the manpower deviation dimension, the hypothesis is formulated as:
H0: µ2-µ1 ≥ 0 versus HA: µ2-µ1 <0
where µi stands for the mean manpower deviation of Group i.
Since p>0.05, we cannot reject H0: µ2-µ1 ≥ 0. Thus, there is no significant
finding about the impact of the project leader’s experience on manpower deviations.

7
H4: The size of project teams has a positive impact on project management performance. Group 1: Number of the team members < 4 persons.
Group 2: Number of the team members ≥ 4 persons and < 6 persons.
Group 3: Number of the team members ≥ 6 persons and < 10 persons.
Group 4: Number of the team members ≥ 10 persons.
H4.1: One-way ANOVA has been executed under the null hypothesis:
H0: µ1=µ2=µ3=µ4=µ versus HA: µ1≠µ2≠µ3≠µ4≠µ,
where µi represents the mean duration deviation of Group i.
The results of this analysis are reported under H4.1 in Table 2. The p-value is
sufficiently small and therefore, H0: µ1=µ2=µ3=µ4=µ is rejected.
Analysis of the means of duration deviations of individual Groups leads to the
conclusion that there is a statistically significant difference between those means.
Furthermore, a tendency of decrease in mean duration deviations is observed with
increasing Group number. The conclusion then is that schedule performance is better
in projects with relatively larger project teams.
H4.2: One-way ANOVA has been employed under the null hypothesis:
H0: µ1=µ2=µ3=µ4=µ versus HA: µ1≠µ2≠µ3≠µ4≠µ,
where µi represents the mean manpower deviation of Group i.
The p-value is sufficiently small and therefore, H0: µ1=µ2=µ3=µ4=µ is rejected.
A similar analysis as in H4.1 leads to the conclusion that manpower usage
performance is better in projects with relatively larger project teams.
H5: Multi-disciplinary approach has a positive impact on project management performance.
Group 1: Projects where 1 or 2 different disciplines contribute.
Group 2: Projects where 3 or more different disciplines contribute.
H5.1: To test the hypothesis in its duration deviation component, t-test is
employed under the null hypothesis:
H0: µ2-µ1 ≥ 0 versus HA: µ2-µ1 < 0
where µi represents the mean duration deviation of Group i.
The p-value is sufficiently small and therefore, H0: µ2-µ1 ≥ 0 is rejected. Thus,
the schedule performance is better in projects with multi-disciplinary project teams
consisting of 3 or more disciplines.

8
H5.2: For the component of manpower usage performance, the null hypothesis
is stated as:
H0: µ2-µ1 ≥ 0 versus HA: µ2-µ1 < 0
where µi represents the mean manpower deviation of Group i.
Since p<0.05, we can reject H0: µ2-µ1 ≥ 0. Thus, manpower usage performance
is better in projects with multi-disciplinary project teams consisting of 3 or more
disciplines.
Summary of the Findings (i) Projects with duration of less than 2 years are more likely to deviate from
their baseline duration and baseline manpower requirements.
(ii) Projects with manpower resource usage less than 6 man-months are more
likely to deviate from their baseline duration and baseline manpower requirements.
The findings reported in (i) and (ii) indicate that for relatively small projects it is
harder to keep to the baseline project plan.
(iii) Projects executed by project leaders with more than 4 years of experience
are more likely to be successful in following their baseline schedules. This result is
expected because experience helps in accumulating knowledge and employing this
knowledge, the experienced project leader has a better chance to plan more
accurately; to be aware of risks and to manage them well; and to prevent conflicts or
to resolve them more quickly. Therefore, possible schedule deviations are decreased
in those projects managed by experienced project leaders.
(iv) Projects with relatively large project teams are more likely to be successful
in following their baseline schedules and baseline manpower requirements. This
might be due to the control exercised by team members over each other and also due
to the possible covering up of team members for each other within the same
discipline.
(v) Projects with project teams consisting of 3 or more disciplines are more
likely to be successful in keeping to their baseline project duration and manpower
requirements. When there are several disciplines involved in a project, then a
dependency structure emerges among those disciplines. A delay in one discipline’s
assignment automatically delays the other disciplines’ assignments. Since each
discipline is usually involved in more than one project, it is difficult for them to

9
reschedule and they are quite sensitive against such delays. As a result, this
dependency structure leads to tighter cross-team control on the project activities.
The project management performance analysis resulted also in extensive
documentation, which is later employed in the preparation of the Risk Checklist.
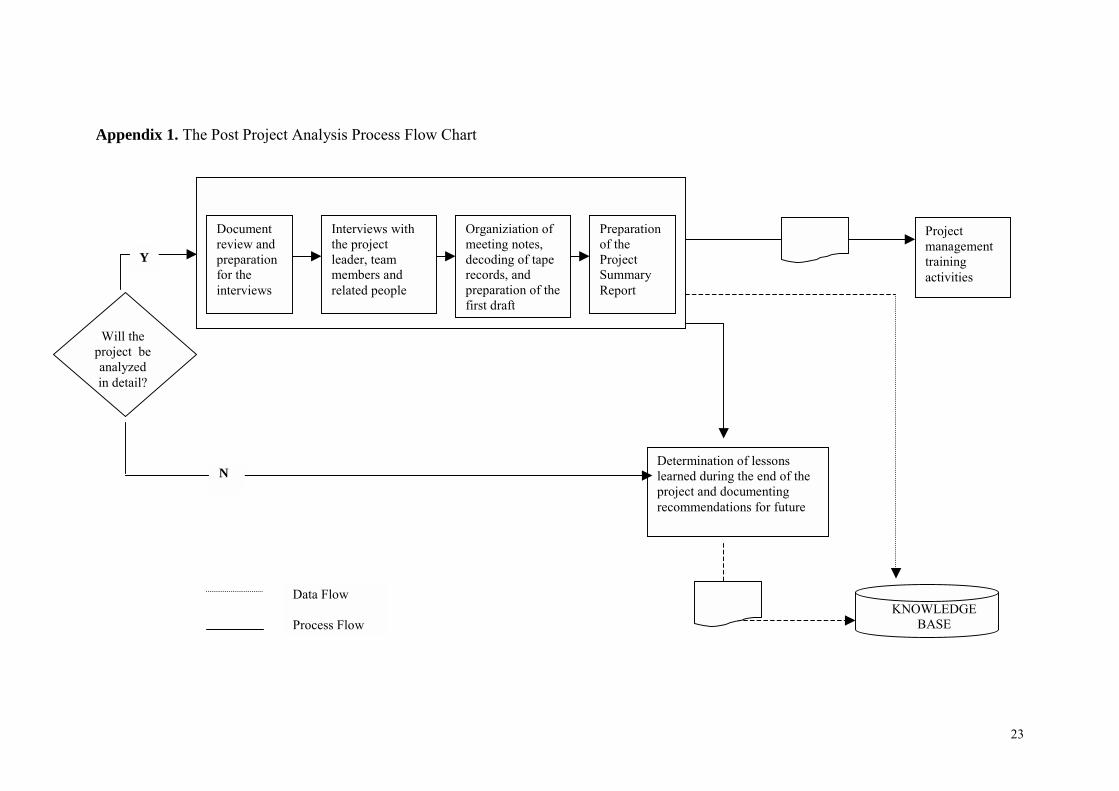
POST PROJECT ANALYSIS PROCESS In the proposed post project analysis process, a project once completed can be
subjected to a brief or detailed post project analysis. The flow chart of this process is
given in Appendix 1.
In a brief post project analysis, the project leader with assistance from the
Project Office summarizes the lessons learned in the closing document; such as
planning and monitoring issues, communication with the stakeholders and within the
project team, what went right and what went wrong. This document is put into the
knowledge base and made available for future use.
The conditions under which a detailed analysis is performed are the following:
(i) If there are extreme deviations from the project objectives (time, cost, and quality
as defined in accordance with the technical specifications). (ii) If it is a project subject
to unusual and/or high-risk applications. (iii) If it is an example to a specific project
type (for example, it is relatively large in terms cost or duration, or is a joint project of
several corporations). (iv) If the project involves an application or a problem, which is
rarely met in practice and thus should be definitely shared with other prospective
project leaders.
The steps of the detailed analysis begin with the preparation for a structured
interview. The interview aims at identifying the lessons learned. The Project Office
reviews project documents and generates questions, which may help the team
members to recall the project details and to state explicitly the lessons learned. Such a
list of questions is definitely helpful when conducting the interview [38,39]. The
Project Office conducts interviews with the project leader, the team members, and if
necessary, with other people involved in the project. After conducting an interview,
the Project Office decodes the tape records, organizes the meeting notes, and produces
a draft document containing all the information discussed in the meetings. Then, if
any, vague or incomplete points in this draft document are verified with the person(s)
involved.

10
Following all these activities, the Project Office prepares a short report under
the title “Project Summary”, summarizing important learning points. The Project
Summary is written in a case format to be used later in project management training
as an internal case study. After the approval of the Project Summary by the project
leader, it will be recorded with the associated key words in the knowledge base for
future use.
DESIGN OF A RISK MANAGEMENT PROCESS The proposed risk management process is designed to include the following
four main activities:
(i) Risk identification,
(ii) Risk analysis,
(iii) Risk response development,
(iv) Risk monitoring and control.
The first three of the above main activities constitute the planning phase of risk
management. The operation phase, on the other hand, is based mainly on risk
monitoring and control, but risk identification, analysis, and response development
are employed also in the operation phase whenever an update associated with the
existing and newly perceived risks is needed. The flow chart of the proposed risk
management process is displayed in Appendix 2.
When designing the risk management process, it is necessary to decide on
which techniques such as Analytic Hierarchy Process (AHP) to include in the process
and how to create a decision environment where those responsible to implement these
techniques can do so easily and effectively.
To provide ease for use, complex quantitative techniques are omitted from the
process. To ensure objectiveness, a standardized Risk Checklist is developed and
scales for scoring are defined for the risk analysis phase.
The risk identification phase. In this phase, the risks associated with the project
activities are identified. The project team analyses the project and identifies the
possible causes of potential problems and their effects. As a helpful tool, cause-effect
diagrams can be used to identify risks. The risks thus identified are entered into the
knowledge base. The basic output of this phase is the Risk Checklist (Appendix 3).
Risk assessment

11
The Risk Checklist is prepared in four steps. At the first step, problems
encountered in the past projects are determined by analyzing historical data from the
project documents.
In the second step, this set of problems is further enlarged with the problems
reported in the literature, especially in the context of R&D projects. Then, the risks in
this list are classified under main risk categories denoted as technical, resource
management, non-technical internal, customer related, external- predictable, and
external-unpredictable.
In the third step, overlaps between the risks and ambiguities in the definitions
are eliminated and to ensure that the Risk Checklist covers all problems encountered
before, past projects are analyzed again with the new format.
Finally, to determine whether the project leader would consider the Risk
Checklist as comprehensible and sufficiently complete, it is tested on a project, which
is still in its planning phase. It is concluded that this Risk Checklist is applicable in
the R&D Department. The final form of the Risk Checklist is given in Appendix 3. In
a recent study, a reference list of potential risk issues in the innovation process has
been developed in a similar fashion [32].
_____________________
Table 3 about here _____________________
The risk analysis phase. The risks identified are analyzed to determine their
severities and then to assign priorities to them. The decision to be made here is the
selection of the analysis method. AHP and scoring methods are considered as
potential methods to be used in the process. Weights, scores on probability and
impacts, and matrices combining those factors to determine severities of risks are
widely used in project risk management literature [16,18,22,33,34,35,36,37,38,39].
The scoring method has the advantage of simplicity that can be viewed as
commensurate to the nature of use of expert-opinion elicitation [40]. As a result of
consultation with the R&D Department personnel, it is found that simplicity is
considered as the main factor for adoption of an analysis method. Thus, scoring is
preferred for risk analysis in the proposed process. Scales of 1-5 determine the
likelihood and the impact of a single risk. Then, these are combined into a matrix to

12
determine the severity of risks. These severities result in the prioritized list of project
risks with high severity corresponding to high priority.
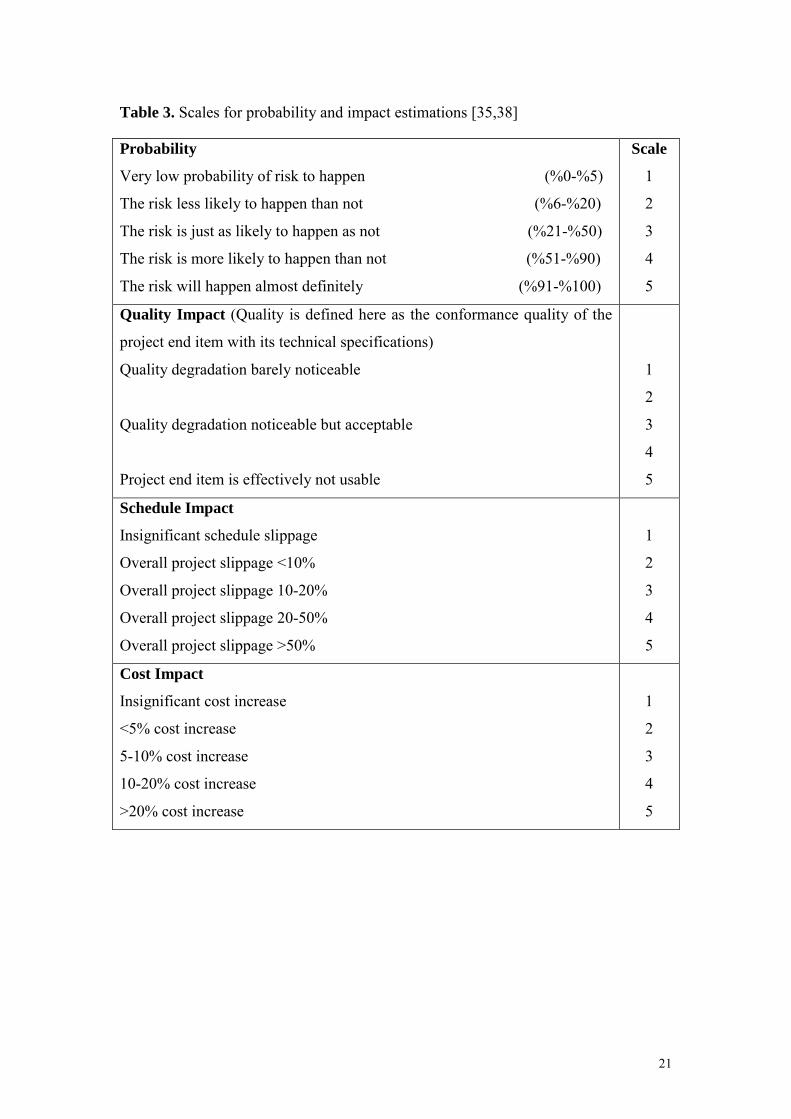
In the proposed process, generic impact scales and probability scales given
respectively in [35] and [38] were decided to be used in prioritization (Table 3).
Using this 1-5 scale and consulting with the project team, the project leader
assigns probabilities and impacts for the identified risks. Then, based on these values,
severity level for each risk is determined (Table 4).
_____________________
Table 4 about here _____________________
When determining the overall impact score, it is possible to accept the highest
impact among the impacts on time, quality, and cost [35]. The deficiency of this
approach is demonstrated when one considers two risks with the same probability of
occurrence and the maximum level of impact being the same for two different
dimensions, say, quality and cost at each risk. Both these risks will have the same risk
severity. It would be unwise to deal with these two risks in the same manner. In the
proposed approach, the impact dimensions could have their own weights called
impact coefficients taking on values according to project type and activity within a
project. For example, a research project ordered by a customer might have a due date
more strict and a schedule tighter than that of an in-house research project and thus,
its schedule impact should be counted more heavily. Overall impact will be taken then
as the integer value of the average as suggested in [34]. The overall impact I is
calculated as in [Eq. 2]:
I = [a*x +b*y +c*z] [Eq. 2]
Under the condition: (a + b + c) = 1.
where:
a: Schedule impact coefficient
b: Quality impact coefficient
c: Cost impact coefficient
x: Value of the time impact in 1-5 scale
y: Value of the quality impact in 1-5 scale
z: Value of the cost impact in 1-5 scale
One of the weaknesses of the scoring model is its failure to incorporate
systematic checks on the consistency of judgments [41]. Also, using a scoring model
13
imputes a degree of precision that simply does not exist. A halo effect (i.e., if a risk
scores high on one criterion, it tends to score high on many of the remaining criteria)
is also possible for a scoring model [42].
The risk response development phase. In this phase, the project leader will
define response and contingency plans for the prioritized risks. Strategies that can be
used in this phase could rely upon acceptance, mitigation, transfer and avoidance
[16,18,22,27,28]. In this phase, past project data will provide useful information about
what has been done for a specific risk in the previous projects. There will be a search
option to see the examples of response and contingency plans used in past projects.
After the definition of the risk response plan, a document containing identified risks,
severities, response plans, risk symptoms, and risk owners will be prepared and
approved by the project sponsor.
The risk monitoring and control phase. The following events, which are of
interest in the context of risk management, can take place during the execution of a
project:
Applying a response plan by monitoring risk symptoms.
Identification of new risks and determination of associated response plans.
Changes in the response plans.
Identification of the risks realized.
Changes in the level of severity of risks.
In the proposed process, all these events are entered into the database and then
monitored. To adapt to the changing environment, project plan may be revised. In this
revision, a document containing for each risk the planned response, applied response
(if any), severity of risk as conceived at the initiation of the project, the most recent
severity assessment of the risk and the risk owner will be prepared and approved by
the project sponsor. Risk monitoring and control is a continuous process.
By the end of the project, all the risk-related data will be stored in the
knowledge base and ready for future use. With the closeout documents, identified and
realized risks, not identified but realized risks, identified but not realized risks will be
separately declared with their applied responses, estimated impact on project
objectives at the initial plan, realized impact on project objectives, and
recommendations for the future.

14
CONCLUSION This study demonstrates the importance of learning from past experiences for
successful project management and in particular for project risk management.
Through this study, some risk management techniques and post project analysis are
integrated into the project management system of the R&D Department with the
objective of improving the project management performance.
Both post project analysis and risk management processes are helpful in
transforming tacit knowledge into explicit and written information. To exploit this
facility a knowledge base is designed and put in place. Tacit knowledge extracted in
written form is thus made easily accessible to others in order to increase its impact
and to make it part of the corporate knowledge base. Standardization and
categorization are introduced for facilitating knowledge sharing. Disorganized and
free-format structures create information pollution, and people rightfully do not want
to spend hours searching through archives without being able to focus on what they
are looking for.
It is observed that risk related issues constitute a major part of post project
analyses. Risk management, on the other hand, relies heavily on the experiences
gathered through a series of projects and made explicit by post project analysis. These
processes interact with each other closely, both serving the same aim of increasing the
success of a project by improving its management. Therefore, risk management and
post project analysis processes are designed together in an input-output type of
collaboration with each other.
Integration of this process innovation into the present project management
system required the use of current terminology and harmony with the current
procedures prevalent in the R&D Department, simplicity and clarity of the techniques
employed, management support and motivation of the employees. Organizational
culture and environment are also observed to play a major role in implementing both
risk management and post project analysis processes.
REFERENCES [1] Cooper K. G., Lyneis J. M., Bryaht B. J., Learning to learn, from past to future,
International Journal of Project Management, 20, 213-219, 2002.
[2] Gulliver F.R., Post project appraisals pay, Harvard Business Review, 65(2), 128-
132, 1987.

15
[3] Garvin D. A., Building a learning organization, Harvard Business Review, 71(4),
78-92, 1993.
[4] Duarte D., Synder N., From experience: facilitating organizational learning in
product development at Whirlpool Corporation, Journal of Product Innovation
Management, 65(2), 48-55, 1997.
[5] Busby J. S., An assessment of post project reviews, Project Management Journal,
30(3), 1999.
[6] Corbin D., Cox R., Hamerly R., Knight K., Project management of project
reviews, PM Network, 59-62, March 2001.
[7] Turner J.R. The Handbook of Project-Based Management. McGraw-Hill Book
Company, New York, 1993.
[8] Ward J.A., Completing projects successfully. In: Tinnirello P. C. editor. Project
Management, Auerbach, Boca Raton, 2000. p.401-407.
[9] Kniestedt R.F., Hager P.A., Continuous process improvement in systems
development. In: Tinnirello P. C. editor. Project Management, Auerbach, Boca Raton,
2000. p. 433-447.
[10] Chiesa V., Coughlan P., Voss C.A., Development of a technical audit, Journal of
Product Innovation Management, 13, 105-136, 1996.
[11] Hameri A., Nihtilä J., Data-based learning in product development, Scandinavian
Journal of Management, 14(13), 223-238, 1998.
[12] Wideman R. M., Project management appraisal: testing the effectiveness of your
project’s management, International Seminar on Project Management for Developing
Countries, New Delhi, Sept 4-6, 1991.
[13] Lientz B. P., Rea K.P., Project Management For The 21st Century. Academic
Press, 1995.
[14] Meredith J.R., Mantel S.J., Project Management, A Managerial Approach. 4th
Edition, John Wiley & Sons, New York, 2000.
[15] Wheelwright S.C., Clark K. B., Revolutionizing Product Development. The Free
Press, New York, 1992.
[16] PMBOK®Guide, A Guide to Project Management Body of Knowledge. Project
Management Institute, Pennsylvania, 2000.
[17] Raz T., Shenar A. J., Dvir D., Risk management, project success, and
technological uncertainty, R&D Management, 32(2), 101-110, 2002.
16
[18] Murray K., Risk management beyond the textbooks, PM Network, 53-57, June
1998.
[19] Kuver P.P., Risk management: the safety net for project schedules and budgets.
In: Tinnirello P. C. editor, Project Management, Auerbach, Boca Raton, 2000. p. 51-
59.
[20] Chapman C., Ward S., Project Risk Management, Processes, Techniques and
Insights. John Wiley & Sons, New York, 1997.
[21] Webb A., Managing Innovative Projects. Chapman & Hall, London, 1994.
[22] Royer P. S., Risk management: the undiscovered dimension of project
management, Project Management Journal, 31(1), 6-13, 2000.
[23] Ward S., Requirements for an effective project risk management process, Project
Management Journal, 37-44, September 1999.
[24] Raz T., Michael E., Use and benefits of tools in project risk management,
International Journal of Project Management, 19, 139-145, 2001.
[25] Kerzner H., Project Management: A Systems Approach to Planning, Scheduling
and Controlling. 7th Edition, John Wiley & Sons, New York, 2001.
[26] Ansell J., Wharton F., Risk management: a review. In: Ansell J., Wharton F.
editors. Risk: Analysis, Assessment and Management, p. 203-211, John Wiley &
Sons, New York, 1992.
[27] Elkington P., Smallman C., Managing project risks: a case study from the
utilities sector, International Journal of Project Management, 20, 49-57, 2002.
[28] Lester A. Project Planning and Control. 3rd Edition, p.12-18, Butterworth-
Hineman, Boston, 2000.
[29] Miller R., Lessard D., Understanding and managing risks in large engineering
projects, International Journal of Project Management, 19, 437-443, 2001.
[30] Kleiner A., Roth G., How to make experience your company’s best teacher, In:
Harvard Business Review on Knowledge Management, p. 137-151, Harvard Business
School Press, Boston, 1998.
[31] Leenders M.R., Erskine J.A., Case Research: The Case Writing Process, School
of Business Administration, The University of Western Ontario, 3rd Edition, 1989.
[32] Keizer J.A., Halman J. I.M., Song M., From experience: applying the risk
diagnosing methodology, The Journal of Product Innovation Management, 19, 213-
232, 2002.

17
[33] Chapman R.J., The controlling influences on effective risk identification and
assessment for construction design management, International Journal of Project
Management, 19, 147-160, 2001.
[34] Pinto J.K. Project management 2002, Research and Technology Management,
22-37, March-April 2002.
[35] Graves R., Qualitative risk assessment, PM Network, 61-66, October 2000.
[36] Datta S., Mukherjee S.K., Developing a risk management matrix for effective
project planning- an empirical study, Project Management Journal, 32(2), 45-57,
2001.
[37] Pyra J., Trask J., Risk management post analysis: gauging the success of a simple
strategy in a complex project, Project Management Journal, 41-48, June 2002.
[38] Patterson F.D., Neailey K., A risk register database system to aid the
management of project risk, International Journal of Project Management, 20, 365-
374, 2002.
[39] Wideman R. M., Project & Program Risk Management, p.II-5, Project
Management Institute, Pennsylvania, 1992.
[40] Ayyub B.M., Elicitation of Expert Opinions for Uncertainty and Risks. CRC
Press, Boca Raton, 2001.
[41] Belton V., A comparison of the Analytic Hierarchy Process and a simple multi-
attribute value function, European Journal of Operational Research, 26, 7-21, 1986.
[42] Cooper R. G., Edgett S. J., Portfolio management in new product development:
lessons from the leaders-I, Research Technology Management, 40(5), 16-29, 1997.

18
Table 1. Results of the t-tests
Table 2. Results of the one-way ANOVA
Table 3. Scales for probability and impact estimations [35,38]
Table 4. Risk severity matrix [35]
Appendix 1. The Post Project Analysis Process Flow Chart
Appendix 2. The Risk Management Process Flow Chart
Appendix 3. The Risk Checklist

19
Table 1. Results of the t-tests
Hypothesis
Groups No. of
Observations
Mean
Variance
T statistics
P (T≤ t)
Tcrit < 2 years 55 0.91 1.9 H1.1
(Duration) ≥ 2 years 38 0.29 0.18 3.1 0.001 1.06
< 2 years 55 0.39 0.08 H1.2 (Manpower) ≥ 2 years 38 0.26 0.11
2.13 0.01 1.66
< 6 man-months 47 1.07 2.12 H2.1 (Duration) ≥ 6 man-months 46 0.25 0.11
3.757 0.0002 1.68
< 6 man-months 47 0.45 0.13 H2.2. (Manpower) ≥ 6 man-months 46 0.23 0.042
3.57 0.0003 1.66
< 4 years 54 0.63 0.65 H3.1 (Duration) ≥ 4 years 37 0.37 0.22
1.92 0.03 1.66
< 4 years 54 0.32 0.07 H3.2 (Manpower) ≥ 4 years 37 0.30 0.06
0.41 0.34 1.66
1 and 2 disciplines 42 0.88 1.30 H5.1 (Duration) ≥ 3 disciplines 51 0.48 1.22
1.7 0.04 1.66
1 and 2 disciplines 42 0.43 1.38 H5.2 (Manpower) ≥ 3 disciplines 51 0.26 0.05
2.465 0.008 1.67

20
Table 2. Results of the one-way ANOVA
Hypothesis
Groups No of
Observations
Mean
Variance
F Value
P Value
Fcrit Team size <4 persons
20 1.38 3.78
Team size ≥4 and < 6 persons
23 0.72 0.86
Team size ≥6 and < 10 persons
24 0.35 0.21
H4.1
Team size ≥10 persons
26 0.34 0.27
4.49
0.005
2.71
Team size <4 persons
20 0.52 0.19
Team size ≥4 and < 6 persons
23 0.36 0.08
Team size ≥6 and <10 persons
24 0.25 0.05
H4.2
Team size ≥10 persons
26 0.25 0.04
4.02
0.009
2.71
21
Table 3. Scales for probability and impact estimations [35,38]
Probability
Very low probability of risk to happen (%0-%5)
The risk less likely to happen than not (%6-%20)
The risk is just as likely to happen as not (%21-%50)
The risk is more likely to happen than not (%51-%90)
The risk will happen almost definitely (%91-%100)
Scale
1
2
3
4
5
Quality Impact (Quality is defined here as the conformance quality of the
project end item with its technical specifications)
Quality degradation barely noticeable
Quality degradation noticeable but acceptable
Project end item is effectively not usable
1
2
3
4
5
Schedule Impact
Insignificant schedule slippage
Overall project slippage <10%
Overall project slippage 10-20%
Overall project slippage 20-50%
Overall project slippage >50%
1
2
3
4
5
Cost Impact
Insignificant cost increase
<5% cost increase
5-10% cost increase
10-20% cost increase
>20% cost increase
1
2
3
4
5

22
Table 4. Risk severity matrix [35]
5 19 14 9 4 1
4 21 16 11 6 2 A
3 23 C 18 13 B 8 3
2 24 20 15 10 5
1 25 22 17 12 7
Prob
abili
ty o
f Occ
urre
nce
(Lik
elih
ood)
1 2 3 4 5
Overall Impact A=High severity, B=Moderate severity, C=Low severity.
23
Appendix 1. The Post Project Analysis Process Flow Chart
Will the project be analyzed in detail?
Document review and preparation for the interviews
Interviews with the project leader, team members and related people
Organiziation of meeting notes, decoding of tape records, and preparation of the first draft
Preparation of the Project Summary Report
Y
Determination of lessons learned during the end of the project and documenting recommendations for future
Project management training activities
KNOWLEDGE BASE
Data Flow Process Flow
N N

24
Appendix 2. The Risk Management Process Flow Chart
RISK IDENTIFICATION Tools: Risk checklists Cause-effect diagrams
RISK ANALYSIS Tools: Qualitative estimations
RISK RESPONSE DEVELOPMENT Tools: Knowledge base search
RISK MONITORING AND CONTROL Tools: Periodic meetings Monitoring risk symptoms from database
PROJECT CLOSEOUT PHASE Tools: Closeout meetings (Determination of lessons learned)
KNOWLEDGE BASE
• Risk Codes • Identified Risks • Explanation • Risk Owner • Planned
Responses • Priority
• Risk Codes • Realised Risks • Applied Responses • First and Last Priorities and
Impacts • Risk Owner • Recommendations for
Future

25
Appendix 3. The Risk Checklist Risk Categories Risk Classes Risk Causes
Use of new-to-the-firm technology Maturity level of the technology used Use of new-to-the-world technology
High uncertainty in technical content Complexity and uncertainty of the technical content Difficulty in defining the project scope
Technical
Inadequacy of the technical personnel
Absence of qualified people (person who has the experience and knowledge about the technology) Inadequacy of labour units for this project because of overloading Inadequacy of laboratories / equipment because of overloading No experience with the use of the laboratories / equipment Equipment breakdown / lack of maintenance
Inadequate resources
Reduction in project team size
Resource Management
Changes in team members Turnover in project team Inadequacy of communication with upper management
Inadequate communication
Inadequacy of communication within the project team
Changes in strategy / project priorities
Changing objectives / expectations
Inexperienced project leader
Non-technical Internal (Managerial – Project Management)
Inadequate project experience Lack of teamwork experience in the project team No previous experience of working together with the customer
Uncertainty in the communication with the customer Customer violating the written and oral
agreements / understandings Frequent change requests by the customer Uncertainty in customer
requests Project aborted by the customer
Customer Related
Project budget Payment delays / cash flow irregularities No previous experience of working together with the supplier / consultant Difficulty in material procurement Limited service alternatives Interruption of provided services
Material / service acquisition
Problems in deliveries New technologies developed by the competitors
External- Predictable
Competitive environment
Changes in standards and regulations Natural hazards Earthquake, flood, etc. National / international economic crises
Economic crises and exchange rate fluctuations affecting the project Changes in international relations affecting the project
External- Unpredictable
International relations and legal regulations
Legal and bureaucratic obstructions affecting the project