DESIGN OF PIPE DISTRIBUTION NETWORK IN THE COMMAND … · design of pipe distribution network in...
108
DESIGN OF PIPE DISTRIBUTION NETWORK IN THE COMMAND OF A CANAL OUTLET FOR OPTIMAL CROP PLANNING M. Tech. (Agril. Engg.) THESIS By Rahul Raghuwanshi DEPARTMENT OF SOIL AND WATER ENGINEERING SV COLLEGE OF AGRICULTURAL ENGINEERING AND TECHNOLOGY & RESEARCH STATION FACULTY OF AGRICULTURAL ENGINEERING INDIRA GANDHI KRISHI VISHWAVIDYALAYA RAIPUR (C. G.) 2016
Transcript of DESIGN OF PIPE DISTRIBUTION NETWORK IN THE COMMAND … · design of pipe distribution network in...

DESIGN OF PIPE DISTRIBUTION NETWORK IN THE
COMMAND OF A CANAL OUTLET FOR OPTIMAL
CROP PLANNING
M. Tech. (Agril. Engg.) THESIS
By
Rahul Raghuwanshi
DEPARTMENT OF SOIL AND WATER ENGINEERING
SV COLLEGE OF AGRICULTURAL ENGINEERING
AND TECHNOLOGY & RESEARCH STATION
FACULTY OF AGRICULTURAL ENGINEERING
INDIRA GANDHI KRISHI VISHWAVIDYALAYA
RAIPUR (C. G.) 2016
DESIGN OF PIPE DISTRIBUTION NETWORK IN THE
COMMAND OF A CANAL OUTLET FOR OPTIMAL
CROP PLANNING
Thesis
Submitted to the
Indira Gandhi Krishi Vishwavidyalaya, Raipur
by
Rahul Raghuwanshi
IN PARTIAL FULFILMENT OF THE REQUIREMENTS FOR
THE DEGREE OF
Master of Technology
in
Agricultural Engineering
(Soil and Water Engineering)
Roll No: 220114032 ID No. –20141520490
JUNE, 2016


i
Acknowledgements
It takes a lot of good people to make a good project .If this proves to be a
good project, which I hope it will, credits are due to many.
I wish to express my deep sense of respect and indebtedness to my major
adviser Er. Dhiraj Khalkho, Scientist/Assistant Professor, Department of Soil and
Water Engineering, SVCAET & RS, Faculty of Agricultural Engineering, IGKV,
Raipur, for his valuable, talented, inspiring, constructive criticism, and ceaseless
encouragement provided during the entire project work.
I feel great pleasure in expressing my sincere and deep sense of gratitude to
Er. P. Katre, Assistant Professor, Department of Soil and Water Engineering, for
his valuable guidance, constant inspiration and moral support throughout the
research work.
I am very thankful to senior member of the faculty Dr.V.K. Panday, Dean,
SVCAET & RS ,Dr. M.P. Tripathi Prof. & Head of Department of Soil and Water
Engineering, Dr B.P. Mishra Head of Department Farm Machinery and Power and
Dr S. Patel Head of Department of Agricultural Processing and Food Engineering,
Faculty of Agricultural Engineering, IGKV, Raipur, for their constant
encouragement during project completion.
I have a great pleasure in expressing my sincere thanks to other advisory
committee members, Dr. M.P. Tripathi Dr. R.K. Naik, Dr. V.N. Mishra, and Dr.
R.R. Saxena for their priceless guidance, worthy suggestions and constant
encouragement throughout the project.
I am extremely thankful to all the members of Faculty of Agricultural
Engineering including,Dr. R. K. Sahu, Dr. A .K. Pali, Er. A. P. Mukherjee, Dr.
JItendra Sinha, Dr. A. K. Dave, Er. M. Quasim Dr. S. V. Jogdand, Dr. V.M. Victor,
Er.P.S. Pisalkar, Er.N. K. Mishra,Dr. D. Khokhar, Er. A. A. Kalne, and Er. Yatnesh
Bisen, for their time to time co-operation during the course of study.


iii
TABLE OF CONTENTS
Chapter Title Page No.
ACKNOWLEDGEMENTS I
LIST OF TABLES VI
LIST OF FIGURES VII
LIST OF NOTATIONS VIII
LIST OF ABBREVIATIONS IX
I INTRODUCTION 1
II REVIEW OF LITERATURE 5
2.1 Irrigation Survey 5
2.2 Pipe Distribution Network 6
2.3 Crop Planning 12
III MATERIALS AND METHODS 18
3.1 Details of the Study Area 18
3.1.1 Study area 18
3.1.2 Agro climate 18
3.1.3 Land use pattern 20
3.1.4 Soils 20
3.2 Data Collection 21
3.3 Software used 22
3.4 Site selection 22
3.5 Irrigation facility of the study area 22
3.6 Survey of the Study Area 23
3.6.1 Topographic survey 23
3.7 Losses Estimated through Questionnaire Information 25
3.7.1 Estimation of demand of water for irrigation 25
3.7.2 Water required by crops during kharif 25
3.7.3 Determination of effective rainfall for paddy 25
3.7.4 Water required by crops during rabi 26
3.7.5 Total water requirement 26
3.7.6 Estimation of volume of water supplied from
outlet
26
3.8 Application efficiency and losses 26
3.9 Scenario development for increasing conveyance
efficiency
27
3.10 Underground Pipeline system 27
3.11 Design of underground pipeline system 28
3.11.1 Selection of type of system 28
3.11.2 Pipe material of the pipe line 28
3.11.3 Design velocity 28
3.11.4 Diameter of pipeline and frictional head losses 29

iv
3.11.4.1 Darcy-Weisbach equation 29
3.11.4.2 Reynolds number 30
3.11.4.3 Colebrook White- equation 30
3.11.4.4 Hazen-Williams formula 31
3.11.5 Minor losses 31
3.11.6 Design of ancillary structures 32
3.11.6.1 Gravity inlet 32
3.11.6.2 Air vent 33
3.11.6.3 Outlets 33
3.12 Optimal crop planning 34
3.12.1 Productivity, net benefit and cost of cultivation
of crops 34
3.12.2 Objective function 34
3.12.3 Water constraint 35
3.12.4 Area availability constraint 35
3.12.5 Affinity constraint 36
3.12.6 Nutritional constraint 36
3.12.7 Case 1 (Existing Scenario) 36
3.12.8 Case 2 (Proposed scenarios) 37
3.12.9 Case 3 38
3.12.10 Case 4 38
3.12.11 Case 5 39
IV RESULTS AND DISCUSSION 41
4.1 Site Selection 41
4.2 Topographic Survey 42
4.3 Irrigation Facility of the Study Area 42
4.3.1 Field observation: 43
4.4 Losses Estimation 44
4.4.1 Irrigation required in kharif season 44
4.4.2 Irrigation required in rabi season 44
4.4.3 Total irrigation demand 45
4.4.4 Estimation of volume of water delivered 45
4.4.5 Assessment of water losses 45
4.4.6 Application Efficiency 46
4.4.7 Improving conveyance efficiency by providing
closed conduit canal network 46
4.5 Design of Underground Pipeline System 47
4.5.1 Selection of type of system 47
4.5.2 Pipe material of the pipe line 47
4.5.3 Diameter of pipeline and frictional head losses 48
4.5.3.1 Trial -1 48
4.5.3.1.1 Method -(1) Darcy-
Weisbach equation 48
4.5.3.1.2 Method- (2) Hazen-Williams
equation 49
4.5.3.2 Trial-2 51

v
3.5.3.2.1 Method - (1) Darcy-
Weisbach equation 51
3.5.3.2.2 Method- (2)Hazen-
Williams equation 52
4.5.4 Head loss due to valves and fittings 54
4.5.5 Bed slope of pipeline 54
4.5.6 Energy line and outlets 55
4.5.7 Design of ancillary structures 56
4.5.7.1 Gravity inlet 56
4.5.7.2 Outlets of the system 58
4.5.7.3 Air vents 60
4.6 Scenario Development for Crop Diversification 62
4.7 Optimal Crop Planning 62
4.8 Comparison between Existing and Suggested Plan 63
V SUMMARY AND CONCLUSIONS 65
VI BIBLIOGRAPHY 68
VII APPENDICES 73
RESUME

vi
LIST OF TABLES
Table Title Page No.
3.1 Number of days of canal flow in a particular year in kharif
season
22
3.2 Number of days of canal flow in a particular year in rabi
season
23
3.3 Net irrigation requirements of different crops in kharif 25
3.4 Water requirements of different crops 26
3.5 Net profit of different crops 34
4.1 Field elevations 42
4.2 Values of head loss with corresponding distance by Darcy's
formula with pipe diameter 160 mm
49
4.3 Values of head loss with corresponding distance by Hazzen-
williams formula with pipe diameter 160 mm
50
4.4 Values of head loss with corresponding distance by Darcy's
formula with pipe diameter 200 mm
52
4.5 Values of head loss with corresponding distance by Hazzen-
williams formula with pipe diameter 200 mm
53
4.6 Depth of pipeline below ground level (m) 55
4.7 Table shows reduced level of outlet and water surface 56
4.8 Land allocation (in ha) and maximum benefit from different
crops
62
4.9 Land allocation for different crops (in %) and maximum
benefit
63
4.10 Comparison between present and suggest pattern 64

vii
LIST OF FIGURES
Figure Title Page
3.1 Study area at Munrethi village, Raipur 19
3.2 Topographic survey of the study area 24
4.1 Topography of study area 43
4.2 Average days in a month of canal flow in kharif season 44
4.3 Average days in a month of canal flow in rabi season 45
4.4 Irrigation requirement in Rabi and Kharif 46
4.5 Volume of water lost in Rabi and Kharif 47
4.6 Application efficiency and losses 48
4.7 Head loss by Darcy's equation with diameter 160 mm 49
4.8 Head loss by Hazzen-williams equation with diameter 160mm 50
4.9 Head loss by Darcy's equation with diameter 200 mm 51
4.10 Head loss by Hazzen-williams equation with diameter 200 mm 53
4.11 Different bed slope 54
4.12 Outlets of the system 55
4.13 Gravity inlet 58
4.14 Diversion box and outlet 60
4.15 Air valve 60
4.16 Layout of pipe distribution network 61

viii
LIST OF NOTATIONS
Friction factor
e Roughness of pipe
Kinematic viscosity of irrigation water
C Hazen – Williams Coefficient of relative roughness of the
pipe material
˚C Degree Celsius
% Percentage
'' Inch
° Degree
' Minute
'' Second

ix
LIST OF ABBREVIATIONS
MSP Minimum Support Price
Qt Quintal
PDN Pipe Distribution Network
CDN Canal Distribution Network
BGL Below ground level
Qt ha-1
Quintal per hectare
Rs. Rupees
Rs ha-1
Rupees per hectare
Rs Qt-1
Rupees per quintal
et al. Et alibi
Ha Hectare
Cm Centimetre
M Meter
m2 Square meter
m3 Cubic meter
m3 s
-1 Cubic meter per second
Lps Litre per second
ha-cm Hectare centimetre
ha-m Hectare metre Agril. Agricultural Agril. Engg. Agricultural Engineering PVC Polyvinyl chloride
IWMI International Water Management
Institute
USDA United States Department of Agriculture
CCI Close Conduct Irrigation
NLBC Nasic Left Bank Canal
Cusec Cubic feet per second
Km-h-1
Kilometer per hour
m s-1
Meter per hour

xi
irrigation potential created and utilized is 1.809 Mha and1.151 Mha in
Chhattisgarh. Thus there is gap between irrigation potential created and utilized,
and it is up most important to minimize the gap. This can be achieved by use of
pipe distribution network. Thus, the objective of this study is to emphasis on the
use of Pipe Distribution Network instead of Canal Distribution Network in the
command area of irrigation project to improve water use efficiency. The growing
demand of food for large population can only be met by optimum utilization of
available water and appropriate allocation of available land to different crops.
Therefore, a study entitled “Design of pipe distribution network in the command of
a canal outlet for optimal crop planning” was undertaken by Department of Soil and
Water Engineering, SVCAET & RS, FAE, Raipur during 2015-16. For planning of
pipe distribution network Munrethi village in Raipur district of Chhattisgarh, which
lies in the canal command of kurud irrigation tank was selected for this study. The
average rainfall of Raipur district was reported to be 1219 mm which is mostly
received between middle of June to end of September with occasional showers
during winter. A low-lying deep bluish black soil (Kanhar) with high moisture
retention capacity was dominated in the study area.
In present study, the water losses were estimated with the help of data
collected through personal interview with farmers of the study area using
questionnaire. Presently, field to field irrigation is practiced which restricts the
farmers to cultivate paddy during both kharif as well as rabi season. It was found
that 648 ha-cm water is required to delivered to apply 54 cm depth (CWR-ER) of
water during the growing period of kharif crop. However, 1008 ha-cm was
estimated to be delivered which means 360 ha-cm water is lost and drained
unutilized. similarly during rabi season 1440 ha-cm water is required for 120 cm
depth of irrigation. The actual water delivered was found to be as high as 2244 ha-
cm, further the estimated losses was found to be water loss of 804 ha-cm during
rabi season. The application efficiency of the chak of 12 ha was estimated to be
64.18 % and losses were found to be 35.82%.
Adoption of buried pipeline distributary systems had lead to the reduction in
water conveyance and distribution losses, reduction in the land area taken up by the
distribution system and reduction in the maintenance and operating costs of the

xii
irrigation system. A chak of 12 ha having 640m length was selected for design of
underground pipe distribution network and controllable turnout structures. The inlet
structure of rectangular shape having 1m2 area and 2.7m height is designed just
below the canal bank to trap silt. A screen is fixed to the inlet through that water
enters into underground pipeline to keep the thrash out of pipeline. A 20 cm
diameter pipe is suitable for delivering water on bed slope of 0.8% up to the last
point i.e., 560 m away from the inlet. The head loss calculated from Darcy-
Weisbach equation and Hazzen-Williams equation is 2.63 m and 1.77 m. The head
loss found to be less than that of available head of 4.77 m. Air vents of 5 cm
diameter were also provided at appropriate points to release entrapped air. Eight
number of outlets were proposed in the design of the underground pipeline system.
The outlets deliver water to a diversion box of 45 × 45 × 45 cm. Two outlets of 200
mm diameter were proposed in each diversion box, one for right hand side of fields
and other for left side fields for delivering irrigation water directly to the farmers
fields. This conveyance and distribution irrigation system overcomes the problem
of field to field irrigation system.
In this study a Linear Programming model was developed to maximize the
net returns of the farmers considering, available land and water resources, crop
water requirement and net return from different crops. A suitable crop plan which
includes crops such as cereals, pulses, and oilseed were suggested. On the basis of
this crop plan the outcome can be increased by Rs. 51793.00 as compared to
existing cropping pattern, moreover the ample amount of precious water, 1.30 ha-
cm (20%) in kharif and 5.82 ha-cm (40 %) during rabi could be saved and utilized
for additional area under crop.


xiv
ufydk forj.k ra= dh ;kstuk cukus ds fy, NRrhlx<+ ds jk;iqj ftys ds eqjSaBh xkWao dks tks dq:n
flapkbZ VSad dh ugj dekaM esa fufgr gS] bl v/;;u ds fy, pquk x;k FkkA jk;iqj ftys dh vkSlr o"kkZ
1219 feeh Fkh] tks T;knkrj twu ds e/; ls flracj ds var rd izkIr gksrh gSA mPp ueh cuk, j[kus
dh {kerk okyh xgjh uhyh&dkyh feV~Vh ¼dUgkj½ dk v/;;u {ks= esa izHkqRo FkkA
orZeku v/;;u esa] ikuh dh gkuh dk vuqeku fdlkuksa ds lkFk iz’ukoyh ,oa O;fDrxr
lk{kkRdkj ds ek/;e ls ,d= vkadM+ksa dh enn ls yxk;k x;k FkkA orZeku esa [ksr ls [ksr flapkbZ fof/k
fdlkuksa }kjk viukbZ xbZ gS] tks mUgsa jch vkSj [kjhQ nksuks l=ksa esa /kku ysus ds fy, izfrcaf/kr djrh
gSA ;g ik;k x;k fd [kjhQ dh Qly ds nkSjku ikuh dh 54 lseh xgjkbZ ykxw djus ds fy, 648
gsDVs;j lseh ikuh forfjr djus dh vko’;drk FkhA gkykafd 1008 gsDVs;j lseh forfjr fd;k x;k Fkk]
ftlesa fd 360 gsDVs;j lseh ikuh dh gkfu dk vkdyu fd;k x;kA blh rjg jch l= ds nkSjku 120
lseh flapkbZ dh xgjkbZ fy, 1440 gsDVs;j ls-eh ikuh vko’;drk FkhA okLrfod :i esa 2244 gsDVs;j
lseh ikuh forfjr fd;k x;k ftlesa dh 804 gsDVs;j lseh ikuh dh gkfu dk vkdyu fd;k x;kA 12
gsDVs;j ds pd dh mi;ksx n{krk 64-18 izfr’kr vkSj gkuh 35-82 izfr’kr gksus dk vkdyu fd;k x;kA
Hkwfexr ufydk forj.k iz.kkyh viukus ls ikuh okgu vkSj forj.k uqdlku esa deh forj.k vkSj
flapkbZ iz.kkyh ds j[kj[kko vkSj ifjpkyu ykxr esa deh] flapkbZ iz.kkyh }kjk Hkwfe {ks= vf/kxzg.k esa deh
vkfn ykHk izkIr gq,A 640 eh- yackbZ okys 12 gsDVs;j ds ,d pd dks Hkwfexr ufydk forj.k ra= dh
fMtkbu ds fy, pquk x;k FkkA ugj rV ij 1 oxZ eh- {ks=Qy vkSj 2-7 ehVj ÅWpkbZ okyk vk;rkdkj
vkdkj dh izos’k lajpuk cukbZ x;h gSA xkn dks Hkwfexr ikbi ykbu esa izos’k ls jksdus ds fy;s NUuh
yxkbZ xbZ A 20 ls-eh O;kl dh ufydk izos’k ls vafre fcUnq ;kfu 560 ehVj dh nwjh rd 0-8 izfr’kr
ds <yku ij fcNkbZ xbZA ikuh igqpkus ds fy, mi;qDr gSaA nkc gkfu dh x.kuk MklhZ&folcsp vkSj
gstu&fofy;El lehdj.k ls dh x;h gS tks Øe’k% 2-63 eh vkSj 1-77 eh gSaA nkc gkfu] 4-77 eh ds
miyC/k nkc dh rqyuk esa de gSA QWalh gok fudkyus ds fy, 5 lseh O;kl dh gok ufy;ka Hkh mfpr
fcanqvksa ij iznku dh x;h gSA Hkwfexr ufydk iz.kkyh ds fMtkbu esa vkB fudkl izLrkfor gSA fudkl
45 x 45 x 45 lseh ds ifjorZu+ ckWDl esa ikuh fudyrk gSA fdlkuksa ds [ksrksa esa lh/ks ikuh igqpkus ds
fy, izR;sd ifjorZu+ ckWDl esa 200 feeh O;kl ds 2 fudkl izLrkfor fd;s x;s gS] ,d nkfgus vkSj nwljk
ckbaZ vksjA bl okgu vkSj forj.k flapkbZ iz.kkyh ls [ksr ls [ksr flapkbZ iz.kkyh dh leL;k dks nwj fd;k
tk ldrk gSA
bl v/;;u esa miyC/k Hkwfe vkSj ty lalk/kuksa] Qly ikuh dh vko’;drk vkSj fofHkUu Qlyksa
ls 'kq) ykHk dks /;ku esa j[kdj 'kq) ykHk dks vf/kdre djus ds fy, ,d js[kh; dk;Zdze ekWMy
fodflr fd;k x;k FkkA vukt] nygu vkSj frygu Qlyks dks lfEefyr dj ,d mi;qDr Qly
;kstuk dk lq>ko fn;k x;k gSA bl Qly ;kstuk ds vk/kkj ij ekStwnk Qly i)fr dh rqyuk esa ykHk
51793-00 :i;s rd c<+k;k tk ldrk gSA blds vykok cgqeqY; ikuh] [kjhQ esa 1-30 gsDVs;j lseh ¼20
izfr’kr½ vkSj jch ds nkSjku 5-82 gsDVs;j lseh ¼40 izfr’kr½ cpk;k vkSj vfrfjDr {ks= ds fy, mi;ksx
fd;k tk ldrk gSA

1
CHAPTER-I
INTRODUCTION
Water is life for existence of all living being on the earth. Water ensures
food security, feed livestock, maintain organic life and fulfill domestic and
industrial needs (Kolhe, 2012). The population of mankind is increasing at
distressing rate and human is tapping natural resources to cater his need. The
available resources including water and food are falling shorter to cope up with the
need of mankind. To overcome this problem it is very essential to conserve the
water in many ways and utilize it so that food production should be sufficient to
serve for mankind need at reasonably low cost. To increase food production from
agriculture land, irrigation is one of the tool to conserve the water and utilize it for
agriculture production. Irrigation of agriculture land is done using various methods
such as flow through open channel, lift irrigation, drip irrigation, underground
pipelines etc. (Satpute et al. 2015). Irrigation sector is the biggest consumer of
water as more than 80% of available water resources in India are being presently
utilized for irrigation purposes.
Presently the annual agricultural output is just sufficient to sustain our food
grain requirement. To meet the challenge of regular expansion of size of
population, the productivity of the water and land has to be increased, as both the
resources are limited. Water is a major and vital input to increase agricultural
productivity. Hence it is a Supplying water to the crop at right time, right place and
right quantity is the main objective of good irrigation management, but in case of
surface water reservoirs, the irrigation water is conveyed to the farm with the
conventional wide spread open channel water distribution network. In fact, the
above system is not capable to meet time based crop water need due to depletion of
water use efficiency of the system with age. As the time passes lot of deficiencies
including low water use efficiency get involved in this type of network ( Bhalage et
al., 2015).
Ultimate irrigation potential of India is 140 million hectare. Irrigation
potential to the tune of about 102 million hectare has been created through

2
major/medium/minor surface water irrigation projects and use of ground water.
However, potential utilization is about 87 million hectare only. However, the
average water use efficiency of Irrigation Projects is assessed to be only of the
order of 30 - 35%. Thus there is gap between irrigation potential created and
utilized, and it is up most important to minimize the gap. This can be achieved by
use of pipe distribution network (Kolhe, 2012). The following major reasons have
been identified for low Water Use Efficiency of Irrigation projects. (1) Poor or no-
maintenance of canals/distributaries/minors of irrigation systems resulting in
growth of weed & vegetation, siltation, damages in lining etc. (2) Distortion of
canal sections due to siltation or collapse of slopes resulting in some channels
carrying much less and some other channels carrying much more than their design
discharges. (3) Non Provision of lining in canal reaches passing through permeable
soil strata. (4) Leakages in gates and shutters. (5) Damaged structures. (6) No
regulation gates on head regulators of minors causing uneven distribution of water.
(7) Over irrigation due to non-availability of control structures and facilities for
volumetric supply of irrigation water to farmers. (8) Poor management practices.
(9) Lack of awareness among farmers about correct irrigation practices and
cropping pattern.
Engineering, agronomic, organizational and management aspects generally
control the performance of an irrigation scheme. None the less, the water
conveyance and distribution systems are of prime importance in irrigation projects.
These systems are mostly of earthen open channels in minor irrigation systems and
suffer from serious problems such as, low conveyance and distribution efficiencies,
low command areas and high maintenance costs. About 2% to 4% of the cultivable
land area is taken up by the open channel distribution system ( Michael, 1978).
The objective of this study is to emphasis on the use of Pipe Distribution
Network (PDN) instead of Canal Distribution Network (CDN) in command area of
irrigation project to improve efficiency of water use. By virtue of PDN the water
use efficiency can be improved to 70 to 80 % from existing efficiency of 25 to 40
%. Thus there is about two to three times increase in the water use efficiency for
irrigation, which means that there will be 55 to 65 % improvement in overall water
use efficiency as irrigation itself is 80% shareholder in water use. In other words,
3
from the same reservoir, double the command areas could be irrigated, or additional
equal volume of water is made available which can be distributed to another
purposes (Kolhe, 2012).
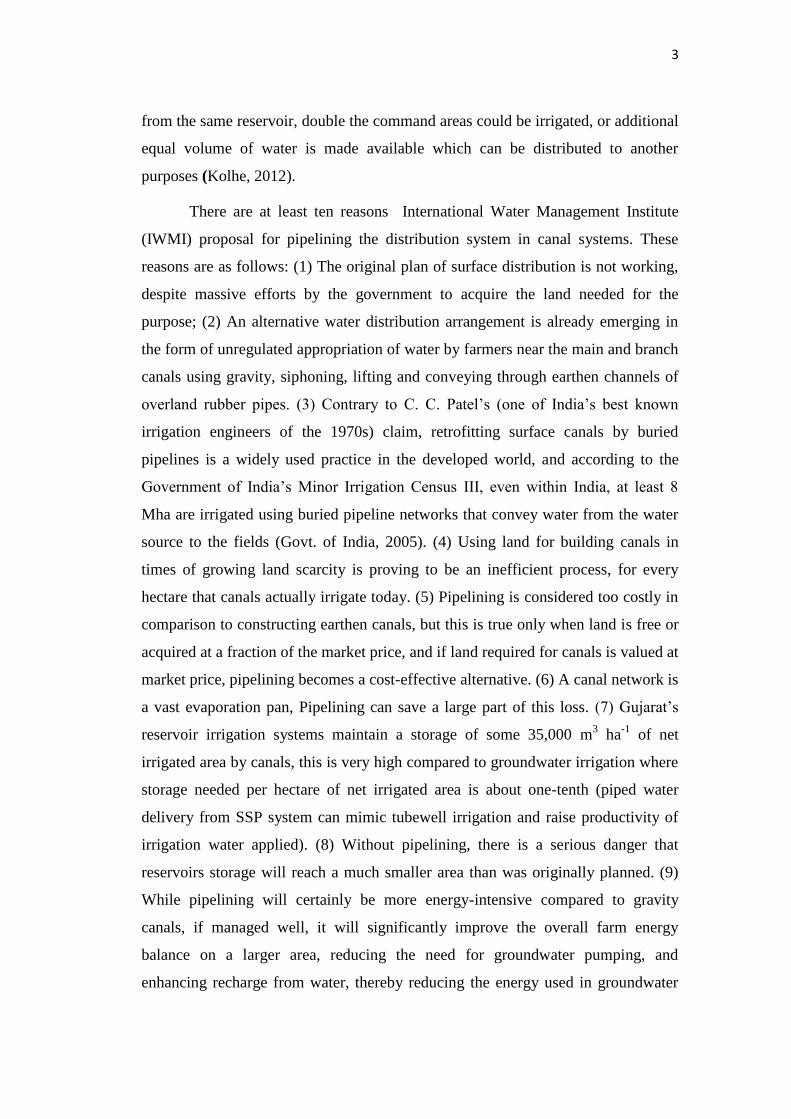
There are at least ten reasons International Water Management Institute
(IWMI) proposal for pipelining the distribution system in canal systems. These
reasons are as follows: (1) The original plan of surface distribution is not working,
despite massive efforts by the government to acquire the land needed for the
purpose; (2) An alternative water distribution arrangement is already emerging in
the form of unregulated appropriation of water by farmers near the main and branch
canals using gravity, siphoning, lifting and conveying through earthen channels of
overland rubber pipes. (3) Contrary to C. C. Patel’s (one of India’s best known
irrigation engineers of the 1970s) claim, retrofitting surface canals by buried
pipelines is a widely used practice in the developed world, and according to the
Government of India’s Minor Irrigation Census III, even within India, at least 8
Mha are irrigated using buried pipeline networks that convey water from the water
source to the fields (Govt. of India, 2005). (4) Using land for building canals in
times of growing land scarcity is proving to be an inefficient process, for every
hectare that canals actually irrigate today. (5) Pipelining is considered too costly in
comparison to constructing earthen canals, but this is true only when land is free or
acquired at a fraction of the market price, and if land required for canals is valued at
market price, pipelining becomes a cost-effective alternative. (6) A canal network is
a vast evaporation pan, Pipelining can save a large part of this loss. (7) Gujarat’s
reservoir irrigation systems maintain a storage of some 35,000 m3 ha
-1 of net
irrigated area by canals, this is very high compared to groundwater irrigation where
storage needed per hectare of net irrigated area is about one-tenth (piped water
delivery from SSP system can mimic tubewell irrigation and raise productivity of
irrigation water applied). (8) Without pipelining, there is a serious danger that
reservoirs storage will reach a much smaller area than was originally planned. (9)
While pipelining will certainly be more energy-intensive compared to gravity
canals, if managed well, it will significantly improve the overall farm energy
balance on a larger area, reducing the need for groundwater pumping, and
enhancing recharge from water, thereby reducing the energy used in groundwater

4
pumping; and (10) Pipelining opens up huge possibilities for public-private
partnerships and farmer participation in irrigation management in ways that surface
canals have failed to provide, and it would majorly enhance the financial, economic
and environmental sustainability, spreading its benefits far and wide through
thousands of irrigation cooperatives that are likely to come up if encouraged and
supported, as they have been in Maharashtra.
In view of above facts the present study has been planned to assess the
losses in present irrigation method and use of pipe distribution network to reduce
the conveyance losses. The attempt has also been made for crop planning as per
availability of water.
The specific objectives of the proposed study are:
1. To asses and study existing water distribution system in the study area.
2. To design a pipe distribution network for the study area.
3. Optimal crop planning based on designed pipe distribution system.

5
CHAPTER-II
REVIEW OF LITERATURE
This chapter deals with the salient features of the work done at difference
places relevant to the present study. The important results obtained, methodology
followed, various tools and practices adopted by different research workers as
related to the objectives of the present study have been summarized in brief.
2.1 Reviews on irrigation surveys
Shaikh et al. (2015) was conducted a study to demonstrate the applicability
and efficiency of an irrigation survey method for digging up reliable information to
estimate application losses. A sample of 220 tertiary channels was drawn randomly
to get information from the growers of the Mirpurkhas subdivision, Jamrao canal
irrigation scheme of Pakistan. Pre and post soil moisture status based practical
measurements of losses were also carried out at 20 different sites. The results
showed that the irrigation methods and soil types have a pronounced effect on
application losses whereas crop type has no effect on application efficiency. The
survey based losses results were validated against measured losses whilst values
available in literature compared favorably. Based on the encouraging results of his
study, he concluded that irrigation survey studies are useful in understanding the
irrigation scheme losses pattern which in turn provide opportunities for
improvement.
Tindula et al. (2011) have conducted a study to collect information on the
irrigation methods. The results were compared with earlier surveys to assess trends
in cropping and irrigation methods. A one-page questionnaire was developed to
collect information on irrigated land by crop and irrigation method. The
questionnaire was mailed to 10,000 growers in California who were randomly
selected from a list of 58,000 growers by the USDA National Agricultural Statistics
Service. Results were found that, From 1972–2010, the planted area has increased
from 15 to 30% for orchards and from 6 to 15% for vineyards. The area planted
with vegetables has remained relatively static, whereas that planted to field crops
has declined from 67 to 41% of the irrigated area. The land irrigated with low-

6
volume (drip and micro-sprinkler) irrigation has increased by approximately 38%,
whereas the amount of land irrigated by surface methods has decreased by
approximately 37%.
Berrada, et al. (2001) was conducted a survey through a questionnaire
developed by Colorado State University scientist in the fall of 1996 to assess
irrigation water management in the Full Service Area (FSA) of the Dolores Project.
Forty four percent of the farm operators in the FSA responded to the survey. An
encouraging outcome of the survey is the large number of respondents who
indicated the need for information on irrigation equipment innovations, irrigation
scheduling, and other information that could help them conserve water and get the
most out of their water allocation.
2.2 Reviews on pipe distribution network
Satpute et al. (2012) says that conventionally on almost all command area
of irrigation projects in India, the water for irrigation is supplied through the
network of turnout, sub minor, distributor, branch canal and main canal. Here,
almost 50 % of water is lost during the storage and distribution. There are many
disadvantages of the conventional system of irrigation. Their design overall project
efficiency (OPE) of the conventional system is obliviously low and ranges between
41 to 48 % only. Actual OPE, is only 20-35 % in most of the irrigation projects due
to many difficulties and constraints. From his study, it is concluded that as compare
with traditional open channel gravity irrigation system, in PDN Water application
efficiency on Farm is 85 %, Efficiency of lateral is 95 %, Efficiency of sub-main is
98% and Efficiency of Main is 98 %. which shows that there is potential increase in
efficiency of overall system. Likewise culturable command area which is 643 ha
was covered under irrigation using open channel irrigation system increased by 2
times, i.e. 1207 ha of area now being irrigated using PDN system.
Mniruzzaman, et al.(2002) assess the performance of PVC and plastic pipe
water distribution system for command area development and irrigation time saving
by minimizing water losses. In the system, total discharge from deep tube well
(DTW) was diverted to two or three directions by using PVC and plastic pipe of
different length and diameters. Technical and economic feasibility of the system

7
were also evaluated. The conveyance loss was 2.8 to 9.5% in PVC and plastic pipe
whereas in earthen channel it varied from 30 to 33% in silty-clay loam soil, which
indicate that on an average 83% water can be saved by improved pipe distribution
system. By improving the pipe system about 37 to 41% command area was
increased in both locations. The BCR of the pipe irrigation system varied from 2.74
to 1.43 on the basis of the 15 to 45 % discount rates.
Kolhe (2012) carried out study on Optimal Utilization of Irrigation Water
by Use of Pipe Distribution Network (PDN) instead Of Canal Distribution Network
(CDN) in Command Area. The objective of the study is to emphasis on the use of
Pipe Distribution Network (PDN) instead of Canal Distribution Network (CDN) in
command area of irrigation project to improve efficiency of water use. By virtue of
PDN the water use efficiency can be improved to 70 to 80 % from existing
efficiency of 25 to 40 %. Thus there is about two to three times increase in the
water use efficiency for irrigation, which means that there will be 55 to 65 %
improvement in overall water use efficiency. This study based on the design of
PDN of Nagthana-2 Minor Irrigation (MI) project, located at Amravati district of
Maharashtra state, which was initially designed to irrigate Culturable Command
Area (CCA) of 600 ha by conventional CDN, and now planned for gravity PDN
and result implies that same volume of water could irrigate CCA of 1200. In his
study, focus is placed on the use of PDN instead of CDN in command area of
irrigation project to improve efficiency of water use. By virtue of PDN the water
use efficiency can be improved to 70 to 80 % from existing efficiency of 25 to 40
%.
Patel et al. (2014) carried out study in replacement of sub minors with
pressurized irrigation systems in canal command area. He says that there is no
possibility to irrigate the entire command area of SSP through conventional flow
irrigation. There is strong need for efficient and cost effective use of limited delta to
cover the entire command area where optimization of water use is the prime
consideration. It has been recognized that use of modern irrigation methods like
drip and sprinkler irrigation is the only alternative using Pressurized Irrigation
Network System (PINS). Pressurized Irrigation Network System (PINS) is
substitute arrangement for sub-minors and field channels in an open canal network.

8
Gadekar et al. (2015) carried out study on Nashik Left Bank Canal, Nashik.
The reach of this canal is 64 km which is running open to atmosphere through the
alluvial type of soil. The objective of study is to use closed circular conduits for the
entire 64 km reach of canal in place of open canal irrigation [OCI] network to
minimize the conveyance losses. They were estimated that 15.55 Mm3 of the water
within the stretch of 64 km can be saved by using CCI for NLBC. The benefit-cost
ratio as calculated for CCI system over OCI is 3.18 which is greater than 1,
therefore CCI system can be thought for the implementation so as to optimally
utilize the irrigation water.
Mtolera et al. (2014) studied Optimization of Tree Pipe Networks Layout
and Size, Using Particle Swarm Optimization, a commonly used design method for
irrigation pipe network (IPN). Layout and size often involves trial and error
approach. This makes it difficult to minimize capital investment and energy cost.
Study was done to optimize simultaneously size and layout of the irrigation pipe
networks using particle swarm optimization (PSO) technique. This technique was
linked to the MATLAB software to reduce the pipeline investment cost in irrigation
projects. The performance of PSO technique was tested and results were compared
with non-optimized (Step-by-step) and genetic algorithm optimization methods.
The proposed PSO technique with an increase in the search space showed a quick
response in the size of the swarm and the initial swarm compared to the non-
optimized (Step-by-step) design method and genetic algorithm.
Yousef and Faisal (2007) has done case study on the use of a semi-buried
poly–vinyl chloride (PVC) pipeline system in Al-Hassa Oasis, Saudi Arabia and its
contribution in improving water conservation. Deteriorated concrete canals at Al-
Hassa Irrigation Project, enhanced irrigation water losses, and the annual cost of
maintenance became un economical for the long term. The PVC pipes easy
maintenance, durability, modification, and flexibility, give them the potential to be
an economical alternative to replace a concrete lateral canal at Al- Hassa Irrigation
Project. PVC pipes were selected to construct a pipeline, 362 m in length. An
energy head, 2.7m of water, was used in determining the pipeline capacity and its
internal diameter, using the continuity equation. The conveyance and the

9
distribution efficiencies increased by 25.3 % and 25% respectively due to
installation of the pipeline.
Bhalage et al. (2015) reported that in India, the average water use efficiency
of Irrigation Projects is assessed to be only of the order of 30-35%. There is no
doubt that modernization of irrigation system like concrete lining to the inner
surface of the open channel, canal automation etc. will save water significantly. But
these techniques require huge capital investment, hence uneasy to adopt. On this
background it is appropriate to know the innovative, simple, low cost, easy to
adopt, water conveyance techniques used in the command of few irrigation projects
in Maharashtra. The findings show that pioneering techniques shall be implemented
in the command areas of irrigation projects as and where found techno
economically feasible to achieve improvement in crop yield and good water
management with high water use efficiency.
Srivastava et al. (2006) Reported that due to rolling topography and coarse
soil texture, the irrigation efficiency is quite poor. With rolling topography, a scope
exists to shift from surface irrigation to hybrid application system comprising
gravity fed pipe conveyance and surface irrigation for rice in monsoon season and
pumped pressurized irrigation system for post-monsoon crops. A system
comprising an adjunct reservoir, a common mainline with option of sprinkler and
drip at desirable location was designed for one outlet of a minor irrigation system
and was evaluated for its hydraulics and irrigation efficiency. The system reduced
the turbidity of the canal water from 11-16 NTU to 2-3 NTU in three stages i.e.
adjunct reservoir, catch well and filtration unit. It was found that the irrigation
efficiency of sprinkler and drip irrigation systems were 77.2% and 90.19%
respectively in comparison to 46.14% in case of surface irrigation system. The
uniformity coefficients of sprinkler irrigation system and emission uniformity of
drip irrigation system were 81.4% and 94.2% respectively. Thus the above system
can be successfully used in minor irrigation commands, for increasing irrigation
efficiency as well as yields. The economic analysis of the system indicated that if
the cost of hybrid drip and sprinkler irrigation system is less than Rs. 38,000.00 /ha,
then saving water through this system will be more economical.

10
Schulze et al. (1985) Reported that two types of irrigation delivery system
are currently being utilized in the Texas Rice Belt, (1) Conventional Surface Canals
and (2) Subsurface Pipeline Systems. Surface canals have been used for many years
and are commonly in used today. Water losses in surface canal delivery systems,
however, range from 25% to 65%, thus indicate potential advantages of a more
efficient water delivery system, such as an underground pipe line irrigation delivery
system.
Horrocks et al. (1994) Analysed new underground pipelines, which replaced
open-channel canals in the Duchesne River area of north-eastern Utah, provided the
necessary water pressure for local farmers in this arid region to switch to sprinkler
irrigation systems. The new pipelines and sprinkler irrigation systems greatly
reduced the amount of water previously lost to canal seepage and flood irrigation.
The new pipelines and sprinkler irrigation systems, however could be easily
damaged or clogged by debris and sediment carried in the water. Self-operating,
low-maintenance, and low-cost pipeline inlet facilities had to be designed to
remove sediment and debris from river water prior to its entering each new canal
pipeline. The unique inlet designed for the new Taddy Canal pipeline has been
operating successfully for four years. It was relatively inexpensive to construct, is
completely self-operating, and requires much less maintenance than mechanical
inlet facilities. It has functioned so well that there have been no reports of any
pipeline or sprinkler damage from water-carried sediment or debris.
Shah et al. (2010) carried out study on Sardar Sarovar Project (SSP) and
reported that against an ultimate potential of 1.8 million hectares (Mha), Gujarat’s
famous Sardar Sarovar Project (SSP) is irrigating less than 100,000 hectares (ha) by
gravity flow 5 years after the dam, and the main and branch canals were completed.
The key problem is that farmers who are to benefit from irrigation refuse to part
with the land needed to construct a surface distribution system below the outlet.
They argues that the government should consider a buried piped distribution system
as an alternative to sub-minors and field channels. The idea, however, is strongly
criticized by irrigation engineers, based on the poor track record of piped
distribution under government management.

11
Smout, I. K., (1999) reported that low-pressure pipelines on surface
irrigation distribution systems serve about 4.5% of the world irrigation area. The
main benefits compared with open channels are reduced leakage rates and land take
requirements, and flexibility in irrigation timing which is important for diversified
cropping systems. His research has shown that low-pressure buried-pipeline
distribution systems can make a major contribution to improving water
management in surface irrigation, both by reducing leakage from the distribution
system and by providing users with a more flexible irrigation supply. These
contributions, however, depend on the standard of survey, design and construction,
and the limited knowledge of buried-pipe distribution systems among irrigation
engineers is an important constraint. The resulting benefits also depend on the
management of the system, and on agricultural, economic and social factors.
Mridha (1992) Was monitored the operation of irrigation systems on eight
deep tubewells in Tangail district, Bangladesh, from 1989 to 1991. These systems
used buried non-reinforced concrete pipe to distribute water from deep tubewells
and irrigate diversified crops during the dry season. The potential of buried pipe
networks for surface irrigation at low heads is documented, and performance under
farmer's management is outlined. The utilization rates of all the tubewells were
disappointing, averaging 3.5 hrs/day at a discharge of 32.5 lps compared to the
design of 56 l/s. The irrigated area averaging 16.6 ha was typically less than half of
the design (40 ha). The reasons for this poor performance were found to be a
combination of social, managerial and agro-economic factors.
Rahman et al. (2011) was carried out study to examine the conveyance
efficiency and rate of irrigation water loss in DTW schemes in Bogra, Thakurgaon
and Godagari zones of Barind Management Development Authority, Bangladesh.
There were various types of water distribution identified in these schemes with
including Poly Venyl Chloride (PVC) buried pipe, cement concrete (CC)
rectangular, Ferro trapezoidal, Ferro semicircular and rectangular earth drain. The
average conveyance efficiency of PVC buried pipe for Bogra, Thakurgaon and
Godagari zones ranged from 94.46% to 95.37% and rate of water loss ranged from
5.45% to 9.55% in three study zones. About 80% farmers recommended buried
pipe irrigation system and about 20% semi-circular channel.

12
Ahmed (1984) reported that new buried pipe systems give high conveyance
and distribution efficiencies besides yielding other economic and non-economic
advantages. However, a conversion from earthen channel to buried pipe requires a
large additional investment.
Jadhav et al. (2014) conducted study on water loss from tank as well as
canal network through seepage was determined and evaporation loss was estimated
for Panchnadi Minor Irrigation Project in Konkan region. The conveyance
efficiency of the lined, unlined section of the main canal and field channel was
observed as 75.3, 52.1 and 34.8%, respectively. He developed Scenario for
increasing conveyance efficiency by canal lining or adaption of closed conduit and
concluded that, if whole canal network is converted in closed conduit then and
additional area of 92.6 ha can be brought under irrigation i.e. about 2.6 times more
than the existing area.
Radhakrishna and Ravikumar (2014). In order to minimize the losses in
conveyance of water from the source to the target site, the buried pipe Distributary
systems have been designed and developed, which is the first of its kind for tank
command irrigation with the adoption of solar pump to lift water from the jack well
in order to reduce the dependence on the erratic electric supply at village level. The
effect of on-demand water supply on different crops yield during Kharif and rabi
2003 to 2008 indicated that there was a significant change in the yield of crops and
cropping pattern in command area due to intervention of on demand water supply.
During 2003 kharif, the WUE of 18.5 kg/ha. cm and 13.0 kg/ha cm in paddy and
mulberry, respectively. However, during 2007 the WUE was 88.12 and 39 kg/ha.
cm in paddy and mulberry, respectively.
2.3 Reviews on Optimal Crop Planning
Shyam and Chauhan (1992) carried out a study in the command area of one
of the main canals of the Gola River in Uttar Pradesh, India. The available water at
the main canal was distributed among two branch and three distributory canals
exactly in proportion of the culturable command area. A linear programming model
for maximizing aggregate net return was used to allocate the land area under
selected crop activities. . Available land area, water, running hours of main canal,

13
carrying capacity of different canals and maximum and minimum area restrictions
under different crops were the different constraints imposed in the model. The
results were compared with the existing cropping pattern and income levels, and it
was found that the cropping pattern obtained through the model gave a 10% higher
aggregate net return than the existing one. Of the 3 command areas, the one with
the highest tubewell water supply had the maximum coverage of area, net return
and income per hectare.
Khare et.al. (2005) developed conjunctive use plan for the Sapon irrigation
command area of Indonesia. He stated that for optimal use of available surface and
groundwater, in any canal command area would results in their better utilization by
maximizing the benefits from the crop production. He presented a simple
economic-engineering optimization model to explore the possibilities of
conjunctive use of surface and groundwater using linear programming with various
hydrological and management constraints and to arrive at an optimal cropping
pattern for optimal use of water resources for maximization of net benefits. The
Lindo 6.1, optimization package has been used to arrive at optimal allocation plan
of surface water and groundwater.
Singh et al. (2005) used a linear programming model to develop an optimal
crop planning for Badliya command area in Rajasthan for maximizing crop
benefits. The study revealed that by efficiently managing resources of the command
area, net return could be increased from 71.57 lacs under existing cropping pattern
to 90.22 lacs (26.06%) under optimal cropping pattern. In order to get maximum
benefits, with 72% area allocated to Bengal gram [Cicer- arietinum] and wheat,
total water utilization was 70% of the available water and total manpower
utilization was 27%. The study also indicates that crop planning at the command
area level has the potential to enhance crop production by 60% and net return by 23
to 27%.
Sethi et al. (2006) provided an optimal crop planning and water resources
allocation in a coastal groundwater basin in Balasore district of Orissa province
(eastern India). Intensive rice cultivation during monsoon and winter seasons has
resulted in extensive pumping of groundwater by a network of shallow, mini-deep
and deep tube wells. The seawater intrusion front is also progressing inland in an

14
alarming rate. As non-structural measure, the Deterministic linear programming
(DLP) and chance-constrained linear programming (CCLP) models were developed
to allocate available land and water resources optimally on seasonal basis so as to
maximize the net annual return from the study area, considering net irrigation water
requirement of crops as stochastic variable. These models were solved using the
quantitative systems for business (QSB) software package. Sensitivity analysis of
the models has been carried out by varying three ranges of cropping scenarios (20,
40 and 50% deviation from the existing cropping pattern) and combinations of
surface water and groundwater at various risk levels (10, 20, 30 and 40%).The
study reveals that 40% deviation of the existing cropping pattern is the optimal that
satisfies the minimum food requirement and maintain geo-hydrological balance of
the basin. The sensitivity analysis of conjunctive use of surface water and
groundwater shows 20% surface water and 30% groundwater availability as the
optimum water allocation level. The proposed cropping and water resources
allocation policies of the developed models were found to be socio-economically
acceptable.
Rajmani and Singh (2009) conducted a study for assessment of conjunctive
use planning of water resource in the Sharda Sahayak Command Area of Sultanpur
district of Uttar Pradesh (India). The water demand and available water resources in
the study area are evaluated considering surface water and groundwater. They
presented a simple economic engineering optimization model to explore the
possibilities of conjunctive use of surface water and groundwater using linear
programming and to arrive at an optimal cropping pattern for optimal utilization of
water for maximum net benefits. The results indicated that conjunctive use options
are feasible and can be easily implemented in the study area.
Boustani and Mohammadi (2010) determined an optimal cropping pattern
for arid and semiarid regions with deficit water resources in the South of Iran. Fars
province is located in the southern part of Iran with mean annual precipitation from
50 to 1000 mm and in most parts of this province water resources for agriculture
are deficit. Jahrom region with semi-arid climate is located in Fars province with
mean annual rainfall of 373 mm. Therefore an optimal cropping pattern was
determined for this region based on water deficit condition. For this purpose, multi-

15
objective programming approach was applied in order to reduce water consumption
use. The results of this study showed that, there was tradeoffs among reduce water
use, reduce risk and getting a specific gross margin. Therefore sustainable use of
resources is affected by output condition in market. Furthermore, the area of maize
and vegetables were increased in all of selected solutions as compared to their
current area.
Aggarwal (2010) estimate the gap in demand and supply of water resources
at the block level during kharif and rabi season in Shaheed Bhagat Singh Nagar and
it was calculated that the average annual water demand exceeded average annual
evapotranspiration requirements by 29285 ha-m out of which 15262 ha–m (52%) in
kharif and 14023 ha-m (48%) in rabi season. The maximum average annual water
deficit of 386 mm in Nawaanshahar block and minimum deficit of 92 mm in Saroa
block was observed during period under study. The analysis revealed that the
cropping pattern is the major factor responsible for higher water demand leading to
water deficit in the district.
Ayare et al. (2010) estimated the irrigation water requirement of major
crops and total water available in the Natuwadi dam located in Konkan region of
Maharashtra A linear programming model was formulated to suggest optimal
cropping pattern giving the maximum return at different water availability levels.
The objective function of the model was subject to following constraints: total
water available and land during Rabi season, minimum area under rice and
sugarcane for local food requirement and preference to grow particular crop in a
specific area. This model has given the optimal cropping pattern for a command
area of 2050 ha at water availability levels of 100, 90, 80 and 70 per cent and net
returns of 120,109.50, 99.10 and 88.64 million rupees, respectively. It is found that,
the water available in the command area may support optimally 36.50, 1018, 50,
273, 45, 98 and 127 ha of rice, banana, sugarcane groundnut, chilli, brinjal and
maize for fodder, respectively, to get maximum returns of 120 million rupees at
100% water availability levels. Banana appears to provide the most consistent profit
in the command area.
Shuklodhan et al. (2011) conducted a study in Tuntapur tank system to
estimate the probable annual runoff entering the tank, the water demand from its

16
command area and to prepare an optimized plan using water balancing technique
while suggesting improvements. The study shows that water being used by the
farmers in excess of the real requirement and that there was a good scope for
improving the water management in the command area. Therefore alternative
cropping plans were proposed by considering the different tank storage levels
namely 100, 80, 60, 40 and 20 per cent of the maximum live storage of the tank
naming them as plan-I, plan-II, plan-III, plan-IV and plan-V respectively. Water
balancing technique was used to work out the proposed cropping pattern and area
under different crops, based on the available water in the tank. The areas for paddy
and groundnut were selected based on their suitability for the soils concerned and
the topography. The logic behind reducing the paddy area is to reduce the water
requirement and replacing that area by a light.
Yurembam and Kumar (2015) was developed a Linear Programming model
to maximize the net returns of the farmers considering, available land and water
resources, crop water requirement and net return from different crops. The
objective function of the model was subject to the following constraints: Water
availability; Land availability, Crop area, and preference to grow a particular crop
in a specific area. Based on three rainfall patterns i.e. normal, deficit and surplus the
optimization was performed. Under deficit rainfall condition the optimized results
of area allocation from the command was obtained as 20.66% kharif paddy, 17.95%
soybean and 1.71% maize during Kharif followed by 24.17% wheat and 2.30% pea
during Rabi season. For normal pattern the maximum return can be achieved
through 27.75% area under kharif paddy, 70.38% under soybean, and 1.71% under
maize during Kharif followed by 34.63% area under wheat and 2.30% area under
pea. Likewise the net return can be maximized by growing summer paddy on
98.13% area during Kharif and wheat on 97.54% area during Rabi season.
Shinde et al. (2015). Proposed cropping pattern scenario for Kalwande
Minor Irrigation Scheme based on the irrigable command area and volume of water
required. The paddy crop is the dominant crop in the study area and grown in kharif
season. Similarly in some of the areas, paddy is grown in rabi season. The alternate
cropping pattern suggested that the rabi paddy should not be encourage in the
command area due high demand of water and low net returns. His Result showed

17
that the maximum net returns obtained under single crop i.e for vegetables were
Rs.143.38 lakh. The maximum net returns obtained under double crop i.e. for
horticultural + vegetables were Rs.139.3 lakh. The horticultural + vegetables
+pulses cropping pattern on 5.50 ha, 5.50 ha and 100 ha respectively provides
maximum returns under available water source. He concluded that the rabi paddy
would not be found feasible in terms of water availability and benefits obtained.
The vegetable and horticultural crop showed potential in the command area with
the available water source to get maximum net returns.

18
CHAPTER-III
MATERIAL AND METHODS
This chapter describes the materials and methodologies adopted in the study
for analyzing the existing irrigation system and design of underground pipe line
irrigation system to minimize the losses. The chapter also presents the
comprehensive management plan of the existing crop and water resources in order
to obtain the sustainable output from the agriculture. The details of the study area
and the sequential methodologies adopted in the present study are described herein.
3.1 Details of the Study Area
3.1.1 Study Area
The study area, lies at Munrethi village in Raipur district of Chhattisgarh.
The area comes under canal command of Kurud irrigation tank. The field lies at 81º
48’ 14.17’’ E longitude and 21º 16’ 21.93’’ N latitude in Munrethi village. The
length of main canal is 12.42 km and length of distributory and minor is 6.30 km.
The head discharge of canal is 42 Cusecs. Total existing area under cultivation is
1388 ha in Kharif and 101 ha in Rabi. Other leading details of kurud irrigation tank
are present in the appendix I.
3.1.2 Agro climate
Study area comes under the Chhattisgarh plains in Raipur district. It is the
largest agro climatic region covering 55.1 % of the total geographical area of the
state. Baster plateau covers 24% and Northern hills region covers 20.9% of the total
geographical area of the state. The normal yearly average rainfall of Raipur district
is 1219 mm which is mostly received between middle of June to end of September
with occasional showers in winter. The maximum temperature of Abhanpur, Raipur
is 43.50 ºC during summer and minimum temperature drops to as low as 13.0 ºC
during winter season. The relative humidity usually observed low around 30% -
40% and reaches up to a peak value of 79 %. Evapotranspiration is maximum in the
month of May, which is more than 120 mm. Mean monthly wind velocity varies
from 12.1 km hr-1
in the month of June to 4.1 km hr-1
in the month of November.
The

19
Fig 3.1: Study area at Munrethi village, Raipur

20
Raipur district experiences sub-tropical climate, characterized by extreme summer
from March to May and rainy season extends from June to September with well
distributed rainfall. The number of rainy days in this area is 60-65 days. The district
receives 89% of the total rainfall during June to September.
3.1.3 Land use pattern
The total area of district Raipur is 12, 94,412 ha. Out of this, 4, 75,978 ha
are under forest that constituted 36.77 % of the total geographical area. The gross
cropped area in district Raipur is 5,92,725 ha which is 45.79% of the total
geographical area. The net cropped area of the district is 5,49,965 ha. It is very
amazing fact that in Raipur 94.11 % of the net cropped area is used only for rice
cultivation. The net irrigated area is only 2,85,981.8 ha that forms 52 % of the net
cropped area whereas the net irrigated area of Chhattisgarh is just 24% of the net
cropped area. Dhamtari has the highest net irrigated area (77%) out of the net
cropped area. Barren land is 9747 ha that forms 0.75 %. During kharif season crops
were grown in 5,42,757 ha and in rabi season crops were grown in only 1,17,658
ha which is only 21.69% of the net cropped area. Double cropped area of Raipur
district is 1,10,450 ha (20%). The 100% area of selected field is under rice
cultivation in kharif as well as in rabi. Rice cultivation in kharif depends upon
rainfall and irrigation whereas in rabi cultivation is totally depends upon irrigation.
Depending upon availability of water in the tank farmer takes rice or fields are left
fellow.
3.1.4 Soils
The soils of the Chhattisgarh Plain are considered as its principal natural
resource, and are the mainstay of the predominantly agricultural population of the
region. The main soils on the toposequence are described as under.
Kanhar (clayey)
A low-lying deep bluish black soil with high moisture retention capacity. It
is well suited for rabi crops, particularly wheat. The power of water absorption in
this soil is greater and this is very useful in growing of Rabi crops in the region.
Scientifically known as vertisols. Kanhar covers 21% area of Raipur district.
Mostly kanhar soils are present in the study area.

21
Dorsa (clay-loam)
This type of soil is intermediate in terms of soil moisture retention between
kanhar and matasi. This is best described as loamy, and has a colour between
brown and yellow. This is more suitable for paddy and comes under alfisol. These
soils are good for soybean, pigeon pea and other oilseed and pulses. Dorsa soil
covers about 27% of total geographical area of Raipur. Only two farmer reported
that dorsa soil in his field.
Matasi (sandy loamy)
This is a yellow sandy soil with an admixture of clay. It has limited
moisture retention capacity. It covers 39% of total geographical area of Raipur.
Though used for paddy, it is ideal for short duration maize and deep-rooted pulses.
It is found in better-drained areas and at relatively higher altitudes. This type of soil
comes under inceptisols These soils having good potential for raising short duration
vegetables both in Kharif and Rabi with the support of stored harvested water.
These soils are not present the study area.
Bhata (laterite)
This soil is a coarse-textured, red sandy-gravelly soil, found on upland tops.
It is deficient in minerals and other productivity enhancing nutrients, and is often
suitable only for coarse millets. Scientifically, it is known as entisol. Bhata soil
occupies 12% of total geographical area of Raipur district. . These soils are not
present in the study area.
3.2 Data Collection
This study depends mainly on primary data from the study area, beside
secondary data from relevant official sources. The method selected for primary data
collection was direct personal interviewing of the sample respondents by using
structural questionnaires. The primary data collected includes crop type and verity,
yield, soil type, colapa operations ( opening, operating time, closing), method of
irrigation, time required to irrigate whole command area, method of field
preparation, depth of pounding etc.
Secondary data which was collected from relevant institutional sources such
as details of Kurud irrigation tank, Cadastral map and Canal flow data is collected

22
from Water Resource Department, Raipur. Only four year canal flow data from
2012-2015 were available.
3.3 Software used
Different software are used in the study to solve the various problems.
Selection of software is done on the basis of availability and user friendly
operation. Geographical Information System (ArcGIS 10.1) was used in the study
for preparation of different location maps of the study area. AutoCAD 2013 was
used for making of proposed design sketch. TORA version 2.00 was used for
optimal crop planning.
3.4 Site selection
Several sites of Mahanadi main canal (distributory no. 21A) and Kurud
irrigation tank in Raipur district, near IGKV was visited for planning and design of
pipe distribution network in the command of a canal outlet.
3.5 Irrigation facility of the study area
Canal is only source of irrigation in the study area. The basin irrigation
method of paddy cultivation is common in the area. Large plot in the field are
divided into small basins. Water is pounded to a depth of 5-10 cm or more in the
field from transplanting to 10-15 days before harvesting. Previous four year canal
flow data from 2012-2015 is collected from Water Resource Department, Govt. of
C.G. for study of opening and closing time of canal. Field survey as well as farmers
survey also conducted for extracting necessary information required for this
research purpose Tables shows days of canal operation in different years in rabi
and kharif season.
Table 3.1: Number of days of canal flow in a particular year in kharif season
Month Year
2012 2013 2014 2015
August 21 6 14 16
September 30 31 23 14
October 31 11 22 25
November 5 0 8 0
Total 87 48 67 55
23
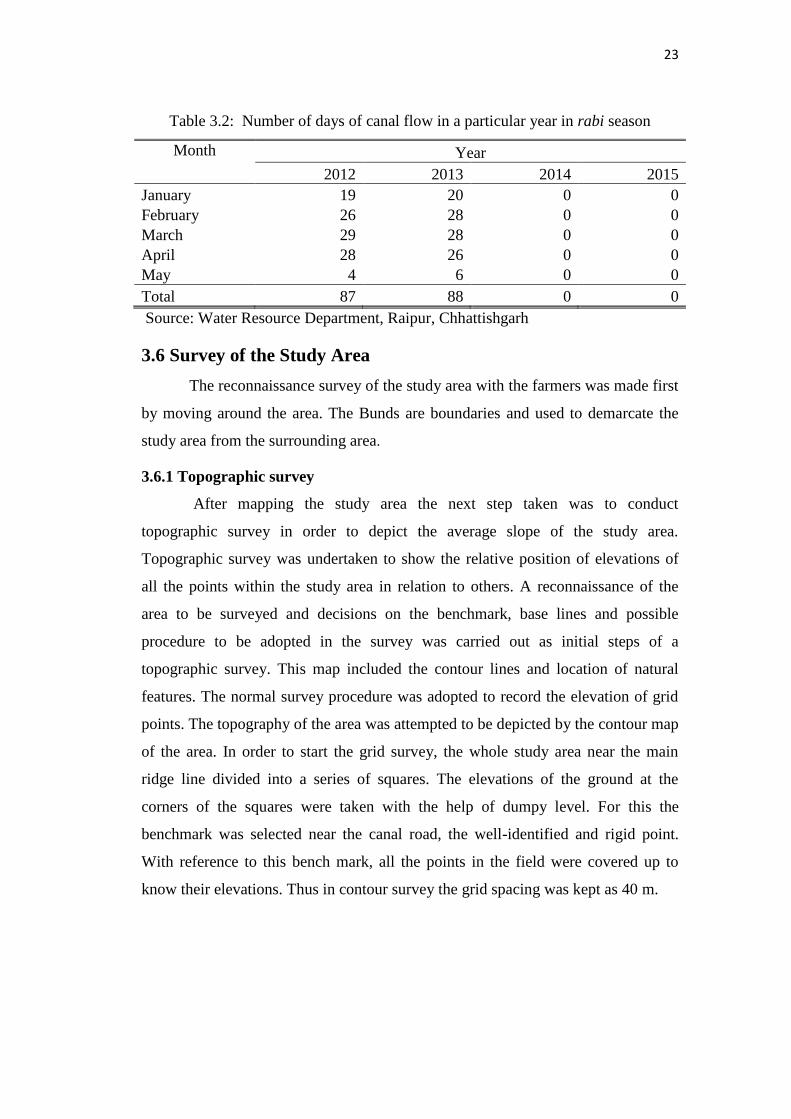
Table 3.2: Number of days of canal flow in a particular year in rabi season
Month Year
2012 2013 2014 2015
January 19 20 0 0
February 26 28 0 0
March 29 28 0 0
April 28 26 0 0
May 4 6 0 0
Total 87 88 0 0
Source: Water Resource Department, Raipur, Chhattishgarh
3.6 Survey of the Study Area
The reconnaissance survey of the study area with the farmers was made first
by moving around the area. The Bunds are boundaries and used to demarcate the
study area from the surrounding area.
3.6.1 Topographic survey
After mapping the study area the next step taken was to conduct
topographic survey in order to depict the average slope of the study area.
Topographic survey was undertaken to show the relative position of elevations of
all the points within the study area in relation to others. A reconnaissance of the
area to be surveyed and decisions on the benchmark, base lines and possible
procedure to be adopted in the survey was carried out as initial steps of a
topographic survey. This map included the contour lines and location of natural
features. The normal survey procedure was adopted to record the elevation of grid
points. The topography of the area was attempted to be depicted by the contour map
of the area. In order to start the grid survey, the whole study area near the main
ridge line divided into a series of squares. The elevations of the ground at the
corners of the squares were taken with the help of dumpy level. For this the
benchmark was selected near the canal road, the well-identified and rigid point.
With reference to this bench mark, all the points in the field were covered up to
know their elevations. Thus in contour survey the grid spacing was kept as 40 m.

24
Fig 3.2: Topographic survey of the study area
25
3.7 Losses Estimated through Questionnaire Information
In the present study, the losses were as estimated through questionnaire for
the study area. Structural questioners was developed with the help of Scientists of
IGKV, Raipur and farmers survey is conducted.
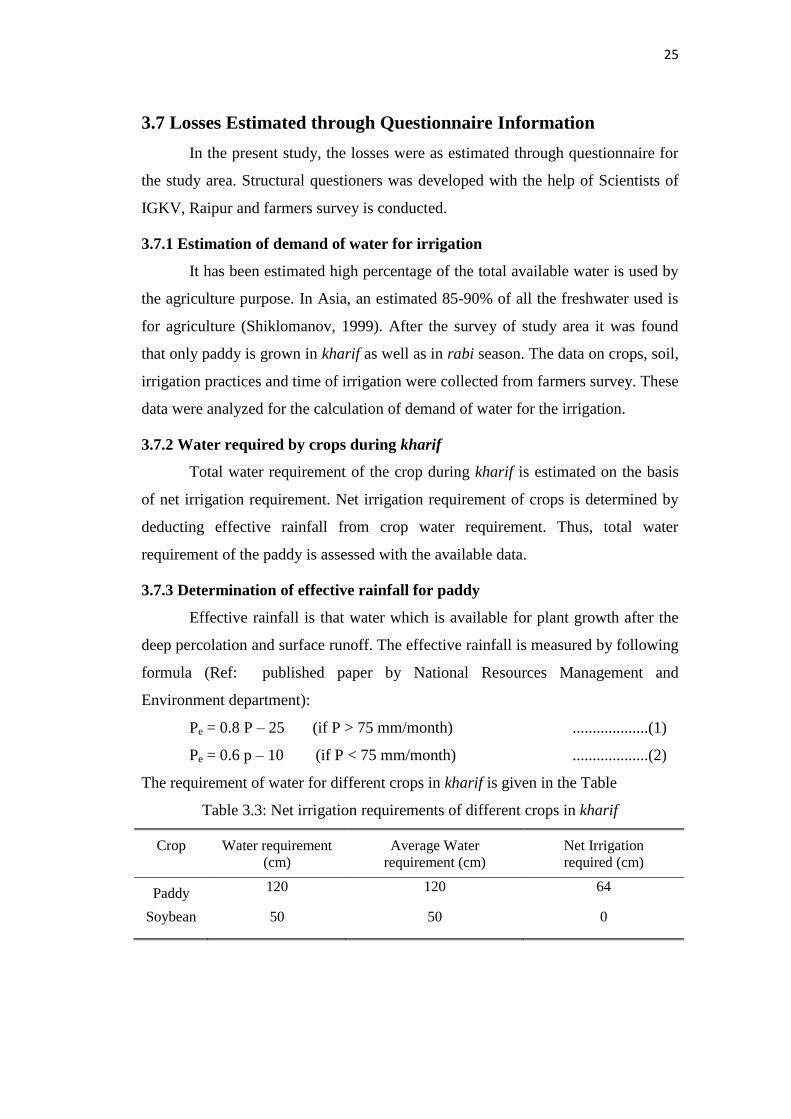
3.7.1 Estimation of demand of water for irrigation
It has been estimated high percentage of the total available water is used by
the agriculture purpose. In Asia, an estimated 85-90% of all the freshwater used is
for agriculture (Shiklomanov, 1999). After the survey of study area it was found
that only paddy is grown in kharif as well as in rabi season. The data on crops, soil,
irrigation practices and time of irrigation were collected from farmers survey. These
data were analyzed for the calculation of demand of water for the irrigation.
3.7.2 Water required by crops during kharif
Total water requirement of the crop during kharif is estimated on the basis
of net irrigation requirement. Net irrigation requirement of crops is determined by
deducting effective rainfall from crop water requirement. Thus, total water
requirement of the paddy is assessed with the available data.
3.7.3 Determination of effective rainfall for paddy
Effective rainfall is that water which is available for plant growth after the
deep percolation and surface runoff. The effective rainfall is measured by following
formula (Ref: published paper by National Resources Management and
Environment department):
Pe = 0.8 P – 25 (if P > 75 mm/month) ...................(1)
Pe = 0.6 p – 10 (if P < 75 mm/month) ...................(2)
The requirement of water for different crops in kharif is given in the Table
Table 3.3: Net irrigation requirements of different crops in kharif
Crop
Water requirement
(cm)
Average Water
requirement (cm)
Net Irrigation
required (cm)
Paddy 120 120 64
Soybean 50 50 0

26
3.7.4 Water required by crops during rabi
Summer paddy is the only crop grown in the area during rabi season. The
total water requirement of the crop is supplied with the irrigation.
Table 3.4: Water requirements of different crops
S. No. Crop Water requirement (cm)
1.
2.
3.
4 .
5.
Wheat
Gram
Lethyrus
Mustard
Tomato
45
30
30
30
50
Source- Krishi Diary (I.G.K.V)
3.7.5 Total water requirement
It is the sum of total water required for irrigation in rabi and kharif season.
This is the amount of water which is required to fulfil crop water requirement in
both the season.
3.7.6 Estimation of volume of water supplied from outlet:
Farmers survey is conducted for digging up reliable information to estimate
volume of water supplied. 150 mm of pipe outlet is provided to irrigate the study
area of 12 ha. Maximum design discharge of outlet is 1 cusec. Measurement of
water required to irrigate the chak was not possible because of the reason that water
is not supplied from the tank for irrigation in rabi season. The approach to estimate
losses through questionnaire was adopted all over the area with the assumptions
that, farmers know well about their practices such as irrigation application depth,
time of irrigation, soil types, no. of irrigation etc (Saikh, 2015).
3.8 Application efficiency and losses
The basis of application losses calculations was kept considering the definition of
application efficiency given by Bos and Nugteren (1990), which is quantitatively
expressed as
Where,

27
AE = Application efficiency
Dm = Depth of irrigation water required (cm)
Df = Depth of irrigation water applied (cm)
3.9 Scenario development for increasing conveyance efficiency
Pipe flow offers many advantages over open channels in water conveyance
and distribution. The average conveyance efficiency of PVC buried pipe ranged
from 94.46 per cent to 95.37 per cent and rate of water loss ranged from 5.45 per
cent to 9.55 per cent. The conveyance efficiency of pipe flow increased up to 95 per
cent (Rahman et al., 2011).
3.10 Underground Pipeline system
Low-pressure pipelines on surface irrigation distribution systems serve
about 4.5% of the world irrigation area. The main benefits compared with open
channels are reduced leakage rates and land take requirements, and flexibility in
irrigation timing which is important for diversified cropping systems (Smout,
I.K.,1999). Underground pipeline systems (also known as buried pipe lines) are
being increasingly used for conveying irrigation water on the farm. Under most of
the conditions pipeline system will function well for several years. However, they
need a higher initial cost as compared to open channels (Murthy, 2002). In
supportive to present study, Campbell (1984) reported that pipe systems in northern
India assured flow delivery at the design discharge to the furthest irrigator with a
minimum losses and unauthorized diversions route. Adoption of buried pipeline
distributary systems had lead to the reduction in water transit and distribution
losses, reduction in the land area taken up by the distribution system and reduction
in the maintenance and operating costs of the irrigation system. The salient features
of the command area and the existing land profile, the main channels and sub
channels were considered while designing the buried pipeline system. The
information on the outlets of buried pipe system for cluster of plots has been
considered and the rate of water discharge in the pipe system for cluster of plots has
been worked out. The buried pipe distributary system was designed based on the
rate of water discharge in the pipe system for cluster of plots, crop water demand of
the command area and cropping pattern. A chak of 12 ha having 640 m length was

28
chosen for design of underground pipe distribution network and controllable
turnout structures.
Requirements of good distribution net work
A good distribution system should satisfy the following requirements:
It should provide desired quantity of water economically and efficiently to
each part of the chak.
It should have enough capacity to meet crop water requirements during peak
use periods.
The system should be large enough to allow delivery of water in the time
allotted when water is supplied on rotation or turn basis.
3.11 Design of underground pipeline system
Several literature are reviewed for design of underground pipe distribution
system. The design of pipeline system consist of following:
3.11.1 Selection of type of system
Buried pipeline systems may be classified depending on the working
pressure as, Low pressure systems (less than 10 m), Medium pressure systems (10
m to 20 m) and High pressure system (more than 20 m) (Murthy, 2002). The low
pressure systems are used for water conveyance while the medium pressure ones
are used with drip systems and high pressure ones with sprinkler system. Low
pressure pipeline systems can be classified on the method of pressure control into
closed, semi-closed and open systems and on the method of providing head into
gravity, pumped or mixed systems.
3.11.2 Pipe material of the pipe line
Concrete, Verified clay, Rigid P.V.C. pipes and mild steel pipes are
materials used for underground pipelines. Among these Concrete and PVC are most
commonly used.
3.11.3 Design velocity
Recommended maximum velocities in low pressure pipelines are in the
range of 1.3 to 1.5 ms-1
. Higher velocities reduce the diameter of pipe and hence
cost but result in higher frictional losses and higher cost of water hammer

29
protection. Minimum flow velocities should be around .5m/s in order to prevent
sedimentation of fine sand.
Where;
Q = Discharge from outlet ( )
A = Area of cross-section of pipe ( )
V = Velocity of flow through pipe (ms-1
)
3.11.4 Diameter of pipeline and frictional head losses
The diameter of pipeline is determined taking into consideration of rate of
flow and the frictional losses in the pipeline and the ancillary structures (Murthy,
2002). These losses depend on the mean flow velocity through the pipe, internal
diameter of the pipe, internal pipe surface, and the turnout's structures. Accurate
estimation of friction losses in pipes is an important engineering task. Due to their
simplicity, empirical equations are often used for determining pressure drops in
pipes The most widely used empirical equations for calculation of pressure drops in
pipes are Darcy-Weisbach equation (Yousef and Faisel 2007) and Hazen-Williams
equation (Sodiki and Emmanuel, 2008).
3.11.4.1 Darcy-Weisbach equation
It is widely accepted that the Darcy-Weisbach equation for calculating head
loss is a highly accurate pipe flow resistance equation. The Darcy-Weisbach
equation is rational, dimensionally homogeneous, and applicable to other fluids as
well as to water (Liou, 1998).
Where,
= Friction factor
= head loss due to wall friction (m)
= Length of pipe (m)

30
= Mean Velocity (ms-1
)
= Internal diameter (m)
= Acceleration due to gravity (ms-2
)
In estimating the friction factor, , Reynolds number ( ) and the relative
roughness of the pipe ( ⁄ ) were determined.
3.11.4.2 Reynolds number ( )
Where,
= Reynolds number
= Mean Velocity (ms-1
)
= Internal diameter of pipe (m)
= kinematic viscosity of irrigation water (m2s
-1)
3.11.4.3 Colebrook-White equation
The average value of roughness (e) was obtained from literature. These
values of D, Re , and e were used in determining the friction factor, f. For all pipes,
many engineers consider the Colebrook-White equation more reliable in evaluating
f. The equation is
(
)
Where,
= Friction factor
e = Roughness of pipe (mm)
= Internal diameter (m)
= Reynolds number
Colebrook-White equation is difficult to solve as appears on both sides of
the equation. Typically, it is solved by iterating through assumed values of until

31
both sided become equal. The hydraulic analysis of pipelines and water distribution
systems, using the equation, often involves the implementation of a tedious and
time-consuming iterative procedure that requires the extensive use of computers.
The use of such empirical equations preceded by decades the development of the
Moody diagram which gives the relation between, Re and relative roughness.
3.11.4.4 Hazen-Williams formula
An alternative method of calculating the frictional head loss to the D'Arcy -
Weisbach equation is the Hazen-Williams formula expressed in terms of readily
measurable variables as (Sodiki, 2002). The Hazen–Williams equation is
an empirical relationship which relates the flow of water in a pipe with the physical
properties of the pipe and the pressure drop caused by friction. It is used in the
design of water pipe systems such as fire sprinkler systems, water supply networks,
and irrigation systems. The Hazen–Williams equation has the advantage that the
coefficient C is not a function of the Reynolds number, but it has the disadvantage
that it is only valid for water. Also, it does not account for the temperature
or viscosity of the water.
Where,
= Head loss due to wall friction (m)
L= Length of pipe (m)
D = Diameter of pipe (m)
Q = Flow rate (m3s
-1)
C = Hazen – Williams Coefficient of relative roughness of the pipe material
3.12.5 Minor losses
In general for pipe system, head losses due to bends and valves comprises
only 5 to 10 % of total pipe friction losses and are frequently referred to as minor
head loss.

32
where,
Hm = minor head loss (m)
Km = minor head loss coefficient
V = velocity before feature causing friction losses (ms-1
)
For uniform grades knowing the length of pipeline to be laid and the
difference in elevations at the starting and end points, the upward or downward
slope (So) can be determined. The gradient of hydraulic head is calculated from the
height of water in the inlet structure and the length of run of pipeline. Provision has
to be made to take care of losses at the bands, valves and risers.
Height of water surface above the pipeline as
The combined hydraulic gradient is calculated as follows:
Sf = Se + So ( for down slope)
Sf = Se - So ( for up slope)
A diameter for the pipeline be selected and the frictional losses calculated.
The calculated friction loss should be less than the value of Sf calculated. If not the
diameter of pipeline is increased.
3.11.6 Design of ancillary structures
3.11.6.1 Gravity inlet
When water enters the pipe line from an open channel a gravity inlet is
used. A screen is fixed to the inlet to keep the thrash out of pipeline. The top of the
structure is provided with cover to prevent accident and to keep the thrash out from
blown into it. It is larger than the size of pipeline. The larger capacity of stand
permits dissipation of the velocity stream and release of entrapped air before the
water enters the pipeline. If the irrigation water contains appreciable quantities of
sand, a trap can be built into the inlet structure to remove most of the suspended
material. When the stand functions as a sand trap also, it has an extra large diameter
to ensure low velocity of water and its bottom is set about 60 cm below the bottom

33
of the pipeline. When the channel water contains considerable quantities of debris
and weed seed, a debris screen is provided at the inlet to clean the water before it
enters the pipeline. Commonly, the stream is allowed to fall through a fine screen
into a gravity inlet. The screen will need frequent cleaning. In small scale
installations, inlet consists of simple masonry tanks of required height and about
one meter square. The concrete bed is made at the bottom of 10 cm thickness for
stands up to 3 m height.
Total height of inlet stand = 0.60 m below the bottom of pipe + Diameter of pipe +
Depth of pipeline below the ground + Max. Depth of flow in the canal + freeboard
3.11.6.2 Air vent
Air vent are vertical pipe structure to release air entrapped in the pipe line
and to prevent vacuums. Entrapped air must be removed to permit an even flow and
avoid danger of water hammer. They are installed at all high points in the line, at
sharp turns, at points of there is a downward deflection of more than 10 degree,
directly downstream of any structure that may entrap air, and at the end of pipeline.
They are also require immediately upstream from gates where closure of gates
would make such points the downstream end of laterals or line. Vents are generally
installed at 150 m on an uniform slope.
3.11.6.3 Outlets
These are needed to deliver the water from the pipeline system to the fields.
The outlet consists of riser pipe jointed to the main pipe line vertically. At the end
of the riser pipe near ground level a valve is fitted. Opening and closing of the
valve control the flow of water. The diameter of the riser pipe is kept the same as
the pipeline system where the entire flow of the pipeline is to be released through
the valve. A field block of 1 ha provided with a separate outlet of 1 cusec (27 lps)
capacity, with the valve located about 15 cm above the field level with a division
box (protection against scouring would be convenient (Mridha,1992). While
designing pipe distribution network outlet are provided as per requirement of
farmers and minimum application loss. The separate outlet may be provided for
each farmer. If size of field is so small then one outlet will be proved for one or
more farmer.

34
3.12 Optimal Crop Planning
The growing demand of food for large population can only be met by
optimum utilization of available water and efficient allocation of available land to
different crops. In this study a Linear Programming model was developed to
maximize the net returns of the farmers considering, available land and water
resources, crop water requirement and net return from different crops. (Yurembam
and Kumar, 2015)
3.12.1Productivity, net benefit and cost of cultivation of crops
In the study area and whole Munrethi village farmers usually grows only
paddy in both seasons. Farmers are dependent on canal irrigation for crop
production. The data on the other crops such as cereals, pulses and oilseed collected
from other farmers of nearby villages of Raipur district and also from IGKV
Raipur.
Table 3.5: Net profit of different crops
Crops Cost of
Cultivation
(Rs/ha)
Market price
(MSP)
(Rs/Qt)
Average Yield
(Qt/ha)
Net Profit
(Rs/ha)
Paddy 20514 1440 38 34206
Wheat 14114 1525 25 24011
Gram 16118 3500 15 36382
Lathyrus 7197 3200 9 21603
Mustard 13514 3350 11 23334
Soybean 8598 2600 12 22602
Tomato 26576 800 123 71824
3.12.2 Objective function
The objective function is formulated to maximize the net benefits
within given constraint and design cropping pattern which can be expressed
as

35
∑
Where,
Z= Maximize net annual benefit
ns= Number of season
nc= Number of crop
i= Number of season of the study area
j= Number of crops
Aij= Area under jth
crop in the ith
season (ha)
NBj = Net benifit of jth
crop in the ith
season (Rs)
The objective function is to be maximized subject to variety of constraints:
3.12.3 Water constraint
The irrigation requirement for all the crops in command area shall be met by
surface only. Therefore, water constraint for the crops can be written as:
∑
Where,
Di = Depth of irrigation water required by jth
crop (m)
Ai = Area of jth
crop for ith
season (ha)
V = Total water use (ha-m)
3.12.4 Area availability constraint
The total area under different crops should be less than or equal to the
available cultivable area in rabi and kharif season.
∑
Where,
A = Available cultivable land (ha)

36
3.12.5 Affinity constraint
The affinity constraints are required for allocating area to the crops whose
net benefit are less but farmer have affinity to grow such crops. Therefore, affinity
constraint for the crops can be written as:
∑
Where,
A = Available cultivable land (ha)
3.12.6 Nutritional constraint
Since it is required to allocate land resources to some oil seed crops and
pulses to fulfil the nutritional requirement.
∑
Where,
A = Available cultivable land (ha)
3.12.7 Case 1 (Existing Scenario)
The study area is irrigated by canal only in rabi and kharif. There is no any
source of groundwater in study area. Paddy is the only crop grown in both seasons.
Max Z: 34206 Ap1 +34206Ap2
Water constraint:
0.54 Ap1≤6.48
1.20Ap2 ≤14.4
Land constraint
Ap1≤ 12
Ap2 ≤ 12
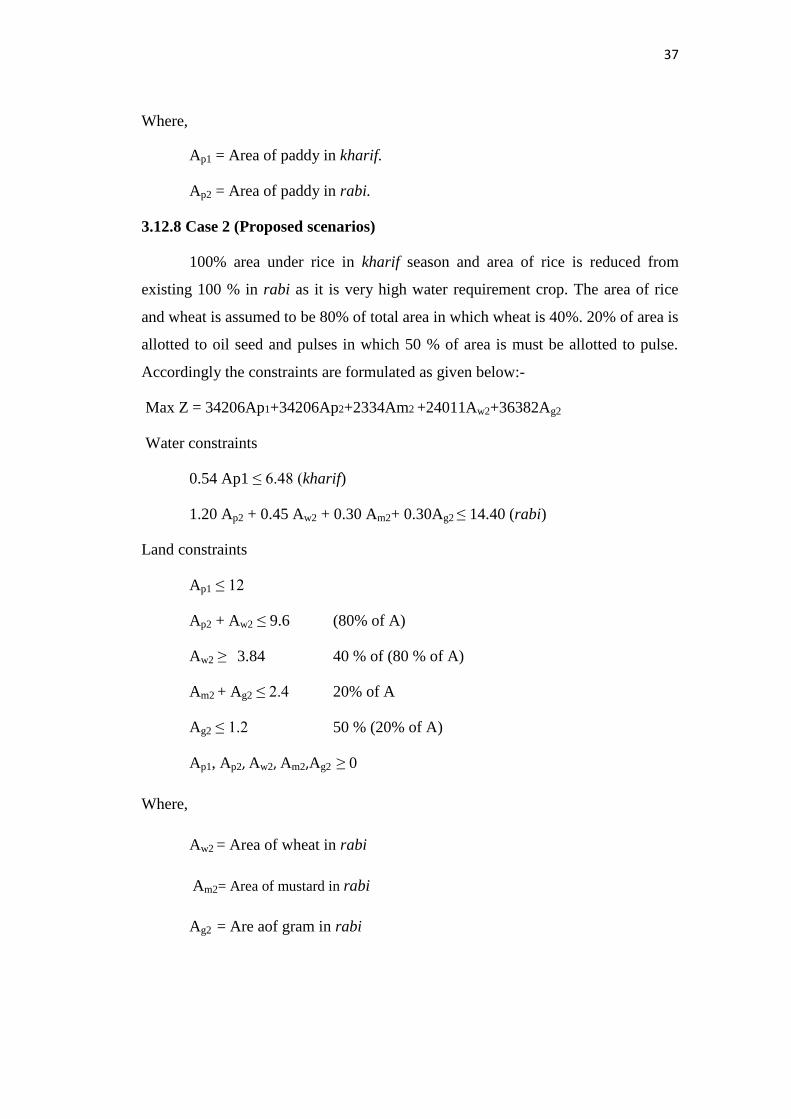
37
Where,
Ap1 = Area of paddy in kharif.
Ap2 = Area of paddy in rabi.
3.12.8 Case 2 (Proposed scenarios)
100% area under rice in kharif season and area of rice is reduced from
existing 100 % in rabi as it is very high water requirement crop. The area of rice
and wheat is assumed to be 80% of total area in which wheat is 40%. 20% of area is
allotted to oil seed and pulses in which 50 % of area is must be allotted to pulse.
Accordingly the constraints are formulated as given below:-
Max Z = 34206Ap1+34206Ap2+2334Am2 +24011Aw2+36382Ag2
Water constraints
0.54 Ap1 ≤ 6.48 (kharif)
1.20 Ap2 + 0.45 Aw2 + 0.30 Am2+ 0.30Ag2 ≤ 14.40 (rabi)
Land constraints
Ap1 ≤ 12
Ap2 + Aw2 ≤ 9.6 (80% of A)
Aw2 ≥ 3.84 40 % of (80 % of A)
Am2 + Ag2 ≤ 2.4 20% of A
Ag2 ≤ 1.2 50 % (20% of A)
Ap1, Ap2, Aw2, Am2,Ag2 ≥ 0
Where,
Aw2 = Area of wheat in rabi
Am2= Area of mustard in rabi
Ag2 = Are aof gram in rabi

38
3.12.9 Case 3
Area under rice in kharif season is same as in case 2 and area of rice is
reduced to 40 % in rabi . The area of wheat and gram is assumed to be 40% of total
area in which area under gram is 65%. 10% area is allotted to oilseed (mustard)
crop and 10% is allotted to vegetable (tomato). Accordingly the constraints are
formulated as given below:
Max Z : 34206Ap1 + 34206Ap2 +36382Ag2 +71824At2 +24011Aw2 +23334Am2
Water constraints
0.54 Ap1 ≤ 6.48 (kharif)
1.20 Ap2+ 0.30Ag2 + 0.50 At2 + 0.45 Aw2 + 0.30 Am2≤ 14.40 (rabi)
Land constraints
Ap1 ≤ 12
Ap2 ≤ 4.8 (40% of A)
Aw2 + Ag2 ≤ 4.8 (40% of A)
Ag2 ≥ 3.12 65 % of (40 % of A)
At2 ≤ 1.2 (10% of A)
Am2 ≤ 1.2 (10% of A)
Ap1, Ap2, Ag2 Aw2, At2,Am2, ≥ 0
Where,
At2 = Area of tomato in rabi
3.12.10 Case 4
Oilseed crops as soybean can be grown in kharif season with modern land
improvement practices like ridge and furrow method. So 20 % area is allotted to
soybean in kharif season. Pulse crop as gram and lathyrus can be grown in 20 % of
total area in rabi. Lathyrus is grown in at least 40% area of total pulse area. Rice
and wheat may cover 70 % of total cropped area and rice is restricted to only upto

39
40% of total area. 10 % area is allotted to mustard in rabi. Accordingly the
constraints are formulated as given below:
Max Z: 34206 Ap1+ 20002 As1+ 34206Ap2 + 23334Am2 + 24011Aw1 + 36382Ag2 +
21603Al2
Water constraint
0.54 Ap1+ 0As1 ≤ 6.48
1.2 Ap2 + 0.30Am2 + 0.45 Aw1 + 0.30Ag2 + 0.30 Al2 ≤ 14.4
Land constraint
Ap1+ As1 ≤ 12
As1 ≥ 2.4
Ag2+Al2 ≤ 2.4 (20 % of total area)
Al2 ≤ .96 (40 % of (20% of total area)
Ap2 +Aw2 ≤ 8.4 (70 % of total area)
Ap2 ≤ 4.8 (40% of total area)
Am2 ≤ 1.2 (10% of total area)
Ap1,As1,Ap2,Am2,Aw1,Ag2,Al2 ≥ 0
Where,
Al2 = area of lathyrus in rabi
3.12.11 Case 5
Area under rice and soybean in kharif season is same as in case 4 and area
of rice is reduced to 40 % in rabi. The area of wheat and gram is assumed to be
40% of total area in which area under gram is 75%. 20% is allotted to vegetable
(tomato). Accordingly the constraints are formulated as given below:
Max Z : 34206Ap1 + 20002 As1+ 34206Ap2 +36382Ag2 +71824At2 +24011Aw2
Water constraints
0.54 Ap1+0 As1 ≤ 6.48 (kharif)

40
1.20 Ap2+ 0.30Ag2 +0.50 At2 + 0.45 Aw2 ≤ 14.40 (rabi)
Land constraints
Ap1 + As1 ≤ 112
As1 ≥ 2.4
Ap2 ≤ 4.8 (40% of A)
Aw2 + Ag2 ≤ 4.8 (40% of A)
Ag2 ≥ 3.6 75 % of (40 % of A)
At2 ≤ 2.4 (20% of A)
Ap1, Ap2, Ag2 Aw2, At2 , ≥ 0

41
CHAPTER-IV
RESULT AND DISCUSSIONS
This chapter deals with the results obtained in the present study and the
discussion there on. As described in previous Chapter III, discussions on present
irrigation method, Assessment of water losses, Design of Pipe Distribution Network
and crop planning are discussed in following heads.
4.1 Site Selection
. While selecting the sites, preference was given to
1. Area where Rabi and Kharif crops are grown through canal irrigation only,
as deficiency of water generally occurs in Rabi season. Kharif season is a
monsoon season and sufficient amount of water is available for irrigation.
2. Cooperation of the scheme population is very important for planning and
successful working of irrigation system.
4.2 Topographic Survey
After selecting the study area the next step taken was to conduct
topographic survey in order to depict the average slope of the study area.
Topographic survey was undertaken to show the relative position of elevations of
all the points within the study area in relation to others. Elevations are recorded in
40 m grid. The value of 40 m is selected on the basis of survey conducted by Water
Resource Department for construction of watercourse. One totally defunct
watercourse was present on middle bund of the field, so survey is also conducted
along the middle bund and 40 m left and 40 m right values are also recorded. The
topography of the area was found relatively flat with an average slope of 0.8%. A
reconnaissance survey conducted with farmers of study area, they were also
reported that, water enters to their field from canal outlet and get divided into two
streams after that flows longitudinally along the main bund. An average value of
left side and right side is calculated, because bund has relatively higher elevations
then fields and these elevations are assumed as elevations near the middle bund. An
elevation in 40 m grid shown in table 4.1 and topography is shown in fig 4.1.

42
Table 4.1: Field elevations
Distance
(m)
Left side
(m)
Middle
(m)
Right side
(m)
Av. of left &
right side (m)
0 99.38 99.46 99.33 99.36
40 99.25 99.96 99.29 99.27
80 98.78 99.15 99.03 98.91
120 98.69 98.83 98.74 98.72
160 98.25 98.48 98.30 98.28
200 97.83 98.28 97.75 97.79
240 97.41 97.83 97.27 97.34
280 97.18 97.60 97.00 97.09
320 96.77 97.34 96.61 96.69
360 96.43 97.03 96.51 96.47
400 96.40 96.64 96.23 96.31
440 95.87 96.26 95.71 95.79
480 95.78 96.05 95.66 95.72
520 95.33 95.64 95.12 95.23
560 95.27 95.59 95.10 95.18
600 93.92 94.10 94.23 94.07
640 93.81 94.28 93.55 93.68
4.3 Irrigation Facility of the Study Area
4.3.1Field observation
There was no tubewell/borewell found in the study area. Farmers are
completely depends on rainfall and canal irrigation in Kharif and only on canal
irrigation in Rabi for crop production. In kharif season, canal is opened in the
month of August and continued till the end of October. Transplanting method is
adopted by the farmers due to availability of irrigation facility. There is no shortage
of water in Kharif season as this is monsoon season and long dry spells are fulfilled
by the supplementary canal irrigation. It is found in the farmers survey besides
monsoon rainfall farmers continued to irrigate their crop.
In Rabi season also all farmers of study area cultivate paddy. The whole of
the water requirement of the crop is fulfilled by canal irrigation except occasional
effective rainfalls. Water from the main canal is directly enters into the field from
the 6" diameter pipe and is also called as colapa in local language. The design

43
Fig 4.1: Topography of study area
discharge of 6" colapa is 1cusec. There is no working watercourse in the study
area. One totally defunct watercourse was found in the survey of the field. Field to
field irrigation method is practiced by the farmers. Conveyance losses in this
method are more as water has to travel long distance from earthen bed to reach at
last field. Obstruction by the crop also reduces velocity and increase losses.
Longitudinal distance of the field is 640 meters from colapa to the end of last field.
Natural drainage channel was present below this which drains excess water from
the field. There is no opening or closing gate or no valve is provided in the colapa,
Farmers use mud bags to close it. Leakage of water is always continuing. From the
farmers interaction it was also found that head end and middle farmers face
problem in the application of fertilizers, insecticide, weedicide etc. as they cannot
stop water flowing from their field.
4.4 Losses Estimation
The approach to estimate losses through questionnaire were adopted all over
the area with the assumptions that
1. The farmers know well about their practices such as irrigation application depth,
time of irrigation, soil types etc., and
2. The guidelines for the required depth of irrigations for different crops used by
the research department in the study area is applicable to the whole study area and
irrigation surveys are representative samples of the population.
93.00
94.00
95.00
96.00
97.00
98.00
99.00
100.00
101.00
0 100 200 300 400 500 600
Ele
vat
ions
(m)
Distance (m)
Left side (m)
Middle (m)
Right side (m)

44
4.4.1 Irrigation required in kharif season
In the study area paddy is grown by transplanting method. Water
requirement of paddy is 120 cm. Depth of effective rainfall calculated by empirical
formula which is obtained as 66 cm. Depth of irrigation required to fulfill crop
water requirement in kharif season is 54cm. Total volume of water required to
irrigate 12 ha land with 10 cm is 120 ha-cm, while time required is 5.12 days or 123
hr. Total water required to apply 54 cm depth is 648 ha-cm. Canal flow data
collected from Water Resources Department. Canal opened in the month of August
and closed in last week of October or first week of November. This shows that in
addition to monsoon rainfall farmers need irrigation for crop. From the farmers
survey it is also found that, on an average 10 cm water is pounded in the field. In
monsoon season irrigation is done on the basis of demand. On an average canal
flows 65 days in kharif season. This also shows that, farmers need irrigation besides
the effective rainfall of 66 cm.
4.4.2 Irrigation required in rabi season
In the study area only paddy is grown in rabi season also. In this season
there is an occasional rainfall which is not considered as effective rainfall. Total
water requirement of crop is fulfilled by canal irrigation. The depth of application is
10 cm per irrigation and volume of water required per irrigation is 120 ha-cm. Total
water requirement for irrigation in 12 ha is 1440 ha-cm.
Fig 4.2: Average days in a month of canal flow in kharif season
14.25
24.5 22.25
3.25
0
5
10
15
20
25
30
August September Octomber November
Day
s
Month

45
Fig 4.3: Average days in a month of canal flow in rabi season
4.4.3 Total irrigation demand
Total irrigation demand is the sum of water required for irrigation in rabi
and kharif season. Total water required for irrigation is 2088 ha-cm.
4.4.4 Estimation of volume of water delivered
The data collected in survey showed that 8 days are required to irrigate the
whole command area of 12 ha. Design discharge of outlet is 1cusec. On the basis of
these values, volume of water delivered per irrigation is calculated. Total estimated
volume of water supplied in one irrigation is 187 ha-cm. From this value, the actual
depth of irrigation supplied to crop is obtained as 15.58 cm. which is 5.58 cm more
than the desired depth of 10cm. Hence, on every irrigation 5.58 cm of extra depth is
applied. The actual depth of water applied by farmers in the field is 84 cm in kharif
and 187 cm in rabi. Volume of water delivered in rabi and kahrif is 2244 ha-cm
and 1008 ha-cm. Total volume of irrigation water used for production in both
season is 3252 ha-cm.
4.4.5 Assessment of water losses
The difference in water required for desired depth of irrigation by farmers
and actual depth of water delivered to achieve desired depth from outlet was
considered as water losses. To achieve the desired depth of 10 cm, farmers supply
15.58 cm of depth. It is the extra depth of 5.58 cm which converted into losses.
Demand of water per irrigation of 10 cm depth is 120 ha-cm but volume of water
19.5
27 28.5
27
5
0
5
10
15
20
25
30
January February March April May
Day
s
Month

46
delivered to the field is 187 ha-cm. This excess volume of 67 ha-cm is loss per
irrigation. Volume of water lost in kharif 360 ha-cm and volume of water lost in
rabi 804 ha-cm. Total volume of water lost in both seasons is 1164 ha-cm.
4.4.6 Application Efficiency
In the present study, the losses were as estimated through questionnaire for
the study area. The basis of application losses calculations was kept considering the
definition of application efficiency given by Bos and Nugteren (1990). Application
Efficiency of the check was estimated as 64.18% and losses were estimated as
35.82 %. These losses include evaporation loss, seepage loss and runoff loss.
Evaporation losses are negligible as compared seepage losses and runoff losses, and
these two losses can be minimized with effective conveyance system.
4.4.7 Improving conveyance efficiency by providing closed conduit canal
network
Rahman et al. (2011) revealed that average conveyance efficiency of PVC
buried pipe ranged from 94.46 % to 95.37 %t and rate of water loss ranged from
5.45% to 9.55%. The evaporation losses, however of the negligible amount as
compared to seepage losses, can also be controlled through the closed conduit
networking. The pipe line/closed conduit networking can also facilitate the adaption
of micro irrigation.
Fig 4.4: Irrigation requirement in Rabi and Kharif (ha-cm)
Rabi, 1440
Kharif, 648

47
Fig 4.5: Volume of water lost in Rabi and Kharif (ha-cm)
Fig 4.6: Application efficiency and losses (%)
4.5 Design of Underground Pipeline System
4.5.1 Selection of type of system
Topographic survey of the study area is conducted and average ground
slope was calculated as 0.8%, Hence it is found that topography is relatively flat.
The closed pipe system does not require dissipation of excess energy head and the
entire pipeline is hydraulically connected. These are the systems which are widely
adopted now in flat agricultural land (Murthy,2002). Hence closed pipe system is
selected and designed for the study area.
4.5.2 Pipe material of the pipe line
Polyvinyl chloride (PVC) and polyethylene (PE) are used to a great extent
in irrigation. However, the availability of low-cost PVC pipes and easy handling
Kharif, 360
Rabi, 804
Application
efficiency
64.18
Losses
35.82

48
because of their light–weight, gives them the potential of being the alternative to
replace the concrete open channel. PVC pipes are not affected by any of the
chemical. Concrete pipe are affected by chemical conditions of soil. The cost of
PVC pipe depends on the pipe diameter and thickness.
4.5.3 Diameter of pipeline and frictional head losses
The pipeline friction head losses were estimated to be compared with
available head at the inlet of pipeline. If the friction head losses are less than the
available head, the diameter chosen is correct. The friction head losses in pipes was
calculated by Darcy-Weisbach equation and Hazen-Williams equation
4.5.3.1 Trial -1
4.5.3.1.1 Method -(1) Darcy-Weisbach equation
The major effort in the application of this equation is the determination of
the pipe friction coefficient which is a function of the Reynolds number Re. In
estimating the friction factor, f, Reynolds number (Re) and the relative roughness of
the pipe (e/D) were determined first. The mean pipeline flow velocity is calculated
by assuming pipe diameter.
In first trial diameter of pipe is assumed is, 160mm. The mean velocity of
flow is calculated by Continuity equation. The mean velocity of flow from 160 mm
is equal to 1.34 ms-1
. To get the Re, the kinematic viscosity of the irrigation water
(i.e., v =1.12×10⁻⁶ m2s
-1), the flow velocity (i.e., V =1.24 ms
-1) and its internal
diameter (i.e., D = 0.150 m) were used. A valve of 191428 for Reynolds number
was calculated.
Then an average value (i.e., e = 0.0165 mm) of its roughness was obtained
from literature. These values of D, Re , and e were used in determining the friction
factor, f, using the semi-empirical equation. The value of f was found to be 0.0239,
which was then used with the Darcy–Weisbach formula used to calculate the head
loss of turbulent flow in the pipeline on a rational basis.
Head loss due to friction in pipe only found as 7.62 m for the length of 560
m, which greater then available head of 4.77 m. Hence, gravity flow cannot
possible with this diameter up to desired length of 560 m.

49
Fig 4.7: Head loss by Darcy's equation with diameter 160 mm
Table 4.2: Values of head loss with corresponding distance by Darcy's formula with
pipe diameter 160 mm
Distance
(m)
Left
side
Middle
bund
Right
side
Av. of Left
&Right side
Head loss by
Darcy’s Eq.
Energy line
by Darcy Eq.
0 99.38 99.46 99.33 99.36 0.00 100.36
40 99.25 99.96 99.29 99.27 0.54 99.82
80 98.78 99.15 99.03 98.91 1.09 99.27
120 98.69 98.83 98.74 98.72 1.63 98.73
160 98.25 98.48 98.30 98.28 2.18 98.18
200 97.83 98.28 97.75 97.79 2.72 97.64
240 97.41 97.83 97.27 97.34 3.27 97.09
280 97.18 97.60 97.00 97.09 3.81 96.55
320 96.77 97.34 96.61 96.69 4.36 96.00
360 96.43 97.03 96.51 96.47 4.90 95.46
400 96.40 96.64 96.23 96.31 5.45 94.91
440 95.87 96.26 95.71 95.79 5.99 94.37
480 95.78 96.05 95.66 95.72 6.53 93.83
520 95.33 95.64 95.12 95.23 7.07 93.29
560 95.27 95.59 95.10 95.18 7.62 92.74
4.5.3.1.2 Method- (2) Hazen-Williams equation
Again assuming the diameter of pipeline same as canal outlet i.e., 160 mm
and head loss due to friction is calculated by another most commonly used equation
known as Hazen-Williams equation. This equation calculates the head losses in
92.00
93.00
94.00
95.00
96.00
97.00
98.00
99.00
100.00
101.00
0 100 200 300 400 500 600 700
Ele
vati
on
, (m
)
Distance, (m)
Left side
Middle bund
Right side

50
terms of readily available variables. Slope factor used in this equation is slope of
energy gradient line. A value of Hazen-Williams constant c is equal to 150 obtained
from literature. Maximum design discharge is same as 0.027 m3s
-1. Total head loss
for length of 560 m due to friction in pies only calculated 5.25 m. This is more than
the available head of 4.77 m.
Fig 4.8: Head loss by Hazzen-williams equation with diameter 160 mm
Table 4.3: Values of head loss with corresponding distance by Hazzen-williams
formula with pipe diameter 160 mm
Distance
(m)
Left
side
Middle
bund
Right
side
Av.of Left
&Right
side
Head loss
by Hazzen-
William eq.
Energy line
by Hazzen
William eq.
0 99.38 99.46 99.33 99.36 0.00 100.36
40 99.25 99.96 99.29 99.27 0.37 99.99
80 98.78 99.15 99.03 98.91 0.75 99.61
120 98.69 98.83 98.74 98.72 1.12 99.24
160 98.25 98.48 98.30 98.28 1.50 98.86
200 97.83 98.28 97.75 97.79 1.87 98.49
240 97.41 97.83 97.27 97.34 2.25 98.11
280 97.18 97.60 97.00 97.09 2.62 97.74
320 96.77 97.34 96.61 96.69 2.99 97.37
360 96.43 97.03 96.51 96.47 3.37 96.99
400 96.40 96.64 96.23 96.31 3.75 96.61
440 95.87 96.26 95.71 95.79 4.12 96.24
480 95.78 96.05 95.66 95.72 4.50 95.86
520 95.33 95.64 95.12 95.23 4.87 95.49
560 95.27 95.59 95.10 95.18 5.25 95.11
93.00
94.00
95.00
96.00
97.00
98.00
99.00
100.00
101.00
0 100 200 300 400 500 600 700
Ele
vat
ion
, (m
)
Distance, (m)
Left sideMiddle bundRight sideAv.of Left &Right sideEnergy line by Hazzen william

51
4.5.3.2 Trial-2
Next available higher size of diameter in market is 200 mm. Assuming
diameter of pipe 200 mm repeating the calculations.
3.5.3.2.1 Method - (1) Darcy-Weisbach equation
The mean velocity of flow from 200 mm is equal to 0.86 m s-1
. To get the
Re, the kinematic viscosity of the irrigation water (i.e., v =1.12×10⁻⁶
m2 s
-1), the
flow velocity (i.e., V = 0.86 m s-1
) and its internal diameter (i.e., D = 200 mm) were
used. A valve of 153571 for Reynolds number was calculated.
Then an average value (i.e., e = 0.0165 mm) of its roughness was obtained
from literature. These values of D, Re , and e were used in determining the friction
factor, f, using the semi-empirical equation. The value of f was found to be 0.0249,
which was then used with the Darcy–Weisbach formula used to calculate the head
loss of turbulent flow in the pipeline on a rational basis. Head loss due to friction in
pipe only found as 2.63 m for the length of 560 m, which less then available head
of 4.77 m.
Fig 4.9: Head loss by Darcy's equation with diameter 200 mm
93.00
94.00
95.00
96.00
97.00
98.00
99.00
100.00
101.00
0 100 200 300 400 500 600 700
Ele
vat
ion,m
Distance,m
Left side
Middle bund
Right side
Av.of Left &Right side

52
Table 4.4: Values of head loss with corresponding distance by Darcy's formula with
pipe diameter 200 mm
Distance
(m)
Left
side
Middle
bund
Right
side
Av. of Left &
Right side
Head loss
by Darcy’s
Eq.
Energy line
by Darcy
Eq.
0 99.38 99.46 99.33 99.36 0.00 100.36
40 99.25 99.96 99.29 99.27 0.19 100.17
80 98.78 99.15 99.03 98.91 0.38 99.99
120 98.69 98.83 98.74 98.72 0.56 99.80
160 98.25 98.48 98.30 98.28 0.75 99.61
200 97.83 98.28 97.75 97.79 0.93 99.43
240 97.41 97.83 97.27 97.34 1.13 99.23
280 97.18 97.60 97.00 97.09 1.31 99.05
320 96.77 97.34 96.61 96.69 1.50 98.86
360 96.43 97.03 96.51 96.47 1.69 98.67
400 96.40 96.64 96.23 96.31 1.88 98.48
440 95.87 96.26 95.71 95.79 2.07 98.30
480 95.78 96.05 95.66 95.72 2.25 98.11
520 95.33 95.64 95.12 95.23 2.44 97.92
560 95.27 95.59 95.10 95.18 2.63 97.73
3.5.3.2.2 Method - (2) Hazen-Williams equation
Again assuming the diameter of pipelines same as canal outlet i.e., 200 mm
and head loss due to friction is calculated by another most commonly used equation
known as Hazen-Williams equation. This equation calculates the head losses in
terms of readily available variables. Slope factor used in this equation is slope of
energy gradient line. A value of Hazen-Williams constant c is equal to 150 obtained
from literature. Maximum design discharge is same as 0.027 m3/s. Total head loss
for length of 560 m due to friction in pies only calculated as 1.77 m, which is less
than the available head 4.77 m.

53
Fig 4.10: Head loss by Hazzen-williams equation with diameter 200 mm
Table 4.5: Values of head loss with corresponding distance by Hazzen-williams
formula with pipe diameter 200 mm
Distance
(m)
Left
side
Middle
bund
Right
side
Head loss by
Hazzen-
William Eq.
Energy line
by Hazzen
William Eq.
0 99.38 99.46 99.33 0.00 100.36
40 99.25 99.96 99.29 0.13 100.23
80 98.78 99.15 99.03 0.25 100.11
120 98.69 98.83 98.74 0.38 99.98
160 98.25 98.48 98.30 0.51 99.85
200 97.83 98.28 97.75 0.63 99.73
240 97.41 97.83 97.27 0.76 99.60
280 97.18 97.60 97.00 0.89 99.47
320 96.77 97.34 96.61 1.01 99.35
360 96.43 97.03 96.51 1.14 99.22
400 96.40 96.64 96.23 1.27 99.09
440 95.87 96.26 95.71 1.39 98.97
480 95.78 96.05 95.66 1.52 98.84
520 95.33 95.64 95.12 1.65 98.71
560 95.27 95.59 95.10 1.77 98.59
Calculated value of head loss obtained from Darcy–Weisbach equation is
considered as final value of head loss. The reason is that this equation estimate
more accurate values then other equations.
93.00
94.00
95.00
96.00
97.00
98.00
99.00
100.00
101.00
0 200 400 600 800
Ele
vati
on
, m
Distance,m
Left sideMiddle bundRight sideAv.of Left &Right sideEnergy line by Hazzen william

54
4.5.6 Head loss due to valves and fittings
All outlets are assumed to be opened at the same time, therefore, their
energy losses were considered in the friction head losses of the pipeline. They were
estimated by applying a coefficient K, which was obtained from literature, to the
velocity head at the outlet. Total value of minor head loss is obtained as 0.13 m.
4.5.7 Bed slope of pipeline
Bed slope of pipeline is equal to existing ground slope and minimum depth
of pipeline below ground level is 0.50 m. While selecting the bed slope both of
these factors are considered. Also slope is selected such that it does not require over
fall structure because they cause loss of head available head. Fig 4.13 shows
different bed slope grades with natural topography of study area. 0.7% and 0.75%
slopes do not confirm the depth below ground level requirement. Bed slope of pipe
line is selected as 0.8% as it confirms the depth below ground level requirement
without any auxiliary structure.
Fig 4.11: Different bed slope
Table shows depth of pipeline with respect to ground elevation at left side,
Right side, Middle bund and average valve of left and right field. The value
decreases from 0.5 m after 560 m length however length of pipeline is 560 m.
93.00
94.00
95.00
96.00
97.00
98.00
99.00
100.00
101.00
0 100 200 300 400 500 600
Ele
vati
on
,m
Distance,m
Left sideMiddle bundRight sideAv.of Left &Right side.7%BGL0.75% BGL.8%BGL

55
Table 4.6: Depth of pipeline below ground level (m)
Distance
(m)
Difference
between left
side and .8%(m)
Difference
between right
side and .8%(m)
Difference
between
Av. and
.8%(m)
Difference
between middle
bund and .8%(m)
0 0.63 0.58 0.60 0.70
40 0.81 0.86 0.83 1.52
80 0.67 0.92 0.79 1.04
120 0.89 0.94 0.92 1.03
160 0.78 0.83 0.80 1.01
200 0.67 0.59 0.63 1.12
240 0.57 0.43 0.50 0.99
280 0.67 0.48 0.58 1.08
320 0.58 0.41 0.49 1.14
360 0.56 0.64 0.59 1.15
400 0.85 0.67 0.76 1.08
440 0.64 0.47 0.55 1.03
480 0.87 0.75 0.81 1.14
520 0.73 0.53 0.63 1.05
560 1.00 0.82 0.91 1.31
4.5.8 Energy line and outlets
The head loss due to friction up to distance of 560 m is 2.63 m and minor
losses are 0.13 m. Hence the total head loss is 2.76 m. Height of water in the inlet
structure is .90 m and gain of head due to slope is 4.18 m. Total head available is
5.08 m. Average height from underground pipeline to middle bund is 1.0 m. The
1m height from the pipeline sufficient for all outlets.
Fig 4.12: Outlets of the system
93
94
95
96
97
98
99
100
101
0 100 200 300 400 500 600 700
Ele
vati
on
,m
Distance,m
Outlet
Left side
Middle bund
Right side
Water surface
Pipeline
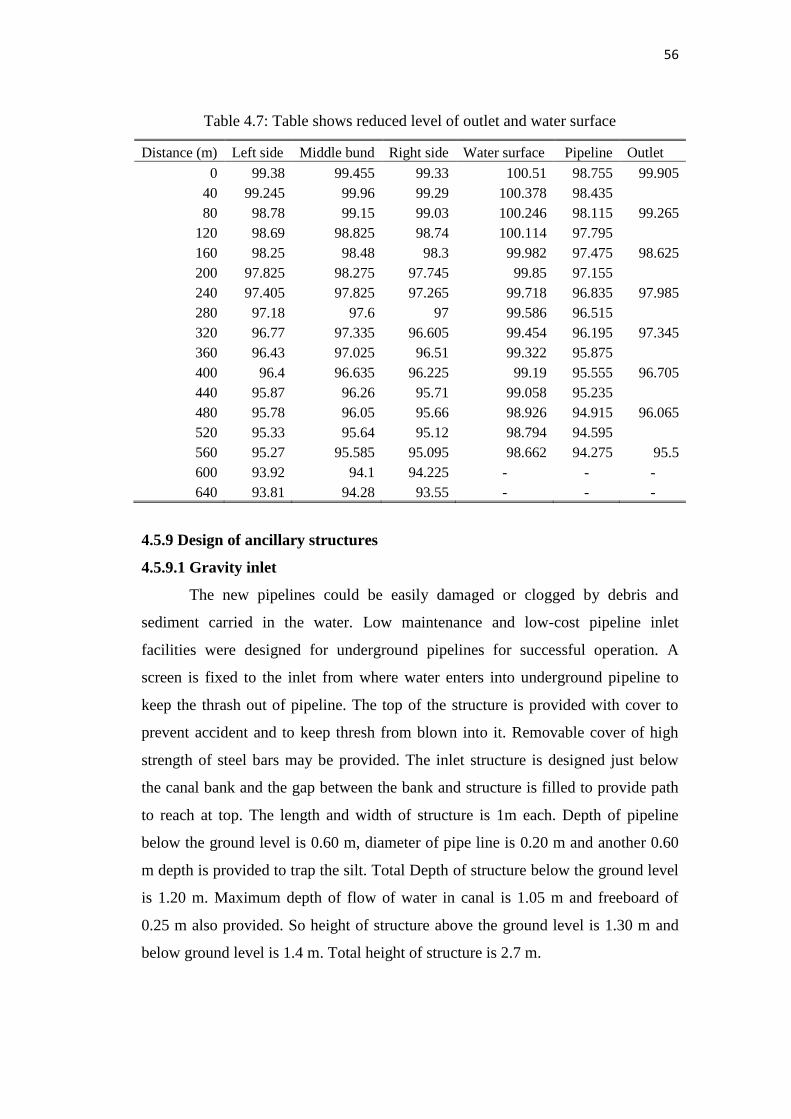
56
Table 4.7: Table shows reduced level of outlet and water surface
Distance (m) Left side Middle bund Right side Water surface Pipeline Outlet
0 99.38 99.455 99.33 100.51 98.755 99.905
40 99.245 99.96 99.29 100.378 98.435
80 98.78 99.15 99.03 100.246 98.115 99.265
120 98.69 98.825 98.74 100.114 97.795
160 98.25 98.48 98.3 99.982 97.475 98.625
200 97.825 98.275 97.745 99.85 97.155
240 97.405 97.825 97.265 99.718 96.835 97.985
280 97.18 97.6 97 99.586 96.515
320 96.77 97.335 96.605 99.454 96.195 97.345
360 96.43 97.025 96.51 99.322 95.875
400 96.4 96.635 96.225 99.19 95.555 96.705
440 95.87 96.26 95.71 99.058 95.235
480 95.78 96.05 95.66 98.926 94.915 96.065
520 95.33 95.64 95.12 98.794 94.595
560 95.27 95.585 95.095 98.662 94.275 95.5
600 93.92 94.1 94.225 - - -
640 93.81 94.28 93.55 - - -
4.5.9 Design of ancillary structures
4.5.9.1 Gravity inlet
The new pipelines could be easily damaged or clogged by debris and
sediment carried in the water. Low maintenance and low-cost pipeline inlet
facilities were designed for underground pipelines for successful operation. A
screen is fixed to the inlet from where water enters into underground pipeline to
keep the thrash out of pipeline. The top of the structure is provided with cover to
prevent accident and to keep thresh from blown into it. Removable cover of high
strength of steel bars may be provided. The inlet structure is designed just below
the canal bank and the gap between the bank and structure is filled to provide path
to reach at top. The length and width of structure is 1m each. Depth of pipeline
below the ground level is 0.60 m, diameter of pipe line is 0.20 m and another 0.60
m depth is provided to trap the silt. Total Depth of structure below the ground level
is 1.20 m. Maximum depth of flow of water in canal is 1.05 m and freeboard of
0.25 m also provided. So height of structure above the ground level is 1.30 m and
below ground level is 1.4 m. Total height of structure is 2.7 m.

57
Fig 4.13 (a): Isometric view
Fig 4.13 (b): Top view

58
Fig 4.13 (c): Side view
Fig. 4.13: Gravity inlet (all dimensions are in cm)
4.5.9.2 Outlets of the system
The entire command area of 12 ha was divided into 16 sections for
delivering water directly into farmers field which are away from canal outlet. 8
sections are left side of the middle bund and 8 sections are right side of the middle
bund. Eight outlets were proposed in the underground pipeline system. The outlets
deliver water to a diversion box of 45 × 45 × 45 cm. Two outlets of 200 mm
diameter were proposed in each diversion box, one for right side fields and other
for left side fields. 200 mm diameter pipe will be fixed in the diversion of suitable
length extended outside of box which should be closed by end plugs when water is
not required. The diameter of all outlets i.e., from underground pipeline to surface
diversion boxes and diversion boxes to the each side field will be same and equal to
200 mm due to reason that full flow will be diverted into any of the section. The
distance between two outlets is selected as 80 m.

59
Fig. 4.14 (a): Top view
Fig. 4.14 (b): Side view
60
Fig 4.14 (c): Isometric view
Fig 4.14: Diversion box and outlet (all dimensions are in cm)
4.5.9.3 Air vents
Air vents are vertical pipe structures to release air entrapped in the pipeline
and to prevent vacuum. The area of vent pipe should not less than the half the area
of pipeline. In no case should the diameter of the small pipe be less than 5 cm.
5 cm diameter PVC pipe is selected for air vent. First air vent is installed at
80 cm below the inlet tank. Last air vent is installed at the end of pipeline. Three air
vents are installed at 150 m, 300 m and 450 m respectively. The height of air vent is
0.25cm (freeboard) above energy line.
Fig 4.15: Air valve

61
Fig 4.16: Layout of pipe distribution network
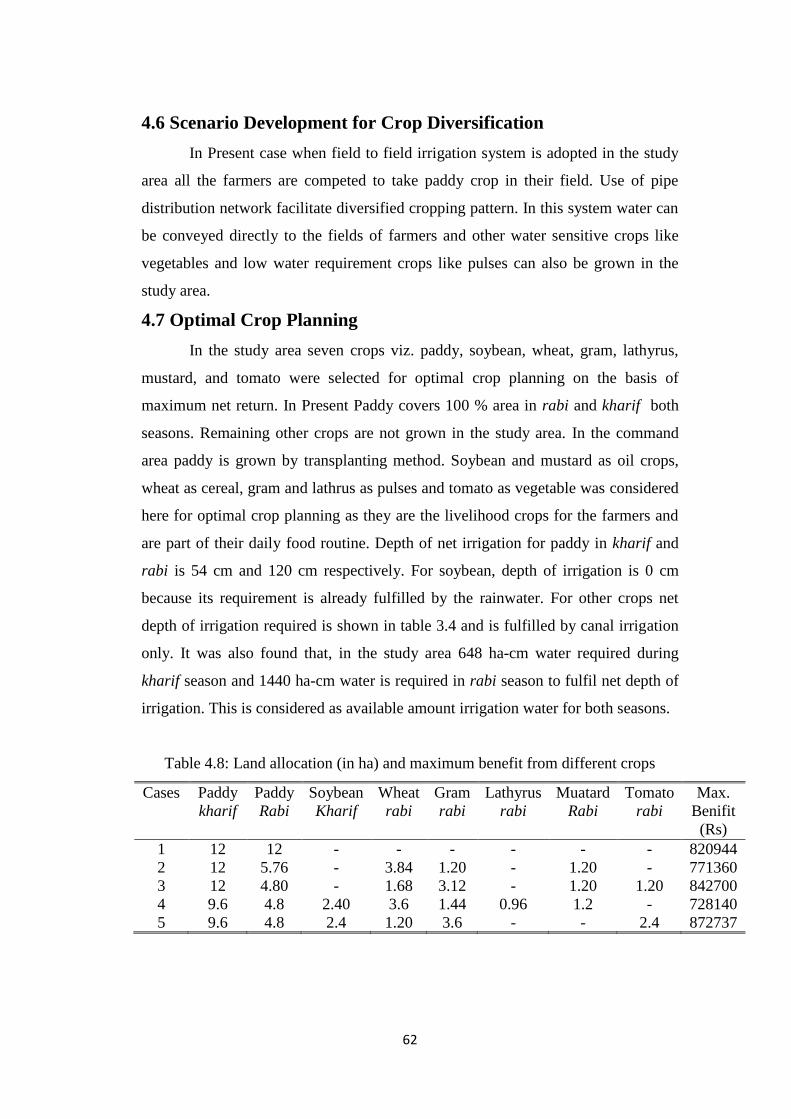
62
4.6 Scenario Development for Crop Diversification
In Present case when field to field irrigation system is adopted in the study
area all the farmers are competed to take paddy crop in their field. Use of pipe
distribution network facilitate diversified cropping pattern. In this system water can
be conveyed directly to the fields of farmers and other water sensitive crops like
vegetables and low water requirement crops like pulses can also be grown in the
study area.
4.7 Optimal Crop Planning
In the study area seven crops viz. paddy, soybean, wheat, gram, lathyrus,
mustard, and tomato were selected for optimal crop planning on the basis of
maximum net return. In Present Paddy covers 100 % area in rabi and kharif both
seasons. Remaining other crops are not grown in the study area. In the command
area paddy is grown by transplanting method. Soybean and mustard as oil crops,
wheat as cereal, gram and lathrus as pulses and tomato as vegetable was considered
here for optimal crop planning as they are the livelihood crops for the farmers and
are part of their daily food routine. Depth of net irrigation for paddy in kharif and
rabi is 54 cm and 120 cm respectively. For soybean, depth of irrigation is 0 cm
because its requirement is already fulfilled by the rainwater. For other crops net
depth of irrigation required is shown in table 3.4 and is fulfilled by canal irrigation
only. It was also found that, in the study area 648 ha-cm water required during
kharif season and 1440 ha-cm water is required in rabi season to fulfil net depth of
irrigation. This is considered as available amount irrigation water for both seasons.
Table 4.8: Land allocation (in ha) and maximum benefit from different crops
Cases Paddy
kharif
Paddy
Rabi
Soybean
Kharif
Wheat
rabi
Gram
rabi
Lathyrus
rabi
Muatard
Rabi
Tomato
rabi
Max.
Benifit
(Rs)
1 12 12 - - - - - - 820944
2 12 5.76 - 3.84 1.20 - 1.20 - 771360
3 12 4.80 - 1.68 3.12 - 1.20 1.20 842700
4 9.6 4.8 2.40 3.6 1.44 0.96 1.2 - 728140
5 9.6 4.8 2.4 1.20 3.6 - - 2.4 872737

63
Table 4.9: Land allocation for different crops (in %) and maximum benefit
Cases Paddy
kharif
Paddy
Rabi
Soybean
kharif
Wheat
rabi
Gram
rabi
Lathyrus
rabi
Muatard
rabi
Tomato
rabi
Max.
Benifit
(Rs)
1 100 100 - - - - - - 820944
2 100 48 - 32 10 - 10 - 771360
3 100 40 - 14 26 - 10 10 842700
4 80 40 20 30 12 8 10 - 728140
5 80 40 20 10 30 - - 20 872737
It is evident from the table 4.7 and 4.8 that the benefit is more in case 1
(820944 Rs) which is the current practice of taking paddy in both the season as
compared to the case 2 and case 4. In case 3, benefits are slightly more (842700
Rs). In case 5, net benefits are highest (872737 Rs). Thus it is necessary for the
farmers of command area to change the cropping pattern in rabi and kharif both
seasons for getting more profit. Water resources are sufficient for irrigating all
crops during kharif and rabi season. It is also clear from the above table that to get
higher profit from available land and water resources, all type of crops must be
taken by the farmers. This will also ensure their nutritional security.
In case 5 benefits are highest and it covers crops such as cereals, pulses,
oilseed and vegetable and benefits are also 51793 Rs. more than existing condition,
also there is water saving 1.30 ha-m (20 %) in kharif and 5.82 ha-m (40.14%) in
rabi. This water can be used for irrigating additional area.
4.8 Comparison between Existing and Suggested Plan
In the existing pattern total profit from same crop in two seasons were
820944 Rs, where as the profit in the suggested pattern is 872737 Rs as per case 5.
In case 5 Wheat, Gram, Mustard, and Tomato are introduced and summer paddy is
reduced. The area under kharif paddy and soybean, is 80% and 20%. The area
under rabi paddy, wheat, Gram, and Tomato is 40, 10, 30, and 20% respectively. In
this case 40.41% and 20% of available water will be saved in rabi and kharif
respectively.

64
Table 4.10: Comparison between present and suggest pattern
Crop area
(ha)
Paddy
kharif
Soybean
kharif Paddy
rabi
Wheat
Rabi
Gram
rabi
Tomato
rabi
Max.
Benifit (Rs)
Existing
pattern 12
12 - - - 820944
Suggested
pattern 9.60
2.40 4.80 1.20 3.60 2.40 872737

65
CHAPTER V
SUMMARY AND CONCLUSIONS
Water which is life for the existence of all living beings on the earth. Water
ensures food security, feed livestock, maintain organic life and fulfill domestic and
industrial needs (Kolhe,2012). The population of mankind is increasing at
distressing rate and human is tapping natural resources to cater his need. The
available resources including water and food are falling shorter to cope up with the
need of mankind. To overcome this problem it is very essential to conserve the
water in many ways and utilize it so that food production should be sufficient to
serve for mankind need at reasonably low cost. To increase food production from
agriculture land, irrigation is one of the tool to conserve the water and utilize it for
agriculture production. Irrigation sector is the biggest consumer of water as more
than 80% of available water resources in India are being presently utilized for
irrigation purposes.
Underground pipe line system (also known as buried pipe line) is being
increasingly used for conveying irrigation water on the farm. Main advantage of
these system are saving of land, elimination of seepage losses, and relatively little
maintenance need. Under most of the conditions a properly installed pipeline
system will function well for several years, however they need high initial cost as
compared to open channel.
The present study has been planned to assess the losses in present irrigation
method and use of pipe distribution network to reduce the conveyance losses. The
attempt has also been made for crop planning as per availability of water. The study
area, lies at Munrethi village in Raipur district of Chhattisgarh. Study area is comes
under canal command of Kurud irrigation tank. The average rainfall of Raipur
district is 1219 mm which is mostly received between middle of June to end of
September with occasional showers in winter. A low-lying deep bluish black soil
(Kanhar) with high moisture retention capacity was found to be dominating in the
area.

66
In the present study, the losses were estimated through questionnaire for the
study area. The current practice followed for irrigation was found to be field to field
irrigation with water being delivered from the colapa and then it passes through all
the field one by one. This practice restricts the farmers to cultivate paddy in the
canal command area. Total water required to apply 54 cm depth (CWR-ER) of
irrigation in kharif is 648 ha-cm but volume of water delivered was 1008 ha-cm
and amount of water lost and unutilized in kharif 360 ha-cm. Similarly total water
requirement in rabi for irrigation of 12 ha is 1440 ha-cm, however volume of water
delivered was 2244 ha-cm and amount of water lost and unutilized was 804 ha-cm.
Total water required for irrigation was 2088 ha-cm and total amount of water lost
and unutilized was estimated as 1164 ha-cm. Application Efficiency of the chak
was estimated as 64.18% and losses were estimated as 35.82 % based on the current
irrigation practice being followed.
Adoption of buried pipeline distributary systems had lead to the
reduction in water conveyance and distribution losses, reduction in the land area
taken up by the distribution system and reduction in the maintenance and operating
costs of the irrigation system. A chak of 12 ha having 640 m length was chosen for
design of underground pipe distribution network and controllable turnout structures.
The inlet structure of rectangular shape having 1m2 area and 2.7 m height is
designed just below the canal bank to trap silt. A screen is fixed to the inlet from
where water enters into underground pipeline to keep the thrash out of pipeline. A
20 cm diameter pipe is suitable for delivering water on bed slope of 0.8% up to the
last point at 560 m. The head loss calculated from Darcy-Weisbach equation is 2.63
m and head loss calculated from Hazzen-Williams equations 1.77 m which is less
than against the available head of 4.77 m. Air vents was found to be of 5 cm are
also provided at appropriate points to release entrapped air. The entire command
area of 12 ha was divided into 16 sections for delivering water directly into
farmer’s field which are away from canal outlet. 8 sections are left side of the
middle bund and 8 sections are right side of the middle bund. Eight outlets were
proposed in the underground pipeline system. The outlets deliver water to a
diversion box of 45 × 45 × 45 cm. Two outlets of 200 mm diameter were proposed
in each diversion box, one for right side fields and other for left side fields. 200 mm

67
diameter pipe will be fixed in the diversion of suitable length extended outside of
box which should be closed by end plugs when water is not required. The diameter
of all outlets i.e., from underground pipeline to surface diversion boxes and
diversion boxes to the each side field will be same and equal to 200 mm due to
reason that full flow will be diverted into any of the section. The distance between
two outlets is selected as 80 m.
In this study optimal crop plan is proposed which covers all crops
such as cereals, pulses, oilseed and vegetable. In the existing pattern total
profit from same crop (paddy) in two seasons were 820944 Rs., where as the profit
in the suggested pattern is 872737 Rs. as per case 5. In case 5 Wheat, Gram,
Mustard, and Tomato are introduced and paddy is reduced. The area under kharif
paddy and soybean, is 80% and 20%. The area under rabi paddy, wheat, Gram, and
Tomato is 40, 10, 30, and 20% respectively. In suggested cropping pattern benefits
are 51793 Rs. more than existing condition, also there is water saving 1.30 ha-m
(20%) in kharif and 5.82 ha-m (40%) in rabi. This water can be used for irrigating
additional area.
SUGGESTION FOR FUTURE WORK
1. Possibilities of gravity flow PDN may be explored in the other part of canal
command.
2. Gravity flow branched PDN may be planned for other part of canal
command.

68
BIBLIOGRAPHY
Aggarwal, M., (2010). Water resource planning at block level Shaheed Bhagat
Singh Nagar - a case study. Journal of Agricultural Engineering , 25(2): 50-
57.
Ahmed, C.H., (1984). Bogra Underground Asbestos Cement Pipe System. An
Economic Analysis, Proceedings of Workshop on Improved
Distribution System for Minor Irrigation in Bangladesh, Bangladesh
Agricultural Research Council (BARC).
Ayare, B.L., Mane, M.N., Sharma. A., and Dekhale, D. H (2010). Optimal cropping
pattern in command area. International Journal of Agricultural
Engineering, Vol. 3 No. 1, 5-10.
Bansal, R. K. (2008). A Textbook of Fluid Mechanics pub. Laxmi Publications
Pvt. Ltd. New Delhi.
Berrada A., Stack, M.W., and Cardon, G.E., (2001). Assessment of Irrigation Water
Management and Demonstration of irrigation Scheduling tools In full
Service Area of the Dolores Project, Part I Survey Results, Technical
Report, Colorado State University.
Bhalage, P., Jadiab, B.B., and Sangale, S. T., ( 2015 ). Case Studies of Innovative
Irrigation Management Techniques, International Conference On Water
Resources, Coastal And Ocean Engineering, Aquatic Procedia 4
pp1197 – 1202.
Bos, M.G. and Nugteren J., (1990). On Irrigation Efficiencies. International
Institute for Land Reclamation and Improvement, Wageningen.
Boustani, F and Mohammadi, H (2010). Determination of Optimal Cropping
Pattern Due to Water Deficit: A Case Study in the South of Iran. American-
Eurasian Journal Agriculture. & Environmental Science, 7 (5): 591-595
Campbell, D.E., (1984). Pipe distribution systems in groundwater development.
Agricultural Administration, Vol.16, pp. 209-227.

69
Gadekar, R. G., Kute, S., and Sathe, N. J. (2015). Optimal Utilization Of Irrigation
Water: A Case Study On Nashik Left Bank Canal [nlbc], Nashik, Indian
Journal of applied research, Vol. 5, pp.15-17.
Hinton, R. D., Quosy, D. E.D. EI., Mankarious, W. F., Talaat, A.A., and Khedr, M.,
(1997). The Performence of low pressure pipeline irrigation pipeline in
Hammmami, Egypt, Implications for design and Management, HR
Wallingford, England
Horrocks, G., Wimmer, H. L. and McMllin, P. (1994). Sedimentation and Debris
Removal Inlet Structure for Canal Pipilines, Journal of Irrigation and
Drainage Engineering, Vol.120, No. 3,pp 607-616
Jacimovic, N., Stamenic, M., Kolendic P., Dordevic D., Radanov, B. and Vladicl.,
(2015). A Novel Method for the Inclusion of Pipe Roughness in the Hazen -
Williams Equation, Faculty of Mechanical Engineering Transactions, vol.
43 pp 35-39
Jadhav, P. B., Thokal, R. T., Mane, M.S., Bhange, H.N., and Kale, S.R. (2014).
Conveyance Efficiency Improvement through Canal Lining and Yield
Increment By Adopting Drip Irrigation in Command Area,
International Journal of Innovative Research in Science, Engineering and
Technology, Volume 3, Special Issue 4, pp 120-119.
Khare. D, Jat. M. K and Ediwahyunan C., (2005).Assessment of conjunctive use
planning options: A case study of Sapon irrigation command area of
Indonesia. Journal of Hydrology (2006) 328, 764-777
Kolhe P.S., (2012). “Optimal Utilization of Irrigation Water by Use of Pipe
Distribution Network (PDN) Instead Of Canal Distribution Network (CDN)
In Command Area”, India Water Week 2012, New Delhi.
Krishi Dairy (2008). Indira Gandhi Krishi Vishwavidyalaya Raipur Publiction.
Liou,C.P., (1998). Limitations and proper use of Hazen- Williams equations,
Journal of Hydraulic Engineering, Vol. 124 (9) pp 951-954
Mniruzzaman, M., Alam, M.M., Sarkar, G.W., Islam, M.T., and Islam, M.N.,
(2012). Water Saving Techniques Through Improved Water Distribution

70
System In Deep Tubewell Area of Bangladesh, Online Journal of
Biological Sciences vol.2 (3). pp178-182
Michael, A.M. and Ojha, T. P. (1999). “ Principles of Agricultural Engineering Vol.
II” Pub. Jain Brothers, New Delhi.
Micheal, A.M, (1978). Irrigation: Theory and practice. 4th
Edition, Vikas Publishing
House Pvt. Ltd. New Delhi.
Mridha, M. A. K., (1993). “Performance of Concrete Buried Pipe Distribution
System for Surface Irrigation under Farmers Management in Tangail,
Bangladesh”, Unpublished MPhil Thesis, Loughborough University,
England
Mtolera, I., Lihaibin. L., Bao, F. D., and Maxiao, Y., (2014). Optimization of Tree
Pipe Networks Layout and Size, Using Particle Swarm Optimization. E-
ISSN: 2224-2872 Volume 13, pp219-230
Murthy, V.V.N. (2002). Text Book of Land and Water Management Engineering,
Third Edition Kalyani Publishers, New Delhi
Patel, M., Sahita, I. W., and Agnihotry, P.G.,(2014). Replacement of Sub Minors
With Pressurized Irrigation Systems: In Canal Command Area, Global
Journal for Research Analysis, Vol.3 Issue 4, pp1-2
Radhakrishna, A. R. and Ravikumar A. S.,(2014). On Demand Water Supply And
Water Use Efficiency Through Burried Pipe System- A Case Study,
International Journal of Research in Engineering and Technology,
Volume: 03 Special Issue: 06 pp156-159
Rahman, M., Kamal, A. H. M., Mamun, A. A., and Miah, S. U., (2011). Study on
the irrigation water distribution system developed by barind multipurpose
development authority. Journal of Bangladesh Association of Young
Resarchers Vol.1(2), pp 63-71.
Rai, R. K., and Deshmukh, S. A.,(2001). Comparative Study of Design of Sewer
Line Using Hazen Williams and Manning Equations, International
Journal of Engineering Research Volume No.5, Issue Special 1 pp : 175-
178

71
Rajmani and Singh, A.N. (2009). Assessment of conjunctive use planning of water
resources: a case study of Sultanpur district –U.P, India. Water &Energy
International. Vol. 66, No. 1, p 56-67
Satpute, M. M., Khandve, P. V., and Gulhane, M. L.,(2015). Pipe Distribution
Network for Irrigation – an Alternative to Flow Irrigation, Section VII:
Environmental Sciences, Proc. 99th Indian Science Congress, Part-II:
Abstracts of Poster Presentation. pp72-81
Schulze, E.W. (1985). An Economic Analysis of Underground Pipeline Irrigation
Delivery System Investments: A Case Study in the Texas Rice Belt,
American Journal of Agricultural Economics, pp. 1290-1297
Sethi. N.; Kumar, Panda, S and Chandra, B (2006).Optimal crop planning and
conjunctive use of water resources in a coastal river basin. Water Resources
Management, 16: 145-169
Shah, T., Krishnan, S., Hemant, P., Verma, S., Chandra, A., and Sudhir, C., (2010).
A case for pipelining water distribution in the Narmada Irrigation System in
Gujarat, India. Colombo, Sri Lanka: International Water Management
Institute. 25p. (IWMI Working Paper 141).
Shaikh, I. A.,Wayayok, A., Abdullah A. F. B., Soom, A. B. M. and Mangrio, M.,
(2015). Assessment of Water Application Losses through Irrigation
Surveys: A Case Study of Mirpurkhas Subdivision, Jamrao Irrigation
Scheme, Sindh, Pakistan, Indian Journal of Science and Technology, Vol
8(11) pp 1-15
Shinde, S.E., Ingle1, P.M., Mane, M.S., Thokal R.T. and Ayare B.L.(2015)
Optimal Cropping Pattern for Sustainable Water Use in Canal Command
area, Research Journal of Recent Sciences, Vol. 3(4), pp 25-28
Shuklodhan, T.C., Santosh, D.T., Madhusudhan M.S., Umeshkumar, S. Mazar,
A. S., Shashidhara, N., and Satiskumar, U. (2011) Studies on Impact of
Water Management Practices on Sustainable Use of Water Resources
under Tuntapur Tank in Raichur District of Karnataka. International

72
Journal of Agriculture, Environment and Biotechnology, Vol. 4, Iss.4, pp
383-388
Shyam, R and Chauhan, H.S. (1992): Equity based optimal crop planning for
Golawar Canal Command in Nainital, Bhabar (U.P.) India. Proceedings 16th
ICID European regional conference Vol2-Ecological, technological and
socio economical impacts on agricultural water management, 327-336
Singh, A.K., Jaspal Singh., Purohit, R.C., and Rashmi Singh (2005). Optimal crop
planning for Badliya command area in Rajasthan for maximizing crop
benefits - a case study. Indian-Journal-of-Soil-Conservation, 33(2): 166-169
Smout, I.K., (1999).Use of low-pressure pipe systems for greater efficiency,
Agricultural Water Management vol. 40 pp 107-110
Sodiki J. I., and Emmanuel, M. A., (2002). A Review on the Development and
Application of Methods for Estimating Head Loss Components in Water
Distribution Pipework, American Journal of Engineering Research,
Volume-3, Issue-9, pp-91-96
Srivastava, R. C., Mohanty, S., Singandhupe, R.B., Biswal A. K., Ray,L.I.P., and
D. Sahoo, (2006) Studies on Canal Water Based Pressurized Irrigation
System in a Minor Irrigation Command, Journal Agricultural
Engineering Vol. 43(4) pp 28-35
Tindula G. O. M., and Snyder, R. (2011). Survey of Irrigation Methods in
California in 2010, Journal of Irrigation and Drainage Engineering,10/
1061 pp 233-238
Yousef, A. and Faisel, Z., (2007). Improving Conveyance and Distribution
Efficiency Through Conversion of an Open Channel Lateral Canal to a Low
Pressure Pipeline at Al- Hassa Irrigation Project, Saudi Arabia, The
Arabian Journal for Science and Engineering, Volume 32, Number 1 C
pp 77-86
Yuembam, G.S and Kumar, V. (2015). Optimization of land and water resource in
Nakatiya Minor Canal command area in Udham Singh Nagar,
Uttarakhand, India, International Journal of Emerging Technologies in

73
Computational and Applied Sciences, 11(3), December 2014- February
2015, pp. 213-216

74
APPENDIX I
Leading Details of Kurud Tank
S.No Name of scheme Kurud Tank Scheme
I General Data 1 District Raipur
2 Tahsil Raipur
3 River or Nalla Local Nalla
4 Location of dam Near village Kurud
5 Name of river basin Mahanadi
6 (a) Longitude 81º-50'-35"
(b) Latitude 21º-14'-0''
7 Toposheet No. 64G/15
8 Year of start 1903
9 Year of completion 1909
II Hydrological Data 1 Mean Rainfall(over....year) 36 Years
2 Annula monsoon 49"
3 Flood maximum observed 525
III Reservior Data 1 Catchment area 5.70 sq.miles /9017sqkm
2 Gross storage capacity 202.83 M.cft/5.74 M.cum
3 Dead storage capacity 1.00 M.cft/0.028 M.cum
4 Live storage cacpcity 201.83 M.cft/5.71 M.cum
5 FTL RL 93.00
6 MWL RL 95.00
7 TBL RL 100.00
8 LSL RL 75.00
IV Pick-up-weir/Anicut 1 Independent catchment area Not necessary
2 Designed discharge DO
3 Lowest discharge Not necessary
4 Crest of weir level Not necessary
5 Maximum water level Not necessary
6 TBL of afflux bund Not necessary
7 No size and sill level of head sluice Not necessary
8 No size and level of under sluice Not necessary
V Dam Data 1 Length of dam
(a) Earth 6500/1981.20
2 Maximum height of dam earth 33'6''/10.21 m
3 Length of W/w 410 Rft /125 m
VI Canal Data

75
1 (a) Length of main canal 7.76 mile/12.42 km
(b) Length of distributry and minor 3.93 mile/6.30 km
2 Head discharge 1.2 cusecs/42 cusecs
Duty adopted 0.25 cusecs
3 Number of villages to be served 8 Nos.
Total area commanded 6958 acres/2817 Ha
Total culturable area 68066 acres/2755 Ha
Total area under cultivation (existing)
Kharif 3428 acres/1388 Ha
Rabi 250 acres/101 Ha
Total 3679 acres/1489 Ha
VII Financial
Estimated cost 1.53 Lakhs

76
APPENDIX II
Calculation of water loss and Application Efficiency
Area of chak = 12 ha
Depth water pounded in the farmers field (As per farmers information) = 4''
= 10 cm
Time required to irrigate whole chak (As per farmers information) = 8 days
= 192 hr
Discharge of outlet (colapa) = .027 m3/s
= 27 lps
Total volume of water delivered for one irrigation = .027×60×60 ×24×8
= 18662 m3
= 18700 m3
= 187 ha-cm
Depth of irrigation furnished from an outlet =
=
= 15.58cm
Volume of water required to pound 10 cm depth = 10×12
= 120 ha-cm
= 12000 m3
Time required to pound 10 cm depth in the command area =
= 123 hr

77
Amount of water lost in kharif season
Total depth of irrigation required in kharif section = (Crop water requirement
- - Effective rainfall)
= (120-66)
= 54 cm
Depth of water supplied to furnish 54cm depth
= 84.13cm
= 84cm (say)
Total amount of water supplied in kharif season from an outlet = 12 × 84
= 1008 ha-cm
Total amount of water lost in kharif = (84-54)× 12
= 360 ha-cm
= 36000 m3
Amount of water lost in rabi season
In rabi season complete water requirement of 120 cm is supplied by irrigation.
Depth of water supplied to furnish 120 cm depth
= 186.96 cm
= 187 cm (say)
Total volume of water supplied in rabi = 2244 ha-cm
Total amount of water lost in rabi season = (187-120)×12
= 804 ha-cm
= 80400 m3

78
Total amount of water lost in rabi and kharif season = 360+804
= 1164 ha-cm
= 116400 m3
Application Efficiency (AE):
The definition of application efficiency given by Bos and Nugteren (1990) which is
quantitatively expressed as
AE
= .6418
= 64.18%
Losses = 1-AE
= 1-.6418
= .3582
= 35.82 %

79
APPENDIX III
Calculation of pipe diameter and frictional head losses
Trial 1 : Assuming diameter of pipeline 160 mm
Velocity of flow through pipe (v)
Q = A ×V
.027 =
V = 1.34m/s
Reynolds number (Re):
=
= 191428
Colebrook-White equation:
Value of roughness (e) = .0165mm
For all pipes, Colebrook-White equation more reliable in evaluating f. The equation
is
= .0239
Darcy-Weisbach equation:

80
Hazen-Williams formula
5.25m
Trial 2 : Assuming diameter of pipeline 200 mm
Velocity of flow through pipe (v)
Q = A ×V
.027 =
V = .86 m/s
Reynolds number (Re)
=
= 153571
Value of roughness (e) = .0165mm
For all pipes, Colebrook-White equation more reliable in evaluating f. The equation
is

81
= .0249
Darcy-Weisbach equation
Hazen-Williams formula
1.77 m
Calculation of minor head losses
Number of 90º bend = 8
value of K for 90º bend = .3
Number of ball valves = 8
value of K for ball valves =.1
Hm2 = .0301m

82
Total minor head loss = Hm1 +Hm2
Hmt = Hm1 + Hm2
Hmt = .1017+.0301
= .13 m
Total head loss from Darcy-Weisbach equation = 2.63 +.13
= 2.76 m
Total head loss from Hazen-Williams formula = 1.77 +.13
= 1.90 m
Total available head at outlet = Head in canal + Difference in elevation at inlet and last
outlet - total head loss

83
APPENDIX IV
RAINFALL DATA
Rainfall data of 2010
Month Rainfall (mm)
January 15.4
February 8.4
March 0.8
April 4.8
May 20
June 100.6
July 419.6
August 156.2
September 298.4
October 44.6
November 7.2
December 57.2
Rainfall data of 2011
Month Rainfall (mm)
January 0.0
February 12.2
March 0.4
April 83.40
May 43.60
June 146.3
July 304.6
August 411.8
September 321.0
October 24.8
November 0
December 0
Rainfall data of 2012
Month Rainfall (mm)
January 57.9
February 2.2
March 0
April 15.8
May 0
June 214.2
July 489.4
August 449.3
September 205.8
October 12
November 32.9
December 0

84
Rainfall data of 2013
Month Rainfall (mm)
January 1.2
February 12.6
March 0
April 34.6
May 10.2
June 210.5
July 502.7
August 464.5
September 193.2
Octomder 40.4
November 0
December 0
Rainfall data of 2014
Month Rainfall (mm)
January 0
February 78.2
March 11
April 21
May 34.6
June 71.6
July 485.4
August 185.3
September 230.3
Octomder 24.8
November 0
December 0
Determination of effective rainfall for paddy
Pe = 0.8 P – 25 (if P > 75 mm/month)
Pe = 0.6 p – 10 (if P < 75 mm/month)
p = 238.29 mm/month
Pe = 1656 mm/month
Pe = 16.5cm (say)
Therefore Effective Rainfall during kharif season = 66 cm

85
APPENDIX IV
Optimal crop planning by taking different cases (case1 to 5)
Case 1

86
Case 2

87
Case 3

88
Case 4

89
Case 5