DESIGN OF EQUIPMENT SAFETY RELIABILITY FOR AN ASEPTIC LIQUID FOOD
246
School of Engineering & Design DESIGN OF EQUIPMENT SAFETY & RELIABILITY FOR AN ASEPTIC LIQUID FOOD PACKAGING LINE THROUGH MAINTENANCE ENGINEERING Thesis submitted for the degree of Doctor of Philosophy (PhD) By Sauro Riccetti Advanced Manufacturing and Enterprise Engineering January 2011
Transcript of DESIGN OF EQUIPMENT SAFETY RELIABILITY FOR AN ASEPTIC LIQUID FOOD

School of Engineering & Design
DESIGN OF
EQUIPMENT SAFETY & RELIABILITY
FOR AN ASEPTIC LIQUID FOOD
PACKAGING LINE
THROUGH MAINTENANCE
ENGINEERING
Thesis
submitted for the degree
of
Doctor of Philosophy (PhD)
By
Sauro Riccetti
Advanced Manufacturing and Enterprise Engineering
January 2011

ii
Abstract
The organisation of maintenance, in the Aseptic Liquid Food (ALF) industry, represents
an important management task that enables a company to pursue higher manufacturing
effectiveness and improved market share. This research is concerned with the process to
design and implement maintenance tasks. These two complementary processes (design
and implementation) have been thought and designed to answer the particular needs of
food industry regarding product safety and equipment reliability.
Numerous maintenance engineering researchers have focused on maintenance
engineering and reliability techniques highlighting the contribution of maintenance in
achieving world class manufacturing and competitive advantage. Their outcome
emphasizes that maintenance is not a “necessary evil” because of costs associated, but it
can be considered an “investment” that produces an added value which generates a real
company profit. The existing maintenance engineering techniques pursue equipment
reliability at minimum cost; but in food industry, food safety represents the most critical
issue to address and solve.
The research methodology chosen is based on case studies coming from ALF industries.
These show that low maintenance effectiveness could have dramatic effects on final
consumers and on the company’s image and underline the need of a maintenance design
and implementation process that takes into consideration all critical factors relevant to
liquid food industry. The analysis of measurable indicators available, represents a tool
necessary to show the status of critical performance indicators and reveals the urgency of
a research necessary to address and solve the maintenance problems in food industry.
The literature review underlines the increasing regulations in place in food industry and
that no literature is available to define a maintenance design and implementation process
for ALF and in general for food industry. The literature review enabled also the gap
existing between theory and real maintenance status, in the ALF, to be identified and the
aim of the research was to explore this gap. The analysis of case studies and Key
Performance Indicators (KPI’s) available highlights the problem and the literature review
provides the knowledge necessary to identify the process to design and implement
maintenance procedures for ALF industry.

iii
The research findings provide a useful guide to identify the process to design
maintenance tasks able to put under control food safety and equipment reliability issues.
Company’s restraining forces and cultural inertia, that work against new maintenance
procedures, have been analysed and a maintenance implementation process have been
designed to avoid losing the benefits produced by the design phase. The analysis of
condition monitoring systems shows devices and techniques useful to improve product
safety, equipment reliability, and then maintenance effectiveness.
This research aimed to fill the gap in the existing literature showing the solution to
manage both food safety and production effectiveness issues in food industry. It identifies
a maintenance design process able to capture all conceivable critical factors in food
industry and to provide the solution to design reliable task lists. Furthermore, the
maintenance implementation process shows the way to maximize the maintenance design
outcome through the empowerment of equipment operators and close cooperation with
maintenance and quality specialists. The new maintenance design and implementation
process represents the answer to the research problem and a reliable solution that allows
the food industry to improve food safety and production effectiveness.
iv
Table of contents
Abstract……………………………………………………………. … ii
Table of contents………………………………………………….. … iv
List of figures……………………………………………………... … x
List of tables………………………………………………………. … xiii
Glossary of terms………………………………………………….. … xiv
Statement of original authorship………………………………….. … xvi
Acknowledgement………………………………………………… … xvii
1 INTRODUCTION……………………………………………….. … 1
1.1 The ALF industry threat: increasing regulation on product safety... … 1
1.2 Background of the research: food safety problems produced by
low equipment reliability…………………………………………..
…
2
1.2.1 The ALF process and criticalities…………………………………. … 2
1.2.2 The main research problem……………………………………….. … 4
1.2.3 The effects of equipment stop in the ALF industry……………….. … 4
1.3 Development of a process to design and implement maintenance
task lists……………………………………………………………
…
5
1.4 Condition monitoring to reduce human errors and their impact on
product safety……………………………………………………...
…
6
1.5 Aims and objectives and their justification……………………….. … 7
1.6 Methodology………………………………………………………. … 7
1.7 Conclusion………………………………………………………… … 8
2 ALF CRITICALITIES AND MAINTENANCE NEEDS
SHOWN BY CASE STUDIES…………………………………..
…
10
2.1 Introduction……………………………………………………….. … 10
2.2 Problems, threats and opportunities in the ALF industry…………. … 10
2.3 Analysis of case studies to address the need of a maintenance
process for ALF industry…………………………………………..
…
12
2.3.1 First case study: product contamination due to scratch in the
packages…………………………………………………………...
…
12
2.3.2 Second case study: product contamination due to package
integrity problems………………………………………………….
…
14
v
2.3.3 Third case study: product contamination due to mineral oil
leakage……………………………………………………………..
…
16
2.3.4 Fourth case study: unsterile packages randomly distributed over
different production runs…………………………………………..
…
18
2.3.5 Peanut case shows holes in product safety net……………………. … 22
2.3.6 Analysis of case studies and lessons learned……………………… … 24
2.4 Food safety system certification (FSSC)………………………….. … 26
2.5 Conclusion………………………………………………………… … 28
3 CRITICAL STUDY OF MAINTENANCE ENGINEERING
TECHNIQUES AVAILABLE IN THE LITERATURE………
…
29
3.1 Introduction……………………………………………………….. … 29
3.2 Equipment availability through reliability, maintainability, and
supportability………………………………………………………
…
29
3.3 Product safety techniques…………………………………………. … 35
3.3.1 Product safety through the application of HACCP methodology…. … 35
3.3.2 Application of HAZOP (HAZard OPerability)…………………… … 41
3.4 Maintenance engineering techniques……………………………... … 43
3.4.1 Reliability centered maintenance (RCM) technique……………… … 43
3.4.2 Failure reporting and corrective action system (FRACAS)………. … 45
3.4.3 Quantitative failure measures through statistical analysis………… … 46
3.4.4 Qualitative analysis through Ishikawa, cause mapping and root
cause analysis……………………………………………………...
…
55
3.4.5 Other qualitative failure analysis tools..…………………………... … 59
3.5 Maintenance engineering techniques for the implementation
process……………………………………………………………..
…
62
3.5.1 Total productive maintenance (TPM) technique………………….. … 62
3.5.2 World class manufacturing (WCM)………………………………. … 69
3.5.3 Total quality maintenance (TQMain) technique………………….. … 72
3.5.4 Terotechnology principles………………………………………… … 73
3.6 Conclusion………………………………………………………… … 76
4 CRITICAL REVIEW OF CONDITION MONITORING
(CM) TECHNIQUES…………………………………………….
…
77
4.1 Introduction……………………………………………………….. … 77

vi
4.2 Online monitoring systems………………………………………... … 77
4.3 Condition monitoring systems to increase maintenance
effectiveness……………………………………………………….
…
79
4.3.1 Infrared thermography (IR)……………………………………….. … 80
4.3.2 Vibration analysis…………………………………………………. … 82
4.3.3 Oil analysis (Tribology)…………………………………………... … 85
4.4 Sensors for continuous monitoring (CM)…………………………. … 87
4.4.1 Conductivity sensor for cleaning in place (CIP) applications…….. … 88
4.4.2 Continuous monitoring of liquids…………………………………. … 88
4.4.3 Continuous monitoring of air quality through electronic nose……. … 89
4.5 Conclusion………………………………………………………… … 90
5 THE PROCESS TO DESIGN MAINTENANCE
PROCEDURES FOR ALF INDUSTRY………………………..
…
92
5.1 Introduction……………………………………………………….. … 92
5.2 Step one: application of HACCP methodology…………………… … 94
5.3 Step two: application of reliability centered maintenance (RCM)... … 98
5.3.1 System selection…………………………………………………... … 100
5.3.2 Boundary definition & operational mode summary………………. … 100
5.3.3 Failure analysis……………………………………………………. … 101
5.3.4 Functional and potential failure determination……………………. … 106
5.3.5 Failure mode and effect analysis (FMEA)………………………... … 107
5.3.6 Review of maintenance history…………………………………… … 112
5.3.7 Determine maintenance approach for each failure effect…………. … 113
5.4 Step three: safety & reliability analysis through HACCP & RCM.. … 119
5.5 Step four: list of priorities (safety & reliability analysis)…………. … 125
5.6 Step five: design of maintenance tasks……………………………. … 127
5.7 5.7 Conclusion…………………………………………………….. … 131
6 THE PROPOSALS FOR AN IMPLEMENTATION MODEL
FOR MAINTENANCE PROCEDURES…………………….....
…
135
6.1 Introduction……………………………………………………….. … 135
6.2 Analysis of different implementation principles………………….. … 135

vii
6.3 The design proposal of a maintenance implementation model for
ALF industry…………………………………………………….
…
140
6.3.1 Situation analysis………………………………………………….. … 140
6.3.2 Define the ALF mandatory requirements…………………………. … 143
6.3.3 Top management involvement and commitment…………………. … 143
6.3.4 Training & education campaign for implementation of new
maintenance procedures…………………………………………..
…
144
6.3.5 Design the organization to implement new maintenance
procedures………………………………………………………….
…
144
6.3.6 Restore basic or standard conditions……………………………… … 145
6.3.7 Develop a scheduled maintenance check lists…………………….. … 145
6.3.8 Develop autonomous & specialist maintenance integration……… … 151
6.4 The key performance indicators (KPI) to monitor production and
maintenance effectiveness…………………………………………
…
157
6.4.1 Definitions………………………………………………………… … 157
6.4.2 Performance based on producer view……………………………... … 162
6.4.3 Performance based on equipment focus…………………………... … 163
6.4.4 Performance based on packaging material used…………………... … 163
6.4.5 Examples of calculation…………………………………………... … 164
6.4.6 Overall equipment effectiveness………………………………….. … 169
6.4.7 How to measure maintenance effectiveness………………………. … 171
6.4.8 Analysis of KPI and task list improvement……………………….. … 175
6.5 Conclusion………………………………………………………… … 176
7 CRITICAL FACTORS IN THE DESIGN &
IMPLEMENTATION PROCESS WITH RELATIVE
SOLUTIONS……………………………………………………...
…
179
7.1 Introduction……………………………………………………….. … 179
7.2 Technical drawbacks……………………………………………… … 180
7.2.1 Equipment reliability and technological problems………………... … 180
7.2.2 Lack of technical documentation, training and service support…... … 181
7.3 Organizational drawbacks………………………………………… … 182
7.3.1 Lack of autonomous maintenance carried out by the equipment
operator…………………………………………………………….
…
182

viii
7.3.2 Lack of management commitment and involvement……………... … 183
7.3.3 Lack of a planning & measuring system………………………….. … 184
7.4 Cultural drawbacks………………………………………………... … 184
7.4.1 Old management culture………………………………………….. … 184
7.4.2 Workforce culture…………………………………………………. … 185
7.4.3 Training for equipment operators and maintenance specialists…... … 186
7.5 Conclusion………………………………………………………… … 188
8 CONCLUSIONS…………………………………………………. … 190
8.1 Introduction……………………………………………………….. … 190
8.2 Conclusions about each research question………………………... … 190
8.2.1 Solutions to manage the effects produced by equipment failures
and downtime……………………………………………………...
…
190
8.2.2 Solutions to establish compliance with product safety directives
and standards………………………………………………………
…
192
8.2.3 Solutions to risks depending on human factor……………………. … 193
8.3 Conclusions about the critical factors to manage during the design
and implementation process……………………………………….
…
194
8.3.1 Solution to technical drawbacks…………………………………... … 194
8.3.2 Solution to organizational drawbacks…………………………….. … 195
8.3.3 Solution to cultural drawbacks…………………………………….. … 195
8.4 Conclusions about the research problem………………………….. … 196
8.5 Possible solutions…………………………………………………. … 197
8.6 Contribution to knowledge………………………………………... … 202
8.7 Future research and work…………………………………………. … 203
8.8 Publications arising from this work……………………………….. … 204
8.9 Limitations………………………………………………………… … 204
8.10 Summary…………………………………………………………... … 205
REFERENCES…………………………………………………... … 207
APPENDIX……………………………………………………. … 211
Appendix A: Product Safety & Equipment Reliability In food

ix
Industry Through Maintenance Engineering……………………… … 211

x
List of figures
Figure 1: Aseptic Liquid Food (ALF) process
Figure 2: The process to identify the research problem
Figure 3: Transversal sealing inductor
Figure 4: Product residues on filling pipe
Figure 5: Milk leakages on pipe connection
Figure 6: Line Availability
Figure 7: Reliability maintenance techniques
Figure 8: HACCP decision tree to identify CCPs
Figure 9: FRACAS phases
Figure 10: SPC control chart
Figure 11: General mechanical failure pattern
Figure 12: Failure Zone Model
Figure 13: Normal and cumulative distribution
Figure 14: Failure shapes
Figure 15: Ishikawa or fishbone diagram
Figure 16: Basic principles of Root Cause Analysis
Figure 17: Cause Mapping process
Figure 18: Cause mapping cause and effect boxes
Figure 19: Fault Tree Symbology represented by logic gates
Figure 20: Fault Tree applied to a light that does not illuminate
Figure 21: Production time domain with OEE formula
Figure 22: TPM’s shared task zone
Figure 23: The different steps to become an operator able to carry out AM
Figure 24: Main WCM steps
Figure 25: The TQMain Football
Figure 26: Terotechnology maintenance model
Figure 27: Life Cycle Profit (LCP)
Figure 28: Maintenance costs
Figure 29: Producer operational cost per thousand packages produced
Figure 30: Cost versus scan rate in the surveillance monitoring

xi
Figure 31: IR inspection shown high temperature on an electrical connection
Figure 32: The maintenance design process goals
Figure 33: HACCP process blocks
Figure 34: RCM process
Figure 35: List of equipment sub-systems, groups, and parts
Figure 36: Transformation of inputs in outputs in an ALF filler
Figure 37: +/-3 Std.Dev. warning lines on SPC Control Chart
Figure 38: Cause Mapping applied to overall organization’s goals
Figure 39: Failure Funnel
Figure 40: From potential to functional failure in a ball bearing
Figure 41: Process FMEA form
Figure 42: Example of a risk evaluation form
Figure 43: Decision logic tree for task selection
Figure 44: Degradation versus Failure (P-F curve)
Figure 45: A plot of different degradations versus time
Figure 46: Inspection time interval
Figure 47: FMEHA form designed for food industry
Figure 48: Example of RPN threshold
Figure 49: List of Safety & Reliability Priorities
Figure 50: Decision Logic Tree
Figure 51: The process to design maintenance tasks for ALF packaging
Figure 52: World Class Manufacturing temple
Figure 53: The TQMain interaction
Figure 54: Restraining and driving forces
Figure 55: FFA applied to a packaging line
Figure 56: From task list design to maintenance implementation
Figure 57: Level of task list complexity based on skill and knowledge
Figure 58: Overlap between operator and maintenance specialist
Figure 59: The route for Autonomous Maintenance
Figure 60: Synergy between equipment operator and maintenance specialist
Figure 61: Implementation model for ALF maintenance procedures

xii
Figure 62: Preparation, production and maintenance phases
Figure 63: Total time segments for production activities
Figure 64: Production time frames
Figure 65: Equipment availability indicators
Figure 66: KPI to measure line performance
Figure 67: Life Cycle Profit (LCP)
Figure 68: Maintenance costs
Figure 69: Manufacturing operational cost per thousand packages produced
Figure 70: Proposal of a maintenance implementation model for ALF industry
Figure 71: Technical, organizational and cultural dimensions for maintenance
management effectiveness
Figure 72: Restraining forces and countermeasures
Figure 73: TPM that works
Figure 74: Technical, organizational & cultural drawbacks with relative solutions
Figure 75: Check list implementation and improvement
Figure 76: FMEHA form for sealing inductors
Figure 77: Maintenance check list form
Figure 78: Working team goals
Figure 79: Maintenance Management System
Figure A1: Maintenance design process for food industry
Figure A2: HACCP decision tree to identify CCPs
Figure A3: Functional and potential failure
Figure A4: FMEA form
Figure A5: Decision logic for task selection
Figure A6: P-F curve
Figure A7: Inspection time interval
Figure A8: Normal failure distribution
Figure A9: Decision Logic Tree
Figure A10: Process to design maintenance task list for food industry
xiii
List of tables
Table 1: The Failure Mode Assessment and Assignment Matrix
Table 2: The twelve steps of TPM development
Table 3: Wear types on parts and information characteristics in oil monitoring
Table 4: Repetitive and chronic failures
Table 5: Failure severity classification table
Table 6: Failure occurrence classification table
Table 7: Failure detection classification table
Table 8: Guideline proposed for implementation of cleaning and maintenance activities
Table 9: Check list structure
Table A1: FMEHA form designed for food industry
Table A2: List of Priorities

xiv
Glossary of terms
ALF: Aseptic Liquid Food
AM: Autonomous Maintenance
APTU: Available Production Time Utilization
BSI: British Standards Institution
CBM: Condition Based Maintenance
CCP: Critical Control Points
CIM: Computer Integrated Manufacturing
CIP: Cleaning In Place
CM: Condition Monitoring
EEC: European Economic Community
FD: Failure Determination
FDT: Failure Detection Threshold
FFA: Force Field Analysis
FFT: Fast Fourier Transform
FMEA: Failure Modes and Effects Analysis
FMECA: Failure Modes Effects and Critical Analysis
FMEHA: Failure Mode Effect and Hazard Analysis
FR: Failure Rate
FRACAS: Failure Reporting And Corrective Action System
FSSC: Food Safety System Certification
FTA: Fault Tree Analysis
GDP: Gross Domestic Product
GMP: Good Manufacturing Practices
HACCP: Hazard Analysis of Critical Control Points
HAZOP: HAZard Operability
HRM: Human Resource Management
IR: Infrared Thermography
ISO: International Standard Organization
KPI: Key Performance Indicator
LCC: Life Cycle Cost
LCL: Lower Control Limit
LCP: Life Cycle Profit
LED: Light Emitting Diodes
JIPM: Japan Institute of Plant Maintenance

xv
JIT: Just-in-Time
MTBF: Mean Time Between Failure
MME: Machine Mechanical Efficiency
MTTR: Mean Time To Restore
MWT: Mean Waiting Time
OEE: Overall Equipment Effectiveness
OPE: Overall Process Effectiveness
OPL: One Point Lesson
PDCA: Plan, Do, Check and Act
PDF: Probability Density Function
PdM: Predictive Maintenance
P&L: Profit and Loss
PM: Preventive Maintenance
PME: Packaging Material Efficiency
PMU: Packaging Material Utilization
PT&I: Predictive Testing & Inspection
PTU: Production Time Utilization
RCA: Root Cause Analysis
RCM: Reliability Centered Maintenance
RMS: Root-Mean-Square
RPN: Risk Priority Number
RTF: Run-To-Failure
SPC: Statistical Process Control
TEI: Total Employee Involvement
Tos: Time from onset
TQC: Total Quality Control
TU: Time utilization
TQMain: Total Quality Maintenance
TPM: Total Productive Maintenance
UCL: Upper Control Limit
UHT: Ultra High Temperature
WCM: World Class Manufacturing

xvi
Statement of original authorship
I Sauro Riccetti confirm that I am the original author of this thesis and that the research
needed to produce this work was undertaken solely by me.
I confirm that this work has not been published previously nor has been used towards the
award of any degree or any qualification of the Brunel University or any other awarding
body.
Signed: …………………………………….
Date: ……………………………………….

xvii
Acknowledgment
Firstly, I would like to thank my supervisor, Dr Joe Au, who had confidence in me from
the beginning. His support and guidance over the last four years, have given me the
confidence, strength and determination to continue up to the achievement of final result. I
would like to thank my company for giving me the possibility to access the
documentation available and for the experience done over the last 28 years. Many thanks
to the managers of different aseptic liquid food companies with which I lived a lot of
rewarding experiences sharing knowledge and managing challenging projects. My
deepest thanks and love go to my family for all their patience and words of
encouragement and the sense of achievement they shared with me. Finally, I wish to
thank my God who created a man to his own image and made marvellous works. I firmly
believe that nothing could have been done without his guidance and help.

1
1. INTRODUCTION
In this chapter, the background to the research is defined starting from an analysis of
the Aseptic Liquid Food (ALF) system. Threats, coming from increasing regulations
from European legislation, are discussed as the basis, which leads the liquid food-
manufacturing units toward the design and implementation of maintenance
procedures.
Since public health can be heavily impacted by the safety and reliability of the
equipment used for aseptic packaging, the design and implementation of maintenance
procedures represent a fundamental tool to reach product safety and equipment
reliability.
Justification for the research is discussed through the identification of the main
research problem, formulation of the research questions, and definition of aims and
objectives.
This chapter answers to the following questions:
What are the ALF criticalities?
What are the potential problems caused by equipment failures and stops?
What are the mandatory product safety requirements in the ALF industry?
How to reduce uncertainties due to human factor?
What are the aims, the objectives, and justification for this research?
What methodology has been used to develop the research?
The first chapter provides an answer to these questions and highlights the main
maintenance process requirements.
1.1 The ALF industry threat: increasing regulation on product safety
Compliance with product safety EEC directives and international standards represent
a mandatory requirement for those who operate in the ALF industry. Current
legislation on ALF packaging call for the producers to identify the equipment critical
control points in order to put them under control during the different production
phases [1]. In the ALF packaging, the following are some of the functions that can be
considered as critical to satisfy product and process requirements:
Cleaning
Product sterilization
Equipment sterilization

2
Package forming, filling and sealing
Package handling.
Manufacturers of food products have to comply with legal requirements. For example,
EEC directive 92/46 [2] specifies composition, safety, hygiene and labelling. At the
present time, rules, guidelines and regulations, covering Good Manufacturing
Practices (GMP) for long-life products, are being formulated in an increasing number
of countries, either on a voluntary or legislative basis. Furthermore Hazard Analysis
of Critical Control Points (HACCP) is a production process control methodology
introduced at the European Community level through the EEC directive 93/43 [3].
HACCP identifies and assesses specific hazards, estimates risks and establishes
control measures that emphasize product safety and its control rather than reliance on
end product testing and traditional inspection methods [4]. HACCP presumes that not
all phases of a food production process are dangerous to man. Therefore, its attention
is concentrated on analyzing only process and equipment critical control points and
not the whole production process.
1.2 Background of the research: food safety problems produced by
low equipment reliability
This section deals with the production process in place in the ALF industry (main
process): starting from raw liquid product, UHT sterilization, aseptic packaging, up to
storage and distribution. Equipment and process criticalities are defined together with
potential interactions existing between equipment reliability and product safety.
1.2.1 The ALF process and criticalities
The manufacturing process for an ALF is based on three main operations:
(a) Product processing (UHT sterilization)
Product processing covers the processes from the raw product inlet tank of the Ultra High
Temperature (UHT) sterilizer, to the product inlet valve of the aseptic filling equipment.
The inlet product is sterilized through different technical solutions, but a commercially
sterile food, as result, must be free from toxins, pathogenic micro-organisms, and micro-
organisms that can grow under normal storage and distribution conditions.

3
(b) Aseptic packaging (aseptic filling)
Aseptic packaging covers the processes from the product filling valve (of the filling
machine) to the final closure of containers. The sterile product is pumped into a sterile
environment to be introduced in the packaging material normally sterilized by the aseptic
filler. Package filling, forming, sealing and cutting are critical operations necessary to
produce a hermetic filled package ready to be stored and distributed.
(c) Package distribution and storage
Package distribution covers the processes from the filling machine output to the storage of
the packages (distribution machines such as straw applicator, tray packers, and palletizer
are normally used for this purpose). Figure 1 below shows the three main blocks
regarding ALF process.
Figure 1: Aseptic Liquid Food (ALF) process
An ALF process must satisfy four main requirements:
Raw liquid product sterilization
Aseptic packaging
Production of hermetic sealed packages and
Package integrity preservation during distribution and storage.
The raw product must be sterilized, packed, and kept sterile during the different phases of
its shelf life. To achieve this result, the liquid product must follow an aseptic transfer
throughout the whole process. After product sterilization, the liquid is pumped into a
container that has been previously sterilized. The sterile product conserved in the closed
package can be contaminated at any time if package integrity is lost. A small hole, of the
dimension of one micrometer, produced by a scratch or due to bad package sealing, may
produce product contamination. Some critical functions, such as:
Equipment sterilization
Package filling, forming, cutting, sealing
Package handling
Raw
Product
UHTSterilization
AsepticPackaging
PackageDistribution& Storage
End
Product
4
might cause product contamination if an appropriate maintenance activity is not
carried out on the line equipments. Product contamination can be dangerous to public
health and the production unit responsible for such problem can be forced to close
down its activity.
1.2.2 The main research problem
A maintenance process, to maintain the equipment criticalities under control, represents a
mandatory requisite to insure equipment reliability, to avoid negative interactions
between equipment and product safety. Since a machine failure can have such a
tremendous impact on the public health and on the whole manufacturing company, all the
conceivable reasons of equipment failure must be identified and monitored to eliminate
possible risks to human health. Lack of maintenance procedures, designed and
implemented to keep the process “in control”, may also result in heavy losses and low
market share due to a poor product safety and quality. In spite of these requirements and
stringent health and safety regulations, many companies in liquid food processing show
appalling complacency when it comes to investigating the reasons behind low process
safety and reliability. This research will investigate the effects produced by the equipment
failures, downtime on product safety to highlights the necessity of a maintenance process
specifically designed for the ALF industry. Because no literature is available to define a
maintenance design and implementation process for ALF industry, the effects of some
equipment failures can represent a serious risk for the final consumer’s health resulting
also in a big market share loss for the company responsible for such an event.
1.2.3 The effects of equipment stop in the ALF industry
While in mechanical industry a machine stop could have a low economical impact on
production cost, in the ALF industry, equipment stop must often be followed by
equipment cleaning and sterilization before a new production start. Product and
package waste, together with other raw materials waste, create a strong impact on
total production costs. Moreover the downtime necessary to clean, sterilize the
equipment and the different criticalities to manage before a new production start,
determine higher costs and product safety risks. Before a production run can start, the
following two conditions need to be satisfied:
1. Equipment cleaning

5
Surfaces in tanks, pipes and other process equipment that come into contact with the
liquid product have to be properly cleaned to avoid formation of dirt and growth of
bacteria. A cleaning procedure normally involves a pre-rinsing with water, cleaning with
detergents and chemical agents and post-rinsing with clean water.
2. Equipment sterilization
For UHT products, sterilization by means of heating or with chemicals is necessary to
sterilize the equipment in order to render the surfaces completely free from bacteria.
The nature of the technology used means that, the average time needed to perform a
cleaning program and then equipment sterilization can vary from two to four hours. Both
these operations must be carried out every time that the equipment is stopped for
whatever reason. Sometimes the filling machine stop involves the processing equipment
stop and vice versa. In such cases, a machine fault creates a big disturbance to the whole
process since all the equipment must be stopped to carry out the cleaning and sterilization
programme. Therefore, while the time necessary for preventive maintenance activities can
be properly reserved, an extraordinary failure will produce disturbance to the planned
production and heavy losses due to the unexpected downtime.
Lack of maintenance procedures, or a maintenance approach based on reactive
maintenance to equipment failure, may produce biological, chemical, and physical risks
on the product packed. The process to design and implement maintenance procedures
must ensure that all conceivable critical points that may result in product contamination
have been identified and put under control through the implementation of reliable
maintenance procedures.
1.3 Development of a process to design and implement maintenance
task lists
Following the indications provided by the food safety legislations and by the GMPs,
the maintenance design and implementation process must address and solve the
problems linked to the product safety and equipment reliability. The process should
clearly identify how to design and implement maintenance procedures, roles, and
responsibilities for an effective maintenance process implementation. HACCP, GMPs
and ISO directives (mandatory and voluntary) should not represent a threat, but a real
opportunity for a company to develop a reliable maintenance solution to answer this
important question.

6
The scope of this research is to define a maintenance design process able to identify
the existing Critical Control Points (CCPs) in the production line equipments and the
relevant maintenance procedures to put under control the product safety risks.
Moreover, the research identifies an implementation process to insure an effective
implementation of maintenance procedures through the integration of different
company’s roles.
1.4 Condition monitoring to reduce human errors and their impact
on product safety
Since human errors, in monitoring and evaluating the status of equipment
components, could have a dramatic effect on product safety and system reliability, the
use of condition monitoring systems represent a necessary tool to reduce the risks
associated with “human factor”. Beyond maintenance activities, intended to maintain
the intrinsic equipment safety and reliability, the use of condition monitoring devices
will enable the equipment to be upgraded to a more reliable automatic control of
critical parameters instead of relying on human checks. In recent years, different
transducers have been developed to help equipment designers to establish automatic
monitoring of critical parameters improving therefore the intrinsic equipment safety
and reliability. These transducers translate various physical quantities related to fluids,
solids, and gas into measurable electrical signals thus enabling automatic monitoring
of critical parameters.
Such devices can be part of the equipment or be installed later on as part of a safety
upgrade project intended to monitor CCPs that might have serious effects on the final
product quality and safety. Furthermore, the use of some condition monitoring
instruments will put under automatic control variables normally controlled by
subjective checks. The integrity of a mechanical part or the heat developed by an
electrical motor can be automatically controlled by instruments, which measure both
vibration and temperature developed by the equipment’s parts or components. The use
of such tools will help to ensure that the effort spent in the design phase is not lost in
the implementation phase. Thermography, vibration analysis, and tribology, with the
related systems, will play an important role to reduce human errors and to improve
maintenance effectiveness and equipment reliability.

7
1.5 Aims and objectives and their justification
The aim of this research is to establish the highest product quality and safety through
the design and implementation of maintenance procedures specifically addressed to
ALF industry. The process designed represents a real aim since it enables the ALF
companies to put under control food criticalities, and satisfy product safety
requirements mandatory in every country.
The main objective of this research is the production of the process to design and
implement maintenance procedures for ALF industry. The process to design and
implement maintenance procedures must acknowledge and address the following
critical variables arose in the case studies:
product safety
equipment reliability and
risks dependent on human factors.
All these variables have to be managed through a maintenance process to address
product safety and equipment reliability together with cost demands. The research
objective was the identification of CCPs in place in an ALF packaging line to design
and implement a maintenance process that allows product safety and equipment
reliability to be reached at a reasonable cost. Aims and objectives are justified by the
literature review that showed the necessity to fill the knowledge gap, regarding lack of
a maintenance process for ALF industries, to determine, as result, product safety, and
equipment reliability. Maintenance processes implemented in other industrial fields,
normally pursue quality, reliability, efficiency, and cost driven issues, lack of a
maintenance process, able to manage food product safety critical issues, represents the
research justification to produce as result the mentioned aims and objectives.
1.6 Methodology
The methodology used for this research is based on analysis of some case studies that
address:
The necessity of an ALF maintenance process specifically designed for this
industrial sector
The results (in terms of safety and reliability) produced by the implementation
of the maintenance process designed for the ALF industry.

8
The reason that justifies the use of this methodology, based on the case studies, is the
lack of a maintenance design and implementation process to address and solve the
questions placed in the previous sections. The primary and secondary literature
research showed that no work has been conducted by other researchers to define a
maintenance process for ALF industry.
The analysis of the case studies represented the best approach to gather information
on the ALF criticalities and on the need of a maintenance process to solve the
problems linked to the equipment used in the ALF production lines.
The research content is defined by “two levels” of literature:
Level 1: Primary literature based on company-specific material, which
provided an indication of the status of maintenance within the organizations
Level 2: Secondary literature that helped to define the research problem and
research questions.
1.7 Conclusion
In this chapter, product safety EEC directives and standards have been examined; they
represent a mandatory requirement which call the ALF industry to identify the
packaging line CCPs and the relative solutions to put them under control.
Examination of ALF process shown criticalities that link equipment reliability to
product safety: poor equipment reliability, dependent on lack of an effective
maintenance process could produce, as result, heavy consequences on product safety
and then on public health. The demands placed by the legislation, compared with the
complexities of the ALF industry lead to the identification of the research problem.
The effects produced by lack of control, of packaging line CCPs, on product safety
and on company’s costs, represent the leverage to identify the equipment criticalities
together with the solutions to put them under control. Figure 2 below summarizes the
different steps and questions that led to the identification of the research problem.

9
Figure 2: The process to identify the research problem
Section 1.4 showed the benefits coming from the use of condition monitoring devices
in improving the inherent equipment reliability through the monitoring of CCPs and
the possibility to be less dependant on the quality of subjective checks and manual
control. Aims, objectives, and their justification have been identified to describe the
added value of this research. The last section of this chapter identifies the
methodology chosen to develop this thesis and the reasons why this methodology
have been chosen.
Food Safety Legislation
Requirements
Are there
criticalities in the
ALF industry? End of process
Identification of ALF
criticalities
Do these
criticalities represent
a problem?
Identification of the
research problem
Yes
No
Yes
No
Section 1.1
Section 1.2.1
Section 1.2.2

10
2. ALF CRITICALITIES AND MAINTENACE NEEDS SHOWN
BY THE CASE STUDIES
2.1 Introduction
The industries involved in processing and packaging aseptic liquid foods, such as milk
or fruit juice, have always been conscious of the need to establish and maintain the
highest standard of hygiene. In recent years, however, this requirement has assumed
even greater importance due to changes in the market and technology. Market (that is
consumer) expectations of quality and hygiene have been rising continually together
with pressures on companies: as an effect of these trends, the organization of
maintenance has an important role to play in developing competitive advantage.
The second chapter identifies:
Problems and threats but also the opportunities in the ALF industry
Five case studies that show the criticalities of the ALF packaging lines and the
effects produced by lack of a maintenance process to design and implement
maintenance tasks
The scope and requirements of food safety certification.
This chapter describes some of the ALF market problems dealing with increased
competition, cost pressures and downsizing. It presents maintenance as an important
weapon to improve product quality and safety, to reduce costs, to comply with food
legislation, and to improve the company’s competitive advantage. Three different case
studies underlines the effects produced by lack of control of some critical points, the
economical losses produced by product contamination and the need of a maintenance
process to put the ALF criticalities under control.
2.2 Problems, threats and opportunities in the ALF industry
The competition in the ALF industry, mainly based on product price, leaves very little
room for error for a company when estimating production costs and the influence of
product safety and production effectiveness. Nowadays, cost competitiveness
represents a problem to deal with for many companies, increasing competition and
downsizing a real threat, but these two challenging inputs can be transformed into
improvement opportunities through a new approach to maintenance with positive
result on costs.

11
Increasing competition
The market for aseptic milk is becoming increasingly challenging because of free
competition within the European Community. This competition, mainly based on
consumer product price, calls for companies to reduce costs and to constantly identify
possible sources of cost reduction.
Cost reduction
The constant downward pressure on prices has resulted in increasing attempts to
reduce production and other costs. Activities, considered to be non-value adding, are
eliminated while others, such as maintenance, have been dramatically reduced in time
or frequency. Head counts are reduced progressively, affecting the ability of
maintenance personnel to undertake routine tasks and sometimes to carry out
corrective actions when breakdown occur. An extreme reaction to increased
competition is shown by those companies that postpone investments and refuse to
pursue any kind of production efficiency methodology.
Downsizing and outsourcing
Medium to large aseptic liquid food companies outsourced engineering and
maintenance work as they downsized during the 1990s. Strategic alliances and
partnerships with suppliers are created to retain capabilities the company once had in-
house and/or to gain access to new markets and new technologies.
According to Morris [5] downsizing/restructuring has, and will continue to have both
positive and negative consequences. One major effect, of course, is fewer people with
more responsibilities. Most panellists who have experienced downsizing see this trend
increasing in the future. Reduction of maintenance specialists represents a restriction
and sets the necessity to drastically reduce equipment downtime. The technical skill
necessary in the ALF requires a specific knowledge and experience over many
different areas. The outsourced personnel has in most cases general electrical or
mechanical competency, but lacks the experience necessary do deal with ALF
problems. It has been stated that at least an experience of 3-4 years is necessary to
deal with the standard level of equipment troubles.
In conclusion, downsizing creates three different problems:
Low equipment efficiency due to the lack of experience in operating the
machine

12
Low supportability due to fewer specialists available to carry out corrective
maintenance activities
Low equipment reliability due to the inability of outsourced personnel to cope
with all ALF requirements.
Despite the threats coming from the increasing competition, successful companies
continue to implement Total Quality Management (TQM) programs, Just In Time
(JIT) procedures, new technologies and new maintenance techniques to improve
equipment effectiveness and product quality.
New approaches to maintenance
The external pressures on food processors, from increasing health and safety
legislation and regulation and increasing competition, continue to focus attention on
the maintenance function, which has to be seen not simply in terms of compliance or
the avoidance of problem, but as a potential contributor to creating competitive
advantage. While the state of art of the technology used today allows a reduction of
critical control points that depend on human control, maintenance remains the only
available tool to improve product safety, equipment reliability, and availability.
2.3 Analysis of case studies to address the need of a maintenance
process for ALF industry
Under this heading, the analysis of some case studies will underline the need for a
maintenance process specifically designed for ALF industry. The process for
designing and implementing maintenance procedures should address and provide
answers to all mandatory requirements placed by the law and by the GMPs applied to
this industrial sector.
2.3.1 First case study: product contamination due to scratch in the packages
This case study comes from a company that produces pasteurized and UHT white and
chocolate milk.
(a) Equipment setup
Two different sterilizers supply the aseptic product to the filler with an average
capacity of 15.000 l/h. The aseptic transfer has been realized through an aseptic tank

13
with a capacity of 25.000 litres. Four different filling machines are used to pack white
milk and chocolate milk.
(b) Problem description
The company experienced an unsterility problem on one production line that caused a
direct economic loss higher than 450.000 Euro.
The production manager claimed that this economic loss was only due to direct costs
arising from:
- packaging material waste
- product waste and
- operator salary.
The unsterility was discovered through a product sampling scheme where four
packages were drawn every 15 min. and incubated at 32° C. The evaluation done after
four days, by means of product pH measurement, confirmed with plating, identified
product contamination. After further investigation, carried out through a destructive
testing on packages produced, some micro holes with plastic lumps were found on the
longitudinal sealing of the package.
(c) Trouble shooting
To identify the potential causes behind this phenomenon a trouble shooting activity
was carried out on three main areas:
- cleaning procedures
- filling machine operation
- packaging material characteristics.
During these activities, it was found that the contamination problems occurred only on
one filling machine and that the type of spoilage was dominated by blown packages
with a coagulated and flat sour product. The distribution of the problem was random
and sporadic, but spread out over the whole production run.
After careful investigation on the filling machine, it was found that the cause of the
blown packages produced was a wrong adjustment done on a package damper. The
incorrect setting of this component caused a small scratch on the packages, and then
an integrity loss and a steady contamination of the product packed.

14
(d) Conclusion
At the end of the investigation the following conclusions were drawn:
- the problem should have been detected by the filling machine operator during
the package integrity checks (through the implementation of standard quality
control procedures)
- preventive maintenance was not regularly executed
- the wrong damper adjustment, carried out by the filling machine operator, was
an extraordinary action to solve problems depending on lack of a preventive
maintenance program.
This case emphasizes the need to regularly implement the quality control checks to
avoid many hours of production of contaminated product due to lack of package
integrity. Package integrity is the result of correct package forming, sealing and
transfer throughout the different pieces of line equipment. This experience shows the
importance of maintenance in controlling the biological risk and in preventing
package integrity problems that produce product contamination.
2.3.2 Second case study: product contamination due to package integrity
problems
The second case study comes from a company that produces UHT milk, cream, and
fruit juice.
(a) Equipment setup
One product sterilizer supplies an aseptic filler packing cream and fruit juice at a
capacity of 20.000 packs/hour. The aseptic filler is well equipped with different
monitoring systems to monitor critical parameters such as the filling circuit cleaning
(temperature, speed, and concentration) and the sealing of packages produced.
(b) Problem description
The company claimed a product contamination, due to the sporadic presence of non
hermetic transversal seals, on 200 ml packages, filled with UHT cooking cream.
Since the defect rate was not known and the failure distribution was random, the
company was forced to withdraw 200.000 packs from the market and to organize a
quality control inspection on the entire product produced. The economical loss

15
produced by this event was higher than 300.000 Euro and the troubles created by the
product delivery delays were underlined by different retailer claims.
(c) Trouble shooting
The trouble shooting activity started on jaw (package forming) and sealing systems to
verify if mechanical and electrical operations were correctly performed. The different
destructive tests, performed on a huge sample of filled packages, could identify small
micro holes distributed on the package transversal sealing. Further tests have shown
the presence of some micro-channels evenly distributed on top and bottom package
sealing. The trouble shooting carried out on mechanical and electrical components of
the forming and sealing section could identify the following anomalies:
- some pressure rubbers (used in the sealing section) were completely worn out
- some inductor profiles were out of tolerance (concave instead of straight)
- the electromechanical power transfer system (bar and slider) were
mechanically worn causing voltage drop and then power loss
- one sealing transformer was damaged.
It was also discovered that, to reduce maintenance cost, the preventive maintenance
program suggested by the equipment supplier was not followed and that corrective
maintenance was the sole maintenance activity carried out on this equipment.
(d) Conclusion
At the end of the investigation the following conclusions were drawn:
- the problem should have been detected by the filling machine operator during
the package integrity checks (through the standard quality control procedures)
- replacement of worn out inductors and pressure rubbers could be done by the
machine operators following a simple daily and weekly maintenance
procedures
- the wrong power transfer could be detected by the machine operator if further
training had enabled him to regularly check some electrical parameters
- the company’s management understood that the tentative to save money has
resulted in a wider economical loss and agreed on the necessity to implement
reliable maintenance procedures.

16
This case shows the result of loss of control of some equipment criticalities associated
to the production of hermetic sealed packages containing liquid food products. The
equipment functions and parts involved in forming, filling and sealing the packages
need to be put under control through maintenance procedures able to manage the
biological and physical risks depending on equipment safety and reliability.
2.3.3 Third case study: product contamination due to mineral oil leakage
This case study concerns a company that produce UHT milk and cooking cream and
that experienced a complex unsterility case.
(a) Equipment setup
Two product sterilizers supply an aseptic filler packing cooking cream with a capacity
of 7500 packs/hour. The downstream equipment is quite simple and made by one
cardboard packer and a final palletizer.
(b) Problem description
The company claimed a sporadic product contamination, concentrated on a specific
time interval, which disappear after a final cleaning In Place (CIP) phase of the filling
machine. As shown in the figure below the product unsterility started suddenly,
during the standard production activity, to end with the final cleaning: no unsterility
was found at the machine restart, after cleaning.
This unsterility pattern was replicated many times during the normal production
activity causing heavy problems both to production planning and to product delivery.
The unsterility was detected after finding a pH variation (acidity) on a sample of
packages stored at a constant temperature of 32° C, for 7 days.
The economical loss determined by this case was close to 500.000 Euro, but the
disturbances produced by the filling machine stops (unplanned downtime) were really
heavy since the line was often under investigation due to its inherent unreliability.
16.00 17.00 18.00 19.00 20.00 21.00 22,00 23,00 24,00 1.00 2.00 3.00 4.00 5.00 6.00 7.00 8.00 9.00 10.00
STERILE PRODUCTION UNSTERILE PRODUCTION STERILE PRODUCTION
PRODUCTION 17-18/07/2006
PRODUCTION CIP PREP PRODUCTION
Production Planning

17
(c) Trouble shooting
The trouble shooting activity started with a huge investigation on the sterile circuit of
the filler. Since no fault was detected, and the package integrity check did not show
any problem, a deeper investigation was started on the packaging material fed through
the whole machine (from the packaging material infeed down to the outfeed).
Through a careful monitoring activity it was noticed an oil leakage coming from a
hydraulic piston which is working on a cylinder that feed the packaging material
throughout the filler. Since the piston tightness was lost due a progressive wear of the
piston gasket, the oil dropped directly on the inner surface of the packaging material
determining a source of contamination, which was not completely removed from
chemical sterilization. The bacterial load, coming from mineral oil residues on the
packaging material, determined a product contamination with a product pH change
(acidity).
(d) Conclusion
At the end of the investigation the following conclusions were drawn:
- the problem should have been detected by the filling machine operator during
the execution of final or weekly cleaning of machine
- while the preventive maintenance check lists for this machine included a
regular check of the hydraulic piston in order to keep it efficient, no
maintenance was carried out for about 3000 working hours
- since no HACCP analysis was applied on this filler section there was not a
clear awareness about the criticality associated to the malfunction of this
component
- to improve the inherent equipment safety and reliability it was suggested to
replace the hydraulic piston with a motorized one.
This case shows that the filling equipment safety must primarily be managed through
a design phase intended to avoid risk residues that could have important effects on
product safety because of contact with chemical agents. Lack of maintenance
procedures designed to put under control the equipment critical control points
determined a higher risk of chemical contamination of product packed.

18
2.3.4 Fourth case study: unsterile packages randomly distributed over different
production runs
The fourth case study regards a company that produces UHT milk, and fruit juice with
two packaging lines.
(a) Equipment setup
Two different product sterilizers supply the aseptic fillers of two packaging lines with
a capacity of 12.000 packs/hour each. The downstream equipment is made up by one
cap applicator, one cardboard packer and a final palletizer, all installed in the same
line.
(b) Problem description
This producer claimed the finding of few unsterile packages, randomly distributed,
over five different production runs, produced by two different packaging lines.
Despite only one or two unsterile packages were found on each pallet produced, the
company was forced to withdraw from the market the pallets containing a single pack
defective. The random failure distribution, and the different types of defect found
during quality control inspections, made the company eager to discover the nature of
the problem as quickly as possible.
(c) Trouble shooting
Because of different type of problems found and different lines involved in producing
packages with defects, it was decided to perform a quality audit on the production
lines under consideration. The scope of this activity was the examination of
production practices implemented during production, the analysis of daily
maintenance carried out by the equipment operator, and the investigation of
procedures implemented during cleaning phase. Moreover, because of diversity and
complexity of problems found, special attention was placed in examining the training
and skillness of people involved in operating and maintaining the equipment. The
investigation done covered the following critical areas:
pre and post-production practices
production practices
quality control practices during production
cleaning procedures (pre and post production)

19
preventive maintenance programme.
Here below the findings gathered according to the type of defect found:
Compliance to standards and specification
The production monitoring showed a general non-compliance versus standards and
specifications as described by the equipment supplier. Practices and procedures
carried out by the equipment operators were different and often customized according
to people’s experience.
Bad package sealing and lack of package integrity
Pressure rollers, used to realize the longitudinal sealing of the package, were not
properly cleaned: product residues left on the component represented a serious risk of
unsterility, and plastic residues found on its surface a risk of an uneven pressure and
then a lack of a hermetic seal. The status of transversal sealing inductors and pressure
rubbers were not carefully checked by the operators. Packaging material residues have
been found trapped in the transversal sealing inductors (see the arrow in Figure 3
below) and this lead to their break. As result, some unsterility packages were found
with a non-hermetic longitudinal and transversal sealing.
Figure 3: Transversal sealing inductor
Cleaning procedures
Cleaning of product filling pipe represents a critical operation that can produce
product contamination if product residues, splashed on its surface (see Figure 4
below), are not properly removed through manual cleaning. It has been noticed a
different way of cleaning this part either by using different detergents and different

20
materials. It has been found big quantities of packaging material dust spread all over
the internal sterility environment of filling machine.
Figure 4: Product residues on filling pipe
Aseptic piping: connections tightness and gasket integrity
During inspection, some residues of caramelized milk were found close to some
connections of product piping, next to aseptic valves and filling pipe (see Figure 5
below). These leakages were mainly due to connections not properly tight, and to
gasket completely worn. This phenomenon could be the cause of some unsterile
packages found without integrity problems, but with coagulated milk inside.
Figure 5: Milk leakages on pipe connection

21
Quality control of filled packages
The quality control procedures, intended to check the integrity of packages produced,
were not carried out according to the standards described in the operator manual.
The interviews with equipment operators have shown deep knowledge gaps due to
lack of a basic training program: it was discovered that the only training received was
the one consisting in a coaching activity made by an expert colleague.
(d) Conclusion
At the end of the investigation, the following conclusions were drawn:
- the presence of unsterile packages on both lines, characterized by different
problems, was a typical indicator of something not working correctly not in
the equipment, but in the organizational and cultural dimension of the
company.
- lack of an operator training program produced, as result a different operational
way to implement production and maintenance practices. This emphasized the
need to comply with the standard procedures and practices designed by the
equipment supplier and to implement the mandatory quality control checks on
packages produced.
- cleaning procedures and preventive maintenance was not regularly executed
and this was most likely the reason of some unsterility cases.
- lack of cleaning and maintenance on longitudinal and transversal sealing
inductors was the reason of some not hermetic seals found on blown packages.
- caramelized milk residues enabled to discover leakages of milk on product
piping due to week connection tightness and worn gaskets.
The findings resulting from this case emphasized the need of a training program to
avoid different ways to operate the equipment with relative non-conformities. Lack of
standards lead to bad quality control on finished product, and to inability to detect
anomalies that show preliminary signs of non-compliance to specifications. Poor
implementation of cleaning and maintenance procedures caused non-hermetic
longitudinal and transversal seals that produced physical and chemical transformation
of product packed.
In conclusion, the analysis of this case, once more, underlined the necessity to define
a maintenance design and implementation process to identify packaging line

22
criticalities with relative solutions to avoid product safety and equipment reliability
problems.
2.3.5 Peanut case shows holes in product safety net
The New York Times, on February 8, 2009, published a story regarding a ConAgra
plant, based in Blakely, Georgia, USA, and producing peanut butter. Problem
emerged in 2004, in the Georgia’s peanut country, when was reported that the food-
product giant, ConAgra Foods, had found salmonella in peanut butter at its plant in
Sylvester, 75 miles from Blakely. At that time, when the plant officially declined to
release their laboratory tests, the Food and Drug Administration (FDA) did not pursue
the records and was unable to confirm the report of salmonella contamination. The
government finally demanded the records three years later, and verified the
contamination claims, after hundreds of people were sickened by salmonella-
contaminated peanut butter, produced at the plant in 2007. The consequences of this
huge contamination accounts for:
half of the salmonella children illnesses traced back to the Blakely plant
a worldwide recall that includes peanut butter shipped to schools, military
bases and nursing homes
the safety issues raised by this outbreak are drawing comparisons to those in
China’s contaminated milk scandal.
Robert Tauxe, a disease prevention expert, from a Center for Disease Control and
Prevention said: “This outbreak is telling us we haven’t been paying enough attention
to food product safety prevention”.
After deep investigation, it was discovered that the causes of finished product
contamination were those listed below:
(a) Raw product contamination
Dispirited workers on minimum wage, supplied by temporary agencies, donned their
uniforms at home, potentially dragging contaminants into the plant, which also had
rodents.
(b) Failure in the equipment sterilization system
The heat treatment system, used to kill the pathogenic bacteria in the product, was not
working correctly because of technical anomalies found in thermo-regulator system.

23
As result, the equipment sterilization system, designed to sterilize the product, was
non-working at the right temperature, and no alarm or corrective action was able to
switch a mandatory production stop.
(c) Product quality control
The quality control procedures, to detect potential product contaminations at source,
were not implemented correctly by the operational staff involved.
In conclusion, although this case is not dealing with an aseptic liquid food process, it
shows important points of discussion, to be held in great consideration, that support
the ALF cases previously analyzed, and the research problem.
Here below few questions and reflections about this case:
Why a critical failure of the product sterilization system did not produce any
equipment alarm or corrective action?
Beyond the possible obsolescence of the equipment used to sterilize the
product, it must be said that, if a HACCP activity had been done, this
important criticality would have been discovered and a reliable solution
implemented. Moreover, lack of a HACCP plan, produced lack of
maintenance procedures intended to put under control the critical technical
parameters of thermo-regulator system.
Why product quality control and equipment inspection did not allow to detect
the problem?
This case emphasize how important is the quality control of the product during
the different phases of the process. If an in-line quality control system had
been planned, the problem would have been discovered before product
delivery. Since no equipment automation was available to detect a critical
thermo regulator failure, lack of maintenance checks of critical parameters put
the system completely out of control.
Why equipment operators were not trained and empowered to take full
responsibility of process through autonomous maintenance?
Production of fresh, medium, and long life food products, must be done by
qualified personnel, able to take full responsibility of the process and not by
temporary workers.

24
The effects produced by this failure on public health, show the importance of a
reliable maintenance design process able to identify all criticalities, together with an
implementation model, which define roles, tasks for an effective implementation.
2.3.6 Analysis of case studies and lessons learned
The analysis of different case studies showed that one of the common reasons behind
unsterility cases depends on lack of preventive maintenance procedures and that these
can be put under control only if the different machine critical functions are properly
identified and preventive maintenance actions implemented.
In the first case, integrity of packages was lost and product contaminated because of
wrong maintenance activity implemented by a person not trained for such
maintenance task. The analysis of this case study showed a lack of regular
maintenance inspection of this critical device (package dumper) and the reason was
due to the unavailability of a HACCP plan intended to identify CCPs and relative
countermeasures to put critical variables under control. The HACCP analysis should
have identified this CCP and asked for a maintenance task to avoid biological risk
produced by lack of package integrity. The economical loss produced by this event
was high, but reduction of market share, resulting from damages on company’s image
was not quantifiable.
The second case study showed that, due to economic pressures, maintenance approach
chosen was corrective only and that, as consequence, a loss of control of different
critical points, regarding package integrity and forming, was experienced. In this case,
an analysis based on product safety and equipment reliability risks should have
revealed lack of maintenance procedures necessary to put under control safety and
reliability critical issues.
The third case emphasized the necessity to carry out a deeper HACCP analysis
intended to examine primary and secondary sources of potential product
contamination. An oil leakage from a hydraulic piston produced packaging material
and then product contamination because no one identified this CCP and, once again,
no HACCP plan was implemented. This case showed that safety and reliability
investigations might produce the necessity of mandatory equipment modifications to
upgrade the inherent equipment safety and reliability.
25
The fourth case summarized the different drawbacks found in the other cases and
underline how important maintenance is in determining a whole control over the
different critical process elements that produce, as result, product quality, and safety.
The fifth case showed the dramatic effects of a food process out of control: lack of a
HACCP plan, of a reliable quality control and maintenance process, produced heavy
problems for public health.
At the end of this section some common conclusions can be drawn:
a) The process to design maintenance procedures must be able to identify all
conceivable equipment critical control points that might affect product safety
and equipment reliability
b) The design and the implementation process must ensure that all equipment
critical functions have been examined and that maintenance tasks designed
and implemented are effective to determine product safety and equipment
reliability.
c) The equipment operator plays a key role in managing the equipment
criticalities through operational and maintenance activities able to prevent
equipment downtime and product safety contaminations.
d) An effective maintenance design process enables the identification of
equipment reliability weakness areas where improvements can be achieved
through condition monitoring systems, structural modifications or through
reliable maintenance procedures.

26
2.4 Food safety system certification (FSSC)
Food safety is a global concern, not only because of the importance for public health,
but also because of its impact on international trade. Globalization of food production
and procurement makes food chains longer and more complex and increases the risk
of food safety incidents. Food safety certification represents a mandatory step for an
ALF manufacturing plant, which ensures that all conceivable risks arising from the
whole production process are under control, and that corrective actions have been
established to avoid product safety hazard [6]. Effective and harmonized food safety
systems shall manage and ensure the safety and suitability of food in each link of the
supply chain. For this reason, ISO (International Standard Organization) developed
the standard for food safety management systems ISO 22000, which applies to all
organizations in the food chain and thus ensures integrity of the chain. FSSC 22000 is
specifically developed to audit and certify food safety systems of food manufacturers
that process or manufacture products with long shelf life at ambient temperature. The
FSSC 22000 certification scheme sets out the requirements for certification bodies to
develop, implement, and operate a certification scheme and to guarantee its
impartiality and competence. FSSC 22000 sets out the requirements to assess the food
safety system of food manufacturing organizations and to issue a certificate. The
added value for an organization with a certified food safety system lies in the efforts
made by the organization to maintain that system and its commitment to continuously
improve its performance.
In the requirements, food safety is defined as the concept that the food will not harm
the consumer. Organizations in the chain are therefore required to take into account
the food safety hazards of their operation for the final product in the chain when
establishing prerequisite and HACCP programs (reference: ISO 22000, clauses 3.1
and 3.3, note 4).
As is stated in chapter 2 of ISO/TS 22004, ISO 22000 promotes the adoption of a food
chain approach when developing, implementing, and improving the effectiveness and
efficiency of a food safety management system. In this regard, the organization is
required to consider the effects of the food chain prior and subsequent to its
operations when developing and implementing its food safety management system.

27
About specifications for services, the food manufacturing organization shall ensure
that all services (including utilities, transport, and maintenance) which are provided
and may have an impact on food safety:
shall have specified requirements,
shall be described in documents to the extend needed to conduct hazard
analysis.
shall be managed in conformance with the requirements of BSI-PAS 220,
clause 9, (Reference: ISO 22000, clauses 7.2.3.f and 7.3.3. and BSI-PAS 220,
clause 9).
Moreover, the organization shall ensure the effective supervision of the personnel in
the correct application of the food safety principles and practices commensurate with
their activity (Reference: ISO 22000, clause 6.2.2). In the requirements and
regulations for providing certification (appendix II B) important technical issues are
taken under consideration:
Layout of premises workspace
- Location of equipment
- Laboratory facilities
- Storage of food, packaging materials, ingredients, and non food chemicals.
Utilities: air, water, energy
- Water supply
- Boiler chemicals
- Compressed air and other gases
- Lighting.
Equipment suitability, cleaning and maintenance
- Hygienic design
- Product contact surfaces
- Temperature control and monitoring equipment
- Equipment cleaning
- Preventive and corrective maintenance.
Measures for prevention of cross contamination
- Microbiological cross contamination

28
- Physical contamination.
Cleaning and sanitizing
- Cleaning and sanitizing agents and tools
- Cleaning and sanitizing programs
- Cleaning in place (CIP) systems
- Monitoring sanitation effectiveness.
2.5 Conclusion
In this chapter the ALF criticalities have been considered regarding to problems
placed by the threats coming from mandatory legislations, from higher competition,
due to globalization, and from cost reduction which often produce downsizing and
outsourcing.
Some of the effects produced by these threats involve reduction of economical and
human resources for maintenance, and a general tendency to move from preventive
maintenance to corrective maintenance only. The case studies examined showed that
lack of a HACCP plan intended to identify the equipment CCPs and relative
countermeasures, to put critical variables under control, may produce biological risks
due to lack of package integrity. The case studies highlighted that the process to
design maintenance procedures must be able to identify all conceivable equipment
critical control points that might affect product safety and equipment reliability and
the relative maintenance tasks to manage such criticalities. The case studies showed
that the economical loss produced by the unsterility cases was high, but reduction of
market share, resulting from damages on company’s image was definitely higher and
difficult to quantify. At the end of the chapter, a short description of food safety
certification, required by ISO, allows to identify a useful tool to “certify” the
compliance to standards of layouts, services, utilities, and maintenance to produce
food hygiene and safety.
29
3. CRITICAL STUDY OF MAINTENANCE ENGINEERING
TECHNIQUES AVAILABLE IN THE LITERATURE
3.1 Introduction
To be able to answer the main research questions regarding product safety and
equipment reliability, an extensive literature search has been carried out to identify the
key maintenance engineering techniques to be used to develop the maintenance design
and implementation process. The scope of this chapter is to present a short highlight
of some of the reliability principles and maintenance engineering techniques chosen to
support the maintenance design and implementation process. The questions to answer
at this point of the research are:
Why literature review is necessary for this research?
What type of literature has to be searched?
What criteria should be used to select maintenance principles and
techniques?
How the selected literature can contribute to the maintenance design and
implementation process?
This chapter will not only answer these questions, but it displays the main
characteristics of the safety, reliability, and maintenance engineering techniques used
in the maintenance design and implementation process. The extensive literature
review shows a picture of the status of art of the safety and maintenance techniques
available today and the advantages coming from their application in the process to
design and implement maintenance procedures.
3.2 Equipment availability through reliability, maintainability, and
supportability
The equipment availability represents one of the most important factors to be used to
measure production and maintenance effectiveness: the line equipments must be
available to allow the manufacturing company to produce the right amount of product,
at the right time, and with the right quality. Equipment availability, itself, depends on
equipment reliability, maintainability, and supportability, and the scope of this section

30
is to identify the key topics that will be part of the process to design and implement
maintenance procedures for the ALF industry.
Availability
The British Standards (BS) define availability as “the ability of an item (under
combined aspects of its reliability, maintainability and maintenance support) to
perform its required function at a stated instant of time or over a stated period of time”
(BS4778). In other words, availability is a measure of how big a part of total
production time the machine is available for production [7]. Availability is then
depending upon reliability, maintainability, and supportability. Availability can be
calculated using the formula:
AvailabilityMT BF
MT BF + MT T R
Where MTBF stands for “Mean Time Between Failure” and MTTR for “Mean Time
To Restore”. In order to keep availability high, the MTTR must be as short as
possible. According to Figure 6, given a machine with a good standard of design and
reliability, with high maintainability, much depends upon the skill of the operator and
service engineer in effecting a rapid return to operation. However, there are other
factors that can reduce MTTR concerned with the diagnostic instruments necessary to
find out faults, spare parts availability and maintenance policy adopted.
Figure 6: Line Availability
AvailabilityA
ReliabilityR MaintainabilityM SupportabilityS
Design
Excess capacity
Maintenance need
Operator ability
Fault detection
Standardisation
Repairability
Maintenance staff
ability
Repair equipment
needs
Parts supply
Technical data
Administration
MTBF MTTR MWT
Design
Redundancy
Maintenance need
Operator ability
Fault detection
Standardization
Reparability
Maintenance staffability
Spare parts
Documentation
Tools, templates& instruments
Administration

31
Reliability
The definition of reliability given by the British Standards, BS 4200, part two, is:
“Reliability is the ability of an item to perform a required function (without failure)
under stated conditions for a stated period of time”. Here an item means a component,
instrument, or system. For example, the reliability of one machine might be quoted as
0.99 for 1000 hours operating time under well defined operating conditions. This
means that the probability of satisfactory operation, without any failure, is 99% during
a period of 1000 hours. According to BS 5760 failure is “the termination of the ability
of an item to perform a required function”.
Reliability maintenance techniques & failure curves
Each maintenance task need to be designed to cope with different failure modes found
for each machine component. For the different component failure modes, the specific
reliability maintenance techniques, listed in Figure 7, will be applied.
Figure 7: Reliability maintenance techniques [8]
Product law of reliability
For units (machines) in series, such that failure of one machine determines the failure
of whole system (production line) reliability of the system is:
Rs = R1 x R2 x R3 x Rn
Here below some possible circuit configurations [8]:

32
Where product quality issues are involved, redundancy of critical components
represents a real equipment investment, to gain higher reliability and product safety.
Factors which affect reliability
The cost of ownership of a product, such as a filling machine is made up of the:
capital cost (the purchase price)
operation cost and
maintenance cost.
At the same time, the above factors have a direct impact on machine and process
reliability. As the machine design is improved, because of components redundancy,
the use of high quality devices and materials which result in a higher safety, the
machine reliability is still improved. In purchasing a machinery the attempt to safe
money just looking at the machine price, without considering the machine quality
design, might produce a saving in the short term, but heavy losses in the medium-long
term.

33
Maintainability
Maintainability is defined as the probability that a system, that has failed, will be
restored to a full working condition within a given time period. Maintainability or
Mean Time To Repair/Restore (MTTR) expresses the average time that it takes to
correct a fault. The mean time to repair or to restore and the repair rate ( ) are
measures of maintainability:
=1
MTTR
and maintainability M(t) = 1 et
1 et /MTTR
where t is the time allowed for the
maintenance action. Appendix A shows an example of how maintainability and
MTTR can be calculated.
Factors which affect maintainability
The machine designer can aim for a low value of MTTR by paying for example close
attention to the accessibility of components and to their standardization. In the liquid
food industries, because of use of perishable product, particular effort is to be spent in
reducing MTTR as much as possible. A fault on the sealing section of an aseptic
filling equipment, for example, may be quickly solved, without machine reset to zero
position, if the time necessary to repair is shorter than the time allowed for the
machine to be in stand by position.
Supportability
The effectiveness of support system, around the machine, is measured by the Mean
Waiting Time (MWT). This can be defined as the time, which elapses from
occurrence of a fault until the repair is started. The support system within an aseptic
liquid food company is made up of the following factors:
(a) Maintenance staff ability
Development of the necessary abilities, for maintenance technicians and machine
operators, to carry out maintenance activities, represents a real opportunity to reduce
MTTR and to improve the company’s competitive advantage. Development of
skillness, in the area of corrective maintenance, requires a good understanding of
system fault location methods, in addition to an understanding of overall system and
circuit operation. The equipment operator empowerment, through different types of

34
training, represents one of the best investments to improve the effectiveness of
company’s support system.
(b) Equipment needed
Different diagnostic tools are often necessary to carry out maintenance activities, they
are:
templates for mechanical measurements
temperature measurement instruments
oscilloscope and electronic multimeter
notebook computer with diagnostic software.
Furthermore, microbiological lab with all necessary test instrumentation is necessary
to carry out product analysis in case of product contamination.
(c) Parts supply
To reduce MWT, the company must ensure that spare parts, more frequently needed
to solve machine faults, are available to repair the equipment. Lack of necessary spare
parts might produce waste of time for maintenance staff, just for waiting the parts, and
unavailability of machinery for production activity.
(d) Technical data
In order to benefit of a good support system, around the production equipment, the
provision of a comprehensive service manual is vital. This must contain easy-to-read
circuit and layout diagrams; spare parts lists with possible equivalents; technical
specifications and test instructions; fault location guides and dismantling instructions.
(e) Administration
Administration refers to the activities concerning management of figures and data
available from production activity. Statistical figures about faults, divided into
categories, records of preventive maintenance activities, feedback information on
equipment availability, reliability and so on, enable management to better understand
the equipment needs.

35
3.3 Product safety techniques
Product safety techniques, through maintenance, play a very important role in
managing the critical factors that could produce non-conformities to product quality
and safety. The maintenance design process for ALF industry will make use of the
techniques described in this section, but the effectiveness of this process cannot be
ascribed to these techniques only, but to the ability to integrate both safety and
reliability techniques.
3.3.1 Product safety through the application of HACCP methodology
Hazard Analysis of Critical Control Points (HACCP) is a production process control
methodology introduced at the European Community level through the ECC directive
93/43. HACCP identifies and assess specific hazards, estimates risks and establishes
control measures that emphasize product safety, though problem prevention and
control, rather than reliance on end-product testing and traditional inspection methods.
HACCP presumes that not all phases of a liquid food machine operation are
dangerous to man. Therefore, its attention is concentrated on analyzing only the
Critical Control Points (CCPs) and not the whole line process [9]. Machine parts or
components, whose fault may produce biological, chemical, or physical hazard, are
examined to devise critical control limits and preventive maintenance
countermeasures. The use of HACCP methodology leads to the identification of
Critical Control Points (CCPs) of the process, and to the design of new maintenance
tasks to establish process, product safety, and reliability. Machine parts or
components, whose fault may produce biological, chemical, or physical hazard, are
examined to devise critical control limits and preventive maintenance
countermeasures. Application of HACCP will first enable identification of the
following issues:
hazards, directly connected to the machine/system/component functions
Critical Control Points (CCPs)
critical limits for each CCP
preventive measures, to carry out at every maintenance interval
monitoring procedures to detect loss of control at the CCP.
The development of HACCP plan requires seven principal activities whose
implementation can ensure the goal of safer food [9]. These principal activities have

36
to be applied to the process equipment to identify CCPs and to establish adequate
maintenance procedures. The following seven principal activities form the basis for
the application of HACCP system:
ACTIVITY 1: conduct hazard analysis, identify hazards (biological, chemical and
physical) and specify control measures
ACTIVITY 2: identify critical control points
ACTIVITY 3: establish critical limits at each CCP
ACTIVITY 4: establish monitoring procedures
ACTIVITY 5: establish corrective action procedures
ACTIVITY 6: establish verification procedures
ACTIVITY 7: establish documentation procedures as appropriate.
ACTIVITY 1: Listing all hazards and considerations of any control measures to
eliminate or minimize hazards
As first step, a list of all hazards that may be expected to occur in the production line
under consideration are identified. The hazards considered are the following:
Biological hazards
regard toxigenic agents that could contaminate the product. This can, in many cases,
be due to lack of package integrity.
Chemical hazards
include, among the others, cleaning compounds and sterilisation agents.
Chemicals, normally used to clean equipment and pipe surfaces, and to sterilise
packaging materials, could come in contact with the product if predictive and
preventive maintenance activities are not regularly implemented.
Physical hazards
include objects, such as metal fragments, glass… that can be found in the package
together with the product, and that may cut the mouth, break teeth or perforate the
package.
This activity can be effectively performed by a team of experts involved in different
areas such as quality, production, and maintenance.

37
ACTIVITY 2: Establishment of Critical Control Points
After all hazards have been identified, a CCP decision tree is used to identify the
existing CCPs for each specific hazard. The hazards which may be reasonably
expected to occur, or be introduced at each step, should be considered. If a hazard has
been identified for which no control measure exists, the machine part or component
should be modified so that hazard is eliminated or reduced to acceptable or minimal
levels. The module shown in Figure 8 below is a HACCP decision tree used for
establishing CCPs.
ACTIVITY 3: Establishment of critical limits for each CCP
Critical limits must be identified for each control measure, at each CCP.
In some cases, more than one critical limit can be specified at a particular CCP. In
some cases, quantity variations may require the use of target levels to ensure that
critical limits are met. Historical and statistical information can represent a reliable
tool to identify limits and thresholds.
ACTIVITY 4: Establishment of monitoring system for each CCP
Monitoring is the periodic measurement or observation at a CCP to determine whether
a critical limit or target level has been met. The monitoring procedure can be
performed by an automatic system or by human control and must be able to detect
loss of control at the CCP.
ACTIVITY 5: Establishment of corrective actions
Corrective actions are those actions to be taken either when monitoring results show
that a CCP has deviated from its specific critical limit or target level or, preferably,
when monitoring results indicate a trend toward loss of control. Different limits or
thresholds can be established regarding critical areas of variable hazard.
ACTIVITY 6: Establishment of verification procedures
Procedures for verification must be established to ensure that HACCP system is
working correctly. Monitoring and auditing methods, procedures and tests, including
random inspection and analysis, can be used for this purpose.

38
ACTIVITY 7: Establishment of record-keeping and documentation
Adequate, accurate record-keeping and documentation are essential to the application
of the HACCP system. Examples of records are: HACCP plan; CCP monitoring
records; deviations file; preventive maintenance procedures, included in the check
lists and check lists review.
HACCP methodology will be used in the design process, as a mandatory tool to
identify all CCPs that may have a relevant impact on product safety hazards. After
CCPs identification, a deeper reliability analysis of critical components and parts will
be necessary to design maintenance task lists that enable a reliable maintenance
control of each critical point.

39

40
Figure 8: HACCP decision tree to identify CCPs [9]

41
3.3.2 Application of HAZOP (HAZard OPerability)
HAZOP reviews have been arising from the chemical industry in Britain during the
1960’s. Imperial Chemical Industries developed a standardized method of analyzing
processing hazards based on the basic operation conditions and then changed
individual parameters one at a time to see the subsequent consequences [10]. This
evolved into a standard practice within their company and soon found its way into the
general chemical industry (although it was not universally or consistently applied).
This technique has been selected because it can be applied to the ALF process to
monitor the critical factors depending on both product and human behaviour.
The HAZOP general overview
Most hazards that arise in a system are thought to be due primarily to defects in
design, material, workmanship, or human error. There are many methods of safety
analysis reviews that are available and can be applied to a facility or project design to
overcome human errors and the various failures of the process system. The methods
may be either qualitative or quantitative in nature. HAZOP can be considered a
qualitative method.
The HAZOP process is based on the principle that a team approach to hazard analysis
will identify more problems than when individuals working separately combine
results. The HAZOP team is made up of individuals with varying backgrounds and
expertise. The expertise is brought together during HAZOP sessions and through a
collective brainstorming effort that stimulates creativity and new ideas, a thorough
review of the process under consideration is made.
The HAZOP process
The HAZOP team focuses on specific portions of the process called “nodes”. A
process parameter is identified, say pressure, and an intention is created for the node
under consideration. Then a series of guidewords is combined with the parameter
“pressure” to create a deviation. For example, the guideword “no” is combined with
the parameter pressure to give the deviation “no pressure”. The team then focuses on
listing all the credible causes of a “no pressure” deviation beginning with the cause
that can result in the worst possible consequence the team can think of at the time
[10]. Once the causes are recorded the team lists the consequences, safeguards and
any recommendations deemed appropriate. The process is repeated for the next

42
deviation and so on until completion of the node. The team moves on to the next node
and repeats the process.
The primary objective of HAZOP is to assure that catastrophic incidents will be
avoided during the lifetime of the facility from the processes under review. The
reviews objectives are to be thorough, impartial, and adequate. Safety reviews are
ultimately, primarily looking for the possibilities of where human error may occur.
Human error is commonly thought of as mainly occurring during the operational
phase of the facility or system, but human error can also be the cause of defects in the
design, material, or workmanship. Human error is considered when one of the
following events occur (which may be applied equally to design or operation of a
production line):
1. An individual fails to perform a task or some portion of a task.
2. The task (or portion) is performed incorrectly.
3. Some step(s) is/are introduced into the sequence, which should not have been
included.
4. A step is conducted out of sequence.
5. The task is not completed within an allocated time period.
Human errors may be accidentally performed by all personnel: designers, engineers,
operators, and managers. Some theories attribute up to 90% of all accidents to human
errors.
The concept of Point Of Reference (POR)
When defining nodes and performing a HAZOP on a particular node, it is useful to
use the concept of point of reference (POR) when evaluating deviations. As an
illustration of this idea, suppose in the example of the flash drum, the node consists of
the flash drum and liquid product piping up to the flange on a product storage tank. If
the deviation "no flow" is proposed then a dilemma becomes apparent when you start
talking about the causes of no flow [10]. If a cause of no flow is pipe rupture and the
pipe ruptures at the flange connection on the flash drum. The term "no flow" is
ambiguous since there is flow out of the flash drum but not through the piping to the
storage tank. Therefore, a POR should be clearly established at the time the node is
defined. It is recommended to always establish the POR at the downstream terminus
of the node.

43
3.4 Maintenance engineering techniques
The maintenance engineering techniques will play a very important role in the
maintenance design process, and this section shows the main features of some well-
known techniques widely used in industry. Quantitative and qualitative analysis of
failures allows to gain a deeper knowledge on each failure type, and on the effects
produced on the equipment; the analysis guide to the identification of maintenance
activities to be designed for each failure type.
3.4.1 Reliability centered maintenance (RCM) technique
In 1976, the “Reliability Centered Maintenance”, a landmark 495 page report by
Stanley Nowlan and Howard Heap, described the RCM methodology developed for
the Boeing 747, Douglas DC-10 and Lockheed 1011 [11].
The key to RCM was abandoning the philosophy of “preserve-equipment” in favour
of “preserve-function”. Equipment became the means to an end, not the end in itself.
In addition, Nowlan and Heap concluded that a maintenance policy based on
operating age would have little, if any, impact on failure rates. Thus, applying time-
based maintenance on equipment which has no “wear-out” pattern was futile. This
forced a change in philosophy from, “It wasn’t broke, but we fixed it anyway” to “If it
isn’t broke, don’t fix it”. Nowlan and Heap [12] also concluded that:
Time-based maintenance works only for a small percentage of components,
and then only when there is solid information on their “wear-out”
characteristics.
Condition Based Maintenance (CBM) is the most-preferred option. That
means monitoring, observing and taking non-intrusive actions, such as
lubricating and cleaning, until a condition signals that corrective action is
necessary.
Run-To-Failure (RTF) is a viable tactic in situations when there is no safety
and little economic impact.
In a significant number of situations, the very act of maintenance itself causes
subsequent failure of the equipment.
Non-intrusive maintenance tasks should be used instead of intrusive
maintenance whenever possible. In other words, do not do any maintenance,

44
except monitoring and non-intrusive sustaining actions, until condition directs
intrusive corrective action.
Four statistically significant studies have confirmed the validity of RCM.
When we come to the understanding of maintenance and the role of Reliability
Centered Maintenance, the airlines are far ahead of industrial manufacturers. After all,
RCM was invented by the airline industry, but also, in the airline business, the
maintenance mission is quite clear, it begins with an understanding of equipment
functions and the failure modes that result in functional failures and ends with a very
specific maintenance strategy designed to mitigate the consequences of each failure
mode. As a result, maintenance is viewed as a reliability function instead of a repair
function [11].
In viewing maintenance as a reliability function, the airline industry simply charges
maintenance with the following mission: To keep airplanes airborne, full of
passengers, and safe. Safety and reliability are also the main goals to be pursued for
the equipment and product packed in the ALF industry. This mission leads to a very
tight set of maintenance guidelines, procedures, and controls. On the other hand,
inside the typical manufacturing plant where maintenance is viewed as a repair, the
maintenance mission is not that clear [13]. For example, if a packaging line goes
down for a couple of hours, that may not be such a big deal, but when you are talking
about a plane with hundreds of people on board, that is a totally different story. The
fundamental difference between RCM and all previous approaches to maintenance is
based on the emphasis on two things: safety and reliability. RCM is a systematic,
decision-logic approach that analyses:
- failure modes
- critical data,
to establish a cost-effective maintenance strategy. In this strategy, scheduled
replacement, preventive maintenance based on condition, periodic rework (overhaul),
and scheduled inspections are combined to minimize the cost of maintenance without
increasing the risk of failure [14]. Based on the results of this process, optimized
maintenance task lists (task schedules) can be defined to address:
- inspection or monitoring/measurement for parts more
susceptible to failure

45
- rework or rebuild to “like-new” condition
- removal/replacement with new parts/assemblies, or
- inspection for undetected failures.
Development of such a program depends on a determination of how a
component/system can fail, the consequences of failure, and classification of failure
distributions (infant mortality, random failures, or wear out). RCM is designed to
minimize costs without increasing the probability of failure through a logical analysis
of preventive maintenance needs and can be used as a design tool. The benefits of
RCM are that it concentrates only on doing what needs to be done. People often focus
on doing preventive maintenance tasks that really do not have much effect and this
produces waste of time and money [15]. RCM is a logical discipline for developing a
scheduled maintenance program that will realize inherent reliability levels of complex
equipment at a minimal cost. RCM is based upon the premise that maintenance cannot
improve the safety or reliability inherent in the design of the hardware. Good
maintenance can only preserve those characteristics.
When phasing in an RCM program, it is strongly recommended by all experts that is
done one system at a time. It is also important to choose a single system and take it all
the way through each step of the RCM process before moving on the next. The classic
approach includes:
1. System selection
2. Boundary definition & Operational mode summary
3. Functional and potential failure determination
4. failure modes and effects analysis (FMEA)
5. maintenance history and technical documentation review
6. task selection and frequency determination.
3.4.2 Failure reporting and corrective action system (FRACAS)
FRACAS is a continuous improvement system utilizing a closed-loop feedback path
in which the maintainer and operator work together to collect and record data relating
to failures of assets. This data is then reviewed and analyzed by a reliability engineer,
considering such factors as Failure Rate, MTBF, MTTR, Availability, Cost, etc. The
resulting analysis identifies corrective actions that should be implemented and
verified to prevent future failures from recurring. FRACAS is particularly useful to

46
analyse historical data regarding equipment failures to identify potential and
functional failures together with their impact on product safety and company’s costs.
The FRACAS process may also be referred to as DRACAS (Data Reporting,
Analysis, and Corrective Action System), or PRACA (Problem Reporting, Analysis,
and Corrective Action System), as well as CA (Corrective Action) systems, and other
acronyms. At its core, FRACAS is a comprehensive closed-loop corrective action
system which can collect, quantify, and control a wide range of incoming incident
reports, such as test data, field data, or repair data. A Failure Reporting, Analysis and
Corrective Action System (FRACAS) is a system, sometimes supported by a
software, that provides a process for reporting, classifying, and analyzing failures, and
planning corrective actions in response to those failures [16]. The method calls for a
systematic failure data collection, management, analysis, and corrective action
implementation. FRACAS process is a disciplined closed loop failure reporting,
analysis and corrective action system and is a useful tool in the achievement of
product reliability and safety. FRACAS promotes reliability improvement throughout
the life cycle of the asset. Considering a standard asset life cycle from cradle to grave,
the phases described in Figure 9 occur:
Figure 9: FRACAS phases [16]
Corrective actions and the impact to total cost of ownership are small during the
conceptual design phase and then have greater impact as the asset gets farther along in
its life cycle. The earlier the failure cause is identified and positive corrective action
implemented, the greater the asset utilization and the lower the total cost of
ownership.
3.4.3 Quantitative failure measures through statistical analysis
Quantitative analysis is to be used to “weight” a failure in order to gain a knowledge
about its importance and how it is distributed over the time. Potential and functional
failures must be measured through statistical tools to assess their impact on the
production activity. The development and use of statistical theories about distributions

47
and how they vary has become the corner stone of process improvement [17].
Statistical Process Control (SPC) allows the user to continuously monitor, analyze,
and control the process. SPC is based on the understanding of variation and how it
affects the output of any process. Variation is the amount of deviation from a design
nominal value. If we consider a failure (Y) as a function of different variables (X1,2,n)
then it can be represented in this way: Y = F(X). If we know the variations caused by
the X’s, then, through SPC, it is possible to monitor the X’s first. Using SPC we are
attempting to control the critical X’s in order to control the failure Y. To get an
effective result we should be able to find the “vital few” X’s, to put them under
control through SPC to achieve a desired result on Y.
Y can be defined as:
Dependent
Output
Effect
Symptom
Monitor.
X1, …Xn can be defined as:
Independent
Input
Cause
Problem
Control.
Statistical Process Control involves the use of statistical techniques, to interpret data,
to control the variation in processes. SPC is primarily used to act on “out of control”
processes, but it is also used to monitor the consistency of processes producing
products and services. A primary SPC tool is the Control Chart, a graphical
representation for specific quantitative measurements of a process input or output. In
the Control Chart, these quantitative measurements are compared to decision rules
calculated based on probabilities from the actual measurement of process
performance. The comparison between the decision rules and the performance data
detects any unusual variation in the process, variation that could indicate a problem
with the process. Several different descriptive statistics can be used in Control Charts.

48
Control Charts, are Time Series Charts of all the data points with one extra addition.
The Standard Deviation for the data is calculated for the data and two additional lines
are added to the chart. As shown in Figure 10, these lines are placed +/- 3 Standard
Deviations away from the Mean and are called the Upper Control Limit (UCL) and
the Lower Control Limit (LCL).
Figure 10: SPC control chart
Now the chart has three zones:
(1) The zone between the UCL and the LCL which called the zone of common
variation,
(2) The zone above the UCL which a zone of Special Cause variation and
(3) another zone of Special Cause variation below the LCL.
Application of SPC to potential and functional failures
Not every equipment stop can be due to a potential failure deviation or to a functional
failure, that is why we need to establish tolerances on the nominal values to judge
whether an equipment stop is to be considered as failure or not. Control charts are one
SPC tool that enables us to monitor and control process variation. During the
equipment operation we can experience both potential and functional failures:
Common Cause
Variation
Process is “In
Control”
Special Cause Variation
Process is “Out of Control”
Special Cause Variation
Process is “Out of Control”
Run Chart of
data points
Process Sequence/Time Scale
Lower Control
Limit
Mean
+/-
3 s
igm
a
Upper Control
Limit
Common Cause
Variation
Process is “In
Control”
Common Cause
Variation
Process is “In
Control”
Special Cause Variation
Process is “Out of Control”
Special Cause Variation
Process is “Out of Control”
Run Chart of
data points
Process Sequence/Time Scale
Lower Control
Limit
Mean
+/-
3 s
igm
a
Upper Control
Limit

49
Potential failure
Potential failures can be considered as variables depending on condition monitoring,
hence a measurement such as a dimension, weight, and its unit of measurement can be
specified. When this is the case, such a measurement can form the basis of SPC using
variables.
Functional failures
Alternatively, a functional failure expresses the non conformity or lack of availability
of the equipment for production activity. In this case SPC uses attributes that are
usually applicable to judgment of overall quality. In short, variables are measured
while attributes are counted.
Every variation of the process must be weighted through condition monitoring in
order to get the distribution of variations that is the distribution of weight for different
failure categories. Sample information obtained through automatic monitoring and
operational feedback, on potential and functional failures, show the lifetime of
population of mechanical components, such as bearings, seals, gear… and the
variation of the units of measure associated to these failures. Normal distribution
(Gaussian) of failures show a tendency for the variables to take a central mean time
value with positive and negative deviations equally distributed all around the mean.
Other failure probability distributions, used to show material strength or time-to-
failure of electronic and mechanical components, are normally represented by the
different shapes of Weibull distribution.
Failure Distribution
Using reliability data to predict the performance of the machine generally involves
assuming that the historical performance will reflect the current performance. The
latter is best measured by strategic use of equipment monitoring techniques.
Therefore, the best way to utilize this information to predict failures is by intelligent
use of predetermined alarm limits. From analysis of numerous failure data on the
mechanical groups, a general failure pattern becomes apparent which takes the form
shown in Figure 11.

50
Figure 11: General mechanical failure pattern [15]
In the “stable zone”, measurements are simply varying about an average value. The
variance may be due to process changes between successive measurements and/or
measurement error. When the measurements start to deviate from these values, it
becomes apparent that a problem exists and the equipment may have entered the
“failure zone”. The setting of realistic alarm limits is achieved using SPC theory, such
that when the condition monitoring measurements move outside the limits imposed,
normally set at three standard deviations about the average, the condition is registered
as being “unstable” and the operation has entered the designated failure zone. Each
zone is defined in terms of whether the condition monitoring measurement is inside or
outside the alarm limits. On this basis, it is evident that the condition data acts as
switch or go/not go signal. However, in order to make further use of the condition
data, a model of the failure zone pattern is also introduced. This is depicted in Figure
12 below.

51
Figure 12: Failure Zone Model [15]
The failure condition commences at the lower limit (LL), which is the averaged
conditional value within the stable zone. The condition measurement X(t) increases
until it is detected passing through the alarm limit (AL). Subsequently, at some time,
t = tf, the upper limit is reached (UL) and the machine needs to be inspected or
withdrawn from production. Inspection of actual failure case histories revealed that
the failure pattern could be approximated to an exponential curve [18]. While this
behaviour cannot be said to apply to every situation, it nevertheless serves as an initial
starting point for developing the prediction model. Values for LL and AL are obtained
from the SPC modelling of the stable zone. The estimate of UL is more problematical
since it is the maximum possible level the machine is permitted to reach before actual
failure occurs. UL must, therefore, be estimated using information available from
either within the company, or from other sources, such as equipment suppliers, or by
reference to universal standards. The time “tf” is obtained by reference to reliability
analysis of previous failures.
Distribution of variations
Every variation must be weighted and distribution of variations is the distribution of
the weights. The curve is what we would expect if the distribution is a “Normal”
distribution. Normal distribution (Bell curve) is represented by a pattern which repeats
itself endlessly regarding manufactured products and in nature. Normal distributions
are the most common type of distribution found in nature, but they are not the only

52
type of distribution. In determining the lifetime reliability of a population of
components (bearings, seals, gears etc.) sample information is obtained from
automatic monitoring and operational feedback on the failure history of components.
From the information obtained it is possible to produce a graph of the probability
density function (pdf) f(t). This is a plot of the frequency at which components fail as
a function of time divided by the whole population. As shown in Figure 13, the pdf
curve can take many forms: one curve representing purely random events is the
normal (Gaussian) curve. This is shown below with the associated Cumulative
Density Function (CDF).
Figure 13: Normal and cumulative distribution [18]
Normal Distributions are appropriate in the following conditions:
there is a strong tendency for the variable to take a central value,
positive and negative deviations from this central value are equally likely,
the frequency of deviations falls off rapidly as the deviations become larger.
The equation for the normal distribution is:
Where “μ” is the mean (MTTF, MTBF) and “σ” is the Standard Deviation.
The Weibull distribution is a general-purpose reliability distribution used to model
material strength, times-to-failure of electronic and mechanical components,
equipment, or systems [18].

53
These probability distributions are related to distribution of failures, where the failure
rate is proportional to a power of time. Shapes represented by different colours
indicate different failure rate that, for instance, decrease, due to infant mortality
following installation of new equipment or increase due to an aging process. Stan
Nowlan and Howard Heap (1978) studied aircraft failures looking for correlations
between those failures and the maintenance that was being performed [19]. They
recognized that maintenance was a contributing factor to many of the failures but in
some other cases maintenance was able to improve the situation. They looked for
patterns and found them. As shown in Figure 14, there were actually six patterns of
Conditional Probability of Failure.
Figure 14: Failure shapes [25]
Pattern A is the well-known bathtub curve. It begins with a high incidence of
failure (known as in infant mortality) followed by a constant or gradually
increasing conditional probability of failure, then a wear-out zone. This pattern
appears in biological systems (like human) and in simple systems that have
only a few dominant failure modes.
Pattern B is classic wear out: shows constant or slowly increasing conditional
probability of failure, ending in a wear-out zone. Prior to the Nowlan and

54
Heap study, this was the dominant view of equipment failure. It occurs in
assets that are in contact with product, process fluids and slurry’s and drives
components.
Pattern C with gradual aging, shows slowly increasing conditional probability
of failure, but there is no identifiable wear-out age. This occurs where there is
erosion, corrosion or fatigue.
Pattern D is best new, shows low conditional probability of failure when the
item is new or just out of the shop, then a rapid increase to a constant level.
This occurs in systems, usually complex, that are maintained and put into
service by highly qualified technicians before being turned over to less
qualified operators. Examples are hydraulic, fluid power and pneumatic
systems.
Pattern E is totally random, shows a constant conditional probability of failure
at all ages. This pattern appears in many systems or components that are, on
their own, not typically subject to maintenance work. Rolling element bearings
and incandescent light bulbs are examples of this type of failure.
Pattern F starts with high infant mortality, dropping to a constant or slowly
decreasing conditional probability of failure. This is common in complex
systems that are subject to start up and shut down cycles, frequent overhaul
type maintenance work and product cycle fluctuations.
Nowlan and Heap’s study on civil aircraft showed that 4% of the items conformed to
pattern A, 2% to B, 5% to C, 7% to D, 14% to E and no fewer than 68% to pattern F.
The number of times these patterns occur in aircraft is not necessarily the same as in
industry. There is no doubt that as assets become more complex, we see more and
more of patterns E and F. Later studies (Broberg, in 1973, also studied aircraft and
two studies were performed on submarine failures, MSP in 1982 and SUBMEPP in
2001) have shown the same patterns with somewhat different, but similar,
distributions [20].

55
3.4.4 Qualitative analysis through Ishikawa, cause mapping and root cause
analysis
Once quantitative analysis has provided the necessary information about the weight of
potential and functional failures, qualitative analysis is necessary to identify the
potential causes behind each failure and the relationships existing among these causes.
The scope of this analysis is to gain a real understanding about the nature of the
failure through the use of the quality tools described here below. In 1950s Japan,
Kaurou Ishikawa became one of the first to visually lay out the causes of a problem.
His fishbone, or “Ishikawa Fishbone,” helped visually capture a problem’s possible
causes and, ultimately, has become a standard in corporate-quality and Six-Sigma
programs [21]. It begins with a problem, and then identifies possible causes by
separate categories that branch off like the bones of a fish. Its categories, as shown in
Figure 15, typically including materials, methods, machines, measurement,
environment, and people can be modified to better match a particular issue.
Figure 15: Ishikawa or fishbone diagram [21]
As an enhanced tool that captures problems and solutions visually, Cause Mapping
expands on some of the basic ideas of the fishbone diagram for a clearer, more
accurate and more specific cause-and-effect analysis. Cause Mapping uses a systems-
thinking approach to root-cause analysis and incident investigation that improves the
way people analyze, document, communicate and solve problems. The following five
points, below, show five features that distinguish Cause Mapping from the standard

56
fishbone diagram, and each helps make the Cause Mapping investigation process and
solutions more effective.
1. Cause Maps (read left to right)
Since the traditional Japanese language reads right to left across a page, the fishbone
starts with a problem on the right and builds across the page moving left. A Cause
map starts on the left and reads right. At every point in both on the fishbone and
Cause Map, investigators ask “why” questions that move backward through time,
studying effects and finding their causes [21]. This distinguishes the Cause Map from
the process map, which moves forward through time with arrows pointing left to right
(the process involves performing step one, then step two, etc.)
2. Root Cause Analysis & Cause Maps tie problems to an organization’s overall goals
Root cause analysis is an approach for identifying the underlying causes of why an
incident occurred so that the most effective solutions can be identified and
implemented. It is typically used when something goes badly, but can also be used
when something goes well [22]. Within an organization, problem solving, incident
investigation and root cause analysis are all fundamentally connected by three basic
questions: What's the problem? Why did it happen? and What will be done to prevent
it? The picture in Figure 16 below highlight the basic principles, linking the result
(symptom of the problem) to the underlying causes.
Figure 16: Basic principles of Root Cause Analysis [22]

57
The fishbone defines one problem and finds causes. The Cause Mapping solution,
however, recognizes that problems are not always that simple. As shown in Figure 17,
first, just try defining one problem by asking: “What’s the problem?”. That question
can create significant disagreement in any organization, with answers varying widely
depending on a person’s perspective. What some see as a problem, others may see as
just a symptom of a larger, more significant issue. Starting an investigation with a
single problem does not necessarily reflect the nature of an incident or failure.
Figure 17: Cause Mapping process [21]
3. Cause Maps focus on cause-and-effect, not categories
As shown in Figure 18, an analysis breaks something down into its parts; analyzing an
incident involves breaking it down into specific cause-and-effect relationships.
Figure 18: Cause mapping cause and effect boxes [21]
Fishbone diagrams group similar causes into categories: method, machine, material,
man, etc. Categorization, however, creates generalizations and represents a polar
opposite of analysis. Grouping an incident’s possible causes by category does not
show the cause and effect relationships. In effect, a fishbone’s categories simply
create a “Yellow Pages” directory of causes not a map that details how causes and
effects relate. For instance, a training issue grouped under “people” can cause a

58
person to make an error that results in an equipment failure, grouped under
“machinery” [21].
4. Cause Mapping focuses on evidence-based causes
The fishbone method regularly identifies possible causes, which encourages
speculation. Cause Mapping, on the other hand, focuses its analysis on causes
supported by evidence. Causes produce effects; anything required to produce an effect
is, by definition, a cause of that effect. Heat, fuel and oxygen, all interacting, “cause”
fire. Causes are supported by evidence while possible causes lack that evidence.
During analysis of a past event, investigators may develop possible causes, identifying
them throughout the Cause Map. But they are identified and treated as such, clearly
distinguishable from the Cause Map’s principal focus: causes supported by evidence.
This makes sense, since any past incident only has actual causes, not possible ones.
5. Cause Maps focus on systems thinking
Which part of a car is required for the car to function: the engine, the transmission, the
battery, the driver, the steering wheel, the tires, the brakes, or the fuel? They all are, of
course, because all of these elements work as a system; remove one element, and the
system does not operate the way it should. Considering how these systems relate to
causes and effects requires systems thinking [21]. It does not look for one answer, or
the cause, but analyzes how elements and systems work together to create an incident.
It also helps explain why there are so many disagreements when people try to identify
“the cause” of an incident. In fact, most organizations only focus on a single cause
and fail to see the incident as a system.
6. Conclusion
The Cause Mapping approach builds upon and refines some of the fishbone diagram’s
original concepts. The concepts, examples, and exercises involved with Cause
Mapping improve the way people analyze, document, communicate, and solve
problems. The purpose of an investigation is to find the best solutions to prevent an
incident from occurring, and a Cause Map helps reach this ideal by efficiently laying
out-on one map- the organization’s goals, problems and the systems of evidence-
supported causes [21].

59
3.4.5 Other qualitative failure analysis tools
Failure Determination (FD) and Fault Tree Analysis (FTA) are currently used in
industries to determine potential failures of products. In order to eliminate or reduce
the possibility of failure, designers need to be aware of all of the potential significant
failure modes in the systems being designed. An essential and crucial part of these
methods is a required function-failure knowledge base of previous products. A
systems failure analysis is an investigation to determine the underlying reasons for the
non-conformance to system requirements. A systems failure analysis is performed to
identify non-conformance root causes and to recommend appropriate corrective
actions. Systems failure analysis begins with a clear understanding of the failure (i.e. a
definition of the problem) [23].
Fault Tree Analysis (FTA): identifying all potential failure causes
When confronted with a systems failure, there is often a natural tendency to begin
disassembling hardware to search for the cause. This is a poor approach. Failed
hardware can reveal valuable information and safeguards are necessary to prevent
losing that information from careless teardown procedures. Fault tree analysis is a
graphical technique that identifies all potential failure causes. The fault tree starts with
a top undesired event, which is the system failure mode for which one is attempting to
identify all potential causes [23]. The analysis then continues to sequentially develop
all potential causes. In FTA, there are two categories of symbols: events and gates.
Fault tree events are linked by gates to show the relationships between the events [24].
As shown in Figure 19, there are two types of gates: “and” gates and “or” gates. The
“and” gate signifies that all events must occur simultaneously to result in the event
above it. The “or” gate means that if any of the events occur, the event above it will
result.
Figure 19: Fault Tree Symbology represented by logic gates [24]
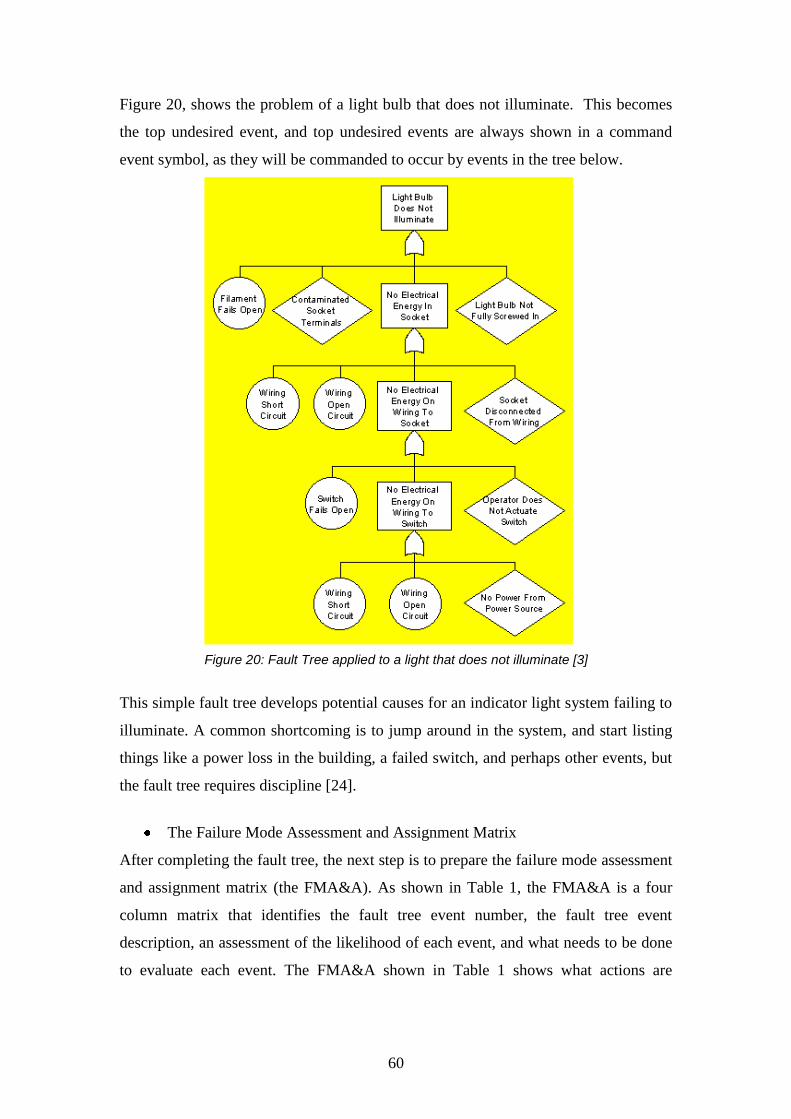
60
Figure 20, shows the problem of a light bulb that does not illuminate. This becomes
the top undesired event, and top undesired events are always shown in a command
event symbol, as they will be commanded to occur by events in the tree below.
Figure 20: Fault Tree applied to a light that does not illuminate [3]
This simple fault tree develops potential causes for an indicator light system failing to
illuminate. A common shortcoming is to jump around in the system, and start listing
things like a power loss in the building, a failed switch, and perhaps other events, but
the fault tree requires discipline [24].
The Failure Mode Assessment and Assignment Matrix
After completing the fault tree, the next step is to prepare the failure mode assessment
and assignment matrix (the FMA&A). As shown in Table 1, the FMA&A is a four
column matrix that identifies the fault tree event number, the fault tree event
description, an assessment of the likelihood of each event, and what needs to be done
to evaluate each event. The FMA&A shown in Table 1 shows what actions are

61
required for evaluating each indicator light potential failure cause, and it provides a
means of keeping track of the status of these actions.
Event Description Assessment Assignment
1 Filament Open Unknown Examine bulb for open filament. Hughes; 16
March 2007
2 Contaminated
Socket Terminals Unknown Examine socket for contaminants. Perform
FTIR analysis on any contaminants observed in
socket. Hughes; 16 March 2007
3 Light Bulb Not
Fully Screwed In Unknown Inspect bulb in socket to determine if properly
installed. Smith; 14 March 2007
4 Socket
Disconnected
From Wiring
Unknown Examine wiring and perform continuity test.
Smith; 16 March 2007
5 Wiring Short
Circuit Unknown Examine wiring and perform continuity test.
Smith; 16 March 2007
6 Wiring Open
Circuit Unknown Examine wiring and perform continuity test.
Smith; 16 March 2007
7 Operator Does
Not Activate
Switch
Unknown Interview operator and check switch function.
Hughes; 16 March 2007
8 Switch Fails Open Unknown Check switch function. Hughes; 16 March 2007
9 Wiring Short
Circuit Unknown Examine wiring and perform continuity test.
Smith; 16 March 2007
10 Wiring Open
Circuit Unknown Examine wiring and perform continuity test.
Smith; 16 March 2007
11 No Power From
Power Source Unknown Check power supply with multimeter. Smith; 14
March 2007
Table 1: The Failure Mode Assessment and Assignment Matrix [24]

62
3.5 Maintenance engineering techniques for the implementation
process
In this section, different maintenance engineering techniques have been selected to
carry out a critical study of features that can give their contribution to the design of
the maintenance implementation process. These techniques show characteristics that
link the design and implementation phases through a reliable management and control
of critical factors.
3.5.1 Total Productive Maintenance (TPM) technique
Seiichi Nakajima, vice president of Japan Institute of Plant Maintenance (JIPM)
introduced the TPM methodology in Japan since the beginning of 1971. The TPM is a
new approach to maintenance which pursues the equipment efficiency optimization,
cutting down faults through the Autonomous Maintenance (AM) activities, carried out
by the machine operators, integrated with preventive maintenance activities done by
the maintenance specialists. TPM pursues the elimination of six fundamental causes
of production losses:
- Loss of time
1. Equipment failure due to faults
2. Set-up and adjustment due to changes in production
runs.
- Equipment speed reduction
3. Downtime because of machine stops due to wrong
settings and anomalies of devices
4. Reduction of equipment speed due to the gap existing
between the original and real speed.
- Equipment failure
5. Machine faults due to the process which involve waste
of product or repair activities to restore the product
quality
6. Reduced yield in the equipment start up phase [25].
Table 2 below, lists the twelve steps, suggested by Nakajima, and needed to develop
and implement a TPM program. The twelve steps are combined into four main stages:

63
1. Preparation
2. Preliminary Implementation
3. TPM Implementation
4. Stabilization.
Stage Step Details
Preparat ion
Announce top management
decision to introduce TPM
Launch educat ion and
campaign to introduce TPM
Create organisations
to promote TPM
Establish basic TPM
policies and goals
Formulate master plan
for TPM dev elopment
Hold TPM kick-of f
Improve ef f ectiv eness of
each piece of equipment
Dev elop an autonomous
maintenance programme
Dev elop a scheduled
maintenance programme
for the maintenance dep.
Conduct training to improv e
operat ion and maintenance
skills
Dev elop early equipment
management programme
Perfect TPM implementation
and raise TPM lev els
1
2
3
4
5
6
7
8
9
10
11
12
Preliminary
implementat ion
TPM
implementat ion
Statement at TPM lecture in company
artic les in company newspaper
Managers:seminars,retears acc. to level
General:slide presentations
Form special committees at ev ery level
to promote TPM,establish cent ral head-
quarters and assign staf f
Analy ze existing conditions: set goals,
predict results
Prepare detailed implementation plans
for the f iv e foundational act iv ities
Inv ite clients,af f iliated and
subcont racting companies
Select model equipment ,
form project teams
Promote 7 steps: build diagnosis skil ls,
establish worker certif icat ion procedure
Include periodic and predictive main-
tenance and management of spare
parts, tools,blueprints and schedules
Train leaders together, leaders share
informat ion with group members
Maintenance Prev ention (MP) design
commissioning control
Evaluate f or PM prize: set higher goalsStabilisation
Table 2: The twelve steps of TPM development [26]
TPM success is measured through the Overall Equipment Effectiveness (OEE) which
measures:
- Availability
Downtime used for preventive and corrective maintenance
- Equipment speed

64
Actual production speed compared to the theoretical
production capacity
- Quality
Proportion of defective products (packages waste).
Then the formula used reflect not only the equipment faults, but all the losses
regarding breakdowns, set-up and registrations, short stops, speed reductions, time
spend for quality defects and rework. The OEE is the index measuring the
line/machine productive effectiveness in the scheduled time. Figure 21, shows the
time domain taken into consideration and the formula used to measure OEE.
Figure 21: Production time domain with OEE formula [27]
Total productive maintenance (TPM) principles implementation
Equipment operator empowerment, and its integration with maintenance specialist, is
a mandatory activity to reach efficiency, reliability targets and cost improvement
results. Implementation of TPM goes through the following steps:
Define machine operator role in operating & maintaining the machine
One of the most important characteristics of TPM philosophy is Autonomous
Maintenance (AM) carried out by those who operate the equipment. AM requires the
operator to clean, lubricate, check and inspect his or her equipment in the name of
order, clearness and efficiency. The seven steps implemented to initiate autonomous
maintenance are:
1. Initial clean up: this is a useful activity for discovering faults
2. Eliminate causes of contamination and make cleaning easier
3. Cleaning and lubrication rules
Available time
Available production time
Production time
Value Added
production time
Breakdowns
Set up
Speed reduction
Short stops
Quality losses
planned
Vacation, etc
Total time (Solar time)
adjustments
OEE =Value Added production time
Available time

65
4. Improve inspection and technical skills (training)
5. Develop autonomous inspection activities
6. Standardize procedures and work place rules
7. Complete Autonomous Maintenance (AM).
To enable a successful AM implementation, machine operators have to be empowered
through the improvement of their competencies. The following four abilities must be
developed:
(a) ability to discover anomalies
(b) ability to fix the anomalies and set the normal operating conditions
(c) ability to define the normal operating conditions and the standard valuation
(d) ability to manage and maintain the equipment.
Integration between machine operator and maintenance specialist
Figure 22 shows a picture that helps maintenance and operator personnel to
understand and learn, that, based on partnership between operations and maintenance,
TPM enables operators and maintenance specialists to become multi-skilled.
ZONE APPROACH OF TPM
OLD ORGANISATIONAL LINE
OPERATOR SKILL LEVEL MECHANIC SKILL LEVEL
High Low Low High
1234567 1 2 3 4 5 6 7TASKS
TPM’s
Shared Task
Zone
Replace knif e
Check package
design correction
Check steam t rap
Measure HF voltage
Check CIP gasket
Figure 22: TPM’s shared task zone [28]
Maintenance specialists and operators are trained to safely perform tasks
listed in the shared task zone

66
In the example made above, since a replacement of knife is in the task zone,
the operator who observes the need for replacing this component, he can
simply do it, without losing time to communicate with maintenance and
operation supervisors, and then waiting for maintenance specialist.
Condition-Based Maintenance and specialistic PM activities, which required good
electrical and mechanical skill, are performed by maintenance specialists.
Operator empowerment through co-operation with maintenance specialists
TPM is, by definition, an effective maintenance management system supported by the
Autonomous Maintenance where each production equipment operator becomes
“proprietor” of his/her machine and takes care of all details that will preserve that
machine in the best possible condition.
TPM’s goals are accomplished through one or more of the following concepts:
1. Operators doing routine maintenance
2. Operators assisting maintenance specialists when equipment is down
3. Maintenance specialists assisting the operators with shutdown and start-ups
4. Transfer of tasks not requiring craft-workers
5. Team approach to computerized calibration
6. Transfer of tasks between operating groups
7. Multi-skilling of craft-workers [28].
1. Empowering operators to perform specified routine maintenance tasks on their
equipment
Operators assuming ownership of their equipment helps to eliminate potential causes
of failure. Once autonomous maintenance is implemented, the recurrence to the
maintenance department is minimized. Gradually, the operator becomes qualified to
determine the status of different components and groups and can make small
adjustments and repairs. When maintenance is needed, the operator already knows the
procedure and is a great help. In many cases, the procedure has been simplified and
the operator is a key element in these improvements that increase the maintainability
of the equipment. A great deal of this improved effectiveness comes from the
motivation given to the employees through adequate training and education. Operators
are given the proper training and tools to perform the “CLAIR” tasks: Clean, Lube,
Adjust, Inspect, and Repair [28].

67
C = Clean
L = Lubricate
A = Adjust
I = Inspect
R = Repair.
2. Empowering operators to assist and support maintenance specialists in the repair
of equipment when it is down
As the operators become more expert with their equipment, the TPM coordinator,
supported by the maintenance technicians, will be giving more instruction to the
operators and giving directions on pertinent safety measures so they keep advancing
in their capacity to intervene in the equipment. When a complex equipment failure is
experienced the operator is committed to understand the reason of failure and to assist
the maintenance specialist while he is carrying out the trouble shooting activity. In
this case, the maintenance force is enlarged; the operators do not loose their central
role due to lack of work and ultimately the failed equipment is returned to service
more quickly.
3. Empowering maintenance technicians to assist operators in the shutdown and
start-up of equipment
Cooperation between maintenance technicians and equipment operators enables us to
save time in shutting down and starting up equipment. Once the maintenance
specialist finish the repairs, they assist the operators in returning the equipment to
service by correcting leaks and other mechanical or electrical problems as they occur.
Maintenance specialists can also be trained to perform some of the operation tasks
without the assistance of the operators.
4. Empowering lower-skilled personnel to perform jobs not requiring skilled craft-
workers
There are many routine tasks that can be done by just about anyone who has been
given proper tools and training. Under the TPM program, these tasks are identified. If
it is not feasible for skilled operators or maintenance specialists to do the job, lower
bracket people are used. As the maintenance personnel spend less time on routine
work, they can concentrate more on improving equipment reliability and doing the
work for which they have been specially trained.

68
5. Use computerized technology to enable operators to calibrate selected instruments
The use of Statistical Process Control (SPC) charts to control operations is based on
process feedback that is as accurate as possible. As part of TPM program, instrument
calibration test units can be used to ensure the proper function of the instrumentation
normally used to carry out preventive maintenance.
6. Transfer of tasks between operating groups
In many cases, unnecessary waiting time and equipment downtime are the attendant
results. Identifying these non-productive interfaces and restructuring job
responsibilities can remove such inefficiencies.
7. Multi-Skilling of craft-workers
The focus of this concept is training mechanics, electricians, and other craft-workers
to use the zone approach in analyzing their job interfaces. Frequently if an electrician
learns some mechanical skills and a mechanic learns some electrical skills, further
reduction can be made in equipment downtime. Multi-skilling reduces the number of
times an operator hears: “it is not a mechanical problem, but an electrical problem,
then you need to get an electrician” or “it is not an electrical problem, then you need
to get a mechanic”. Multi-skilled craft-workers become stewards of the problem and
lose the “that’s not my job” attitude.
Figure 23: The different steps to become an operator able to carry out AM [29]
Autonomous Maintenance
Standardization
Initial Inspection & Cleaning
Autonomous
Inspection
General Inspection
Lubrication & Cleaning Standards
Remove the sources of dirty & difficult areas to clean
Good knowledge on
how equipment set-up
can impact on quality
of product produced
General knowledge
about equipment
functions & features
Ability to repair and
maintain the equipment
Ability to see problems &
gain an understanding on
principles & procedures
to improve the equipment
performance
7
6
5
4
3
2
1
1
2
3
4 Autonomous Maintenance
Standardization
Initial Inspection & Cleaning
Autonomous
Inspection
General Inspection
Lubrication & Cleaning Standards
Remove the sources of dirty & difficult areas to clean
Good knowledge on
how equipment set-up
can impact on quality
of product produced
General knowledge
about equipment
functions & features
Ability to repair and
maintain the equipment
Ability to see problems &
gain an understanding on
principles & procedures
to improve the equipment
performance
7
6
5
4
3
2
1
1
2
3
4

69
The new TPM management concept consists of a more effective and realistic
delegation of responsibilities (empowerment), the different activities, shown in Figure
23 above, enable the operators to know their equipment better than anyone else. The
“collective participation” gives the operators a greater satisfaction. Kaizen is a
Japanese term that means continuous improvement [30], when carrying out this
process, constant success is obtained and the participants look for new opportunities.
The habit is to constantly look for more opportunities to improve the process, the
workplace, the quality of the product, etc. These people enjoy contributing their
spontaneous creativity to the solution of a problem. They are capable of developing
and communicating a creative and friendly environment.
3.5.2 World Class Manufacturing (WCM)
A manufacturing firm achieves world-class status when it has successfully developed
manufacturing capabilities to support the entire company in gaining a sustained
competitive advantage over its competitors in such areas as cost, quality, delivery,
flexibility, and innovation. World-Class Manufacturing (WCM) is defined as a
manufacturing philosophy or ideology that is used to achieve world-class
manufacturer status. The essence of WCM philosophy is continuous improvement
involving everyone in the organization. Organizations that adopt this philosophy
constantly seek opportunities for improvement in such key competitive areas as
quality, cost, delivery, flexibility, and innovation. Such improvements are essential to
survival and profitability. Companies that are pursuing world-class status may take
different paths that, in turn, require different precepts.
Figure 24 below, identifies the main steps to be implemented on a manufacturing
company, starting from the first WCM step, which can assess the actual status of the
equipments and production practices, up to the final step which pursues a
consolidation of zero defects philosophy.
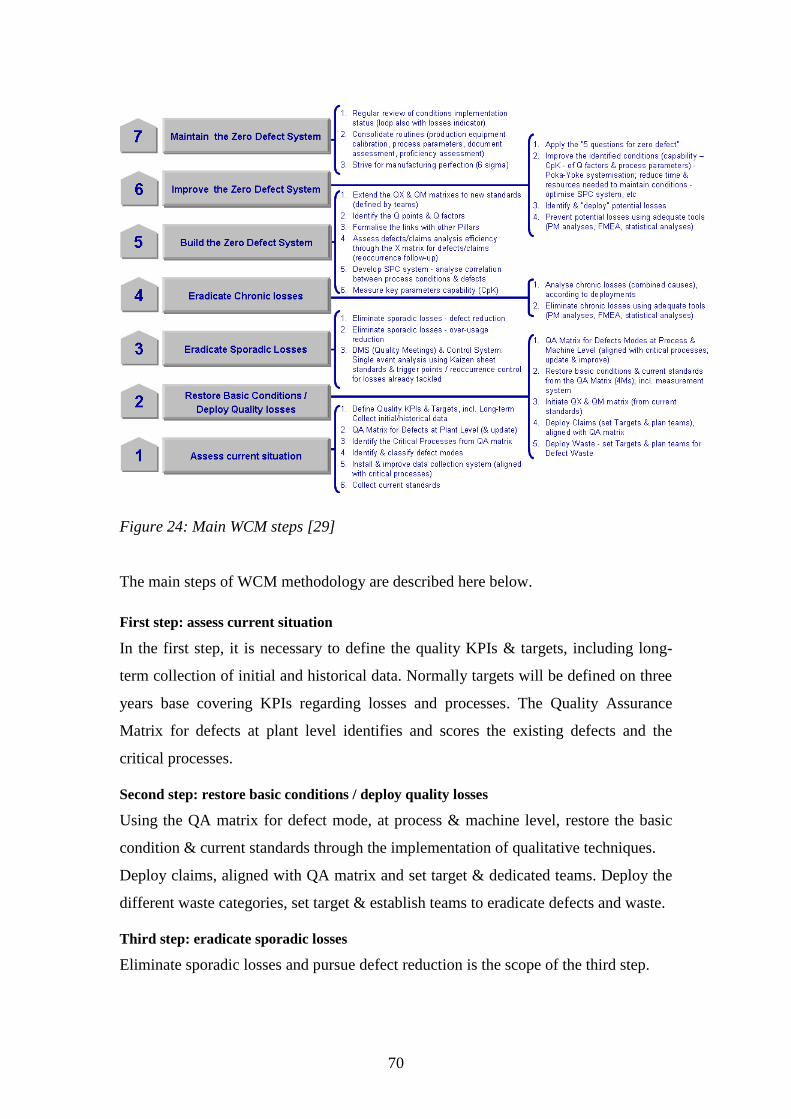
70
Figure 24: Main WCM steps [29]
The main steps of WCM methodology are described here below.
First step: assess current situation
In the first step, it is necessary to define the quality KPIs & targets, including long-
term collection of initial and historical data. Normally targets will be defined on three
years base covering KPIs regarding losses and processes. The Quality Assurance
Matrix for defects at plant level identifies and scores the existing defects and the
critical processes.
Second step: restore basic conditions / deploy quality losses
Using the QA matrix for defect mode, at process & machine level, restore the basic
condition & current standards through the implementation of qualitative techniques.
Deploy claims, aligned with QA matrix and set target & dedicated teams. Deploy the
different waste categories, set target & establish teams to eradicate defects and waste.
Third step: eradicate sporadic losses
Eliminate sporadic losses and pursue defect reduction is the scope of the third step.
71
Equipment is normally stopped due to a combination of sporadic and chronic
problems. Fault Tree & Root Cause Analysis can be carried out to identify the causes
of sporadic and chronic hidden problems.
Fourth step: eradicate chronic losses
Analyse chronic losses (with combined causes) according to the deployment carried
out through PM analysis, FTA, RCA, FMEA, and Statistical analysis. The use of
these tools can eliminate chronic losses. To gain a better understanding of inherent
problems it is necessary to have a good knowledge of the system and the phenomenon
produced.
Fifth step: build the zero defect system
The established teams identify the quality factors to be implemented in order to
pursue the zero defect objectives. Quality results can be achieved thorough a close
link with other pillars. Assessment of defects, claims analysis and equipment
efficiency to gain a holistic view of the production reality. Development of SPC
system is necessary to analyse the existing correlation between process condition and
defects.
Sixth step: improve the zero defect system
Apply the “5 questions for zero defects”:
- Is the condition clear?
- Is it easy to set conditions?
- Is the value variable?
- Is the variance visible?
- Is it easy to restore?
Improve the identified conditions defining priorities and implementing the necessary
countermeasures. Identify & deploy potential losses and prevent those using adequate
tools.
Seventh step: maintain the zero defect system
In the last step, regular review of conditions, about implementation status with
monitoring of losses indicators, is the never ended activity necessary to consolidate
the gains obtained. Quality activities are regularly carried out striving for higher
manufacturing effectiveness that makes use of six-sigma methodology.

72
3.5.3 Total quality maintenance (TQMain) technique
This model, developed by Dr.Basim Al-Najjar (1996) is mainly based on the Deming
cycle: Plan-Do-Check-Act (PDCA), which is the foundation of TQMain, and can be
used for the improvement of any technical or managerial system. Al-Najjar’s research
focus is on Condition Monitoring (CM) by vibration analysis, and it is therefore
natural that his model for maintenance should specifically include inspection and
monitoring. As TPM, maintenance should be integrated with production activity and
scheduled with it. Condition Based Maintenance (CBM) is based on:
- Subjective CBM,
which means that the status of component is checked by
listening, looking, feeling etc.
- Objective CBM,
which means that the status of a component is checked
through measurement of physical parameters such as
vibration, pressure, temperature…
Modern machines are normally equipped with on-line measuring devices that are used
where critical component breakdown can produce serious effects on process reliability
and product safety. Success in TQMain is measured by a modified version of Overall
Equipment Effectiveness (OEE) measure of Total Productive Maintenance (TPM),
which he calls Overall Process Effectiveness (OPE). The OEE measure combines the
six big losses of TPM under three headings, Availability (including preventive down
time), Speed (actual production rate / theoretical production rate), and Quality (1-
proportion defective).
OEE A pd. .( )1 where:
A: is the time loss due to equipment downtime
is the time loss due to speed reduction
pd is the time loss to produce defective products.
TQMain expands this measure to show how its constituent factors are calculated, but
it also calculates over a whole process rather than a single machine, and recognizes
that the same machinery may have different OPE’s for different processes. The
formula used is:

73
OPE N T n t t n n n ns m m r o f c s1 1 1/ . / / . / where:
OPE = {1- No Stoppages/Repair rate x Loading time} x {1- (No Minor
stoppages/Minor repair rate + Time lost to reduced speed operation) / Operating time}
x {1- (defectives made just after stoppages + defectives made when process was in
control + defectives due to assignable QC causes) / Total No made}.
Design & Construction Production/Operation
Condition/Vibration-
based maintenance Managerial functions Quality control
Other activities
Environmental condition
Product design
suitability Maintainbility and
reliability
Performance rate
and availability
Product
quality (1
)
Maintenance
effectiv
eness
(work m
orale)
Main
tenan
ce
cost-
effective
ness
monitoring
(Qu
ality
rate
)
Qu
ality
ma
inte
na
nce
Productquality(2)
Figure 25: The TQMain Football [23]
TQMain also recognises that the relative importance of the various factors to be
considered in maintenance policy-making varies between projects and with the
viewpoint of the manager [23]. To illustrate this, Al-Najjar devised the TQMain
Football as shown in Figure 25 above.
3.5.4 Terotechnology principles
The terotechnology model comes from the work done by the British government, and
develops feedback criteria coming from quality gurus. Figure 26 below, shows the
basic idea that expands, upon the data collection, analysis and schedule optimisation
that should occur during the operation phase, and emphasise the needs for Failure

74
Modes Effect and Critical Analysis (FMECA) and testing of new designs and training
operators and maintainers. The originators of terotechnology, led by Dennis Parker
(1970) did not specifically mention optimization as such, but did advise the revision
of schedules as result of experience. Since sensitivity of the cost rate to PM interval
are very difficult to judge without data and calculation, feedback loops are very
important to enable PM optimization and equipment design improvements.
Figure 26: Terotechnology maintenance model [31]
Terotechnology, moving from Life Cycle Cost (LCC) to Life Cycle Profit (LCP),
allows maintenance function to be seen as contributing to profits rather than just
spending money. To accommodate the profit aspects, effects of maintenance on
product quality and prompt delivery, which in turn affect market share, overall profit
margins and pricing, should be measured and acknowledged. LCP will perhaps
remain a real worthy objective, and the company’s IT system should be sufficiently
integrated to cope with the demands for instant, to supply detailed and unambiguous
information to feed the mathematical models and other decision-guiding calculations.
Figure 27 below, shows the different economical indicators, such as loss of revenues,
due to machine stops, the costs of direct and indirect maintenance throughout the
entire equipment lifetime, and their projection against OEE and the amount of money
involved for each indicator.
Design Specify Procure
TestAnalyse
(FMECA)
Install
CommissionOperate &
MaintainReplace
Analyse
Data
Optimise PM
or redesign
monitoring
condition
Design
Function

75
Direct maintenance costs
Direct maintenance costs are those related to manpower (salaries), spare parts,
templates and technical documentation.
Figure 27: Life Cycle Profit (LCP) [27]
Indirect maintenance costs
Indirect maintenance costs are all the costs generated by insufficient or lack of
maintenance (losses, wastes…). Lack of maintenance affected not only maintenance
costs, but also operational and capital costs.
Loss of revenue
Every hour of standstill or rejection of products should be interpreted as a loss of
revenue. The graph shown in Figure 28, identifies the area where an optimum costs
balance can be found.
Figure 28: Maintenance costs [32]

76
The operational cost for thousand packages produced can be calculated as shown in
Figure 29 below.
Figure 29: Producer operational cost per thousand packages produced [33]
3.6 Conclusion
In this chapter, a critical study of some reliability principles, product safety, and
maintenance engineering techniques have been examined to underline their value and
contribution in defining the maintenance design process. The extensive literature
review could highlight the main features of techniques and methodologies to shape a
maintenance design process intended to design maintenance tasks for ALF
equipments. Safety, reliability, and engineering techniques have shown their potential
to identify equipment CCPs and in providing tools and criteria to be used to design
maintenance tasks necessary to determine product safety and equipment reliability.
Statistical and engineering tools have been examined to carry out quantitative and
qualitative analysis of failures to discover the real nature of a failure and its impact on
production runs. Other maintenance engineering techniques, such as TPM, WCM,
TQMain, and Terotechnology, have been analyzed to identify the principles to be
used in the maintenance implementation process for ALF industry. Some of the
factors that could partially or totally prevent the effective implementation of
maintenance procedures have been examined to guide toward the model that enables
implementation effectiveness for ALF environment. Beyond reliability principles,
different implementation methodologies have been investigated to select useful ideas
to design an implementation process able to address and solve human, cultural, and
organizational complexities.
Customer
Operational =
Cost /1000 Total number of approved packages out line
Supplier
Service
work
Spare
Parts
Customer
Service
work
OperatorsConsumables
& Utilities+ + + +
Waste
Material
cost+

77
4. CRITICAL REVIEW OF CONDITION MONITORING (CM)
TECHNIQUES
4.1 Introduction
Monitoring the condition of critical machine elements enables component degradation
to be identified before it causes a failure. Equipment functions and components can be
monitored using different type of sensors to detect when wear, damage, or a critical
signal is starting to occur. By detecting deterioration of critical signals early,
unplanned stoppages and further damage can be avoided. Condition monitoring can
therefore be thought as a cost-effective insurance policy for critical ALF parameters
or components [34]. Although very few machine builders incorporate condition
monitoring as standard, the equipment used for the ALF, or food industry in general,
should automatically incorporate monitoring systems of critical parameters such as
those linked with machine sterilization or package integrity. The different type of
sensors available, make a vital contribution to the reliability improvement of products
and processes. The automated production lines, in the food and beverage industry,
normally benefit from the use of different kind of sensors to monitor critical
parameters both online or on request.
The scope of this chapter is to investigate this field to identify:
the benefits of online monitoring systems
the condition monitoring systems available in the market
the added value provided by different applications
how each application can give its contribution to improve safety and reliability
of ALF production lines.
4.2 Online monitoring systems
An on-line monitoring system makes use of a device which constantly monitors a
specific magnitude or movement to convert one type of energy or physical attribute to
another with the purpose of measuring and monitoring its function.
A primary consideration for an online monitoring system is to determine which
machine part or function warrant surveillance monitoring as compared to what can be
accomplished with a portable or protection monitoring systems. Figure 30 below

78
provides a good representation of where surveillance monitoring traditionally lies in a
vibration measurement condition-monitoring program.
Figure 30: Cost versus scan rate in the surveillance monitoring [35]
As this graph indicates, on-line surveillance systems are most commonly employed on
equipments that are costly to maintain and those that negatively influence production
efficiency when out of service. Another key consideration is the anticipated time from
the first indication of a developing problem to the actual onset of failure. For instance,
if the equipment is likely to fail in days or weeks, then an on-line surveillance system
is the most cost effective approach. Surveillance systems have found widespread use
for dangerous and inaccessible locations or for critical machine functions.
Continuous condition monitoring and remote diagnosis
A PC condition monitoring is a powerful driven hardware interface for monitoring
system status in critical environments. The system directly accesses the condition of
the electronic boards and systems, and delivers that data to equipment operators or to
service technicians as user-defined text messages (GSM SMS), e-mails, or on-site
visual signals. The potentiality of the continuous remote monitoring is such that can
replaces some preventive maintenance by “repair on demand”, greatly reducing the
costs of on-site troubleshooting service calls. Required hardware maintenance can
frequently be diagnosed early and carried out during planned shutdown times. In
addition, system availability increases, since most failures of monitored components

79
can be detected in advance and thus prevented [36]. Some examples of measurable
condition parameters are time, temperature, concentration of fluids, monitoring of
processors, but also supply voltages and other physical parameters.
4.3 Condition monitoring systems to increase maintenance
effectiveness
Traditionally, condition monitoring was a field requiring expert knowledge to
interpret complex signals produced by machines to determine when mechanical
failure will occur. Today, a sensor monitors machine condition, and the sensor itself
analyses the data, removing the need for interpretation periodically by an expert
technician. Vibration sensor can recognize a problem with a bearing right down to
which rolling element is causing the problem, and is able to ignore any background
noise that is occurring. Infrared Thermography is a diagnostic technique in which an
infrared camera is used to measure temperature variations on the surface of the body,
producing images that reveal sites of abnormal tissue growth. Tribology is the science
and technology of interacting surfaces in relative motion. It includes the study and
application of the principles of friction, lubrication, and wear. Any product where one
material slides or rubs over another is affected by complex tribological interactions,
whether lubricated or unlubricated as in high temperature sliding wear in which
conventional lubricants cannot be used. Here below a list of condition monitoring
techniques applied to different equipment components and functions:
MECHANICAL COMPONENTS
1. Infrared Thermography
2. Oil Analysis (Tribology)
3. Airborne and Structure-borne Ultrasonic
4. Vibration Analysis
5. On-line Motor Circuit Analysis
ELECTRICAL COMPONENTS
1. Infrared Thermography
2. Oil Analysis
3. Airborne and Structure-borne Ultrasonic

80
4. Vibration Analysis
5. Off-line Motor Circuit Analysis
STATIONARY ASSET
1. Infrared Thermography
2. Airborne and Structure-borne Ultrasonic
3. Pulse Echo Ultrasound
4. Magnetic Particle Testing
5. Penetrant Testing
6. Visual Inspection
7. Radiographic Testing
8. Eddy Current Testing.
Infrared thermography, vibration analysis, and tribology are now shortly examined to
highlight the main features and benefits, and limitations from their use in predictive
and preventive maintenance.
4.3.1 Infrared thermography (IR)
Infrared Thermography, thermal imaging, thermographic imaging, or thermal video, is
a type of infrared imaging science. Thermographic cameras detect radiation in the
infrared range of the electromagnetic spectrum (roughly 900–14.000 nanometres or
0,9–14 µm) and produce images of that radiation. Since infrared radiation is emitted
by all objects based on their temperatures, according to the black body radiation law,
thermography makes it possible to “see” one’s environment with or without visible
illumination. The amount of radiation emitted by an object increases with
temperature; therefore thermography allows one to see variations in temperature.
When viewed by thermographic camera, warm objects stand out well against cooler
backgrounds; humans and other warm-blooded animals become easily visible against
the environment, day or night [37].
Electrical inspections can reveal some potential problems that usually go undetected
until a serious breakdown occurs. At the same time, electricity leaks or not properly
balanced loads increase electricity peak loads and, thus, may result to unnecessary
charges. An IR inspection on electrical components can detect various problems in the

81
electrical cabinet, like poor connections, short-circuits, overloads, load imbalances, as
shown in Figure 31.
Figure 31: IR inspection shown high temperature on an electrical connection [37]
The figure shows a high-temperature difference on two main phase fuses (about 20°C
above the left fuse). This is a result from an overload that has caused frequent failures.
One of the main advantages of electrical inspections is that they are performed under
full-load and real operating conditions. The inspection of even large electrical
installations can be performed in a short amount of time, without interrupting service.
Identifying the potential source of a problem can minimize workload and prevent
costly failures. Focusing on specific components will significantly cut down the time
required for a short building audit. Various issues on the definition of critical
equipment parts are available, but can be found through HACCP and FMECA
application. This system can also be used to set up an effective Electrical Preventive
Maintenance (EPM) program.
Problems and limitations of infrared thermography
In general, the interpretation of IR thermographs from electrical inspections need to
take into account that the problem identification involves by default some errors since
the accuracy of the temperature measurement is not sufficiently high in order to
determine the microscopic area of high resistance where the heat is generated.
Consequently, the temperature at some specific locations may even reach the melting
point. However, at a distance of even a few centimetres this may appear within the
expected ranges. In addition, the evolution of the phenomena may alter the problem.
For example, it is possible that a previous undetected problem may have caused local

82
damages, which are not visible any more (i.e. possible melting may have caused
rejoining of the contacts). This may result to a temporary temperature drop. The
magnitude of the problem may be a more serious one that it appears when the
operating conditions at the time of the inspection are not at full-load. Transformers are
usually one of the most dependable elements of an electrical installation. However,
they are vulnerable to heat related failures. Operating temperature rises over ambient
of 65°C for oil filled and 150°C for air-cooled transformers are common. Above these
temperatures, the internal insulation begins to fail very rapidly due to a breakdown in
the insulation on the windings causing an electrical short.
The IR mechanical inspections can concentrate to critical equipment and components,
and to rotating equipment. For example, to inspect pipes and ducts, to locate leaks
from distribution networks (i.e. air ducts, pipes, boiler flue gas leaks), to check
operating status of air supply inlets and outlets located at hard to reach places, and to
verify proper operating conditions of rotating equipment. Pipe inspection can identify
internally damaged sections, as a result of erosion that locally reduces wall thickness
(i.e. especially in pipe elbows). Using IR thermography, it is possible to detect
subsurface defects, with measurements under transient conditions. For example, to
inspect a network of chilled or hot water pipes, the measurements are made when the
main system starts its operation, that is when a thermal transient is generated inside
the pipe as the water temperature is changing. Local pipe surface corrosion under
insulation is another hidden problem that can be revealed with an IR inspection,
before it grows to become a serious one. Corrosion is most severe in steel pipes at
about 90°C (common conditions for most hot water heating systems in ALF industry).
The problem is caused by the entrance of water (i.e. from water leakage,
condensation) into the insulation that traps the water in contact with the metal surface.
In this case, it is first necessary to inspect sections with damaged or deteriorated
insulation. Although the inspector cannot see through the insulation material, the IR
inspection can detect a temperature difference between dry and wet insulation and,
thus, it is possible that there is corrosion under the wet insulation area.
4.3.2 Vibration analysis
Vibration refers to mechanical oscillations about an equilibrium point. The
oscillations may be periodic such as the motion of a pendulum or random such as the
movement of a tire on a gravel road. Vibration is occasionally “desirable”. More

83
often, vibration is undesirable, wasting energy and creating unwanted sound and
noise. For example, the vibrational motions of engines, electric motors, or any
mechanical device, like ball bearing, in operation, are typically unwanted. Such
vibrations can be caused by imbalances in the rotating parts, uneven friction, the
meshing of gear teeth, etc. Vibration is considered the best operating parameter to
judge dynamic conditions such as balance (overall vibration), bearing defects
(enveloping) and stress applied to components. Many machinery problems show
themselves as excessive vibration. Rotor imbalance, misalignment, mechanical
looseness, structural resonance, soft foundation, and gear mesh defects are some of
the defects that can be measured by vibration. Measuring the “overall” vibration of a
machine, a rotor in relation to a machine or the structure of a machine, and comparing
the measurement to its normal value indicates the current health of the machine [38].
Different type of sensors are used to measures the vibration of a machine while it is
operating. To know how to best monitor a machine’s condition requires one to know:
which measurements to take, where and how to take them.
Types of defects detected by vibration analysis
The presence of a defect causes a significant increase in the vibration level. Bearing
defects may be categorized as “distributed” or “local”. Distributed defects include
surface roughness, waviness, misaligned races, and off-size rolling elements. The
surface features are considered in terms of their wavelength compared with the
Hertzian contact width of the rolling element raceway contacts. Surface features of
wavelength of the order of the contact width or less are termed “roughness”, whereas
longer-wavelength features are termed “waviness” [39]. Distributed defects are
caused by manufacturing error, improper installation, or abrasive wear. The variation
in contact force between rolling elements and raceways due to distributed defects
results in an increased vibration level. The study of vibration response due to this
category of defect is, therefore, important for quality inspection as well as condition
monitoring. Localized defects include cracks, pits, and spalls on the rolling surfaces.
The dominant mode of failure of rolling element bearings is spalling of the races or
the rolling elements, caused when a fatigue crack begins below the surface of the
metal and propagates towards the surface until a piece of metal breaks away to leave a
small pit or spall.

84
Techniques used to measure vibration
Several techniques have been applied to measure and analyze the vibration response
of bearings with localized defects. These techniques are not totally independent;
rather, in many cases, they are complementary to one another.
Time-domain approach
The simplest approach in the time domain is to measure the overall root-mean-square
(RMS) level and crest factor, i.e., the ratio of peak value to RMS value of
acceleration. This method has been applied with limited success for the detection of
localized defects. Some statistical parameters such as probability density and kurtosis
have been proposed for bearing defect detection. The probability density of
acceleration of a bearing in good condition has a Gaussian distribution, whereas a
damaged bearing results in non-Gaussian distribution with dominant tails because of a
relative increase in the number of high levels of acceleration.
Local defects can also be detected in the time domain by displaying the vibration
signal on an oscilloscope or plotting it on a chart recorder and observing the presence
of periodic peaks due to impact of the rolling element with the defects. Gustafsson
and Tallian proposed a method of defect detection based on the number of peaks
crossing a preset voltage level. Some band-pass filtering techniques have also been
proposed in the time domain.
The shock pulse method
The shock pulse method, which works on this principle, uses a piezoelectric
transducer having a resonant frequency based at 32 kHz (some instruments based on
resonant frequency around 100 kHz have also been used). The shock pulse, caused by
the impact in the bearing, initiates damped oscillations in the transducer, at its
resonant frequency. Measurement of the maximum value of the damped transient
gives an indication of the condition of rolling bearings. Low-frequency vibrations in
the machine, generated by sources other than rolling bearings, are electronically
filtered out.
Frequency-domain approach
Frequency-domain or spectral analysis of the vibration signal is perhaps the most
widely used approach of bearing defect detection. The advent of modern Fast Fourier
Transform (FFT) analyzers has made the job of obtaining narrowband spectra easier

85
and more efficient. Both low- and high-frequency ranges of the vibration spectrum are
of interest in assessing the condition of the bearing. The interaction of defects in
rolling element bearings produces pulses of very short duration whenever the defect
strikes or is struck owing to the rotational motion of the system. These pulses excite
the natural frequencies of bearing elements and housing structures, resulting in an
increase in the vibrational energy at these high frequencies. The resonant frequencies
of the individual bearing elements can be calculated theoretically. It is difficult to
estimate how these resonances are affected on assembly into a full bearing and
mounting in housing [39].
Use of non-contact transducers
The literature discussed so far has mostly considered casing-mounted transducers,
some researchers have also used non-contact type displacement or proximity
transducers for condition monitoring of rolling element bearings. In these studies, the
transducer senses the displacement of the outer race directly as the rolling elements
pass under it. Thus, the extraneous vibrations of the housing structure are reduced or
eliminated and the signal-to-noise ratio is improved. However, the installation of these
probes is difficult as it not only involves drilling and tapping of the bearing housing
but also fine adjustment of the gap between the probe and the outer race, which can
change due to such conditions as vibration, dirt and thermal expansion.
4.3.3 Oil analysis (Tribology)
Tribology is the science and technology of interacting surfaces in relative motion. It
includes the study and application of the principles of friction, lubrication, and wear.
Tribology plays an important role in manufacturing. A layer of lubricant, which
eliminates surface contact, virtually, eliminates tool wear and decreases needed power
by one third. Historically, Leonardo Da Vinci (1452-1519) was the first to enunciate
two laws of friction. According to Da Vinci, the frictional resistance was the same for
two different objects of the same weight but making contacts over different widths
and lengths. The term became widely used following the Jost Report in 1966, in
which huge sums of money were reported to have been lost in the UK annually due to
the consequences of friction, wear, and corrosion. As a result, several national centres
for tribology were created in the UK [40]. The tribological interactions of a solid
surface’s exposed face with interfacing materials and environment may result in loss

86
of material from the surface. The process leading to loss of material is known as
“wear”. Major types of wear include:
- abrasion,
- adhesion (friction),
- erosion, and
- corrosion.
Wear can be minimized by modifying the surface properties of solids by one or more
of “surface engineering” processes (also called surface finishing) or by use of
lubricants (for frictional or adhesive wear).
Application of Dempster-Shafer (D-S) theory to oil monitoring
In order to solve the problem of diagnosing wear in tribosystem, evidence theory of
Dampster-Shafer is applied to realize the information fusion of multi-parameter in oil
monitoring. Two diesel engines model 8NVD-48A were monitored under running
condition by the oil monitoring methods such as:
- spectrometric oil analysis,
- ferrographic monitoring,
- infrared spectrum analysis and
- oil quality testing.
According to the results from the monitoring experiment, the types of worn parts and
the relevant monitoring characteristic are summarized [41]. The worn parts are mainly
pointed to scoring, seizure and corrosion between piston (or piston ring) and cylinder
liner; scratching, seizure, spalling and corrosion in gear; pitting, seizure and fatigue in
gear.
Tribological failure types and their features
The monitoring experiment is conducted on two marine diesel engines that were
mounted in a passenger ship. According to the monitoring results and some other
monitoring examples of the same type engine, the wear types of parts and their
features from oil monitoring are summarized and listed in Table 3.

87
Information Characteristic from Different Oil Monitor Number Parts Name
Failures Type
SOA Ferrographic monitoring
Infrared* Quality**
Scoring Abnormal in concentration of ferrous-element
Small cast iron cutting wear particle
Soot Increases
Benzene insoluble increases
Seizure Abnormal in concentration of both ferrous and nonferrous element
Cast iron and aluminum severe sliding wear particle with a rough surface
TAN increases
1 Piston & Cylinder Liner
Corrosion Abnormal in concentration of ferrous-element
Corrosive wear debris
Sulfation increases
Scratching Abnormal in concentration of nonferrous element;Silicon increase
Nonferrous cutting wear particles
Benzene insoluble increases
Seizure Abnormal in concentration of nonferrous element
Nonferrous metal wear particles with oxidation; Black oxides of iron
Oxidation increases
Viscosity increases
Spalling Abnormal in concentration of nonferrous element
Nonferrous metal fatigue particle
2 Bearing
Corrosion Abnormal in concentration of nonferrous element
Corrosive wear debris
Sulfation increases
TAN increases
Pitting Abnormal in concentration of ferrous-element
Steel rubbing and fatigue wear particle
3 Gear
Scuffing Abnormal in concentration of ferrous-element
Steel severe sliding wear particles with striations
Oxidation increases
Benzene insoluble increases
Table 3: Wear types on parts and information characteristics in oil monitoring [41]
For the tribosystem in diesel engine, wears of parts are the main tribological failure
which include scoring, seizure and corrosion between piston and cylinder liner;
scratching, seizure, spalling and corrosion in bearings; and pitting, scuffing and
spalling in gear.
4.4 Sensors for continuous monitoring (CM)
In this section, some of the sensors used for continuous monitoring applied to the ALF
industry are briefly presented to underline the importance of automatic monitoring as
a tool to improve product safety and equipment reliability.

88
4.4.1 Conductivity sensor for cleaning in place (CIP) applications
In ALF industry, equipment cleaning represents a mandatory pre-requisite before
equipment sterilization. The concentration of the fluids used to clean the product pipes
need to be monitored and the conductivity sensor is the component for CIP (Cleaning-
In-Place) applications to make sure that the quality of the fluid is within the
specifications. This sensor provides the time and cost saving benefits of phase
detection across all transmitted media, including aggressive cleaning agents (alkaline
and acid solutions). It also guarantees transparency of the process at all times, plus
protection against expensive errors in fluid handling. Nowadays a four-electrode
technology gives an extended measuring range (0.1uS/cm to 500mS/cm) and this
technology is particularly reliable since it eliminates the polarization phenomenon
normally observed with two-electrode sensors.
4.4.2 Continuous monitoring of liquids
In ALF industry different liquids are used for different proposals:
- Hydrogen peroxide as sterilization medium to sterilize packaging material and
piping surfaces in contact with food product
- Cooling water to cool down the sterile air through heating exchanger system
and sealing systems
- Cleaning water to clean and rinse the product circuit after the production
phase.
Continuous monitoring of these liquids allows the company to avoid manual checks
depending on human factor, to increase equipment reliability and product safety
through automatic control of critical parameters.
Continuous monitoring of liquid concentration
A new spectrophotometric technique allows the continuous monitoring of liquid
concentration enabling to put under control the hydrogen peroxide, which is one of
the most important process sterilization variables largely used to sterilize the
packaging material in ALF industry. Inline spectroscopy also offers continuous
monitoring of the concentration of liquids that consists of several components to
ensure efficient process control. The mid-infrared spectrometer can directly be
connected to the process to obtain reliable on-time liquid concentration measures that
enable the equipment to activate corrective actions if the lowest concentration

89
threshold is exceeded. These devices can efficiently be used to determines
concentrations quickly and precisely and can even be used in hazardous area
applications.
Water pH control
The pH of water, used in the ALF equipments, represents an important parameter to
monitor to avoid problems with filters or mechanical parts. Corrosion of parts or
cooling inefficiency, due to water residues, may depend on the quality of water and
pH (acidity) measurement. A sensor for pH control allows the system to carry out a
preventive detection of potential anomalies that can results in an equipment
downtime. To overcome problems of pH control contamination, in the conventional
pH monitoring systems, a solution using proportional hydroxide dosing and the
implementation of Auto-Clean pH controller has recently been introduced. Sensors
electrodes can be user-specified to ensure measurement reliability and maximum
sensor lifetime.
Water treatment and bacteria measurement
The presence of some bacteria in the cooling water circuit can represent a real and
critical problem to solve for some of the equipments used in food industry. A new
method to monitor critical bacteria in the water is now available and this can be
particularly useful in biotechnology and bioengineering. Researchers at Purdue
University in the US verified a theory that copper is vital to the proper functioning of
a key enzyme in the bacteria. This method senses minute changes in chemistry related
to bacterial health and yields results immediately, unlike conventional technologies,
which require laboratory analyses taking at least a day. This immediacy could make it
possible to detect the bacterial load in the water and to alert the equipment operator
through a suitable alarm signal.
4.4.3 Continuous monitoring of air quality through electronic nose
The measurement and estimation of human-related senses has become an established
technique in sensor research, as well as in the practical design of measurement and
control systems. The commercialization of the electronic nose began in 1993 as the
concept became widely accepted as an effective instrument for detection and
estimation of olfaction. Since extraneous elements, in the air of the ALF production
90
room, could produce sensorial variations of the product packed or storage, these
devices can be installed in different equipment or production areas to monitor the
sensorial quality of the air. The general set-up of an electronic nose consists of an
array of chemical sensors; an air flow system, which switches the reference air and the
tested air; a signal analysis technique; and a presentation unit. To increase the
complexity of the odours system, an array of mixed sensing principles is often
designed, consisting of different types of sensor, in order to create differences in
operating temperatures, flow conditions, and sensor response times [42]. This means
that artificial human-related sensor systems could become the everyday tools for
estimation of our own personal condition as well as that of the environment.
4.5 Conclusion
This chapter dealt with condition monitoring of critical machine variables to avoid
component degradation and then equipment failure. Equipment critical functions can
be monitored using different type of sensors to detect deterioration and avoid
unplanned stoppages, and further damages. Some of the equipments used in the ALF
industry, through specific sensors, automatically monitor critical parameters such as
those linked with machine sterilization or package integrity. The automated
production lines, in the food and beverage industry, normally make use of these
sensors to monitor critical parameters both online or on request. Continuous condition
monitoring and remote diagnosis systems have been presented to directly access the
condition of critical functions and delivers data to equipment operators and to service
technicians. Condition monitoring represents a reliable tool to monitor machine
conditions, usually carried out on regular base, by expert technicians. The sensors
used, monitor machine condition, analysing data and removing the need for periodical
human inspection. Condition monitoring is changing manufacturing operations as
maintenance is only needed once the condition monitoring sensor detects a variation
linked with potential failure, whereas, in the past, routine maintenance was carried out
whether machines were faulty condition or not. Infrared Thermography has been
examined as a diagnostic tool to measure temperature variations on the surface of a
body, producing images that reveal electrical and mechanical anomalies. Vibration
sensor represented another important tool to recognize anomalies with mechanical
components such as bearings in which the rolling element can cause problems. The

91
analysis of these components in the past was completely manual and carried out by a
vibration expert to examine details of the equipment regarding mechanical geometry
and quality. Tribology was, at the end, examined as the science that studies the
interaction of surfaces in relative motion. The study and application of the principles
of friction, lubrication and wear is commonly applied in bearing design but it extends
to any other product where one material slides or rubs over another and is affected by
tribological interactions. To achieve the highest maintenance effectiveness, in some
critical circumstances, thermography, vibration and tribology can be combined and
integrated to make maintenance activity even more reliable.

92
5. THE PROCESS TO DESIGN MAINTENANCE PROCEDURES
FOR ALF INDUSTRY
5.1 Introduction
In this chapter the different phases of the process identified to design maintenance
procedures (task lists) for ALF industry are examined. The reliability concepts, the
safety and the maintenance engineering techniques, presented in chapter three, have
been compared and contrasted to identify the principles to be used in building up the
design process. Hereafter the process blocks, highlighting the main maintenance
design phases, are listed in sequential order.
Product Safety Identification of Critical
Product Safety Issues
Equipment Reliability Identification of Equipment
Reliability Issues
Product Safety & List of Product Safety &
Equipment Reliability Equipment Reliability Issues
Analysis of Safety & List of Priorities according to
Reliability Priorities Safety & Reliability Analysis
Definition of Maintenance Task Lists
Maintenance Tasks for ALF Industry
This chapter examine the content of the maintenance process to design maintenance
task lists for ALF packaging lines, the contribution of each phase is shortly described
here below:
1) The first phase has been thought with the intention to identify and address all
conceivable CCPs that could influence product quality and safety. The

93
application of safety methodologies such as HACCP and HAZOP can identify
the existing equipment and process criticalities, to weight them to establish a
list of priorities that have a direct impact on final product safety.
2) In the second phase the equipment reliability issues are deeply examined
through the application of some maintenance engineering techniques to
identify criticalities, belonging to equipment functions, and relative solutions.
3) The third phase addresses the need to highlight product safety and equipment
reliability issues weighting both criticalities together in the same form. This
phase contributes to link equipment reliability and product safety through the
identification of global risk priority number which result from the analysis of
quality and reliability risks.
4) In the fourth phase a list of priorities is properly developed according to the
scoring resulting from previous analysis. This form represents a summary of
the work done in the previous phases and is a document that list the items
according to their criticality.
5) The fifth phase enables the design team to develop maintenance task lists able
to control ALF criticalities dependent on product safety and equipment
reliability.
As shown in Figure 32, the peculiarity of this process, compared to other processes
used to design maintenance procedures for different industrial sectors, is its ability to
link the end product quality together with equipment reliability issues to produce an
outcome able to address every criticality of the ALF packaging line.
Figure 32: The maintenance design process goals
This process will strongly contribute to identify all critical process variables that have
a negative impact on product safety, on equipment reliability and the maintenance
solutions to put these criticalities under control.
Product Quality & Safety
Equipment Reliability
Task Lists

94
5.2 Step one: application of HACCP methodology
As first step, through HACCP methodology, all critical machine parts and
components (CCPs), that have a negative effects on product safety, are identified
together with the risks associated to different failure modes. HACCP identifies and
assess specific hazards, estimates risks and establishes control measures that
emphasize product safety, though problem prevention and control, rather than reliance
on end-product testing and traditional inspection methods. Machine parts or
components, whose fault may produce biological, chemical or physical hazard, are
examined to devise critical control limits and preventive maintenance
countermeasures. As shown in Figure 33 below, at this design stage, all conceivable
product safety hazards, coming from equipment operation and human behaviour must
be identified, to ensure that:
Equipment
Human (operational) and
External (service & utilities)
criticalities that have a direct impact on biological, chemical and physical
modification of the product packed are listed and examined.
Figure 33: HACCP process blocks
HACCP
Hazard Analysis
&
Critical Control Points
Identification of CCPs
Have all critical factors
been considered for HACCP
analysis?
Residual CCPs
to be added to the
HACCP process
HACCP RESULTS
CCPs associated to
biological, chemical &
phisycal risks
Yes
No

95
To achieve this result, HACCP, HAZOP methodologies and GMP, suggested by ISO
22000 certification (Food Safety Management), have been analyzed to identify all
critical equipment and operational conditions and the most effective way to manage
all product safety risks. Despite HAZOP methodology is normally used to assure that
catastrophic incidents (in chemical industry) will be avoided during the lifetime of a
production line under review, it provides some useful guidelines to identify the
operational situations or conditions where human error may occur. Our study will
consider human errors mainly occurring during the operational phase (preparation,
production and after production phases).
As first step, application of HACCP and HAZOP techniques will enable identification
of the following critical issues:
hazards, directly connected to the equipment/system/component functions
identification of CCPs in the equipment operation
critical limits for each CCP
hazards in performing operational tasks
preventive measures to carry out at every maintenance interval
monitoring procedures or devices to detect loss of control at the CCP.
According to Figure 8, the development of a HACCP plan requires seven principal
activities to be carried out by the HACCP team. These activities have to be applied to
the process equipment and to operational tasks to identify CCPs and to establish
adequate maintenance procedures. The seven principal activities are:
ACTIVITY 1
Conduct hazard analysis, on equipment functions and on operational tasks to identify
hazards (biological, chemical and physical) and specify control measures
ACTIVITY 2
Identify critical control points (CCPs)
ACTIVITY 3
Establish critical limits at each CCP
ACTIVITY 4
Establish monitoring procedures or condition monitoring devices
ACTIVITY 5
Establish corrective action procedures

96
ACTIVITY 6
Establish verification procedures
ACTIVITY 7
Establish documentation procedures as appropriate.
Here below the HACCP activities are described with regard to the ALF environment.
ACTIVITY 1: Listing all hazards and considerations of any control measures to
eliminate or minimize hazards depending on equipment functions and operational
tasks
The hazards considered during this activity are the following:
Biological hazards
It includes all potential sources of product contamination (direct and indirect)
depending on equipment functions and operational tasks. This can include cleaning
errors, depending on the equipment or human factors, lack of package integrity,
wrong equipment settings, lack of preventive maintenance procedures and operator
mistakes.
Chemical hazards
It includes, among the others, cleaning compounds and sterilization agents.
Hydrogen peroxide, normally used to sterilize the packaging material, could come in
contact with the food product if critical conditions of some components are not
monitored and inspected through maintenance activities. Alkaline and acid solutions,
used to clean the filling section of a filling machine, could come in contact with the
food product that supplies other filling machines, if the seal of a valve is not working
correctly.
Physical hazards
It includes objects, such as metal fragments, glass, that can be found in the product
packed, and that may cut the mouth, break teeth, or perforate the package. Since the
filling section of filler is normally using a variable amount of moving parts, the
analysis must consider all the critical components and operations to avoid that solid
fragment (metals and plastics) could come in contact with the product packed.

97
The team involved in this activity, must consider all the conceivable sources of
equipment and operational hazard, and list them under the three (biological, chemical
and physical) main areas of risk.
ACTIVITY 2: Establishment of Critical Control Points
After all hazards have been identified, a CCP decision tree module is to be used to
determine whether a CCP can be identified for the specific hazard. If a hazard has
been identified for which no control measure exists, the machine part or component
should be modified so that hazard is eliminated or reduced to acceptable or minimal
levels. The module shown in chapter 3, Figure 8, is a HACCP decision tree normally
used for establishing CCPs. If a CCP refers to an operational activity, carried out by
the equipment operator, this have to be clearly described and specific hazards
identified.
Critical operational practices need to be described without grey areas: adjustment,
registrations, and mechanical settings must be verified and possibly monitored
through automatic monitoring devices.
ACTIVITY 3: Establishment of critical limits for each CCP
Critical limits must be specified for each control measure at each CCP.
In some cases, more than one critical limit will be specified at a particular CCP. If a
critical measure has a direct impact on other physical parameters, these need to be
identified together with critical limits. It is recommendable that quantity variations are
compared with target levels to ensure that critical limits are met. For critical
operational pre/post-production or production practices that are directly linked to
biological, chemical, and physical hazard, potential deviations need to be identified
together with critical limits.
ACTIVITY 4: Establishment of monitoring system for each CCP
Monitoring is the periodic measurement or observation at a CCP to determine whether
a critical limit or target level has been met. The monitoring procedure must be able to
detect loss of control at the CCP. Automatic monitoring devices need to be used
where a physical parameter under control can automatically be measured. To
minimize the hazard, optical systems can also be used to monitor critical operational
practices or physical conditions of critical equipment parts.

98
ACTIVITY 5: Establishment of corrective actions
Corrective actions are those actions that need to be taken either when monitoring
results show that a CCP has deviated from its specific critical limit or target level or,
preferably, when monitoring results indicate a trend toward loss of control. Corrective
actions can either be referred to deviations regarding potential hazard or to loss of
control at the specific CCP.
ACTIVITY 6: Establishment of verification procedures
Procedures for verification must be established to ensure that HACCP system is
working correctly. Monitoring and auditing methods should be devised, for
operational practices, to assess if criticalities, control measures and deviations are
under control. Procedures, tests and analysis, can be used to assess if the activities
designed fulfils the safety targets identified for each CCP.
ACTIVITY 7: Establishment of record-keeping and documentation
Adequate, accurate record-keeping and documentation are essential to the application
of the HACCP system. Examples of records are: HACCP plan, CCP monitoring
records; a file with deviations; preventive maintenance procedures, included in the
check lists and check lists review.
Application of HACCP methodology represents a mandatory step in the maintenance
design process, a basic tool to identify critical issues that may have a relevant impact
on food product safety and quality.
5.3 Step two: application of reliability centered maintenance (RCM)
Basically, the outcome coming from the first step is the identification of criticalities
associated to product safety and quality. After identification of CCPs (Biological,
Chemical, and Physical risks) linked to the equipment parts and to operational
practices, Reliability Centered Maintenance (RCM) has been used for the following
reasons:
a) To make an analysis of the different failure modes and their effects on
equipment operation: the application of Failure Mode Effect and Critical
Analysis (FMECA) enable the identification of different priorities associated
to different failure effects

99
b) Furthermore, RCM supply the right methodology to define the different
maintenance approaches implemented through the task list content to
effectively manage food product safety and equipment reliability issues.
As shown in Figure 34, RCM process should ensure that all types of failures and their
effects are analyzed to design the most effective maintenance task for each failure
type.
Figure 34: RCM process
In implementing an RCM design program, it is strongly recommended that one
system at a time is taken under consideration. It is also important to choose a single
system and take it all the way through each step of the RCM process before moving
on the next. The customized approach chosen includes the following activities:
1. System selection
2. Boundary definition & Operational mode summary
3. Failure Analysis (quantitative & qualitative)
4. Functional and potential failure determination
5. Failure Modes and Effects Analysis (FMEA)
6. Maintenance history and technical documentation
review
7. Task selection and frequency determination.
Identification of
RCM priorities
Have all components
been considered for
RCM analysis?
Residual RCM
components to be
added to RCM process
RCM RESULTS
CCPs associated to
biological, chemical &
phisycal risks
Yes
No
RCM ANALYSIS
Reliability analysis based
on FMECA

100
5.3.1 System selection
According to the results of HACCP analysis, safety and health issues should
determine the priorities in the selection of equipment systems and sub-systems. The
use of Failure Reporting, Analysis and Corrective Action Systems (FRACAS)
technique can provide a framework for controlling corrective action processes and
then to identify the priorities in choosing equipment systems and sub-systems. The
FRACAS process may also be referred to as DRACAS (Data Reporting, Analysis,
and Corrective Action System), or PRACA (Problem Reporting, Analysis, and
Corrective Action System), as well as CA (Corrective Action) systems, and other
acronyms. At its core, FRACAS is a comprehensive closed-loop corrective action
system which can collect, quantify, and control a wide range of incoming failure
reports, such as test data, breakdown and unsterility data, or repair data. Data coming
from field experience should support HACCP analysis.
5.3.2 Boundary definition & operational mode summary
After identification of a machine system, as shown in Figure 35, groups and parts,
directly linked to each sub-system, should be listed to define both components
function and system boundaries.
Figure 35: List of equipment sub-systems, groups, and parts
Looking at the equipment type as a simple process with a value-added transformation
of inputs to produce some desired output will help determine the function.
Figure 36 shows a few examples referred to as an ALF filler.
Equipment Type
Sub-System
(1)
Sub-System
(2)
Sub-System
(3)
Group
(A)
Group
(B)
Part
(A1)
Part
(A2)

101
Figure 36: Transformation of inputs in outputs in an ALF filler
An operational mode summary is a description of the anticipated mix of ways the
system will be used in carrying out its operational role. These data are used to
establish the Reliability and Maintainability (R&M) characteristics of the system. In
other words, it gives us a baseline to which our maintenance program must support.
5.3.3 Failure analysis
After system boundary definitions, this step has been introduced to identify the
existing failures in the different equipment sub-systems.
Quantitative analysis of failures
First, as we saw in chapter 3.4.3, the use of statistical analysis will permit a
“quantitative analysis” to identify the different sources of variations existing in the
equipment or in the production line. As shown in Figure 37, the different control limit
thresholds used by SPC, can weight each failure type (Potential and Functional) and
to define their probability of occurrence. Control Charts graphically highlight data
points that do not fit the normal level of variation expected. It is standard that the
Common Cause variation level is defined as +/- 3 Standard Deviations from the mean.
This is also known as the Upper Control Limit (UCL) and Lower Control Limit
(LCL) respectively and it is all based on probably figures.
Equipment
Type:
Aseptic Filler
Packaging &
Auxiliary Material
Sterile Product
Tight containers
filled of sterile
liquid food
Sub-System
(Air Sterilization)
Air Intake
(from production
room)
Sterile air for
sterile system

102
Figure 37: +/-3 Std.Dev. warning lines on SPC Control Chart
The use of SPC will provide two basic functions:
(1) Information on the performance of the process, tracking the events
affecting the production line
(2) Information on special cause variations.
Since during the equipment operation we can experience both potential (P) and
functional (F) failures, potential failures can be considered as variables monitored
through condition monitoring, and functional failures as attributes that produce lack of
equipment availability. Through SPC, variables are measured while attributes are
counted. The Control Limits must be based on data coming from the past (historical
figures) and depending on the sources of variation included in the subgroups, the
control limits which detect the special cause variation will be affected. Normally we
really want to have subgroups with only common cause variation, so if other sources
of variation are detected, the sources will be easily found instead of buried within
your definition of subgroups.
The use of warning lines, with lower and upper limits, and the action lines will
provide a deeper knowledge about the causes that determine equipment stop and that
produce potential and functional failures. The analysis of the information available
normally shows variables (potential failures) and attributes (functional failures) to
define the content of both: “inherent” variability of the process and the special causes
that produce lack of equipment availability.
68
%
95
%
99
.7%
3
2
1-1
-2
-3
68
%
95
%
99
.7%
3
2
1-1
-2
-3

103
Qualitative analysis of failures
As soon as the different types of failure have been identified, through statistical and
historical analysis, and potential and functional failures been weighted, we are ready
to proceed with a qualitative analysis of failures. The use of different quality tools will
determine a clear understanding of:
- the links existing between causes and effects
- the reasons behind each cause
- the link existing between each cause and the global
equipment and manufacturing context
- the logical order of the events that produce a failure.
First: Fault Tree and What’s Different Analysis
The use of Fault Tree Analysis (FTA) establishes a connection between the different
failure modes and a specific effect. The investigation to determine the underlying
reasons for non-conformance to system requirements leads to the identification of
non-conformance root causes necessary to define appropriate corrective actions. FTA
is a graphical technique that identifies all potential failure causes. The fault tree starts
with a top undesired event, which is the system failure mode for which one is
attempting to identify all potential causes. The analysis then continues to sequentially
develop all potential causes. The section 3.4.5 shows figures and symbols used by the
fault tree technique.
After production of the tree that link potential failure causes to effects in a logical
order, it becomes necessary to implement some supporting techniques to better
identify the true failure causes. “What’s Different” analysis is a simple technique that
identifies changes that might have induced the failure. The basic premise of this
analysis is that the system has been performing satisfactorily until the failure
occurred; therefore, something must have changed to induce the failure. Potential
changes include the analysis of all interacting factors such as:
- system design,
- manufacturing practices and processes,
- change of suppliers,
- change of equipment operators,
- quality change in the hardware lots, and
- some other factors.

104
As changes are identified they should be evaluated against the potential failure causes
identified.
Second: Root Cause Analysis & Cause Mapping
The use of these two techniques ties problems to the global manufacturing
organization context. Root Cause Analysis (RCA) is based on three fundamental
questions:
What’s the problem?
Why did it happen?
What will be done to prevent it?
RCA starts from the result or from the symptom of the problem linking this to the
underlying causes. Since starting an investigation with a single problem does not
necessary reflect the global nature of a failure, cause mapping defines problems
within the context of a manufacturing’s overall goals. Looking at Figure 38, we see
that the analysis breaks the problem down into its parts, analyzing a failure and
breaking it down into specific cause-and-effect relationship.
Figure 38: Cause Mapping applied to overall organization’s goals
The Cause Map organizes the findings of any investigation visually into “effect”
boxes on the left followed by a cause to its right. The cause, in turn, represents an
effect of another cause, again placed to the right. For this reason, every box in a cause
map can be viewed as both an effect and a cause at the same time. The fuel that drives
ProductSafety
Problem
MachineEfficiencyProblem
Direct &IndirectCosts
Cause
Cause
Cause
Cause
Cause Cause
Cause

105
the cause-map analysis involves “why” questions, which link together a chain of
events.
Third: Ishikawa with his fishbone diagram
This technique helped visually to capture a problem and all possible causes. As we
saw in Figure 15, the technique enables one to visually lay out the causes of a
problem, grouping them under different root families: machines, methods, material,
measurements, environment, people… Ishikawa begins with a problem and then
identifies possible causes by separate categories that branch off like the bones of a
fish. This complementary tool of RCA, defines one problem at a time and find causes
enabling to gain a global picture of the causes grouped for categories. This technique
does not show the cause and effect relationship in its dynamic evolution, as RCA
does, but it creates a directory of causes behind each problem to display different
causes split for families. Since, for instance, a training issue, grouped under “people”,
can cause an operator to make an error that results in an equipment failure, grouped
under “machinery”, details of any investigation must be sought linking Ishikawa to
RCA. In conclusion Fault Tree Analysis starts with a top undesired event that is the
system failure mode for which one is attempting to identify all potential causes, and
link all potential causes in a logic tree through events and gates. Then Root Cause
Analysis and Ishikawa enable one to identify the potential causes that produce a
failure showing causes and effects and grouping them for families.
The Failure Funnel shown in Figure 39, represents the result produced by the key
methods & technique (quantitative and qualitative) used.
Figure 39: Failure Funnel
Consolidation
Failures from
production monitoring
Statistical Analysis
& Historical figures
Prioritisation Repetitive Chronic
Statistical Analysis
Classification &
Prioritisation
Automatic Production Monitoring
& Statistical Analysis
Cause Mapping
PM Analysis
Failure modes
& Root Causes
Historical &
Quality Analysis

106
Through quantitative analysis we are able to identify and consolidate the different
type of failures in a system. Through qualitative analysis we define the relationship
existing between causes and effects, in the specific context, and then, as result, we are
able to prioritize and classify the failures. The Table 4 below summarizes the
repetitive and chronic failures showing their frequency, complexity and the potential
causes with the main findings coming from quantitative and qualitative analysis.
Table 4: Repetitive and chronic failures
5.3.4 Functional and potential failure determination
Once identification of failures has been accomplished, all potential failure causes are
identified using the techniques presented in the previous section. These techniques
help in converging on the causes of failure among many identified potential causes.
Once the failure causes have been identified, the approach outlined herein develops a
range of corrective actions and then selects and tracks optimum corrective action
implementation. Because an unsatisfactory condition can range from the complete
inability of an item to perform its intended function to some physical evidence that it
will soon be unable to do so, failures must be further classified as either functional
failures or potential failures.
Functional failure
It is the inability of an item (or the system containing it) to meet a specified
performance standard. This definition requires that we specify a performance
standard, thus generating an identifiable and measurable condition for functional
failures.
Repetitive Chronic
Frequency
Complexity
Cause
ToolsRestore Basic
Conditions & Stds
SPC, Ishikawa, FTA
Cause Mapping
SPC, Historical Analysis
& PM Analysis
KnownSometimes
UnknownUnknown
• Mainly One Cause
• Easy to Identify
• More than One Cause
• Difficult to Identify
Low High
LowLowHigh

107
Potential failure
It is an identifiable physical condition which indicates that a functional failure is
imminent. The ability to identify a potential failure permits the maximum use of an
item without suffering the consequences associated with a functional failure. In these
circumstances items are removed or repaired/adjusted to prevent functional failures.
As an example, Figure 40 below shows how the operational condition of a ball
bearing changes, from potential to functional failure, after potential failure is detected.
From vibration deviation detection (potential failure threshold) down to total ball
bearing breakdown (functional failure) there are different intermediate steps that need
to be well known to define when a corrective action is to be implemented.
Figure 40: From potential to functional failure in a ball bearing
Prior to performing a FMEA analysis, the individual components, comprising the
system, must be identified. Since there are so many possible failures a system can
experience, it may be necessary to subdivide the system into manageable segments
(components) in order to identify all possible failures. This process is known as a
Work Breakdown Structure (WBS).
5.3.5 Failure mode and effect analysis (FMEA)
FMEA or FMECAs (Failure Mode Effects and Criticality Analyses) represent one of
the most commonly used tools in reliability assessment programs. The basic
components of a FMEA consist of some type of hierarchical breakdown, an outlining
Co
nd
itio
n o
f C
om
po
ne
nt
Steel particles in lubricantSteel particles in lubricant
Becomes warmBecomes warm
Becomes noisyBecomes noisy
Becomes very
hot
Becomes very
hot
Total breakdownTotal breakdown
Vibration detectableVibration detectable
Failure triggered
(could be random)
Failure triggered
(could be random)
Time
- random event for electronic components
- predictable event for mechanical components
Potential
Failure
Functional
Failure

108
of all possible Failure Modes of all elements, and then a determination of the effects
of these failure modes. The power in FMEAs is realized when this analysis is
extended to include information relating to the risk of these potential system failures.
The task is to be able to use a FMEA to assess which failure modes require effort to
prevent, mitigate, detect, or ignore. This assessment of criticality in a FMEA lays the
groundwork, for ALF industry, to develop an organized approach to risk management.
By using FMEA to assign and categorize failure modes, the resulting categories can
each have a defined plan of action. For example, high risk items, as those that may
result in an unsterile container, must be flagged, and a plan to eliminate them
formulated and deployed. Medium level items may require some type of detection
mechanism to be designed. Low risk items could perhaps require no action. The issue
then becomes how to adequately assess the risk levels of failure modes. Main
approaches are based on:
1. Mode Criticality
Mode criticality is a numerical value that can be calculated and applied to each failure
mode. Mode criticalities are based on a FMECA approach defined in MIL-STD-1629,
a commonly used FMECA methodology.
2. Risk Priority Number (RPN)
Risk Priority Numbers or RPN are also numerical assessments of risk. RPNs are
based on a FMEA such as those defined by SAE, AIAG, and Ford. RPN values range
from 1 to 1000. To use RPNs, the analyst evaluates each failure mode and determines
the Severity, Occurrence, and Detection level in each case. All three of these
parameters are based on a 1-10 scale. A score of 10 indicates the most severe, most
likely to occur, and least likely to be detected failure mode. The calculation of RPN is
then defined as:
Risk Priority Number (RPN) = Severity x Occurrence x Detection
3. Criticality Rank
Criticality rank is an approach described in the SAE FMEA 5580 document.
Criticality ranking provides a systematic way to rank failure modes. The criticality
rank is a value based on a multi-criterion, Pareto ranking system. Failure modes are
assessed by the analyst in terms of severity and probability of occurrence.
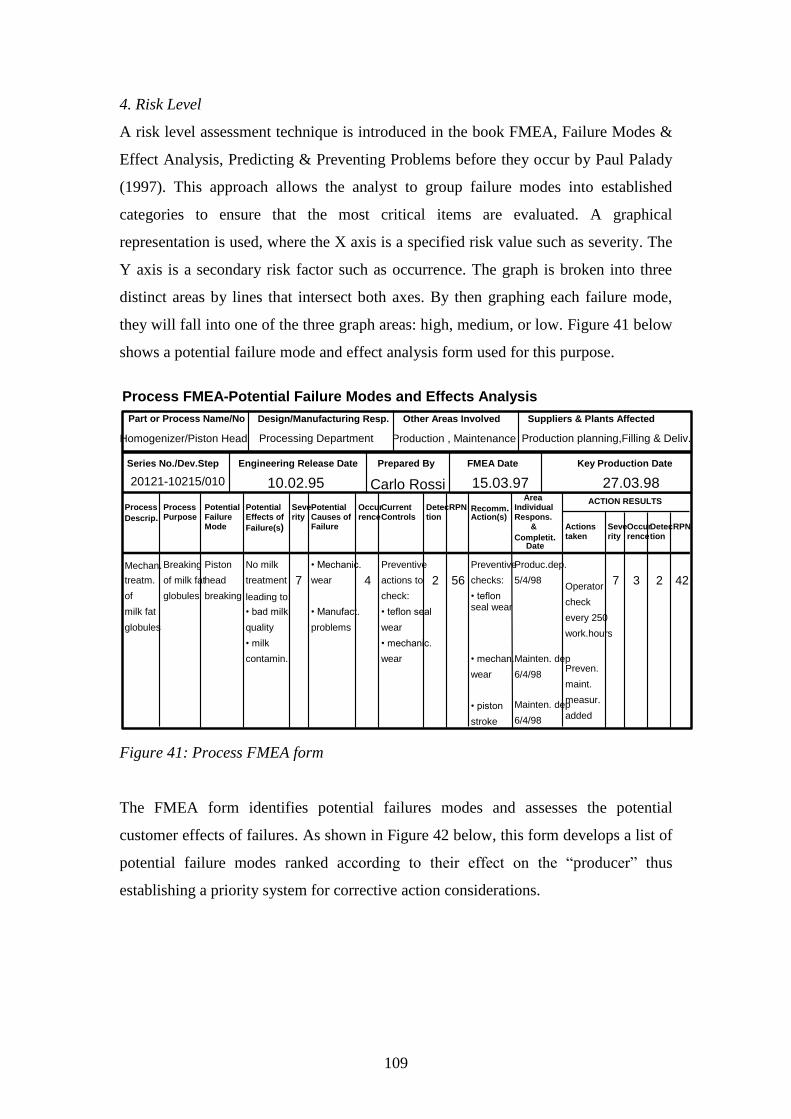
109
4. Risk Level
A risk level assessment technique is introduced in the book FMEA, Failure Modes &
Effect Analysis, Predicting & Preventing Problems before they occur by Paul Palady
(1997). This approach allows the analyst to group failure modes into established
categories to ensure that the most critical items are evaluated. A graphical
representation is used, where the X axis is a specified risk value such as severity. The
Y axis is a secondary risk factor such as occurrence. The graph is broken into three
distinct areas by lines that intersect both axes. By then graphing each failure mode,
they will fall into one of the three graph areas: high, medium, or low. Figure 41 below
shows a potential failure mode and effect analysis form used for this purpose.
Process FMEA-Potential Failure Modes and Effects Analysis
Part or Process Name/No
Prepared By Key Production Date
Process Descrip.
Potential Failure
Mode
Potential Effects of
Failure(s)
Potential Causes of Failure Actions
taken
RPN
Recomm. Action(s)
Seve rity
Occur rence
Homogenizer/Piston Head
20121-10215/010 Carlo Rossi 10.02.95
Mechan. treatm.
of
milk fat
globules
Piston
head
breaking
No milk
treatment
leading to: • bad milk
quality
• milk
contamin.
7
• Mechanic.
wear
• Manufact.
problems
4
Preventive
checks:
• teflon seal wear
• mechan.
wear
• piston
stroke
56 42
Design/Manufacturing Resp.
Processing Department
Engineering Release Date
Other Areas Involved
Production , Maintenance
Suppliers & Plants Affected
Production planning,Filling & Deliv.
Series No./Dev.Step FMEA Date
15.03.97 27.03.98
Process Purpose
Current Controls
Detec tion
RPN
Area Individual Respons. &
Completit. Date
ACTION RESULTS
Occur rence
Detec tion
Breaking
of milk fat
globules
Preventive
actions to
check:
• teflon seal
wear
• mechanic.
wear
2
Produc.dep.
5/4/98
Mainten. dep
6/4/98
Mainten. dep
6/4/98
Operator
check
every 250
work.hours
Preven.
maint.
measur.
added
Seve rity
7 3 2
Figure 41: Process FMEA form
The FMEA form identifies potential failures modes and assesses the potential
customer effects of failures. As shown in Figure 42 below, this form develops a list of
potential failure modes ranked according to their effect on the “producer” thus
establishing a priority system for corrective action considerations.

110
RISK EVALUATION
Product:
Compiled from: Date:
FAILURE IDENTIFICATION No. Progr.
Life Phase Failure Description
RISK EVALUATION
Severity (x) Probability (y) RPN (x+y)
Persons Property A B C Consequences
Figure 42: Example of a risk evaluation form [27]
Potential failure mode and effect analysis is a combination of different steps:
(a) Description of Failure mode (the manner by a failure is observed)
It describes the way the failure occurs and its impact on equipment operation. Each
component has one or more failure modes and a separate analysis must be performed
on each failure mode.
(b) Failure effect and Severity (the consequences)
This is the effect that a failure mode has on the operation, and on product produced.
Criticality analysis is a procedure by which each potential failure mode is ranked
according to the severity produced by the effects.
Severity is classified as:
- Catastrophic
A failure which may cause unsterility or equipment system loss
- Critical
A failure which may cause severe injury, major property damage, or major system
damage which will result in operation loss

111
- Marginal
A failure which may cause minor injury, minor property damage, or minor system
damage which will result in delay or loss of availability
- Minor
A failure is not serious enough to cause injury, property damage, or system damage,
but which will result in unscheduled maintenance or repair.
(c) Probability of Failure Occurrence
Failure modes identified in the failure mode and effect analyses are assessed in terms
of probability of occurrence when specific parts configuration or failure rates are not
available. Individual failure mode probabilities of occurrence should be grouped into
distinct, logically defined levels. They are:
-Frequent
High probability may be defined as a single failure mode probability greater than 0.20
of the overall probability of failure during the item operating time interval.
-Reasonably Probable
This is a moderate probability of occurrence during the item operating time interval.
Reasonably probable is a single failure mode probability of occurrence which is more
than 0.10 but less than or equal to 0.20 of the overall probability of failure during the
item operating time.
-Occasional
This is a single failure mode probability of occurrence which is more than 0.01 but
less than or equal to 0.1 of the overall probability of failure during the item operating
time.
-Remote
An unlikely probability of occurrence of a single failure mode which is more than
0.001 but less than 0.01 of the overall probability of failure during the item operating
time.
-Extremely unlikely
This is a failure whose probability of occurrence is essentially zero during item
operating time interval (less than 0.001 of the overall probability of failure).
By combining the severity of the failure and the probability of occurrence, a matrix
can be constructed which will indicate a priority of failure modes. During research

112
and development, those failure modes possessing the highest priority should be
redesigned if possible.
(d) Failure Detection
To assign detection rankings, the process or product related controls for each failure
mode need to be identified and then assign a detection ranking to each control.
Detection rankings evaluate the current process controls in place. A control can relate
to the failure mode itself, the cause (or mechanism) of failure, or the effects of a
failure mode. Controls can either prevent a failure mode or cause from occurring or
detect a failure mode, cause of failure, or effect of failure after it has occurred.
The Detection ranking scale, like the Severity and Occurrence scales, is on a relative
scale from 1 to 10.
Furthermore, the consequences that a failure mode had on operation or machine
function must be analyzed. Then for each failure a critical analysis is to be done to
identify a critical number that is derived by the failure severity, occurrence and
detection classification. MTBF was a basic data element needed for RCM analysis.
This number is derived by the following formula:
5.3.6 Review of maintenance history
The various steps of the RCM analysis require a variety of input data, like design data,
operational data, and reliability data. In this step we examine the necessary reliability
data input. Reliability data is necessary to define the criticality, to mathematically
describe the failure process and to optimize the time between PM-tasks. Reliability
data include a mean time between failures (MTBF), mean time to restore (MTTR),
and failure rate function. As we saw, in many cases the failure rate will be an
increasing function of time, indicating that the item is deteriorating. In other cases the
failure rate may be decreasing, indicating that the item is improving. There are also
cases where the failure rate is decreasing in one time interval and increasing in
another. For repairable systems, the situation may be even more complex with a time
dependent rate of occurrence of failures. The failure distributions (Gaussian,
Weibull…) are rather flexible, and may be used for detailed modelling of specific
failure mechanisms. However, for most applications the class of Weibull distributions
Production Time
Number of Equipment Stops

113
is sufficiently flexible to be the preferred distribution. The operational and reliability
data are collected from available operating experience and from external files where
reliability information from systems with similar design and operating conditions may
be found. The external information available should be considered carefully before it
is used, because such information is generally available at a rather coarse level. In
conclusion, this step is necessary to summarize:
- the equipment stops that have occurred,
- the causes
- MTBF and failure distribution.
From information gathered during the review of maintenance history and the results
of the failure modes and effect analysis, a maintenance approach for each of the
failure effects can be determined. The value of MTBF, the failure rate and its
distribution will give us an idea of the reliability of the part. More specifically, we
can:
1. Calculate the failure rate of each failure mode and decide whether a design
review is desired on a developmental item, and
2. Decide when the part should be replaced if scheduled replacement is required.
Failure distribution or dispersion around the mean must be considered when deciding
whether to replace or inspect the component at fixed intervals. Similarly problem,
phenomenon or physical mechanism pursues the elimination of chronic failures
through the following activities:
problem definition
physical analysis of the problem
identify the likely causes of the problem
equipment, materials and methods assessment
develop techniques for analysis and inspection
eliminate disturbing factors
devise proposals and improvements.
5.3.7 Determine maintenance approach for each failure effect
There are four major maintenance components of the Reliability Centered
Maintenance program, they are:

114
- Reactive Maintenance (Corrective Maintenance),
- Preventive Maintenance,
- Predictive Maintenance (Condition Monitoring), and
- Proactive Maintenance.
The RCM logic tree can be used as a guide to determine the maintenance tasks and to
logically work through the tasks likely to be needed to develop RCM program. After
creating a logic tree, four distinct types of maintenance tasks usually result in:
Time Directed Tasks (all preventive maintenance procedures)
This task is generally applied to failure modes that can be restored without the
need to replace the part. Examples in this area include; re-machining, cleaning,
flushing, sharpening, re-positioning, tightening and adjusting. Sometime
preventive maintenance task can include calibration where this is done on a
hard time basis.
Condition Directed Maintenance (preventive and CBM)
This task aimed at detecting the onset of failure or the potential failure. Often
referred to as CBM or On-Condition Maintenance, the goal is to ensure that
the occurrence of failure modes that have undesirable consequences are
predicted so that they can be mitigated through planned activities.
Failure Finding
This task suggests replacing a physical component in order to restore its
function. As with preventive restoration tasks, these are also hard time tasks.
Common examples of tasks include greasing bearings, changing oil filters and
oil (if done on a time basis), and routine light bulb replacement (often but not
always).
Running To Failure (decision to run certain components to failure)
These are tasks that are done to detect whether an item has already failed so
that action can be taken. These tasks are only used with items that have hidden
functions. For example with protective devices such as circuit breakers, stand
by pumps, switches on conveyor systems and High-high level switches. These
tasks are only used within the four categories on the Hidden side of the RCM
decision diagram and are not referred to in the four categories on the evident

115
side at all. Detective maintenance tasks include proof testing of critical
instrumentation and the occasional running of stand by pumps. Although often
associated with safety related failures this is not always the case. Within RCM
it provides the last line of defence for routine maintenance when a failure
mode cannot be predicted or prevented.
RCM logic tree for task selection
One of the most important things in defining an RCM task is the comprehension of
the nature of failure, and the assignment of routine maintenance tasks. From the
original RCM report we provided four basic routine maintenance tasks.
Task selection can be supported by the correct application of different “decision logic
trees” which provide the pathway to identify the right maintenance approach for each
failure pattern [8]. A simple decision logic tree, for task selection, shown in Figure 43,
can be used to identify the criteria needed to apply condition monitoring and time
directed task. This tool takes into consideration evident or hidden failures and
consequences (effects) on product safety and on direct and indirect costs. As result it
suggests different maintenance tasks according to potential failure effects.
Figure 43: Decision logic tree for task selection
Will equipment failure have a direct
and adverse effect on product safety,
health, environment?
Is there a cost-effective
CM task to detect
Potential Failure?
Is there a cost-effective
Time Directed task to
Reduce Failure Rate?
Yes
Yes
Will the failure have a
direct and adverse effect
on operational mission?
No
Condition
Monitoring
Task
No
Time
Directed
Task
Redesign
Required
Yes
No
Is there a cost-effective
CM task to detect
Potential Failure?
Is there a cost-effective
CM task to detect
Potential Failure?
Yes No
Is there a cost-effective
Time Directed task to
Reduce Failure Rate?
Is there a cost-effective
Time Directed task to
Reduce Failure Rate?
Yes
Condition
Monitoring
Task
No No
Yes
Time
Directed
Task
Run
To
Failure
No
Run
To
Failure
No
Product Safety
Consequences
Operational
Economic
Consequences
Non-Operational
Economic
Consequences
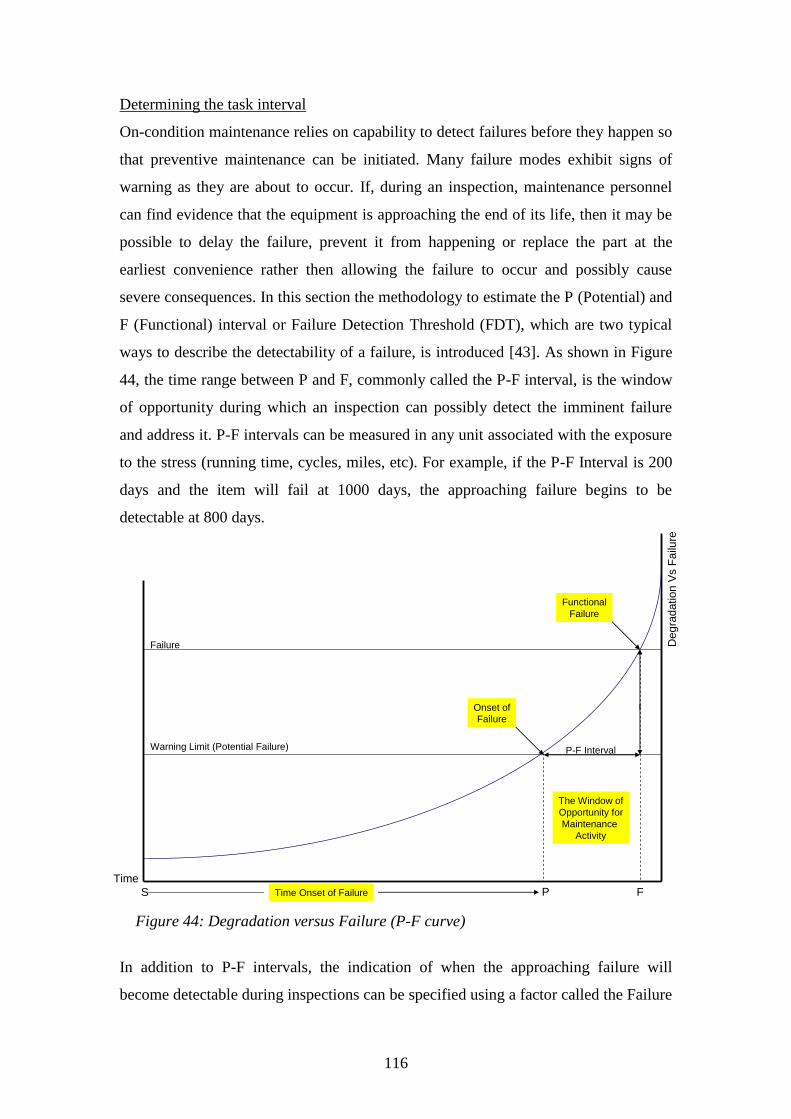
116
Determining the task interval
On-condition maintenance relies on capability to detect failures before they happen so
that preventive maintenance can be initiated. Many failure modes exhibit signs of
warning as they are about to occur. If, during an inspection, maintenance personnel
can find evidence that the equipment is approaching the end of its life, then it may be
possible to delay the failure, prevent it from happening or replace the part at the
earliest convenience rather then allowing the failure to occur and possibly cause
severe consequences. In this section the methodology to estimate the P (Potential) and
F (Functional) interval or Failure Detection Threshold (FDT), which are two typical
ways to describe the detectability of a failure, is introduced [43]. As shown in Figure
44, the time range between P and F, commonly called the P-F interval, is the window
of opportunity during which an inspection can possibly detect the imminent failure
and address it. P-F intervals can be measured in any unit associated with the exposure
to the stress (running time, cycles, miles, etc). For example, if the P-F Interval is 200
days and the item will fail at 1000 days, the approaching failure begins to be
detectable at 800 days.
Figure 44: Degradation versus Failure (P-F curve)
In addition to P-F intervals, the indication of when the approaching failure will
become detectable during inspections can be specified using a factor called the Failure
Time
Degra
dation
Vs
Failu
re
P-F Interval
Onset of
Failure
P F
Warning Limit (Potential Failure)
Failure
S Time Onset of Failure
Functional
Failure
The Window of
Opportunity for
Maintenance
Activity

117
Detection Threshold (FDT). FDT is a number between 0 and 1 that indicates the
percentage of an items life that must elapse before an approaching failure can be
detected. For example, if the FDT is 0.9 and the item will fail at 1000 days, the
approaching failure becomes detectable after 90% of the life has elapsed, which
translates to 900 days in this case (0.9x1000=900). Estimation of the P-F interval or
FDT can be achieved using condition monitoring, experience of people who design,
manufacture and operate the equipment and through statistical analysis of historical
figures. Note that estimation of P-F Interval or FDT should be done on one failure
mode at a time. Many failure mechanisms can be directly linked to the degradation of
a component or part. Weibull degradation analysis enables the analysis of degradation
data. Degradation analysis involves the measurement of the degradation of
performance/quality data that can be directly related to the presumed failure of the
part under examination. Assuming such data can be obtained, the FDT or P-F Interval
can be estimated using this technique.
Figure 45: A plot of different degradations versus time
A plot of different degradations versus time, shown in Figure 45 above, enable to gain
better knowledge of component or system degradation with relative P-F intervals.
In other words, if an inspection interval is based upon the time from potential failure
to functional failure, a curve can be developed showing the time occurring from the
Time
De
gra
dation
Vs
Fa
ilure
P1
Warning Limit (Potential Failure)
Failure (Functional Failure)
S P2 P3
F1 F2 F3

118
onset of failure to functional failure. This time period is known as time from onset
(Tos) that is the time at which potential failure is detectable. The beginning of Tos is
the point on the slope at which a physical symptom (potential failure) appears. To
assure that an inspection to detect impending failure will occur between the
appearance of potential and functional failure, inspection intervals must be shorter
than Tos.
Figure 46: Inspection time interval
Since an inspection could fail to identify and correct the mechanical wear or
symptom, there would be at least one more inspection before functional failure
occurs. For critical machine parts or components (according to HACCP & reliability
analysis), the inspection interval is to be established at 1/3 or 1/4 of Tos. Scheduling a
replacement or overhaul task is an exercise based upon the curve shown in Figure 46
above, which indicates the cumulative probability of failure, for a specific component,
at different lifetimes. In the example taken from the curve, the decision for
replacement of a package sealing element occurs at 6,000 operating hours, where the
probability of failure exceeds 0.15 (15%). This decision is mainly dependant on the
evaluations of the effects produced by this critical components on product safety..
When historical data available shows that failures are evenly distributed around the
mean, the MTBF could be used to schedule maintenance intervals. When failures
occur in a narrow range, a normal failure distribution curve can be used for task
scheduling. There have been many models, or combination of model, suggested to
Time1000 2000 3000 4000 5000 6000 7000 8000 9000 10000 11000 12000
0,1
0,2
0,3
0,4
0,5
0,6
0,7
0,8
0,9
1,0
Cumulative
Probability
119
represent typical failure distributions, as described by the cumulative distribution
function. Typical of those most frequently mentioned are the Exponential, Gamma,
Erlang and Weibull distributions. After RCM application the team involved in the
design process will be aware that any maintenance action, which does not improve the
component’s safety or reliability, should be eliminated.
5.4 Step three: safety & reliability analysis through HACCP & RCM
The design process started with the application of HACCP to identify the product
safety critical issues, as a second step the application of RCM highlighted equipment
reliability criticalities, now, at this point of the design process, HACCP and RCM
techniques are combined together to carry out safety and reliability analysis. The
purpose of this analysis is to identify the whole risk produced by the failure effects on
product safety, on equipment reliability and then on production activity. The different
risk priority numbers will give us the opportunity to weight the risks regarding total
effects produced by a specific failure mode on:
Final product (product safety problems),
Equipment functions
Production activity (interaction between equipment and packages).
This step has been thought for equipments or production lines operating in food
industry where the analysis of risk could not be limited to the equipment reliability
only, but needs to take into consideration all the conceivable critical factors associated
to product safety.
Figure 47, in the next page, shows a form which combines both FMECA (Failure
Modes Effect and Critical Analysis) with some of meaningful HACCP and HAZOP
criteria and parameters. This form has been called FMEHA (Failure Mode Effect and
Hazard Analysis) to display the integrated appraisal (measure) of product safety and
equipment reliability criticalities. It provides a clear path, and opportunity to identify
all conceivable problems depending on equipment and operational reliability, together
with those depending on product safety hazards.

120
Figure 47: FMEHA form designed for food industry
FM
EH
A -
Fa
ilu
re M
od
es
Eff
ec
t a
nd
Ha
za
rd A
na
lys
is (
FM
EC
A +
HA
CC
P)
Descri
ptio
n o
f:
(1)
Pa
rt/P
roce
ss
(2)
CC
P
(3)
Ope
ratio
na
l
P
ractice
Pro
ce
ss
Pu
rpo
se
Ide
ntify
th
e P
ote
ntia
l
Haza
rds:
(B)
Bio
log
ica
l
(C)
Che
mic
al
(P)
Ph
ysic
al
Cri
tica
l L
imits
for
ea
ch
CC
PD
evia
tio
ns
Po
ten
tia
l
Fa
ilure
Mo
de
Po
ten
tia
l
Eff
ects
of
Fa
ilure
(s)
Se
ve ri ty
Po
ten
tia
l
Cau
se
s o
f
Fa
ilure
Oc
cu
r
ren
ce
Curr
en
t
Con
tro
ls
Exis
tin
g
mo
nito
rin
g
pro
ce
du
res
Fre
qu
en
cy
De
tect
ion
RP
NR
eco
mm
en
de
d
Actio
n(s
)
Are
a I
nd
ivid
ua
l
Resp
on
sib
ility
& C
om
ple
tio
n
Date
Actio
ns
Ta
ke
n
Se
ve ri ty
Oc
cu
r
ren
ce
De
tect
ion
RP
N
Se
rie
s N
o./
Dev.S
tep
En
gin
ee
rin
g R
ele
ase
Da
teP
rep
are
d B
yF
ME
HA
Date
Pa
rt o
r P
roce
ss n
am
eD
esig
n/M
an
ufa
ctu
rin
g R
esp
.O
the
r A
rea
s I
nvo
lve
dS
up
plie
rs &
Pla
nts
Aff
ecte
d

121
The purpose of this form is to record both equipment reliability and product safety
issues to highlight all the criticalities, to gain, as result, a global view and a total Risk
Priority Number (RPN) based on CCP and critical reliability issues identified in the
design process. Here below a short description of the fields that build up this form
with the information to be supplied and the scoring criteria to be used to find a final
risk priority number for each item. Starting from the left side, this is the list of the
fields that make up the form:
Description of: (1) part/process, (2) CCP, (3) operational practice
This is the description of the equipment part, or the Critical Control Point or
the operational practice that should be provided with reference to a specific
critical reliability or safety issue.
Process purpose
Process Purpose refers to a description of an equipment or process function or
to an operational function (e.g. air sterilization or package forming).
Identification of potential hazards: (B) biological, (C) chemical, (P) physical
The type of the hazard, depending on the specific failure, should be identified
and this has to be classified in the three HACCP categories:
(B) stands for Biological hazard
(C) stands for Chemical hazard
(P) stands for Physical hazard.
Critical limits for each CCP
For each CCP the critical limits must be identified (e.g. air sterilization
temperature thresholds or dimensional measures for packaging
sealing/appearance).
Deviations
For each CCP or operational practice, potential deviations must be identified
(e.g. incorrect numerical values, wrong application of operational practices).
Potential failure mode
The lists of potential failure modes, regarding the item under investigation,
highlight the different ways through which the equipment part or CCP fails.

122
Potential effects of failure(s)
The effects produced by each failure mode must be identified to gain a clear
understanding of the criticality associated to that failure mode.
Severity
According to Table 5 shown below, the number selected represents the
severity of each failure mode, regarding either equipment reliability or product
safety. This table considers not only the equipment reliability failure effects,
but also the HACCP failure effects on product safety.
Score
No.
Severity
Classif.Potential HACCP effects
1 I
2-3 II
Small package shape/appearance
problems
4-6 III
Ther could be random problems on
product safety
7-8 IV
Package integrity and product safety
problems (defect rate > 0,1/100)
9-10 V
Package integrity and product safety
problems (defect rate > 1/100)
Failure Severity Assessment Criteria
No damages on product packed and on people.
Customer will not realize any failure effect
Failure effects are not serious:
minor potential warnings are detected (noise, package appearance…)
SEVERITY
Failure effects are serious enough. There could be safety problems on
product and the event will be noted by the customer
Failure effects are serious. Production must be stopped
Failure effects are very serious. Failure effects
infringe national laws on product safety
Table 5: Failure severity classification table
Compilation of the table will be supported by the historical information
available through FRACAS and statistical analysis (quantitative and
qualitative).
Potential causes of failure
All the conceivable potential causes that determine a failure mode should be
identified under this box.
Occurrence
According to Table 6, the score numbers introduced in these fields identify the
failure probability of occurrence. Also in this case, compilation of the table
will be supported by the historical information available through FRACAS
and statistical analysis (quantitative and qualitative).
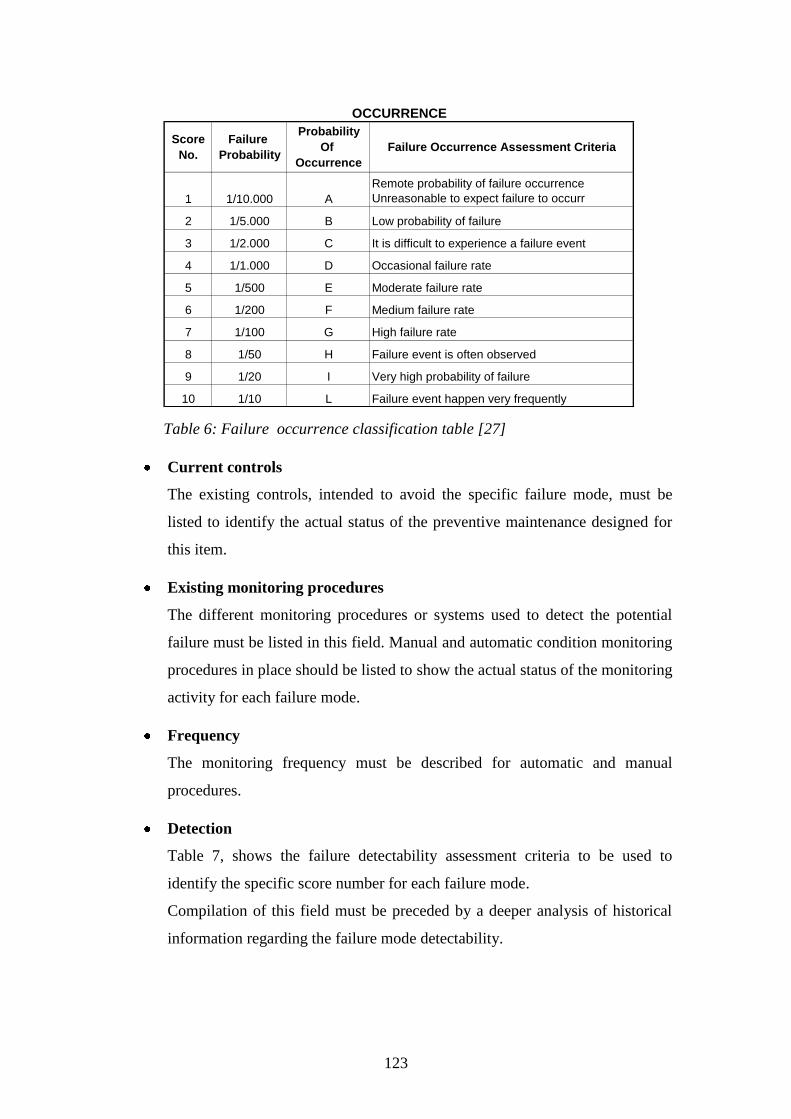
123
Score
No.
Failure
Probability
Probability
Of
Occurrence
Failure Occurrence Assessment Criteria
1 1/10.000 A
Remote probability of failure occurrence
Unreasonable to expect failure to occurr
2 1/5.000 B Low probability of failure
3 1/2.000 C It is difficult to experience a failure event
4 1/1.000 D Occasional failure rate
5 1/500 E Moderate failure rate
6 1/200 F Medium failure rate
7 1/100 G High failure rate
8 1/50 H Failure event is often observed
9 1/20 I Very high probability of failure
10 1/10 L Failure event happen very frequently
OCCURRENCE
Table 6: Failure occurrence classification table [27]
Current controls
The existing controls, intended to avoid the specific failure mode, must be
listed to identify the actual status of the preventive maintenance designed for
this item.
Existing monitoring procedures
The different monitoring procedures or systems used to detect the potential
failure must be listed in this field. Manual and automatic condition monitoring
procedures in place should be listed to show the actual status of the monitoring
activity for each failure mode.
Frequency
The monitoring frequency must be described for automatic and manual
procedures.
Detection
Table 7, shows the failure detectability assessment criteria to be used to
identify the specific score number for each failure mode.
Compilation of this field must be preceded by a deeper analysis of historical
information regarding the failure mode detectability.

124
Score
No.
1
2-3
4-6
7-8
9-10
DETECTION
Failure will not probably be detected
Failure will rarely be detected
Failure Detectability Assessment Criteria
Failure will surely be detected
Failure will probably be detected
Failure could be detected
Table 7: Failure detection classification table [27]
Risk priority number (RPN)
This number is the result of the product of three scoring numbers:
(a) Severity
(b) Occurrence and
(c) Detection.
E.g. Severity (7), Occurrence (4), Detection (2), RPN (S x O x D) = 56.
Recommended action(s)
If the RPN obtained, to multiply severity, occurrence and detection, shows a
number which call for a corrective action to improve the global equipment
reliability and product safety, then a recommended action is needed. As shown
in Figure 48 below, for each failure mode should be advisable to identify
different RPN thresholds to highlight a number above which a corrective
action is needed.
Figure 48: Example of RPN threshold
45

125
Recommended action normally means a preventive maintenance activity or an
equipment or procedure modification able to reduce the total RPN to a level
which shows that the specific failure mode is under control.
Area of individual responsibility & completion date
The person or role or department responsible to implement the recommended
action is to be identified together with the completion date.
Actions taken
The specific practices linked to the recommended actions must be listed to
deploy all the activities to be implemented.
Severity, occurrence, detection
The new score numbers will now reflects the improvement produced by the
recommended actions and practices implemented as corrective actions.
RPN
Final RPN highlights if the corrective actions devised can reduce the first RPN
which showed the problem and the need for a corrective action.
5.5 Step four: list of priorities (safety & reliability analysis)
As result of a combined analysis of product safety and equipment reliability issues,
we now obtained a risk priority number which embody both HACCP and RCM
criticalities. At this point of the design process we carry out the analysis of different
failure modes effects, based on equipment reliability and on product safety, to
produce a list of priorities based on RPN scoring.

126
Figure 49: List of Safety & Reliability Priorities
Lis
t o
f P
rio
riti
es
(S
afe
ty a
nd
Re
lia
bil
ity i
ss
ue
s)
Pa
rt o
r P
roce
ss
Descri
ptio
n
HA
CC
P H
aza
rd
(B,
C, P
) &
Relia
bili
ty R
isk
Se
veri
ty
Occ
urr
e
nce
Det
ecti
on
RP
N
Con
ditio
n
Mo
nito
rin
g
To
ols
Cri
tica
l L
imits
or
Wa
rnin
g L
imits
Com
pe
ten
ce
Le
vel R
eq
uir
ed
Tim
e/C
ycle
Inte
rva
l
Ma
inte
na
nce
Actio
ns
(Chk,
Ad
j, R
ep
)
To
ols
&
Te
mp
late
s
Po
ten
tia
l E
ffe
cts
of
Fa
ilure
(to
be
ke
pt
un
de
r co
ntr
ol)
Se
rie
s N
o./
Dev.S
tep
En
gin
ee
rin
g R
ele
ase
Da
teP
rep
are
d B
yD
ate
Eq
uip
me
nt
Nam
e (
Syste
m)
Desig
n/M
an
ufa
ctu
rin
g R
esp
.S
ub
-Sys
tem
Are
as I
nvo
lve
d

127
The form shown in Figure 49 above, describes (from the left):
- the part or the process taken under consideration,
- the hazard type (B, C and P),
- the RPN found,
- the potential effects produced by that failure,
- the condition monitoring tools used
- the tools and templates available to carry out maintenance
activities (objective tools for measurements)
- the critical or warning limits to be monitored or checked
- the competence level required (operator or technician,
electrical, mechanical…)
- the time (working hours) interval or No. of cycles at which a
maintenance need to be planned
- the maintenance action devised in the previous section.
Since through RCM analysis we already split the equipment/line or system into
different sub-systems, groups, component functions and system boundaries, at this
step of the design process, a list of priorities is to be defined for each sub-system.
According to RPN scoring results, for each sub-system, the main maintenance
priorities are defined to properly address the maintenance tasks intended to put under
control the identified criticalities regarding product safety and equipment reliability.
This activity will represent a sort of bridge between steps 3 and 5 to enable the
designer to move forward in the design process and to display the criticalities in place
within the different sub-systems defined in the equipment.
5.6 Step five: design of maintenance tasks
As result of the design activities carried out in the previous steps, we identified the
functions that the equipment is intended to perform, the ways that it might fail to
perform the intended functions and the evaluation of the consequences of these
failures. The next step is to define the appropriate maintenance strategy for the
equipment parts and components analyzed in the design process. The RCM guidelines
include task selection logic diagrams based on the Failure Effect Categorization, this
tool provides a structured framework for analyzing the functions and potential failure
modes for the equipment parts under consideration in order to develop a scheduled
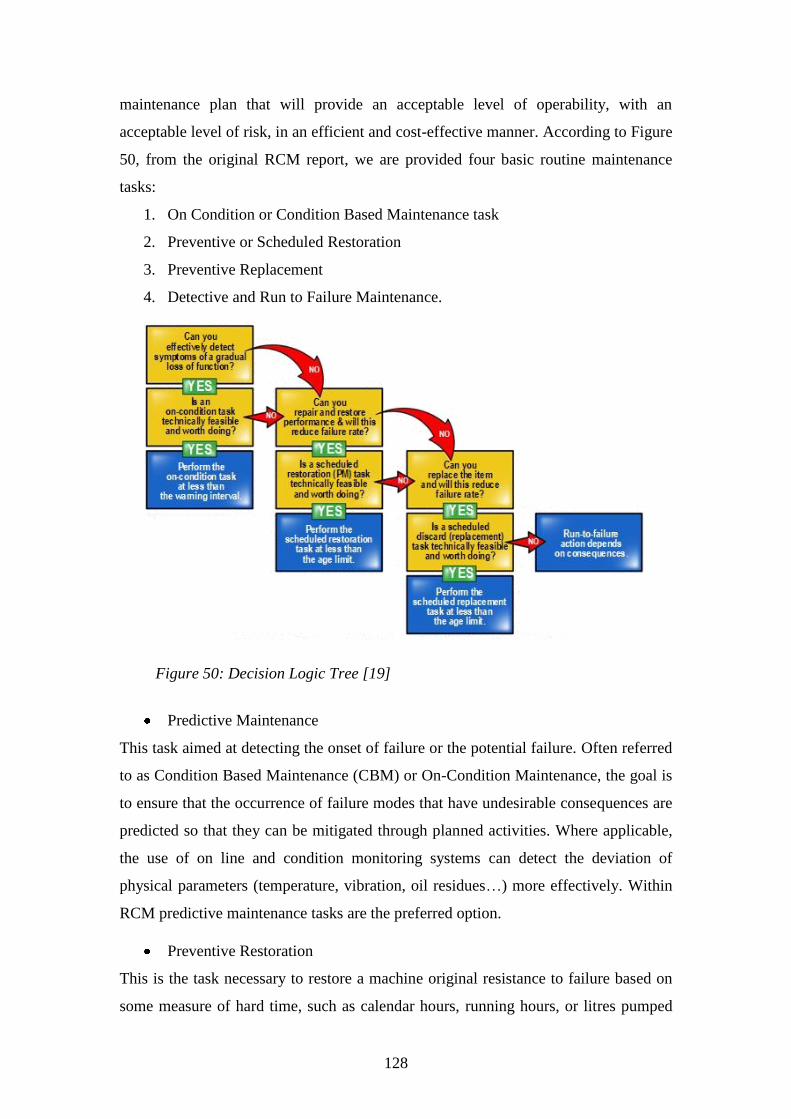
128
maintenance plan that will provide an acceptable level of operability, with an
acceptable level of risk, in an efficient and cost-effective manner. According to Figure
50, from the original RCM report, we are provided four basic routine maintenance
tasks:
1. On Condition or Condition Based Maintenance task
2. Preventive or Scheduled Restoration
3. Preventive Replacement
4. Detective and Run to Failure Maintenance.
Figure 50: Decision Logic Tree [19]
Predictive Maintenance
This task aimed at detecting the onset of failure or the potential failure. Often referred
to as Condition Based Maintenance (CBM) or On-Condition Maintenance, the goal is
to ensure that the occurrence of failure modes that have undesirable consequences are
predicted so that they can be mitigated through planned activities. Where applicable,
the use of on line and condition monitoring systems can detect the deviation of
physical parameters (temperature, vibration, oil residues…) more effectively. Within
RCM predictive maintenance tasks are the preferred option.
Preventive Restoration
This is the task necessary to restore a machine original resistance to failure based on
some measure of hard time, such as calendar hours, running hours, or litres pumped

129
for example. This task is generally applied to failure modes that can be restored
without the need to replace the asset. Examples in this area include: re-machining,
cleaning, flushing, sharpening, re-positioning, tightening and adjusting. Often
preventive restoration task can include calibration where this is done on a hard time
basis. Within RCM these tasks are the second preferred option.
Preventive Replacement
This task addresses the replacement of a physical part in order to restore its resistance
to failure. As with preventive restoration tasks these are also hard time tasks.
Common examples of preventive replacement tasks include greasing bearings,
changing oil filters and oil (if done on a time basis), and routine light bulb
replacement (often but not always). Of the standard routine tasks, preventive
replacement is the least preferred within an RCM framework.
Detective Maintenance or Run To Failure (RTF)
These are tasks that are done to detect whether an item has already failed so that
action can be taken. These tasks are only used with items that have hidden functions.
For example with protective devices such as circuit breakers, stand by pumps, micro-
switches on conveyor systems and electrical switches. These tasks are only used
within the four categories on the hidden side of the RCM decision diagram and are not
referred to in the four categories on the evident side at all. Detective tasks include
proof testing of critical instrumentation and the occasional running of stand by pumps.
Although often associated with safety related failures this is not always the case.
Within RCM it provides the last line of defence for routine maintenance when a
failure mode cannot be predicted or prevented.
RCM provides the framework to define not only the four mentioned routine tasks, but
also to define the three additional corrective tasks and calculate their expected
frequencies. For example, in a predictive maintenance task the predictive task (PTive)
is the task that we are going to apply at a given frequency in order to detect the onset
of failure. However, there is also a corrective task: once we have predicted that a
component or part is going to fail we need to plan, resource and execute a task to
correct this situation [44]. This can be called the Predicted Task (PTed).
Within the time based tasks there is only one task, that of Preventive Restoration or
that of Preventive replacement. However, in Detective Maintenance (DTive) tasks

130
there are also corrective actions. Once we have determined that a detective
maintenance task is required, RCM enables us to derive a frequency based on
managing the risk of a multiple failure to a tolerable level. The Detective task is then
performed on a routine basis to detect whether an asset has failed or whether it is still
working. Regardless of whether the part under consideration is a switch, a circuit
breaker, a sensor or a stand by pump, at some point we will detect that the asset has
failed. This means that at some point there will be a corrective task, the Detected
Maintenance task, which will normally be a replacement or repair of the failed asset.
As with the Predictive Maintenance task we have allowed this to happen because it is
the best failure management policy available to us and we are able to manage the
consequences of the corrective task.
The last of the corrective tasks that we can derive from a standard RCM analysis is
that of Run-to-Failure. In this failure management policy we have eliminated the
likelihood of either safety or environmental consequences and have determined that
the most cost effective strategy is to allow the component to fail. Any other action
would cost more to carry out than to maintain the component itself. In this case the
only task that we need to consider is the Run-to-Failure task itself which is obviously
a corrective action.
Once a comprehensive RCM analysis is completed for an equipment-system, it can
include up to seven planned tasks. Four are routine tasks, three are corrective tasks,
but all are proactive tasks. All are the result of careful decision making regarding
maintenance policy and strategy. This allows us to build what is known as a Proactive
Whole-of-Life Model. To summarize the tasks describe above are:
Predictive Maintenance - Routine
Predicted Maintenance - Corrective
Preventive Restoration - Routine
Preventive Replacement - Routine
Detective Maintenance - Routine
Detected Maintenance - Corrective
Run-to-Failure (RTF) – Corrective.
The whole of life cycle model is produced through calculating the resource burden of
each individual task, then calculating this by the frequency of the task until the end of
131
life event or threshold tine period. In the case of the routine tasks, because of support
of statistical analysis and historical figures, we can be pretty sure that our estimates
are correct. However in case of the corrective tasks these are often estimates based
either on manufacturer’s data, our own maintenance history records and the
experience of the people involved in the analysis. As time goes on we need to
continue to collect data that will enable us to carry out further quantitative and
qualitative analysis to become more accurate in our predictions.
5.7 Conclusion
In this chapter, the process used to design maintenance procedures for ALF industry
has been examined. This research presents an original design process, conceived by
the writer, which combine reliability concepts, safety and maintenance engineering
techniques, to effectively manage product safety and equipment reliability issues. The
reliability concepts, the safety and the maintenance engineering techniques found in
the literature, and analyzed in chapter three, have been compared and contrasted and
selected to identify:
(a) The process to design maintenance procedures and
(b) The techniques to be used in the design process.
Here below the contents of the maintenance design process and the benefits coming
from each design step are briefly summarized:
Step one: application of HACCP methodology to manage product safety
criticalities
The decision to start with this phase is based on the necessity to identify and address
all conceivable Critical Control Points that could play a fundamental role in
determining the final product safety. Through the seven HACCP steps, all critical
machine parts have been identified (CCPs) and the use of HAZOP and GMP,
suggested by ISO 22000, can highlight both critical areas depending on human errors
and from production practices (GMPs). The main outcome of this phase is the
identification of critical issues (equipment parts, human errors and production
practices) that may influence the final product safety under biological, chemical and
physical point of view. This step represents an original contribution to the
maintenance design process since it addresses the critical practices and the equipment
parts that can produce product safety hazards.

132
Step two: application of maintenance engineering techniques to manage
equipment reliability criticalities
RCM is the basic maintenance engineering technique used to carry out the analysis of
different failure modes and their effects on equipment or line operation. Starting from
selection of system and sub-systems and definition of boundaries and the operational
modes, equipment failures have been analyzed under quantitative and qualitative point
of view. The use of statistical tools can identify and quantify the various types of
failures, their distribution and component/part life time.
Qualitative tools like Fault Tree Analysis, Root Cause Analysis, Ishikawa, tied
problems to the global context to identify the categories of causes and linking them to
the effects produced on equipment and production activity. Potential and Functional
failures have been identified to carry out Failure Mode Effect and Criticality Analysis
(FMECA). The effects produced by each failure mode have been scored together with
corrective and preventive measures. Failure rate and distribution, MTBF and
historical information can, in the end, define the most convenient and effective
maintenance task to be implemented for each failure mode. Some of the most
important maintenance engineering techniques have been integrated in a new and
original pattern to define a process able to cope with equipment reliability criticalities.
Step three: safety & reliability analysis to manage product safety and equipment
reliability criticalities
At this point of the design process, HACCP (product safety criticalities) and RCM
(equipment reliability criticalities) techniques have been put together for a global
evaluation which identifies a Risk Priority Number that embodies both product safety
and equipment reliability issues. A new and original Failure Mode Effect and Hazard
Analysis (FMEHA) form has been devised to display all the criticalities examined in
the previous design steps. This form satisfy the necessities to integrate product quality
and safety with equipment reliability issues to gain, as result, a global scoring system
which is appropriate to the Aseptic Liquid Food industry environment.
Step four: list of priorities (safety & reliability analysis)
This step have been conceived to produce a list of priorities based on RPN scoring
which highlight the global criticality due to the effects produced by the different
failure modes found during safety and reliability analysis. A form designed for this

133
scope summarizes the key factors and parameters that led to the final RPN, the critical
issues with limits and suggests the necessary maintenance activities. This activity,
carried out for each equipment sub-system, represents a process rationalization which
guide to the execution of next design step more effectively.
Step five: design of maintenance tasks
As result of the design activities carried out in the previous steps we now have all the
information necessary to design the maintenance tasks to be implemented for each
failure mode found. Predictive, preventive, detective and corrective maintenance tasks
have been identified to increase resistance to failure and reduce, as much as possible,
product safety risks and equipment failure probability. Routine tasks have been
designed to prevent functional failure; corrective tasks are designed to manage hidden
or unknown failures and to restore the equipment in the shortest time possible. The
content of the tasks can be further improved through a continuous improvement
activity based on collection of historical figures. Product safety hazards and
equipment reliability criticalities need to be continuously investigated, through
quantitative and qualitative analysis, to update and upgrade the effectiveness of the
maintenance task lists designed through this process.
Figure 51 below summarizes the described process steps to design maintenance
procedures.

134
HACCP
Hazard Analysis
&
Critical Control Points
Identification of CCPs
Have all critical factors
been considered for HACCP
analysis?
Residual CCPs
to be added to the
HACCP process
HACCP RESULTS
CCPs associated to
biological, chemical &
phisycal risks
HACCP + RCM
Safety & Reliability
Analysis
Yes
No
Definition of
Maintenance Tasks
Design of Maintenance
Task Lists
Identification of
RCM priorities
Have all components
been considered for
RCM analysis?
Residual RCM
components to be
added to RCM process
RCM RESULTS
CCPs associated to
biological, chemical &
phisycal risks
Yes
No
RCM ANALYSIS
Reliability analysis based
on FMECA
LIST OF PRIORITIES
Safety & Reliability
Analysis
Design Phase
based on
HACCP & RCM
Analysis
RPN referred to
safety & reliability
issues
Prioritisation
Safety & Reliability
issues
Definition of
task list content
Figure 51: The process to design maintenance tasks for ALF packaging

135
6. THE PROPOSALS FOR AN IMPLEMENTATION MODEL FOR
MAINTENANCE PROCEDURES
6.1 Introduction
The design activity could partially or totally be ineffective, during the implementation
phase, if roles and responsibilities are not well defined according to specific needs and
criticalities. The implementation model should address and answer to important
questions like:
(a) Who is committed to carry out a specific maintenance task?
(b) When a specific task is to be implemented?
(c) How to perform the tasks and overcome the complexities?
(d) What are the critical elements which can reduce maintenance effectiveness?
(e) What are the KPI to be used to monitor maintenance implementation
effectiveness?
Here below the main questions are properly addressed to find out, as result, the
proposals for an implementation model able to maximize the outcomes and the
benefits produced by the design process. This chapter presents the result of the
writer’s own research intended to identify the problems existing in the ALF packaging
and the solutions proposed to implement maintenance tasks effectively. The effort
spent to design maintenance procedures, the results obtained in the design phase, with
the production of reliable task lists, needs now to find its continuity through proposals
which effectively address and solve technical and cultural problems during
maintenance tasks implementation.
6.2 Analysis of different implementation principles
In this section some of the implementation techniques, described in chapter 3.5, are
examined to identify the implementation criteria that best address and solve problems
and constrictions placed by the ALF environment. Among the techniques and
methodologies taken under consideration we find:
(a) TPM (Total Productive Maintenance)
(b) RCM (Reliability Centered Maintenance)
(c) TQMain. (Total Quality Maintenance)

136
(d) Terotechnology principles and
(e) WCM (World Class Manufacturing) criteria.
While RCM provides its maximum contribution in the design phase, playing a
fundamental role in the design of maintenance task lists, the implementation of
different maintenance activities must be done to achieve, as result, equipment
reliability, product quality and safety. The implementation process should be able to
catch, address and solve not only reliability issues, but the:
complexities linked to the technologies used, to pursue higher
equipment reliability,
organizational and cultural limits, to pursue higher competence and
proactiveness
critical points linked with product safety and quality.
The outcome of the analysis will emphasize the necessity to develop an
implementation model which embodies a choice of techniques able to pursue higher
reliability, product safety and quality with the right people at the minimum cost. TPM,
which had its genesis in the Japanese car industry, was originally thought to
incorporate Total Quality Control (TQC), Just In Time (JIT) and Total Employee
Involvement (TEI). At that time became obvious that TPM was a critical missing link
in successfully achieving not only world class equipment performance to support
TQC (reduction of variation) and JIT (lead time reduction), but was a powerful new
means to improving overall company performance. Since the early 90s, TPM is now
having a major impact on bottom-line results by revitalising and enhancing the quality
management approach to improve capacity while reducing not only maintenance
costs, but overall operational costs. Statistical Process Control (SPC), supported by
“Quality at Source”, was introduced to ensure quality right first time so to provide
maximum customer value. The quality approach changed to “Prevention at Source”
by controlling process variables, equipment performance, discovering problems in the
earlier phase and detecting quality deviations to avoid non conformity products. Since
production and quality departments demand for equipment availability, quick
response time from maintenance and quality right first time, TPM emphasized
“prevention at source” through equipment operator’s empowerment. Equipment
operators are trained and motivated to be responsible for identifying problems at the
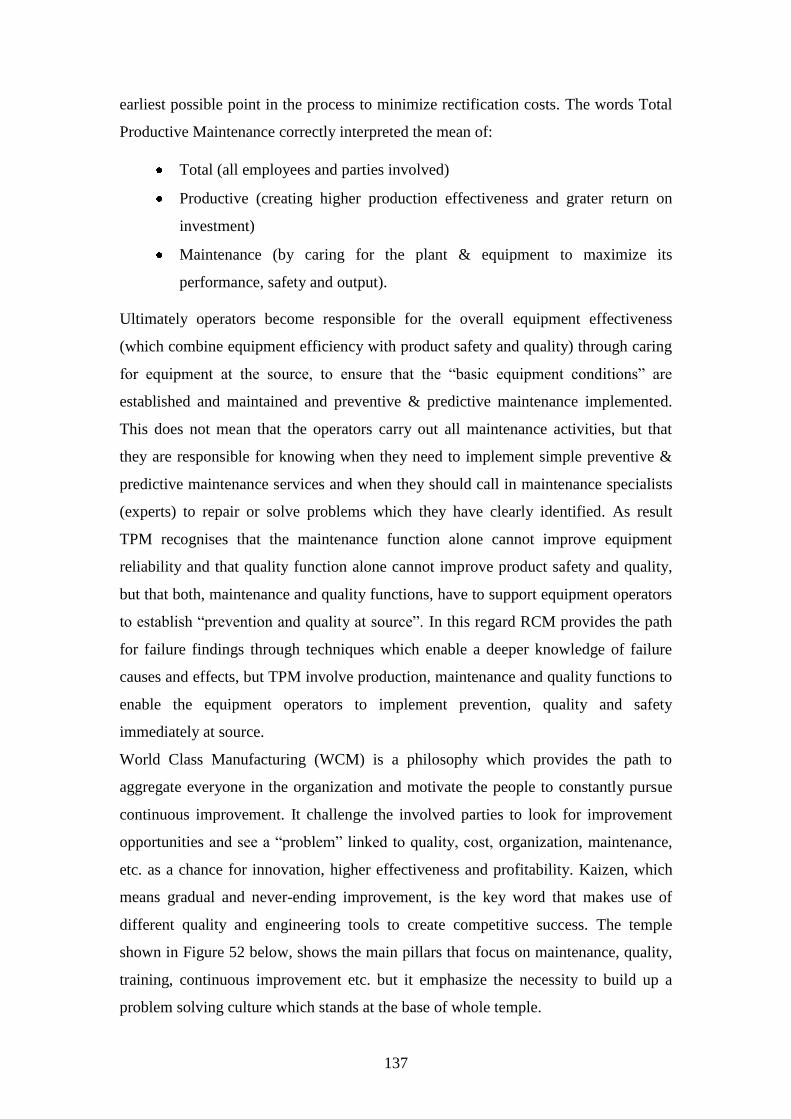
137
earliest possible point in the process to minimize rectification costs. The words Total
Productive Maintenance correctly interpreted the mean of:
Total (all employees and parties involved)
Productive (creating higher production effectiveness and grater return on
investment)
Maintenance (by caring for the plant & equipment to maximize its
performance, safety and output).
Ultimately operators become responsible for the overall equipment effectiveness
(which combine equipment efficiency with product safety and quality) through caring
for equipment at the source, to ensure that the “basic equipment conditions” are
established and maintained and preventive & predictive maintenance implemented.
This does not mean that the operators carry out all maintenance activities, but that
they are responsible for knowing when they need to implement simple preventive &
predictive maintenance services and when they should call in maintenance specialists
(experts) to repair or solve problems which they have clearly identified. As result
TPM recognises that the maintenance function alone cannot improve equipment
reliability and that quality function alone cannot improve product safety and quality,
but that both, maintenance and quality functions, have to support equipment operators
to establish “prevention and quality at source”. In this regard RCM provides the path
for failure findings through techniques which enable a deeper knowledge of failure
causes and effects, but TPM involve production, maintenance and quality functions to
enable the equipment operators to implement prevention, quality and safety
immediately at source.
World Class Manufacturing (WCM) is a philosophy which provides the path to
aggregate everyone in the organization and motivate the people to constantly pursue
continuous improvement. It challenge the involved parties to look for improvement
opportunities and see a “problem” linked to quality, cost, organization, maintenance,
etc. as a chance for innovation, higher effectiveness and profitability. Kaizen, which
means gradual and never-ending improvement, is the key word that makes use of
different quality and engineering tools to create competitive success. The temple
shown in Figure 52 below, shows the main pillars that focus on maintenance, quality,
training, continuous improvement etc. but it emphasize the necessity to build up a
problem solving culture which stands at the base of whole temple.

138
Figure 52: World Class Manufacturing temple [45]
Starting from assessing the current situation, to identify improvement areas and
bottlenecks, WCM guide the people involved to restore the basic conditions where we
normally find the cause of many chronic problems. Afterward the eradication of
sporadic and chronic losses represents the central steps which make use of
engineering techniques able to identify both cause and solutions for eradication of
multiple forms of losses.
Through the implementation of TPM Autonomous Maintenance, World Class
Manufacturing guides the equipment operator to become the main actor in pursuing
the eradication of equipment losses.
The last step to the achievement of “zero defects” philosophy and its consolidation
makes use of six sigma methodology. In conclusion WCM is particularly useful to
build up the cultural values necessary to motivate the people to work as a unique team
for the achievement of highest result at a reasonable cost.
Total Quality Maintenance (TQMain) put its focus on condition monitoring (CM)
recognizing that where critical component breakdown can produce serious effects on
process reliability and product safety, on-line measuring devices should be used. The
use of CM devices can provide reliable facts and figures on equipment performance
and, as shown in Figure 53, through a holistic view of the production process it is
WCM

139
necessary to involve all the interested parties in pursuing continuous improvement
projects.
Figure 53: The TQMain interaction
Continuous improvement necessarily call for wider involvement of those who play
different company roles, but those identified as key enablers to push projects forward
for the achievement of highest results. A modified version of the OEE, named Overall
Process Effectiveness (OPE) can be used to get a performance based not only on a
single line or piece of equipment, but based on the whole process. The Deming cycle
(Plan-Do-Check-Act), used in TQMain process, is an effective tool to pursue a
continuous improvement of the task lists through on-line monitoring and feedback
from the filed.
Terotechnology highlights the importance of revision of scheduled activities as result
of experience: it recognises that the original task lists, designed by the equipment
designers, can be improved through feedback coming from the field. Feedback loops
are also the base to constantly introduce equipment design improvements. Moreover,
maintenance it is not a cost to be measured through Life Cycle Cost (LCC), but since
it generates a real profit it needs to be measured through Life Cycle Profit (LCP) to
highlight its contribution to the company’s profit. To pursue this objective, direct &
indirect maintenance costs and loss of revenue issues are monitored to identify the
areas where maintenance generates its maximum profit.
Condition
Monitoring
Equipment
design
Production Quality
Managerial
functions
Environment
Maintenance

140
6.3 The design proposal of a maintenance implementation model for
ALF industry
The design of an implementation model, able to maximize the effort spent in the new
maintenance task lists design, can be done only if the ALF constrictions and
opportunities are well defined regarding to the three main company’s dimensions:
(a) Technical
(b) Organizational and
(c) Cultural.
Threats, opportunities, limits and constrictions need to be described to identify the
problems and how the implementation model can provides positive answers for an
effective implementation of the task lists designed. The scope of this activity is not
limited to a production of an academic treaty on implementation, but its goal is the
production of a tool able to provide positive answers to the different problems and
complexities in the ALF environment.
6.3.1 Situation analysis
Situation analysis should be the first phase able to identify:
All the restraining forces in the manufacturing environment
All the driving forces to be deployed to overcome the restraining forces.
Problems identification is the first activity: the scope is to shoot a photograph to the
whole production environment in order to capture problems and their nature making
use of automatic data collection (to highlight problems coming from technical
environment) and production audit with interviews (to highlight problems coming
from organizational and cultural environment). Through the use of a production line
monitoring system and KPIs available, it is possible to measure line availability,
highlighting main production line bottlenecks and drawbacks. These systems collect
all type of stops (normal, short, emergency stops…) and the relative time associated,
to calculate efficiency through different formulas. Data can be collected over a period
of two-four weeks. Stop reasons not automatically collected by these systems must be
gathered manually. The information gathered can be elaborated by the computer to
enable the team to proceed with a production audit to analyse production practices,

141
procedures, training programmes etc. to compare and contrast technical figures with
organizational and cultural facts.
Figure 54: Restraining and driving forces
Figure 54 above represents just an example on how to display restraining and driving
forces that work against and in favour of new maintenance implementation
philosophy. In order to analyse the elements that form the context in which the
designed maintenance tasks have to be implemented, a Force Field Analysis (FFA)
technique can be used. This states that at any one point in time a situation in an
organisation is likely to be in a state of equilibrium because all the forces acting on it
cancel each other out. This equilibrium is maintained by two sets of forces that act on
the situation. One set of forces (driving forces) would, if not opposed, induce change
in the situation. Within the context of this research the present situation is the low
level of maintenance implementation effectiveness within ALF industry. A more
desirable situation would be the increased maintenance implementation effectiveness
within the ALF industries. These two situations, existing and desirable, are illustrated
in Figure 54. The driving forces that are pushing for an increased maintenance
implementation effectiveness are:
increasing competition and regulation
Low level of
Maintenance
Implementation
Effectiveness
Maintenance
Implementation
Effectiveness
Old
working
culture
Lack of
resources/
outsourcing
Lack of
time/
product/
capacity
Lack of
management
committment
Lack of
management
awareness of
benefits
Training on
implementation
principles
Increasing
integration/
effectiveness
Increasing
use of new
technologies
Increasing
regulation
Increasing
competition
RESTRAINING FORCES
DRIVING FORCES

142
increasing use of new technology (which calls for a more skilled labour force
and well organised maintenance approach)
increasing integration and effectiveness
a structured training on implementation principles.
The forces that oppose, or restrain to an increased maintenance implementation
effectiveness are:
lack of management awareness of benefits
lack of management commitment and support
lack of time for maintenance due to lack of product and production capacity
lack of resources and use of outsourced personnel
old working culture with all barriers associated.
Figure 55 below shows a practical example on how to display some of the restraining
and driving forces that work against the achievement of maintenance implementation
effectiveness on a specific ALF packaging line.
Figure 55: FFA applied to a packaging line
Low level of
Maintenance
Implementation
Effectiveness
Maintenance
Implementation
Effectiveness
Equipment Layout
RedesignEquipment
Layout
Home-madeEquipment
UpgradesTech.doc.Training
Lack ofAM
Deploybenefits
from field
Lack ofOperator
empowerment
OperatorTrainingprogram
Lack ofCooperationOper.-Spec.
PlanTeamWork
Restraining Forces
Driving Forces

143
This analysis will produce, as a result, clear awareness about the restraining and
driving forces in the manufacturing environment and then the ability to monitor each
force in order to put them under control for the achievement of the targets.
6.3.2 Define the ALF mandatory requirements
ALF tends to involve complex systems in which the automatic machines, that make
up a production line, interact with each other to satisfy production requirements. EEC
directive 93/43, deals with critical operations and specific hazards of the process and
require that appropriate measures for the prevention of failures can be applied to
ensure the safety of food. Annex 5 of the directive states:
“plant equipment, in contact with food, must be designed and built with materials that
reduce, if maintained in a good condition and submitted to a regular maintenance
programme, the risks of food contamination”.
The use of HACCP methodology leads to the identification of Critical Control Points
(CCPs) of the process and to the design of maintenance procedures necessary to
achieve process-product safety and reliability. At the same time GMP has two
complementary and interacting components; the manufacturing operations and the
quality control-quality assurance system. Both these components must be well
designed and effectively implemented. In the second phase, the management roles
should clearly define the requirements and respective actions associated with the two
functions. While compliance with legal requirements represents a threat to the
manufacturing unit, this could be converted to an opportunity to pursue a quality
programme aimed at achieving better process reliability and product safety. Despite
legal pressures, the implementation of maintenance, could be seen not only as a tool
to comply with legal requirements, but as an opportunity to develop a real
manufacturing competitive advantage.
6.3.3 Top management involvement and commitment
Implementation of new maintenance procedures has to be sold to the whole work
force. In the third phase, top management has to inform all the company’s employees
and share their enthusiasm for the project. Experience showed a contradiction existing
between theory and practice, therefore, since the beginning, top management has to
put its effort to persuade the whole workforce about the real intention of the company
to pursue a complete implementation of new maintenance procedures. This means that

144
the implementation program must have a full support of top management in order to
overcome resistances and conflicts coming from middle management, and promote
the involvement of all company’s employees. Because of mandatory requirements and
results found in the situation analysis, implementation of new maintenance
procedures, in the ALF environment, must be initiated as top-down process to enable
bottom-up implementation.
6.3.4 Training & education campaign for implementation of new maintenance
procedures
As fourth phase, training should start as soon as possible. Its purpose is to:
train the different categories of people on new maintenance procedures
philosophy (from design to implementation)
train the people involved on new implementation model
provide the necessary motivation to overcome early resistances.
Training should be used to present new maintenance procedures features and
advantages, to gain the involvement of the workforce that consider this as a costly
process and to show the advantages for all company’s roles. This step should create a
positive attitude towards new maintenance procedures and their implementation.
6.3.5 Design the organization to implement new maintenance procedures
The structure on new maintenance procedures is based on committees and project
teams formed at every level of the organisation. To enable a good communication,
every organisational level has to be connected with the others through observers that
link the various levels as a sole body. In the fifth phase, team activities should be
planned and links among them clearly identified to obtain a pro-active participation of
the ALF managers that consider this implementation as threatening for their position.
Regular communications, results, decisions have to be officially shared with the
workforce involved in the implementation to promote a better ownership. Accurate
planning and design of the activities, listed above, will enable the organisation to
overcome the difficulties that will arise at different levels of the company’s
organisation. If the organisation decides to implement the new maintenance
procedures, the selling effort must continue until these become the way of life. This
will not happen quickly and should never be taken for granted. The people who have

145
been convinced of the value of the concept and practice must keep in touch and be
involved with the successes on an ongoing basis. The different design activities
should not involve a complete redesign of the whole work system; this is an expensive
process which is likely to be very unsettling to the workforce. A complete redesign
would be a revolution, probably imposed by senior management. In contrast this is an
evolutionary process.
6.3.6 Restore basic or standard conditions
The situation analysis identified deviations from the basics and from the standards
(technical and organizational) due to the following issues:
(a) Technical deviations
chronic and sporadic losses
availability and efficiency problems
quality and safety problems
(b) Organizational deviations
operator and maintenance specialist roles
claims management
KPI,s and measurement system
Support & Improvement teams.
In the sixth phase, correlation between technical and organizational deviations enables
us to gain a deeper understanding on the causes and effects produced by the
deviations from the standards, both on technical and on organizational environments.
Restore the basic and standard conditions, under technical and organizational point of
view, is the first preliminary and mandatory step before the implementation of new
maintenance procedures. Implementation effort could be fruitless if standard and basic
conditions are not properly established within the manufacturing organization.
6.3.7 Develop a scheduled maintenance check lists
In the seventh phase, implementation of new maintenance procedures, based on task
lists, is to be considered one of the most important parts of the project: failure in
reaching the target could be experienced if technical, human and cultural aspects of
manufacturing environment are not taken into consideration.

146
Following the analysis of the implementation principles carried out in section 6.2, the
Table 8, shown below, represents an important guideline regarding cleaning and
maintenance activities and the roles responsible for their implementation.
Too often, after design of maintenance tasks, lack of a clear definition of roles &
responsibilities produce uncertainty on:
Who is committed to implement cleaning and maintenance tasks and
The competence level required for each company’s roles.
Activity Content Competence Role
(a) Daily (pre & post production) Daily cleaning procedures
(b) Weekly cleaning & inspection Weekly cleaning & inspection
(a) Time based (daily & weekly)
(b) Based on No. of cycles, packages
(c) Based on Condition Monitoring deviations
(a) Time based (250/500 running hours)
(b) Based on No. of cycles, packages
(c) Based on Condition Monitoring deviations
(a) Time based (1000/2000 running hours)
(b) Based on No. of cycles, packages
(c) Based on Condition Monitoring deviations
Routine Cleaning &
Maintenance
Basic Maintenance
Advanced Maintenance
Specialistic Maintenance
Mechanical preventive &
predictive maintenance based
on low complexity systems and
deviations
Mechanical-Electromechanical
prev. & predict. maintenance
based on medium complexity
systems and deviations
Mechanical-Electromechanical
prev. & predict. maintenance
based on high complexity
systems and deviations
Equipment
Operator
Equipment
Operator
Equipment
Operator
Maintenance
Technical
Specialist
Table 8: Guideline proposed for implementation of cleaning and maintenance
activities
Operators and maintenance specialists have to be trained to safely perform tasks and
share the execution of maintenance activities that can be performed either by
operators and maintenance specialists. Maintenance performance optimisation,
necessary to reduce maintenance cost and improve its effectiveness, can be achieved
sharing maintenance task lists responsibility in this way:
Daily cleaning and basic repair activities (carried out by equipment operators)
Weekly task lists, based on cleaning, maintenance and basic inspections
(carried out by equipment operators)
250/500 hours check lists, based on equipment running hours: preventive &
predictive maintenance (carried out by equipment operators and shared by
maintenance specialists)

147
1000 hours check lists, based on equipment running hours: preventive &
predictive maintenance (carried out by maintenance specialists and shared by
equipment operators).
The content of these check lists is coming from the result of the design phase, and
each list is strictly linked to the others, to build up a unique task list structure.
Definition of task list responsibility is to be done identifying the right role for the right
maintenance task, improving then personnel commitment and maintenance
effectiveness.
Moreover, according to the complexity of maintenance tasks, the table above shows
how to split preventive and predictive maintenance tasks and the roles responsible for
their implementation.
An effective implementation is based on ability to:
Define the equipment operator and maintenance specialist roles
Define who is responsible to implement cleaning and maintenance tasks
Define how to record the result of each maintenance event
Define the interaction existing among the parties involved and support
provided by the manufacturing management.
All these activities have a strong impact on technical, organizational and cultural
dimension of the company. In order to be effective, cultural values invoked by the
WCM must be established and spread out within the whole organization. The
organizational structure, itself, should facilitate the connection and make easy the
dialogue among the parties involved, avoiding bureaucratic procedures and barriers.

148
Figure 56: From task list design to maintenance implementation
Figure 56 above summarizes how the task lists designed need to be split for
maintenance families in order to be allocated to equipment operators and to
maintenance specialists for their implementation. Daily and Weekly (D/W) cleaning
and maintenance, Time Based (TB) and Condition Based (CB) maintenance are
implemented by the equipment operators or maintenance specialists according to the
complexity of task list content [46].
Figure 57: Level of task list complexity based on skill and knowledge
Figure 57 above highlights different levels of complexities based on skill and
knowledge necessary to carry out the task list contents.
Task Lists
designed
in the
Design
Phase
Routine Cleaning
& Maintenance
Basic
Maintenance
Advanced
Maintenance
Specialistic
Maintenance
MAINTENANCE
DESIGN
MAINTENANCE
ACTIVITIES
Equipment
Operator
Technical
Specialist
MAINTENANCE
ROLE
MAINTENANCE
IMPLEMENTED
D/W Cleaning
D/W Mainten.
TB Mainten.
CB Mainten.
TB Mainten.
CB Mainten.
SKILL LEVEL
Cleaning D/W Maintenance Advanced CBMBasic CBM Specialistic TB&CBM
KNOWLEDGE LEVEL
Pre/Post
production
cleaning &
inspection
Consumables
filters, gaskets
simple checks
Basic mechanical
inspection simple
adjustments
Advanced mechanical
and electromechanical
inspection and adjust.
Specialistic mechanical
and electromechanical
inspection and adjustment
LEVEL OF COMPLEXITY
1 2 3 4 5
EQUIPMENT
OPERATOR
MAINTENANCE
SPECIALIST

149
There is not a clear limit or threshold to define the skillness and knowledge level for
operators and maintenance specialists, but manufacturing management should
empower the equipment operators, through continuous training, to allow them:
to achieve the highest possible level of competence and experience
to effectively cooperate with maintenance specialists to carry out preventive,
predictive and corrective maintenance.
Since prevention implemented by the equipment operator can avoid quality and safety
problems on final product, operator empowerment should be a never ending process
to increase product safety, reliability and quality image of the company.
If in a mechanical industry an operator mistake can produce bolts or screws with some
non conformity’s problems compare to technical specifications, an operator mistake,
or a lack of prevention in food industry can have serious effects on public health and
huge damage to the quality image of the company.
As shown in Figure 58, cooperation between operators and maintenance specialists
represents a mandatory pre-requisite to carry out some maintenance activities where
every role alone could experience serious difficulties without the support of the other.
Figure 58: Overlap between operator and maintenance specialist
To pursue a real integration between these two complementary roles it should be
advisable to enable the operators to implement some maintenance specialist tasks and
maintenance specialist to implement some operators tasks. This will produce, as
result, a better awareness of the complexities linked to each role, the ability to better
understand limits and constrictions of the other role and reinforce an effective
cooperation. The simple figure above shows an overlap which represents the area
where maintenance tasks can be implemented both by the equipment operators or by
the maintenance specialist.
Condition-based maintenance and specific PM activities, which required good
electrical & mechanical skill are mainly performed by maintenance specialists.
Equipment operators implemented the same maintenance techniques for low-medium
Operator Tasks
Maintenance Specialist Tasks
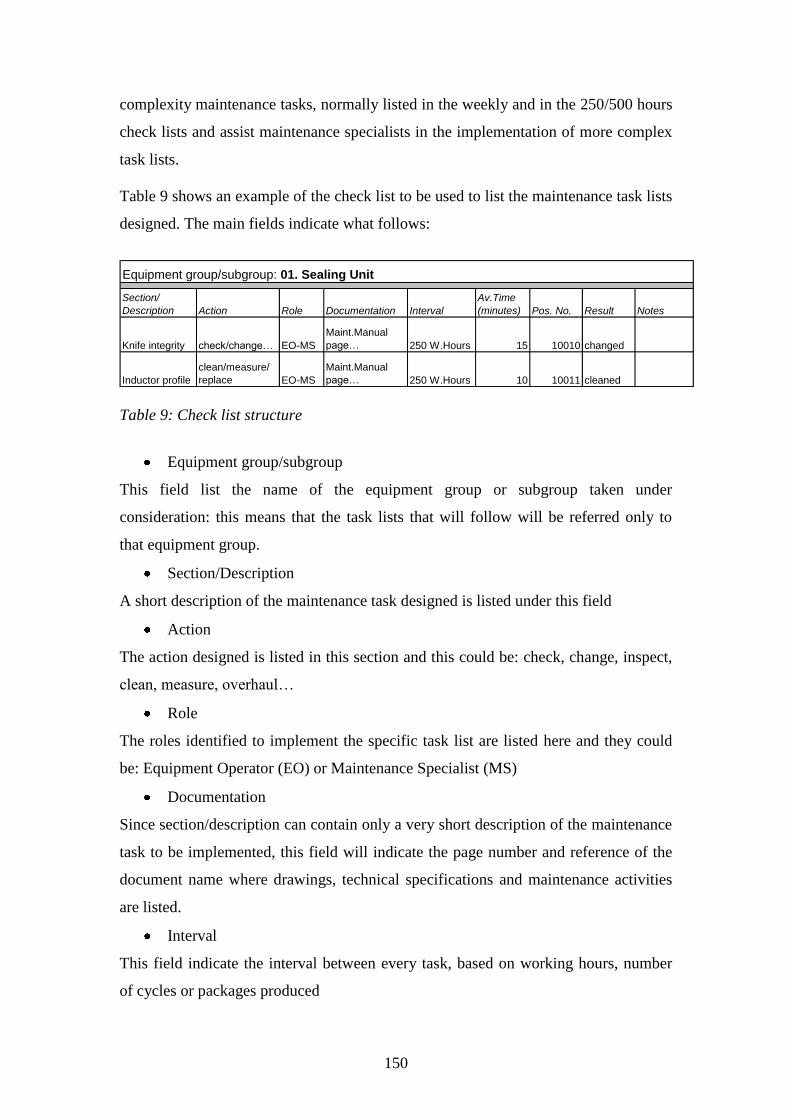
150
complexity maintenance tasks, normally listed in the weekly and in the 250/500 hours
check lists and assist maintenance specialists in the implementation of more complex
task lists.
Table 9 shows an example of the check list to be used to list the maintenance task lists
designed. The main fields indicate what follows:
Section/
Description Action Role Documentation Interval
Av.Time
(minutes) Pos. No. Result Notes
Knife integrity check/change… EO-MS
Maint.Manual
page… 250 W.Hours 15 10010 changed
Inductor profile
clean/measure/
replace EO-MS
Maint.Manual
page… 250 W.Hours 10 10011 cleaned
Equipment group/subgroup: 01. Sealing Unit
Table 9: Check list structure
Equipment group/subgroup
This field list the name of the equipment group or subgroup taken under
consideration: this means that the task lists that will follow will be referred only to
that equipment group.
Section/Description
A short description of the maintenance task designed is listed under this field
Action
The action designed is listed in this section and this could be: check, change, inspect,
clean, measure, overhaul…
Role
The roles identified to implement the specific task list are listed here and they could
be: Equipment Operator (EO) or Maintenance Specialist (MS)
Documentation
Since section/description can contain only a very short description of the maintenance
task to be implemented, this field will indicate the page number and reference of the
document name where drawings, technical specifications and maintenance activities
are listed.
Interval
This field indicate the interval between every task, based on working hours, number
of cycles or packages produced

151
Average Time (minutes)
This field shows the average time normally necessary to carry out the specific
maintenance task
Position Number
This field contains the progressive number that makes the task list traceable
Result
The result of the maintenance activity is listed under this field and this could be:
adjusted, changed, replaced, cleaned…
Notes
Where necessary this field can contain notes regarding the activities done or to be
done at the next available opportunity.
Further fields can obviously be added to identify the tools and the templates to be
used to carry out each maintenance task, but the most meaningful information are
those listed in Table 9 above.
6.3.8 Develop autonomous & specialist maintenance integration
The implementation model acknowledge that the role of the equipment operator is one
of the most critical and meaningful one for the achievement of a sustainable
equipment effectiveness. This statement is particularly true in the ALF environment
where the equipment operator plays a major role in implementing some critical
preventive maintenance tasks that can maintain the equipment under HACCP control.
According to TPM methodology the operator empowerment represents the basic
condition to satisfy to implement preventive and predictive maintenance procedures
effectively. The role of the operator is designed according to the basic maintenance
needs foreseen in the design model.
Autonomous maintenance (AM) carried out by the equipment operator is the sharp
weapon against equipment breakdown, Figure 59 here below shows a full description
of the different incremental steps to pursue to implement this methodology in the ALF
environment.

152
Figure 59: The route for Autonomous Maintenance
1. Initial cleaning
Despite cleaning activities are not generally recognized as professionally qualifying,
in food industry these practices play a more important role compare to some other
industrial realities. Since cleaning represents a fundamental pre-requisite for an
effective surface sterilization, manual cleaning of surfaces not automatically cleanable
by the Cleaning In Place (CIP) system must be done by the equipment operator.
Through the use of “One Point Lesson” (OPL) the implementation of each cleaning
practice must be defined regarding the materials to be used and the operational
practices to be put in place.
2. Eliminate sources of dirt and difficult to clean and inspect areas
Among the equipment operator tasks there is the ability to:
discover the reason of dirt and
identify reliable solution for its elimination.
Dirt and residues can be produced by friction and can reveal anomalous behaviour of
components, but dirt and powder can also be produced by product leakages and can
represent an important input to discover leakages in the pipes.
1.
2.
3.
4.
5.
6.
7.
Initial Cleaning
Eliminate sources of dirt difficult to clean and inspect areas
Create and maintain cleaning Inspection & lubrication standards
General Inspection
Autonomous Inspection
Standardization
Autonomous Management
(OPL on each cleaning practice)
(Discover reasons of dirt, Identify solutions for its elimination)
(Identify & Define the Standardcontent for cleaning & lubrication)
(Identify the critical equipmentparts that need to be inspected)
(Improve equipment knowledge tobecome autonomous inspector)
(Give your contribution to Improve the existing standards)
(Become the autonomous Manager of your equipment)
AM STEPS QUICK CONTENT

153
Sometimes it is possible to find difficult surfaces or areas to clean where the
packaging material could be contaminated or dust residues produced and not cleaned
that could come in contact with the product packed. The equipment operator task is to
devise simple but effective solutions to avoid dust and dirt production: these solutions
could be represented by cleaning practices or by simple equipment modifications to
improve the equipment reliability.
3. Create and maintain cleaning, inspections and lubrication standards
Through improvement team meetings, equipment operator gives its precious
contribution to identify and define the standard contents for cleaning, inspection and
lubrication. No one better then those who are committed to carry out cleaning and
lubrication practices, on daily and weekly base, can define and improve the relative
standards. New ideas on how to inspect and detect potential problems can properly be
conveyed to improve the effectiveness of the existing standards. Every standard can
be dynamic and be submitted to regular analysis to improve its consistency and
efficiency. Standards should serve the company and company should not serve the
standards: standards are important to define the best way to execute a specific activity
and they are essentials to avoid personalisms and uncertainty on how to implement
new maintenance procedures.
4. General inspection
Inspection carried out by the equipment operator does not cover only activities linked
to cleaning, but also connected to some critical mechanical and electromechanical
functions necessary to form and seal the final package. The equipment operator must
be trained and then supported to verify if the CCPs identified in the design phase are
under control or if some potential deviations need to be preventively managed to
avoid loss of control. Again, no one better then the equipment operator can give its
maximum contribution in this area and the whole company should promote the
operator involvement in training and in participating to the improvement team
activities.
5. Autonomous inspection
The equipment operator empowerment starts with a basic training that enables him to
know:
154
the working program of the equipment (preheating, sterilization, production,
cleaning…) the dynamic functions of the different groups and sections of the
equipment
the critical functions and measures of the sterilization unit and the forming and
sealing units
how to prepare, clean and maintain the equipment
how to carry out quality control checks (destructive and non destructive)
during production phase and before and after every type of stop
how to fix the basic problems regarding short stops and how to adjust groups
and components to avoid appearance and leakage problems on the final
package.
This type of training represents the “basic investment” that enables the equipment
operator to gain the standard knowledge of the equipment and how to carry out
quality control and basic maintenance. Moreover, to pursue a real operator
empowerment, the equipment operator will be trained to implement basic and
advanced maintenance. The theoretical training must be followed by practical training
and a maintenance specialist should assist and support the execution of the task lists
implemented under the responsibility of the equipment operator. A final training
regarding equipment trouble shooting should empower the operator to autonomously
fix the basic troubles that produce equipment short stops due to the equipment failures
or to the problems on the final package.
The ability to grow in its role and to gain a wider possible autonomy, depends on
stimuli coming from:
continuous training
continuous support and dialogue with maintenance and quality
specialists
continuous participation to the improvement team activities
continuous information about its performance.
The autonomous inspection, effectively carried out by the equipment operator,
represents the outcome of the investment that the company’s management should
plan, support and monitor for every equipment operator.

155
6. Standardisation
This step represents the ability of every company’s role to give its contribution for the
achievement of standard procedures, practices and operations. To avoid grey areas
depending on personal opinions, practices and ways to work, the equipment operator
should be challenged to pursue continuous improvement, but following the procedures
established to standardise each activity. New ideas to save time, money, or to improve
safety, quality and reliability should be regarded not as a disturbance but as an
opportunity to improve the existing standards. Trough its proactive participation to the
improvement team activities, the equipment operator can play an important role in
defining and improving the company’s standards and the standardisation process. No
one better then him can know what to do, how to do and when to do the right things to
operate and maintain the equipment effectively.
7. Autonomous management
At the end, autonomous management of:
equipment operation (pre-post production, production and cleaning practices)
equipment maintenance
product safety and quality
continuous improvement activities
is carried out by the equipment operator.
An effective program to pursue a real operator empowerment produce as result the
ability of the equipment operator to become a “manager” of the equipment/line able
not only to operate the equipment, but to maintain and to ensure safety and quality of
the end product. This result is based on different activities or investments which point
out to an increase sense of equipment/line ownership based on training, collaboration,
involvement and continuous improvement.
The Good Manufacturing Practices (GMP) implemented through AM represent the
best organized and proactive way to produce a direct positive impact on HACCP
criticalities and on reliability issues. The synergy shown in Figure 60 emphasizes that
while equipment operator is taking the responsibility of cleaning, basic and advanced
maintenance implementation, maintenance specialist implements complex preventive
and predictive task lists which require higher mechanical and electrical competence.
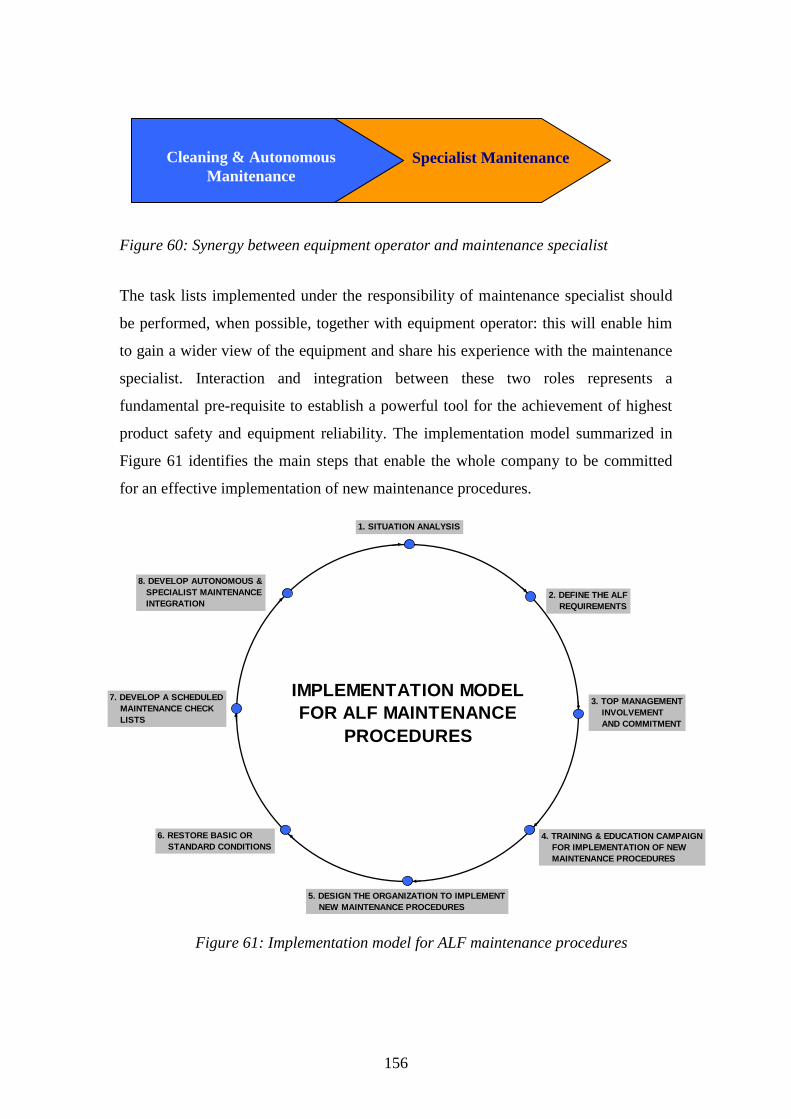
156
Figure 60: Synergy between equipment operator and maintenance specialist
The task lists implemented under the responsibility of maintenance specialist should
be performed, when possible, together with equipment operator: this will enable him
to gain a wider view of the equipment and share his experience with the maintenance
specialist. Interaction and integration between these two roles represents a
fundamental pre-requisite to establish a powerful tool for the achievement of highest
product safety and equipment reliability. The implementation model summarized in
Figure 61 identifies the main steps that enable the whole company to be committed
for an effective implementation of new maintenance procedures.
Figure 61: Implementation model for ALF maintenance procedures
Cleaning & Autonomous
Manitenance
Specialist Manitenance
1. SITUATION ANALYSIS
2. DEFINE THE ALF
REQUIREMENTS
3. TOP MANAGEMENT
INVOLVEMENT
AND COMMITMENT
4. TRAINING & EDUCATION CAMPAIGN
FOR IMPLEMENTATION OF NEW
MAINTENANCE PROCEDURES
5. DESIGN THE ORGANIZATION TO IMPLEMENT
NEW MAINTENANCE PROCEDURES
6. RESTORE BASIC OR
STANDARD CONDITIONS
7. DEVELOP A SCHEDULED
MAINTENANCE CHECK
LISTS
8. DEVELOP AUTONOMOUS &
SPECIALIST MAINTENANCE
INTEGRATION
IMPLEMENTATION MODEL
FOR ALF MAINTENANCE
PROCEDURES

157
If, after some years from the implementation, the company feels the necessity to
revitalize the implementation commitment and sensitivity of those involved, then the
process could be restarted from the first step, to discover the existing drawbacks,
down to the last step, to consolidate the equipment operator and maintenance
specialist integration.
6.4 The key performance indicators (KPI) to monitor production and
maintenance effectiveness
What performance indicators should be measured and who should be committed to
measure maintenance effectiveness? The identification of the KPIs, that highlight the
status of maintenance effectiveness of a packaging line, is discussed in this chapter
regarding not only to technical reliability, but to quality and safety reliability. Some of
the difficulties in gathering measurable information will be highlighted to identify the
easiest way to gather and monitor meaningful ALF KPIs.
6.4.1 Definitions
The following definitions will be applied to the different KPI used to measure
production and maintenance effectiveness:
Actual capacity
It defines the amount of product produced per hour, during production time, without
any stops, e.g. number of filled packages in a filling machine (including filled
packages ejected through the drop chute in aseptic filler).
Nominal capacity
It defines the capacity of the equipment as stated in the specification.
Equipment
It defines the equipment chosen to be investigated, i.e. single machines, part of a
production line or a whole production line.
Approved package/container
It defines a package that is approved during production. (e.g. if an approved package
later, in case of aseptic packaging, turns out to be unsterile, it is still to be regarded as

158
approved). The total number of approved packages also includes approved packages
taken as samples during production for quality control purposes.
Filled package/container
It defines a filled package to be regarded as a sealed package, filled with product to
intended volume.
Packaging material loss
It defines the packaging material that has entered the equipment, but does not come
out as approved packages sellable in the market.
Phases
The period of time that the equipment is studied for can be divided into the following
four phases:
(a) Preparation phase
Preparation means: “any work or enforced waiting time that necessarily occurs at the
start of a work period before production can begin”. The preparation phase starts with
the first attempt to prepare the equipment for planned production and ends when the
production phase starts.
(b) Production phase
Production means: “when the intention is to produce filled packages or product”.
The production phase starts with the first attempt to produce product or packages with
the equipment and ends when planned production is done or when for other
circumstances a production interruption is decided and production is stopped.
(c) After Production phase
After Production means: “any work or enforced waiting time that necessarily occurs
at the end of a work period after production has stopped.”
The after production phase starts with the first attempt to run the after production
program and ends when intended tasks in the after production phase have been
completed.

159
(d) Planned Maintenance phase
Planned maintenance means “The maintenance and cleaning procedures carried out at
predetermined intervals or according to prescribed criteria and intended to reduce the
probability of failure or the degradation of the functioning of the equipment”.
The planned maintenance phase starts at the beginning of the first preventive action
and ends when planned maintenance has been carried out.
Here below is presented Figure 62 which shows the four phases under investigation,
followed by a short description.
Preparation
phase
Production
phase
After
production
phase
Planned
maintenance
phase
2 3 4 5 6 71
Figure 62: Preparation, production and maintenance phases [33]
1. First attempt to prepare the equipment for production
2. First attempt to produce product or packages
3. Planned production is done or stopped
4. First attempt to run the after production program
5. Intended after production tasks has been carried out
6. Beginning of first planned maintenance task
7. Planned maintenance has been carried out.
Stop reasons
In this section the different equipment stop are listed and defined.
(a) Equipment stops
A stop caused by a failure in the equipment itself. An equipment stop can exist during
all phases. We refer to all corrective maintenance activities depending on the
equipment and due to functional failures.
(b) Other stops
Stops caused by reasons outside the equipment itself. Other stop time can exist during
all phases. We refer to stop events as:
Stop caused by other equipment (different from the one under observation)

160
Meals
Missing information for operating the equipment
The time necessary to change the product
The time necessary to change package design, package volume, and packaging
pattern
The equipment stopped by the operator for unknown reasons
Lack of packaging material, or opening devices and other materials
Lack of services or utilities to the equipment (air, water, steam, electricity etc.)
Operator mistakes.
(c) Time
Figure 63 below shows the different time segments under consideration and then a
short description highlights the meaning of such definitions.
Total time
Not worked
timeAvailable time
Available production time
Equipment production time
Production time
Production Phase
Other
Phases
Oper.
time
Equip.
stop
time
Other
stop
time
Other
stop
time
Equip.
stop
time
Figure 63: Total time segments for production activities [33]
Looking at Figure 63 above, the first consideration to be done refers to the
identification of the two main phases: production phase which consider the
preparation of the equipment and production, and other phases referring to after
production and planned maintenance activities.
Production time
This is the time during which the equipment is performing a primary required
function. E.g. producing product or filled packages.

161
Equipment Production time
This is the time during which the equipment could have been performed a
primary required function if no equipment stop had occurred during the
production phase.
Operating time
This is the time during which the equipment is performing a required function.
Operating time can exist during all phases but is called production time in the
production phase. E.g. Production time equals operating time in the production
phase. For example, in preparation phase, the operating time can be a fixed
value stated in the specification for each individual equipment.
Equipment stop time
This is the accumulated time interval from when an equipment stop occurred
until the equipment is back in the same state as it was before the stop occurred,
or when the present phase has ended. Equipment stop time can exist during all
phases.
Other stop time
This is the accumulated time interval starting from a stop caused by reasons
outside the equipment itself ending when the equipment is back in the same
state as it was before the stop occurred, or when the present phase has ended.
Other stop time can exist during all phases.
Available production time
This is the time during which the equipment could have been performing a
required function if no equipment or other stops had occurred. I.e. Available
production time = Production time + Equipment stop time + Other stop time.
Available production time can only exist in the production phase.
Available time
The Available time = total time - not worked time (not planned).
Total time
This is the continuous time interval during which the performance of the
equipment is considered. For example 24 hours, a week, a month.

162
Not worked time
This is the time interval during which the equipment is not used, and does not
belong to any other time interval, previously explained. E.g. when there is no
need or wish to produce or no production is planned.
6.4.2 Performance based on producer view
The indicators used in this paragraph enable the producer to highlight all the factors
(technical, organizational...) that influence the performance of the plant operation
where the equipment is installed and all kinds of stops that reduce the performance of
the line.
Total capacity utilization
Total capacity utilization describes the share of production time out of the total time.
Time utilization (TU)
Time utilization describes the share of production time out of available time.
It defines planning, operational and equipment effectiveness.
Another way to calculate the time utilization effectiveness is to consider the packages
produced.
Available production time utilization (APTU)
Available production time utilization indicates the time used for production phase.
It defines the equipment under observation and other equipment effectiveness.
Available production time utilization =Available production time
Available time
Time utilization =Tot. Number of Filled packages
Available time x actual capacity
Time utilization =Production time
Available time
Total capacity utilization =Production time
Total time

163
Production time utilization (PTU)
Production time utilization indicates the time used for production phase.
It identifies the time spent to produce commercial packages compared with the time
available for production activity.
6.4.3 Performance based on equipment focus
The indicators used in this paragraph enable the producer to highlight all technical
factors that influence the performance of equipment installed. The formulas used
show the efficiency of the specific equipment or machine under observation.
Mechanical machine efficiency (MME)
It defines the machine efficiency over the production time available for the machine.
Mean time between failure (MTBF)
It describes the mean production time existing between equipment failures.
Mean time to restore (MTTR)
It describes the average time necessary to bring the equipment into operation after
equipment stop.
6.4.4 Performance based on packaging material used
In this paragraph the packaging material performance (packages, bottles or containers)
is measured considering both the utilization and the efficiency.
MTTR =Equipment stop time
Number of equipment stop
MTBF =Production time
Number of equipment stop
MME =Production time
Production time + Equipment stop time
Production time utilization =Production time
Available production time

164
Packaging material utilization (PMU)
It describes the ratio existing between the packaging material at the equipment infeed
with the total number of approved packages or containers produced by the equipment.
Packaging material efficiency (PME)
This formula describes the packaging material used to produce filled packages ready
for the market. It defines the efficiency of the equipment regarding to the ratio
existing between the packaging material at the equipment infeed and the approved
packages delivered at the equipment outfeed. The formula refers to a specific machine
taken under consideration and not to the other equipments (processing and
downstream equipments).
6.4.5 Examples of calculation
In the Figure 64 below, a practical example of calculation is showed to explain how
practical situations, like stops and operational activities, have to be allocated. This
figure summarizes the following time periods (starting from left to right):
Pre-Production
During equipment preparation, different pre-production program steps must be
executed to prepare equipment for production activity; this portion of time is defined
as an “operating time”. The light green triangle (on the left) represents a part of pre-
production program executed to rise up the program at the condition where the
machine is ready for production. If, at a certain point, the equipment under
consideration is stopped because of lack of compressed air, due to a compressor fault,
this portion of time is stored under the group: “other stop time” represented by the
yellow segment. If, in re-starting up the program, the equipment is not working
correctly because of a failure in the sterilization system, then the portion of time used
to restore the equipment is stored under the group: “equipment stop time”. The time
PME =Total number of approved packages
number of packages into the equipment - number of packages wasted at other stop
PMU =Total number of approved packages
Number of packages into equipment

165
spent to execute the last pre-production program steps, to reach the condition where
the equipment is ready for production, is an operating time allocated to this group.
Production
Production starts with the first attempt to put the machine in production to produce
filled packages or containers. If, during production activity, represented by the dark
green colour, allocated to: “production time” group, another short stop is experienced
because of lack of compressed air, then this portion of time will be allocated to: “other
stop time” group. If, during production phase, the equipment program drops down to
zero position because of a critical failure on the sterilization system, then the portion
of time used to restore the equipment for production activity is stored under the group:
“equipment stop time”.
Post-Production
If, after the production activity, the company is not working because of a local
holiday, this time, represented by the light grey segment, is stored under the group:
“not working time”. The activities carried out to clean the equipment, after
production, are represented by the light green segments, and are stored under the
group: “operating time”. If during this operating time a stop is still experienced
because of air compressor fault, this portion of time, represented by the yellow
segment, is stored under the group: “other stop time”.
The available time, represented by the blue segment, is the time available for
production (pre-production, production, and post-production) activities without the
planned time in which the company is not working.

166
Figure 64: Production time frames
(a)
Pro
duction T
ime
(b)
Opera
ting T
ime (
Pre
-Post
Pro
d.)
(c)
Equip
ment S
top T
ime
(d)
Oth
er
Sto
p T
ime (
oth
er
equip
.)
(e)
Not W
ork
ing T
ime (
pla
nned)
(f)
Availa
ble
Tim
e
Pro
du
cti
on
Sta
tus
Op
era
tin
g
Sta
tus
Eq
uip
me
nt
Pre
pa
rati
on
Pro
du
cti
on
Pro
du
cti
on
Pro
du
cti
on
Re
-Pre
pa
rati
on
Aft
er
Pro
d.
Pra
ct.
Aft
er
Pro
d.
Pra
ct.
Tim
eE
qu
ipm
en
t
No
t
Wo
rkin
g
Pre
Pro
du
cti
on
Pro
du
cti
on
Po
st
Pro
du
cti
on

167
Examples of data collected to calculate the performance of the equipment
(a) Production Time: 10,5 h
(b) Operating Time (e.g. pre-production and cleaning activities): 2,5 h
(c) Equipment Stop Time (e.g. package out of design during production phase): 1 h
(d) Other Stop Time (e.g. missing operator input): 1 h
(e) Not Working Time (not planned): 9 h
(f) Available Time: 15 h
Number of stop during production phase: 5
Packages In (to the equipment): 72347
Packages In (to the equipment during production phase): 71670
Packages Out (from the equipment): 70520
Packaging loss at operating time (b): 575
Packaging loss at other stop time during production phase (d): 110
Packaging loss at equipment stop during production phase (c): 465
Tot. Packaging Loss: 1150
+
Note:
The difference between packages In (to the equipment) and the sum of packages Out
(from the equipment) and loss during production stops are due to packages ejected
during production phase.
Calculations based on collected data
Time Utilization (TU)
Time utilization =Production time
Available time
10,5
15= = 70%
Packaging material utilization (PMU)
PMU =Total number of approved packages
Number of packages into equipment
70520
72347= 97,47%=
Packaging material efficiency during production phase (PME)
PME =Total number of approved packages
number of packages into the equipment - number of packages wasted at other stop
70520
71670 - 110= 98,55%=

168
Mechanical machine efficiency (MME)
Mean time between failure during production phase (MTBF)
Mean time to restore during production phase (MTTR)
Figure 65 below, displays the interaction of indicators such as: MTBF, MTTR and
MME, with the three legs that determine equipment Availability: Reliability,
Maintainability and Supportability. The red cross identifies the existing interactions.
MTBF is the indicator commonly used to measure equipment reliability. It is
heavily dependent on equipment design, but also on maintenance effectiveness
and operator ability.
MTTR is the indicator used to measure equipment maintainability. While it is
mainly dependent on equipment reparability and fault detection, it is also
dependent on availability of spare parts, tools and templates to carry out
corrective and preventive maintenance. This means that the quality of support
system, available for production activities, is also interacting with MTTR.
MWT (Mean Waiting Time) is the average time to wait before a service can
be started. This is a difficult indicator to measure, but it could highlight some
organizational drawbacks coming from shortage of competency or logistic
problems in getting the right competence to carry out equipment trouble
shooting.
MME is an indicator, referred to a single equipment performance, that is
dependent on the three main availability legs: Reliability, Maintainability and
Supportability.
MME =Production time
Production time + Equipment stop time=
10,5
10,5 + 1= 91,3%
MTBF =Production time
Number of equipment stop=
10,5
5= 2h 06min
MTTR =Equipment stop time
Number of equipment stop=
1h
5= 12min

169
Figure 65: Equipment availability indicators
6.4.6 Overall equipment effectiveness
Overall Equipment Effectiveness (OEE) measures total performance by relating the
availability of a process to its productivity and output quality. OEE addresses all
losses caused by the equipment, including:
equipment not available when needed because of breakdowns or set-up and
adjustment losses
equipment not running at the optimum rate because of reduced speed or idling
and minor stoppage losses
equipment not producing first-pass quality output because of defects and
rework or start-up losses.
OEE was first used by Seiichi Nakajima, the founder of total productive maintenance
(TPM), in describing a fundamental measure for tracking production performance. He
AvailabilityA
ReliabilityR MaintainabilityM SupportabilityS
Design
Excess capacity
Maintenance need
Operator ability
Fault detection
Standardisation
Repairability
Maintenance staff
ability
Repair equipment
needs
Parts supply
Technical data
Administration
MTBF MTTR MWT
MME
MTBF
MTTR
X
X
X
X
X
X

170
challenged the complacent view of effectiveness by focusing not simply on keeping
equipment running smoothly, but on creating a sense of joint responsibility between
operators and maintenance workers to extend and optimize overall equipment
performance. OEE is calculated by multiplying three factors: availability,
productivity, and quality.
% OEE = (%Availability) x (%Productivity) x (%Quality)
The values used can reflect an entire processing plant, a process line, or an individual
piece of equipment.
Equipment availability is not just assumed to be the length of the shift in which it is
operated. Instead, it is based on actual operating time, as a percentage of the possible
production time.
% Availability = actual production time / possible production time
Here is an example: An ALF line is operated 24 hours a day, 5 days a week (120
hours). Planned downtime for preventive maintenance is 1 hour each week.
Unplanned downtime due to equipment failure and equipment adjustment is 7 hours.
% Availability = (120 - 1 - 7) / (120 - 1) = 112 / 119 = 94,1%
Productivity can be calculated by looking at the actual output produced by the
equipment as a percentage of the theoretical output, given its optimum speed and
actual running time. Here is an example: The sustained capacity of an ALF line is 40
millions of packs per year. Last year it produced 37 millions of packs.
%Productivity = actual production / optimum capacity = 37 millions / 40 millions =
92,5%
The quality rate used in OEE calculations is defined as:
% Quality = product produced - (scrap & rework) / product produced
For example, an ALF line produced 37 millions of filled packs on yearly base, but
only 36 millions met the commercial specifications on the first pass.
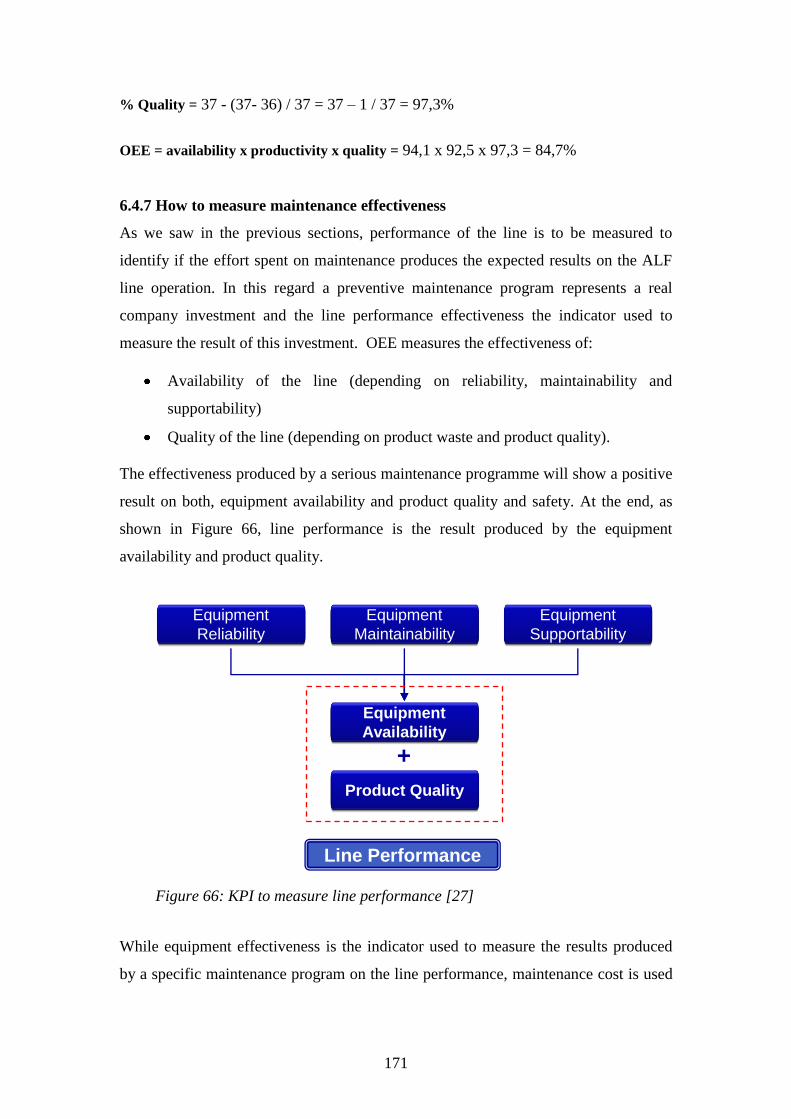
171
% Quality = 37 - (37- 36) / 37 = 37 – 1 / 37 = 97,3%
OEE = availability x productivity x quality = 94,1 x 92,5 x 97,3 = 84,7%
6.4.7 How to measure maintenance effectiveness
As we saw in the previous sections, performance of the line is to be measured to
identify if the effort spent on maintenance produces the expected results on the ALF
line operation. In this regard a preventive maintenance program represents a real
company investment and the line performance effectiveness the indicator used to
measure the result of this investment. OEE measures the effectiveness of:
Availability of the line (depending on reliability, maintainability and
supportability)
Quality of the line (depending on product waste and product quality).
The effectiveness produced by a serious maintenance programme will show a positive
result on both, equipment availability and product quality and safety. At the end, as
shown in Figure 66, line performance is the result produced by the equipment
availability and product quality.
Figure 66: KPI to measure line performance [27]
While equipment effectiveness is the indicator used to measure the results produced
by a specific maintenance program on the line performance, maintenance cost is used
Equipment
Reliability
Equipment
Reliability
Equipment
Maintainability
Equipment
Maintainability
Equipment
Supportability
Equipment
Supportability
Equipment
Availability
Equipment
Availability
Product QualityProduct Quality
Line Performance
+

172
to identify the economical effort put in place to maintain the equipment. Basically,
maintenance cost depends on:
manpower used to carry out preventive and corrective maintenance
spare parts used on different maintenance occasions
any other tool or support used to maintain the equipment.
The manufacturing company’s competitiveness is heavily dependent on both, line
performance and maintenance cost. Figure 67 shows the LCP with maintenance cost
which represents the investment that produce an added value measured through the
key performance indicators that highlight equipment effectiveness and product safety.
Direct maintenance costs
Direct maintenance costs are those related to manpower (salaries), spare parts,
templates and technical documentation (this is the investment that should produce
added value).
Figure 67: Life Cycle Profit (LCP) [27]
Indirect maintenance costs
Indirect maintenance costs are all the costs generated by insufficient or lack of
maintenance. Lack of maintenance affects not only maintenance costs, but also
operational and capital costs. In the ALF industry these costs can be really heavy and
could be due to non conformity products claimed from the market or even worse to
product unsterility discovered on the company’s warehouse or on the market.
Packaging material and product waste represent another source of cost that can be

173
produced by a poor maintenance program that increase manufacturing costs of an
ALF plant.
Loss of revenue
Every hour of equipment standstill or rejection of products should be interpreted as a
loss of revenue. This loss can usually be measured through the net profit margin that
the company should have earn in selling the packages not produced because of
equipment failure. A maintenance program based on corrective approach only may
result in poor equipment availability and unpredicted equipment downtime.
Here below an example, drawn from a real writer’s experience, shows the deployment
of indirect costs of company (A) that refuse to implement a preventive maintenance
program, based on reliability and safety methodologies, with the cost reduction
experienced by a similar company (B) that implemented a preventive maintenance
program.
The cost analysis, carried out during a quality audit, have shown these main costs:
- Indirect costs of company (A):
(a) packaging material waste: 4% on 200 millions of packs/year = 850.000 Euro
(b) Product unsterility/year: No. 2 main cases = 35.000 Euro
(c) Non conformity product: No. 60.000 non conformity packages = 10.000 Euro
(d) Energy loss: due to equipment downtime = 2000 Euro
(e) Chemicals loss: due to cleaning phases following equipment failure = 5000 Euro.
Total indirect costs = 902.000 Euro.
- Indirect costs of company (B):
(a) packaging material waste: 2% on 200 millions of packs/year = 423.500 Euro
(b) Product unsterility/year: No. 1 small case = 10.000 Euro
(c) Non conformity product: No. 7.000 non conformity packages = 2.000 Euro
(d) Energy loss: due to equipment downtime = 1200 Euro
(e) Chemicals loss: due to cleaning phases following equipment failure = 2000 Euro.
Total indirect costs = 438.700 Euro.

174
- Loss of Revenue
If the net margin, for each filled package produced, is 10 Euro cents, and the packages
lost (not produced) in one year, from company (A) compare to company (B), because
of equipment inefficiency, are four millions higher, then the annual loss of revenue of
company (A) compare to company (B) is 400.000 Euro higher.
- Direct costs
The direct costs, including among others, manpower, spare part costs, and external
training and services costs, have shown that costs of company (B), compared to
company (A), were higher than 40.000 Euro.
The costs comparison between these two similar companies emphasized that an
investment of 40.000 Euro, in a new preventive maintenance program (direct cost),
has generated the following savings on the other cost indicators:
- Indirect costs: 436.300 Euro
- Loss of revenue: 400.000 Euro.
The savings showed above represent the result of important changes in the company’s
(B). The tendency to overestimate direct costs without considering the potential
savings that can be obtained on the other cost indicators, is self-explanatory of an old
management culture unable to get an holistic view of manufacturing reality.
The graph shown in Figure 68, identifies the area where an optimum costs balance can
be found. A short term cost view can often be seen as a way to reduce cost, especially
during downturn time, but it can shows terrible effects on indirect maintenance costs
and on loss of revenue.
Figure 68: Maintenance costs

175
The operational cost for thousand packages produced can be calculated as shown in
Figure 69 below.
Figure 69: Manufacturing operational cost per thousand packages produced [33]
Because maintenance is sometimes perceived as a disturbance, some manufacturing
units consider production as the sole added value activity that takes place in the shop-
floor. Where this view prevails, management is characterized by a reactive approach
based on short term problem fixing. As result the short term view of the company’s
management does not allow the implementation of a competitive maintenance plan
(investment) and to realize the benefits coming from less operational cost and higher
product safety.
6.4.8 Analysis of KPI and task list improvement
The scope of this section is not only related to the analysis of KPIs, but to the
identification of:
a systematic monitoring routine that suit the ALF environment needs
the team to be involved in the measuring activity
the main topics to address during the analysis of KPIs
the corrective/improvement activities to be put in place after analysis
the task list revision process with the improvement procedures.
These activities represent the basic tool for the appraisal of maintenance task list
effectiveness and for the continuous improvement of the task list design.
The improvement will regard both the working method and the content of
maintenance tasks, according to the feedback coming from the field.
Since maintenance effectiveness is not a matter of a sole reliability, all the
conceivable factors that could have a direct impact on effectiveness will be taken
under consideration to maximize the implementation and then the maintenance
effectiveness.
Customer
Operational =
Cost /1000 Total number of approved packages out line
Supplier
Service
work
Spare
Parts
Customer
Service
work
OperatorsConsumables
& Utilities+ + + +
Waste
Material
cost+

176
6.5 Conclusion
In this chapter, following the literature review, an analysis of different maintenance
implementation models, normally used in industry, have been done. This analysis
produced the identification of implementation principles to be used in the design of
the implementation model proposed for ALF industry.
Here below a list of some of the benefits produced by this model:
It provides a clear pathway to answer the question: “how to avoid to loose the
advantages of an effective maintenance task design”. The threats that could
limit the benefits coming from a reliable maintenance design phase and
regarding the technical, organizational and cultural dimensions have been
considered and managed.
It provides the opportunity to gain the commitment of all the parties involved
in pursuing higher equipment reliability and product safety at the minimum
operational cost
It represents a cultural evolution in pursuing the integration of different
company’s roles to work as a sole body in implementing the different
maintenance tasks
It is a tool to empower the people involved through different training sessions
and team activities carried out by equipment operators, maintenance
specialists and quality experts
It shows the opportunity to maximize the implementation effectiveness
defining both maintenance task contents and the more convenient way to
implement that tasks
It shows the solution for an effective implementation of autonomous
maintenance carried out by the equipment operator, that combine all
maintenance activities, starting from cleaning up to inspection and
autonomous equipment management.

177
Figure 70: Proposal of a maintenance implementation model for ALF industry
Situation Analysis
Identification of
Technical, Organizational
& Cultural Problems
Definition of ALF
Mandatory Requirements
Safety Legislations, ISO
Standards, GMP...
Top Management
Invovment & Committment
For a Top-Down
Starting
Training & Eduction
Campaign
To motivate and Gain
Involvement of People
Design the Implementation
Organization
Project Teams, Planning...
Restore Basic
Conditions
About Losses, Efficiency,
Safety Problems, Claims...
Develop Scheduled
Check Lists
Definition of Tasks, Roles &
Competences
Develop Autonomous &
Specialist Maintenance
Integration
Sharing Tasks & Competence
PROBLEMS
+THREATS
COMPANY'S
OPPORTUNITY
CULTURAL
MOTIVATION
ORGANIZATIONAL
MOTIVATION
+
RESTORE
THE BASICS
CHECK LISTS
DEVELOPMENT
DEVELOPMENT
OF INTEGRATION

178
The model proposed in this chapter and summarized by the diagram in Figure 70
above, represents an important and original tool to prevent that the outcome of
maintenance design phase is just a good theory without the possibility of delivering
real benefits in the real industry world. Since maintenance represents an investment
and not a cost, in this chapter, the different KPI’s used to measure maintenance and
production effectiveness have been introduced and explained. The purpose of such
indicators is to “measure” the effectiveness of a production line according to the
customer/producer view and then to the equipment operation with a specific focus on
equipment performance. The “Overall Equipment Effectiveness” (OEE) indicator has
been introduced and its value explained.
At the end of this chapter, basic economical indicators such as: direct and indirect
maintenance cost and loss of revenue, have been introduced to provide the tools
useful to measure the Profit and Loss (P&L) of the packaging line and to assess if the
investments done in maintenance produces the expected results.

179
7. CRITICAL FACTORS IN THE DESIGN &
IMPLEMENTATION PROCESS WITH RELATIVE SOLUTIONS
7.1 Introduction
In this chapter, the most important critical factors that need to be managed during the
design and implementation process have been identified and analyzed. Figure 71
below shows the three main manufacturing dimensions that need to be investigated to
avoid that potential threats coming from each dimension could limit the achievement
of maintenance and manufacturing effectiveness.
Figure 71: Technical, organizational and cultural dimensions for maintenance
management effectiveness
The scope of this chapter is to determine a deep awareness in people involved in the
project about technical, organizational, human, and cultural criticalities that prevent
the achievement of targeted product safety through maintenance effectiveness because
of the restraining forces. Technical, organizational, and cultural problems that could
reduce the effectiveness of the design and implementation process are examined to
identify the key arguments that need to be analyzed and solved.
The main questions that need to be addressed and solved are:
What kind of technical problems could limit the effectiveness of the design
and implementation process?
What is the organizational model that enables an effective maintenance design
and implementation?
How to overcome the restraining forces due to barriers placed by the
organizational and cultural inertia?
Technical
Dimension
Organisational
Dimension
Cultural
Dimension
Maintenance
Management
Effectiveness
-Reliability
-Efficiency
-Maintenance
-Operation
-Improvement
-Updatement
-Good Manufacturing
Practices (GMP)
-Operation management
-Implementation of KPI
-Improvement teams
-Planning tools
-Motivation and
skillness
-Participation and
proactiveness
-Co-operation and
integration

180
The guidelines and tools developed in this chapter represent the solution to convey
each critical issue towards a model that provides a way to overcome obstacles and
barriers in a structured way.
7.2 Technical drawbacks
With technical drawbacks we refer to:
(a) Technological or reliability problems placed by some of the equipments
available in the production line
(b) Lack of technical documentation available for some equipments of the line
(c) Lack of training or service support for the equipment
7.2.1 Equipment reliability and technological problems
Sometimes equipments show reliability problems that produce real production line
bottlenecks that cannot be overcome through a suitable maintenance program.
If we are dealing with home/tailor made or customized equipment with reliability
problems, we have to be aware that involvement of the equipment designer represents
a mandatory step necessary to identify both the unreliability causes and an
improvement program to upgrade the equipment up to an acceptable reliability level.
Since reliability design problems cannot be solved through maintenance it is very
important to identify the inefficiency reasons that produce a poor line or equipment
performance.
These reasons could depend on the following subjects:
Old technology
Equipment layout
Services and utilities
Complex or difficult equipment operational practices.
To gain a clear picture about the problems and relative causes that determine low line
efficiency the following procedures should be implemented:
(1) Production audit
Through a production audit, carried out by a trained staff, it is possible to gather
numerical figures that highlight the different causes behind production stops.

181
(2) Production stop categorization
Production stops related to equipment, to practices or utilities must be split for
systems, sub-systems and stop category type.
(3) Production stop prioritization
The different stop reasons with relative categorization, must be weighted according to
the intensity of disturbance produced during the normal operation
(4) Analysis of priorities
After a selection of main stop reasons, a deeper analysis of potential causes must be
undertaken to identify the technical reasons behind every stop
(5) Equipment improvement
A detailed list of problems, with causes that determine equipment or line inefficiency
will be examined by the equipment designer or supplier to identify the corrective
design activities necessary to overcome technical drawbacks and produce better
equipment performance.
7.2.2 Lack of technical documentation, training and service support
Sometimes lack of documentation determines equipment inefficiency due to the
inability of people to manage technical matters according to standards and
specifications that are missing. This lack could be referred to the following missing
documentation:
Operational Manual (to identify the operational standards: practices and
procedures)
Maintenance Manual (to identify the mechanical standards: settings and
measures)
Electrical Manual (to identify the electrical standards: settings and measures)
Spare Part Catalogue (to identify parts and components specifications).
When this documentation or part of it is missing, the impact on equipment or line
efficiency could be really meaningful. The inability to identify the technical standards
to avoid tailored operational procedures and maintenance activities could determine a
source of uncertainty that is quite often the reason of poor line effectiveness.
Lack of technical training based on reliable documentation, lack of qualified service
engineers and service support for equipment upgrade or lack of a spare part catalogue,
could be one of the reasons of low line efficiency.

182
To overcome these problems there are two possible solutions:
(1) Produce, with the support of the equipment designer or supplier, the required
documentation or
(2) Establish a team of company’s specialist able to develop the standard
documentation and to support the personnel with the required training
activities.
Sometimes because of:
Equipment price competition and
Immediate satisfactory equipment performance result,
technical managers do not verify if the technical documentation is complete and
reliable and if technical and operational standards have been clearly defined by the
equipment supplier. In the medium-long term the presence of technical and
operational standards and specifications will play a very important role in ensuring
both higher operational performance and product safety. Lack of clear technical
specifications about mechanical and electrical settings will produce an unreliable
maintenance approach; and, on the other side, lack of clear standards on operational
and quality practices will result in a low production effectiveness and product safety.
For this reasons the check list used by the technical managers to assess the equipment
suppliers should mandatory contain these important requisites.
7.3 Organizational drawbacks
The organizational model for the ALF industry can give a great contribution to
maintenance effectiveness if some important quality methodologies become the
source of inspiration in promoting co-operation and best practices and in removing
inertia and bureaucracy.
7.3.1 Lack of autonomous maintenance carried out by the equipment operator
The organization in place in some ALF plants shows traditional boundaries among
different departments and narrow definition of roles and functions. Normally
equipment operators are not involved in maintenance activities for the following
reasons:
• Lack of the necessary skill, and

183
• Different company policy.
Regarding the equipment operator role, few companies normally establish a serious
training program to enable the operators to grow to the level required to carry out
autonomous maintenance. This situation emphasises that maintenance activities are
considered the sole domain of technical specialists. The concept “I produce and you
repair” is generally well established for the following reasons:
Narrow view of equipment operator role
Fear to increase equipment operator salary
Fear to obtain lower equipment efficiency and availability.
Against operator involvement in autonomous maintenance activities, plays an
important role the unavailability of technical and quality specialists to share their
experience with equipment operators. Frictions among different departments is
sometime another adverse force which leads the departments to limit their co-
operation.
To be able to implement maintenance procedures effectively, the role of equipment
operator must be designed to carry out autonomous maintenance and good
manufacturing practices that have a direct impact on equipment criticalities identified
in the HACCP process. To avoid this organizational drawback, top management must
continue to support the whole organization and middle managers should ensure a
wider participation of technical specialists for a real integration of company’s roles.
7.3.2 Lack of management commitment and involvement
Lack of management commitment, due to a poor knowledge and awareness of
benefits coming from maintenance engineering, represents a problem that has a strong
impact on ALF organization. The adjective Total, regarding the productive
maintenance implemented, means that maintenance function is enlarged to the totality
of the personnel working in the company. It is not the sole maintenance function
responsible for its implementation, but all the company regularly motivated and
supported by top management. One of the reasons for maintenance implementation
failure resides also on the inability of the management to cope with the complexity of
the implementation process. Sometime managers refuse their own commitment and
involvement in supporting the activity of improvement teams, and this often is the
reason of poor participation and poor maintenance and production effectiveness.

184
To overcome this problem it is very important to gain management commitment since
the very beginning and design the involvement of management at different level of
maintenance and production organization.
7.3.3 Lack of a planning & measuring system
Maintenance activities must be planned and someone should be directly responsible to
develop and update a master plan in each department. A short term view of
maintenance, based on a reactive approach, combined with the daily production
pressure, could represent an obstacle for planning maintenance activities that have
been designed for the line equipments. The maintenance activities designed must be
planned and regularly monitored to verify if:
They are regularly implemented
They are effective, both in quality and in time
Improvement or corrective actions need to be implemented.
A common production management drawback resides on inability to establish a
management system based on measure. On the other side, a measurement system
itself is not enough if the measures obtained are not analyzed and improvement and
corrective actions applied. The KPI used to measure maintenance and production
effectiveness should be regularly updated and shared with the people involved at
different levels. These measures must be compared and contrasted to identify the
areas where further improvement can be designed and implemented.
7.4 Cultural drawbacks
Lack of basic maintenance engineering knowledge, quite often, does not enable
middle management to motivate company’s employees, to support them in
overcoming problems during the implementation phase.
7.4.1 Old management culture
Because maintenance is sometimes perceived as a disturbance, some manufacturing
units consider production as the sole added value activity planned in the shop-floor. In
these realities, characterised by a reactive approach, based on short term problem
fixing, emphasis is placed only on production: output has to be produced on time, at
the minimum cost and in the ordered quantity. To support this culture, managers argue

185
that the reliability of the technology available today enables reduction of equipment
downtime and that corrective maintenance is the only maintenance approach needed
in this context. As result the short term view of company’s management does not
allow to build up a competitive plant: lack of quality methodologies, bureaucracy and
barriers among the departments determine poor equipment efficiency and product
safety.
The analysis of the culture in an ALF company is an important prerequisite to carry
out before maintenance engineering implementation can take place. If the forces
which are ranged against maintenance design and implementation are not examined
and managed in advance, implementation failure can be experienced.
Figure 72: Restraining forces and countermeasures
As pointed out by Andrew Leigh in the book “Effective Change 20 ways to make it
happen” (1998), Field Force Analysis (FFA) technique [47], as shown in Figure 72
above, enables one to list the cultural restraining forces in place in the organization, to
carry out an analysis for the implementation of different countermeasures necessary to
move to a state of production effectiveness.
7.4.2 Workforce culture
Psychologists such as Maslow, Hezeberg, Adams and McGregor developed theories
which identify human needs and how they affect job performance. TPM and WCM
workforce culture are based on McGregor’s theory Y (1960) which states that people
have a hierarchy of needs (as specified by Maslow) that they naturally perform well in
Stato di
Inefficienza
Deployment del valore
del prodotto
Stato di
EfficaciaElenco dei bisogni/problemi
Improvement activities to
overcome problem in placeCountermeasures
necessary to overcome
problems
Restraining forces
Inefficiency
State
Effectiveness
StateList of needs and problems

186
the service of objectives to which they are committed and that they learn and seek
responsibility [48]. The substantial gap existing between Japanese and European job
culture can be ascribed to:
Japanese Human Resource Management (HRM)
Collaboration between Japanese government and industry
Japan’s position as a late developer
Mac Duffie [49] argued that HRM is particularly important in determining quality.
Japanese employees typically enjoy much longer-term relationship with their
employing organisations and hence have a much stronger sense of “shared destiny”.
Work systems are based on team-working and quality circles and responsibility for
quality lay with production workers. HRM policy is gauged by the sophistication of
selection and training procedures, the extent of single-status conditions and the
presence of “contingent compensation” performance-related pay. Despite in the last
two decades many western companies implemented different TQM projects, the
culture is still too much based on strong functional departments which make
interdepartmental co-operation difficult. The culture in many European ALF
industries is at the present too much based only on short term company results. Latest
technology, marketing and commercial issues are considered the sole competitive
tools able to produce higher market share. The human resources are a sort of
necessary evil, but not a winning factor to manage for a higher market share. This
suggests particular care in designing maintenance implementation plan, in defining
training programmes and in team work formation.
7.4.3 Training for equipment operators and maintenance specialists
The implementation models suggested by TPM and WCM, has been modified to meet
the requirements of ALF environment to embodies HACCP methodology, to satisfy
both EEC legal requirements and maintenance effectiveness requirements.
Autonomous maintenance, carried out by those who operate the equipment, must
include regular monitoring activities of CCPs of the process. Furthermore GMPs
already in place in many ALF environments suggest some tailoring activity in
defining AM procedures for equipment operators. Because of low company’s status,
suffered by the equipment operators and cultural boundaries existing between

187
production and maintenance departments, strong effort has to be placed in supporting
small group of activities.
Most industries today are organised with maintenance on one side and operations on
the other. Although both sides have the same goal: to be a productive unit in a
company making a profit, the organisational line frequency gets in the way, causing
delays and production stoppages. According to Figure 73 below, operators and
specialists each have clearly identified skills and both do only those skills designated
as their own.
Figure 73: TPM that works [28]
TPM combines operators and maintenance personnel into a single team which
identifies existing tasks that cause delays, create waste and reduce productivity. This
figure illustrates the inadequacy of the old work system. If a machine operator
observes that a cutting knife needs to be replaced, he or she reports the problem to his
or her supervisor, who initiates a work request. The work requests is transferred
through the Maintenance Information System (either electronically or on paper) to the
maintenance supervisor, who will contact the specialist and assign the job. When the
specialist arrives at the job site, he or she must find the operator and get him or her to
come to the job site to replace the knife. At this point, the work can actually be done.
This example shows that the organisational line has required a tremendous
communications effort for the completion of a simple maintenance task. This
OLD WORK SYSTEM
MAINTENANCE INFORMATION SYSTEM
ORGANISATIONAL
LINE
OPERATOR SPECIALIST
3 2 1 1 2 3
HIGH LOW LOW HIGH
SUPV SUPV
a
b c
d
Skill Level
OPERATOR SKILLS SPECIALIST SKILLS

188
administrative system consumes much time, promotes inefficiency, causes longer
downtimes, increases costs and decreases productivity. The production delays which
are caused by this relationship, as it exists in most companies today, make the
implementation of new maintenance procedures an essential tool to improve
equipment availability and reliability. This approach, as result, shows that on as-
needed basis, operators perform some tasks that were once thought to be exclusively
“maintenance” tasks.
7.5 Conclusion
In this chapter the three main company’s dimensions (technical, organizational and
cultural) have been examined to identify some of the critical factors that need to be
managed to avoid design and implementation problems with the relative
inefficiencies.
A common denominator that cross these three dimensions is strongly based on
cultural drawbacks depending on:
Lack of knowledge
Short term view of manufacturing activities
Reactiveness instead of proactiveness
Lack of integration and communication
Departmental boundaries and bureaucracy.
For each critical factor a solution has been provided, but a reliable and lasting solution
will depends on ability to gain a wider participation of people through team activities
and strong cooperation. Top and middle managers have the fantastic opportunity to
shape the future according to their ability to listen, learn and share the vision with all
the company’s functions. On the other hand, shop-floor workers need to know that
their flexibility to share knowledge, to work with others and to give their positive
contribution to the team work activities are the key ingredients to facilitate the
bottom-up company’s change. Figure 74 below summarizes the technical,
organizational and cultural drawbacks identified in this chapter and solutions found.

189
No. Problem Issues Note Solutions Proposed Result
1 TECHNICAL DRAWBACKS
1.01
Equipment Reliability &
Technological Problems
Production Audit To gather numerical figures that
highlight the different causes behind
production stops.
Old Technology Obsolete/Old Equipment
Production Stop Categorization Production stops split for systems,
sub-systems and stop category type.
Packaging Line Layout Layout with Bottelenecks
Production Stop Prioritization Stop reasons are weighted to
identify the intensity of disturbance
to normal operation.
Services & Utilities Unreliable Equipment
Analysis of Priorities Analysis of potential causes to
identify the technical reasons behind
every stop.
Complex Operational Practices
Complex and Unreliable
Practices
Equipment Improvements Identification of corrective design
activities to overcome technical
drawbacks.
1.02
Lack of Technical
Documentation, Training and
Service Support
Lack of Operational, or
Maintenance Manual, or
Electrical Manual
Lack of clear technical
specifications
Produce the required
documentation (with support of
equipment designer/supplier)
Production of a standard
documentation
Lack of Spare Part Catalogue
Lack of spare part
specifications
Establish a team of supplier or
company’s specialist to develop
documentation and training
Production of a standard
documentation
2 ORGANIZATIONAL DRAWBACKS
2.01
Lack of autonomous
maintenance carried out by the
equipment operator
Equipment operators are not
involved in maintenance
activities
Define the equipment operator
role
Clear definition of equipment
operator role
Lack of the necessary skill
Narrow view of equipment
operator role
Establish an AM training
program for operators
Equipment operator trained to
perform AM
Different company policy
Fear to increase equipment
operator salary Top management support
Top management support the AM
carried out by the equipment
operator
2.02
Lack of management
commitment and involvement
Poor knowledge and awareness
of benefits coming from
maintenance engineering
Lack of knowledge about
advantages of AM
Management commitment
towards the new maintenance
implementation model
Management support the
implementation program
Management inability to cope
with the complexity of the
implementation process Implementation drawbacks
Training program for different
categories of management
Management trained to cope with
the implementation complexities
Poor participation due to lack of
management support and
participation
Poor participation of
specialists in the project
team activities
Management involvement in
project team activities
Management fully support the
project team activities with their
participation
2.03
Lack of planning &
measuring system
Short term view of maintenance
based on a reactive approach
Lack of a reliable
maintenance planning
Develop a maintenance plan to
be regularly updated
Regular execution of maintenance
activities according to plan
Daily production pressures
AM not regularly
implemented
Awareness of benefits coming
from systematic AM
implementation Regular AM implementation
Inability of management to
establish a line management
system based on measure
Lack of KPIs to measure
maintenance and production
effectiveness
Awareness of benefits coming
from a management system
based on measure
Definition of KPIs with regular
measurement of production and
maintenance effectiveness
3 CULTURAL DRAWBACKS
3.01 Old management culture
Consider production as the sole
added value activity
Lack of quality and
maintenance engineering
techniques FFA to deploy the solutions
Maintenance activities are
implemented with full
support of management
Reactive approach based on short
term problem fixing
Bureaucracy and barriers
among the departments
Implementation of product safety
and maintenance engineering
techniques
Management pursue the integration
of equipment operators with
maintenance specialists
3.02 Workforce culture
Lack of objectives and lack of
rewarding tools like pay-
performance systems
Lack of clear objectives and
poor effort in pursuing
production effectiveness
Define company's objectives and
a pay-performance/rewarding
system
Objectives difined and
communicated and rewarding
system implemented
Lack of employee longer-term
relationship and sense of "shared
destiny"
Poor motivation and
performance
Identify company's incentives
that
promote quality and efficiency Company's incentives implemented
Lack of working teams and
quality circles
Poor integration and
participation
Empower different categories of
people for a higher proactive
perticipation
Operator and maintenance specialist
empowered and integrated through
proactive participation
3.03
Training for equipment
operators and maintenance
specialists
Split organization with
maintenance on one side and
operations on the other
Cultural barriers among
departments, poor
integration and delays
Autonomous Maintenance (AM)
to establish co-operation
between operators & specialists
Product safety & Equipment
reliability management through AM
Figure 74: Technical, organizational & cultural drawbacks with relative solutions

190
8. CONCLUSIONS
8.1 Introduction
The sections of this chapter summarize the findings based on research questions
identified in the first two chapters: these emphasized research conclusions and relative
benefits. The analysis of the background to the research and the definition of
problems led to the identification of criticalities in the ALF industry and the need of a
maintenance design and implementation process specifically designed for this
industry. The analysis of case studies produced:
a) the research questions,
b) the research activities and then
c) the definition of the process to design and implement maintenance
procedures for ALF industry.
The critical factors to manage in the maintenance design and implement process have
been addressed through the integration of engineering and quality techniques that
provided the answer to product quality and safety requirements and to equipment
reliability problems. This chapter summarizes conclusions about:
research questions
research findings
solutions found and implemented
contribution to knowledge.
The primary and secondary literature review allowed to find the material used during
the development of the process to design and implement maintenance procedures.
8.2 Conclusions about each research question
This section highlights the research questions arose in the first two chapters and the
solutions found.
8.2.1 Solutions to manage the effects produced by equipment failures and
downtime
This research showed that while in mechanical industry a machine stop could have a
low economical impact on production cost, in ALF industry, equipment stop can have

191
tremendous impact on company’s costs. The analysis of the case studies produced the
research questions which highlight the necessity to develop a maintenance design and
implementation process to manage and overcome product safety problems and
equipment reliability issues. The HACCP analysis showed that some equipment
failures could have serious effects on quality of the product packed and eventually on
consumer’s health. The solution to the problems produced by equipment stops was the
maintenance design and implementation process able to link product safety and
equipment reliability issues to address the criticalities of the food industry lines. The
peculiarity of this process, compare to processes used to design maintenance
procedures for other industrial sectors, is based on capacity to identify:
the critical product quality and safety issues
the effects produced by these criticalities
the weight of each failure effect on product safety and on equipment reliability
the maintenance tasks for each failure type
the maintenance organization and competence necessary to implement the task
lists designed
the way to overcome problems encountered during the implementation phase.
The starting requirement for the maintenance design process was the necessity to
identify all conceivable CCPs existing in the manufacturing line, and that could
influence the quality and safety of product packed. The application of the HACCP and
HAZOP techniques represented the solution for the identification of the equipment
and process criticalities that produce biological, chemical, and physical risks of
product packed. Risks have been weighted to produce a list of priorities that have a
direct impact on final product safety. Product safety and equipment reliability issues,
with the relative criticalities, have been put together to gain a global picture on
existing safety and reliability risks. As result, a list of priority has been developed
according to the outcome coming from safety and reliability analysis. The
development of maintenance task lists, able to control ALF packaging line
criticalities, was the last design phase necessary to provide a solution to equipment
stops and potential consequences on product packed.
The implementation constrictions coming from three main company’s dimensions:
technical, organizational and cultural, have been solved through the deployment of
countermeasures coming from application of maintenance engineering techniques.

192
Top management involvement, training & education for different categories of people
and organizational redesign led to the identification of deviations from the standards,
and then to a restoration of basic conditions for a reliable implementation. Finally,
autonomous & specialist maintenance integration was achieved through Autonomous
Maintenance (AM) to effectively implement maintenance tasks that maintain the
equipment under HACCP control. The maintenance design and implementation
process represents the main answer to the problems produced by the equipment stops,
which can determine product quality and safety non-conformities together with
unpredictable economical losses.
8.2.2 Solutions to establish compliance with product safety directives and
standards
As we saw in the first two chapters, pressures exerted by the EU legislation call food
manufacturing companies to identify:
the existing criticalities on production lines and
the preventive maintenance actions to avoid product quality and safety
problems.
Hazard Analysis of Critical Control Points (HACCP) is the production process control
methodology selected, as a solution, to:
a) identify and assess specific hazards,
b) estimate risks and
c) establishes control measures that emphasize product safety prevention and
control rather than reliance on end-product testing and traditional inspection
methods.
HACCP application ensures that all conceivable risks depending on the whole
production process are under control, and that corrective actions have been
established to avoid product safety hazards. To achieve product compliance with
safety legislation, the maintenance design process has been built to embody safety,
reliability, and maintenance engineering techniques. The application of HACCP and
HAZOP allowed the identification of critical control points dependent on human
errors and production practices (GMPs). The design process identifies and quantifies:
the various types of failures,
the failures distribution,

193
the component/part life time,
the categories of causes and
the link between causes and effects on product packed.
Potential and Functional failures have been identified and the effects produced by
each failure mode have been scored together with corrective and preventive measures.
Safety & Reliability analysis carried out through HACCP and RCM allowed a global
evaluation of failures effects to identify a Risk Priority Number, which embodies both
product safety and equipment reliability issues. The Failure Mode Effect and Hazard
Analysis (FMEHA) form have been designed to answer the specific needs in the
Aseptic Liquid Food industry. This form list Safety & Reliability priorities based on
global criticality due to the effects produced by different failure modes found during
the analysis. Predictive, preventive, and corrective maintenance tasks have been
designed as solution to increase resistance to failure, to reduce equipment failure
probability and to establish product safety compliance.
8.2.3 Solutions to risks depending on human factor
The research findings show that risks associated to human behaviour can be reduced
through the use of condition monitoring systems and sensors to automatically monitor
critical parameters normally under human control. To avoid loos of control of critical
parameters, such as those linked with machine sterilization or package integrity, this
research suggested the mandatory use of on-line monitoring systems. These represent
the most cost effective approach, based on the evaluation of the following criteria:
the frequency distribution of failure
the effects of failure on product quality and safety
the effects of failure on equipment and production activity
the probability to detect the failure under consideration.
To reduce human error probability and improve maintenance effectiveness, different
condition monitoring techniques, such as infrared thermography, vibration, and oil
analysis have been examined to determine higher maintenance reliability. The
integration of these techniques represents a solution where the high criticality under
consideration does not allow to leave minimum risks depending on human factor.

194
8.3 Conclusions about the critical factors to manage during the
design and implementation process
Figure 53, in Chapter Seven, displays the three main company’s dimensions in food
manufacturing companies. Maintenance design and implementation process could
suffer of variations and instability if the critical elements identified as “restraining
forces” are not managed through a holistic view of manufacturing reality. The
solutions found to this problem have been showed in chapter seven and summarized
here below.
8.3.1 Solution to technical drawbacks
One common drawback depending on lack of technical documentation and standards
is normally referred to customized equipments. The problem identified depends on:
lack of clear technical specifications on mechanical and electrical settings
lack of reliable standards on operational and quality practices
lack of training or service support
poor equipment performance due to poor and unstable reliability.
This problem can easily determine an unreliable maintenance design together with
low production effectiveness and product safety. The solution found suggested the
involvement of the equipment designer to identify the unreliability causes and an
improvement program to upgrade the equipment up to an acceptable reliability level.
A more structured solution found consists in the implementation of the following
procedures:
1. Production audit
2. Production stop categorization
3. Production stop prioritization
4. Analysis of priorities
5. Equipment improvement.
If the equipment supplier is not available the above procedures can be implemented
by the company’s specialists.

195
8.3.2 Solution to organizational drawbacks
The problem found is based on inertia and bureaucracy introduced by traditional
boundaries among different departments, on narrow definition of roles and functions,
which not allows the equipment operators to be involved in maintenance activities.
The concept: “I produce and you repair”, well established because of narrow view of
equipment operator role, is often the cause of low equipment efficiency and
availability. The solution found to avoid this organizational and cultural drawback
consists in the top management commitment in establishing the new operator role and
in leading the whole organization to a wider participation of people for a real
integration between equipment operators and company’s specialists. This solution
enables the maintenance function to be enlarged to include all personnel working in
the company. A master plan for an effective maintenance implementation, a regular
monitoring activity to verify if maintenance checklists are effectively implemented,
represent some of the tasks under management responsibility.
8.3.3 Solution to cultural drawbacks
The problem found showed that lack of basic maintenance engineering knowledge
about positive results on production effectiveness and product safety, is often the
cause that prevents the company’s management to motivate different categories of
employees and support them in the design and implementation phases.
Solution to old management culture
The solution found to overcome problems depending on reactive approach, on short
term problem fixing, consists in the use of Field Force Analysis (FFA) technique:
to list the cultural restraining forces in the organization,
to carry out an analysis of the negative forces
to identify the positive countermeasures necessary to move from a state of
inefficiency to a state of production effectiveness.
Figure 54, in Chapter Seven, shows the basic approach to this solution.
Solution to lack of workforce commitment
The research showed that commitment of workforce could be a problem if the
hierarchies of needs that affect job performance and promote employees

196
empowerment, as a key issue to achieve company’s objectives, is not well established
in the company.
The solution found to get an effective commitment of every employee involved in the
maintenance design and implementation process is based on:
Ability to look for a longer-term relationship with company’s organisations
and workforce
A much stronger sense of “shared destiny” among the parties involved.
The research shows that work systems based on team working and quality circles,
where the responsibility for product quality and safety lies with production workers,
enable people to move from a position of “follower” to “enabler”.
Solution to establish a close co-operation between equipment operators and
maintenance specialists
Despite maintenance design and implementation process call for a close co-operation
between equipment operators and maintenance specialists, the problem shows that
operators and specialists often have rigid pattern of skills and both do only those
activities designated as their own. The solution, suggested the implementation of
autonomous maintenance (AM) and GMPs, carried out by the equipment operators
with the support and co-operation of maintenance specialists. The AM activities
promote a real integration of these two roles removing the cultural boundaries existing
between production and maintenance departments.
8.4 Conclusions about the research problem
The analysis of ALF production environment underlined the importance of
maintenance in determining both product safety and equipment reliability. Primary
and secondary literature search showed the research problem that no literature is
available to address and solve the criticalities of the ALF production lines through a
maintenance process.
The maintenance design and implementation process for ALF represents the answer to
the main research problem because of the following conclusions:

197
1) The design process integrates product safety techniques, such as HACCP and
HAZOP to put under control CCPs and to determine, as result, highest end
product quality and safety
2) The integration of some maintenance engineering and product safety
techniques enable us to weight product safety and equipment reliability risks
3) The qualitative and quantitative analysis done allowed to define a maintenance
prioritization necessary to identify maintenance tasks that answer the need of
safety and reliability at reasonable cost
4) The condition monitoring systems and sensors have been used to control
critical equipment functions to improve the overall maintenance effectiveness
5) The empowerment of the equipment operator role, and its integration with
quality and maintenance specialists produced, as result, the effective
implementation of autonomous maintenance procedures able to address and
control ALF criticalities.
6) The KPIs used to measure equipment and maintenance effectiveness allow to
measure efficiency, quality and cost elements that make the process
particularly effective for food industries.
8.5 Possible solutions
The application of the mentioned solutions can be done through a set of maintenance
procedures to implement maintenance tasks in the aseptic liquid food packaging lines
context. A maintenance system is not only made up by a set of maintenance
procedures, but from three other basic components:
1) A software program which prints out the check lists and records the service
results for each maintenance occasion (AM plus all types of maintenance).
2) A production line monitoring system to measure equipment effectiveness, and
able to supply information for continuous improvement of maintenance
check lists.
3) A working team responsible to implement and improve the maintenance
check list content.
Figure 75 below shows the relationship among the different components which make
up this maintenance system.

198
Figure 75: Check list implementation and improvement
Software Program
The maintenance tasks designed are normally stored in a software programme which
enable to print out the specific check list for each service and to records the service
results at each maintenance occasion.
Figure 76 below, shows a FMEHA form referred to a single component: since the
RPN result is higher than the established limit (40), the corrective action decided is an
AM check to be carried out by the equipment operator on a daily base. This
improvement action produced an RPN reduction, from 64 to 32.
The maintenance design activities are stored in the software together with the
maintenance check lists that show the maintenance tasks identified for each
maintenance occasion.
FMEHA - Failure Modes Effect and Hazard Analysis (FMECA + HACCP)
Other Areas Involved
Prepared By
Description of:
(1) Part/Process
(2) CCP
(3) Operational
Practice
Process
Purpose
Identify the Potential
Hazards:
(B) Biological
(C) Chemical
(P) Physical
Critical Limits
for each CCPDeviations
Potential
Failure
Mode
Potential
Effects of
Failure(s)
Se
ve
ri
ty
Potential
Causes of
Failure
Oc
cur
ren
ce
Current
Controls
Existing
monitoring
procedures
Frequency
De
tect
ion
RPN
Sealing
Inductors
Package
Sealing B
Electrical:
(see EM 6.32)
Mechanical:
(see MM 5.20)
Electrical:
+/- 10%
Mechanical:
+5%/-7%
(a) wrong
settings
(b) physical
damages
(c) Ca or PE
residues
Bad seals
Package
with micro
holes.
Product
unsterility 8
Electrical,
Mechanical,
Human error 4
Weekly
1000
hours
Electrical:
continuous.
Mechanical:
W, 1000
work. Hours
Electrical:
Automatic
Mechanical:
Weekly/
Manual 2 64
20125/050V 6425/02
Series No./Dev.Step Engineering Release Date
PACKAGE SEALING A.Bianchi
Part or Process name Design/Manufacturing Resp.
Implementation of
Check List (CL)
Content
Maintenance
Procedures
Equipment Effectiveness
Measurement
Facts & Figures from
Production Line Monitoring
Team
Analysis
Continuous
Improvement
of CL content

199
Other Areas Involved
Prepared By
Recommended
Action(s)
Area Individual
Responsibility
& Completion
Date
Actions
Taken
Se
ve
ri
ty
Oc
cur
ren
ce
De
tect
ion
RPN
Daily checks,
included in the
AM check list
Production:
Equipment
Operator
Definition of:
- AM check
content
- Op.training
- Tools
necessary 8 4 1 32
08/04/2011
FMEA Date
Maintenance Dep./Quality Milk Dairy
Suppliers & Plants Affected
Figure 76: FMEHA form for sealing inductors
Figure 77 below shows an example of check list form with the following information:
Description of maintenance tasks,
Identification of technical documentation to be used as reference guide,
Other information such as the time interval,
A field to be filled with service result implemented
A field with explanatory notes.
As soon as historical information are gathered, statistical figures can be obtained, to
measure the component life time, the maintenance adjustment frequency, for each
task, and the average time spent for each service activity.
Figure 77: Maintenance check list form

200
Production Line Monitoring
The purpose of this system is to:
measure equipment efficiency and effectiveness through the performance
indicators already examined: MTBF, MTTR and MWT
support continuous improvement of maintenance tasks through the analysis of
the information provided by the system.
Working Team
A working team, composed by operators and specialists, responsible to carry out
different maintenance activities, is a mandatory organizational tool to successfully
implement the preventive, predictive and corrective maintenance procedures.
The team should be able to start and continuously improve the system. According to
Figure 78, the activity of the team is not spent only in starting the system, but in
pursuing its continuous improvement through the constant analysis of production line
monitoring indicators.
Figure 78: Working team goals
Figure 79 below summarizes the main features of a maintenance management system
which embodies the three main elements:
Maintenance Improvement Team
Efficiency Improvement
Task lists Improvement
Elimination of Failures
Predictable costs
Reduction of Spare parts consumption

201
software program,
production line monitoring,
working team.
Figure 79: Maintenance Management System
The Figure above shows that:
maintenance tasks designed are planned according to check lists content,
a maintenance report, compiled by equipment operators and specialists,
contains the service activities implemented,
service results are stored in the maintenance software program,
periodical analysis of KPIs enable the working team to identify the
improvements areas where upgrades and updates can be introduced,
improvements are stored in the system and spread in the check lists content.
Productive Maintenance System
Maintenance
Evaluation
MaintenanceReport
MaintenanceCheck Lists
Computer Based Evaluation
Improvement

202
8.6 Contribution to knowledge
Following a literature review, this research identified an important gap in the existing
knowledge and regarding the lack of a maintenance process able to manage product
safety and equipment reliability critical issues of the ALF packaging lines. Numerous
researchers have focused their attention to maintenance engineering and reliability
techniques highlighting the contribution of maintenance in achieving manufacturing
effectiveness, but no maintenance process has been designed to manage the
criticalities existing in the ALF production lines. Through the research methodology,
based on analysis of different case studies, the research showed that low maintenance
effectiveness could have dramatic effects on final product safety and on equipment
reliability. The analysis showed that consumer’s health could be affected by the
biological, chemical, and physical risks existing in the packaging line, which can
determine product safety problems. The scope of the research was to explore the gap
existing between theory and real ALF maintenance status in industry to identify a
process to design and implement maintenance tasks able to put under control food
safety and equipment reliability critical points. The contribution to knowledge
produced by this research is due to the definition of a maintenance process to design
and implement maintenance tasks for the ALF packaging lines. This process allows to
fill the knowledge gap providing a route map to design and implement maintenance
tasks to manage ALF criticalities. Contribution to knowledge is mainly due to the
following issues:
a) Maintenance design based on safety and reliability analysis
The process to design maintenance tasks is based on safety and reliability
analysis. HACCP, HAZOP, RCM, and other quantitative and qualitative
techniques have been originally integrated to identify the equipment CCPs,
their effects on product safety, on equipment reliability, and maintenance
activities to put CCPs under control.
b) Maintenance implementation based on autonomous maintenance for
ALF environment
The autonomous maintenance (AM) has been designed to empower the
equipment operator role to maximize maintenance implementation
effectiveness for ALF packaging lines. The AM phases allow the equipment
operator to become the main equipment owner in managing safety and

203
reliability issues. The process identified represents an original way to
implement maintenance tasks designed for ALF packaging lines.
c) The KPIs used to measure equipment and maintenance effectiveness
The KPIs, used to monitor equipment and maintenance effectiveness,
measure availability, productivity, and quality factors to constantly monitor
product safety and equipment reliability. The KPIs identified allow to display
the added value of the maintenance process, the positive effects on product
safety and equipment reliability.
8.7 Future research and work
This research identified a maintenance design and implementation process for aseptic
liquid food industry. This process has been designed to address and manage the
criticalities existing on production lines for packing liquid food intended for human
consumption. Quality techniques, have originally been integrated with maintenance
engineering techniques, to define a maintenance design process able to identify
product safety risks and to design maintenance tasks to put these criticalities under
control. The author of this research is strongly convinced that this work shown the
way to manage the food industry criticalities, dependent on equipment and operational
practices, through a reliable maintenance process. Future research can be done to
continue the integration of maintenance engineering and safety techniques to pursue
product safety and equipment reliability goals for food industry sectors. Further
research could, perhaps, investigate different types of risks and find specific solutions
to put these risks under control through maintenance. In this regard, maintenance is to
be seen as a key tool to put product safety risks, dangerous for human health, under
control. The implementation process has been designed to avoid to loose the benefits
produced by the design phase and to add value through a proper definition of roles,
tasks, and procedures to be implemented on the ALF equipments. Further research in
this area can investigate if the conclusions of this research could be differentiated and
customized for different food industry fields. This research drawn the way to highlight
the role that maintenance can play in determining, through a maintenance design and
implementation process, product safety and equipment reliability, we hope that this
work could represent a modest contribution to create further stimuli for other
activities in this important industry field.

204
The intention of the writer is to work on two future projects:
1. A design solution for maintenance tasks for food industry
This tool should allow to easily design maintenance tasks according to different types
of criticalities taken into consideration.
2. An implementation solution for maintenance tasks
The process to implement the task list designed pointed out the need to empower the
equipment operator role through AM and its integration with company’s specialists.
The definition of roles, activities, and the level of integration between equipment
operator and other company’s specialists represent another important area where this
work can add further value.
8.8 Publications arising from this work
The work done with this research produced an article titled: “Product Safety &
Equipment Reliability in Food Industry through Maintenance Engineering” and
introduced in the appendix. This work summarizes the process, conceived in this
research, to design maintenance tasks for ALF packaging lines, and it is addressed to
all maintenance specialists and managers who wish to use maintenance as a tool to
design product safety and equipment reliability.
This script has been published by the “Maintenance Engineering/Maintenance &
Asset Management Journal, (UK) Issue 1, Jan/Feb. 2011. This script will also be
published on Asset Management and Maintenance Journal (Australia) between July
and October 2011. Another work, written by the author of this research, has been
published in Italy, titled: “Maintenance Strategies for Liquid Food Equipments” by
the magazine: “Food Technologies”, Issue April/May, 1997.
8.9 Limitations
This research is addressed to ALF industry’s environment, the maintenance design
and implementation process have been conceived to provide a reliable answer to the
hazards in this industry sector. Biological, chemical, and physical risks of products
packed are the main criticalities taken into consideration and the focus given to this
goal could represent a limitation to taking into consideration other critical factors
normally in place in other industries. A maintenance design and implementation
process for automotive industry, can, for instance, introduce different concepts of

205
safety and reliability with different solutions to manage different degrees of safety and
reliability. Moreover, within the food industry field, there could be different
equipments and products with other type of risks that could require the application of
other techniques necessary to better manage the criticalities not taken into
consideration in this research.
8.10 Summary
This chapter summarized the research questions and solutions. The solutions found in
the maintenance design and implementation process, enable the food companies to
manage the product safety hazards and reliability problems existing in the ALF
packaging lines. The analysis of equipment failures, of their effects on product safety
and equipment reliability, has been done through HACCP, HAZOP, and maintenance
engineering techniques. To insure a reliable management of biological, chemical, and
physical risks of product packed, qualitative and quantitative analysis of failures have
been integrated in a design process able to weight them, and their consequences. The
design of maintenance task lists represents the answer to the research questions
addressed by the analysis of different case studies. The maintenance design process
fills the gap found in the literature, regarding lack of a maintenance process designed
for ALF industry, and represents a reliable tool to use to put under control the critical
variables of the ALF packaging lines. The technical, organizational and cultural
criticalities, identified in the ALF environment, have been put under control through
the implementation process designed to ensure an effective implementation of the
maintenance task list designed. Condition monitoring systems and sensors were
examined to answer the need to reduce the risks depending on human factors and to
improve the global maintenance effectiveness. The maintenance implementation
model identifies the key company’s roles to implement maintenance tasks and calls
the equipment operator to become the main equipment owner in the implementation
of maintenance activities designed. Autonomous maintenance represents a powerful
tool of the implementation model since it allows a reliable implementation of task lists
designed through equipment operators and company’s specialists. The KPI’s
identified in the implementation process provided the way to measure production line
and maintenance effectiveness. The maintenance design and implementation process

206
represents the answer to the gap existing in the literature and the solution to manage
the ALF critical factors showed by the case study analysis.

207
REFERENCES
1) Food and Agriculture Organisation of the United Nations, World Health
Organisation. (1993), Codex Alimentarius, (2nd edition).
2) EEC Council Directive (1992), 92/46.
3) EEC Council Directive (1993), 93/43.
4) Food and Drug Administration (FDA), (1984), Aseptic processing and packaging
systems in federally inspected meat and poultry establishments.
5) Morris, C.E. (1996), The state of food manufacturing, Midwest Editor, Published
by Food Engineering Journal.
6) Food Safety Management (January 2009), Foundation for food safety
certification, Gorinchem, the Netherland, Food Safety System Certification
(FSSC22000), Available at: http://www.foodsafetymanagement.org [Accessed 18
July 2009].
7) Loveday, G. (1985), Electronic testing and fault diagnosis, pp.19-33, Pitman.
8) N.A.S.A. (2000), Reliability Centered Maintenance: Guide for facilities and
collateral equipment.
9) World Health Organisation (1993), Training considerations for the application of
the hazard analysis critical control point system to food processing and
manufacturing.
10) Blanchard C. (2007), The HAZOP (Hazard and Operability) method. AcuTech.
11) James V. Reyes-Picknell. (March 2005), The Value of RCM in Business Today,
Available at: http://www.consciousasset.com [Accessed 25 September 2007].
12) Nowlan, F. Stanley and Heap, Howard F. (1978), Reliability Centered
Maintenance: Dolby, Access Press.
13) Galley M. Plucknette D.J. (November 2008), Reliability Centered Maintenance
and Root Cause Analysis: working together to solve problems, ThinkReliability,
Available at: http://www.thinkreliability.com [Accessed 13 January 2009].
14) Le Pree, J. (1996), Reliability Centered Maintenance, Food Engineering Journal.
15) Moubray J. (1997), Reliability Centered Maintenance, Industrial Press, Inc., New
York City.
16) Life Cycle Institute (2009), Failure Report Analysis and Corrective Action System
(FRACAS), Life Cycle Engineering, Available at: http://www.LCE.com [Accessed
27 December 2009].
17) Open University (1997), Block 7: Reliability and Testing, Quality, Course T834.

208
18) Roymech (2008), Failure Distributions, Available at:
http://roymech.co.uk/Useful_Tables/ARM/Failure_Distributions [Accessed 8
September 2008].
19) Keeter B. Plucknette D.J. (June 2009), The Seven questions of reliability centered
maintenance, Allied Reliability, Available at:
http://www.alliedreliability.com/2009 [Accessed 10 August 2009].
20) GPAllied (August 2009), Why RCM doesn’t Work? Available at:
http://www.gpallied.com [Accessed 12 February 2010].
21) Galley M. (2007), Improving on the fishbone Effective Cause-and-Effect Analysis:
Cause Mapping, ThinkReliability, Available at: http://www.thinkreliability.com
[Accessed 7 January 2008].
22) Instructor Blog (February 2009), Root Cause Analysis, Available at:
http://www.thinkreliability.com [Accessed 11 April 2009].
23) Al-Najjar, B. (1996), Total Quality Maintenance: An approach for continuous reduction
in costs of quality products. Journal of Quality in Maintenance Engineering, 2-20, Vol 2,
Number 3.
24) Berk J.H. and Associates, Systems Failure Analysis. Available at:
http://www.jhberkandassociates.com/systems_failure_analysis.htm [Accessed 9
March 2009].
25) Japan Institute of Plant Maintenance (1991), Applichiamo il TPM, Milano:
FrancoAngeli Editore.
26) Nakajima, S (1992), TPM Total Productive Maintenance.
27) Tetra Pak Training Dep. (1999) Training Material on TPMS.
28) Maggard, B.N. (1992), TPM that works: theory and design of TPM, Pittsburgh:
TPM Press.
29) Tetra Pak Training Dep. (2002) Training Material on WCM.
30) Mora E. (June 2009), TPM definition & procedures leadership environment for
success, Available at: http://www.TPMonline.com [Accessed 20 November 2009].
31) Al-Najjar, B. Presentation - Terotechnology (Systemekonomi). Available at:
http://solescandinavia.org/pdfdokument/18-1%20Basim1.pdf [Accessed 21
October 2008].
32) Blanchard, B.S. (1978), Design and manage to Life Cycle Cost, M/A Press, Forest
Grove.
33) Tetra Laval Group, Operational characteristics & performance measurements,
Tetra Pak Company’s Standard, PM 9614.20.

209
34) Engineer Live (June 27, 2008), Condition monitoring is as cost-effective as
insurance. Available at: http://www.engineerlive.com [Accessed 15 March 2009].
35) Predictive Maintenance and Condition Monitoring management (April 2009).
Available at: http://reliabilityweb.com/ee-assets/my-uploads/art09/tips_09
[Accessed 15 January 2010].
36) Engineer Live, (April 16, 2007), Continuous condition monitoring and remote
diagnosis permits the highest availability with the lowest costs, PC Condition
Monitoring for High-Availability Embedded Computer Systems at Minimal
Expense, Eching, Germany.
37) FLIR R&D Handbook (2009). Available at: http://www.flir.com [Accessed 10
December 2009].
38) Lacey S.J. (Nov-Dec.2008), An Overview of bearing vibration analysis,
Maintenance & Asset Management, Vol.23, no.6.
39) N. Tandon, Choudhury A. (2000), A review of vibration and acoustic
measurement methods for the detection of defects in rolling element bearings,
Elsevier Science.
40) Wikipedia, Tribology, Available at:
http://en.wikipedia.org/w/index.php?/Tribology [Accessed 17 Nov.2008].
41) Yan XP, Xie YB, Xiao HL (October 2005), A study of Information Technology
used Oil Monitoring. Tribology International Volume 38, Issue 10, pp. 879-886.
42) Gradner JW. Bartlett PN. (1999), Electronic Noses: Principles and Applications,
Oxford University Press.
43) Reliability HotWire (June 2007), On-Condition Maintenance Using P-F interval
or Failure Detection Threshold (FDT). Available at: http://www.weibull.com
[Accessed 3 June 2008].
44) Physical Assets (May 2007), RCM does not support whole-of-life asset
management. Available at: http://physical-assets.blogspot.com [Accessed 20
March 2008].
45) EFESO Consulting, Milano (1998), World Class Manufacturing: from TPM to
World Class Manufacturing.
46) Riccetti S. (1997), La manutenzione degli impianti alimentary: Rivista Tecnologie
Alimentari, no.4-5, pp.76-82.
47) Leigh, A. (1988), Effective change 20 ways to make it happen, London: Institute
of Personnel Management, pp.158-165.
48) Open University (1995), Block 2: A Model for Change, Implementation of New
Technologies, Course PT621.

210
49) Mac Duffie, J.P. (1991), Beyond mass production: flexible production systems and
manufacturing performance in the world auto industry, (PhD Thesis), MIT.

211
APPENDIX
Appendix A: Product Safety & Equipment Reliability In food
Industry Through Maintenance Engineering
Introduction
Threats coming from increasing regulations on food safety, lead food industry to
design and implement maintenance procedures able to put under control critical
variables linked to food safety and equipment reliability. Since public health can be
heavily impacted by the level of safety and reliability of the equipment used in food
industry, the design and implementation of maintenance procedures represent a
fundamental tool to reach this goal. The consequences produced by food
contamination represent the leverage that call a food manufacturing company to
design and implement maintenance through the use maintenance engineering
techniques instead of relying on experience of expert craftman working in
maintenance field.
The process to design maintenance procedures for food industry
The process used to design maintenance procedures for food industry, have to be
thought in order to put under control all critical variables that might produce product
contamination and low equipment reliability.
Reliability concepts, safety and the maintenance engineering techniques, have been
examined to identify the principles that have to be used in the design process.
Hereafter the process blocks, in Figure A1, highlight the main maintenance design
phases, which lead to the production of maintenance check lists to be implemented in
food industry. The peculiarity of this process, compare to other processes used in
different industrial sectors, lays on the ability to link product safety and equipment
reliability issues to produce an outcome able to address every criticality in place in a
food manufacturing line.

212
Product Safety Identification of Critical
Product Safety Issues
Equipment Reliability Identification of Equipment
Reliability Issues
Product Safety & List of Product Safety &
Equipment Reliability Equipment Reliability Issues
Analysis of Safety & List of Priorities according to
Reliability Priorities Safety & Reliability Analysis
Definition of Maintenance Task Lists
Maintenance Tasks for Food Industry
Figure A1: Maintenance design process for food industry
The first phase has been thought with the intention to implement Hazard Analysis and
Critical Control Points (HACCP) to identify and address all conceivable Critical
Control Points (CCP) that could influence the product safety.
In the second phase, the equipment reliability issues are properly examined through
the application of some maintenance engineering techniques to identify criticalities
owing to equipment components and functions and specific solutions. The third phase
addresses the need to highlight the product safety and the equipment reliability issues
showing both criticalities put together in the same form. In the fourth phase, a list of
priority is developed according to the priorities coming from previous analysis. In the
fifth phase, the design team can develop the maintenance task lists to control food
criticalities owing to product safety and equipment reliability.
Step One: Application of HACCP methodology
Through HACCP methodology, all critical machine parts and components are
identified (CCPs) together with the risk associated to the different failure modes.

213
HACCP identifies and assess specific hazards, estimates risks and establishes control
measures that emphasize product safety through problem prevention and control,
rather than reliance on end-product testing and traditional inspection methods.
Machine parts or components, whose fault may produce biological, chemical or
physical hazard, are examined to devise critical control limits and preventive
maintenance countermeasures. At this design stage, all conceivable product safety
hazards, coming from equipment operation and human behaviour must be identified,
to ensure that:
Equipment
Human (operational) and
External (service & utilities)
criticalities that have a direct impact on biological, chemical and physical
modification of the product filled are listed and examined.
Application of HACCP and HAZOP (HAZard OPerability) techniques enable the
identification of the following issues:
hazards, directly connected to the equipment/system/component functions
identification of CCPs in the equipment operation
critical limits for each CCP
hazards in performing operational tasks
preventive measures to carry out at every maintenance interval
monitoring procedures or devices to detect loss of control at the CCP.
The development of HACCP plan requires seven principal activities to be carried out
by the HACCP team. These activities have to be applied to the process equipment and
to operational tasks to identify CCPs and to establish adequate maintenance
procedures. The principal activities are:
ACTIVITY 1: Conduct hazard analysis, on equipment functions and on operational
tasks to identify hazards (biological, chemical and physical) and specify control
measures
ACTIVITY 2: Identify critical control points (CCPs)
ACTIVITY 3: Establish critical limits at each CCP
ACTIVITY 4: Establish monitoring procedures or condition monitoring devices
ACTIVITY 5: Establish corrective action procedures

214
ACTIVITY 6: Establish verification procedures
ACTIVITY 7: Establish documentation procedures as appropriate.
Activity 1
Listing all hazards and considerations of any control measures to eliminate or
minimize hazards depending on equipment functions and operational tasks. The
hazards considered during this activity are the following:
Biological hazards
It includes all potential sources of product contamination depending on equipment
functions and operational tasks.
Chemical hazards
It includes, among the others, cleaning compounds and sterilization agents.
Chemicals, normally used to sterilize packaging materials, could come in contact with
the food product if critical conditions of some components are not monitored and
inspected through maintenance activities.
Physical hazards
It includes objects, such as metal fragments, glass, that can be found in the product
packed, and that may cut the mouth, break teeth or perforate the package.
The team involved in this activity, must consider all the conceivable sources of
equipment and operational hazard and list them under the three (biological, chemical
and physical) main areas of risk.
Activity 2
After all hazards have been identified, a CCP decision tree module is to be used to
determine whether a CCP can be identified for the specific hazard. If a hazard has
been identified for which no control measure exists, the machine part or component
should be modified so that hazard is eliminated or reduced to acceptable or minimal
levels. The module shown in Figure A2 is a HACCP decision tree normally used for
establishing CCPs. If a CCP regards an operational activity, carried out by the
equipment operator, this have to be clearly described and specific hazard identified.

215
Figure A2: HACCP decision tree to identify CCPs [9]
Critical operational practices need to be defined, without grey areas: adjustment,
registrations, and mechanical settings must be verified and possibly monitored
through automatic monitoring devices.

216
Activity 3
Critical limits must be specified for each control measure at each CCP. In some cases,
more than one critical limit will be specified at a particular CCP. If a critical measure
has a direct impact on other physical parameters, these need to be identified together
with critical limits. It is recommendable that quantity variations are compared with
target levels to ensure that critical limits are met.
Activity 4
Monitoring is the periodic measurement or observation at a CCP to determine whether
a critical limit or target level has been met. The monitoring procedure must be able to
detect loss of control at the CCP. Automatic monitoring devices need to be used
where a physical parameter under control can automatically be measured.
Activity 5
Corrective actions are those actions that need to be taken either when monitoring
results show that a CCP has deviated from its specific critical limit or target level or,
preferably, when monitoring results indicate a trend toward loss of control. Corrective
actions can either be referred to deviations regarding potential hazard or to loss of
control at the specific CCP.
Activity 6
Procedures for verification must be established to ensure that HACCP system is
working correctly. Monitoring and auditing methods should be devised, for
operational practices, to assess if criticalities, control measures and deviations are
under control. Procedures, tests and analysis, can be used to assess if the activities
designed fulfils the safety targets identified for each CCP.
Activity 7
Adequate, accurate record-keeping and documentation are essential to the application
of the HACCP system. Examples of records are: HACCP plan, CCP monitoring
records; a file with deviations; preventive maintenance procedures, included in the
check lists and check lists review.
Application of HACCP methodology represents a mandatory step in the design
process: a basic tool to identify critical issues that may have a relevant impact on food
product safety.

217
Step Two: Application of Reliability Centered Maintenance (RCM)
The outcome coming from the first step is the identification of criticalities associated
to product safety. After identification of CCPs (Biological, Chemical and Physical
risks) linked to the equipment parts and to operational practices, Reliability Centered
Maintenance (RCM) technique enables the analysis of the different failure modes and
their effects on equipment operation. Furthermore RCM supply the right methodology
to define the different maintenance approaches implemented through the task list
content to effectively manage food product safety and equipment reliability issues.
The approach chosen includes the following activities:
1. System selection
Systems and sub-systems in the line will be selected according to HACCP results and
to the priorities identified by the project team.
2. Boundary definition & Operational mode summary
After identification of a machine system, groups and parts directly linked to each sub-
system should be listed to define both components function and system boundaries.
Looking at the equipment type as a simple process with a value-added transformation
of inputs to produce some desired output will help determine the function. An
operational mode summary is a description of the anticipated mix of ways the system
will be used in carrying out its operational role.
3. Failure Analysis
After system boundary definitions, the purpose of this step is the identification of the
existing failures in place in the different equipment sub-systems. Quantitative analysis
of failures through the use of statistical tools will enable to identify the different
sources of variations existing in the equipment or in the production line. The different
control limit thresholds used by Statistical Process Control (SPC), enable to weight
each failure type (Potential and Functional) and to define their probability of
occurrence. As soon as the different types of failure have been identified, we are
ready to proceed with a qualitative analysis of failures. The use of different quality
tools such as Fault Tree Analysis (FTA), Root Cause Analysis (RCA) and Ishikawa or
fishbone diagram will enable to produce a clear understanding of:
- the links existing between causes and effects

218
- the reasons behind each cause
- the link existing between each cause and the global context
- the logical order of the events that produce a failure.
4. Functional and potential failure determination
Because an unsatisfactory condition can range from the complete inability of an item
to perform its intended function to some physical evidence that it will soon be unable
to do so, failures must be further classified as either functional failures or potential
failures.
Functional failure
It is the inability of an item (or the system containing it) to meet a specified
performance standard. This definition requires that we specify a performance
standard, thus generating an identifiable and measurable condition for functional
failures.
Potential failure
It is an identifiable physical condition which indicates that a functional failure is
imminent. The ability to identify a potential failure permits the maximum use of an
item without suffering the consequences associated with a functional failure. In these
circumstances items are removed or repaired/adjusted to prevent functional failures.
Figure A3: Functional and potential failure [15]
Figure A3 above shows the onset of failure regarding a potential failure and time
between potential and functional failure. Since there are so many possible failures a
system can experience, it may be necessary to subdivide the system into manageable

219
segments (components) in order to identify all possible failures. This process is
known as a Work Breakdown Structure (WBS).
5. Failure Modes and Effects Analysis (FMEA)
FMEA or FMECAs (Failure Mode Effects and Criticality Analyses) represent one of
the most commonly used tools in reliability assessment programs. The basic
components of a FMEA consist of some type of hierarchical breakdown, an outlining
of all possible Failure Modes of all elements, and then a determination of the effects
of these failure modes. By using FMEA to assign and categorize failure modes, the
resulting categories can each have a defined plan of action. For example, high risk
items, as those that may result in an unsterile container, must be flagged, and a plan to
eliminate them formulated and deployed. Medium level items may require some type
of detection mechanism to be designed. Low risk items could perhaps require no
action. Main approaches are based on:
Mode Criticality
Mode criticality is a numerical value that can be calculated and applied to each failure
mode. Mode criticalities are based on a FMECA approach defined in MIL-STD-1629,
a commonly used FMECA methodology.
Risk Priority Number (RPN)
Risk Priority Numbers or RPN are also numerical assessments of risk. RPNs are
based on a FMEA such as those defined by SAE, AIAG, and Ford. RPN values range
from 1 to 1000. To use RPNs, the analyst evaluates each failure mode and determines
the Severity, Occurrence, and Detection level in each case. The calculation of RPN is
then defined as: Severity x Occurrence x Detection.
Criticality Rank
Criticality rank is an approach described in the SAE FMEA 5580 document. The
criticality rank is a value based on a multi-criterion, Pareto ranking system. Failure
modes are assessed by the analyst in terms of severity and probability of occurrence.
Risk Level
A risk level assessment technique is introduced in the book FMEA, Failure Modes &
Effect Analysis, Predicting & Preventing Problems before they occur by Paul Palady.
This approach allows the analyst to group failure modes into established categories to

220
ensure that the most critical items are evaluated. By then graphing each failure mode,
they will fall into one of the three graph areas: high, medium, or low. Figure A4
below shows a potential failure mode and effect analysis form used for this purpose.
Process FMEA-Potential Failure Modes and Effects Analysis
Part or Process Name/No
Prepared By Key Production Date
Process Descrip.
Potential Failure
Mode
Potential Effects of
Failure(s)
Potential Causes of Failure Actions
taken
RPN
Recomm. Action(s)
Seve rity
Occur rence
Homogenizer/Piston Head
20121-10215/010 Carlo Rossi 10.02.95
Mechan. treatm.
of
milk fat
globules
Piston
head
breaking
No milk
treatment
leading to: • bad milk
quality
• milk
contamin.
7
• Mechanic.
wear
• Manufact.
problems
4
Preventive
checks:
• teflon seal wear
• mechan.
wear
• piston
stroke
56 42
Design/Manufacturing Resp.
Processing Department
Engineering Release Date
Other Areas Involved
Production , Maintenance
Suppliers & Plants Affected
Production planning,Filling & Deliv.
Series No./Dev.Step FMEA Date
15.03.97 27.03.98
Process Purpose
Current Controls
Detec tion
RPN
Area Individual Respons. &
Completit. Date
ACTION RESULTS
Occur rence
Detec tion
Breaking
of milk fat
globules
Preventive
actions to
check:
• teflon seal
wear
• mechanic.
wear
2
Produc.dep.
5/4/98
Mainten. dep
6/4/98
Mainten. dep
6/4/98
Operator
check
every 250
work.hours
Preven.
maint.
measur.
added
Seve rity
7 3 2
Figure A4: FMEA form
The FMEA form identifies potential failures modes and assesses the potential
customer effects of the failures.
6. Maintenance history and technical documentation review
In this step we examine the necessary reliability data input. Reliability data is
necessary to define the criticality, to mathematically describe the failure process and
to optimize the time between PM tasks. Reliability data include a mean time between
failures (MTBF), mean time to restore (MTTR), and failure rate function. The failure
distributions (Gaussian, Weibull…) are rather flexible, and may be used for detailed
modelling of specific failure mechanisms. However, for most applications the class of
Weibull distributions is sufficiently flexible to be the preferred distribution. From
information gathered during the review of maintenance history and the results of the
failure modes and effect analysis, a maintenance approach for each of the failure
effects can be determined. The value of MTBF, the failure rate and its distribution
will give us an idea of the reliability of the part. More specifically, we can:

221
Calculate the failure rate of each failure mode and decide whether a design
review is desired on a developmental item, and
Decide when the part should be replaced if scheduled replacement is
required.
7. Determine maintenance approach for each failure effect
There are four major components of the Reliability Centered Maintenance program:
- Reactive Maintenance (Corrective Maintenance),
- Preventive Maintenance,
- Predictive Maintenance (Condition Monitoring), and
- Proactive Maintenance.
The RCM logic tree is to be used to determine the maintenance tasks and to logically
work through the tasks likely to be needed to develop RCM program. After creating a
logic tree, four distinct types of maintenance tasks usually result in:
Time Directed Tasks (all preventive maintenance procedures)
This task is generally applied to failure modes that can be restored without the need to
replace the part. Examples in this area include; re-machining, cleaning, flushing,
sharpening, re-positioning, tightening and adjusting.
Condition Directed Maintenance (preventive and CBM)
This task aimed at detecting the onset of failure or the potential failure. Often referred
to as CBM or On-condition Maintenance, the goal is to ensure that the occurrence of
failure modes that have undesirable consequences are predicted so that they can be
mitigated through planned activities.
Failure Finding
This task suggests replacing a physical component in order to restore its function. As
with preventive restoration tasks these are also hard time tasks. Common examples of
tasks include greasing bearings, changing oil filters and oil (if done on a time basis),
and routine light bulb replacement (often but not always).
Running To Failure (decision to run certain components to failure)
These are tasks that are done to detect whether an item has already failed so that
action can be taken. These tasks are only used with items that have hidden functions.
Task selection can be supported by the correct application of different “decision logic
trees” which provide the pathway to identify the right maintenance approach for each

222
failure pattern. A decision logic tree, for task selection, showed in Figure A5 can be
used to identify the criteria needed to apply condition monitoring and time directed
task.
Figure A5: Decision logic for task selection [27]
Many failure modes exhibit signs of warning as they are about to occur. The
methodology to estimate the P (Potential) and F (Functional) interval or Failure
Detection Threshold (FDT), which are two typical ways to describe the detectability
of a failure, is to be introduced. As shown in Figure A6, the time range between P and
F, commonly called the P-F interval, is the window of opportunity during which an
inspection can possibly detect the imminent failure and address it.

223
Figure A6: P-F curve [43]
FDT is a number between 0 and 1 that indicates the percentage of an items life that
must elapse before an approaching failure can be detected. For example, if the FDT is
0.9 and the item will fail at 1000 days, the approaching failure becomes detectable
after 90% of the life has elapsed, which translates to 900 days in this case
(0.9x1000=900). This time period is known as time from onset (Tos) that is the time
at which potential failure is detectable. Figure A7 shows the beginning of Tos as the
point on the slope at which a physical symptom (potential failure) appears. To assure
that an inspection to detect impending failure will occur between the appearance of
potential and functional failure, inspection intervals must be shorter than Tos.
Figure A7: Inspection time interval [15]
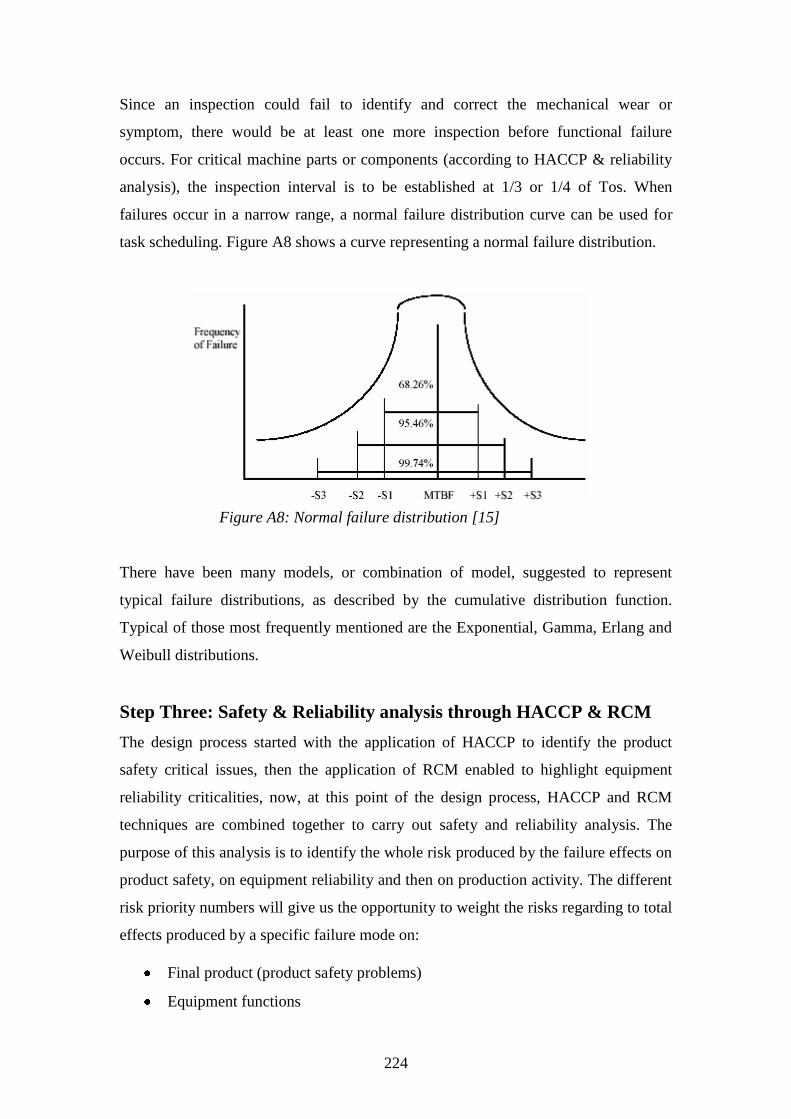
224
Since an inspection could fail to identify and correct the mechanical wear or
symptom, there would be at least one more inspection before functional failure
occurs. For critical machine parts or components (according to HACCP & reliability
analysis), the inspection interval is to be established at 1/3 or 1/4 of Tos. When
failures occur in a narrow range, a normal failure distribution curve can be used for
task scheduling. Figure A8 shows a curve representing a normal failure distribution.
Figure A8: Normal failure distribution [15]
There have been many models, or combination of model, suggested to represent
typical failure distributions, as described by the cumulative distribution function.
Typical of those most frequently mentioned are the Exponential, Gamma, Erlang and
Weibull distributions.
Step Three: Safety & Reliability analysis through HACCP & RCM
The design process started with the application of HACCP to identify the product
safety critical issues, then the application of RCM enabled to highlight equipment
reliability criticalities, now, at this point of the design process, HACCP and RCM
techniques are combined together to carry out safety and reliability analysis. The
purpose of this analysis is to identify the whole risk produced by the failure effects on
product safety, on equipment reliability and then on production activity. The different
risk priority numbers will give us the opportunity to weight the risks regarding to total
effects produced by a specific failure mode on:
Final product (product safety problems)
Equipment functions

225
Production activity (interaction between equipment and packages).
Table A1 shows a form which combines both FMECA (Failure Modes Effect and
Critical Analysis) with some of meaningful HACCP and HAZOP criteria. This form
has been called FMEHA (Failure Mode Effect and Hazard Analysis) and it provides
the opportunity to identify all conceivable problems depending on equipment, on
operational reliability and on product safety.
FMEHA - Failure Modes Effect and Hazard Analysis (FMECA + HACCP)
Description of:
(1) Part/Process
(2) CCP
(3) Operational
Practice
Process
Purpose
Identify the
Potential Hazards:
(B) Biological
(C) Chemical
(P) Physical
Critical Limits
for each CCPDeviations
Potential
Failure
Mode
Potential
Effects of
Failure(s)
Se
ve
ri
ty
Potential
Causes of
Failure
Oc
cur
ren
ce
Current
Controls
Existing
monitoring
procedures
Frequency
De
tect
ion
RPNRecommended
Action(s)
Area Individual
Responsibility
& Completion
Date
Actions
Taken
Se
ve
ri
ty
Oc
cur
ren
ce
De
tect
ion
RPN
Part or Process name Design/Manufacturing Resp. Other Areas Involved Suppliers & Plants Affected
Series No./Dev.Step Engineering Release Date Prepared By FMEA Date
Table A1: FMEHA form designed for food industry
The purpose of this form is to record both equipment reliability and product safety
issues to highlight all the criticalities in place, to gain, as result, a global view and a
total Risk Priority Number (RPN) based on CCP and critical reliability issues
identified in the design process.
Step Four: List of Priorities (Safety & Reliability analysis)
As result of a combined analysis of product safety and equipment reliability issues,
we now obtained a risk priority number which embody both HACCP and RCM
criticalities. At this point, as shown in Table A2, we carry out the analysis of different
failure modes effects, based on equipment reliability and on product safety, to
produce a list of priorities based on RPN scoring.

226
List of Priorities (Safety and Reliability issues)
Part or Process
Description
HACCP Hazard
(B, C, P) &
Reliability Risk
Se
veri
ty
Occ
urre
nce
Det
ecti
on
RPN
Condition
Monitoring
Tools
Critical Limits
or
Warning Limits
Competence
Level Required
Time/Cycle
Interval
Maintenance
Actions
(Chk, Adj, Rep)
Tools &
Templates
Potential Effects of Failure
(to be kept under control)
Series No./Dev.Step Engineering Release Date Prepared By Date
Equipment Name (System) Design/Manufacturing Resp. Sub-System Areas Involved
Table A2: List of Priorities
The form showed in the table above, describes (from the left):
- the part or the process taken under consideration,
- the hazard type (B, C and P),
- the RPN found,
- the potential effects produced by that failure,
- the condition monitoring tools used
- the tools and templates available to carry out maintenance activities (objective
tools for measurements)
- the critical or warning limits to be monitored or checked
- the competence level required (operator or technician, electrical,
mechanical…)
- the time (working hours) interval or No. of cycles at which a maintenance
need to be planned
- the maintenance action devised in the previous section.
Since through RCM analysis we already split the equipment/line or system into
different sub-systems, groups, component functions and system boundaries, at this
step of the design process, a list of priorities is to be defined for each sub-system. This
activity will represent a sort of bridge between step 3 and 5 to enable the designer to
move forward in the design process and to display the criticalities in place within the
different sub-systems defined in the equipment.
Step Five: Design of Maintenance Tasks
As result of the design activities carried out in the previous steps, we identified the
functions that the equipment is intended to perform, the ways that it might fail to

227
perform the intended functions and the evaluation of the consequences of these
failures. The next step is to define the appropriate maintenance strategy for the
equipment parts and components analyzed in the design process. The RCM guidelines
include task selection logic diagrams based on the Failure Effect Categorization, these
tools provide a structured framework for analyzing the functions and potential failure
modes for the equipment parts under consideration in order to develop a scheduled
maintenance plan that will provide an acceptable level of operability, with an
acceptable level of risk, in an efficient and cost-effective manner. According to Figure
A9 below, from the original RCM report we are provided four basic routine
maintenance tasks:
1. On Condition or Condition Based Maintenance task
2. Preventive or Scheduled Restoration
3. Preventive Replacement
4. Detective and Run to Failure Maintenance.
Figure A9: Decision Logic Tree [19]
Predictive Maintenance
This task aimed at detecting the onset of failure or the potential failure. Often referred
to as Condition Based Maintenance (CBM) or On-Condition Maintenance, the goal is
to ensure that the occurrence of failure modes that have undesirable consequences are

228
predicted so that they can be mitigated through planned activities. Where applicable,
the use of on line and condition monitoring systems will enable to detect the deviation
of physical parameters (temperature, vibration, oil residues…) more effectively.
Preventive Restoration
This is the task necessary to restore a machine original resistance to failure based on
some measure of hard time, such as calendar hours, running hours, or litres pumped
for example. This task is generally applied to failure modes that can be restored
without the need to replace the asset. Examples in this area include: re-machining,
cleaning, flushing, sharpening, re-positioning, tightening and adjusting. Often
preventive restoration task can include calibration where this is done on a hard time
basis.
Preventive Replacement
This task addresses the replacement of a physical part in order to restore its resistance
to failure. As with preventive restoration tasks these are also hard time tasks.
Common examples of preventive replacement tasks include greasing bearings,
changing oil filters and oil (if done on a time basis), and routine light bulb
replacement (often but not always).
Detective Maintenance or Run To Failure (RTF)
These are tasks that are done to detect whether an item has already failed so that
action can be taken. These tasks are only used within the four categories on the hidden
side of the RCM decision diagram and are not referred to in the four categories on the
evident side at all. Detective tasks include proof testing of critical instrumentation and
the occasional running of stand by pumps. Although often associated with safety
related failures this is not always the case. Within RCM it provides the last line of
defence for routine maintenance when a failure mode cannot be predicted or
prevented.
The content of the tasks can be further improved through the continuous improvement
activity based on collection of historical figures, to combine quantitative and
qualitative analysis necessary to update and upgrade the quality of the designed
maintenance tasks. Figure A10 summarizes the described process steps to design
maintenance procedures.

229
HACCP
Hazard Analysis
&
Critical Control Points
Identification of CCPs
Have all critical factors
been considered for HACCP
analysis?
Residual CCPs
to be added to the
HACCP process
HACCP RESULTS
CCPs associated to
biological, chemical &
phisycal risks
HACCP + RCM
Safety & Reliability
Analysis
Yes
No
Definition of
Maintenance Tasks
Design of Maintenance
Task Lists
Identification of
RCM priorities
Have all components
been considered for
RCM analysis?
Residual RCM
components to be
added to RCM process
RCM RESULTS
CCPs associated to
biological, chemical &
phisycal risks
Yes
No
RCM ANALYSIS
Reliability analysis based
on FMECA
LIST OF PRIORITIES
Safety & Reliability
Analysis
Design Phase
based on
HACCP & RCM
Analysis
RPN referred to
safety & reliability
issues
Prioritisation
Safety & Reliability
issues
Definition of
task list content
Figure A10: Process to design maintenance task list for food industry