Design of Cantilever Sheet Pile Walls - January 2015 · PDF fileDesign Example of Cantilever...
37
Design of Sheet Pile Walls Using TRULINE Composite Wall Sections – Design Methods and Examples A Report Presented to Formtech Enterprises, Inc./ TRULINE 126 Ben Burton Circle Bogart, Georgia 30622 by Ensoft, Inc. 3003 Howard Lane Austin, Texas 78728 January 2015 (Update 3)
-
Upload
hoangduong -
Category
Documents
-
view
268 -
download
2
Transcript of Design of Cantilever Sheet Pile Walls - January 2015 · PDF fileDesign Example of Cantilever...
Design of Sheet Pile Walls Using TRULINE Composite Wall Sections –
Design Methods and Examples
A Report Presented to
Formtech Enterprises, Inc./ TRULINE 126 Ben Burton Circle Bogart, Georgia 30622
by
Ensoft, Inc. 3003 Howard Lane
Austin, Texas 78728
January 2015
(Update 3)
ii
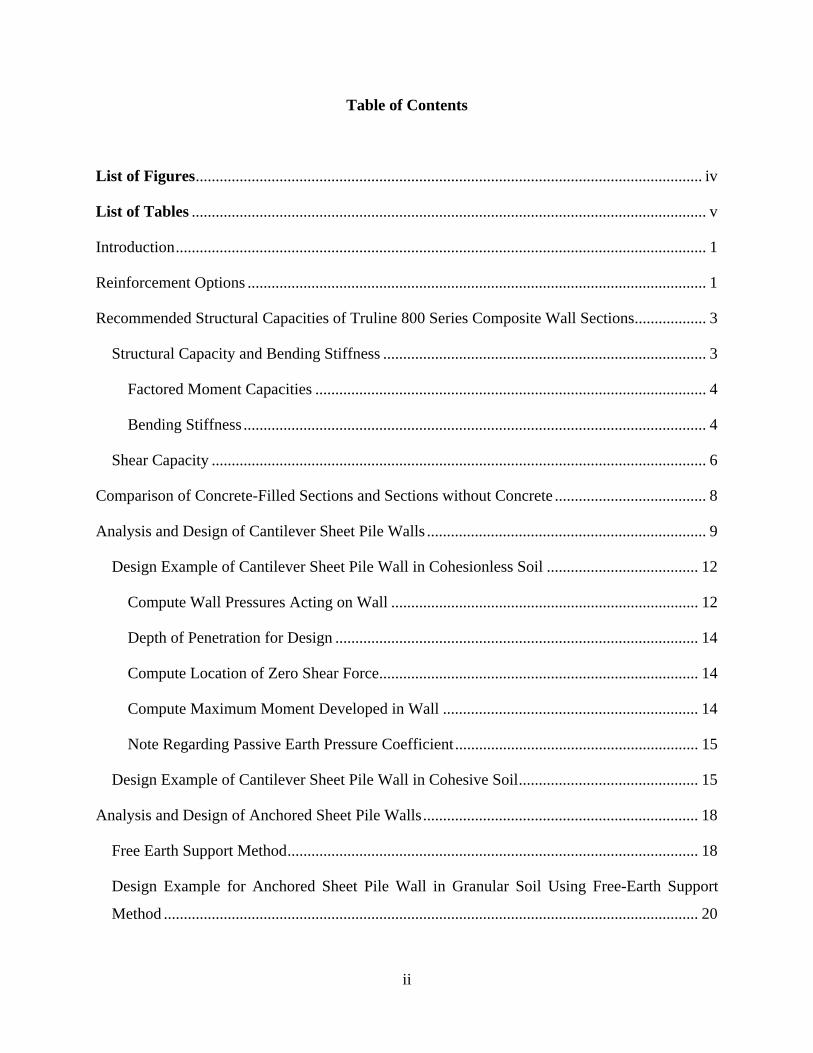
Table of Contents
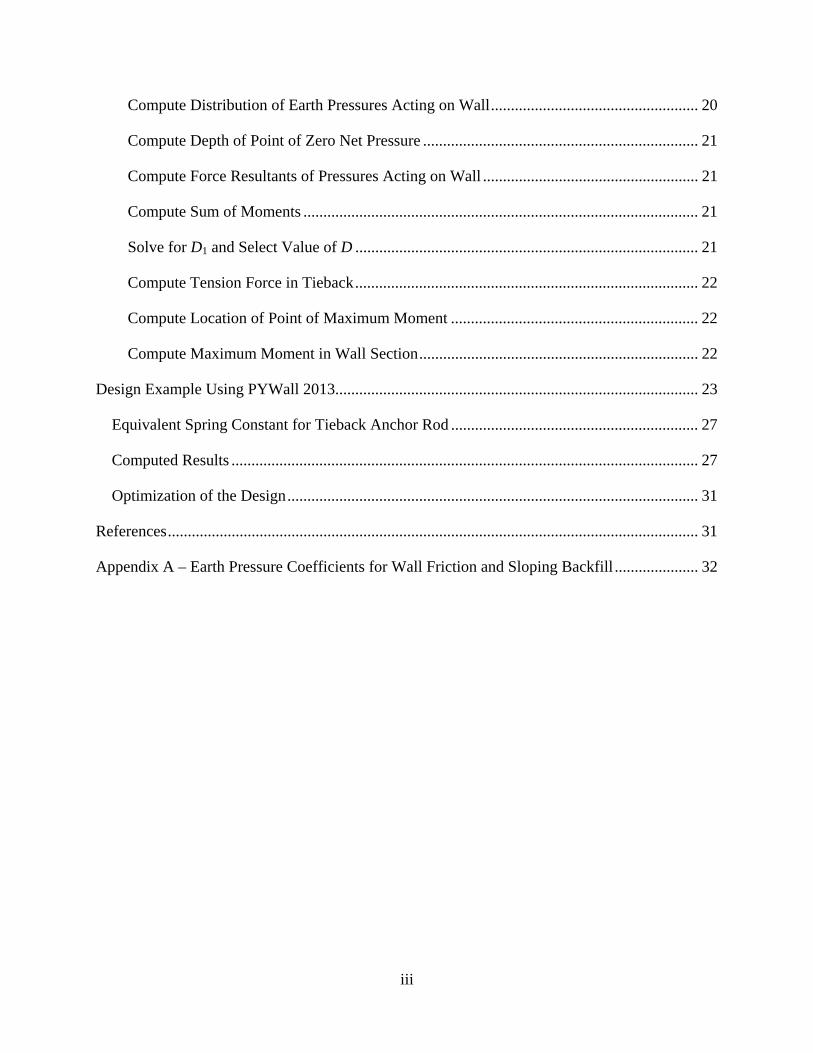
List of Figures ............................................................................................................................... iv
List of Tables ................................................................................................................................. v
Introduction ..................................................................................................................................... 1
Reinforcement Options ................................................................................................................... 1
Recommended Structural Capacities of Truline 800 Series Composite Wall Sections .................. 3
Structural Capacity and Bending Stiffness ................................................................................. 3
Factored Moment Capacities .................................................................................................. 4
Bending Stiffness .................................................................................................................... 4
Shear Capacity ............................................................................................................................ 6
Comparison of Concrete-Filled Sections and Sections without Concrete ...................................... 8
Analysis and Design of Cantilever Sheet Pile Walls ...................................................................... 9
Design Example of Cantilever Sheet Pile Wall in Cohesionless Soil ...................................... 12
Compute Wall Pressures Acting on Wall ............................................................................. 12
Depth of Penetration for Design ........................................................................................... 14
Compute Location of Zero Shear Force ................................................................................ 14
Compute Maximum Moment Developed in Wall ................................................................ 14
Note Regarding Passive Earth Pressure Coefficient ............................................................. 15
Design Example of Cantilever Sheet Pile Wall in Cohesive Soil ............................................. 15
Analysis and Design of Anchored Sheet Pile Walls ..................................................................... 18
Free Earth Support Method ....................................................................................................... 18
Design Example for Anchored Sheet Pile Wall in Granular Soil Using Free-Earth Support
Method ...................................................................................................................................... 20
iii
Compute Distribution of Earth Pressures Acting on Wall .................................................... 20
Compute Depth of Point of Zero Net Pressure ..................................................................... 21
Compute Force Resultants of Pressures Acting on Wall ...................................................... 21
Compute Sum of Moments ................................................................................................... 21
Solve for D1 and Select Value of D ...................................................................................... 21
Compute Tension Force in Tieback ...................................................................................... 22
Compute Location of Point of Maximum Moment .............................................................. 22
Compute Maximum Moment in Wall Section ...................................................................... 22
Design Example Using PYWall 2013........................................................................................... 23
Equivalent Spring Constant for Tieback Anchor Rod .............................................................. 27
Computed Results ..................................................................................................................... 27
Optimization of the Design ....................................................................................................... 31
References ..................................................................................................................................... 31
Appendix A – Earth Pressure Coefficients for Wall Friction and Sloping Backfill ..................... 32
iv
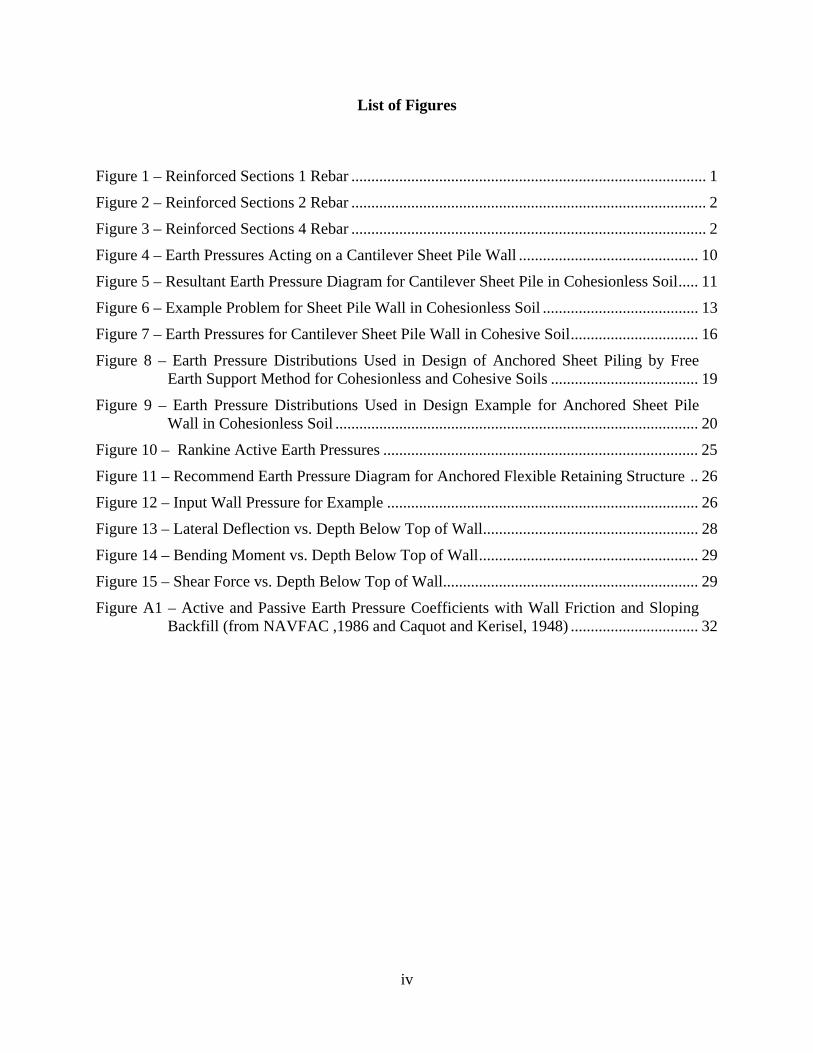
List of Figures
Figure 1 – Reinforced Sections 1 Rebar ......................................................................................... 1
Figure 2 – Reinforced Sections 2 Rebar ......................................................................................... 2
Figure 3 – Reinforced Sections 4 Rebar ......................................................................................... 2
Figure 4 – Earth Pressures Acting on a Cantilever Sheet Pile Wall ............................................. 10
Figure 5 – Resultant Earth Pressure Diagram for Cantilever Sheet Pile in Cohesionless Soil ..... 11
Figure 6 – Example Problem for Sheet Pile Wall in Cohesionless Soil ....................................... 13
Figure 7 – Earth Pressures for Cantilever Sheet Pile Wall in Cohesive Soil ................................ 16
Figure 8 – Earth Pressure Distributions Used in Design of Anchored Sheet Piling by Free Earth Support Method for Cohesionless and Cohesive Soils ..................................... 19
Figure 9 – Earth Pressure Distributions Used in Design Example for Anchored Sheet Pile Wall in Cohesionless Soil ........................................................................................... 20
Figure 10 – Rankine Active Earth Pressures ............................................................................... 25
Figure 11 – Recommend Earth Pressure Diagram for Anchored Flexible Retaining Structure .. 26
Figure 12 – Input Wall Pressure for Example .............................................................................. 26
Figure 13 – Lateral Deflection vs. Depth Below Top of Wall ...................................................... 28
Figure 14 – Bending Moment vs. Depth Below Top of Wall ....................................................... 29
Figure 15 – Shear Force vs. Depth Below Top of Wall................................................................ 29
Figure A1 – Active and Passive Earth Pressure Coefficients with Wall Friction and Sloping Backfill (from NAVFAC ,1986 and Caquot and Kerisel, 1948) ................................ 32
v
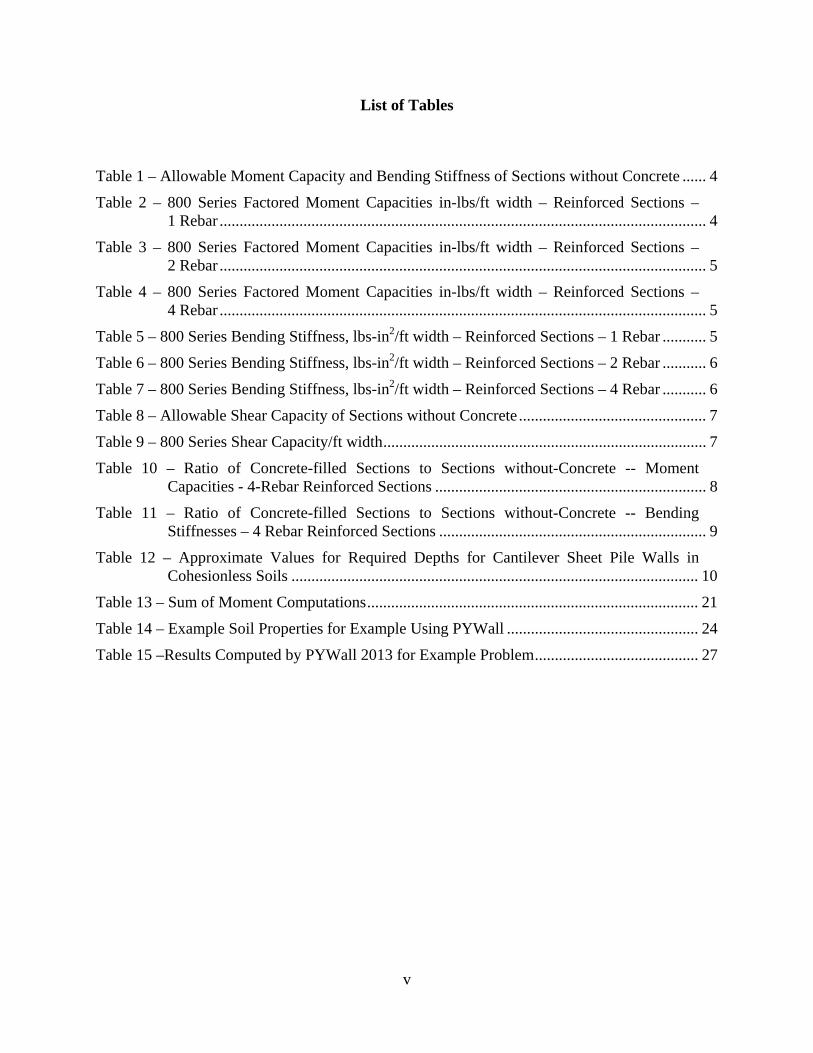
List of Tables
Table 1 – Allowable Moment Capacity and Bending Stiffness of Sections without Concrete ...... 4
Table 2 – 800 Series Factored Moment Capacities in-lbs/ft width – Reinforced Sections – 1 Rebar .......................................................................................................................... 4
Table 3 – 800 Series Factored Moment Capacities in-lbs/ft width – Reinforced Sections – 2 Rebar .......................................................................................................................... 5
Table 4 – 800 Series Factored Moment Capacities in-lbs/ft width – Reinforced Sections – 4 Rebar .......................................................................................................................... 5
Table 5 – 800 Series Bending Stiffness, lbs-in2/ft width – Reinforced Sections – 1 Rebar ........... 5
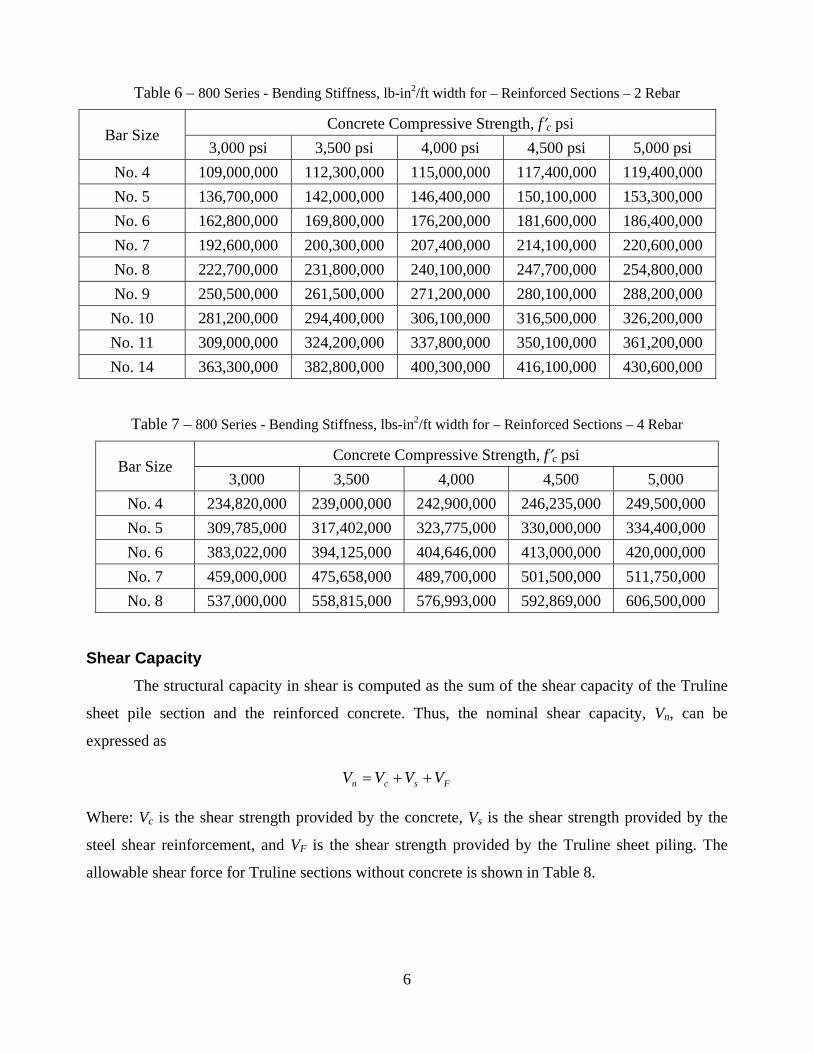
Table 6 – 800 Series Bending Stiffness, lbs-in2/ft width – Reinforced Sections – 2 Rebar ........... 6
Table 7 – 800 Series Bending Stiffness, lbs-in2/ft width – Reinforced Sections – 4 Rebar ........... 6
Table 8 – Allowable Shear Capacity of Sections without Concrete ............................................... 7
Table 9 – 800 Series Shear Capacity/ft width ................................................................................. 7
Table 10 – Ratio of Concrete-filled Sections to Sections without-Concrete -- Moment Capacities - 4-Rebar Reinforced Sections .................................................................... 8
Table 11 – Ratio of Concrete-filled Sections to Sections without-Concrete -- Bending Stiffnesses – 4 Rebar Reinforced Sections ................................................................... 9
Table 12 – Approximate Values for Required Depths for Cantilever Sheet Pile Walls in Cohesionless Soils ...................................................................................................... 10
Table 13 – Sum of Moment Computations ................................................................................... 21
Table 14 – Example Soil Properties for Example Using PYWall ................................................ 24
Table 15 –Results Computed by PYWall 2013 for Example Problem ......................................... 27
1
Design of Sheet Pile Walls Using Truline Composite Wall
Sections – Design Methods and Examples
Introduction
This report presents the recommended structural capacities for Truline composite wall
sections and a summary of design methods commonly used to design cantilevered and anchored
sheet pile structures. Several design examples are provided to illustrate the application of these
design methods for sheet pile walls using the Truline 800 Series composite wall sections.
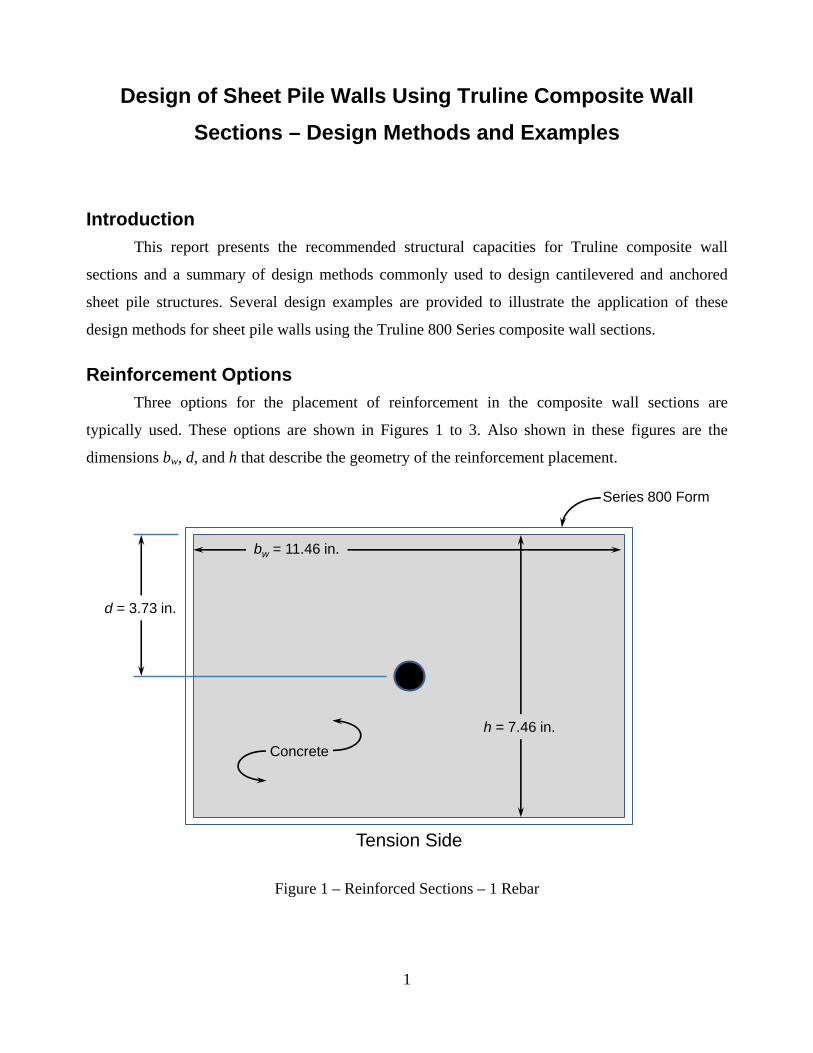
Reinforcement Options
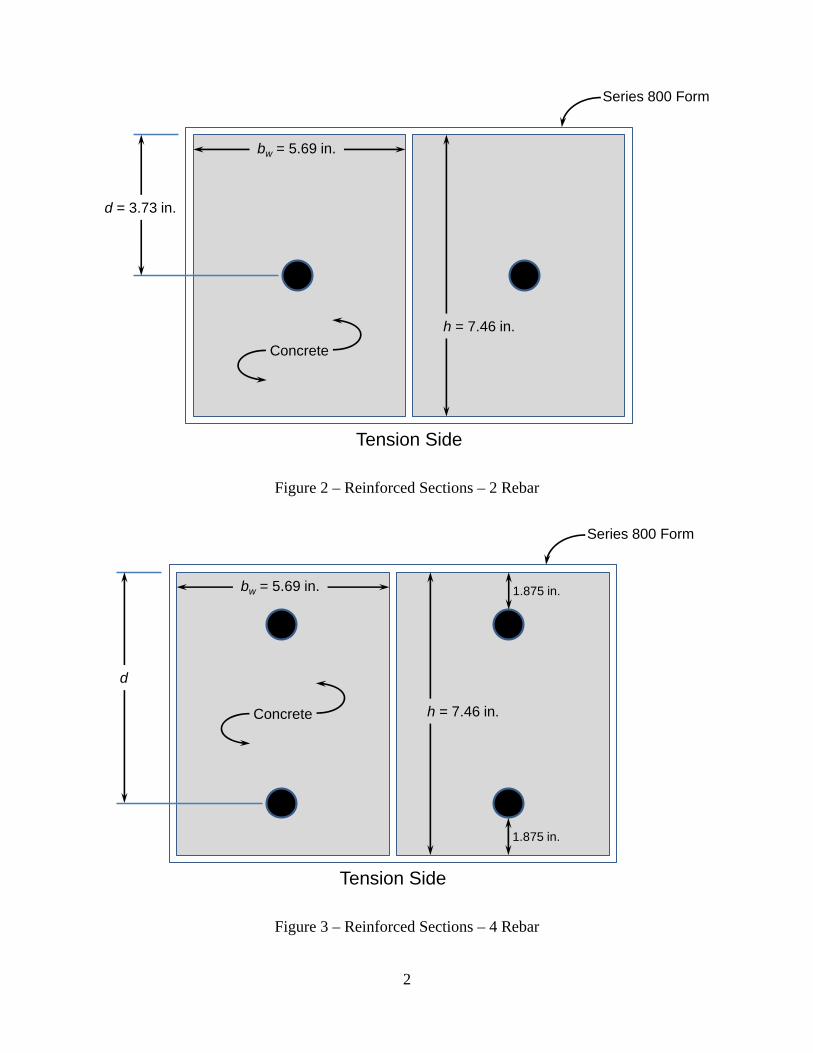
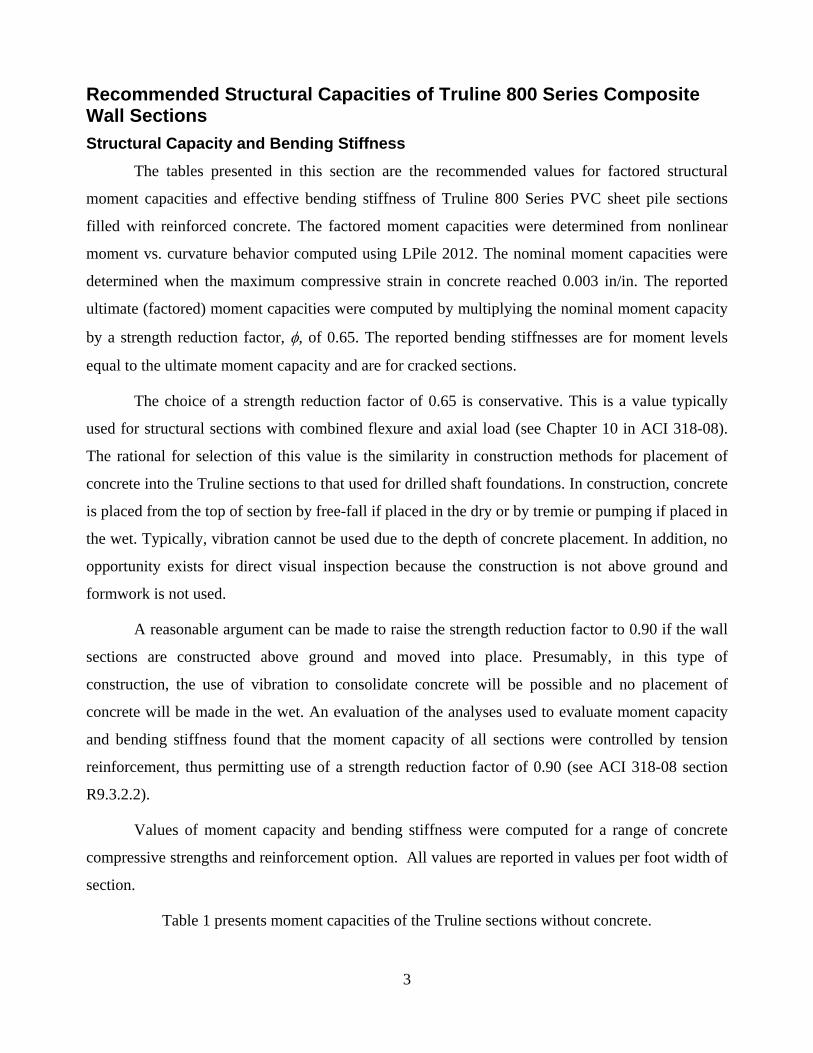
Three options for the placement of reinforcement in the composite wall sections are
typically used. These options are shown in Figures 1 to 3. Also shown in these figures are the
dimensions bw, d, and h that describe the geometry of the reinforcement placement.
Tension Side
d = 3.73 in.
bw = 11.46 in.
h = 7.46 in.
Series 800 Form
Concrete
Figure 1 – Reinforced Sections – 1 Rebar
2
Tension Side
d = 3.73 in.
bw = 5.69 in.
h = 7.46 in.
Series 800 Form
Concrete
Figure 2 – Reinforced Sections – 2 Rebar
Tension Side
d
bw = 5.69 in.
h = 7.46 in.
Series 800 Form
Concrete
1.875 in.
1.875 in.
Figure 3 – Reinforced Sections – 4 Rebar
3
Recommended Structural Capacities of Truline 800 Series Composite Wall Sections
Structural Capacity and Bending Stiffness
The tables presented in this section are the recommended values for factored structural
moment capacities and effective bending stiffness of Truline 800 Series PVC sheet pile sections
filled with reinforced concrete. The factored moment capacities were determined from nonlinear
moment vs. curvature behavior computed using LPile 2012. The nominal moment capacities were
determined when the maximum compressive strain in concrete reached 0.003 in/in. The reported
ultimate (factored) moment capacities were computed by multiplying the nominal moment capacity
by a strength reduction factor, , of 0.65. The reported bending stiffnesses are for moment levels
equal to the ultimate moment capacity and are for cracked sections.
The choice of a strength reduction factor of 0.65 is conservative. This is a value typically
used for structural sections with combined flexure and axial load (see Chapter 10 in ACI 318-08).
The rational for selection of this value is the similarity in construction methods for placement of
concrete into the Truline sections to that used for drilled shaft foundations. In construction, concrete
is placed from the top of section by free-fall if placed in the dry or by tremie or pumping if placed in
the wet. Typically, vibration cannot be used due to the depth of concrete placement. In addition, no
opportunity exists for direct visual inspection because the construction is not above ground and
formwork is not used.
A reasonable argument can be made to raise the strength reduction factor to 0.90 if the wall
sections are constructed above ground and moved into place. Presumably, in this type of
construction, the use of vibration to consolidate concrete will be possible and no placement of
concrete will be made in the wet. An evaluation of the analyses used to evaluate moment capacity
and bending stiffness found that the moment capacity of all sections were controlled by tension
reinforcement, thus permitting use of a strength reduction factor of 0.90 (see ACI 318-08 section
R9.3.2.2).
Values of moment capacity and bending stiffness were computed for a range of concrete
compressive strengths and reinforcement option. All values are reported in values per foot width of
section.
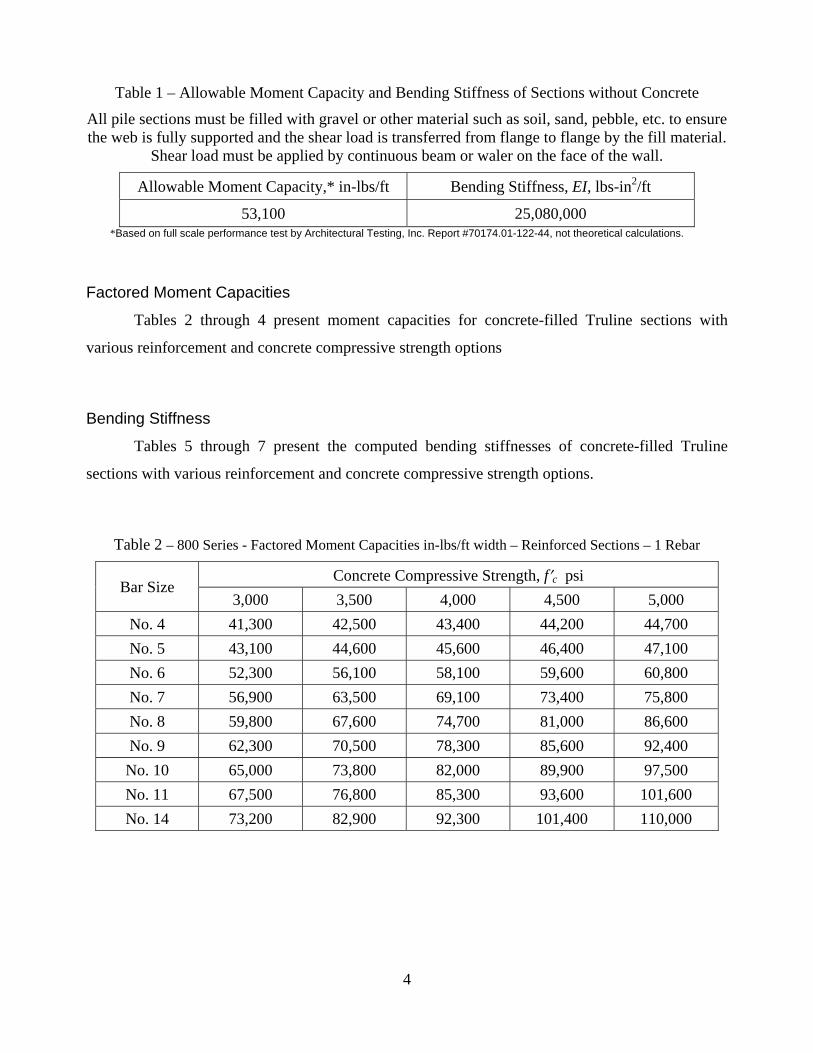
Table 1 presents moment capacities of the Truline sections without concrete.
4
Table 1 – Allowable Moment Capacity and Bending Stiffness of Sections without Concrete
All pile sections must be filled with gravel or other material such as soil, sand, pebble, etc. to ensure the web is fully supported and the shear load is transferred from flange to flange by the fill material.
Shear load must be applied by continuous beam or waler on the face of the wall.
Allowable Moment Capacity,* in-lbs/ft Bending Stiffness, EI, lbs-in2/ft
53,100 25,080,000 *Based on full scale performance test by Architectural Testing, Inc. Report #70174.01-122-44, not theoretical calculations.
Factored Moment Capacities
Tables 2 through 4 present moment capacities for concrete-filled Truline sections with
various reinforcement and concrete compressive strength options
Bending Stiffness
Tables 5 through 7 present the computed bending stiffnesses of concrete-filled Truline
sections with various reinforcement and concrete compressive strength options.
Table 2 – 800 Series - Factored Moment Capacities in-lbs/ft width – Reinforced Sections – 1 Rebar
Bar Size Concrete Compressive Strength, fc psi
3,000 3,500 4,000 4,500 5,000
No. 4 41,300 42,500 43,400 44,200 44,700
No. 5 43,100 44,600 45,600 46,400 47,100
No. 6 52,300 56,100 58,100 59,600 60,800
No. 7 56,900 63,500 69,100 73,400 75,800
No. 8 59,800 67,600 74,700 81,000 86,600
No. 9 62,300 70,500 78,300 85,600 92,400
No. 10 65,000 73,800 82,000 89,900 97,500
No. 11 67,500 76,800 85,300 93,600 101,600
No. 14 73,200 82,900 92,300 101,400 110,000
5
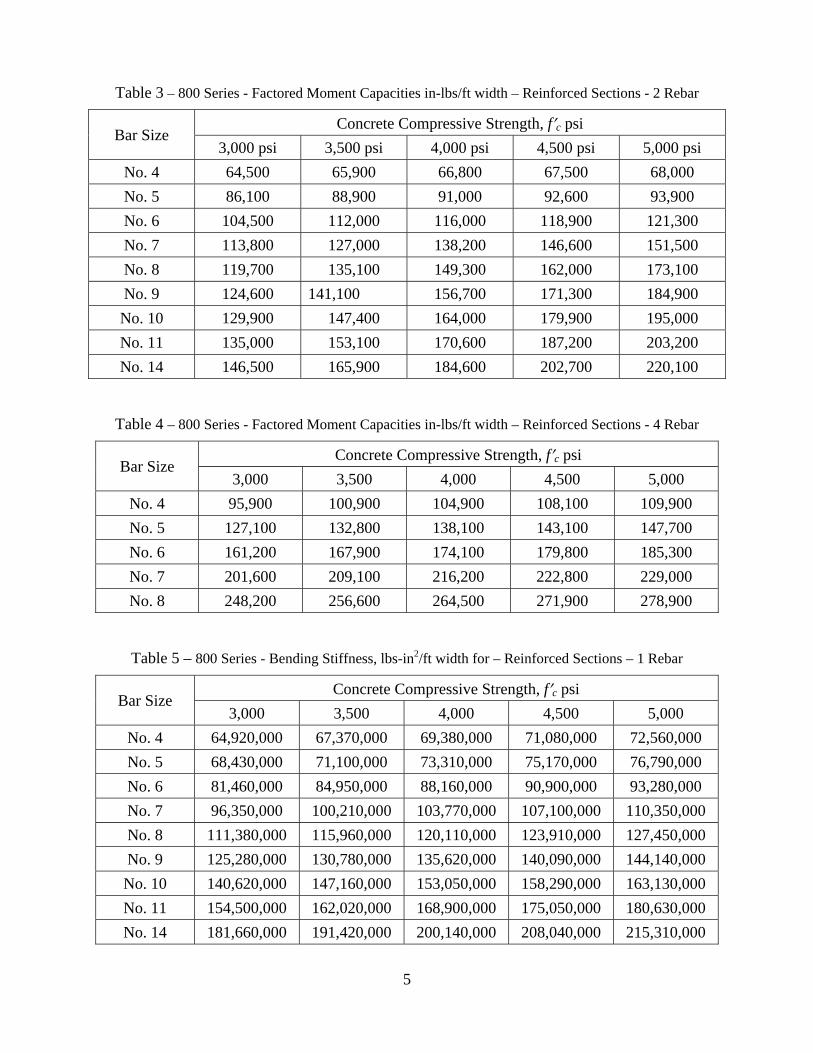
Table 3 – 800 Series - Factored Moment Capacities in-lbs/ft width – Reinforced Sections - 2 Rebar
Bar Size Concrete Compressive Strength, fc psi
3,000 psi 3,500 psi 4,000 psi 4,500 psi 5,000 psi
No. 4 64,500 65,900 66,800 67,500 68,000
No. 5 86,100 88,900 91,000 92,600 93,900
No. 6 104,500 112,000 116,000 118,900 121,300
No. 7 113,800 127,000 138,200 146,600 151,500
No. 8 119,700 135,100 149,300 162,000 173,100
No. 9 124,600 141,100 156,700 171,300 184,900
No. 10 129,900 147,400 164,000 179,900 195,000
No. 11 135,000 153,100 170,600 187,200 203,200
No. 14 146,500 165,900 184,600 202,700 220,100
Table 4 – 800 Series - Factored Moment Capacities in-lbs/ft width – Reinforced Sections - 4 Rebar
Bar Size Concrete Compressive Strength, fc psi
3,000 3,500 4,000 4,500 5,000
No. 4 95,900 100,900 104,900 108,100 109,900
No. 5 127,100 132,800 138,100 143,100 147,700
No. 6 161,200 167,900 174,100 179,800 185,300
No. 7 201,600 209,100 216,200 222,800 229,000
No. 8 248,200 256,600 264,500 271,900 278,900
Table 5 – 800 Series - Bending Stiffness, lbs-in2/ft width for – Reinforced Sections – 1 Rebar
Bar Size Concrete Compressive Strength, fc psi
3,000 3,500 4,000 4,500 5,000
No. 4 64,920,000 67,370,000 69,380,000 71,080,000 72,560,000
No. 5 68,430,000 71,100,000 73,310,000 75,170,000 76,790,000
No. 6 81,460,000 84,950,000 88,160,000 90,900,000 93,280,000
No. 7 96,350,000 100,210,000 103,770,000 107,100,000 110,350,000
No. 8 111,380,000 115,960,000 120,110,000 123,910,000 127,450,000
No. 9 125,280,000 130,780,000 135,620,000 140,090,000 144,140,000
No. 10 140,620,000 147,160,000 153,050,000 158,290,000 163,130,000
No. 11 154,500,000 162,020,000 168,900,000 175,050,000 180,630,000
No. 14 181,660,000 191,420,000 200,140,000 208,040,000 215,310,000
6
Table 6 – 800 Series - Bending Stiffness, lb-in2/ft width for – Reinforced Sections – 2 Rebar
Bar Size Concrete Compressive Strength, fc psi
3,000 psi 3,500 psi 4,000 psi 4,500 psi 5,000 psi
No. 4 109,000,000 112,300,000 115,000,000 117,400,000 119,400,000
No. 5 136,700,000 142,000,000 146,400,000 150,100,000 153,300,000
No. 6 162,800,000 169,800,000 176,200,000 181,600,000 186,400,000
No. 7 192,600,000 200,300,000 207,400,000 214,100,000 220,600,000
No. 8 222,700,000 231,800,000 240,100,000 247,700,000 254,800,000
No. 9 250,500,000 261,500,000 271,200,000 280,100,000 288,200,000
No. 10 281,200,000 294,400,000 306,100,000 316,500,000 326,200,000
No. 11 309,000,000 324,200,000 337,800,000 350,100,000 361,200,000
No. 14 363,300,000 382,800,000 400,300,000 416,100,000 430,600,000
Table 7 – 800 Series - Bending Stiffness, lbs-in2/ft width for – Reinforced Sections – 4 Rebar
Bar Size Concrete Compressive Strength, fc psi
3,000 3,500 4,000 4,500 5,000
No. 4 234,820,000 239,000,000 242,900,000 246,235,000 249,500,000
No. 5 309,785,000 317,402,000 323,775,000 330,000,000 334,400,000
No. 6 383,022,000 394,125,000 404,646,000 413,000,000 420,000,000
No. 7 459,000,000 475,658,000 489,700,000 501,500,000 511,750,000
No. 8 537,000,000 558,815,000 576,993,000 592,869,000 606,500,000
Shear Capacity
The structural capacity in shear is computed as the sum of the shear capacity of the Truline
sheet pile section and the reinforced concrete. Thus, the nominal shear capacity, Vn, can be
expressed as
Fscn VVVV
Where: Vc is the shear strength provided by the concrete, Vs is the shear strength provided by the
steel shear reinforcement, and VF is the shear strength provided by the Truline sheet piling. The
allowable shear force for Truline sections without concrete is shown in Table 8.
7
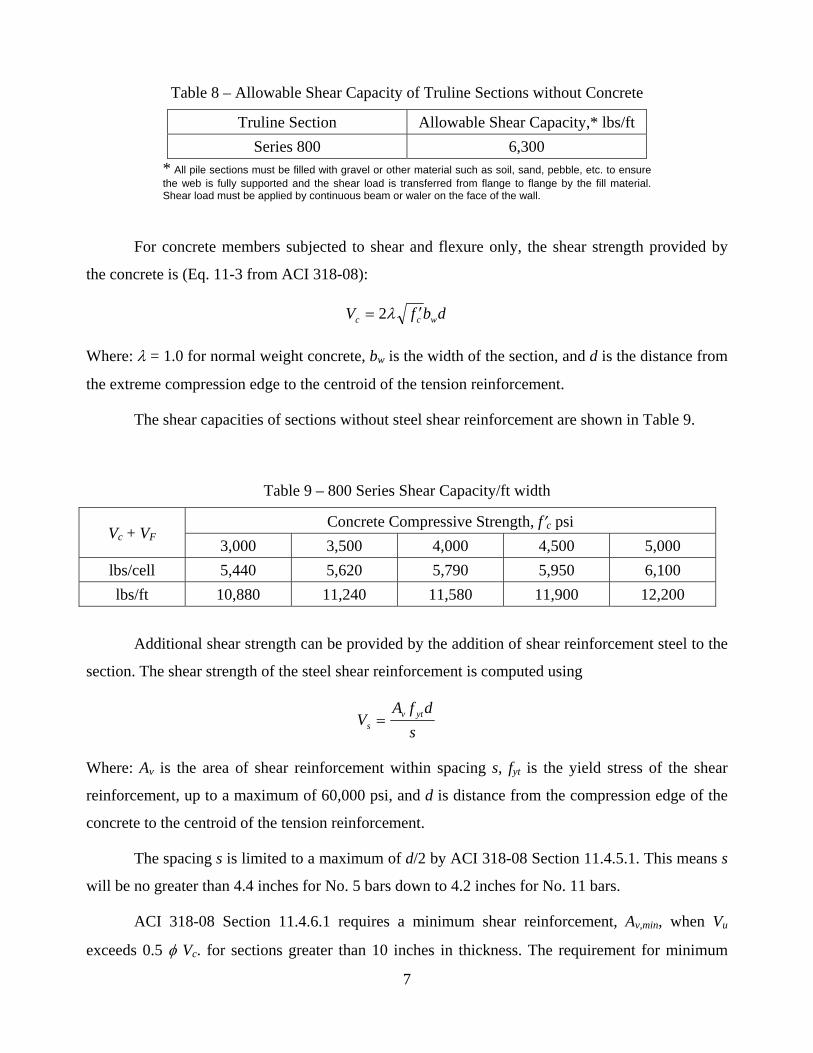
Table 8 – Allowable Shear Capacity of Truline Sections without Concrete
Truline Section Allowable Shear Capacity,* lbs/ft
Series 800 6,300 * All pile sections must be filled with gravel or other material such as soil, sand, pebble, etc. to ensure the web is fully supported and the shear load is transferred from flange to flange by the fill material. Shear load must be applied by continuous beam or waler on the face of the wall.
For concrete members subjected to shear and flexure only, the shear strength provided by
the concrete is (Eq. 11-3 from ACI 318-08):
dbfV wcc 2
Where: = 1.0 for normal weight concrete, bw is the width of the section, and d is the distance from
the extreme compression edge to the centroid of the tension reinforcement.
The shear capacities of sections without steel shear reinforcement are shown in Table 9.
Table 9 – 800 Series Shear Capacity/ft width
Vc + VF Concrete Compressive Strength, fc psi
3,000 3,500 4,000 4,500 5,000
lbs/cell 5,440 5,620 5,790 5,950 6,100
lbs/ft 10,880 11,240 11,580 11,900 12,200
Additional shear strength can be provided by the addition of shear reinforcement steel to the
section. The shear strength of the steel shear reinforcement is computed using
s
dfAV ytv
s
Where: Av is the area of shear reinforcement within spacing s, fyt is the yield stress of the shear
reinforcement, up to a maximum of 60,000 psi, and d is distance from the compression edge of the
concrete to the centroid of the tension reinforcement.
The spacing s is limited to a maximum of d/2 by ACI 318-08 Section 11.4.5.1. This means s
will be no greater than 4.4 inches for No. 5 bars down to 4.2 inches for No. 11 bars.
ACI 318-08 Section 11.4.6.1 requires a minimum shear reinforcement, Av,min, when Vu
exceeds 0.5 Vc. for sections greater than 10 inches in thickness. The requirement for minimum
8
shear reinforcement does not apply to the 800 Series section since the depth of the concrete section
is 7.46 inches is less than 10 inches.
The ultimate (factored) shear capacity is computed using a strength reduction factor, , of
0.75 (see ACI 318-08 Section 9.3.2.3).
Fscnu VVVVV
As an example, the factored shear capacity of an 800 Series wall, with f’c = 4,000 psi, Grade
60, No. 8 vertical reinforcement, and Grade 60, No. 3 shear reinforcement is
lb/ft 800,15lb/ft 000,4lb/ft 580,1175.0 nV
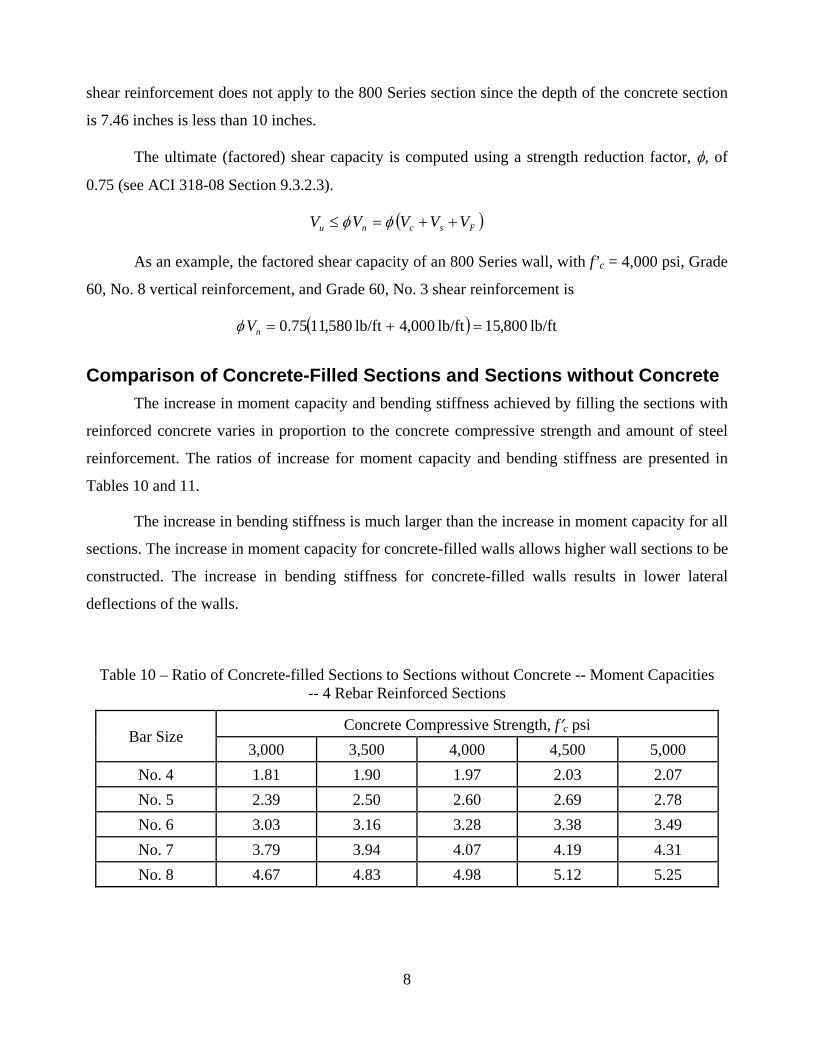
Comparison of Concrete-Filled Sections and Sections without Concrete
The increase in moment capacity and bending stiffness achieved by filling the sections with
reinforced concrete varies in proportion to the concrete compressive strength and amount of steel
reinforcement. The ratios of increase for moment capacity and bending stiffness are presented in
Tables 10 and 11.
The increase in bending stiffness is much larger than the increase in moment capacity for all
sections. The increase in moment capacity for concrete-filled walls allows higher wall sections to be
constructed. The increase in bending stiffness for concrete-filled walls results in lower lateral
deflections of the walls.
Table 10 – Ratio of Concrete-filled Sections to Sections without Concrete -- Moment Capacities -- 4 Rebar Reinforced Sections
Bar Size Concrete Compressive Strength, fc psi
3,000 3,500 4,000 4,500 5,000
No. 4 1.81 1.90 1.97 2.03 2.07
No. 5 2.39 2.50 2.60 2.69 2.78
No. 6 3.03 3.16 3.28 3.38 3.49
No. 7 3.79 3.94 4.07 4.19 4.31
No. 8 4.67 4.83 4.98 5.12 5.25
9
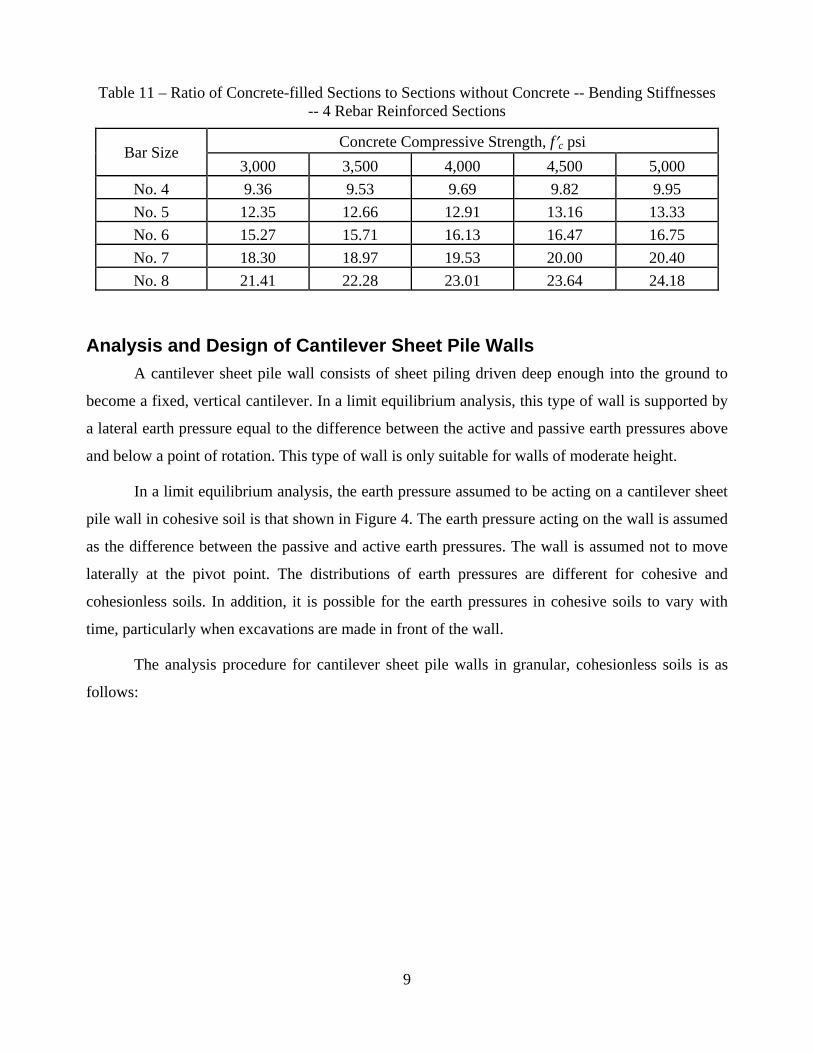
Table 11 – Ratio of Concrete-filled Sections to Sections without Concrete -- Bending Stiffnesses -- 4 Rebar Reinforced Sections
Bar Size Concrete Compressive Strength, fc psi
3,000 3,500 4,000 4,500 5,000
No. 4 9.36 9.53 9.69 9.82 9.95
No. 5 12.35 12.66 12.91 13.16 13.33
No. 6 15.27 15.71 16.13 16.47 16.75
No. 7 18.30 18.97 19.53 20.00 20.40
No. 8 21.41 22.28 23.01 23.64 24.18
Analysis and Design of Cantilever Sheet Pile Walls
A cantilever sheet pile wall consists of sheet piling driven deep enough into the ground to
become a fixed, vertical cantilever. In a limit equilibrium analysis, this type of wall is supported by
a lateral earth pressure equal to the difference between the active and passive earth pressures above
and below a point of rotation. This type of wall is only suitable for walls of moderate height.
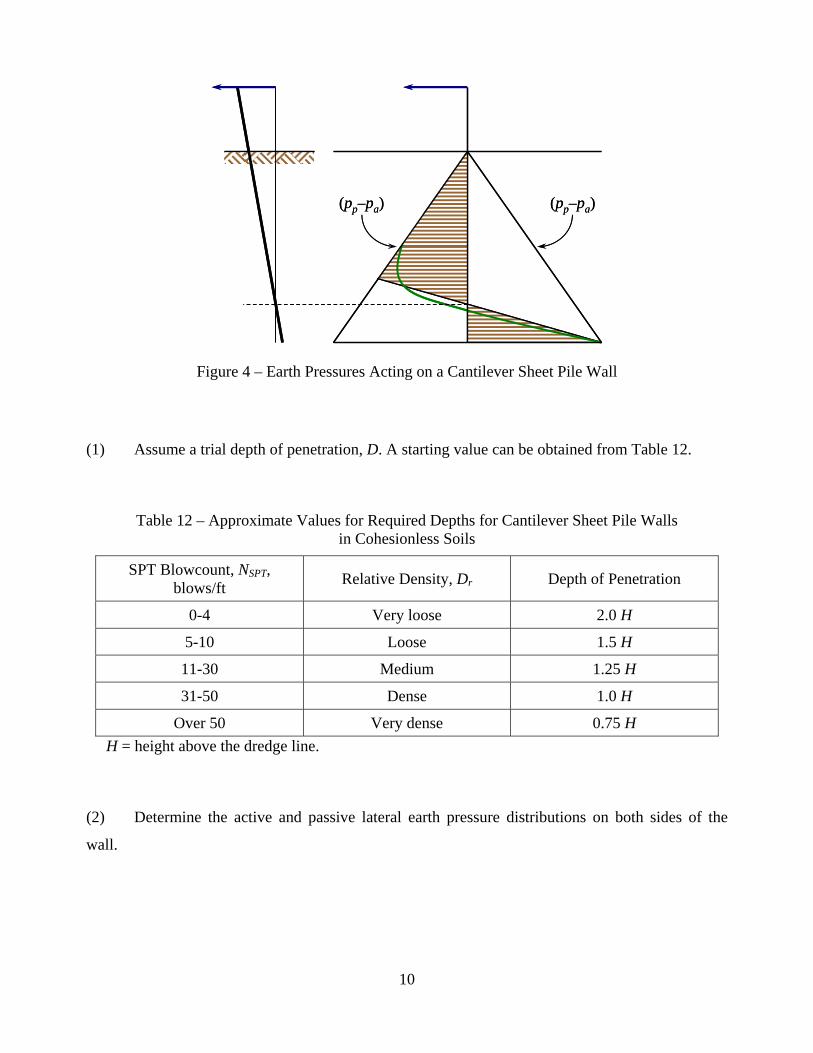
In a limit equilibrium analysis, the earth pressure assumed to be acting on a cantilever sheet
pile wall in cohesive soil is that shown in Figure 4. The earth pressure acting on the wall is assumed
as the difference between the passive and active earth pressures. The wall is assumed not to move
laterally at the pivot point. The distributions of earth pressures are different for cohesive and
cohesionless soils. In addition, it is possible for the earth pressures in cohesive soils to vary with
time, particularly when excavations are made in front of the wall.
The analysis procedure for cantilever sheet pile walls in granular, cohesionless soils is as
follows:
10
(pp–pa)(pp–pa) (pp–pa)(pp–pa)
Figure 4 – Earth Pressures Acting on a Cantilever Sheet Pile Wall
(1) Assume a trial depth of penetration, D. A starting value can be obtained from Table 12.
Table 12 – Approximate Values for Required Depths for Cantilever Sheet Pile Walls in Cohesionless Soils
SPT Blowcount, NSPT, blows/ft
Relative Density, Dr Depth of Penetration
0-4 Very loose 2.0 H
5-10 Loose 1.5 H
11-30 Medium 1.25 H
31-50 Dense 1.0 H
Over 50 Very dense 0.75 H
H = height above the dredge line.
(2) Determine the active and passive lateral earth pressure distributions on both sides of the
wall.
11
A1
A2
A
B
C
O1
E F J
TOP OF GROUND
DREDGE LINE
H
D
ap KDHDK )(
pKDH )(
ap DKKDH )(pDK
aKDH )( aDK
E
P1
P2
P3
A1
A2
A
B
C
O1
E F J
TOP OF GROUND
DREDGE LINE
H
D
ap KDHDK )(
pKDH )(
ap DKKDH )(pDK
aKDH )( aDK
E
P1
P2
P3
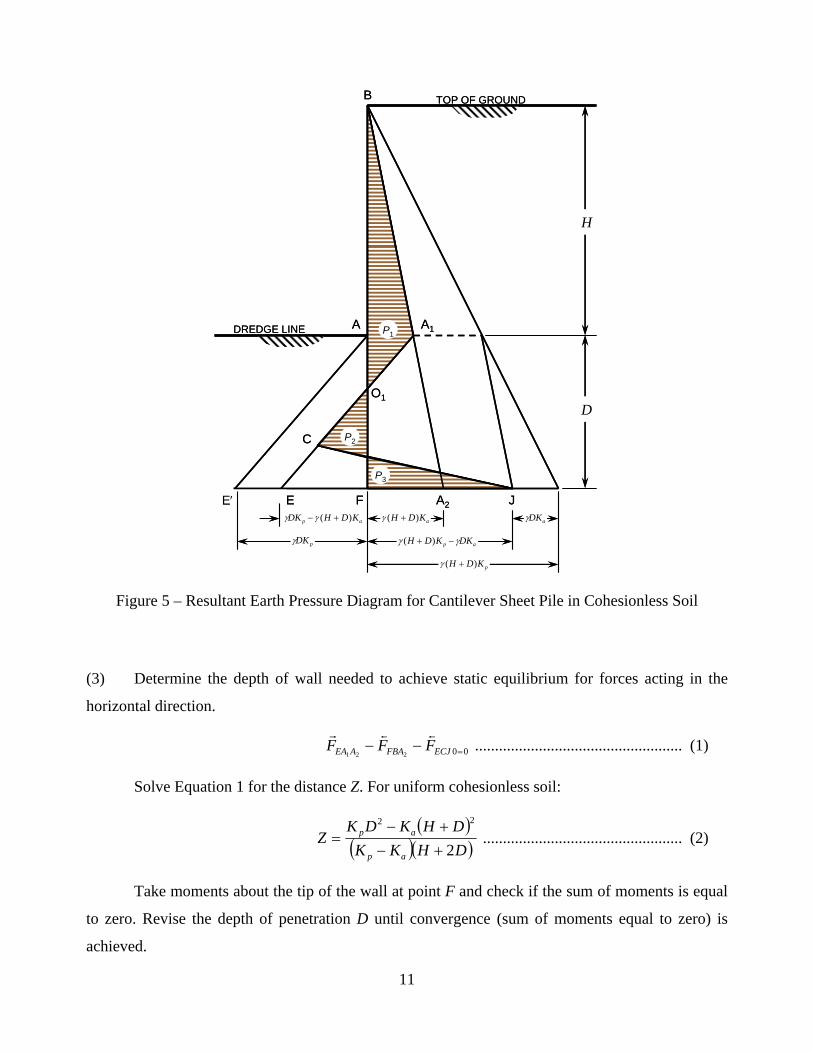
Figure 5 – Resultant Earth Pressure Diagram for Cantilever Sheet Pile in Cohesionless Soil
(3) Determine the depth of wall needed to achieve static equilibrium for forces acting in the
horizontal direction.
00221 ECJFBAAEA FFF
.................................................... (1)
Solve Equation 1 for the distance Z. For uniform cohesionless soil:
DHKK
DHKDKZ
ap
ap
2
22
.................................................. (2)
Take moments about the tip of the wall at point F and check if the sum of moments is equal
to zero. Revise the depth of penetration D until convergence (sum of moments equal to zero) is
achieved.
12
Add 20 to 40 percent to the calculated depth of penetration. This results in a factor of safety
of approximately 1.5 to 2.0. Alternatively, one may use a reduced value of the passive earth
pressure coefficient for design. A typical value is 50 to 75 percent of the maximum passive
resistance.
Compute the maximum bending moment developed in the wall prior to increasing the depth
by 20 to 40 percent.
The lateral displacement can be estimated by assuming that the wall is fixed at a depth of
½D and loaded by a triangular load equal to the actual applied active loading. The lateral movement
at any distance y below the top of the wall is computed by
5452
4560
yyEI
Pt ................................................ (3)
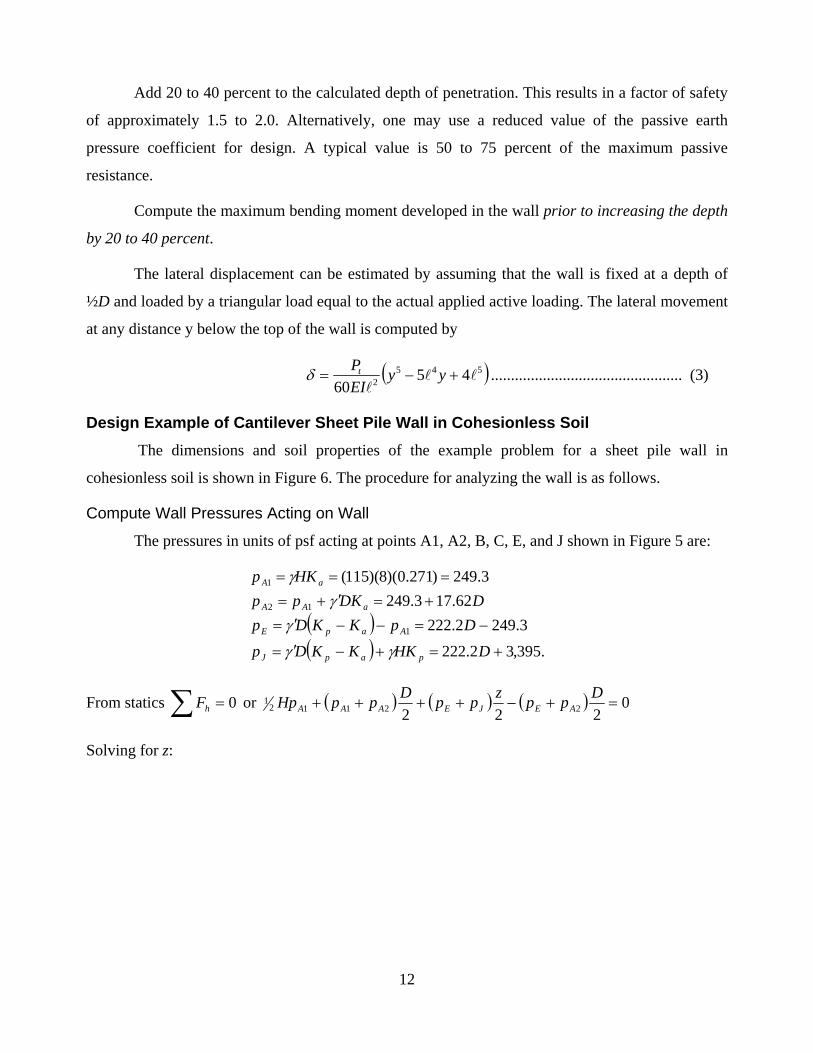
Design Example of Cantilever Sheet Pile Wall in Cohesionless Soil
The dimensions and soil properties of the example problem for a sheet pile wall in
cohesionless soil is shown in Figure 6. The procedure for analyzing the wall is as follows.
Compute Wall Pressures Acting on Wall
The pressures in units of psf acting at points A1, A2, B, C, E, and J shown in Figure 5 are:
.395,32.222
3.2492.222
62.173.249
3.249)271.0)(8)(115(
1
12
1
DHKKKDp
DpKKDp
DDKpp
HKp
papJ
AapE
aAA
aA
From statics 0 hF or 0222 22112
1 D
ppz
ppD
ppHp AEJEAAA
Solving for z:
13
B
H = 12 ft
D = 12.628 ft
P1
P2
P3
y
z
xPoint of Zero Shear Force
= 115 pcf’ = 65 pcf = 35 deg.Ka = 0.271Kp = 3.690
B
H = 12 ft
D = 12.628 ft
P1
P2
P3
y
z
xPoint of Zero Shear Force
= 115 pcf’ = 65 pcf = 35 deg.Ka = 0.271Kp = 3.690
Figure 6 – Example Problem for Sheet Pile Wall in Cohesionless Soil
JE
AAE
pp
HpDppz
11
Summing moments about the bottom of the wall:
66623
02
12
2
2
22
1121
Dpp
Dpp
zpp
Dp
HDHpM AAAEJEAA
The above equations can be solved by trial and error by assuming a value for D, computing z, and
computing the sum of moments, varying D until the computed sum of moments is zero.
Alternatively, the equations can be programmed in an electronic spreadsheet program and using the
Goal Seek tool to obtain a solution. The solution for the above problem finds
ft 388.1
ft 419.8
z
D
8
8.419
14
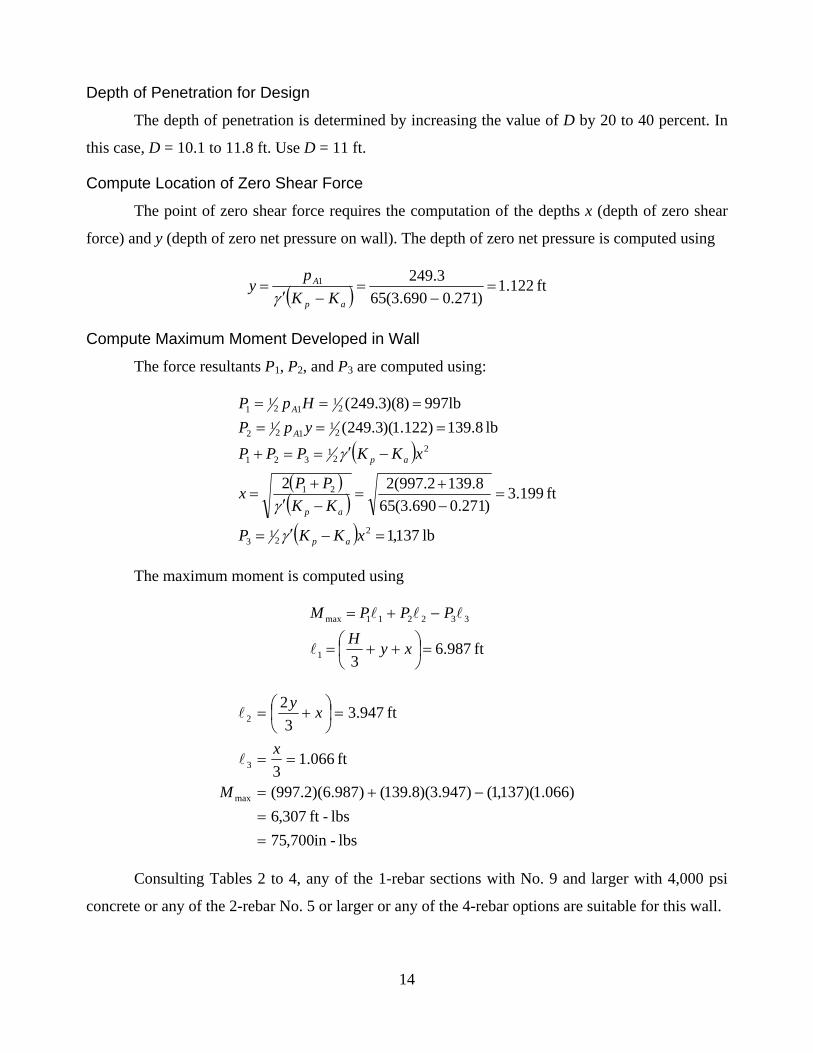
Depth of Penetration for Design
The depth of penetration is determined by increasing the value of D by 20 to 40 percent. In
this case, D = 10.1 to 11.8 ft. Use D = 11 ft.
Compute Location of Zero Shear Force
The point of zero shear force requires the computation of the depths x (depth of zero shear
force) and y (depth of zero net pressure on wall). The depth of zero net pressure is computed using
ft 122.1)271.0690.3(65
3.2491
ap
A
KK
py
Compute Maximum Moment Developed in Wall
The force resultants P1, P2, and P3 are computed using:
lb 137,1
ft 199.3)271.0690.3(65
8.1392.997(22
lb 8.139)122.1)(3.249(
997lb)8)(3.249(
22
13
21
22
1321
21
121
2
21
121
1
xKKP
KK
PPx
xKKPPP
ypP
HpP
ap
ap
ap
A
A
The maximum moment is computed using
ft 987.6
31
332211max
xyH
PPPM
lbs-in700,75
lbs-ft 307,6
)066.1)(137,1()947.3)(8.139()987.6)(2.997(
ft 066.13
ft 947.33
2
max
3
2
M
x
xy
Consulting Tables 2 to 4, any of the 1-rebar sections with No. 9 and larger with 4,000 psi
concrete or any of the 2-rebar No. 5 or larger or any of the 4-rebar options are suitable for this wall.
15
Note Regarding Passive Earth Pressure Coefficient
In the above design example, the passive earth pressure coefficient was computed assuming
that the wall is vertical and frictionless and that the ground surface behind the wall is horizontal. For
these conditions, the computation of the passive earth pressure coefficient using Rankine theory is
both appropriate and conservative.
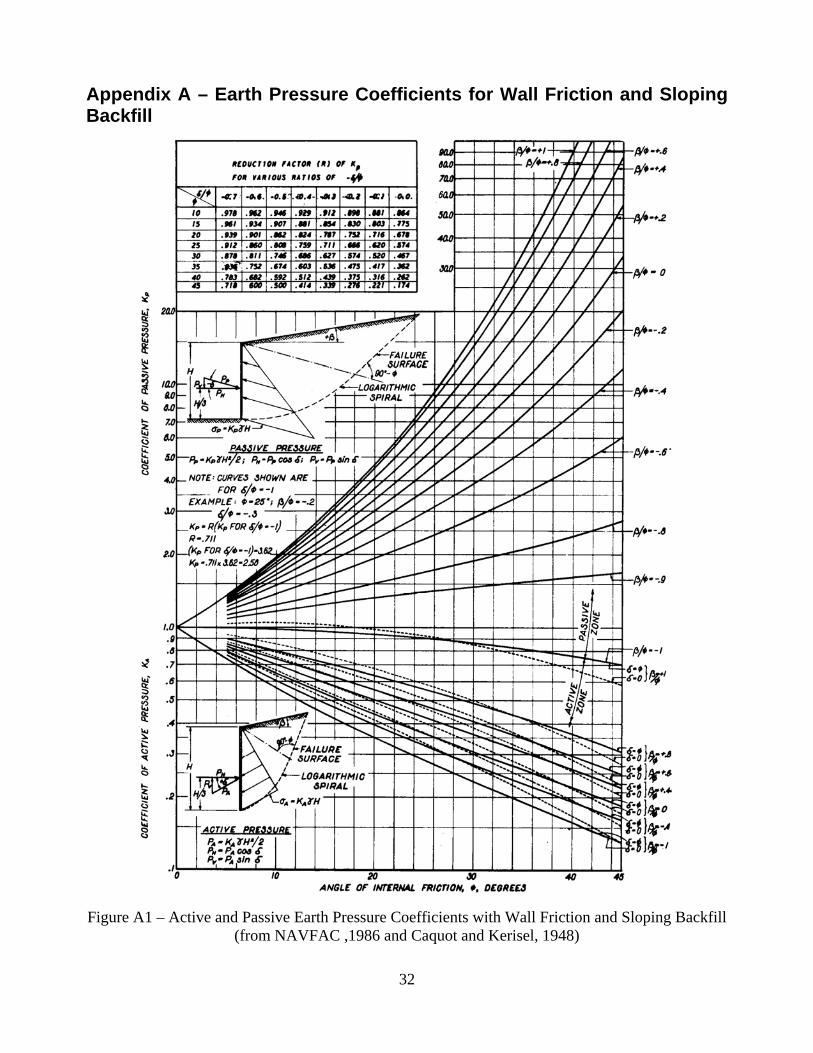
It is common practice when designing steel sheet pile walls to consider the effect of wall
friction on the passive earth pressure coefficient. When doing so, many designers use the
coefficients developed by Caquot and Kerisel (1948). These coefficients are illustrated in Figure A1
of the Appendix of this report and are reported in NAVFAC DM 7.02 (1986) in Figure 6 on page
7.2-67. This manual is available in PDF format for download from
http://portal.tugraz.at/portal/page/portal/Files/i2210/files/eng_geol/NAVFAC_DM7_02.pdf.
Design Example of Cantilever Sheet Pile Wall in Cohesive Soil
Cantilever sheet pile structures are typically used for small walls. The analysis that follows
was originally developed by Blum (1931) and is for under short-term loading conditions. For long-
term loading conditions, the analysis is made using the analysis for cantilever sheet pile walls in
cohesionless soils using the fully drained shearing properties of the soil presented above.
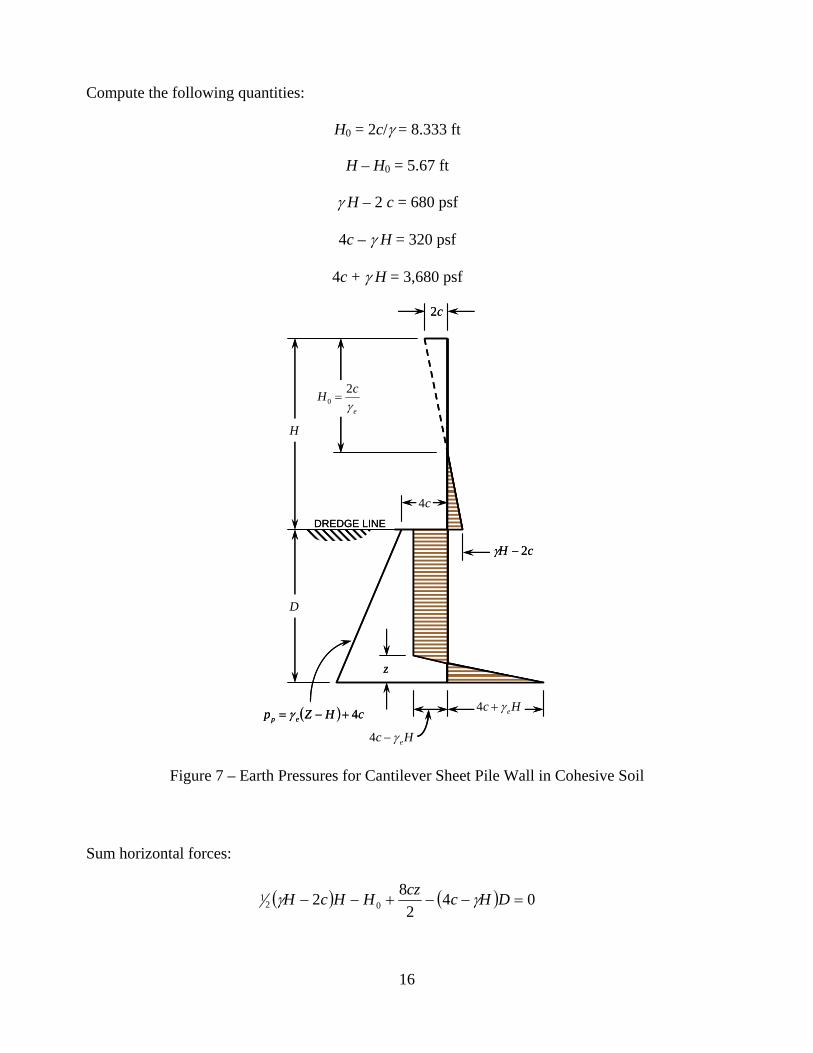
The earth pressures acting on a cantilever sheet pile wall in cohesive soils are shown in
Figure 7.
The dimensions and soil properties for this design example are:
H = 14 ft, = 120 pcf, = 60 pcf, c = 500 psf
16
Compute the following quantities:
H0 = 2c/ = 8.333 ft
H – H0 = 5.67 ft
H – 2 c = 680 psf
4c – H = 320 psf
4c + H = 3,680 psf
H
D
e
cH
2
0
Hc e4
Hc e4
cHZp ep 4
DREDGE LINE
c4
z
cH 2
c2
H
D
e
cH
2
0
Hc e4
Hc e4
cHZp ep 4
DREDGE LINE
c4
z
cH 2
c2
Figure 7 – Earth Pressures for Cantilever Sheet Pile Wall in Cohesive Soil
Sum horizontal forces:
042
82 02
1 DHccz
HHcH
17
Solve for depth z
c
HHcHHcDz
8
242 0
Sum moments about the bottom of wall
02
46
8
32
220
021
DHc
czHHDHHcHM
Strategy for Computations:
1. Assume a value for D.
2. Calculate depth z.
3. Calculate sum of moments about the bottom of wall.
4. Repeat until convergence (sum of moments) is achieved.
Alternatively, one may solve the quadratic equation (sum of moments equation) for D. The
solution for the above given data:
z = 1.300 ft
D = 14.147 ft
The solution values are quite sensitive to the input values. If the value of cohesion is varied
plus or minus 5 percent the values of H = 22.532 ft for c = 475 psf and H = 9.75 ft for c = 525 psf.
Similar sensitivity is found for slight variations in unit weight and geometry.
Selection of Wall Section
The selection of the wall section is made based on the moment developed in the wall. The
design moment is computed at the dredge line. For the above conditions, the moment is
lb-in 700,43
lb-ft 640,3
)ft 1(psf 680ft 67.5
ft 122
61
206
1
cHHHM
Checking the level of moment developed in the wall against the allowable moment capacity values
shown in Tables 2 through 4, an 800 Series section with the following combinations of concrete
18
compressive strength and reinforcement size will be acceptable for this application for short-term,
undrained conditions:
a concrete compressive strength of 3,500 psi and 1-bar centered reinforced with No. 5 bar
a concrete compressive strength of 3,000 psi and 2-bar centered reinforced with No. 4 bars
a concrete compressive strength of 3,000 psi and 4-bar reinforced with No. 4 bars.
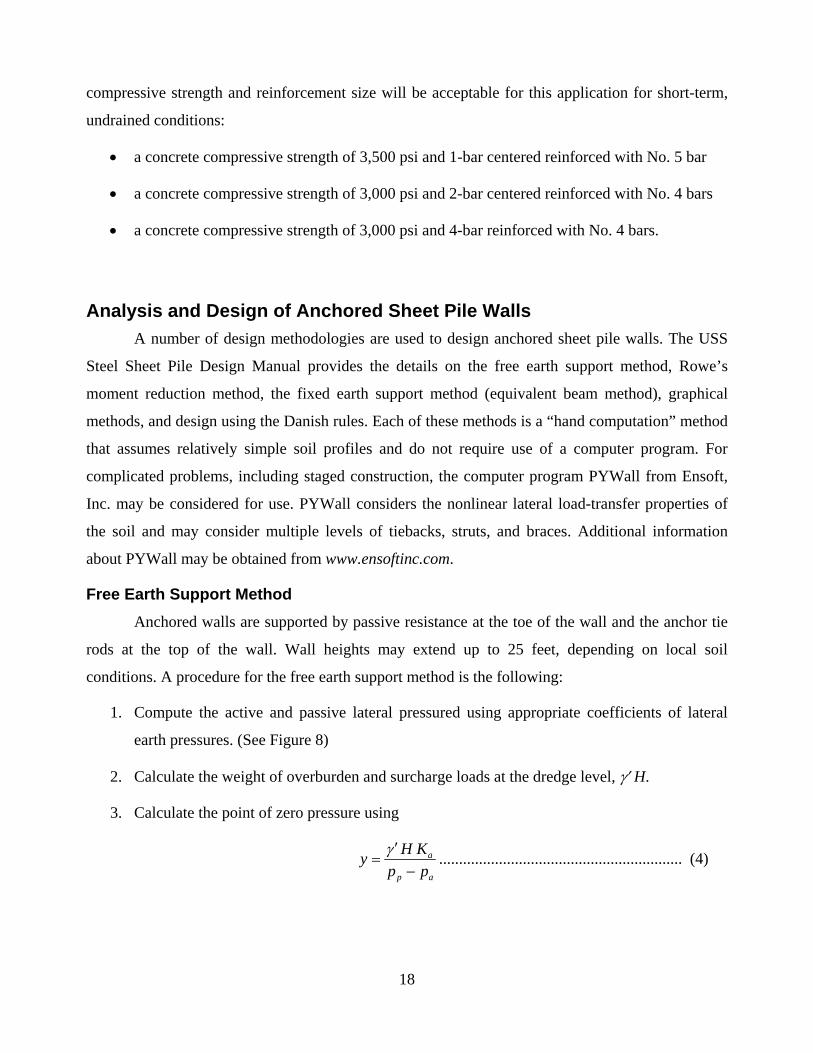
Analysis and Design of Anchored Sheet Pile Walls
A number of design methodologies are used to design anchored sheet pile walls. The USS
Steel Sheet Pile Design Manual provides the details on the free earth support method, Rowe’s
moment reduction method, the fixed earth support method (equivalent beam method), graphical
methods, and design using the Danish rules. Each of these methods is a “hand computation” method
that assumes relatively simple soil profiles and do not require use of a computer program. For
complicated problems, including staged construction, the computer program PYWall from Ensoft,
Inc. may be considered for use. PYWall considers the nonlinear lateral load-transfer properties of
the soil and may consider multiple levels of tiebacks, struts, and braces. Additional information
about PYWall may be obtained from www.ensoftinc.com.
Free Earth Support Method
Anchored walls are supported by passive resistance at the toe of the wall and the anchor tie
rods at the top of the wall. Wall heights may extend up to 25 feet, depending on local soil
conditions. A procedure for the free earth support method is the following:
1. Compute the active and passive lateral pressured using appropriate coefficients of lateral
earth pressures. (See Figure 8)
2. Calculate the weight of overburden and surcharge loads at the dredge level, H.
3. Calculate the point of zero pressure using
ap
a
pp
KHy
............................................................. (4)

19
ay
Hw
H1
D1
(pp–pa)D1
p p–p a e H Ka
LowWater T
Cohesionless Soil
e H
Ka H1
Ka
Pa
Ka
ay
Hw
H1
D1
(pp–pa)D1
p p–p a e H Ka
LowWater T
Cohesionless Soil
e H
Ka H1
Ka
Pa
Ka
Hw
H1
D
e HPa
LowWater T
L
2qu–eH
pa
Ht
Cohesive Soil
Hw
H1
D
e HPa
LowWater T
L
2qu–eH
pa
Ht
Cohesive Soil
Figure 8 – Earth Pressure Distributions Used in Design of Anchored Sheet Piling by Free Earth Support Method for Cohesionless and Cohesive Soils
4. Calculate Pa, the resultant force of the earth pressure above point a, and its distance, L,
below the tie rod elevation.
Static equilibrium is attained by making the wall deep enough that the moment due to the
net passive pressure will balance the moment due to the resultant active force, Pa. Sum moments
about the tie rod level.
0)()())(( 1322
121 DyHDppPLM tapa ............................ (5)
Solving for D1; usually a trial and error solution is used. Alternatively, the equation can be solved
using the Goal Seek option in an electronic spreadsheet program.
Compute the tension in the tie rod by
212
1 )( DppPT apa
The maximum bending moment occurs at the point of zero shear force in the wall below the
tie rod elevation.
Select the appropriate sheet pile section for the maximum moment developed.
20
Add 20 to 40 percent to D1 to provide a margin of safety or divide the passive resistance
force Pp by a factor of safety of 1.5 to 2.0.
Design Example for Anchored Sheet Pile Wall in Granular Soil Using Free-Earth
Support Method
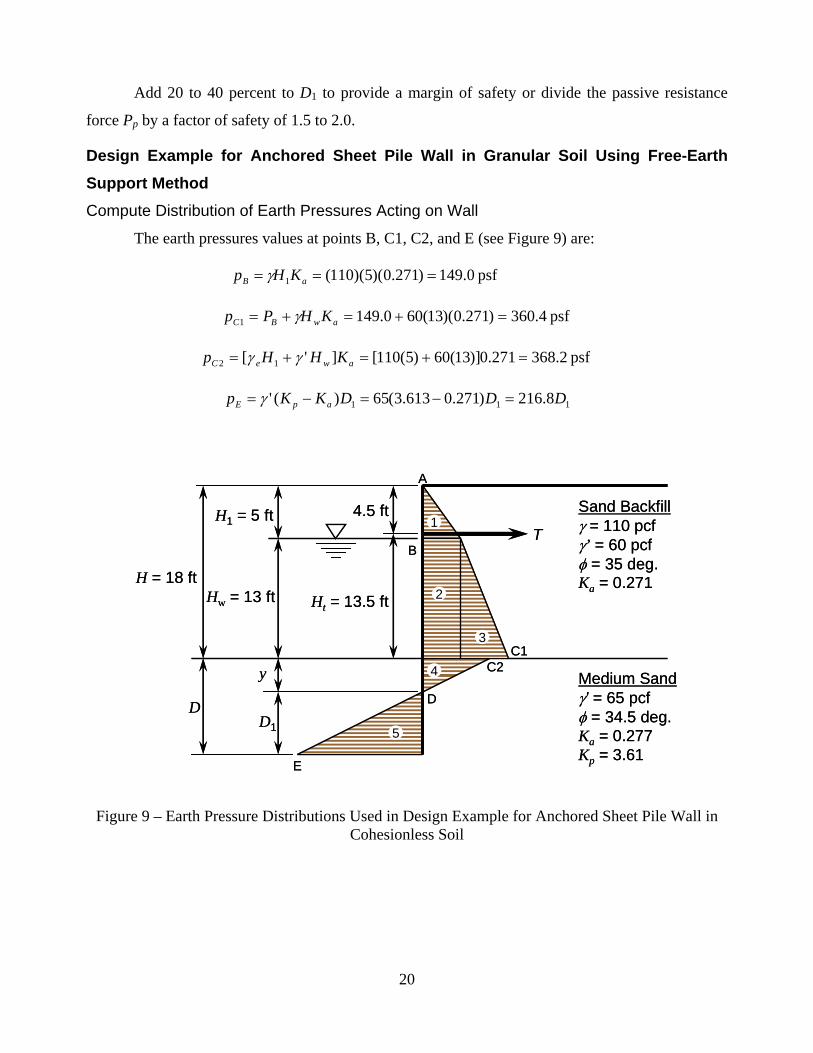
Compute Distribution of Earth Pressures Acting on Wall
The earth pressures values at points B, C1, C2, and E (see Figure 9) are:
psf 0.149)271.0)(5)(110(1 aB KHp
psf 4.360)271.0)(13(600.1491 awBC KHPp
psf 2.368271.0)]13(60)5(110[]'[ 12 aweC KHHp
111 8.216)271.0613.3(65)(' DDDKKp apE
1
2
4
5
Sand Backfill = 110 pcf’ = 60 pcf = 35 deg.Ka = 0.271
Medium Sand’ = 65 pcf = 34.5 deg.Ka = 0.277Kp = 3.61
A
B
C1C2
D
E
H1 = 5 ft
Hw = 13 ft Ht = 13.5 ft
DD1
4.5 ft
y
H = 18 ft
T
3
1
2
4
5
Sand Backfill = 110 pcf’ = 60 pcf = 35 deg.Ka = 0.271
Medium Sand’ = 65 pcf = 34.5 deg.Ka = 0.277Kp = 3.61
A
B
C1C2
D
E
H1 = 5 ft
Hw = 13 ft Ht = 13.5 ft
DD1
4.5 ft
y
H = 18 ft
T
3
Figure 9 – Earth Pressure Distributions Used in Design Example for Anchored Sheet Pile Wall in Cohesionless Soil
21
Compute Depth of Point of Zero Net Pressure
The depth of zero net pressure below the dredge line is computed by
ft 662.1)271.0614.3(65
4.360
)('2
ap
C
KK
py
Compute Force Resultants of Pressures Acting on Wall
The resultant forces acting on the wall are:
21112
112
15
21
221
4
21
121
3
2
21
121
1
4.108)8.216)((
lb 0.306)662.1)(2.368)((
lb .374,1)0.1494.360)(13)(()(
lb .938,1)0.149)(13(
lb 6.372)0.149)(5)((
DDDDpP
ypP
ppHP
pHP
pHP
E
C
BCw
Bw
B
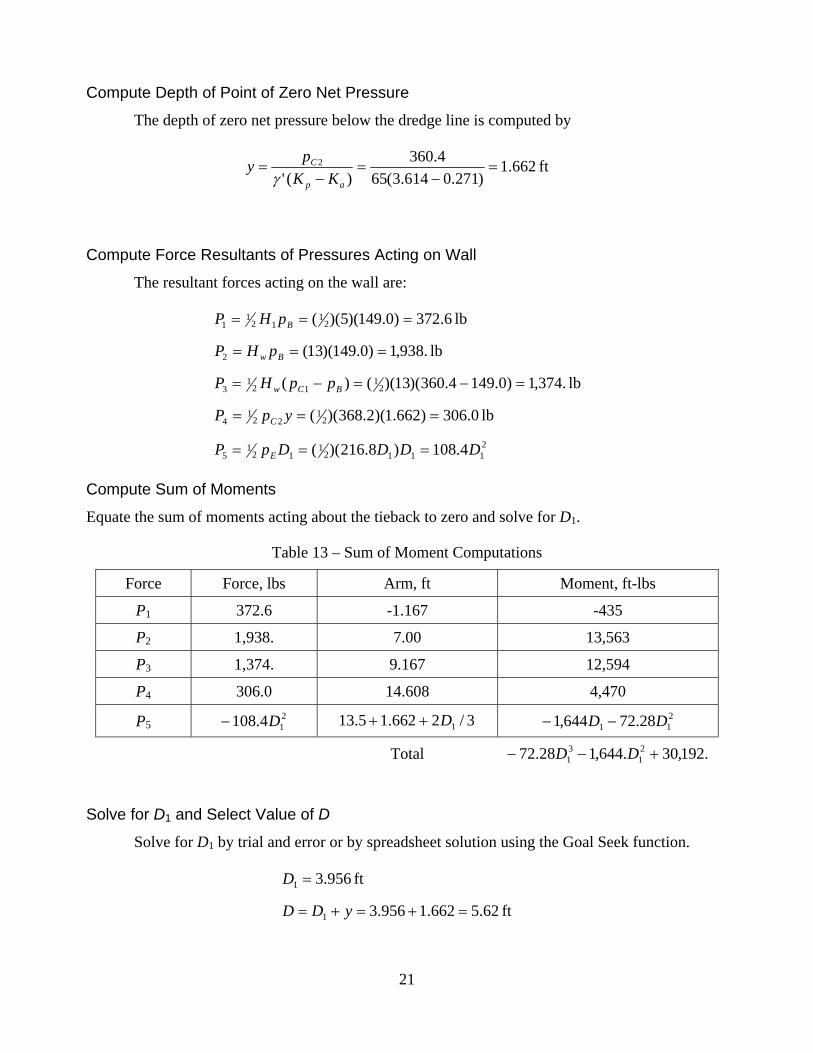
Compute Sum of Moments
Equate the sum of moments acting about the tieback to zero and solve for D1.
Table 13 – Sum of Moment Computations
Force Force, lbs Arm, ft Moment, ft-lbs
P1 372.6 -1.167 -435
P2 1,938. 7.00 13,563
P3 1,374. 9.167 12,594
P4 306.0 14.608 4,470
P5 214.108 D 3/2662.15.13 1D 2
11 28.72644,1 DD
Total .192,30.644,128.72 21
31 DD
Solve for D1 and Select Value of D
Solve for D1 by trial and error or by spreadsheet solution using the Goal Seek function.
ft 62.5662.1956.3
ft 956.3
1
1
yDD
D
22
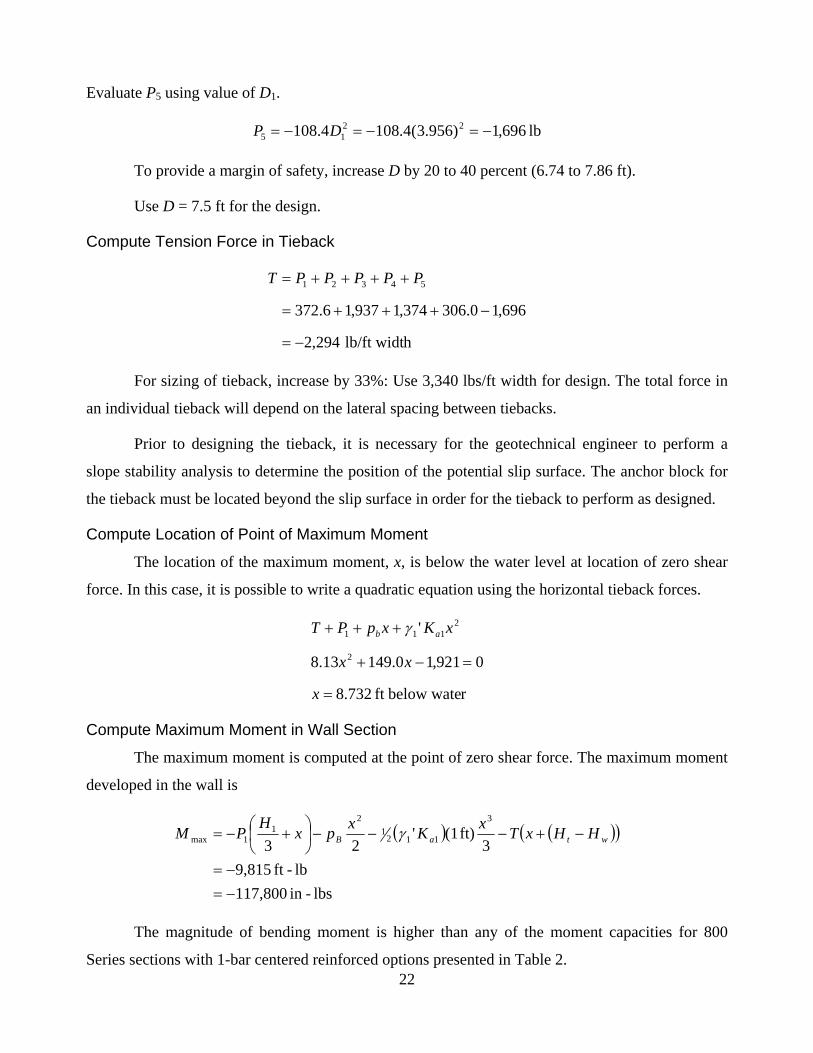
Evaluate P5 using value of D1.
lb 696,1)956.3(4.1084.108 2215 DP
To provide a margin of safety, increase D by 20 to 40 percent (6.74 to 7.86 ft).
Use D = 7.5 ft for the design.
Compute Tension Force in Tieback
hlb/ft widt294,2
696,10.306374,1937,16.372
54321
PPPPPT
For sizing of tieback, increase by 33%: Use 3,340 lbs/ft width for design. The total force in
an individual tieback will depend on the lateral spacing between tiebacks.
Prior to designing the tieback, it is necessary for the geotechnical engineer to perform a
slope stability analysis to determine the position of the potential slip surface. The anchor block for
the tieback must be located beyond the slip surface in order for the tieback to perform as designed.
Compute Location of Point of Maximum Moment
The location of the maximum moment, x, is below the water level at location of zero shear
force. In this case, it is possible to write a quadratic equation using the horizontal tieback forces.
rbelow wateft 732.8
0921,10.14913.8
'
2
2111
x
xx
xKxpPT ab
Compute Maximum Moment in Wall Section
The maximum moment is computed at the point of zero shear force. The maximum moment
developed in the wall is
lbs-in 117,800
lb-ft 9,815
3ft) (1'
23
3
1121
21
1max
wtaB HHxT
xK
xpx
HPM
The magnitude of bending moment is higher than any of the moment capacities for 800
Series sections with 1-bar centered reinforced options presented in Table 2.
23
Checking the options for 2-bar centered reinforcement presented in Table 3, the
reinforcement bar size combined with concrete compressive strengths shown below are acceptable
for this wall section:
No. 8 or larger for f'c = 3000 psi
No. 7 or larger for f'c = 3,500 psi and higher
No. 6 or larger for f'c = 4,500 psi and higher
Checking the options for 4-bar reinforcement presented in Table 4, No. 5 or larger bars
combined with concrete compressive strength of 3,000 psi or high are acceptable for this wall
section:
Design Example Using PYWall 2013
The computer application PYWall 2013 from Ensoft (www.ensoftinc.com) considers soil-
structure interaction by using a generalized beam-column model and analyzes the behavior of a
flexible retaining wall or soldier-pile wall with or without tiebacks or bracing systems. Unlike the
limit equilibrium analysis methods discussed previously, PYWall solves the nonlinear differential
equation for a beam column that ensures compatibility of displacements of the wall and resistance
forces exerted by the soil. In addition, PYWall can include the force versus deformation behavior of
the tiebacks used for anchored walls.
The output from PYWall includes computation and graphs of lateral deflection, bending
moment, and shear force versus wall elevation.
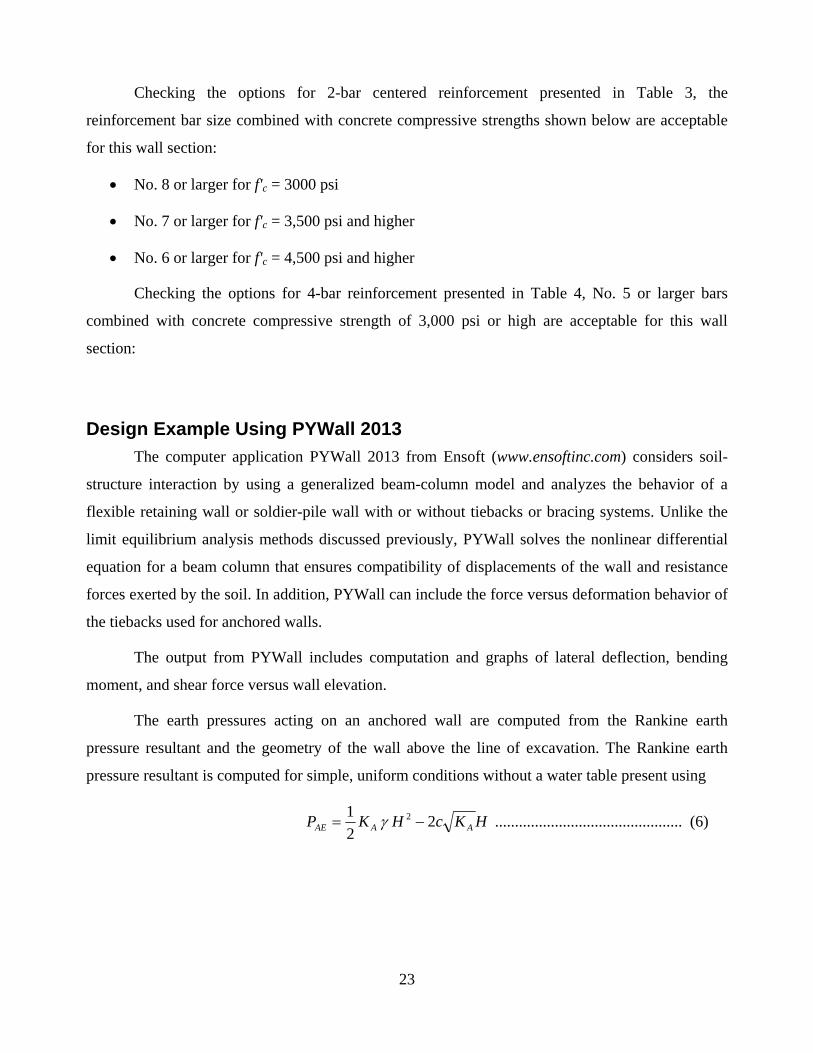
The earth pressures acting on an anchored wall are computed from the Rankine earth
pressure resultant and the geometry of the wall above the line of excavation. The Rankine earth
pressure resultant is computed for simple, uniform conditions without a water table present using
HKcHKP AAAE 22
1 2 ............................................... (6)
24
If the ground slope is inclined at an angle of , the active earth pressure coefficient is computed
using
22
22
coscoscos
coscoscoscos
AK ......................................... (7)
If the ground slope is flat, the active earth pressure coefficient is computed using
sin1
sin1
245tan2
AK .............................................. (8)
H
PAEa 32
3.1 ............................................................. (9)
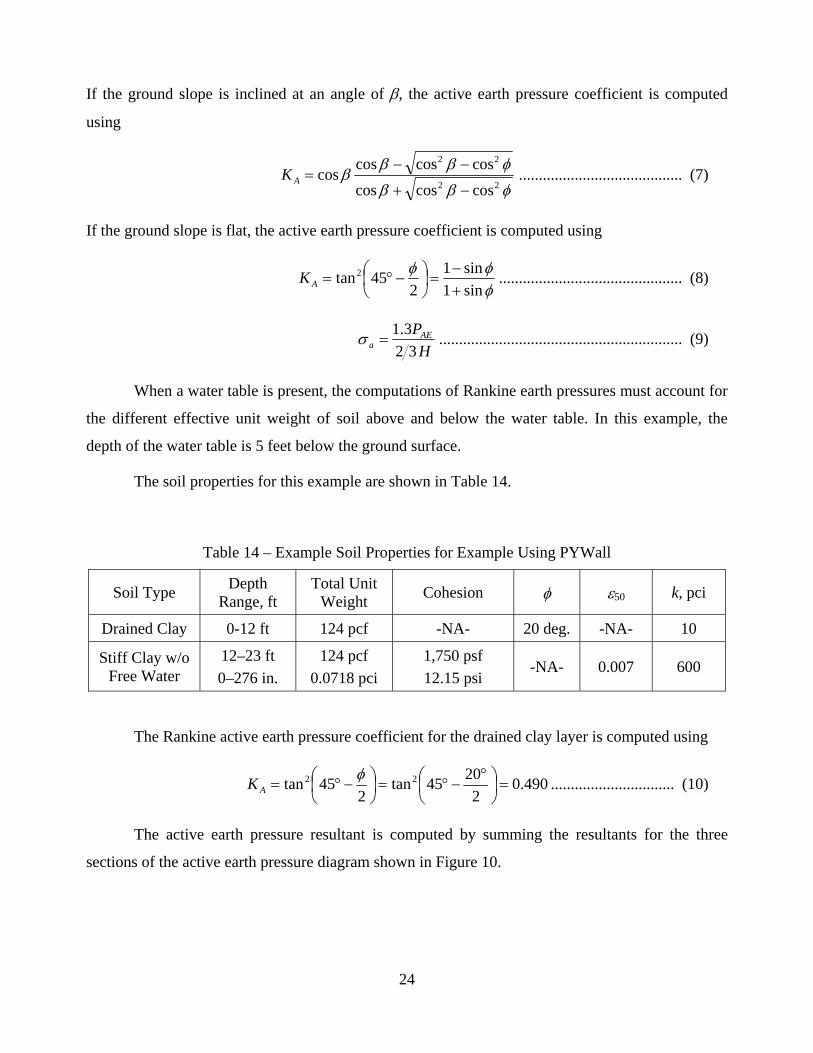
When a water table is present, the computations of Rankine earth pressures must account for
the different effective unit weight of soil above and below the water table. In this example, the
depth of the water table is 5 feet below the ground surface.
The soil properties for this example are shown in Table 14.
Table 14 – Example Soil Properties for Example Using PYWall
Soil Type Depth
Range, ft Total Unit
Weight Cohesion 50 k, pci
Drained Clay 0-12 ft 124 pcf -NA- 20 deg. -NA- 10
Stiff Clay w/o Free Water
12–23 ft
0–276 in.
124 pcf
0.0718 pci
1,750 psf
12.15 psi -NA- 0.007 600
The Rankine active earth pressure coefficient for the drained clay layer is computed using
490.02
2045tan
245tan 22
AK ............................... (10)
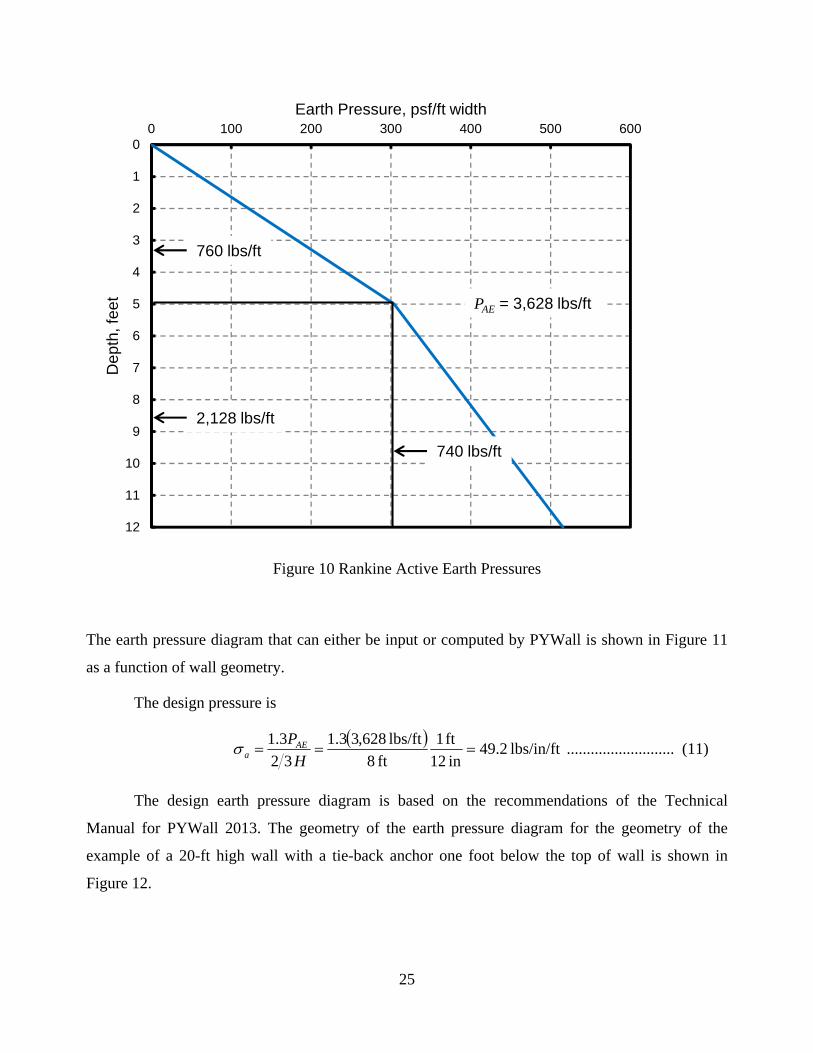
The active earth pressure resultant is computed by summing the resultants for the three
sections of the active earth pressure diagram shown in Figure 10.
25
0
1
2
3
4
5
6
7
8
9
10
11
12
0 100 200 300 400 500 600D
ep
th, f
ee
tEarth Pressure, psf/ft width
760 lbs/ft
2,128 lbs/ft
740 lbs/ft
PAE = 3,628 lbs/ft
Figure 10 Rankine Active Earth Pressures
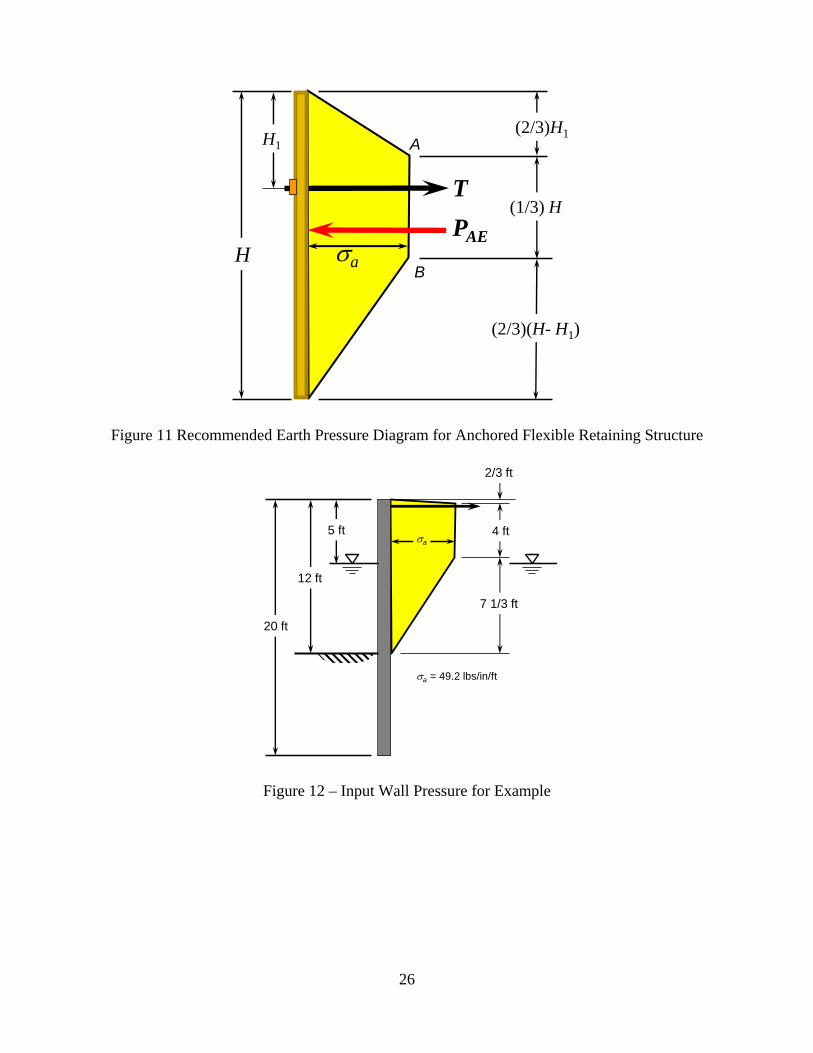
The earth pressure diagram that can either be input or computed by PYWall is shown in Figure 11
as a function of wall geometry.
The design pressure is
lbs/in/ft 2.49in 12
ft 1
ft 8
lbs/ft 628,33.1
32
3.1
H
PAEa ........................... (11)
The design earth pressure diagram is based on the recommendations of the Technical
Manual for PYWall 2013. The geometry of the earth pressure diagram for the geometry of the
example of a 20-ft high wall with a tie-back anchor one foot below the top of wall is shown in
Figure 12.
26
(1/3) H
(2/3)H1
(2/3)(H- H1)
A
BH
H1
T
a
PAE
Figure 11 Recommended Earth Pressure Diagram for Anchored Flexible Retaining Structure
12 ft
20 ft
4 ft
7 1/3 ft
2/3 ft
5 ft a
a = 49.2 lbs/in/ft
Figure 12 – Input Wall Pressure for Example
27
Equivalent Spring Constant for Tieback Anchor Rod
The tieback anchor will be modeled as a linear spring based on the extension of the tieback
anchor bar attached to a unyielding anchor block at a depth one foot below the top of wall. The
spring constant is equal to
tieback
tieback sL
AEk ....................................................... (12)
Where A = cross sectional area of tieback anchor bar, E = Young’s modulus, L = length of anchor
bar, and stieback = horizontal spacing between tieback anchor bars. For a No. 9 bar, 25 ft long, and a
spacing of 6 ft, the anchor spring constant for a 12-inch wide section of wall is
lbs/inch 110,16)in 72)(in 300(
)in 12)(psi 000,000,29)(in 1( 2
tieback
tieback sL
AEk ................ (13)
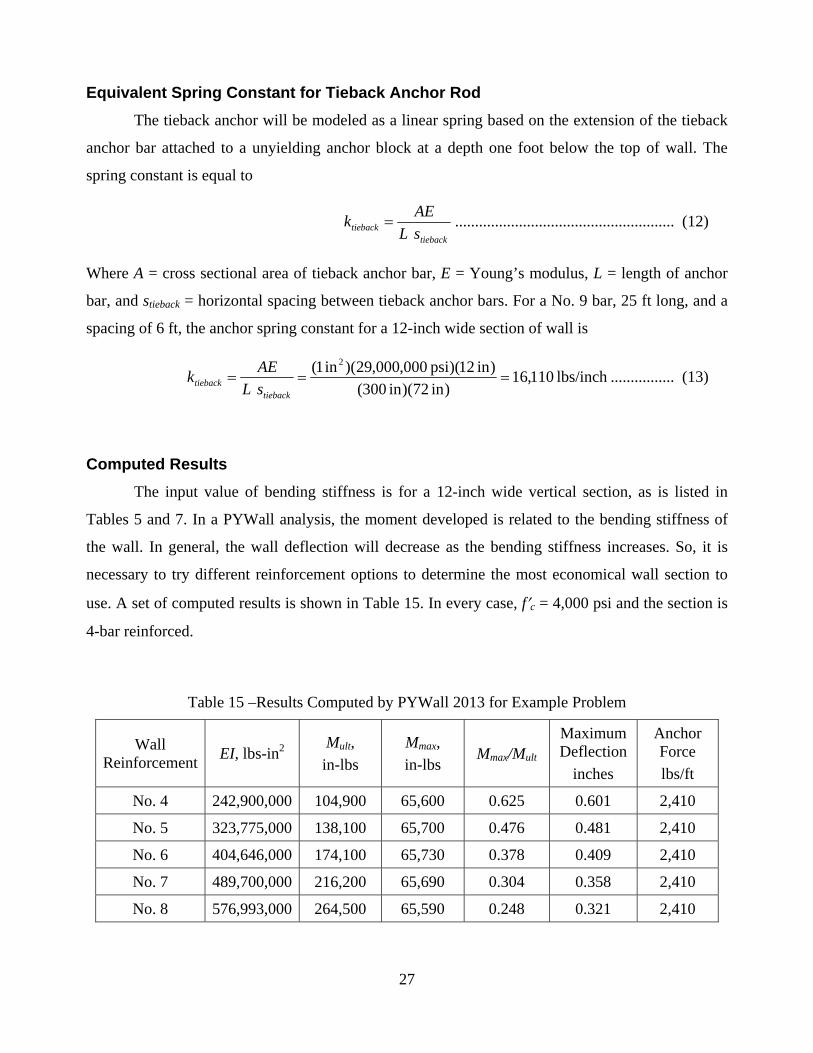
Computed Results
The input value of bending stiffness is for a 12-inch wide vertical section, as is listed in
Tables 5 and 7. In a PYWall analysis, the moment developed is related to the bending stiffness of
the wall. In general, the wall deflection will decrease as the bending stiffness increases. So, it is
necessary to try different reinforcement options to determine the most economical wall section to
use. A set of computed results is shown in Table 15. In every case, fc = 4,000 psi and the section is
4-bar reinforced.
Table 15 –Results Computed by PYWall 2013 for Example Problem
Wall Reinforcement
EI, lbs-in2 Mult,
in-lbs
Mmax,
in-lbs Mmax/Mult
Maximum Deflection
inches
Anchor Force
lbs/ft
No. 4 242,900,000 104,900 65,600 0.625 0.601 2,410
No. 5 323,775,000 138,100 65,700 0.476 0.481 2,410
No. 6 404,646,000 174,100 65,730 0.378 0.409 2,410
No. 7 489,700,000 216,200 65,690 0.304 0.358 2,410
No. 8 576,993,000 264,500 65,590 0.248 0.321 2,410
28
An examination of these results finds that a 800 Series wall section with a concrete
compressive strength of 4,000 psi and reinforced with No. 4 bars is the minimum section that will
work for this example problem. However, the computed wall deflection decreases if larger
reinforcement is used.
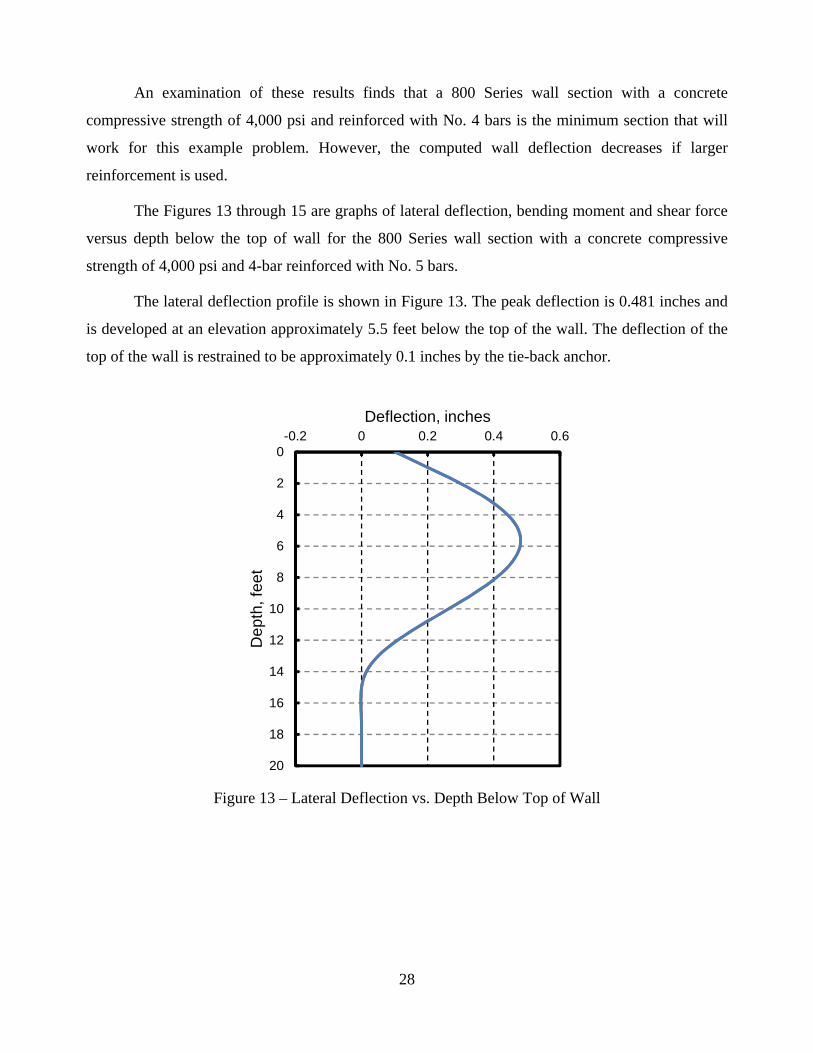
The Figures 13 through 15 are graphs of lateral deflection, bending moment and shear force
versus depth below the top of wall for the 800 Series wall section with a concrete compressive
strength of 4,000 psi and 4-bar reinforced with No. 5 bars.
The lateral deflection profile is shown in Figure 13. The peak deflection is 0.481 inches and
is developed at an elevation approximately 5.5 feet below the top of the wall. The deflection of the
top of the wall is restrained to be approximately 0.1 inches by the tie-back anchor.
0
2
4
6
8
10
12
14
16
18
20
-0.2 0 0.2 0.4 0.6
De
pth
, fe
et
Deflection, inches
Figure 13 – Lateral Deflection vs. Depth Below Top of Wall
29
0
2
4
6
8
10
12
14
16
18
20
-100,000 -50,000 0 50,000 100,000
De
pth
, fe
et
Moment, inch-pounds
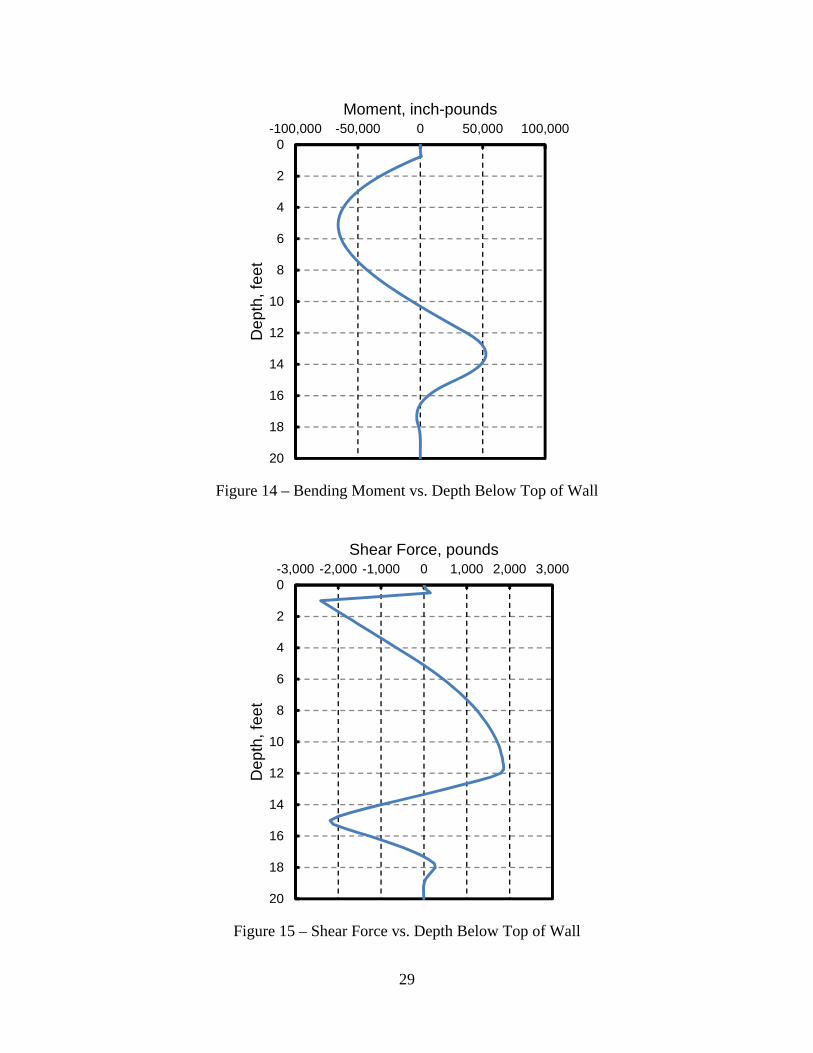
Figure 14 – Bending Moment vs. Depth Below Top of Wall
0
2
4
6
8
10
12
14
16
18
20
-3,000 -2,000 -1,000 0 1,000 2,000 3,000
Dep
th, f
eet
Shear Force, pounds
Figure 15 – Shear Force vs. Depth Below Top of Wall
30
The bending moment profile in the wall is shown in Figure 14. The peak moment is 65,700
in-lbs/ft of wall and occurs at an elevation approximately 5.25 feet below the top of the wall. This is
just above the location for the peak lateral deflection. The bending moment in the wall is close to
zero from the top of wall to the depth of the tie-back anchor at 1 foot.
The shear force profile is shown in Figure 15. There are two locations of high shear force in
the wall and one location of high shear force at the connection point for the tieback anchor. The two
high shear force values are 1,860 lbs/ft width just above the dredge line (12 ft) and a value of 2,190
lbs/ft width at 15 feet below the top of the wall.
The maximum shear force in the wall is due to the tieback and is 2,410 lbs/ft width. The
actual force developed in the tieback will depend on the horizontal spacing between tiebacks. For
example, if the tiebacks are spaced 6 ft apart on centers, the force in an individual tieback is
computed to be 14,460 lbs.
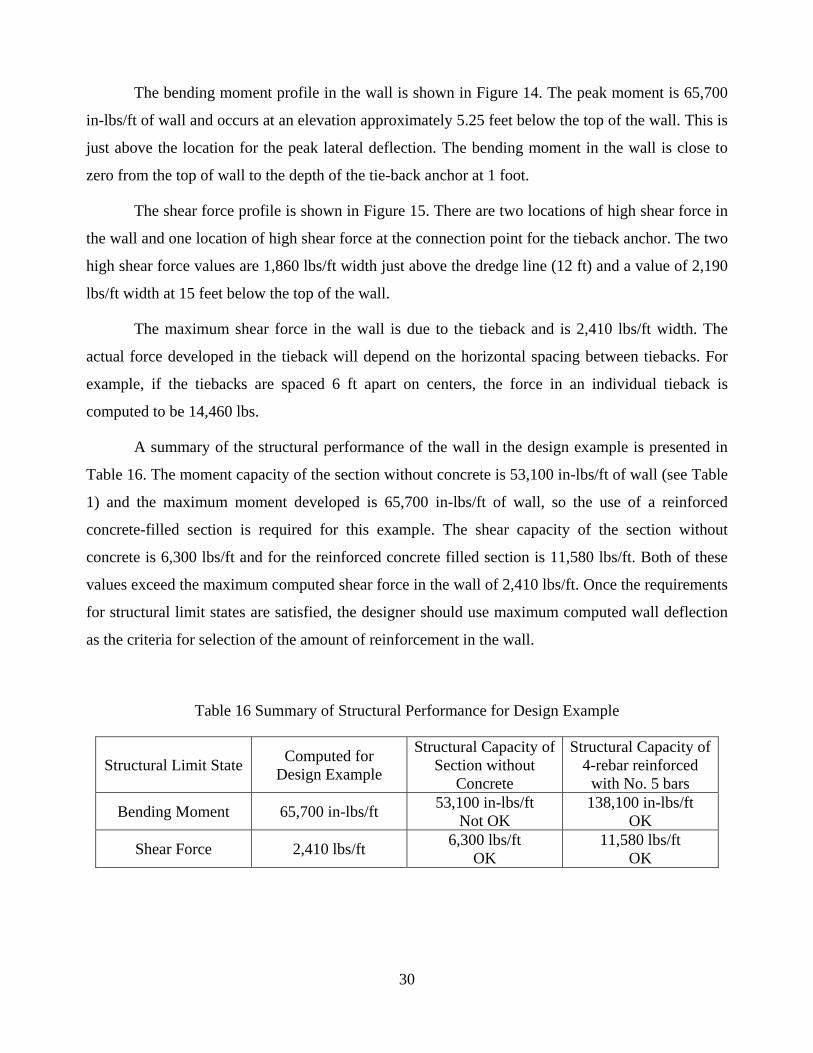
A summary of the structural performance of the wall in the design example is presented in
Table 16. The moment capacity of the section without concrete is 53,100 in-lbs/ft of wall (see Table
1) and the maximum moment developed is 65,700 in-lbs/ft of wall, so the use of a reinforced
concrete-filled section is required for this example. The shear capacity of the section without
concrete is 6,300 lbs/ft and for the reinforced concrete filled section is 11,580 lbs/ft. Both of these
values exceed the maximum computed shear force in the wall of 2,410 lbs/ft. Once the requirements
for structural limit states are satisfied, the designer should use maximum computed wall deflection
as the criteria for selection of the amount of reinforcement in the wall.
Table 16 Summary of Structural Performance for Design Example
Structural Limit State Computed for
Design Example
Structural Capacity of Section without
Concrete
Structural Capacity of 4-rebar reinforced
with No. 5 bars
Bending Moment 65,700 in-lbs/ft 53,100 in-lbs/ft
Not OK 138,100 in-lbs/ft
OK
Shear Force 2,410 lbs/ft 6,300 lbs/ft
OK 11,580 lbs/ft
OK
31
Optimization of the Design
It is possible to optimize the design by reducing or eliminating the steel reinforcement below
the depth in the wall where it is needed. In the design example, the lateral deflection is very small
below 14 ft below the top of wall and the bending moment developed in this section is below the
structural moment capacity of section without concrete. Thus, placement of a gravel fill can be
substituted for the reinforced concrete fill below 14 ft below the top of the wall.
If the maximum tolerable deflection developed in the wall is larger than 0.5 inches, one can
explore the possibility of substituting either a 1-bar centered or 2-bar centered reinforcement option
for the 4-bar reinforcement used in the design example. One should recognize that when the
bending stiffness of the wall is reduced, the lateral deflection developed in the wall will increase.
Thus, it is necessary to repeat the analysis of wall deflections for each reinforcement option being
considered.
References
Blum, H. (1931). Einspannungsverhältnisse bei Bolhwerken. Wilh. Ernst und Sohn, Berlin.
Caquot, A., and Kerisel, J. (1948). Tables for the Calculation of Passive Pressure, Active Pressure and Bearing Capacity of Foundations, Transl. from French by M. A. Bec, Gauthier-Villars, Paris, 120 p.
Clayton, C. R. I., and Milititsky, J. (1986). Earth Pressure and Earth Retaining Structures, Surrey University Press, 300 p.
Naval Facilities Engineering Command, (1986). NAVFAC Design Manual 7.2, Foundations and Earth Structures, US Government Printing Office.
Terzaghi, K., Peck, R. B., and Mesri, G. (1996). Soil Mechanics in Engineering Practice, 3rd Edition, Wiley, New York, 549 p.
United States Steel Corporation (1975). USS Steel Sheet Piling Design Manual, 132 p.
Wang, S.-T. (2013). Technical Manual for Computer Program PYWall 2013, Ensoft, Inc., Austin, Texas, www.ensoftinc.com.
32
Appendix A – Earth Pressure Coefficients for Wall Friction and Sloping Backfill
Figure A1 – Active and Passive Earth Pressure Coefficients with Wall Friction and Sloping Backfill (from NAVFAC ,1986 and Caquot and Kerisel, 1948)