Makes your group Snow Day sensational ALPINE SKI CLUB SKIING AND SNOWBOARDING AT ITS BEST.
Upload
phamkhuongCategory
view
218download
0
Design of a Ski Lift Inspection & Maintenance System May 9, 2018 ─
Katie Barthelson, Shallu Darhele, Miguel Mitra, Pritika Sondhi INSPEX - “Because ski lift inspections shouldn’t be a slippery slope”
1

Table of Contents
Table of Contents 2
1.0 Context Analysis 5 1.1 Ski Resorts and Ski Lifts 5 1.2 Operating Costs 5 1.3 Components 6 1.4 Regulations 8 1.5 Inspection Requirements, Frequency, and Methods 9 1.6 Failure Analysis 12 1.7 Economics of Ski Lift Maintenance 20 1.8 Accident/Incident Statistics 23
1.8.1 Passenger Statistics 23 1.8.2 Occupational Statistics 24
1.8.3 Reliability 25 1.9 Economics of Increased Inspections 27
2.0 Stakeholder Analysis 27 Ski Resorts 28 Maintenance and Inspection Personnel 28 Visitors 28 Parts Manufacturers 28 Regulators 29 NSAA 29 Insurance Companies 29 Other 30
3.0 Gap Analysis and Problem Statement 33 3.1 Gap Analysis 33 3.2 Problem Statement 34
4.0 Need Statement 34
5.0 Concept of Operations 35 General Concept of Operation for the Current Method 35 Proposed Concept of Operations 35 Image Processing for the Aerial and Tower Platforms 37
2

6.0 Design Alternatives 37 Current Method 37 Aerial Platform 38 Tower-based Platform 42 Cameras for Design Alternatives 43
7.0 Requirements 44 7.1 Inspection System Requirements 44 7.1.1 Mission Requirements 44 7.1.2 Functional Requirements 44 7.1.3 Design Requirements 45 7.2 Simulation Requirements 45 7.2.1 I/O Requirements 45 7.2.2 Time I/O Requirements 45 7.2.3 Cost I/O Requirements 46 7.2.4 Accuracy I/O Requirements 46 7.2.4 Availability I/O Requirements 46
8.0 Simulation Design 47 8.1 Time 48 8.2 Cost 49 8.3 Accuracy 49 8.4 Safety 50 8.5 Availability 51
9.0 Design of Experiment 51
10.0 Results 52
11.0 Analysis 55 11.1 Utility Analysis 55 11.2 Analytic Hierarchy Process 56 11.3 Sensitivity Analysis 57 11.4 Cost Versus Utility Analysis 58
12.0 Business Model 59 12.1 Motivation and Business Thesis 59 12.2 Business Model 59 12.3 Market Analysis 60 12.4 Marketing and Sales Strategy 61
3
12.5 Market Competition and Competitive Advantage 61 12.6 Business Costs 62 12.3 Revenue Projection
64
13.0 Verification and Validation 65 13.1 Verification 66 13.2 Validation 68
14.0 Future Work: Predictive Analytics 69
14.0 Project Plan 70 14.1 Statement of Work 70 14.2 Work Breakdown Structure (WBS) 73 14.3 Project Schedule 74 14.4 Critical Path 76 14.5 Budget 78 14.6 Project Risk Mitigation 79
15.0 References 80
16.0 Appendix 82 16.1 Colorado Cause and Failure codes 82 16.2 Simulation Code 83
4

1.0 Context Analysis
1.1 Ski Resorts and Ski Lifts Ski resorts are popular recreation destinations developed specifically for
skiing, snowboarding, and other winter sports. Although the primary season for a
ski resort is winter, ski resorts are now operating their lifts 12 months a year to
expand operations for summer sports such as mountain biking. Ski areas are
mountainous areas with pistes (ski runs), ski trails, and a ski lift system. The NSAA
categorizes U.S. ski areas by region: Pacific Northwest, Pacific Southwest, Rocky
Mountain, Midwest, Northeast, and Southeast. Pennsylvania, Maryland, Virginia and
West Virginia are all part of the southeast region. The United States consists of a
total of 521 ski resorts with 4 operating in Virginia [1]. During the 2015/16 ski
season, the number of customers at ski resorts varied between 50,000 and 499,000
for downhill snowsports [2].
Ski resorts use ski lifts as their primary mode of uphill transportation. A ski
lift is a motor-driven conveyor system used to safely and reliably transport skiers
and sightseers up a slope to the top of a run. Ski lifts typically consist of a series of
bars or seats attached to an overhead moving cable. A total of 2,705 ski lifts are
operated across the US with 18 operating in Virginia [1]. These lifts vary in type,
consisting of traditional double, triple and quad chair lifts, gondolas, surface lifts,
rope tows, and aerial tramways [3]. The case study for operational analysis is Bryce
Resort in Basye, Virginia. It has five surface lifts and two aerial lifts that service 8
runs. The area has 25 acres of skiable terrain and a vertical drop of 500 feet [23].
Bryce Resort was chosen as the case study because their double chair aerial lift is
one of the oldest ski lifts in the country and it is one of the closest ski resorts to
George Mason University.
Skylark Drone Research is investigating the use of unmanned aerial vehicles
(UAVs) to inspect ski lift towers. The purpose of this analysis and system design is to
examine the viability of using UAVs as a potential design alternative for an
5

inspection system in comparison to other alternatives. Some ski resorts operate on
US Forest lands where the use of drone systems is banned, but Bryce Resort does
not fall under US Forest Service rules. There is a non-FAA regulated airfield nearby
with low frequency local traffic that does not interfere with UAV operation over the
lift area. However, inspection personnel would need to obtain a waiver or an FAA 14
CFR Part 107 license to operate a UAV for commercial use.
1.2 Operating Costs The cost of operating a ski lift is based on multiple variables because ski
areas and resorts are both capital and labor intensive. Operating expenses include
direct labor, maintenance and repairs, property/other taxes, land use fees, and
insurance. The average operating expenditure in the Southeast was $13.8 million
for the 2015/2016 season [4]. The largest expense category is direct labor
accounting for 24% in overall expenditures with an average of $7.9 million per ski
area in the 2015-16 season [4]. Lift operations account for 4.1% of expenses and
the average maintenance and repair cost was $735,000 in the 2015-16 season
accounting for 2.3% of overall expenditures. It takes an average of $423,500 to
inspect a ski lift per year [5]. Examples of operating costs include the cost of:
● Installation of ski lifts based on type, configuration, and installation
method
● Running base lodges, which house a variety of services, and their
maintenance
● Purchase, replacement, and labor costs of snow grooming tractors
which move and recondition the snow each night
● Purchase and energy cost of snowmaking equipment
● Energy costs required to run equipment and lifts, and to heat the base
facilities
6
● Labor costs for lift and grooming operators, rental shop technicians,
instructors and patrollers, accounting, road maintenance personnel,
marketers, snowmakers, IT, and administrative support. [6].
The cost of the most recent ski lift installed at Bryce Resort in 2012 was $1.5
million alone. Ski resorts are dependent on the mechanical soundness of their ski
lift components and safety systems in order to operate their businesses. Any
mechanical breakdown could cause closure of the slopes, strand passengers, and
cost their business millions.
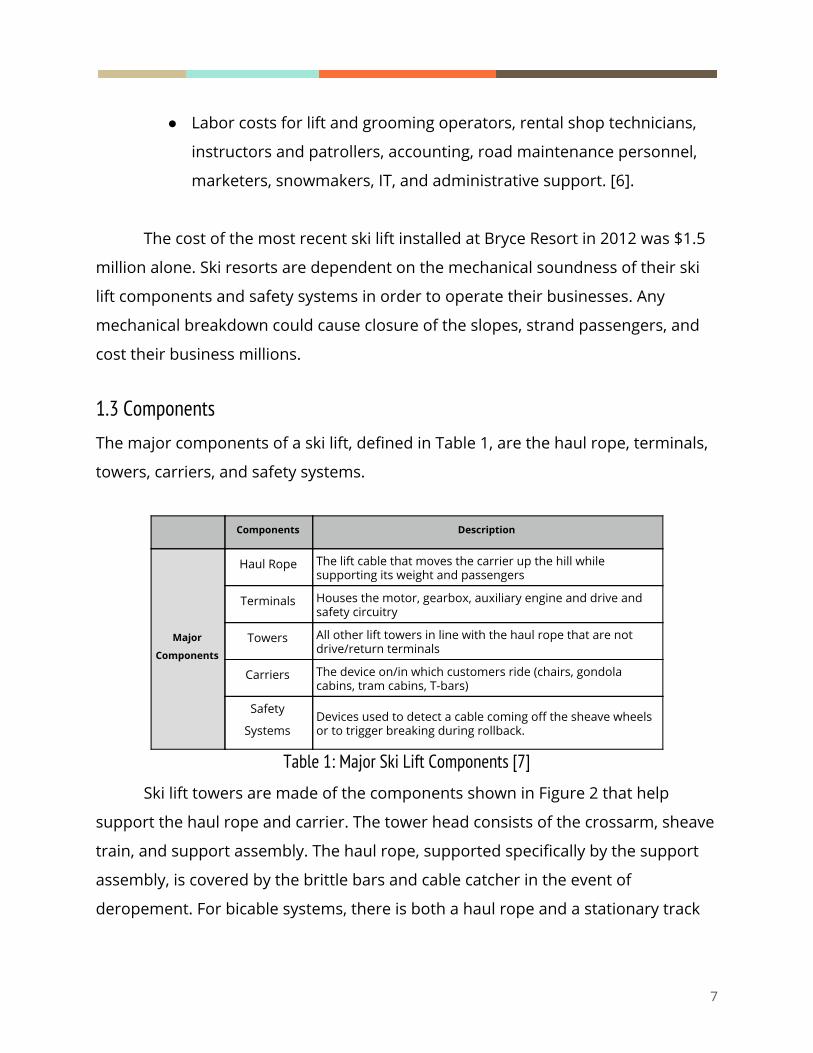
1.3 Components The major components of a ski lift, defined in Table 1, are the haul rope, terminals,
towers, carriers, and safety systems.
Components Description
Major
Components
Haul Rope The lift cable that moves the carrier up the hill while supporting its weight and passengers
Terminals Houses the motor, gearbox, auxiliary engine and drive and safety circuitry
Towers All other lift towers in line with the haul rope that are not drive/return terminals
Carriers The device on/in which customers ride (chairs, gondola cabins, tram cabins, T-bars)
Safety
Systems Devices used to detect a cable coming off the sheave wheels or to trigger breaking during rollback.
Table 1: Major Ski Lift Components [7]
Ski lift towers are made of the components shown in Figure 2 that help
support the haul rope and carrier. The tower head consists of the crossarm, sheave
train, and support assembly. The haul rope, supported specifically by the support
assembly, is covered by the brittle bars and cable catcher in the event of
deropement. For bicable systems, there is both a haul rope and a stationary track
7

rope to support the weight of the carrier. The track rope is supported on the tower
by the saddle, which prevents excessive movement.
Figure 2: Components of the ski lift towers described in this section [8]
Table 3 below defines the subcomponents by component type. The power
components generate and supply the energy for ski lifts to function. The
mechanical components consist of the parts involved in the moving mechanism of
the ski lift. The safety components ensure the ski lift is fail safe by activating when a
failure in the system occurs. Another important component is the communications
line (comm line) which carries data signals from each tower’s safety and operating
circuitry between the base and the summit and mountain dispatch. If the comm
line breaks, a signal is sent to the terminal to indicate a fault, and problems related
to the low voltage control system may occur.
8

Power Components Mechanical Components Safety Components
Components Description Components Description Components Description
Auxiliary Backup power to
the main motor Bullwheel
Large wheel located at both ends
of the lift used to change
directions of the haul rope
Anti-Rollback
Device
A type of brake that prevents
ski lift from rolling backwards
Drive (Low
Voltage Control
System)
Controls speed
and amount of
voltage going to
the main motor
Cross Arm
Arm at the top of the tower to
which the sheave train is
attached
Brittle Bar
A device connected to a safety
circuit that breaks if a cable
comes off the sheave wheel
Gearbox
Transfer power
from the motors
to the bullwheel
Service Brake The main brake used to stop the
lift during daily operations. Cable Catcher
Catches the haul rope if it
comes off preventing the rope
from falling to the ground
Prime Mover Primary motor
Sheave Train
(Walking beam)
A series of sheave wheels on a
crossarm that allows the wheels
to move up and down depending
on the weight of the carrier Emergency
Brake
Stops the ski lifts in case of
emergencies
Sheave Wheel
A wheel with rubber lining that
supports the haul rope and
provides grip/friction
Table 3: Ski Lift Components [7]
1.4 Regulations Ski lifts are regulated under the ANSI B77.1-2017 standards. Prior to being
opened to the public, new or relocated aerial lifts must undergo and pass the
following two test requirements:
1. qualified personnel shall thoroughly test and verify compliance with the
plans and specifications of the designer/manufacturer.
2. designers or manufacturers shall propose and submit an acceptance test
procedure [15].
Following the initial installation phase, as stated in the ANSI B77 standards, ski lift
owners are subject to meet the following conditions for their ski lifts prior to being
opened to the public: ”
a. tightness of all structural connections;
9
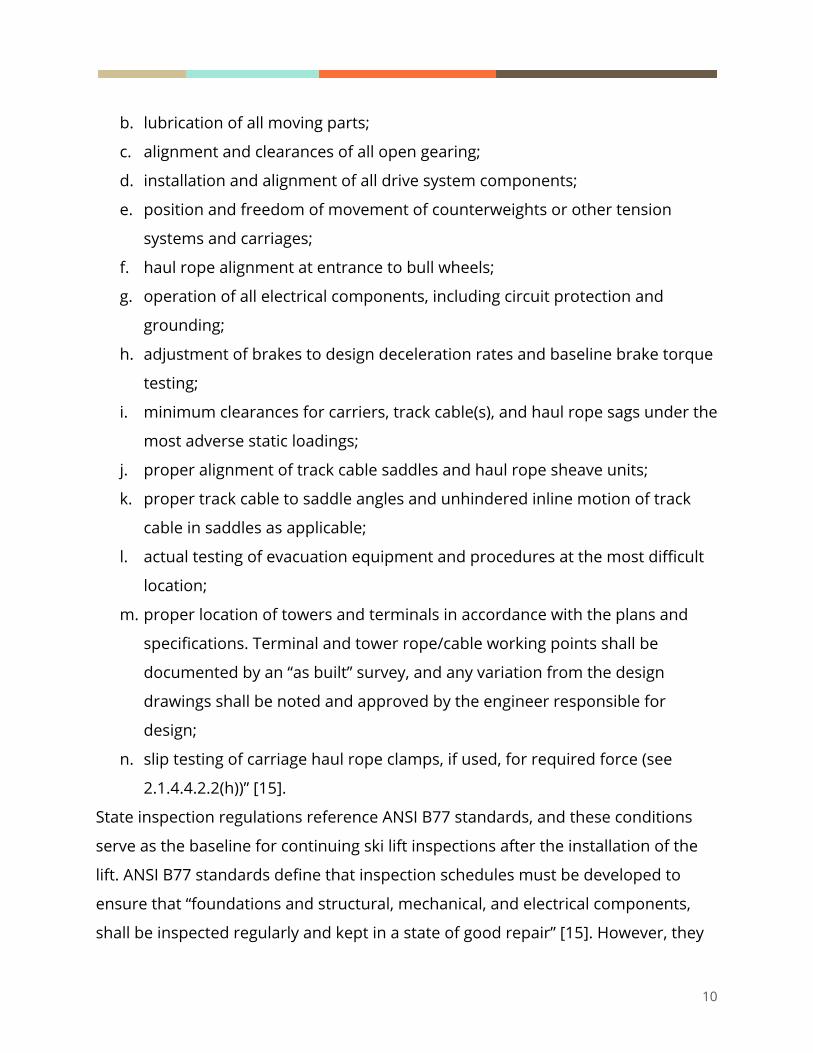
b. lubrication of all moving parts;
c. alignment and clearances of all open gearing;
d. installation and alignment of all drive system components;
e. position and freedom of movement of counterweights or other tension
systems and carriages;
f. haul rope alignment at entrance to bull wheels;
g. operation of all electrical components, including circuit protection and
grounding;
h. adjustment of brakes to design deceleration rates and baseline brake torque
testing;
i. minimum clearances for carriers, track cable(s), and haul rope sags under the
most adverse static loadings;
j. proper alignment of track cable saddles and haul rope sheave units;
k. proper track cable to saddle angles and unhindered inline motion of track
cable in saddles as applicable;
l. actual testing of evacuation equipment and procedures at the most difficult
location;
m. proper location of towers and terminals in accordance with the plans and
specifications. Terminal and tower rope/cable working points shall be
documented by an “as built” survey, and any variation from the design
drawings shall be noted and approved by the engineer responsible for
design;
n. slip testing of carriage haul rope clamps, if used, for required force (see
2.1.4.4.2.2(h))” [15].
State inspection regulations reference ANSI B77 standards, and these conditions
serve as the baseline for continuing ski lift inspections after the installation of the
lift. ANSI B77 standards define that inspection schedules must be developed to
ensure that “foundations and structural, mechanical, and electrical components,
shall be inspected regularly and kept in a state of good repair” [15]. However, they
10
seldom define what a state of good repair is. Inspection methods are also lightly
defined in terms of tolerances.
1.5 Inspection Requirements, Frequency, and Methods Ski resorts are required to follow state inspection requirements and those
mandated by their insurance companies. This project is under the jurisdiction of
Virginia state law, which requires a third-party inspection to be conducted once
annually. In accordance with the law, Bryce Resort has a third-party state inspection
once annually in accordance to ANSI B77 standards and is inspected twice annually
by insurance. In addition to mandatory state and insurance inspections, Bryce
resort also performs two in-house annual inspections, once prior to the summer
season and once prior to the ski season. Additional inspections may be performed
if there is cause for additional concern, such as a guest reporting noise. Other
indications for failure are summarized in Table 4 in section 1.6.
In terms of inspection difficulty, 82% of the ski lift components listed below
can be visually inspected without removing any shields. The communication line
and the ski lift tower base require special inspection procedures. The comm line is
held in a watertight enclosure that is checked every 3-5 years. However, electric
faults in the comm line are indicated in the terminal’s control system which is
checked daily. The ski lift tower base is examined for cracks using X-ray imaging
every 5-10 years at Bryce Resort and is more easily performed prior to snowy
weather. Easier, non-visual checks include the physical inspection of components
and connections such as tightness of bolts measured by torque, and inspection of
abnormal sounds that may come from the tower’s many moving parts. However,
tower inspections themselves are difficult to perform due to the need to climb the
tower often in snowy conditions.
The scope of the system’s capabilities exclude components that can be
inspected from fault indications or in the terminal, components that require the
removal of covers, or tactile inspections. The red underlined components in the
11

table below indicate which components are within scope for visual inspection. Gaps
in system capabilities for the tactile inspection of these components can be
performed during regular tower maintenance, such as greasing.
Table 4: Visual versus Tactile Inspections
12

For comparison, the current inspection procedures for Bryce Resort and
system capabilities are summarized in Table 5 below.
Components Current Inspection Method Required and Practiced Inspection Frequencies
(inspecting party) System Capabilities
Sheave Train Climb up tower and check for
misalignment or cracks visually; listen for noise
Annual (State), Biannual (Insurance), Offseason and
Yearly (resort)
Substitute or increase visual inspections using
enhanced imaging.
-Substitute or increase audio inspections using
enhanced imaging. -Use thermal imaging for
detecting subsurface cracks not visible to the
naked eye.
-Record data to track wear over time and
predict failures when degradation becomes
worse.
Sheave
Wheels/Liner
Climb up tower and check for
misalignment, debris/ice, and
liner wear visually; measure
sheave liner groove depth
Annual (State), Biannual
(Insurance), Offseason and
Yearly (resort), Quarterly
Lubrication Maintenance
(resort)
Brittle Bars
Climb up tower and check for
debris/ice, corrosion; check for
electrical fault in terminal
Annual (State), Biannual
(Insurance), Offseason and
Yearly (resort), daily operator’s
inspection (resort)
Connections and
Welds
Climb up tower and check for
cracks visually; listen for noise;
physically check tightness of bolts
Annual (State), Biannual
(Insurance), Offseason and
Yearly (resort)
Cross Arm
Climb up tower and check for
cracks, corrosion
Annual (State), Biannual
(Insurance), Offseason and
Yearly (resort)
Ski Lift Tower
Structure
Climb up tower and check for
cracks or corrosion; check around
base from the ground for
corrosion and cracks visually
Off-season Inspection (resort)
Table 5: Tower components, inspection procedure, frequency, and system capabilities
13

Due to the safety-critical structural support that ski lift towers provide and
the frequency of component failures related to the tower, the tower is the most
crucial part of ski lift inspections. The difficulty and risk associated with climbing the
tower limit the frequency at which ski lift towers can be inspected. In general, there
are five inspections performed annually for ski lift tower components, which have
gaps of two to three months between them in which component failures can go
unnoticed. The timeline for inspections can be found in Figure 6.
Figure 6: A yearly timeline for full-system inspections performed at Bryce Resort (tower
inspections). 1.6 Failure Analysis
The purpose of inspections is to catch failures before they occur. Ski lifts
have had 18 mechanical failures nationally resulting in accidents since 1972 [3].
There are four categories of failure type: deropement, rollback, detachment, and
safety system failures. The types of incidents associated with ski lift tower
components and their respective indications are described in Table 7.
14
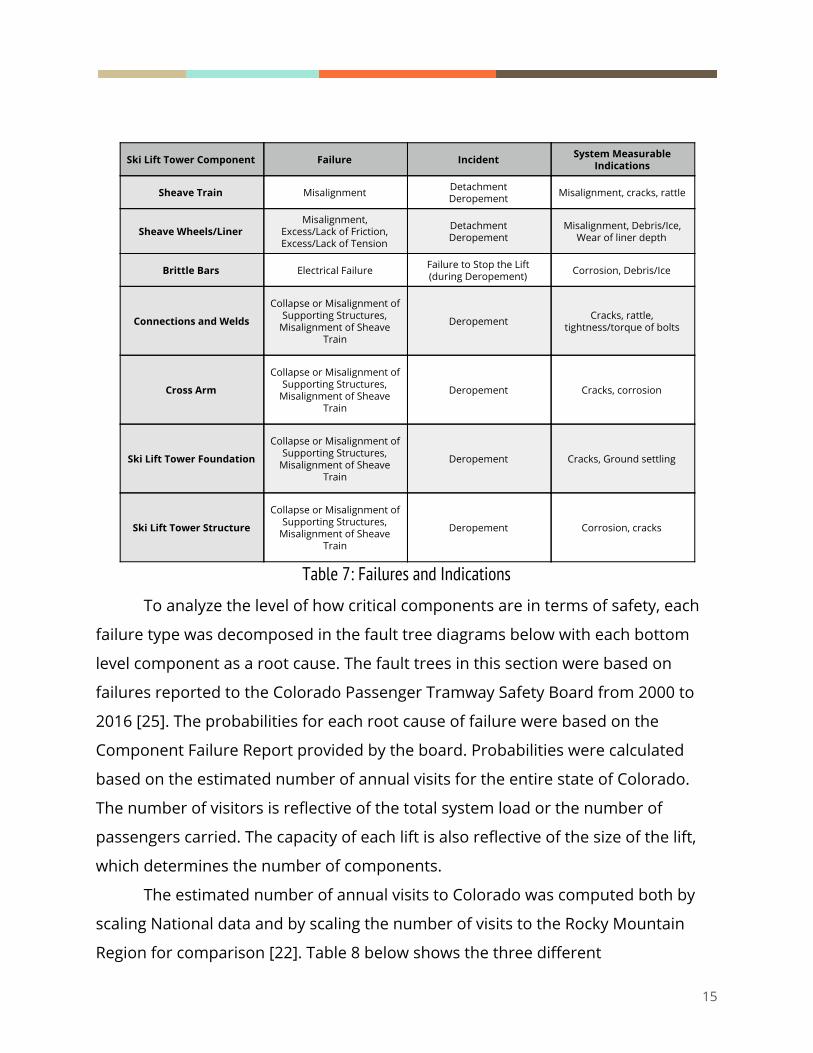
Ski Lift Tower Component Failure Incident System Measurable Indications
Sheave Train Misalignment Detachment Deropement Misalignment, cracks, rattle
Sheave Wheels/Liner Misalignment,
Excess/Lack of Friction, Excess/Lack of Tension
Detachment Deropement
Misalignment, Debris/Ice, Wear of liner depth
Brittle Bars Electrical Failure Failure to Stop the Lift (during Deropement) Corrosion, Debris/Ice
Connections and Welds
Collapse or Misalignment of Supporting Structures,
Misalignment of Sheave Train
Deropement Cracks, rattle, tightness/torque of bolts
Cross Arm
Collapse or Misalignment of Supporting Structures,
Misalignment of Sheave Train
Deropement Cracks, corrosion
Ski Lift Tower Foundation
Collapse or Misalignment of Supporting Structures,
Misalignment of Sheave Train
Deropement Cracks, Ground settling
Ski Lift Tower Structure
Collapse or Misalignment of Supporting Structures,
Misalignment of Sheave Train
Deropement Corrosion, cracks
Table 7: Failures and Indications
To analyze the level of how critical components are in terms of safety, each
failure type was decomposed in the fault tree diagrams below with each bottom
level component as a root cause. The fault trees in this section were based on
failures reported to the Colorado Passenger Tramway Safety Board from 2000 to
2016 [25]. The probabilities for each root cause of failure were based on the
Component Failure Report provided by the board. Probabilities were calculated
based on the estimated number of annual visits for the entire state of Colorado.
The number of visitors is reflective of the total system load or the number of
passengers carried. The capacity of each lift is also reflective of the size of the lift,
which determines the number of components.
The estimated number of annual visits to Colorado was computed both by
scaling National data and by scaling the number of visits to the Rocky Mountain
Region for comparison [22]. Table 8 below shows the three different
15

categorizations of resort size for the Rocky Mountain Region as well as the average
number of visitors reported per category from the 2015-2016 NSAA Economic
Analysis Report Survey [1]. Based on the average number of visits reported per
resort size category and the number of areas of that size, the total number of visits
for the Rocky Mountain Region can be calculated. Of the reporting resorts, 18 out of
the 29 resorts were from Colorado. The sum calculated for the Rocky Mountain
Region survey from Table 9 was used to estimate the number of visits to Colorado
resorts. The number of visitors was estimated by using a ratio of the reporting
Colorado resorts to the total number of reporting resorts in the region. Compared
to a common estimate that Colorado is responsible for 20% of all National visits,
the sum of the surveyed resort sizes for the Rocky Mountain Region from 2015/16
is actually 18.5% of the overall national visits.
Table 8: Surveyed Average Visitors per Size for the Rocky Mountain Region[1]
Table 9: Total Reported Visitors from Table 7 above Scaled to Estimate Colorado [1].
From the actual recorded national visits and visits for the Rocky Mountain
Region, the averages were taken for both methods and compared. Due to annual
variation, the average for the past 16 years of the 20% scaled estimate is actually
20.6% of the overall average of recorded national visits. By ratio, the scaled
estimate is 22.8% of the overall average of recorded national visits. Table 10 below
shows a year to year scale comparison.
16

Table 10: Total Visitors Recorded by the NSAA since 2000, scaled to Colorado [22].
A t-test was performed to compare the 20% scale and resort ratio scale to
confirm that the difference between means is statistically significant (Table 11
below). Since the p-value is less than the confidence level of .05, these scales used
to estimate the number of visitors are not equal. The 20% scale has a smaller
variance and it provides the closest value to the surveyed visits for the Rocky
Mountain region in Table 8. For the fault trees and simulation, the estimated
number of visitors for the state of Colorado will be based on the 20% scale
highlighted in Table 9 above.
17

Table 11: t-Test Comparison
Deropement failures are caused by excess or lack of friction between the
haul rope and wheels, misalignment of sheave train, track rope system failures,
bullwheel failures, and excess or lack of tension in the haul rope. Excess or lack of
friction is caused by wear in the sheave liner, tensioning system, or too much/little
lubrication. Misalignment of the sheave train is caused by wear in the bearings and
axles, sheave wheels, connections and welds, and the sheave wheel liner. Excess or
lack of tension can be caused by either tensioning or the collapse/misalignment of
supporting structures. Collapse or misalignment of supporting structures can be
caused by the cross arm, connections and welds, or the ski lift tower base, footing,
or structure. Other supporting structures for the haul rope include a failure of the
bullwheel. Bicable systems can also have deropement due to the track rope failing.
A derailment of either rope can cause the other rope to also come off the tower.
18
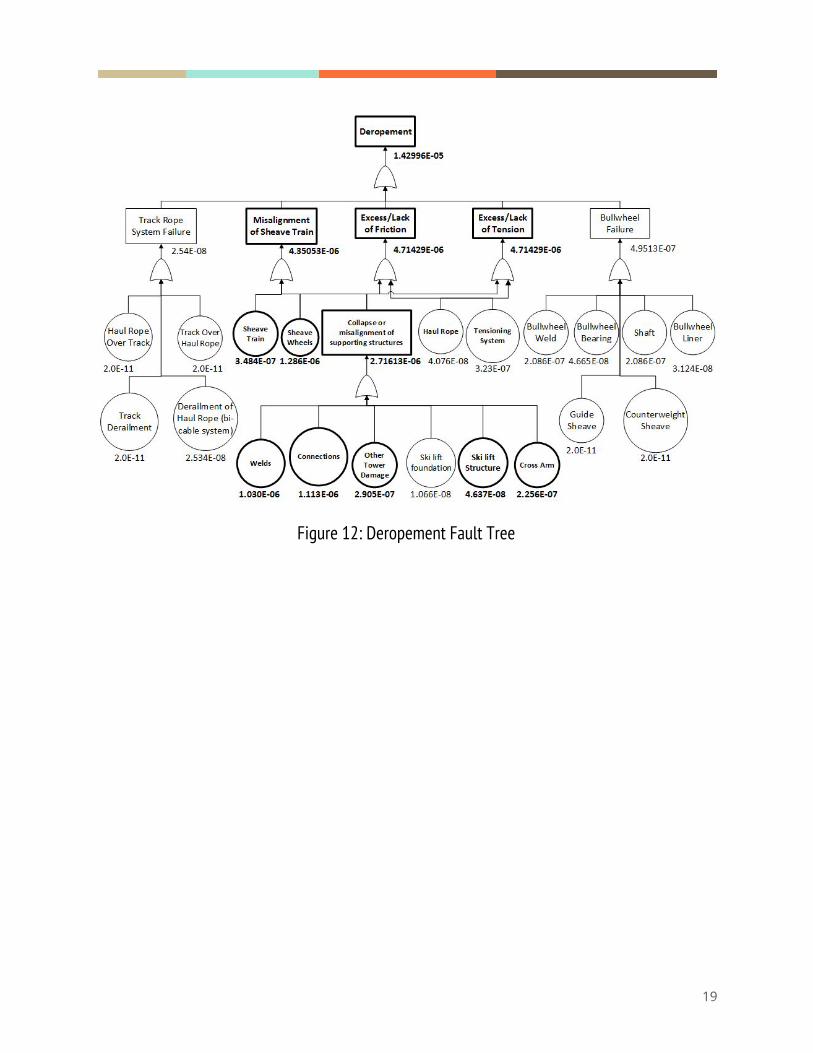
Figure 12: Deropement Fault Tree
19

Rollback failures are caused by loss of circuit connections, motor failures and
brake failures as shown in Figure 13 below. Loss of circuit connections involve
components such as the electrical circuit, brakes, and motor failure. Motor Failure
involves components such as the gearbox, the prime mover drive, and auxiliary
motor. Brake Failure involves components including the gearbox and the
anti-rollback brake. Electrical failures can be caused by the low voltage control
system or an incoming power failure.
Figure 13: Rollback Fault Tree
20
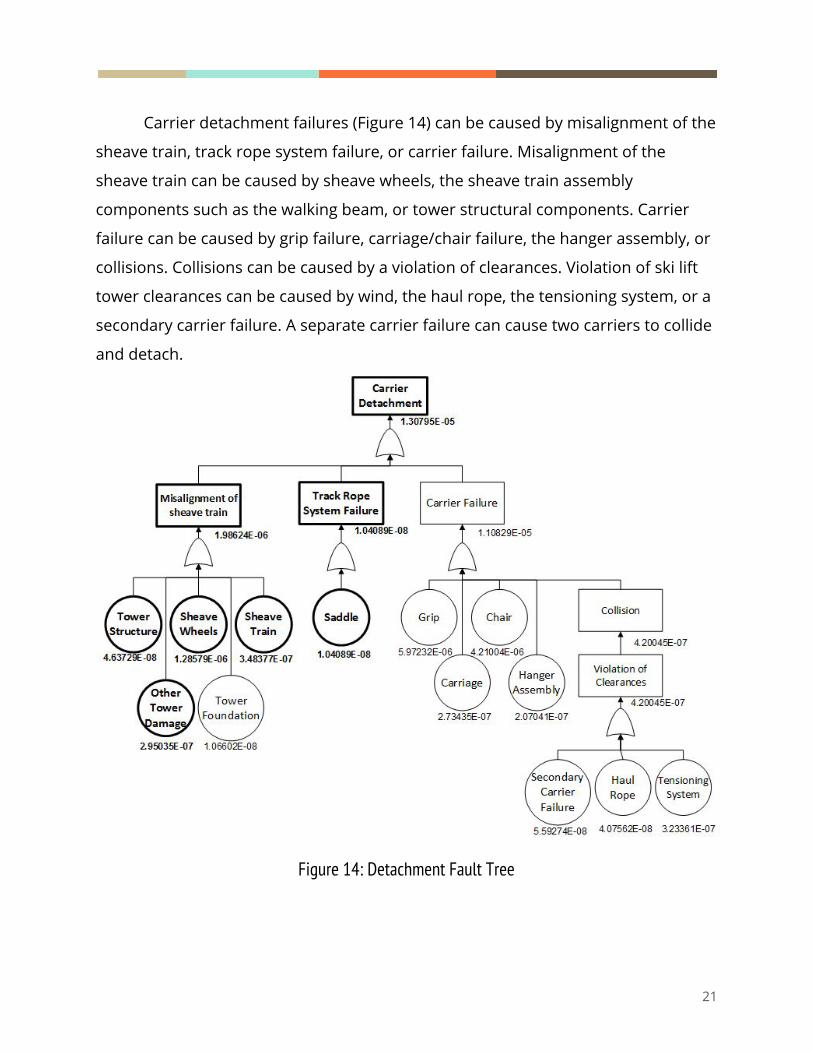
Carrier detachment failures (Figure 14) can be caused by misalignment of the
sheave train, track rope system failure, or carrier failure. Misalignment of the
sheave train can be caused by sheave wheels, the sheave train assembly
components such as the walking beam, or tower structural components. Carrier
failure can be caused by grip failure, carriage/chair failure, the hanger assembly, or
collisions. Collisions can be caused by a violation of clearances. Violation of ski lift
tower clearances can be caused by wind, the haul rope, the tensioning system, or a
secondary carrier failure. A separate carrier failure can cause two carriers to collide
and detach.
Figure 14: Detachment Fault Tree
21

Safety system failures result in the failure to stop a ski lift. Figure 15 further
decomposes these failures. The failure to stop a ski lift is caused by emergency
brake failure, service brake failure, rollback brake failure or electrical failures. Brake
failures are a result of component failures such as the physical brake itself or a
failure in the gearbox. The failure of manually triggered brakes such as the
emergency or service brake can also be attributed to the user. Electrical failures can
be attributed to the brittle bar or a failure in the low voltage control system that
controls acceleration and deceleration of the lift.
Figure 15: Failure to Stop Lift Fault Tree.
22
1.7 Economics of Ski Lift Maintenance All component failures have a cost associated. Component failures prolong
ski lift closures and increase costs due to the required re-inspection prior to
reopening. On February 20, 2016, Vermont’s Suicide Six Ski Area had an inspection
following an accident at another resort serviced by the same manufacturer. During
the inspection, cracks found in a crossarm resulted in a mandatory five day closure
of the resort while all welding and a complete inspection could be performed [9]. In
2016, ski resorts in the Northeast averaged 2,323 daily visits with an average $89.89
of revenue per visit of [4]. Based on those figures, a 5 day closure costs $1,044,072
in revenue losses alone. Table 16 below summarizes repair procedures, time, and
costs for ski lift tower components and components impacted by tower component
failures.
23

Table 16: Component repair procedure and cost [10].
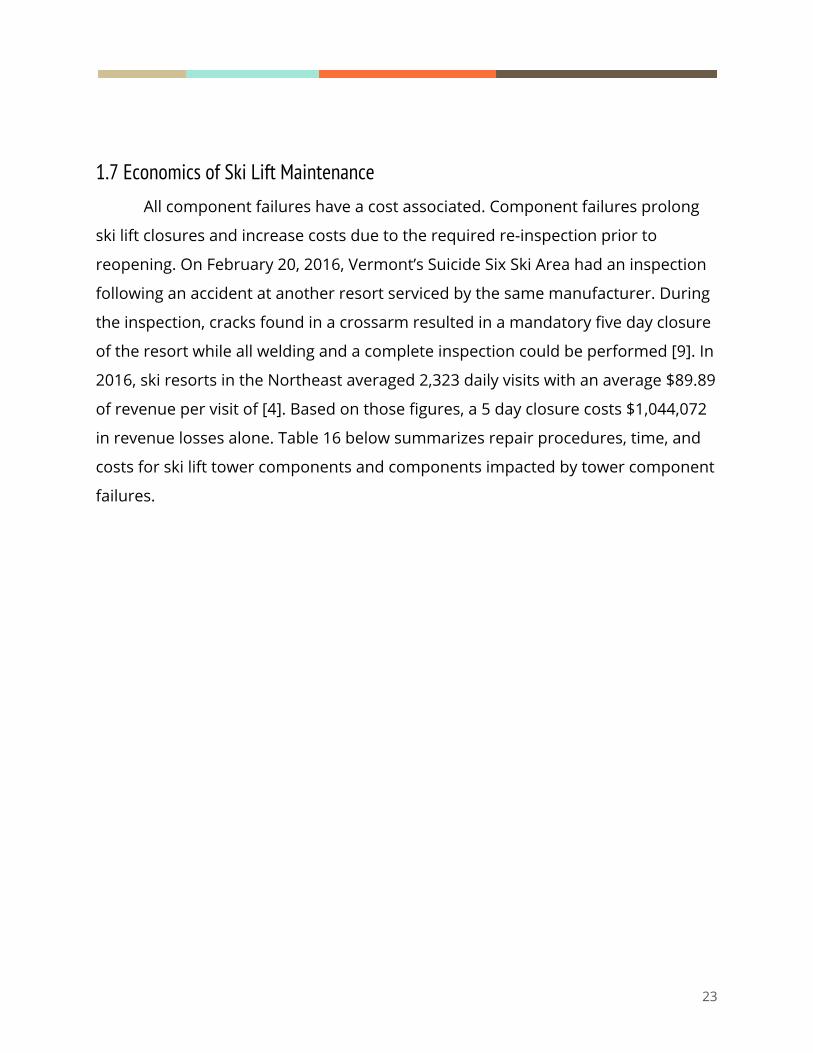
The cost per component replacement and the annual number of component
failures found from the Colorado Passenger Tramway Safety Board were used to
calculate the total cost in Figure 17 below. Common failures require a greater
number of part replacements which add up over the life of a lift. The cost of
replacing certain components is comparable to buying a new lift. By comparison of
failure frequency and individual repair cost, repairs to the foundation are the most
costly over the life of a lift, followed by haul rope repairs, sheave train repairs, and
repairs to the tower structure.
24
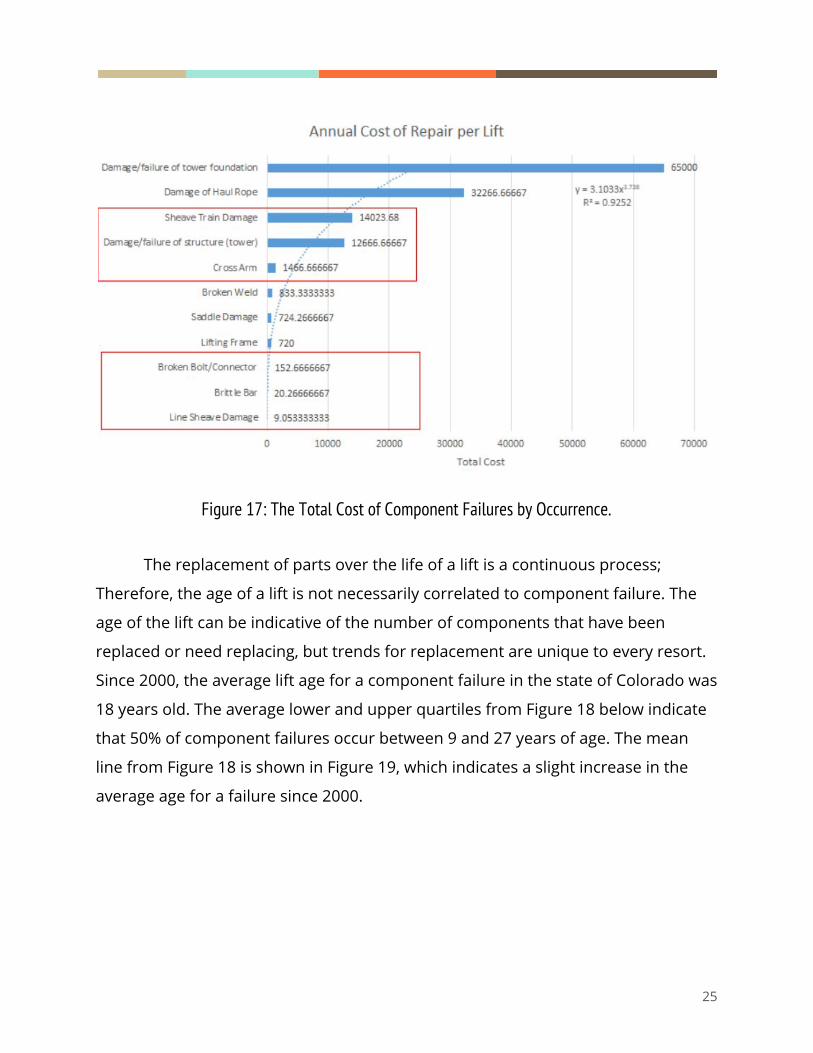
Figure 17: The Total Cost of Component Failures by Occurrence.
The replacement of parts over the life of a lift is a continuous process;
Therefore, the age of a lift is not necessarily correlated to component failure. The
age of the lift can be indicative of the number of components that have been
replaced or need replacing, but trends for replacement are unique to every resort.
Since 2000, the average lift age for a component failure in the state of Colorado was
18 years old. The average lower and upper quartiles from Figure 18 below indicate
that 50% of component failures occur between 9 and 27 years of age. The mean
line from Figure 18 is shown in Figure 19, which indicates a slight increase in the
average age for a failure since 2000.
25

Figure 18: Component Failure by Lift Year Over Time
Figure 19: Average Lift Year for a Component Failure Over Time
26

1.8 Accident/Incident Statistics
1.8.1 Passenger Statistics
During the 2015/16 US ski season, there was a total of 52.8 million skier visits
resulting in 19.8 billion passenger miles [3]. Since 1972, there have been a total of
19 accidents involving ski lift malfunctions resulting in passenger injuries and
fatalities in the United States. Of the 19 incidents, 6 resulted in fatalities (with the
last reported death occurring in 2016) [3]. The overall lift fatality rate is 0.418/yr
equating to 0.211 fatalities per 100 million miles transported by ski lifts. Accidents
not involving ski lift mechanical failures (i.e. passengers falling) are not included in
this analysis.
The severity of accidents is measured by the number of fatalities and injuries
by each cause. Deropements are the most common and the most fatal type of
accident. A summary of accident severities can be found in Figure 21 below.
Figure 21: Severity of Accidents by Cause, based on average injuries and fatalities.
The number of accidents over the past 43 years has fluctuated but injuries
and fatalities are significantly lower now compared to the 1970s and 1980s [3]. The
27

number of accidents, fatalities, and injuries over time is shown in Figure 22. Before
a fatal accident in late 2016, the last reported fatality occurred in 1993. During the
23 year period of no fatalities, there were 46 injuries across 6 accidents relating to
ski lift malfunctions.
Figure 22: Frequency of Accidents, Fatalities, and Injuries by Year
Although the period 2001-2017 appears to have a lower average number of
accidents and injuries than 1971-2000, the t-test shown in Figure 23 indicates that
the difference in the means is not statistically significant. The number of fatalities
has decreased, but the rate of accidents has not decreased. Considering accidents
are random events and accident severity is not easily controlled, the overall safety
for ski lift systems has not improved.
28

Figure 23: A Comparison of Accident Distributions for 1971-2000 and 2001-2016.
1.8.2 Occupational Statistics
According to the National Safety Council (NSC), one of the top ten causes of
serious workplace injuries is falls to a lower level (second leading in unintentional
fatal events and the fifth leading event in days away from work). Maintenance
personnel use ladders to reach ski lift tower tops. Of the varying falls to a lower
level, 33% occur on ladders resulting in days away from work [11]. The Bureau of
Labor Statistics (BLS) tracks data on the number of nonfatal occupational injuries
and illnesses for skiing facilities in the US. Although the data does not specifically
state how many incidents are directly related to maintenance and inspections of ski
lift towers, it provides a general idea of the amount of risk that maintenance
personnel experience. Figure 24 below shows the number of workplace incidents
per year from 2006-2015. It should be noted that not all incidents are related to ski
lift towers and not all falls are related to maintenance personnel. However, a t-test
shows that installation, maintenance and repair personnel have a higher rate of
injury than other ski resort employees for falls including ladder related incidents.
29

Figure 24: Number of non-fatal skiing facility occupational injuries in the US [23]
1.8.3 Reliability As discussed in section 1.8.1, the severity of incidents involving mechanical
ski lift failures has declined since the 1970’s. According to the Colorado Tramway
Safety Board, from 2001-2012, only 2% of the 227 non-fatal chairlift incidents in
Colorado were caused by mechanical failure [12]. However, several mechanical
failures have occurred in recent years, in part due to age of the ski lifts [13]. In early
2016, an accident took place in the Timberline Four Seasons Resort in West Virginia
after a failure in the cross arm caused the haul rope to slip free sending 25 people
to plummet 30 feet to the ground. The lift was installed in 1985 [14]. Within days
after the West Virginia incident, Vermont’s Suicide Six Ski Area closed down a
40-year old lift when cracks were discovered on the towers where the towers meet
the crossarm [14].
Visitor statistics are gathered and calculated by the NSAA. To calculate
statistics and rates, the NSAA made the following assumptions:
1. For each skier visit, the average rate is 7.5 rides per visit.
2. The average lift ride is 0.5 miles long in distance traveled.
30

To analyze the severity of accidents, several lists were compiled and cross-verified
between the NSAA’s reports and Illicit Snowboarding’s compilation of newspaper
articles. Between 1972 to 2016, there have been 19 recorded accidents involving
mechanical failure which resulted in 13 fatalities and 220 injuries. The NSAA
estimates 16.7 billion ski lift rides since 1972 (43 years) based on their conservative
assumptions of data trends tracked since 1978. The probability of an accident,
death, or injury occurring per ride is summarized in Table 26 below. Due to these
specific accidents’ causes, the probability of an accident occurring per ride is
equivalent to the probability of a catastrophic mechanical failure per ride.
Event Total number of
events since 1972
Average number of
events per ride
Average number of
events per year
Accidents 19 1.1377 x10⁻⁹ 0.4419
Deaths 13 7.7844 x10⁻¹⁰ 0.3023
Injuries 220 1.3174 x10⁻⁸ 5.1163
Table 26: Average Accident, Death, and Injury per ride and per year.
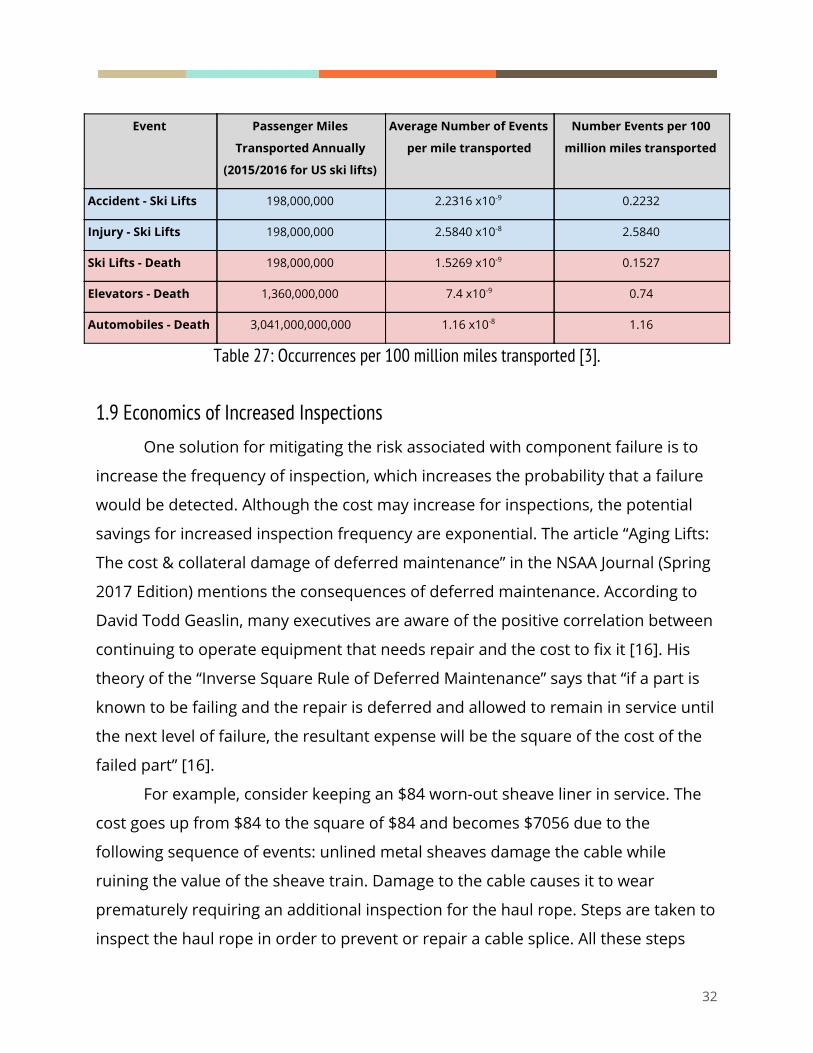
For comparison to other modes of transportation, the NSAA estimates an
average of .5 miles traveled per ski lift ride, which equates to 8.35 billion miles
transported since 1972. The comparison between ski lifts, elevators, and
automobiles for the number of deaths per 100 million miles transported shows that
a person is five times more likely to die in an elevator than a ski lift and eight times
more likely to die in an automobile than a ski lift. However, a passenger is more
likely to be injured on a ski lift than to die in an automobile per 100 million miles
transported, as shown in Table 27.
31
Event Passenger Miles
Transported Annually
(2015/2016 for US ski lifts)
Average Number of Events
per mile transported
Number Events per 100
million miles transported
Accident - Ski Lifts 198,000,000 2.2316 x10⁻⁹ 0.2232
Injury - Ski Lifts 198,000,000 2.5840 x10⁻⁸ 2.5840
Ski Lifts - Death 198,000,000 1.5269 x10⁻⁹ 0.1527
Elevators - Death 1,360,000,000 7.4 x10⁻⁹ 0.74
Automobiles - Death 3,041,000,000,000 1.16 x10⁻⁸ 1.16
Table 27: Occurrences per 100 million miles transported [3].
1.9 Economics of Increased Inspections One solution for mitigating the risk associated with component failure is to
increase the frequency of inspection, which increases the probability that a failure
would be detected. Although the cost may increase for inspections, the potential
savings for increased inspection frequency are exponential. The article “Aging Lifts:
The cost & collateral damage of deferred maintenance” in the NSAA Journal (Spring
2017 Edition) mentions the consequences of deferred maintenance. According to
David Todd Geaslin, many executives are aware of the positive correlation between
continuing to operate equipment that needs repair and the cost to fix it [16]. His
theory of the “Inverse Square Rule of Deferred Maintenance” says that “if a part is
known to be failing and the repair is deferred and allowed to remain in service until
the next level of failure, the resultant expense will be the square of the cost of the
failed part” [16].
For example, consider keeping an $84 worn-out sheave liner in service. The
cost goes up from $84 to the square of $84 and becomes $7056 due to the
following sequence of events: unlined metal sheaves damage the cable while
ruining the value of the sheave train. Damage to the cable causes it to wear
prematurely requiring an additional inspection for the haul rope. Steps are taken to
inspect the haul rope in order to prevent or repair a cable splice. All these steps
32

incur labor cost. However, if the sheave liner problem causes a serious injury, the
cost can square again to an upward of $50 million and any potential incident could
ruin the resort’s reputation [16]. One increment of increased inspection will save an
amount equivalent to the square root of current replacement costs. Increased
inspections also save the immeasurable cost of losing a human life.
2.0 Stakeholder Analysis Primary stakeholders are: Ski Resorts, Maintenance and Inspection
Personnel, and Visitors. Ski resorts profit driven and own ski lifts so they take the
brunt of the costs for maintenance and repair. They are also accountable for safety
and reliability of the ski lifts. However, maintenance and inspection personnel are
directly responsible for the safety of the lift. A new system would cost the resorts
money and it would impact the maintenance budget of the personnel. Visitors are
the main source of revenue for ski resorts and experience the most risk when using
ski lift systems. The price of visitor tickets is also dependent on resort expenditures,
which has a direct impact on their revenue and capability to price competitively.
Other stakeholders include parts manufacturers, insurance companies and the
NSAA who works with regulators, such as the ANSI and USFS. Overall, tensions
between stakeholders are due to cost and risk and nothing would prevent a full
implementation of a new inspection system as everyone benefits from improved
safety and decreased costs.
Ski Resorts Ski resorts are the primary stakeholders for this project. Ski resorts need to
ensure that the ski lifts meet ANSI safety standards as well as individual state
requirements for operation and insurance requirements. Bryce Ski Resort in
Virginia is the case study for this project. Their operational procedure and lift
specifications will be the basis of the simulation design. Their objective is to
maintain safety, minimize cost, and maximize profitability of their operations. A
33

tension exists between ski resorts and inspection personnel due to the potential for
increased costs and the risk for maintenance personnel performing their duties.
Maintenance and Inspection Personnel Maintenance personnel are also primary stakeholders and are responsible
for the inspection, maintenance and repair procedures of ski lifts. They are the
end-users of this project who will ultimately use the system. This group of
stakeholders also includes the third party inspectors, such as state inspectors and
insurance inspectors, that experience similar risks and have the same objectives.
Their objective is to minimize risk and provide safety to personnel and visitors
regardless of the cost, which causes a tension with ski resort owners looking to
profit.
Bryce Resort personnel currently inspect ski lift towers once before the start
of every ski season and once prior to the summer season. As part of their objective
for minimizing risk, there has been an expressed desire by Bryce Resort employees
to increase ski lift tower inspections as often as once daily.
Visitors The objective of ski resort visitors is to use amenities at an affordable rate
and safe transportation up slopes. Visitors are prone to the risks involved in using
ski resort amenities, facilities, and attractions. A tension exists between visitors and
ski resorts over liability for safety and increasing prices.
Parts Manufacturers Parts manufacturers are responsible for supplying reliable systems as well as
replacement parts for the duration of the ski lift system’s life. They are also
responsible for supplying maintenance and inspection recommendations for every
individual ski lift installation, as is required by ANSI B77 Standards. Their objective is
to sell ski resorts a reliable system and provide new parts. Tensions exist to
34

maintain a reasonable cost while making a profit as well as following all required
regulations.
Regulators American National Standards Institute (ANSI) is an organization that provides
standards and enforces compliance for various systems in the United States. ANSI’s
objective is to ensure that ski resorts conform to their standards in order to
maintain safety for visitors. A tension exists between regulators and ski resorts due
to the complexity and cost of maintenance.
The Federal Aviation Administration (FAA) regulates and permits the use of
unmanned aerial vehicles (UAV), also known as drones. Under 14 CFR Part 107, the
FAA requires drone pilots to be certified for commercial operations where
“commercial” means any kind of flight operation that can be tied to economic
benefits [17]. Therefore, ski resort drone operators are required to obtain a waiver
and/or a Part 107 drone certification. Official FAA records show Bryce Resort owns
Sky Bryce--a daylight operations only, VFR only, privately owned airport. Their
objective is to enforce aviation safety. A tension exists for resorts that wish to use
drones on their property.
The US Forest Service regulates and provides permits for ski resorts that
operate on US Forest Lands. Ski resorts on US Forest Lands must comply with their
additional requirements for inspection. The US Forest Service currently bars the use
of drones on US Forest Lands regardless of the existing FAA allowances. Their
objective is to regulate ski lift operations with respect to safety of people and land
protections. A tension exists for resorts that wish to use drones on their property.
NSAA The National Ski Areas Association is a trade association that represents the
ski industry in the United States. It ensures industry growth and provides necessary
promotion by hosting conferences, trade shows and bi monthly publications. The
35

NSAA also provides training, manuals, and ensures that the industry complies with
regulations [18]. Their objective is to provide information about the industry to
promote economic growth. A tension exists between the NSAA, regulators, and
visitors to provide accurate information on the safety of ski lifts.
Insurance Companies Insurance Companies provide protections for ski resorts if an incident were
to occur. Insurance can involve the ski resort, employees and workers
compensation, as well as the ski lift itself. Their objective is to ensure compliance
with ANSI B77 standards by requiring their own independent inspections. Another
objective is to charge for insurance with respect to the amount of risk. A tension
exists between ski resorts and insurance companies to keep costs low while
providing the same coverage.
Other The other stakeholders in the system include the local businesses, local
governments, parts manufacturers/suppliers and insurance companies. A new
inspection system would be beneficial to these stakeholders. Increased visitors
benefit local businesses and governments due to increased sales and taxes. The
main benefits of the system are financial, maintaining reduced costs, and
maximizing returns on investments (ROI).
36

Stakeholder Objectives Tensions Notes
Ski Resorts
- profit from ticket sales
- optimize ski lift
performance
-ensure ski lift safety to
visitors
- with maintenance personnel:
risk, increased cost
- with regulators:
cost of regulation compliance,
increased cost of maintenance
Primary Stakeholder
Maintenance &
Inspection
Personnel
Earn income
Work in safe environment
- with ski resort:
hazardous working environment, job
involves risk
Primary Stakeholder
Visitors Use ski resort amenities for
leisure
- with ski resorts: safety concerns
about ski lift usage
Primary Stakeholder
Parts
Manufacturers
profit from ski lift owners -with ski resorts: to keep costs low
over the life of lifts
-with regulators: follow all regulations
Primary Stakeholder
Regulators
provide standards and
regulations to ensure safety
- with ski resorts:
rigid and complex regulations could
increase costs for ski resorts
- ANSI
- FAA
- USFS
NSAA
represent and ensure
continued growth in skiing
industry
-with visitors and regulators:
Providing accurate information on the
safety of ski lifts while protecting
industry interests.
Insurance
Companies
profit from premiums in
exchange for benefits to ski
resorts
-with ski resorts: to keep costs low and
provide adequate coverage
Local Government collect taxes from local ski
resorts and businesses
with ski resorts
Local Businesses
profit from economy created
by the influx of customers in
the area visiting ski resorts
with local government local economy grows
as ski resorts expand
into the summer
months
Table 28: Stakeholders Objectives and Tension Table
37

Figure 29: Stakeholder Tensions and Interactions Diagram
3.0 Gap Analysis and Problem Statement
3.1 Gap Analysis Ski lift towers play a vital role in ski resort operations. It takes an average of
$423,500 to inspect a ski lift tower. Global temperatures have been rising at a rate
of 0.35℉ per decade for the last 4 decades. Due to climate change, Virginia has seen
a 6 day reduction in the average ski season length (105 days in 2014-15 to 99 days
in 2015-16), a 4.9% decrease. The shortening of ski season length has negatively
38
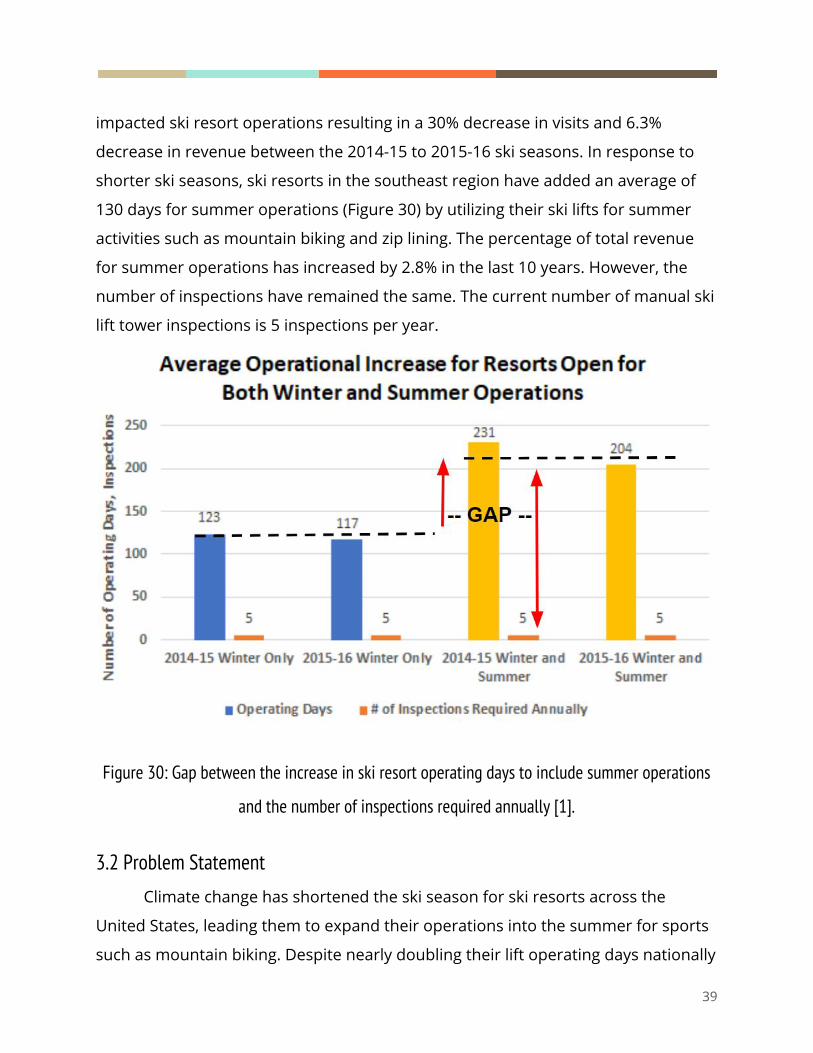
impacted ski resort operations resulting in a 30% decrease in visits and 6.3%
decrease in revenue between the 2014-15 to 2015-16 ski seasons. In response to
shorter ski seasons, ski resorts in the southeast region have added an average of
130 days for summer operations (Figure 30) by utilizing their ski lifts for summer
activities such as mountain biking and zip lining. The percentage of total revenue
for summer operations has increased by 2.8% in the last 10 years. However, the
number of inspections have remained the same. The current number of manual ski
lift tower inspections is 5 inspections per year.
Figure 30: Gap between the increase in ski resort operating days to include summer operations
and the number of inspections required annually [1].
3.2 Problem Statement Climate change has shortened the ski season for ski resorts across the
United States, leading them to expand their operations into the summer for sports
such as mountain biking. Despite nearly doubling their lift operating days nationally
39

from 117 to 204 days on average and subjecting lifts to a wider range of
temperatures, the number of inspections has remained constant due to the danger
of climbing lift towers and limited maintenance budgets (National Ski Areas
Association). The inspection schedule at Bryce Resort in Virginia, the case study for
this analysis, leaves gaps of two to three months between its five annual
inspections in which failures can go unnoticed and cause an accident. However,
more frequent inspections would increase the risk for inspectors. The current
inspection method is also primarily visual and vulnerable to inaccurate subjective
human judgement, as there are no numerical thresholds for component failures
nor tools for consistent data collection or archiving.
4.0 Need Statement The growing demand on ski lifts has created a need for more frequent
inspections to decrease the probability that component failures will remain
undetected. However, an increase in inspection frequency would increase the risk
for inspectors. Therefore, there is a need for a safer, more cost-effective alternative
method to inspect ski lift towers to reduce workplace incidents by 20%. An
alternative method of inspection can also provide consistency of measurements,
manage inspection data for easier access, and develop numerical thresholds for
preventative maintenance.
5.0 Concept of Operations
General Concept of Operation for the Current Method The current maintenance strategy is a combination of running components
to failure with minimally scheduled preventive maintenance [19]. Preventive
maintenance is usually set by time, usage, or hours of operation with the intention
of identifying parts that are degrading. The degradation of ski lift components is
40

impacted by the hours of operation and ski season length, load factor and the
number of visitors, weather (temperature and precipitation), and frequency of parts
replacement or inspection. Due to the interoperability of ski lift components, a
worn part or misalignment can cause wear or failure in other parts. Outside of
regularly performed maintenance (i.e. greasing and tightening of bolts), inspections
serve as a precursor for the maintenance of ski lift tower components as they
identify needing repairs.
Current inspections are primarily visual and stored on paper logs. Paper logs
do not provide any method of data tracking and analysis. There are few numeric
thresholds for component failures and inspections heavily rely on personal
experience which can be subjective. Personnel must climb the lift towers and
record information after the completion of the inspection which is both dangerous
and inaccurate. During the time between the inspection and when the information
is recorded on paper, inspectors can forget important details or measurements.
The concept of operations for the overall process of inspection is summarized in
Figure 31.
Figure 31: CONOPS for the Current Inspection Process
41

Proposed Concept of Operations To obtain a safe system and minimize the probability of failure, gaps in
operation can be filled with a new system to increase frequency of inspections,
begin preventative maintenance, and identify when the lift should be inspected
through predictive analytics.
A ski lift inspection system would apply visual and thermal technology
integrated with an automated image processing software to identify defects and
indications for failure. The inspection system can be equipped with lights to
improve visibility for image processing. The system would replace the human eye
with thermal and HD cameras for visual data collection, replace paper with a
cloud-based data management system, and replace subjective component health
differentiation with image processing. Images and videos can be stored on the
cloud for data analysis and archiving. Through consistent data collection and
analysis, resorts can review their failure progression in an organized report. More
frequent inspections and predictive data analysis can also provide resorts advanced
warning on repairs which can lower repair costs.
Figure 32: Proposed Concept of Operations
42

A list of inspected components was developed from Bryce Resort’s Inspection
Schedule and ANSI B77 Standards. A list of inspected tower components can be
found in Table 33 with their Mean Time Between Failure (MTBF) which was analyzed
from data from the Colorado Passenger Tramway Safety Board. Based on the
lowest MTBF, the frequency of inspections should be increased to weekly.
Table 33: Inspected Components, Inspection Type, Frequency, and Requirements
Image Processing for the Aerial and Tower Platforms Images from HD and Thermal Cameras can be processed using OpenCV.
OpenCV is an open source library for asynchronous and real-time computer vision
algorithms. Indications for failure that can be identified through image processing
include wheels out of alignment, wheels wobbling, structural cracks, debris or ice
that can cause component failure, and corrosion in the tower structure or brittle
bars. Optical flow algorithms can track motion between video frames for dynamic
analysis as shown in Figure 34 below. Other image processing algorithms include
corner and circle detection or color analysis. Heat signatures from the thermal
cameras can indicate hot bearings or areas with excessive friction, which can also
be analyzed through color analysis.
Figure 34: Image Processing Application for Motion Tracking (Side view and top view)
43

6.0 Design Alternatives
Current Method The current process for ski lift inspections is a manual inspection process by
which personnel use a ladder to climb up to the top of each tower. Under section
3.1.3.1 - Towers of the ANSI B77 standards, ground personnel must be provided a
means for ground access to tower tops. Every resort is required to have a minimum
1:1 ratio of portable ladders to towers. Portable ladders are allowed to extend up to
no more than 20 feet (6.10 meters). Therefore, towers greater than 20 feet in height
are required to have permanent ladders. Personnel must be provided work
platforms along each tower crossarm for access to all line sheave and saddle
assemblies. Personnel must also be provided permanent anchor points on all tower
tops for the attachment of fall protection devices [15].
This method involves manual labor which incurs cost, is time consuming, and
puts personnel at risk of falling. Manual tower inspections take an average
inspection time of 31 minutes per tower and cost $423,000 per year. In 2015, there
were 20 incidents involving maintenance, inspection, and repair personnel, for
more information refer to Figure 18 in Section 1.8.2 [23]. The frequency of tower
inspections is extremely low due to the level of risk associated with climbing the
tower. This method has a significant gap in time between tower inspections leading
to unnoticed degradation and component failures. For example, Bryce Resort
recently had a ski lift stop and strand riders on a busy Saturday when the weight of
a mud dauber nest caused a brittle bar to break.
Inspection data is stored on paper logs. Information is recorded after time
has passed, which causes personnel to forget details. There are few numeric
thresholds that allow resorts to track failure progression and paper logs can be lost
and forgotten.
44

Aerial Platform An unmanned aerial vehicle (UAV)-based system would allow for indirect
inspection of components and monitoring at a higher frequency than manual
inspections without increasing risk for personnel. The drone will be equipped with
thermal and high definition cameras, and it will fly along the lift line to inspect
tower by tower. The cameras would allow for higher-ranging angle views of
components and replace purely visual inspections with less subjective numerical
measurements. Thermal cameras allow for the damage inspection of the ski lift
components by observing the component’s surface temperature. The high
definition cameras will be used to capture images and record videos for detecting
damages using visual inspection. All data and recordings collected will be stored in
removable memory card and transferred on the cloud. Analysis of data including
image processing and damage evaluation will be performed on the ground by the
evaluating inspector after the conclusion of the inspection.
Figure 35: UAV - based inspection
The Aerial Platform requires precise operation by personnel for the safety of
skiers and other personnel that may be in the area. An aerial platform
45

procedure was developed based on the required list of components, safety,
efficiency, and ease of operation. A pictorial summary of the tower inspection
procedure can be found in Figure 36 below.
46

Figure 36: A Summary of Upper-Tower Inspection Procedures
47

Aerial Platform Pre Checklist Procedure:
1. Before beginning inspection, identify whether or not the current wind and
temperature conditions are operable. The maximum operable wind speed
for the DJI Matrice 100 is 22 knots (25 mph). The lowest recommended
temperature is 20 degrees Fahrenheit (-6 Celcius).
2. Prior to inspection, take note of the speed of the operating lift. The speed
may have an effect on any mechanical analysis as well as the time required
for a stationary inspection to capture at least three wheel rotations. Normal
winter operations are 400 ft/min, which equates to 3.18 sheave wheel
rotations per second. Normal summer operations are 200 ft/min, which
equates to 1.59 sheave wheel rotations per second. Operating speeds should
be consistent to the season when performing inspections.
3. If the wind is within operable speeds, setup and calibrate the UAV System
and ensure the battery is full before operating. It is recommended that the
operator have at least three fully charged spare batteries on hand. The
operator should follow the 30% rule, meaning the aerial device should return
to the operator for battery replacement after 70% of the battery has been
drained.
4. The operator must be aware of ski lift tower clearances. The operator must
maintain a minimum of 10 feet separation from the tower, which is 5 feet
from the moving path of the chair due to the collision avoidance system. A
visual observer is required to guarantee separation between the aerial device
and the tower to prevent collision and damage. Prior to an aerial inspection,
it is recommended that resorts remove tree branches that would limit a
UAV’s tower clearances.
5. Prior to inspection, the area must be cleared of people or cordoned off. All
personnel must be aware of the inspector’s operation. If the ski resort is
within 5 miles of an airport, the operator must contact the necessary entities
prior to flight. It is recommended that all resorts check the B4UFly app for
any regional restrictions.
48

6. Personnel may choose to wear reflective gear or an identifiable pilot’s vest so
resort guests and other personnel can easily identify the drone operator.
Inspection Procedure during Normal Lift Operations:
7. Inspection Point 1: Starting from a point on the ground that is a minimum
of 10 feet away from the tower, climb to be level and centered with the front
of the sheave train on the uphill side of the tower and move no closer than 5
feet from the sheave train. Record video for a minimum of 20 seconds,
maintaining as stationary of a position as possible.
8. Climb up to be 10 feet above the tower and cross the tower height to be 10
feet from the downhill side of the tower at Inspection Point 2. Align the UAV
with the center of the downhill sheave train and move no closer than 5 feet
from the sheave train. Record video for a minimum of 20 seconds,
maintaining as stationary of a position as possible.
9. Climb to be 10 feet above the tower height and center the UAV above the top
of the downhill sheave train at Inspection Point 3. Inspect the uphill sheave
train by hovering over the center of the sheave train and recording video for
20 seconds.
10.Maintain a height of 10 feet above the tower and begin to cross the tower
frame to be centered on the tower at Inspection Point 4. Inspect the top of
the tower structure by maintaining a stationary position over the center and
recording video for 20 seconds.
11.Continue along the tower frame to Inspection Point 5, maintaining the 10
foot height above the tower. Align with the center of the top of the uphill
sheave train and record video for 20 seconds as stationary as possible.
12.Cross the tower frame to be centered 10 feet away from the front of the
downhill side at Inspection Point 6. Angle the camera slightly downward to
inspect the tower structure. Record video for 30 seconds at a stationary
position.
49

13.Cross to the uphill side of the tower and rotate the aerial device so that the
camera faces the uphill tower structure at Inspection Point 7.
14.Climb to the height of the next tower, maintaining a 10 foot buffer from the
side and top of the tower. Fly the lift line to continue to the next tower. The
next tower inspection should start on the uphill sheave train at Inspection
Point 1 and repeat the procedure for the next tower.
15.The UAV operator must travel with the UAV to the next tower to keep the it
within his/her line of sight. Repeat these inspection procedures for each
tower, keeping battery life in mind. The operator should not start a new
tower inspection before replacing the battery if it is below 30%.
Tower-based Platform This design alternative is a tower-based system where the cameras and
sensors are mounted in a fixed position at the top of every tower above each
sheave train (two sets of cameras per tower). Visual data and images can be
collected from these cameras continuously for analysis. Due to additional
equipment, the cost of this system is significantly more expensive than the aerial
platform. For data analysis, this alternative would provide the highest amount of
data, but quality of data would be limited by the camera angle views because all
measurements would be taken from a fixed point. Cameras can be housed in a
protective case to prevent camera damage with heating devices to maintain an
optimal environmental temperature.
Figure 37: CONOPS for Tower based Platform
50
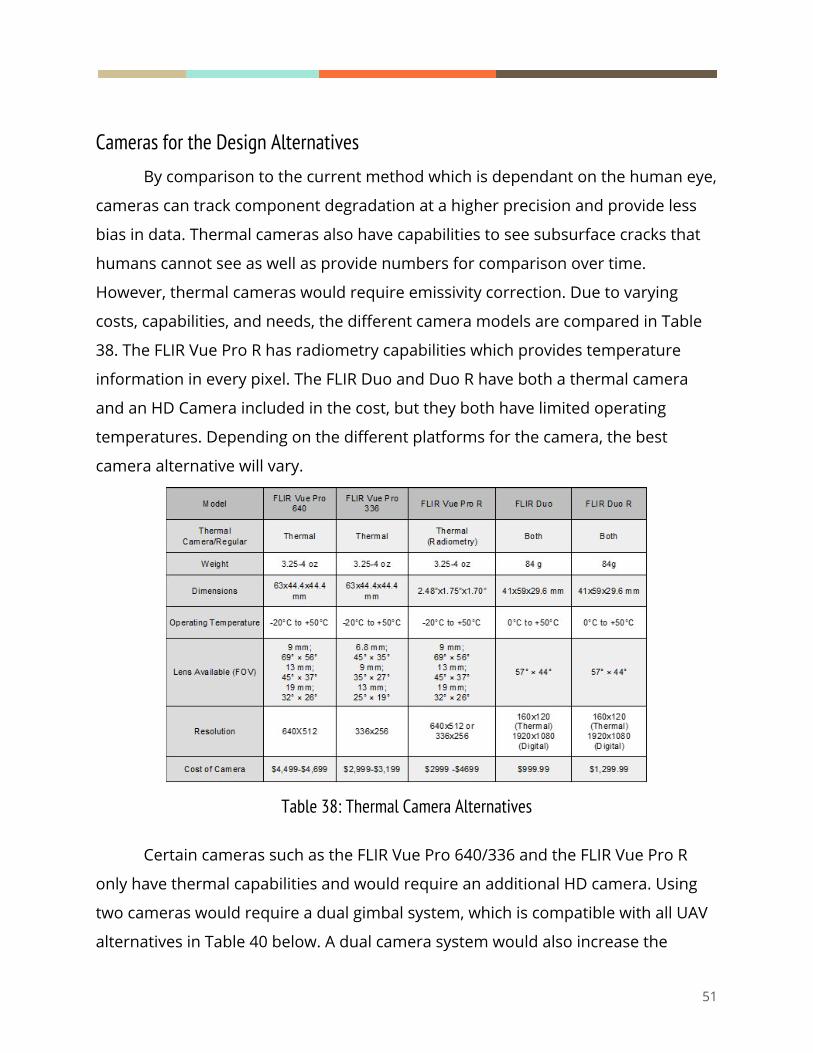
Cameras for the Design Alternatives By comparison to the current method which is dependant on the human eye,
cameras can track component degradation at a higher precision and provide less
bias in data. Thermal cameras also have capabilities to see subsurface cracks that
humans cannot see as well as provide numbers for comparison over time.
However, thermal cameras would require emissivity correction. Due to varying
costs, capabilities, and needs, the different camera models are compared in Table
38. The FLIR Vue Pro R has radiometry capabilities which provides temperature
information in every pixel. The FLIR Duo and Duo R have both a thermal camera
and an HD Camera included in the cost, but they both have limited operating
temperatures. Depending on the different platforms for the camera, the best
camera alternative will vary.
Table 38: Thermal Camera Alternatives
Certain cameras such as the FLIR Vue Pro 640/336 and the FLIR Vue Pro R
only have thermal capabilities and would require an additional HD camera. Using
two cameras would require a dual gimbal system, which is compatible with all UAV
alternatives in Table 40 below. A dual camera system would also increase the
51
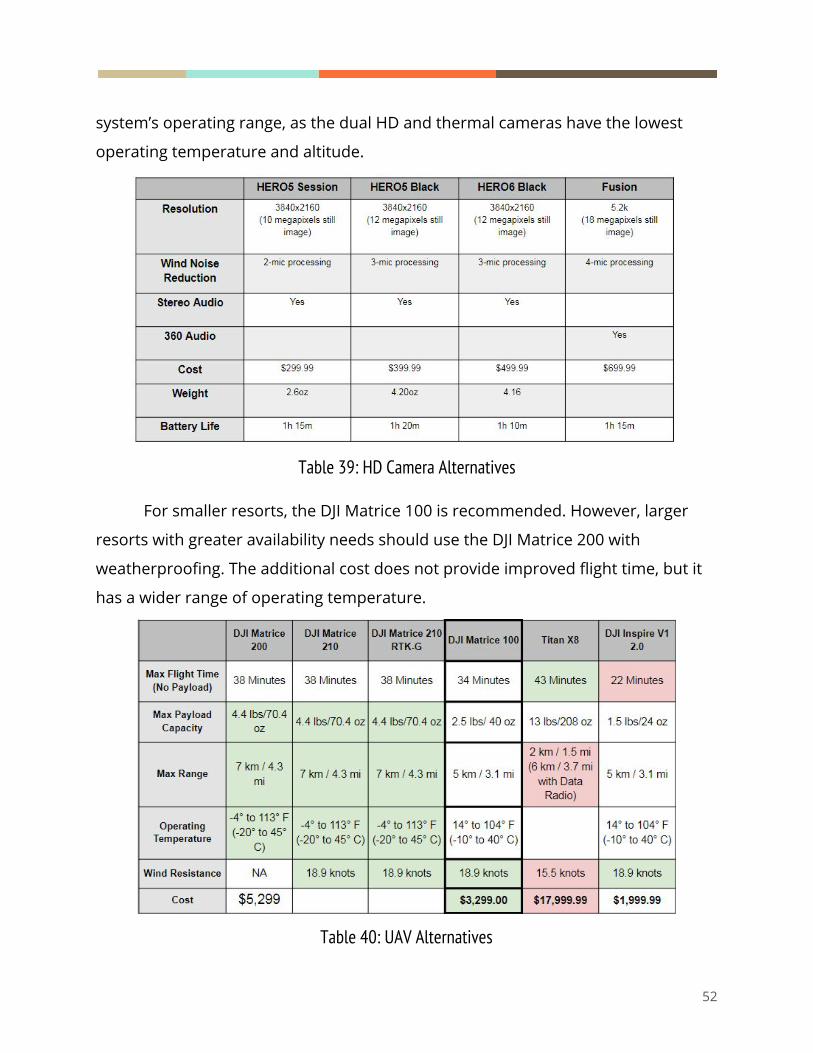
system’s operating range, as the dual HD and thermal cameras have the lowest
operating temperature and altitude.
Table 39: HD Camera Alternatives
For smaller resorts, the DJI Matrice 100 is recommended. However, larger
resorts with greater availability needs should use the DJI Matrice 200 with
weatherproofing. The additional cost does not provide improved flight time, but it
has a wider range of operating temperature.
Table 40: UAV Alternatives
52
7.0 Requirements
7.1 Inspection System Requirements
7.1.1 Mission Requirements MR 1. The system shall detect the following external Ski Lift Tower and component
defects:
● Corrosion in tower components
● Cracks in metal structural components such as the cross arm or the top of
the tower structure
● Misalignment and/or wobble in sheave wheels
● Noise: clatter and/or screeching from sheave wheels
● Loose connections (i.e. nuts/bolts)
MR 2. The system shall inspect the ski lift in daylight hours without interrupting
resort operations limiting the inspection system to inspect the lift or a portion of
the lift in under two hours during resort operating days (i.e. between 7am and 9am
prior to opening).
MR 3. The system shall be able to inspect ski lift components listed in MR.1. a
minimum of every 2 weeks while maintaining inspection time constraints per MR.2.
MR 4. The system shall be operable by inspection and maintenance personnel with
no previous technological experience other than the provided training.
7.1.2 Functional Requirements F1. The system shall measure the alignment of the sheave wheels by identifying
two points of visual reference above each wheel and send an alert if the wheels are
more than 5% out of alignment.
53
F2. The system shall inspect the wobble of the sheave wheels by identifying two
points of visual reference from above for each wheel when the ski lift is in motion
to compare the angle and position for each wheel over time. The system shall
indicate an alert for each individual wheel if the angles deviate more than 5% for
each wheel when in motion.
F3. The system shall capture color and thermal images of metal components for
corrosion, cracks, and material loss and process those images to report
discolorations greater than 5% from a baseline measurement under static system
lighting.
F4. The system shall inspect the ski lift for loose nuts and bolts by recording video
of the system in motion from above (preferably weighted) and measuring
deviations or vibration in video. The system shall indicate an alert for deviations
greater than 5% from a baseline measurement.
7.1.3 Design Requirements DR 1. The system shall illuminate system components using LED lights to establish
a baseline environment for consistency of measurements.
DR 2. The system shall store recorded measurements and images for the user to
review remotely through a device compatible with a standard computer (either via
wireless transmission or a removable memory device).
DR 3. The system shall be operable at altitudes up to 12,000 feet above sea level,
temperatures between 15 degrees and 105 degrees Fahrenheit, and winds up to 22
knots.
7.2 Simulation Requirements
7.2.1 I/O Requirements SR 1. The simulation shall accept input values of the number of towers, the height difference and the distance between towers, and the number of sheave wheels per
54

tower. SR 2. The simulation shall output measures for time to inspect the ski lift, measures for accuracy, and measures for availability.
7.2.2 Time I/O Requirements SR 3. The simulation shall output an average tower inspection time for the aerial platform equal to the average time to inspect a tower following the developed procedure five times with an error tolerance of ± 10%. SR 4. The simulation shall assume an aerial inspection procedure respective to the UAV’s collision avoidance system for all tower clearances. SR 5. The simulation shall assume a speed distribution for the aerial platform including climb/descend speed, inspection speed, and horizontal travel speeds equal to repeated field tested values (five times) with an error tolerance of ± 10%. SR 6. The simulation shall assume a headwind for the aerial platform based on historical wind data for all horizontal travel and assume no wind for vertical travel such that the airspeed is greater than the wind speed. SR 7. The simulation shall output an average tower inspection time for the current method equal to the average time to inspect a tower based on the current inspection procedure with an error tolerance of ± 15%.
7.2.3 Cost I/O Requirements SR 8. The simulation shall calculate the total labor cost for each design alternative based on the inspection time output by the simulation, including labor wages, workers compensation and insurance costs per hour. SR 9. The simulation shall account for the cost of the UAV device in addition to the thermal and HD cameras to calculate the cost of an aerial platform. The simulation shall take into account the average time required to inspect the ski lift given a local historical wind distribution to determine the number of batteries required for the aerial platform. SR 10. The simulation shall account for the cost of the thermal and HD cameras
55

(inclusive of mounting materials and installation labor) for each sheave train to calculate the cost of the tower platform.
7.2.4 Accuracy I/O Requirements SR 11. The simulations shall output accuracy for the aerial platform based on the visibility of components from the distance of the aerial vehicle from the tower. SR 12. The simulation shall output accuracy of the tower platform based on the height of the camera above the tower with a minimum fixed angle view of the farthest component of 60 degrees. SR 13. The simulation shall output accuracy of the current inspection method based on the time elapsed between a tower inspection and recording the information using Ebbinghaus’s forgetting curve.
7.2.4 Availability I/O Requirements SR 14. The simulation shall output availability of each design alternative based on temperature, wind, and precipitation restrictions. (defined in the table 39 below)
Table 41: Availability based on Wunderground Local Weather Data (2014-2017)
8.0 Simulation Design A stochastic simulation was developed to compare the inspection time,
safety, accuracy, and availability of the three design alternatives, which are output
56

by the simulation. Simulation inputs include the number of towers, the number of
sheave wheels per tower, the height and location of each tower, as well as a
random distribution for wind.
Figure 42: Simulation Design
8.1 Verification and Validation through Empirical Data Collection For verification and validation of the simulation, extensive empirical data
collection was performed. Random variables for the simulation were collected
through experimentation and research. Travel speed for the mobile aerial platform
includes horizontal travel speed, inspection speed, and vertical speed. Vertical
speed is based on half of the maximum climb and descend speed for the DJI
Matrice 100 Manufacturer Specifications. Horizontal and Inspection speeds were
collected through an experiment. A UAV was flown between two markers for both a
57

100 foot fence line and 13.5 feet to represent flying between towers and flying
along the top of the tower five times. The number of trials was limited by the
number of batteries brought by the pilot. The setup time for the aerial platform was
based on the initial setup for two separate testing days at Bryce Resort. The time
also includes walking from the office to the first tower.
The random distributions for the current method were based on research
and subject matter expert experience. Horizontal travel speed was based on half
the average human walking speed. Inspection speed was based on one third of the
average human walking speed. Vertical speed was based on the difference between
the horizontal and inspection speed and subject matter expert input. Setup time for
the current method was based on the inspection procedure and subject matter
expert input.
Figure 43: Experimental Setup for Aerial Inspection Speed Collection
8.2 Time Inspection time is a cost-critical system characteristic, as it is related to labor
costs. For the current method, the time required for a human to inspect the tower
includes the time to setup, climb the tower, inspect all components, climb down,
and travel to the next tower. The tower platform is considered continuous with a
58
system delay of 1 minute. For the aerial platform, the simulation assumes that the
procedure in Figure 36 is executed for inspections, including a maximum battery
usage of 70% before replacement. Battery life was modeled based on stochastic
wind conditions which can cause longer inspection times. Empirical data for
random variables was collected for horizontal speed, climbing and descending
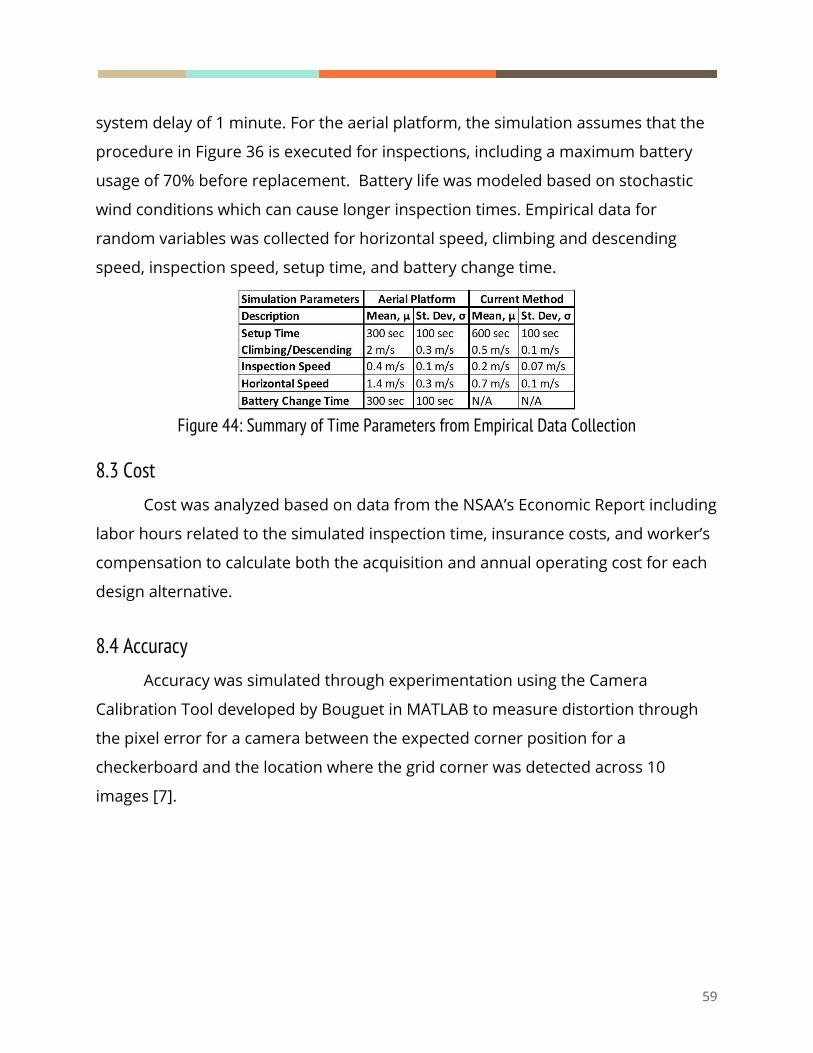
speed, inspection speed, setup time, and battery change time.
Figure 44: Summary of Time Parameters from Empirical Data Collection
8.3 Cost Cost was analyzed based on data from the NSAA’s Economic Report including
labor hours related to the simulated inspection time, insurance costs, and worker’s
compensation to calculate both the acquisition and annual operating cost for each
design alternative.
8.4 Accuracy Accuracy was simulated through experimentation using the Camera
Calibration Tool developed by Bouguet in MATLAB to measure distortion through
the pixel error for a camera between the expected corner position for a
checkerboard and the location where the grid corner was detected across 10
images [7].
59

Figure 45: Experimental Setup for a MATLAB Distortion Model
Camera distortion effects both image processing algorithms and shape
interpretation of the human eye. For example, an inspector would not be able to
recognize a wheel misalignment if the pixels themselves do not appear aligned due
to distortion. The pixel error measures the difference between the expected corner
location and where the corner was located due to distortion, as shown in Figure 46
below.
Figure 46: Wheel Alignment Example for Pixel Error
The Pixel Error analysis provides each design alternative’s accuracy based on
camera distortion respective to the camera’s extrinsic parameters: distance and
angle from components. The mobile aerial platform is restricted to 10 feet at a
90-degree angle from components due to the collision avoidance system. The
accuracy of the tower platform was averaged between the camera angles from the
47-inch height above the tower center (90 degrees) and the 60-degree angle from
the farthest component.
60

Figure 47: Accuracy extrinsic parameters for the aerial and tower platforms.
The camera angle has a greater effect on image distortion than distance. For
example, the 60-degree angle for the tower platform distorts the image of sheave
wheels from above. Figure 48 below shows how the camera angle can impact the
appearance of shapes. Camera calibration can adjust distortion for image
processing analysis to identify a misalignment. However, extreme distortion cannot
be corrected.
Figure 48: Tower Platform Shape Distortion
Since the size of each grid box and pixel will vary based on the camera
distance from the grid, accuracy is scaled by the diagonal pixel error in comparison
to the diagonal length of each box in pixels. Using diagonal pixel error also
simplifies the error for a 1 to 1 comparison because the error may not be
symmetrical across the x and y axes. For example, one grid box is 28.5 mm by 28.5
61
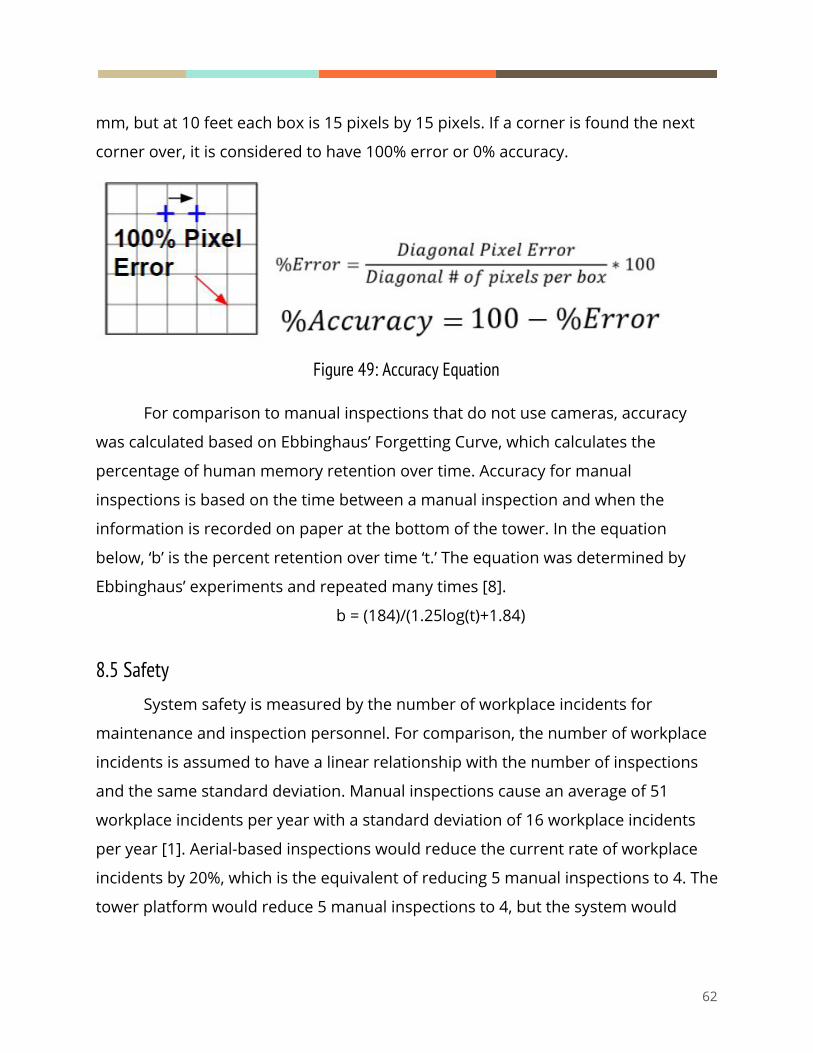
mm, but at 10 feet each box is 15 pixels by 15 pixels. If a corner is found the next
corner over, it is considered to have 100% error or 0% accuracy.
Figure 49: Accuracy Equation
For comparison to manual inspections that do not use cameras, accuracy
was calculated based on Ebbinghaus’ Forgetting Curve, which calculates the
percentage of human memory retention over time. Accuracy for manual
inspections is based on the time between a manual inspection and when the
information is recorded on paper at the bottom of the tower. In the equation
below, ‘b’ is the percent retention over time ‘t.’ The equation was determined by
Ebbinghaus’ experiments and repeated many times [8].
b = (184)/(1.25log(t)+1.84)
8.5 Safety System safety is measured by the number of workplace incidents for
maintenance and inspection personnel. For comparison, the number of workplace
incidents is assumed to have a linear relationship with the number of inspections
and the same standard deviation. Manual inspections cause an average of 51
workplace incidents per year with a standard deviation of 16 workplace incidents
per year [1]. Aerial-based inspections would reduce the current rate of workplace
incidents by 20%, which is the equivalent of reducing 5 manual inspections to 4. The
tower platform would reduce 5 manual inspections to 4, but the system would
62
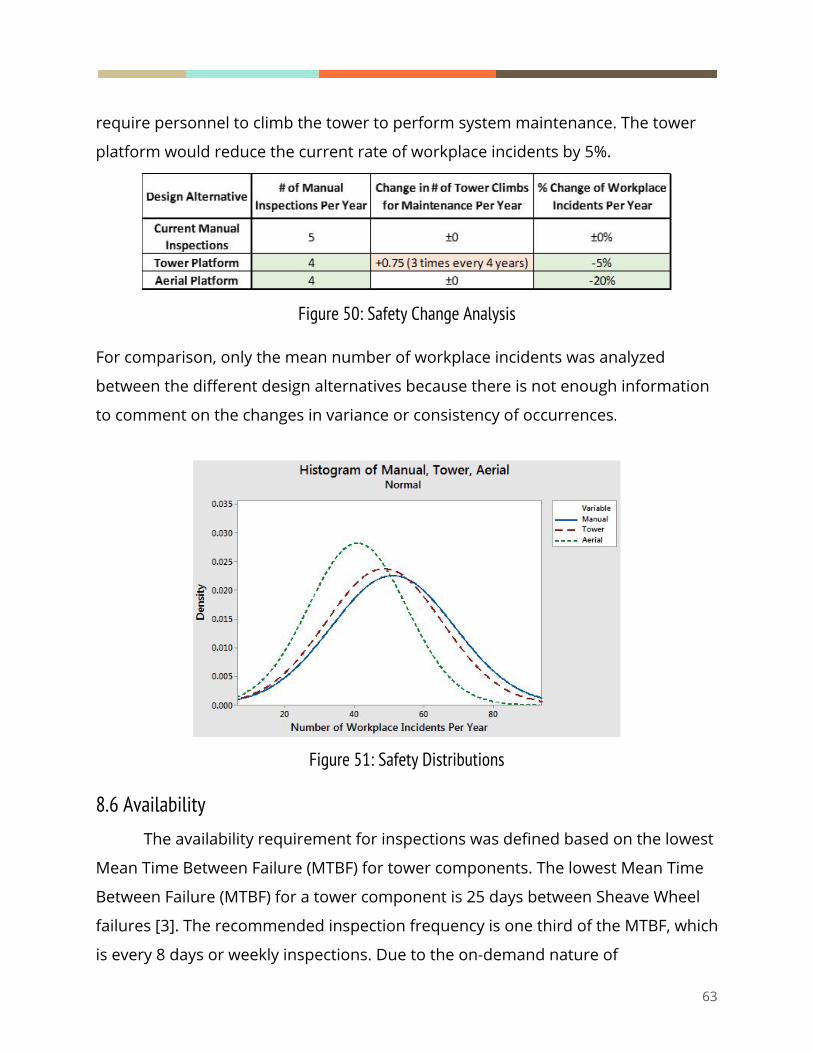
require personnel to climb the tower to perform system maintenance. The tower
platform would reduce the current rate of workplace incidents by 5%.
Figure 50: Safety Change Analysis
For comparison, only the mean number of workplace incidents was analyzed
between the different design alternatives because there is not enough information
to comment on the changes in variance or consistency of occurrences.
Figure 51: Safety Distributions
8.6 Availability The availability requirement for inspections was defined based on the lowest
Mean Time Between Failure (MTBF) for tower components. The lowest Mean Time
Between Failure (MTBF) for a tower component is 25 days between Sheave Wheel
failures [3]. The recommended inspection frequency is one third of the MTBF, which
is every 8 days or weekly inspections. Due to the on-demand nature of
63

maintenance concerns, personnel may perform an inspection on any day.
Availability is defined as the percentage of days per year in which a design
alternative can inspect lift towers based on weather conditions. Historical weather
data was analyzed for Bayse Virginia, where Bryce Resort is located [9]. Availability
restrictions were defined by Bryce Resort’s inspection procedure and manufacturer
specifications for a UAV as well as HD and thermal cameras.
Table 52: Availability Restrictions
9.0 Design of Experiment To compare the different design alternatives, time, safety, accuracy, and
availability were analyzed across the same number of towers and lift characteristics
including the number of sheave wheels per tower as well as the height, slope, and
distance between each tower from the Bryce Resort Lift Specifications. The cost of
each alternative was compared based on the number of people required to
perform an inspection: 4 people for manual inspections, 1 person for the tower
platform, and 2 people for the mobile aerial platform. It was hypothesized that
either the mobile aerial platform or tower platform would decrease cost by 20%,
which would be the equivalent to reducing manual inspections from 5 to 4
inspections per year.
64

Figure 53: Design of Experiment
10.0 Results Results were obtained from 1,453 replications of the simulation. A summary
of simulation outputs and system characteristics for comparison can be found in
the table below.
Figure 54: Simulation Results
10.1 Results: Time
The mobile aerial platform reduces inspection time by an average of 23
minutes per tower per inspection compared to manual inspections. The tower
platform reduces inspection time by 31 minutes per tower per inspection. Due to
stochastic wind conditions and operating speeds, the mobile aerial platform has a
standard deviation of 0.78 minutes per tower compared to 2.89 minutes per tower
for manual inspections.
65

Figure 55: Time Results for Aerial Platform (left) and Manual Inspections (right)
10.2 Results: Availability
Although the mobile aerial platform has the lowest daily availability to
perform inspections of the three design alternatives, the mobile aerial platform
fulfills the requirement that weekly inspections can be performed. The average
number of unavailable days per week is 0.79, which means resorts have 6 out of 7
days per week to perform an inspection.
Figure 56: Historical Weekly Availability Distribution for the Aerial Platform
Historically, there have been three weeks out of four years (between 2014
and 2017) in which the mobile aerial platform was not available for seven
consecutive days.
66

Figure 57: Historical Days Unavailable per Week for the Aerial Platform
The most restricted month for the Aerial Platform is the month of May due to
heavy precipitation during the Spring season. Although May is considered the
resort off-season, pre-season maintenance occurs throughout the month prior to
the summer mountain biking season. The tower platform is 1% less available daily
than manual inspections.
Figure 58: Average Monthly Availability for the Aerial Platform
10.3 Results: Safety
The availability constraints for the mobile aerial platform and tower platform
were defined to have lower risk to the inspection system than manual inspections
that place inspection personnel at risk of falling. The mobile aerial platform
67
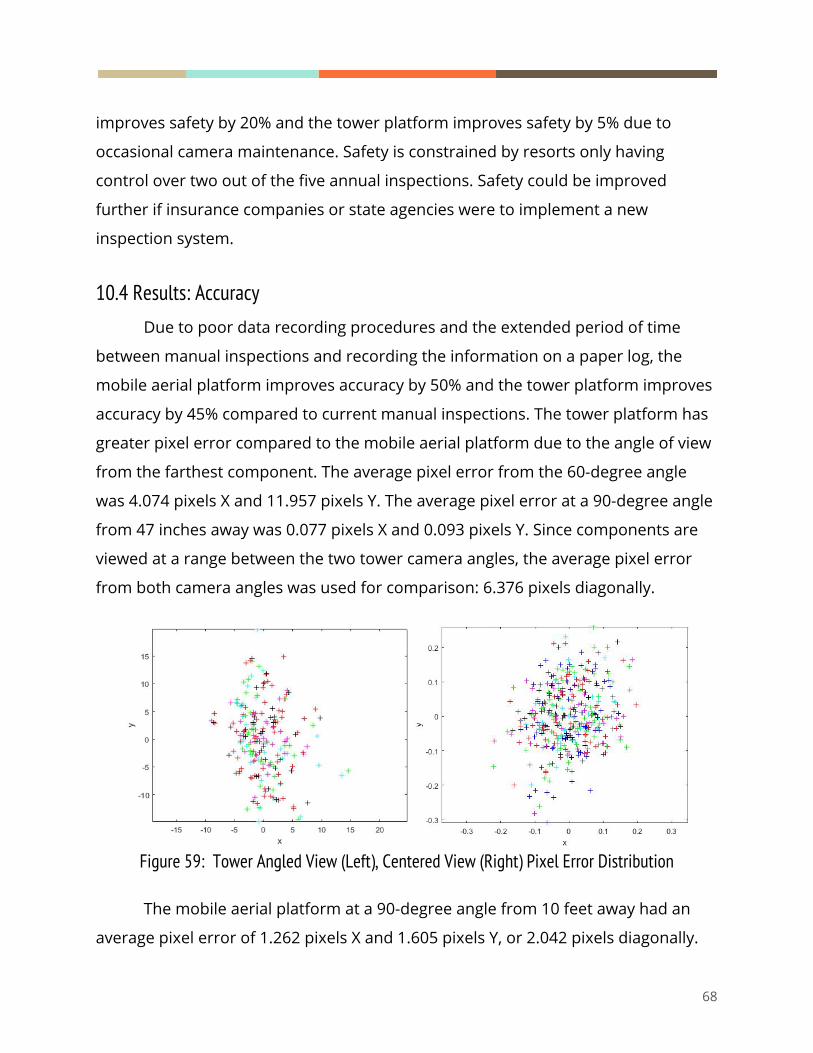
improves safety by 20% and the tower platform improves safety by 5% due to
occasional camera maintenance. Safety is constrained by resorts only having
control over two out of the five annual inspections. Safety could be improved
further if insurance companies or state agencies were to implement a new
inspection system.
10.4 Results: Accuracy
Due to poor data recording procedures and the extended period of time
between manual inspections and recording the information on a paper log, the
mobile aerial platform improves accuracy by 50% and the tower platform improves
accuracy by 45% compared to current manual inspections. The tower platform has
greater pixel error compared to the mobile aerial platform due to the angle of view
from the farthest component. The average pixel error from the 60-degree angle
was 4.074 pixels X and 11.957 pixels Y. The average pixel error at a 90-degree angle
from 47 inches away was 0.077 pixels X and 0.093 pixels Y. Since components are
viewed at a range between the two tower camera angles, the average pixel error
from both camera angles was used for comparison: 6.376 pixels diagonally.
Figure 59: Tower Angled View (Left), Centered View (Right) Pixel Error Distribution
The mobile aerial platform at a 90-degree angle from 10 feet away had an
average pixel error of 1.262 pixels X and 1.605 pixels Y, or 2.042 pixels diagonally.
68

The error distributions for the mobile aerial platform can be found in Figure 60
below.
Figure 60: Aerial Platform View Pixel Error Distribution
For comparison, the thermal camera pixel accuracy for the mobile aerial
platform at a 90-degree angle from 10 feet away was 0.182 pixels X and 0.171 pixels
Y, or 0.239 pixels diagonally. From 10 feet away, the thermal camera has 97.8% spot
accuracy.
Figure 61: Aerial Platform Thermal Camera Experimental Setup and Pixel Error Distribution
69

11.0 Analysis
11.1 Utility Analysis It was determined that the aerial platform has the highest utility, followed by
the tower platform then the current method. The overall ranking can be found in
Figure 62 below.
Figure 62: Utility ranking for the inspection systems
The mean and standard deviation for utility uncertainty was calculated based
on 5,000 replications of random number generation for each simulation output’s
distribution. The range of utility is shown by the lines in Figure 62 above for the
mean as well as one, two, and three sigma. The summary of uncertainty including
5% and 95% probability density values can be found in the figure below.
Figure 63: Utility Uncertainty Summary
11.2 Analytic Hierarchy Process The weights for accuracy, availability, and time were calculated using the
Analytic Hierarchy Process (AHP) method. The weights were based subjectively on
the viewpoint of two groups of stakeholders with two subject experts per group
70

were asked to provide a pairwise comparison: ski resort management and ski lift
maintenance personnel.
Safety was weighted the highest due to risk associated for inspection
personnel when they climb up the tower. Availability and Accuracy was weighed
the second highest due to the risk associated with gaps between inspections in
which failures could go unnoticed for availability and accuracy due to the risk of
failing to detect structural defects or declaring a faulty component in error.
Misreadings may also require additional inspections and incur a greater cost. Time
was weighed the lowest because the process of inspection and the thoroughness of
the inspection is more important than the time it takes to complete.
Figure 64: Calculated weights for each system goal.
Figure 65: Affinity Diagram for each weighted goal.
11.3 Sensitivity Analysis If cost is not included in the decision making process, the aerial platform has
the highest utility at the weights determined using the AHP method. The vertical
71

lines shown in Figure 66 below indicate the weights determined from the
stakeholder’s perspective and the relative utility for each design alternative. The
Aerial Platform is preferred when the weight of safety is greater than 0.48, weight
of availability is less than 0.21, weight of time is less than 0.15, and the weight of
accuracy does not change the outcome. The second most preferred is the tower
platform. The current method is only better if availability is greater than 0.97.
Figure 66: Sensitivity Analysis for Weights
72

11.4 Cost Versus Utility Analysis Compared to current manual inspections that cost $423,500 per year on
average in the United States, both the mobile aerial platform and tower platform
would improve utility (by 48.3%, 43.8% respectively) at a lower cost. The mobile
aerial platform would cost $31,862 over the first year of implementation, which
includes both acquisition and operating costs. The annual operating cost for the
mobile aerial platform is $22,864. The tower platform acquisition cost is $105,316
and has a lower annual operating cost of $16,716. The variance shown in the graph
below represents one sigma for utility. If a resort desires continuous monitoring
with the Aerial Platform, they would lose 0.0002 in utility for every additional $1,000
spent.
Figure 67: Utility vs. Cost Comparison.
73
12.0 Business Plan
12.1 Motivation and Business Thesis Ski lifts transport 51.8 million ski resort visitors on average annually for
downhill snowsports that are the main source of revenue for over 500 ski resorts
nationwide. Due to climate change shortening the winter season, 80% of ski resorts
are now open during the summer. Despite nearly doubling their lift operating days
nationally from 117 to 204 days on average and subjecting lifts to a wider range of
temperatures, the number of inspections has not changed due to the danger of
climbing lift towers (National Ski Areas Association). Tower inspections are both
dangerous and expensive due to labor and insurance costs. Maintenance and
inspection personnel already risk falling during the tower inspections and
maintenance checks they perform that are too infrequent for both what
management and personnel desire as well as what the increased system strain
demands. The solution is: us.
Our company helps ski lift maintenance personnel, inspection personnel, and
ski lift management who experience risk of injury from falling while conducting ski
lift inspections when they climb lift towers and must remember location and
severity of defects inspected to complete paperwork when they get back to the
ground by providing a safer, more accurate, and faster UAV system that can archive
component data and perform inspections more frequently at a lower cost due to
insurance and labor savings resulting in fewer workplace incidents and reduced
liability costs, a reduction in inspection costs, and methods to track failure
progression of components better than the current risk-prone inspections that
require climbing the towers that could be increased from only 5 times a year to
weekly as ski lift operational periods expand into the summer.
74

Figure 68: Resort Motivations
12.2 Business Model INSPEX generates profit through commission as a vendor for DJI drones as
well as FLIR Thermal and HD GoPro Cameras. INSPEX also generates profit through
a data management and analysis subscription for image processing and storage.
There is no other company in the United States that provides both UAV systems
and image data management, which collects data for Ski Lift failure analysis across
the industry.
What a Purchase Includes:
● Integrated Digital UAV Inspection System (complete with thermal and HD
cameras and preloaded software)
● Recommended FAA Part 107 Schools/Training Resources
● Subscription (based on quote, starting at $2000/month):
○ Inspection Report
○ Data analysis and predictive failure progression report
○ OpenCV Image Processing
○ Amazon Web Services Cloud Storage for 2 months worth of high
definition inspection video stored at a time (data and reports can be
stored for longer)
● Operational Consultation
● Annual personnel retraining
● Regulatory update
75
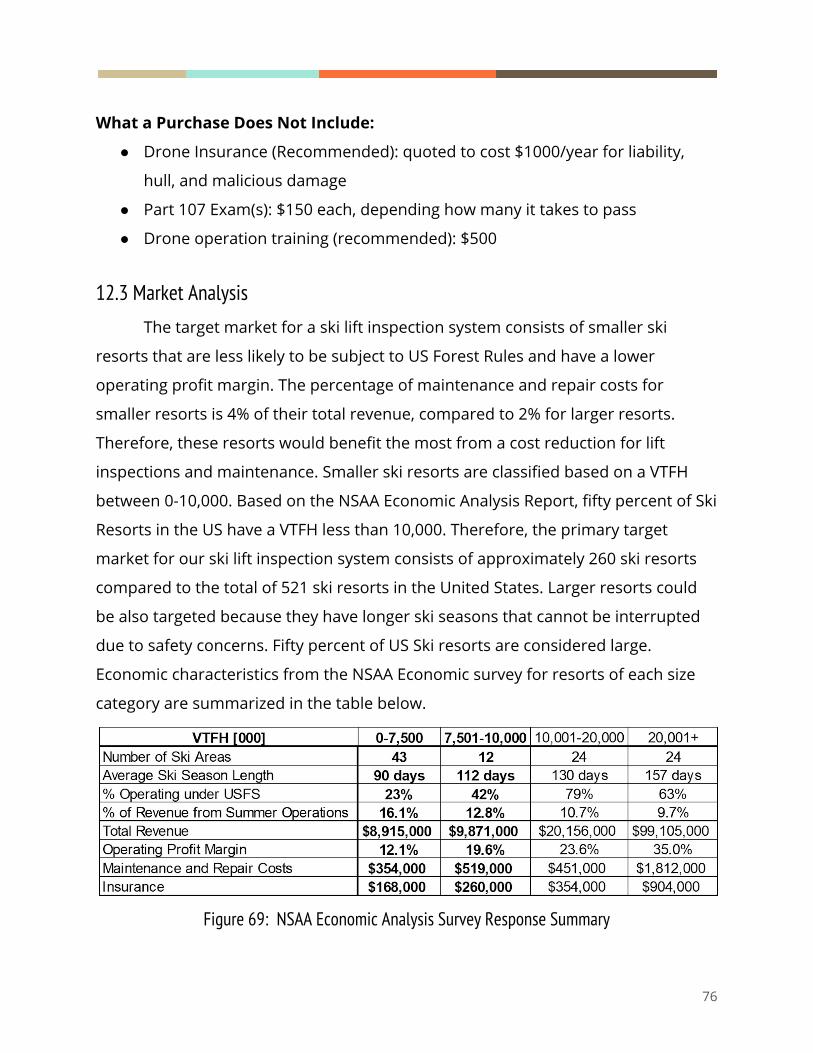
What a Purchase Does Not Include:
● Drone Insurance (Recommended): quoted to cost $1000/year for liability,
hull, and malicious damage
● Part 107 Exam(s): $150 each, depending how many it takes to pass
● Drone operation training (recommended): $500
12.3 Market Analysis The target market for a ski lift inspection system consists of smaller ski
resorts that are less likely to be subject to US Forest Rules and have a lower
operating profit margin. The percentage of maintenance and repair costs for
smaller resorts is 4% of their total revenue, compared to 2% for larger resorts.
Therefore, these resorts would benefit the most from a cost reduction for lift
inspections and maintenance. Smaller ski resorts are classified based on a VTFH
between 0-10,000. Based on the NSAA Economic Analysis Report, fifty percent of Ski
Resorts in the US have a VTFH less than 10,000. Therefore, the primary target
market for our ski lift inspection system consists of approximately 260 ski resorts
compared to the total of 521 ski resorts in the United States. Larger resorts could
be also targeted because they have longer ski seasons that cannot be interrupted
due to safety concerns. Fifty percent of US Ski resorts are considered large.
Economic characteristics from the NSAA Economic survey for resorts of each size
category are summarized in the table below.
Figure 69: NSAA Economic Analysis Survey Response Summary
76

12.4 Marketing and Sales Strategy To enter the market, members of the National Ski Areas Association (NSAA)
and geographic clusters will be targeted. The NSAA is headquartered in Colorado,
which is one of the largest geographic clusters in the US. The state of Colorado is an
industry hub and role model for safety and regulation for the entire country. By
demonstrating the integrated system at several conferences and seminars shown
in the table below, exposure to industry decision-makers will increase visibility and
boost sales. Involvement with regulatory bodies such as the Colorado Passenger
Tramway Safety Board will help the system become standard for the industry. The
NSAA will also be publishing an article about INSPEX for their bi-monthly magazine,
which has over 700 ski resort industry subscribers.
Figure 70: Demonstration Opportunities
12.5 Market Competition and Competitive Advantage INSPEX is one-stop shop for UAVs and a Cloud-based Inspection Service that
specializes in ski lifts for visual and numerical data analysis. The cloud-based
inspection data management company Scopito is limited in data collection
capability and mass image processing as it is not an automated system nor
designed for ski lifts. Other ski lift inspection companies such as Eagle Sight and
EverDrone are limited in availability to the number of pilots available within the
77

region that they can serve. They also lack experience with maintenance procedures
or mechanical problems. INSPEX offers a platform for knowledge sharing in an
industry that operates in a fix-as-you-go corrective maintenance philosophy with
little knowledge on ski lift failures and few numeric tolerances for component
failure. Our engineers can provide knowledge and expertise that aerial
photographers cannot and should not provide. A side by side comparison of
INSPEX and other competition can be found in the table below.
Figure 71: Competition Comparison
If a resort were to purchase a UAV from another vendor or buy an
integrated system, they would pay several thousand dollars more. No other
company offers an integrated system that comes preloaded with software for
cloud-based data management and predictive analytics. A cost summary can be
found in the table below.
78

Figure 72: Competition Cost Comparison
12.6 Business Costs Startup costs include the cost to acquire the technology including hardware
and software development as well as marketing and labor costs. Software
development requires two employees, while hardware development and data
collection requires one employee. The remaining employee will be dedicated to
marketing. A summary of startup costs for year one can be found below.
Figure 73: Startup Cost Summary
Business costs are based on quotes for equipment, insurances, image
processing, and cloud storage. Purchases for businesses and resale receive a 20%
79
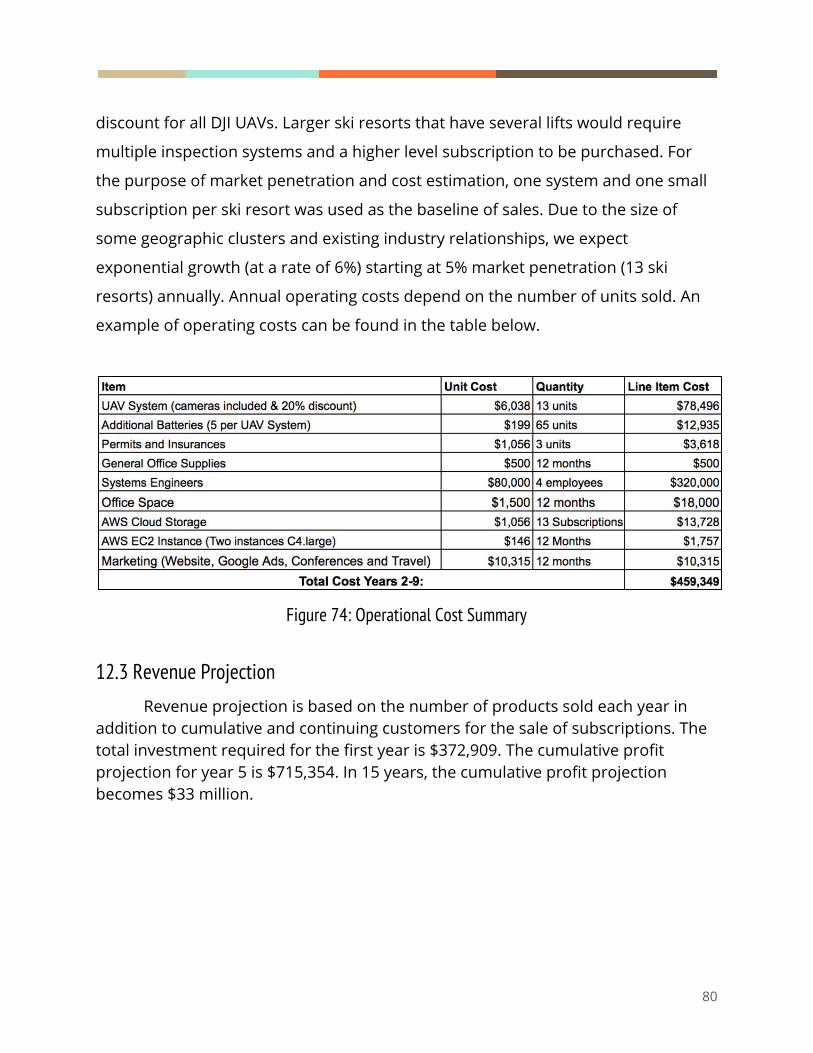
discount for all DJI UAVs. Larger ski resorts that have several lifts would require
multiple inspection systems and a higher level subscription to be purchased. For
the purpose of market penetration and cost estimation, one system and one small
subscription per ski resort was used as the baseline of sales. Due to the size of
some geographic clusters and existing industry relationships, we expect
exponential growth (at a rate of 6%) starting at 5% market penetration (13 ski
resorts) annually. Annual operating costs depend on the number of units sold. An
example of operating costs can be found in the table below.
Figure 74: Operational Cost Summary
12.3 Revenue Projection Revenue projection is based on the number of products sold each year in
addition to cumulative and continuing customers for the sale of subscriptions. The total investment required for the first year is $372,909. The cumulative profit projection for year 5 is $715,354. In 15 years, the cumulative profit projection becomes $33 million.
80

Figure 75: Financial Projection Table
Based on the expected market penetration and net present value (NPV), the first three years will end in a loss, followed by a breakeven (profit) for year 4 and thereafter. A graph of projections for the first five years of business can be found in the table below.
Figure 76: Revenue, Cost, and Profit Projection for 5 Years
The return on investment (ROI) for expected market penetration is 480% for
year 5. Optimistic and pessimistic revenue projections end with an ROI of 640% and
260% for year 5 respectively. A summary of expected, optimistic, and pessimistic
returns can be found in the table below for year 5, 10, and 15.
81

Figure 77: Expected, Optimistic, and Pessimistic Return on Investment
13.0 Future Work: Predictive Analytics and Audio Inspections Predictive Analytics is the use of data, statistical algorithms, and machine
learning techniques to identify the likelihood of future outcomes based on
historical data. Behavior regarding the frequency of inspection for each type of
component can be monitored. Ski lift manufacturers would also be able to track
quality control for replacement parts based on individual component lifespans. The
measurements taken during an inspection may be used to predict when a lift falls
within range of risk. Due to the battery limitations of the aerial platform, this
solution would provide a methodology to optimize and shorten the inspection
times for a particular lift by tracking failure progression.
Applications of predictive analytics also include image processing algorithms
to obtain motion patterns for dynamic lift system analysis. Audio inspections for
wheel and bearing squeaking can also be included for predictive analysis and
failure progression analysis. Predictive analytics can be used in conjunction with the
current method, the aerial platform, or the tower platform to determine periods of
high risk when there is more demand on the system or when components are the
most brittle and have the highest probability of failure. The frequency of inspection
is dependent on both the probability of failure and the availability of the inspection
system. Inspections should especially be performed when the probability of failure
increases during the most demanding winter months.
ANSI Lift Standards have pre-existing definitions for risk reduction that can
be used to classify the level of risk for a lift based on data from inspections. If the
82
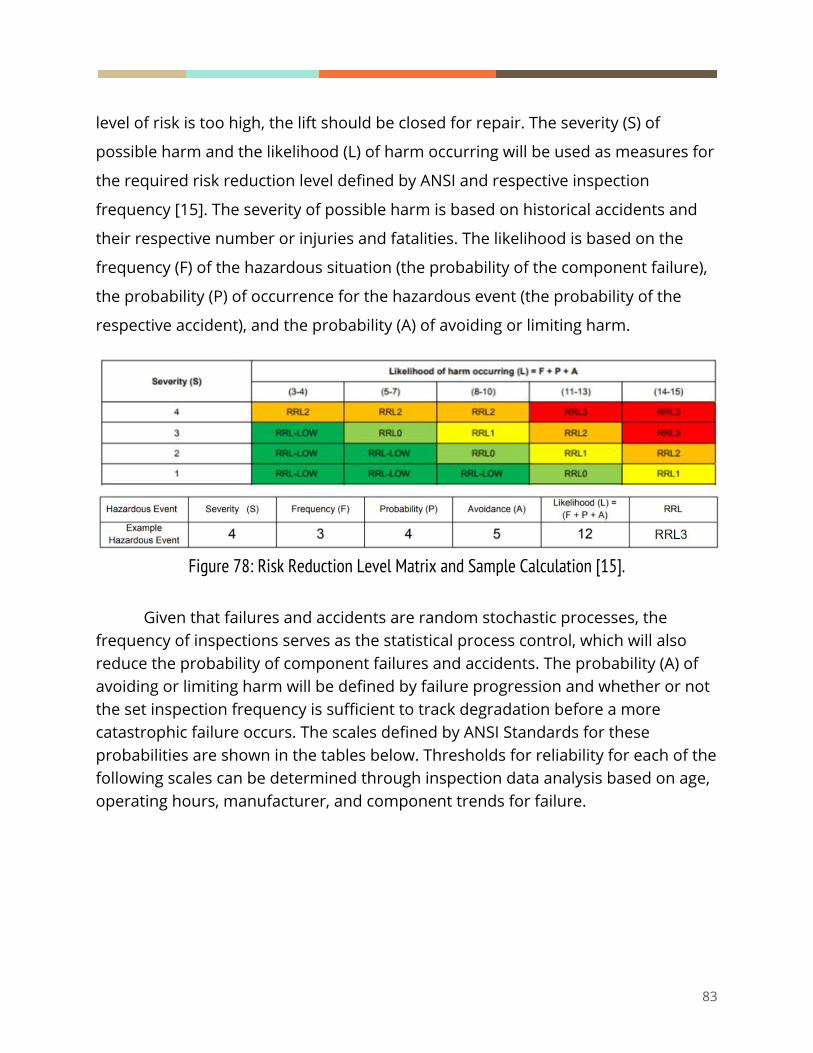
level of risk is too high, the lift should be closed for repair. The severity (S) of
possible harm and the likelihood (L) of harm occurring will be used as measures for
the required risk reduction level defined by ANSI and respective inspection
frequency [15]. The severity of possible harm is based on historical accidents and
their respective number or injuries and fatalities. The likelihood is based on the
frequency (F) of the hazardous situation (the probability of the component failure),
the probability (P) of occurrence for the hazardous event (the probability of the
respective accident), and the probability (A) of avoiding or limiting harm.
Figure 78: Risk Reduction Level Matrix and Sample Calculation [15].
Given that failures and accidents are random stochastic processes, the frequency of inspections serves as the statistical process control, which will also reduce the probability of component failures and accidents. The probability (A) of avoiding or limiting harm will be defined by failure progression and whether or not the set inspection frequency is sufficient to track degradation before a more catastrophic failure occurs. The scales defined by ANSI Standards for these probabilities are shown in the tables below. Thresholds for reliability for each of the following scales can be determined through inspection data analysis based on age, operating hours, manufacturer, and component trends for failure.
83

Table 79: Scale for Probabilities
To identify risk for a particular resort, the Vertical Transport Feet per Hour can be used for a preliminary estimate of visitors and speed to analyze risk. The number of people that ride a lift daily should be tracked using ticket data, so the approximate weight and stresses on the system can be taken into account. Then, periods of peak load can be identified to plan inspections and repair. Several resorts currently use RFID systems to track riders for economic analysis, but the technology would be beneficial to use for a more accurate estimate of the number of visitors. Periods of higher stress and lifts that run at higher speeds would require higher frequencies of inspection for risk reduction. For example, the period with the most customers and highest load tends to be during the winter months when components are also the most brittle. The level of risk reduction should be the highest during the winter months, so the frequency of inspections would be the highest.
84

14.0 Project Plan
14.1 Statement of Work Background
Ski lifts are mechanical, electrical devices that operate in severe and changing
weather conditions. They are a critical component of ski resorts. Bryce resort in
Virginia would like to evaluate alternative designs to perform routine, periodic,
inspections. Skylark Drones is interested in supplying their drones for use as one of
the potential design alternatives. The National Ski Areas Association (NSAA)
produces documentation for inspection of lifts and holds regional meetings each
year to discuss lift maintenance. This project will present results of study at this
meeting.
Objectives
The objective of this statement of work is developing a design alternative to
perform routine, periodic, inspections on ski towers for Bryce Resort.
Scope of the Work
Unless otherwise specified, the team shall perform the following tasks:
1. Create a project plan
2. Meet the requirements of each deliverable on time
Period of Performance
The period of performance for the Ski Lift Maintenance/Inspection (INSPEX) project
is 9 months with a start date of Aug 28, 2017 and an end date of May 18, 2018. All
work is to be scheduled to completion within this time. Extensions to the schedule
will not be considered.
The selected vendor for the INSPEX project will submit weekly individual time
sheets with the total number of billing hours completed by each team member.
Place of Performance
85

The bulk of the work for the INSPEX project will be performed on site at George
Mason University. Location of meetings with the vendor and client are to be
determined.
Work Requirements
As part of the INSPEX project, the vendor is responsible for executing and
completing the required tasks throughout the life of this project. The following is a
list of these tasks:
Kickoff:
● Identify client’s problem and needs
● Conduct preliminary research and gather data
● Present plan to client for approval
Requirements Phase:
● Work with Bryce Resort to gather requirements and maintenance
procedures/regulations
● Develop originating requirements
● Derive mission requirements, functional requirements, design requirements,
and simulation requirements
Design Phase:
● Develop design alternatives
● Derive high level design, detailed design, and simulation design
● Develop DoE and design proposal for Bryce Resort review and approval
Testing Phase:
● Test system validation
● Run simulation tests and results
● Analyze simulation results
● Confirm system verification
● Conduct sensitivity/cost/tradeoff analyses
● Compile a testing report to present to Bryce Resort for approval
Other Phases:
● Bryce Resort will be provided all finalized documentation of project plan
86
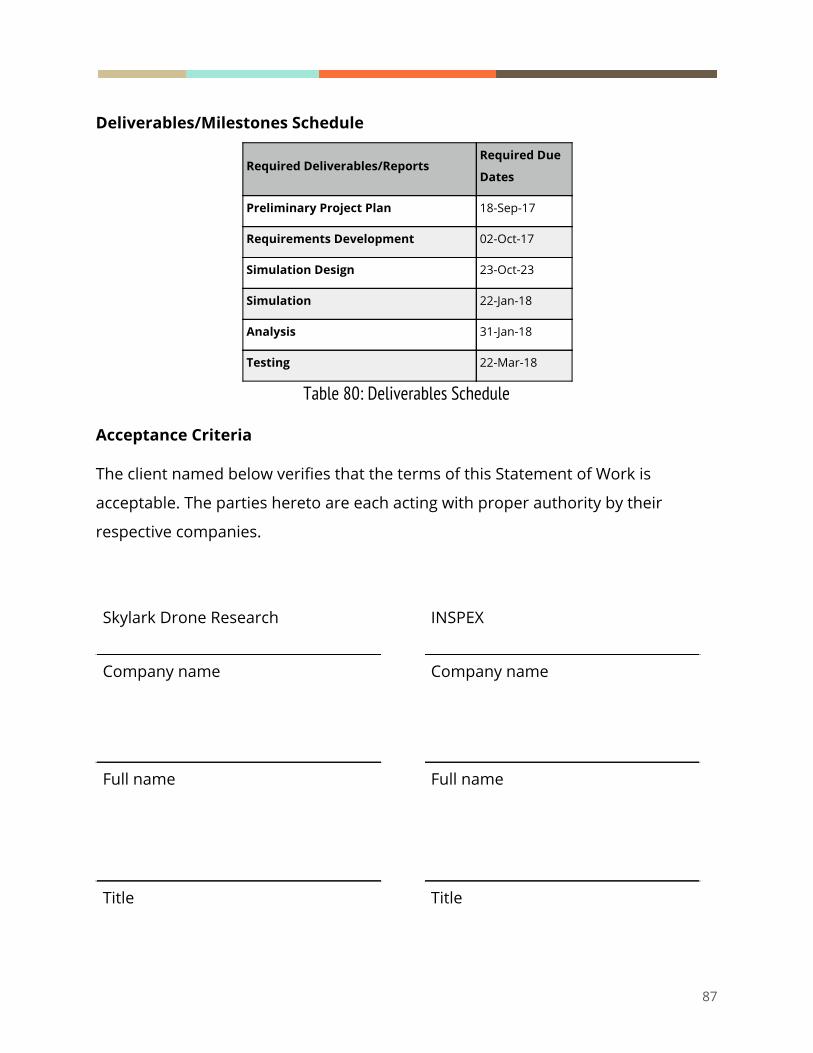
Deliverables/Milestones Schedule
Required Deliverables/Reports Required Due
Dates
Preliminary Project Plan 18-Sep-17
Requirements Development 02-Oct-17
Simulation Design 23-Oct-23
Simulation 22-Jan-18
Analysis 31-Jan-18
Testing 22-Mar-18
Table 80: Deliverables Schedule
Acceptance Criteria
The client named below verifies that the terms of this Statement of Work is
acceptable. The parties hereto are each acting with proper authority by their
respective companies.
Skylark Drone Research INSPEX
Company name Company name
Full name Full name
Title Title
87

Signature Signature
Date Date
88

14.2 Work Breakdown Structure (WBS)
The top level of the Work Breakdown Structure is Management, Research,
Requirements, Design, Simulation/Testing, Analysis, and System
Verification/Validation.
Figure 81: Work Breakdown Structure
89

14.3 Project Schedule
90

Figure 82: Project Schedule
91

14.4 Critical Path
92

Figure 83: Critical Path
93

14.5 Budget
The average salary for an entry level Systems Engineer in Washington D.C.
and Northern VA is approximately $80,000 per year [20][21]. Assuming 52 work
weeks and 40 hours a week, this equates to $41/hour. We are implementing a
multiplier of 2 for overhead cost making the total pay $82/hour per person. The
total budget cost is based on 188 working days, weekends not included. The total
number of work weeks equate to 37 weeks, working 80 hours per week in total. The
total project cost is $251,740.00.
Hours (hours per
person) Cost
Cost with
Overhead
Optimistic 2,664 (18 hours) $109,224.00 $218,448.00
Standard 3,070 (20 hours) $125,870.00 $251,740.00
Pessimistic 3,356 (22 hours) $133,496.00 $266,992.00
Figure 84: Project Budget
94
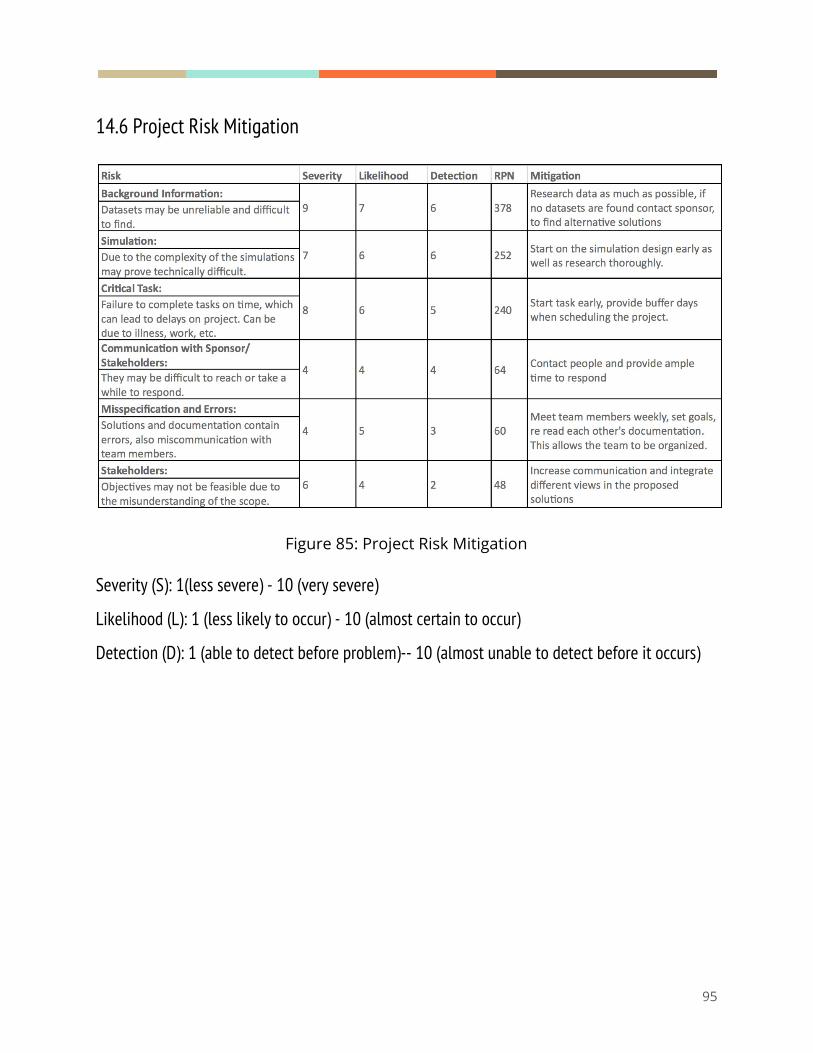
14.6 Project Risk Mitigation
Figure 85: Project Risk Mitigation
Severity (S): 1(less severe) - 10 (very severe)
Likelihood (L): 1 (less likely to occur) - 10 (almost certain to occur)
Detection (D): 1 (able to detect before problem)-- 10 (almost unable to detect before it occurs)
95

15.0 References 1. Skiresort Service International GmBH. “Ski lifts USA.” Accessed September 20, 2017.
http://www.skiresort.info/ski-resorts/usa/sorted/number-lifts/
2. Belin, D. “NSAA Economic Analysis Results: Breakdown of the 2015-16 Season.” NSAA Journal
25, (2017): 2-30.
3. National Ski Areas Association. “NSAA Ski Lift Fact Sheet.” NSAA, October 1, 2016.
https://www.nsaa.org/media/276290/Lift_Safety_Fact_Sheet_2016_Revised.pdf
4. National Ski Areas Association. Economic Analysis of United States Ski Areas Forty-Seventh
Edition. Colorado: RRC Associates, 2016.
5. Richardson, J. “Lift inspection vary broadly by state.” Press Herald, February 6, 2011.
http://www.pressherald.com/2011/02/06/lift-inspections-vary-broadly-by-state_2011-02-06/
6. National Ski Areas Association. “Skiing, not as expensive as You Might Think”. NSAA, 2013.
http://www.nsaa.org/media/186201/ticketpricearticle.pdf
7. Skilifts.org. “Cable Tramway Terms.” Accessed 28 September 2017.
http://www.skilifts.org/old/glossary.htm
8. Richardson, John. “A line of caution at Sugarloaf.” Accessed 2 October, 2017.
http://www.pressherald.com/2011/01/15/a-line-of-caution-at-sugarloaf_2011-01-15/
9. Camareto, Tim. “Safety Concerns Close Suicide Six Lift.” Valley News. Accessed 2 October,
2017. http://www.vnews.com/Archives/2016/02/SkiLifts-tc-vn-022416
10. Partek Enterprises. “Partek Ski Lifts.” Accessed 28 September, 2017.
http://www.partekskilifts.com/
11. National Safety Council. “National Safety Council Injury Facts 2015 Edition.”
http://www.nsc.org/Membership%20Site%20Document%20Library/2015%20Injury%20Facts/
NSC_InjuryFacts2015Ed.pdf
12. Sylte, Allison and Oravetz, Janet. “Mom dies, daughters hurt in fall from Colo. ski resort
chairlift.” USA Today. Accessed 1 October, 2017.
https://www.usatoday.com/story/news/nation-now/2016/12/29/mom-dies-daughters-hurt-c
hairlift/95988502/
13. Ski Area Management-SAM. “Outside Online Article Questions Aging Lift Infrastructure.” SAM
Magazine. Accessed 16 December.
http://www.saminfo.com/headline-news/8725-outside-online-article-questions-aging-lift-infr
astructure
14. Borrell, Brendan. 2016. “Is Your Local Chairlift a Death Trap?.” Accessed. 4 October.
https://www.outsideonline.com/2069911/your-local-chairlift-death-trap
96
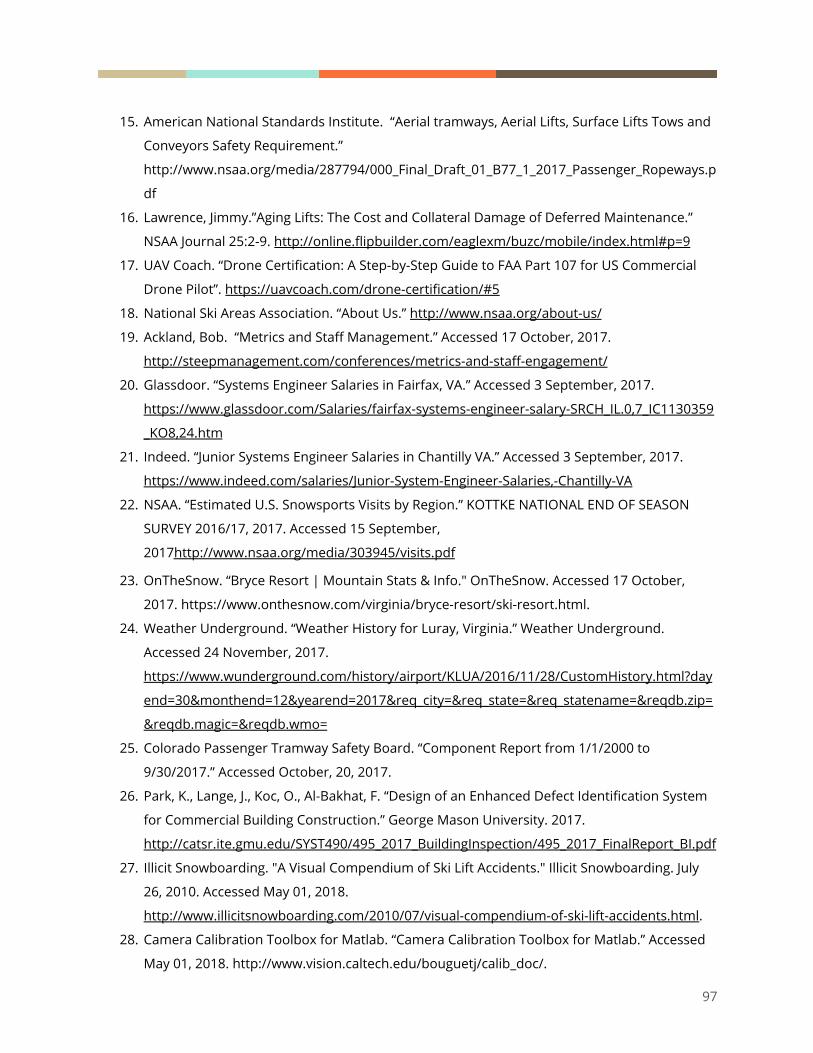
15. American National Standards Institute. “Aerial tramways, Aerial Lifts, Surface Lifts Tows and
Conveyors Safety Requirement.”
http://www.nsaa.org/media/287794/000_Final_Draft_01_B77_1_2017_Passenger_Ropeways.p
df
16. Lawrence, Jimmy.”Aging Lifts: The Cost and Collateral Damage of Deferred Maintenance.”
NSAA Journal 25:2-9. http://online.flipbuilder.com/eaglexm/buzc/mobile/index.html#p=9
17. UAV Coach. “Drone Certification: A Step-by-Step Guide to FAA Part 107 for US Commercial
Drone Pilot”. https://uavcoach.com/drone-certification/#5
18. National Ski Areas Association. “About Us.” http://www.nsaa.org/about-us/
19. Ackland, Bob. “Metrics and Staff Management.” Accessed 17 October, 2017.
http://steepmanagement.com/conferences/metrics-and-staff-engagement/
20. Glassdoor. “Systems Engineer Salaries in Fairfax, VA.” Accessed 3 September, 2017.
https://www.glassdoor.com/Salaries/fairfax-systems-engineer-salary-SRCH_IL.0,7_IC1130359
_KO8,24.htm
21. Indeed. “Junior Systems Engineer Salaries in Chantilly VA.” Accessed 3 September, 2017.
https://www.indeed.com/salaries/Junior-System-Engineer-Salaries,-Chantilly-VA
22. NSAA. “Estimated U.S. Snowsports Visits by Region.” KOTTKE NATIONAL END OF SEASON
SURVEY 2016/17, 2017. Accessed 15 September,
2017http://www.nsaa.org/media/303945/visits.pdf
23. OnTheSnow. “Bryce Resort | Mountain Stats & Info." OnTheSnow. Accessed 17 October,
2017. https://www.onthesnow.com/virginia/bryce-resort/ski-resort.html.
24. Weather Underground. “Weather History for Luray, Virginia.” Weather Underground.
Accessed 24 November, 2017.
https://www.wunderground.com/history/airport/KLUA/2016/11/28/CustomHistory.html?day
end=30&monthend=12&yearend=2017&req_city=&req_state=&req_statename=&reqdb.zip=
&reqdb.magic=&reqdb.wmo=
25. Colorado Passenger Tramway Safety Board. “Component Report from 1/1/2000 to
9/30/2017.” Accessed October, 20, 2017.
26. Park, K., Lange, J., Koc, O., Al-Bakhat, F. “Design of an Enhanced Defect Identification System
for Commercial Building Construction.” George Mason University. 2017.
http://catsr.ite.gmu.edu/SYST490/495_2017_BuildingInspection/495_2017_FinalReport_BI.pdf
27. Illicit Snowboarding. "A Visual Compendium of Ski Lift Accidents." Illicit Snowboarding. July
26, 2010. Accessed May 01, 2018.
http://www.illicitsnowboarding.com/2010/07/visual-compendium-of-ski-lift-accidents.html.
28. Camera Calibration Toolbox for Matlab. “Camera Calibration Toolbox for Matlab.” Accessed
May 01, 2018. http://www.vision.caltech.edu/bouguetj/calib_doc/.
97

16.0 Appendix
16.1 Team Photos
98

16.2 Colorado Cause and Failure codes
99

16.3 Simulation Code
A stochastic simulation was developed in java to compare inspection time. Safety,
accuracy and availability was developed in excel.
16.3.1 Main
import org.apache.commons.math3.distribution.*;
import java.util.*;
public class Main{
public static void main (String[] args){
ArrayList<Double> list = new ArrayList<Double>();
// TowerObject t1 = new TowerObject(12.5,0.0);
//height, distance from previous tower, vert dist from ground, # of sheaves uphill, # of sheave
downhill
TowerObject t2 = new TowerObject(12.5,0,0,6,6);
TowerObject t3 = new TowerObject(11.78,73.152,7.49808,4,2);
TowerObject t4 = new TowerObject(13.716,80.772,7.58952,6,2);
TowerObject t5 = new TowerObject(15.88,85.344,8.50392,6,2);
TowerObject t6 = new TowerObject(15.11,85.344,12.3444,6,6);
TowerObject t7 = new TowerObject(13.97,79.248,17.8308,6,2);
TowerObject t8 = new TowerObject(11.049,86.2584,22.58568,6,2);
TowerObject t9 = new TowerObject(13.67,95.0976,21.61032,4,2);
TowerObject t10 = new TowerObject(11.2,64.008,20.45208,8,6);
LiftObject lift = new LiftObject(new TowerObject[] {t2,t3,t4,t5,t6,t7,t8,t9,t10});
Inspection iUAV = new Inspection("UAV",
2,.3, //vertical speed
7,.3, //horizontal speed
3,.18, //inspection speed
1.3,8.46, //wind
100

300, 100, //set-up/battery change speed
lift);
Inspection iHUMAN = new Inspection("Current Method",
.5,.1, //vertical speed
.67,.1, //horizontal speed based on average human walking speed ~3.1 mph w gear to carry
.2,.07, //inspection speed ~1 mph
1,1, //wind actually has no effect here
(10*60), 100, //equipment set-up speed
lift);
double sum=0;
ArrayList<Double> timesUAV = new ArrayList<Double>();
int iterations = 1453; //1454 wind data points
ArrayList<Double> groundspeedH = new ArrayList<Double>();
ArrayList<Double> groundspeedI = new ArrayList<Double>();
for(int k=0; k<iterations; k++){
sum+= iUAV.time();
timesUAV.add(iUAV.time());
//groundspeedH.add(iUAV.normDist(iUAV.speed_horz_mean, iUAV.speed_horz_std)-(-.001 + 11
*iUAV.betaDist(iUAV.wind_mean, iUAV.wind_std)));
//groundspeedI.add(iUAV.normDist(iUAV.insp_speed_mean, iUAV.insp_speed_std)-(-.001 + 11 *
iUAV.betaDist(iUAV.wind_mean, iUAV.wind_std)));
}
double sum2=0;
ArrayList<Double> timesHUMAN = new ArrayList<Double>()
for(int h=0; h<iterations; h++){
sum2+= iHUMAN.time();
timesHUMAN.add(iHUMAN.time());
}
double sumDiffsSquared = 0.0;
for (double value : timesUAV)
{
double diff = Math.pow((value - (sum/iterations)),2);
sumDiffsSquared += diff;
}
double sum2DiffsSquared = 0.0;
101
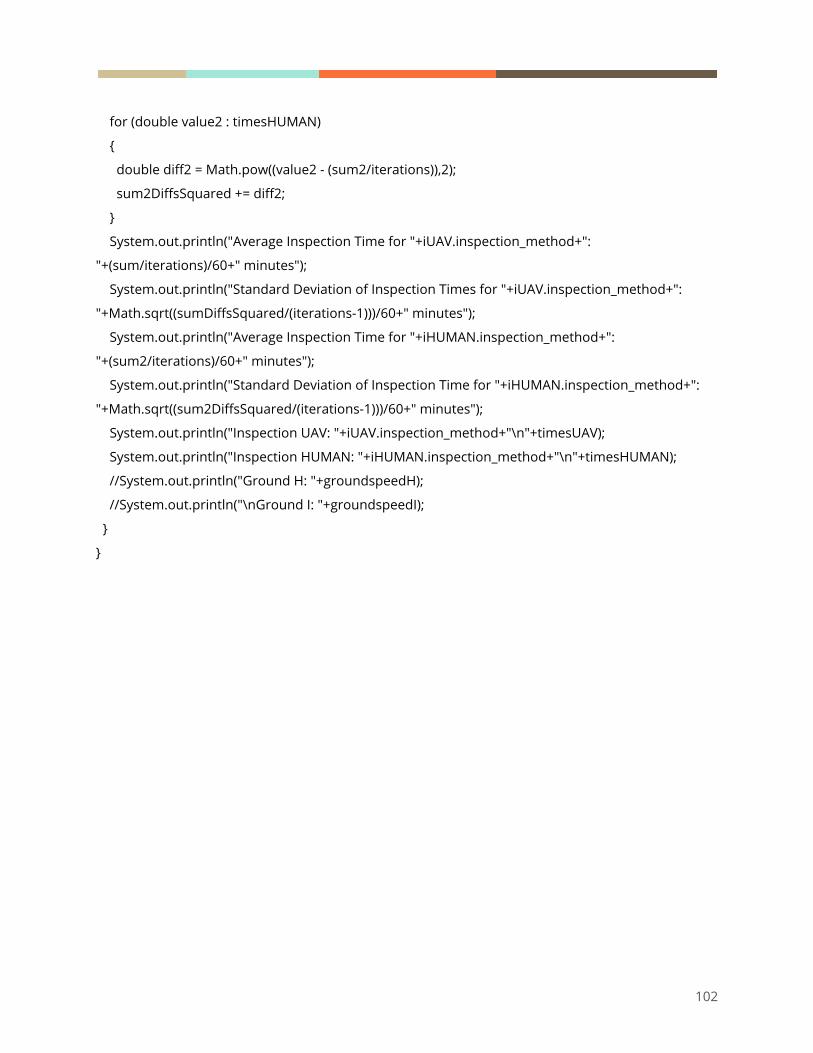
for (double value2 : timesHUMAN)
{
double diff2 = Math.pow((value2 - (sum2/iterations)),2);
sum2DiffsSquared += diff2;
}
System.out.println("Average Inspection Time for "+iUAV.inspection_method+":
"+(sum/iterations)/60+" minutes");
System.out.println("Standard Deviation of Inspection Times for "+iUAV.inspection_method+":
"+Math.sqrt((sumDiffsSquared/(iterations-1)))/60+" minutes");
System.out.println("Average Inspection Time for "+iHUMAN.inspection_method+":
"+(sum2/iterations)/60+" minutes");
System.out.println("Standard Deviation of Inspection Time for "+iHUMAN.inspection_method+":
"+Math.sqrt((sum2DiffsSquared/(iterations-1)))/60+" minutes");
System.out.println("Inspection UAV: "+iUAV.inspection_method+"\n"+timesUAV);
System.out.println("Inspection HUMAN: "+iHUMAN.inspection_method+"\n"+timesHUMAN);
//System.out.println("Ground H: "+groundspeedH);
//System.out.println("\nGround I: "+groundspeedI);
}
}
102

16.3.2 Counter
import java.io.*;
import java.util.*;
public class Counter {
public static void main(String [] args) {
// The name of the file to open.
String fileName = "C:\\Users\\katie\\Desktop\\Spring 2018\\Code\\2014.txt";
//String fileName = "C:\\Users\\katie\\Desktop\\Spring 2018\\Code\\2015.txt";
//String fileName = "C:\\Users\\katie\\Desktop\\Spring 2018\\Code\\2016.txt";
//String fileName = "C:\\Users\\katie\\Desktop\\Spring 2018\\Code\\2017.txt";
// This will reference one line at a time
String line = null;
try {
// FileReader reads text files in the default encoding.
FileReader fileReader =
new FileReader(fileName);
// Always wrap FileReader in BufferedReader.
BufferedReader bufferedReader =
new BufferedReader(fileReader);
int week = 0;
int index = 1;
ArrayList<Integer> i2014 = new ArrayList<Integer>();
while((line = bufferedReader.readLine()) != null) {
if(line.equals("1")){
week++;
}
else{
week=0;
}
if(index%7==0){
i2014.add(week);
week = 0;
}
103

index++;
}
System.out.println("Max: "+ Collections.max(i2014));
System.out.println("Weeks: "+ i2014);
System.out.println("Num Weeks: "+i2014.size());
// Always close files.
bufferedReader.close();
}
catch(FileNotFoundException ex) {
System.out.println(
"Unable to open file '" +
fileName + "'");
}
catch(IOException ex) {
System.out.println(
"Error reading file '"
+ fileName + "'");
// Or we could just do this:
// ex.printStackTrace();
}
}
}
16.3.3 TowerObject
import org.apache.commons.math3.distribution.*;
public class TowerObject{
public double height;
public double distFromPrevTower;
public double vertDistFromGround;
public double numSheeveUp;
public double numSheeveDown;
public TowerObject(double height, double distFromPrevTower, double vertDistFromGround, double
numSheeveUp, double numSheeveDown) {
this.height = height;
104
this.distFromPrevTower = distFromPrevTower;
this.vertDistFromGround = vertDistFromGround;
this.numSheeveUp = numSheeveUp;
this.numSheeveDown = numSheeveDown;
}
}
16.3.4 LiftObject
import org.apache.commons.math3.distribution.*;
public class LiftObject {
// Define Lift Characteristics --> how to format, csv? or .txt
public TowerObject[] towers;
public LiftObject() {
// TowerObject[] towers = new TowerObject[0]; //may not be necessary
}
public LiftObject(TowerObject[] towers) {
this.towers = towers;
}
public TowerObject get(int index){
if (index >= towers.length){ //index can't be out of bounds
throw new RuntimeException();
}
else{
return towers[index]; //return the TowerObject value at the given index
// return str;
}
}
public void set(int index, TowerObject tower){
if (index >= towers.length){ //index can't be out of bounds
throw new RuntimeException();
}
else{
towers[index] = tower; //set tower as the value at the given index
}
}
public double getSize(){
105
return this.towers.length;
}
}
16.3.5 Inspection
import org.apache.commons.math3.distribution.*;
import java.util.*;
public class Inspection {
public String inspection_method;
public double insp_time;
public double insp_cost;
public double battery_life;
public double speed_vert_mean;
public double speed_vert_std;
public double speed_horz_mean;
public double speed_horz_std;
public double insp_speed_mean;
public double insp_speed_std;
public double wind_mean;
public double wind_std;
public double setup_mean;
public double setup_std;
public LiftObject lift;
public double wind_total=0;
//constructor accepts a lift object and it's characteristics
public Inspection (String inspection_method,
double speed_vert_mean, double speed_vert_std, // UAV or human climb/descend
double speed_horz_mean, double speed_horz_std, // UAV between tower or human
walking
double insp_speed_mean,double insp_speed_std, //UAV maneuvering or human walking
on tower
double wind_mean, double wind_std,
double setup_mean, double setup_std, //UAV setup or human harness
LiftObject lift) {
106

this.inspection_method = inspection_method;
this.speed_vert_mean = speed_vert_mean;
this.speed_vert_std = speed_vert_std;
this.speed_horz_mean = speed_horz_mean;
this.speed_horz_std = speed_horz_std;
this.insp_speed_mean = insp_speed_mean;
this.insp_speed_std = insp_speed_std;
this.wind_mean = wind_mean;
this.wind_std = wind_std;
this.setup_mean = setup_mean;
this.setup_std = setup_std;
this.lift = lift;
}
// CALCULATE TIME OF
INSPECTION~~~~~~~~~~~~~~~~~~~~~~~~~~~~~~~~~~~~~~~~~~~~~~~~~~~~~~~~~~~~~~~~~~~~~~~
~~~~~~~~~~~~~~~
public double time() {
double setup = normDist(setup_mean, setup_std); //set-up average (5mins=300secs)
double total_inspection_time = setup;
double runtime = 0; //how long the drone has been operating in one battery (seconds)
int index = 0;
double wind = -.001 + 11 * betaDist(wind_mean, wind_std);
double tower_insp_time; //inspection time for each tower
double batt_life=30*60; //capacity in seconds for each new battery
//Inspecting with a UAV--------------------------------------------------------------------------------------------
if(inspection_method.equals("UAV")){
for(TowerObject t : lift.towers){ //loop through towers
if(tower_time(t,wind) < (batt_life*.7 - runtime)){ //it has enough time to inspect the next tower w
battery
tower_insp_time = tower_time(t,wind); //calculate time to inspect a tower
runtime+=tower_insp_time;
total_inspection_time += tower_insp_time;
tower_insp_time=0;
index++;
107

}
else{ //replace battery
runtime=0;
double batt_change = normDist(setup_mean, setup_std);
total_inspection_time+=batt_change; //battery change
//System.out.println("Battery change on Tower"+(index+1)+ "\nChange time: "+ batt_change);
tower_insp_time = tower_time(t,wind); //calculate time to inspect the tower
runtime+=tower_insp_time;
total_inspection_time += tower_insp_time;
tower_insp_time=0;
index++;
}
}
}
// Inspecting with the current method------------------------------------------------------------------------------
if(inspection_method.equals("Current Method")){
for(TowerObject i: lift.towers){
tower_insp_time = normDist(setup_mean,setup_std); // start w tower setup time, hook harness
to twr
tower_insp_time += (i.height/normDist(speed_vert_mean, speed_vert_std))*4 + //go up/down
twr height
(1.8288)/normDist(insp_speed_mean, insp_speed_std) + // walk 6 ft to left sheave
(i.numSheeveUp*60) + //inspect uphill sheaves
(4.1148/normDist(insp_speed_mean, insp_speed_std))*2 + //walk across top to other side
~13.5'
(i.numSheeveDown*60) + //inspect downhill sheaves
(2.286/normDist(insp_speed_mean, insp_speed_std)) + //walk back to ladder ~ 7.5'
(4.1148/normDist(insp_speed_mean, insp_speed_std))*2 + //inspect structure -walk across top
~13.5'
108

4*Math.sqrt((Math.pow(i.distFromPrevTower,2)+Math.pow(i.vertDistFromGround,2)))/
normDist(speed_horz_mean, speed_horz_std); // climb down incl. go to next tower
total_inspection_time+=tower_insp_time;
}
}
return total_inspection_time;
}
//~~~~~~~~~~~~~~~~~~~~~~~~~~~~~~~~~~~~~~~~~~~~~~~~~~~~~~~~~~~~~~~~~~~~~~~~~~~~~~~~
~~~~~~~~~~~~~~~~~~~~~~~~~~~~~~~~~~~
public double tower_time(TowerObject t, double wind){
double upDown_speed = normDist(speed_vert_mean, speed_vert_std); //m/s
double upDown_time = t.height/upDown_speed;
double speed_vert1 = normDist(speed_vert_mean, speed_vert_std); // m/s
double tower_clear1 = ((3.408)/(speed_vert1)); //second
double insp_speed1 = normDist(insp_speed_mean, insp_speed_std); // m/s
double across_tower1 =(10.2108)/normDist(.399,.102);//(insp_speed1-wind); //seconds THIS IS
GRND SPEED FROM WIND DIST
double insp_structure_speed1 = normDist(insp_speed_mean, insp_speed_std); // m/s
double structure_insp_time1 = (6.7056)/(normDist(.399,.102));//insp_structure_speed1-wind);
//seconds THIS IS GRND SPEED FROM WIND DIST
double travel_across_speed1 = (normDist(insp_speed_mean, insp_speed_std)); //m/s
double travel_across_time1 = (6.4008)/(normDist(.399,.102));//(travel_across_speed1-wind);
//seconds THIS IS GRND SPEED FROM WIND DIST
double travel2center = (normDist(insp_speed_mean, insp_speed_std)); //m/s
double travel2center_time = (3.68)/(normDist(.399,.102));//(travel2center-wind);// THIS IS GRND
SPEED FROM WIND DIST
109

double distFromPrevTower_speed = (normDist(speed_horz_mean, speed_horz_std));
double distFromPrevTower_time =
(t.distFromPrevTower)/(7*betaDist(2,4.94));//(distFromPrevTower_speed-wind); //seconds THIS IS
GRND SPEED FROM WIND DIST
double tower_insp_time =
(upDown_time)*2 + //going up/down to tower height level
(20*2) + //inspect wheel sides (once per side)
(tower_clear1)*4 + //tower height clearance
(across_tower1) + //go across above tower
(structure_insp_time1) + //inspect tower structure
(20*2) + //30 seconds to inspect top of sheave trains (10 seconds per sheave train)
(travel_across_time1) + //travel speed across the structure
(20*2) + //inspect side of tower
(travel2center_time) + //go to center of tower
(Math.sqrt((Math.pow(t.distFromPrevTower,2)+Math.pow(t.vertDistFromGround,2))))/normDist(.67,.1
)+ //human operator travels to join up
distFromPrevTower_time;
return tower_insp_time;
}
public double normDist(double mean, double std) {
Random rng = new Random();
double ret = mean + std * rng.nextGaussian();
110

//System.out.println(ret);
return ret;
}
public double betaDist(double alpha, double beta){
BetaDistribution b = new BetaDistribution(alpha, beta);
double n = b.inverseCumulativeProbability(Math.random());
return n;
}
}
16.4 Youtube Video
Youtube Link: https://youtu.be/-8l0tEkVvRo
111