Margin Determination in the Design and Development of a Thermal

Raytheon Design for Six Sigma
Design Margin Analysis & Prediction
Richard W. JohnsonDFSS Deployment Lead
Raytheon Company
January 11, 2005

Raytheon Design for Six Sigma
Definition of “Margin”
USL
TargetNominal
Value
x
How do we apply “Margin” in our Designs?
Design Margin = ? Design Margin = ?
USLLSL
xy
TargetNominal
Value
• An amount allowed beyond what is needed (e.g. a small margin of safety)** The American Heritage Dictionary, Fourth Edition
x USL Design Margin = xLSL Design Margin = y
What if we determine that the predicted unit-to-unit variability looks like this....how does this change our predicted design margin?
What if we determine that the predicted unit-to-unit variability looks like this....how does this change our predicted design margin?
Design Margin = ?
USLLSLMeanValue
σ
So.....How can we quantify design margin such that the
effects of expected unit-to-unit variation are comprehended?

Raytheon Design for Six Sigma
What is Design Margin in the DFSS Paradigm?
Design Margin can be quantified using the Mid-Term Capability Index (Cpk)
MIN (USL - µ, µ - LSL)3σ
Design Margin (DM) =• Assumes that µ is between USL and LSL
= Cpk
USLLSLMean
(µ)
Desired DM:
DM = 2.0σ
6σ
DM = 6σ/3σ = 2.0
Min Acceptable DM:
DM = 1.5
DM = 4.5σ/3σ = 1.5
6σ4.5σ
σ

Raytheon Design for Six SigmaA Common Dilemma
USL
Estimated Response
You work hard to get your estimated response below the USL.......• Pushing the response estimate lower will
• Take more design time (more design iterations)• Require higher-cost components & materials• Drive tighter manufacturing tolerances
Negative impact on Program Schedule
Negative impact on Product Cost
Your design meets the Your design meets the requirement..... Right?requirement..... Right?
0 .1 .2 .3 .4 .5 .6 .7 .8 .9 1.0
Should you change your Should you change your design to push the response design to push the response lower? ..... Do you have lower? ..... Do you have enough design margin? enough design margin?

Raytheon Design for Six SigmaA Common Dilemma
USL
Estimated Response
Mean
If the actual response distribution looks like this....this placement of the mean should result in acceptable yields at test
DefectiveUnits
If the actual response distribution looks like this....this placement of the mean will drive a high rate of defective units at test
0 .1 .2 .3 .4 .5 .6 .7 .8 .9 1.0
Placement of the estimated response mean with respect to Placement of the estimated response mean with respect to the specified limit is a the specified limit is a ““guessing gameguessing game”” if the expected if the expected response variation is not knownresponse variation is not known

Raytheon Design for Six Sigma
Design Margin Analysis ExampleDesign Margin Analysis Example
Military Radio Production
• Experiencing poor first pass yields at several ambient gain tests
• Design margin analysis recommended • Mean value of many test
measurements are close to limit• Poor design margin suspected to be the
problem

Raytheon Design for Six Sigma
Program Example Program Example –– Military Radio ProductionMilitary Radio Production
Design Margin AnalysisDesign Margin Analysis
Approach
• Select tests to be analyzed• Download historical test data to statistical data analysis tool
• Agilent ADS (Advanced Design System)• Analyze the Data• Calculate Design Margin• Verify correlation of DM analysis with
probabilistic predictions

Raytheon Design for Six Sigma
Std Dev = .055 dB
Gain Distribution
0
50
100
150
200
250
300
-11 -10.6
-10.2 -9.8
-9.4 -9
-8.6
-8.2
-7.8
-7.4 -7
-6.6
-6.2
-5.8
-5.4 -5
-4.6
-4.2
Gain (dB)
Num
ber o
f Uni
ts
Ant SW: Gain Margin03-07320 Test #60 : Gain J10 to P5
Lower Spec Limit
Original MeanTemp Modified Limit
Lower Spec Limit
OriginalMean Temp Modified Limit
Program Example Program Example –– Military Radio ProductionMilitary Radio ProductionDesign Margin AnalysisDesign Margin Analysis
GoalMean
6 Sigma
Probabilistic modeling of performance output verified that inadequate design margin could have been predicted, identified input variables driving most of response variation, and ensured success of new design.
2 Sigma
µ - LSL3σ
DM = = - 0.83 – (- 0.94)
3 (.055)
Design Margin CalculationDesign Margin Calculation
DM = 0 .67
Raytheon Design for Six Sigma
Upper Spec Limit
Original MeanTemp Modified Limit
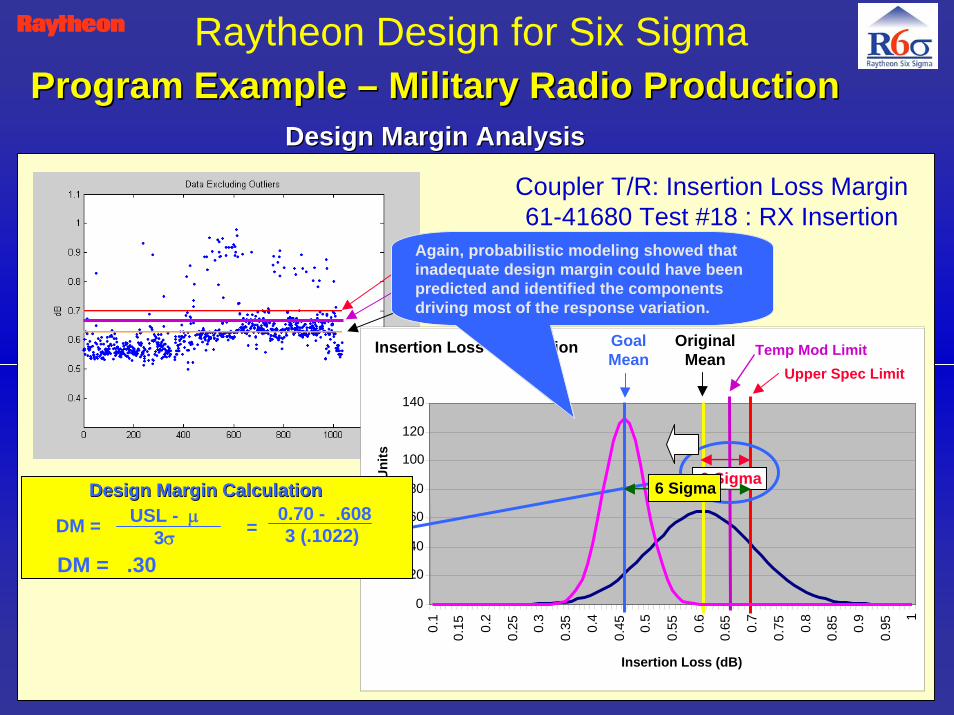
Coupler T/R: Insertion Loss Margin61-41680 Test #18 : RX Insertion
Loss
Program Example Program Example –– Military Radio ProductionMilitary Radio ProductionDesign Margin AnalysisDesign Margin Analysis
Insertion Loss Distribution
0
20
40
60
80
100
120
140
0.1
0.15 0.
2
0.25 0.
3
0.35 0.
4
0.45 0.
5
0.55 0.
6
0.65 0.
7
0.75 0.
8
0.85 0.
9
0.95
1
Insertion Loss (dB)
Num
ber o
f Uni
ts
Original Mean
Upper Spec LimitTemp Mod Limit
Std Dev = .1022 dB
.9 Sigma
USL - µ3σ
DM = = 0.70 - .6083 (.1022)
Design Margin CalculationDesign Margin Calculation
DM = .30
GoalMean
6 Sigma
Again, probabilistic modeling showed that inadequate design margin could have been predicted and identified the components driving most of the response variation.

Raytheon Design for Six SigmaProgram Example Program Example –– Military Radio ProductionMilitary Radio Production
Design Margin AnalysisDesign Margin Analysis
Results• 19 of 37 analog circuits were identified with low design
margin (Cpk<.72)
• Probabilistic modeling using design specifications verifiedthat the low design margins could have been predicted
• Design margin analysis on production test data coupled withprobabilistic modeling & simulation of the circuit designsprovided clear visibility to which design variables could beadjusted to achieve desired margins
Raytheon Design for Six Sigma
Design Margin Prediction ExampleDesign Margin Prediction Example
Lightweight Video Sight (LVS)
• LVS mounted on grenade machine gun• Developed for military combat applications• Implemented design improvements to
include optical path

Raytheon Design for Six Sigma
Design Margin Prediction ExampleDesign Margin Prediction Example
Objectives• Determine the Line of Sight (LOS) variation for theLVS sensors
• Image-Intensified Night Vision Camera (I2TV)• Day Television Camera (DTV)• Laser Rangefinder (LRF)

Raytheon Design for Six Sigma
Design Margin Prediction ExampleDesign Margin Prediction Example
Approach
• Identify error sources• Create model (transfer function)
• Establish relationships• Develop equations
• Run simulation• Monte Carlo
• Analyze results
Raytheon Design for Six Sigma
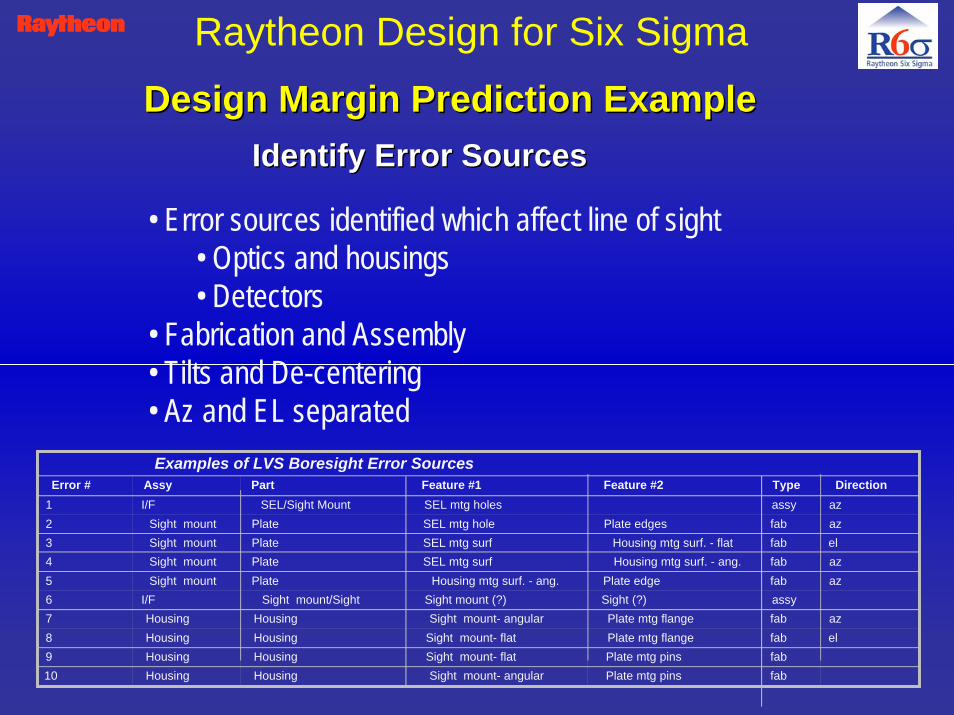
Identify Error SourcesIdentify Error SourcesDesign Margin Prediction ExampleDesign Margin Prediction Example
• Error sources identified which affect line of sight• Optics and housings• Detectors
• Fabrication and Assembly• Tilts and De-centering• Az and EL separatedExamples of LVS Boresight Error Sources
Error # Assy Part Feature #1 Feature #2 Type Direction1 I/F SEL/Sight Mount SEL mtg holes assy az2 Sight mount Plate SEL mtg hole Plate edges fab az3 Sight mount Plate SEL mtg surf Housing mtg surf. - flat fab el4 Sight mount Plate SEL mtg surf Housing mtg surf. - ang. fab az5 Sight mount Plate Housing mtg surf. - ang. Plate edge fab az6 I/F Sight mount/Sight Sight mount (?) Sight (?) assy7 Housing Housing Sight mount- angular Plate mtg flange fab az8 Housing Housing Sight mount- flat Plate mtg flange fab el9 Housing Housing Sight mount- flat Plate mtg pins fab10 Housing Housing Sight mount- angular Plate mtg pins fab

Raytheon Design for Six Sigma
LENS #1TILT
CELLLENS #1
TILT
LENS #2TILT
CELLLENS #2
TILT
LENS #3TILT
CELLLENS #3
TILT
LENS #1DE-CENTER
CELLLENS #1
DE-CENTER
LENS #2DE-CENTER
CELLLENS #2
DE-CENTER
LENS #3DE-CENTER
CELLLENS #3
DE-CENTER
FOCUS CELLTILT
LENS HSG.TILT
LENS HSG.DE-CENTER
LENS #5DE-CENTER
CELLLENS #5
DE-CENTER
LENS #6DE-CENTER
CELLLENS #6
DE-CENTER
LENS #7DE-CENTER
CELLLENS #7
DE-CENTER
ASSYLENS #5
DE-CENTER
ASSYLENS #6
DE-CENTER
ASSYLENS #7
DE-CENTER
LENS #4DE-CENTER
CELLLENS #4
DE-CENTER
LENS #4TILT
CELLLENS #4
TILT
LENS #5TILT
CELLLENS #5
TILT
LENS #6TILT
CELLLENS #6
TILT
LENS #7TILT
CELLLENS #7
TILT
FLATMIRROR
TILT
ANNULARMIRROR
TILT
LOS ERROROPTICAL BENCH
DTV ASSY
I2 ASSYDE-CENTER
ANNULARMIRROR
LOCATION
FLATMIRROR
LOCATION
FABTOLERANCE
SUMMATION
CALCULATION
ASSYTOLERANCE
LENS #1TILT
LENS #2TILT
LENS #3TILT
LENS #1DE-CENTER
LENS #2DE-CENTER
LENS #3DE-CENTER
LOS ERRORLENS ASSY
LENSES
LOS ERRORLENS ASSY
ASSYLENS #1
DE-CENTER
ASSYLENS #2
DE-CENTER
ASSYLENS #3
DE-CENTER
LENS #5DE-CENTER
LENS #6DE-CENTER
LENS #7DE-CENTER
LENS #4DE-CENTER
ASSYLENS #4
DE-CENTER
LENS #4TILT
LENS #5TILT
LENS #6TILT
LENS #7TILT
LOS ERROROPTICAL BENCH
I2 ASSY
DTVDE-CENTER
ASSYDTV
DE-CENTER
ASSYI2 ASSY
DE-CENTER
ASSYLENS #3
TILT
DTVDE-CENTER
I2 ASSYDE-CENTER
Create Response ModelCreate Response Model
Design Margin Prediction ExampleDesign Margin Prediction Example

Raytheon Design for Six SigmaDesign Margin Prediction ExampleDesign Margin Prediction Example
Create Response ModelCreate Response ModelInput Variables • Six Sigma tolerances used for
all fabrication errors• Obtained tolerances from
Raytheon Internal ProcessCapability Database
• 6σ tolerances derived fromactual measured part data
• Methods and Tooling groupconsulted for distribution fit
Six Sigma Tolerances for Some of the Machined Features Involved
+6σ-6σ
Feature #n
+6σ-6σ
Feature #5
+6σ-6σ
Feature #4
+6σ-6σ
Feature #3
+6σ-6σ
Feature #2
+6σ-6σ
Feature #1
•FAB TOLERANCES, LENS ASSY• TILT, LENS SEATS - ⊕ .00076 (N/C Lathe)• DE-CENTER, LENS BORES - ⊕ .00076 (N/C Lathe)
• FAB TOLERANCES, OPTICAL BENCH ASSY• TILT, LENS SEATS - // .003, ⊥ .0036 (N/C Mill)• DE-CENTER, LENS BORES - ⊕ .00174 (N/C Mill)• TILT, MIRRORS - ∩ .006 (N/C Mill)• LOCATION, MIRRORS - ∩ .006 (N/C Mill)

Raytheon Design for Six Sigma
Create the Response ModelCreate the Response Model
Design Margin Prediction ExampleDesign Margin Prediction Example
Using Decisioneering’s Crystal Ball ® – Monte Carlo Simulation
Error Sources(Input Variables) Random
ValuesTransfer Function
Generate Distribution for
Response
LOS calculation
USLLSL
USLLSLUSLLSL
USLLSLUSLLSL
USLLSLUSLLSL
USLLSLUSLLSL
User defined:• Means• Tolerances• Distributions• Sigma levels
Re-iterate “X”number of trials

Raytheon Design for Six Sigma
Run the Simulation and Analyze the ResultsRun the Simulation and Analyze the Results
Frequency Chart
.000
.006
.012
.019
.025
0
61.75
123.5
185.2
247
-0.44 -0.22 -0.00 0.21 0.43
10,000 Trials 163 OutliersForecast: LOS Error, DTV to LRF, Elevation
Frequency Chart
.000
.006
.012
.018
.025
0
61.5
123
184.5
246
-0.46 -0.23 -0.01 0.22 0.44
10,000 Trials 130 OutliersForecast: LOS Error, DTV to LRF, Azimuth
Forecast: LOS Error, DTV to LRF, ElevationStatistic ValueTrials 10,000Mean 0.00Median -0.00Mode ---Standard Deviation 0.17 (6σ = 1.02 mrad)Variance 0.03Skewness -0.03Kurtosis 3.61Mean Std. Error 0.00
Forecast: LOS Error, DTV to LRF, AzimuthStatistic ValueTrials 10,000Mean 0.00Median 0.00Mode ---Standard Deviation 0.17 (6σ = 1.02 mrad)Variance 0.03Skewness -0.02Kurtosis 3.51Mean Std. Error 0.00
Spec = 2.08 mrad Max
Using 6 Sigma
Manufacturing Tolerances!
Design Margin Prediction ExampleDesign Margin Prediction Example
USL - µ3σDM = = 2.08 - 0.00
3 (0.17)4.08
Design Margin CalculationDesign Margin Calculation
DM =
Raytheon Design for Six Sigma
Design Margin Prediction ExampleDesign Margin Prediction Example
Results
• System level mechanical boresight alignment not required (~$300K Avoidance).
• Optical alignment of the I2 and DTV cameracomponents will be required.
• Software alignment of the aiming reticle to theLRF transmitter beam at the system level will berequired.

Raytheon Design for Six Sigma
Analysis ToolsAnalysis Tools
Data Analysis
• Statistical Analysis and Acceptance Test Software (STAATS)• Advanced Design System – Agilent Technologies• Minitab• Microsoft Excel
• Raytheon Analysis of Variability Engine (RAVE)• Crystal Ball - Decisioneering• Advanced Design System (ADS) – Agilent Technologies• Statistical Design Institute Tools
Probabilistic Performance Modeling

Raytheon Design for Six Sigma
Conclusions• Design Margin is a familiar concept in engineering and
manufacturing environments, but has been under-utilizedbecause classical methods of quantifying design margin inproduct performance do not comprehend unit-to-unit variability
• Classical design methods recognized the existence of unit-to-unit variability, but in the absence of available/efficientmethods and tools to model variability, adopted the use ofsafety factors and worst-case design (infinite margin)
• More design iterations• Higher-cost materials/components• Tighter tolerances
• Using Cpk as a design margin model provides way to:• Communicate how much variability is occurring or tolerable• Communicate how much risk is present or tolerable