Design Fundamentals DPWH
96
Basics of Concrete Pavement Thickness Design
-
Upload
jerome-angelo-b-baybay -
Category
Documents
-
view
318 -
download
26
description
volume 3
Transcript of Design Fundamentals DPWH

Basics of Concrete Pavement Thickness Design

Concrete Pavement Design
• Geometrics• Thickness(es)• Joints
• Materials

Concrete Pavement Design
• Geometrics• Thickness(es)• Joints
• Materials
Most Often Influence Cost& Selection of Projects
COST
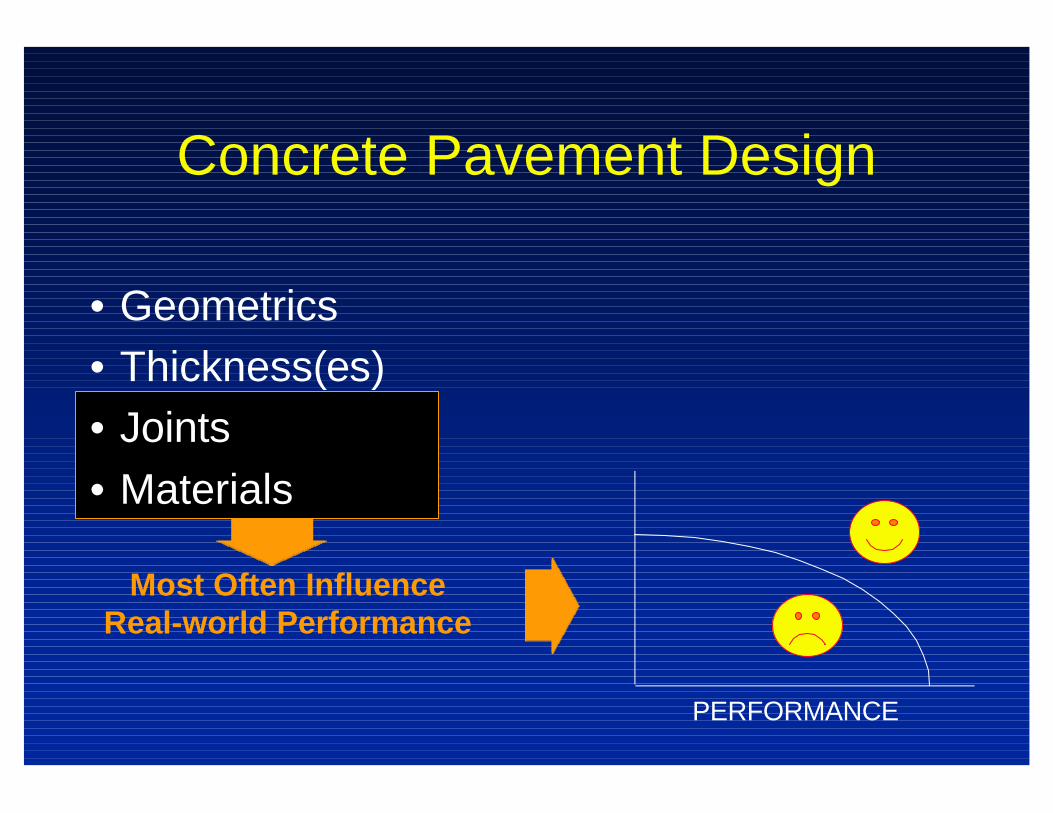
Concrete Pavement Design
• Geometrics• Thickness(es)• Joints
• Materials
Most Often InfluenceReal-world Performance
PERFORMANCE
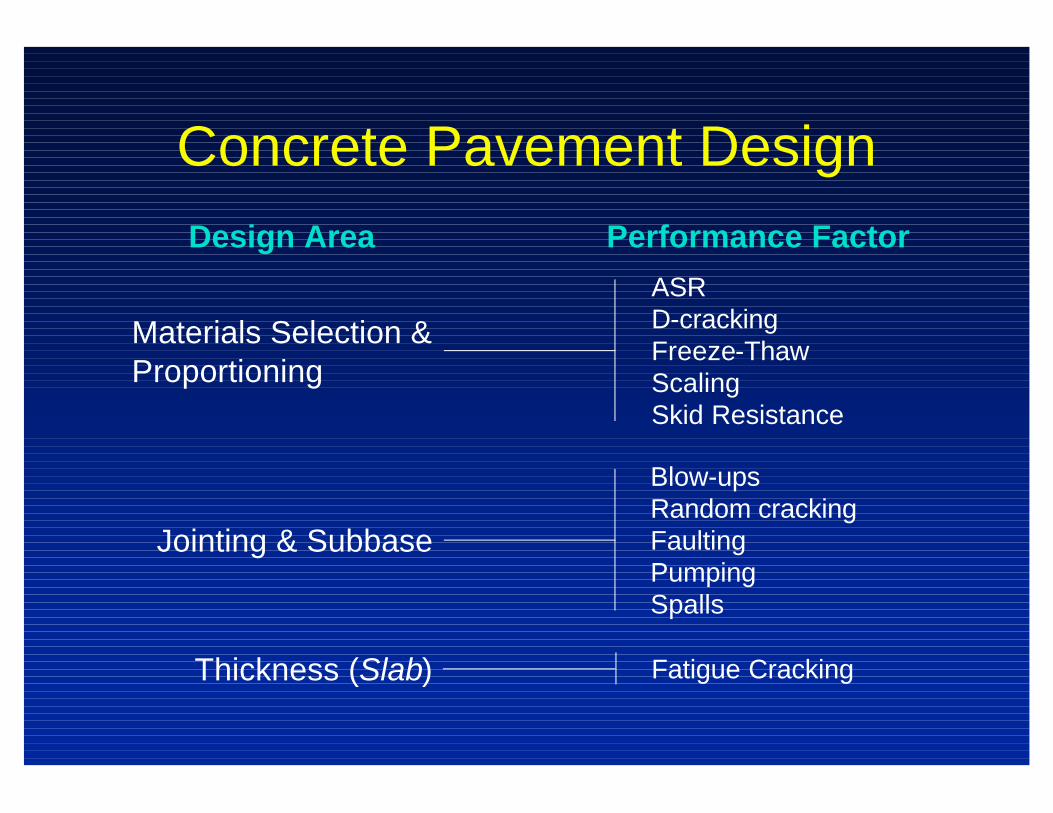
Concrete Pavement Design
Performance FactorDesign Area
Blow-upsRandom crackingFaultingPumpingSpalls
Jointing & Subbase
Materials Selection &Proportioning
ASRD-crackingFreeze-ThawScalingSkid Resistance
Thickness (Slab) Fatigue Cracking

Principles of Design
Load stresses
Volume change stresses
Curling/Warping stresses
Jointing orReinforcing
Thickness

Thickness Design Procedures
• Empirical Design Procedures• Based on observed performance
• AASHO Road Test
• Mechanistic Design Procedures• Based on mathematically calculated pavement
responses• PCA Design Procedure (PCAPAV)

PAVEMENT DESIGN
NCHRP 1-26 Phase II Final Report
Pavement design is an a priori process.The new pavement will be built in the future, on subgrades often not yet exposed or accessible; using materials not yet manufactured from sources not yet identified; by a contractor who submitted the successful "low dollar" bid, employing unidentified personnel and procedures under climatic conditions that are frequently less than ideal.
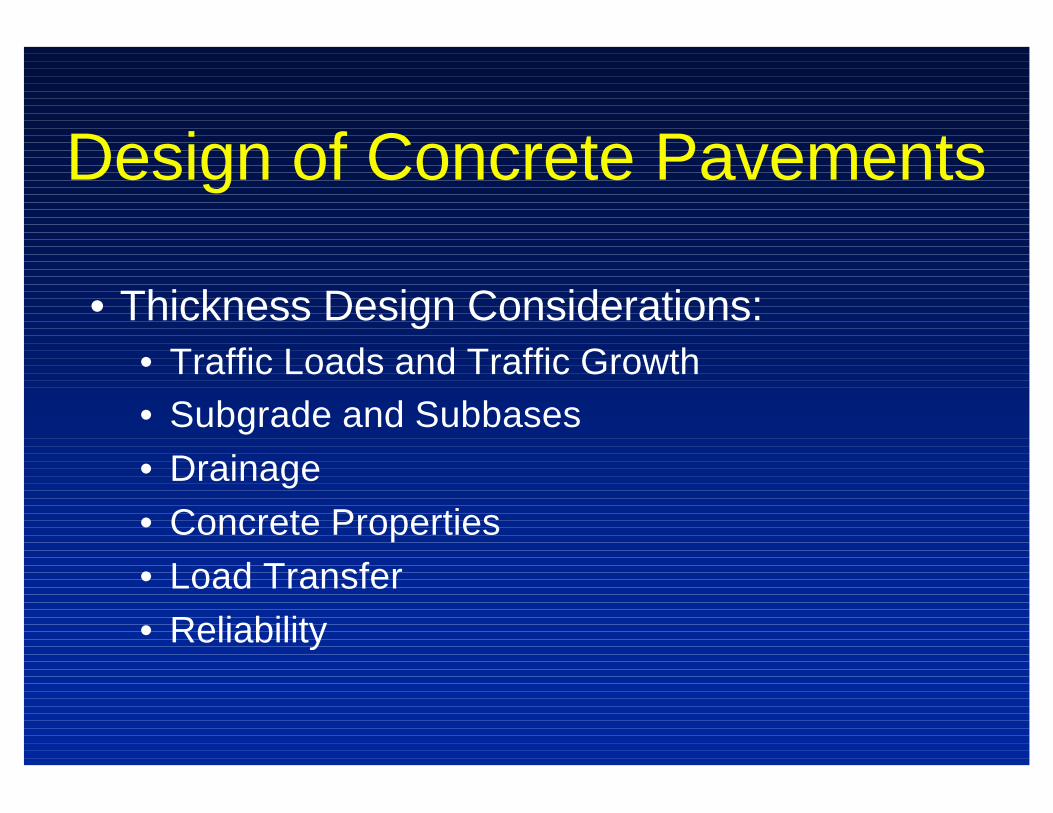
• Thickness Design Considerations:• Traffic Loads and Traffic Growth
• Subgrade and Subbases
• Drainage
• Concrete Properties
• Load Transfer
• Reliability
Design of Concrete Pavements

AASHTO Design Procedures
AASHTO Guide for Design of Pavement Structures - 1993
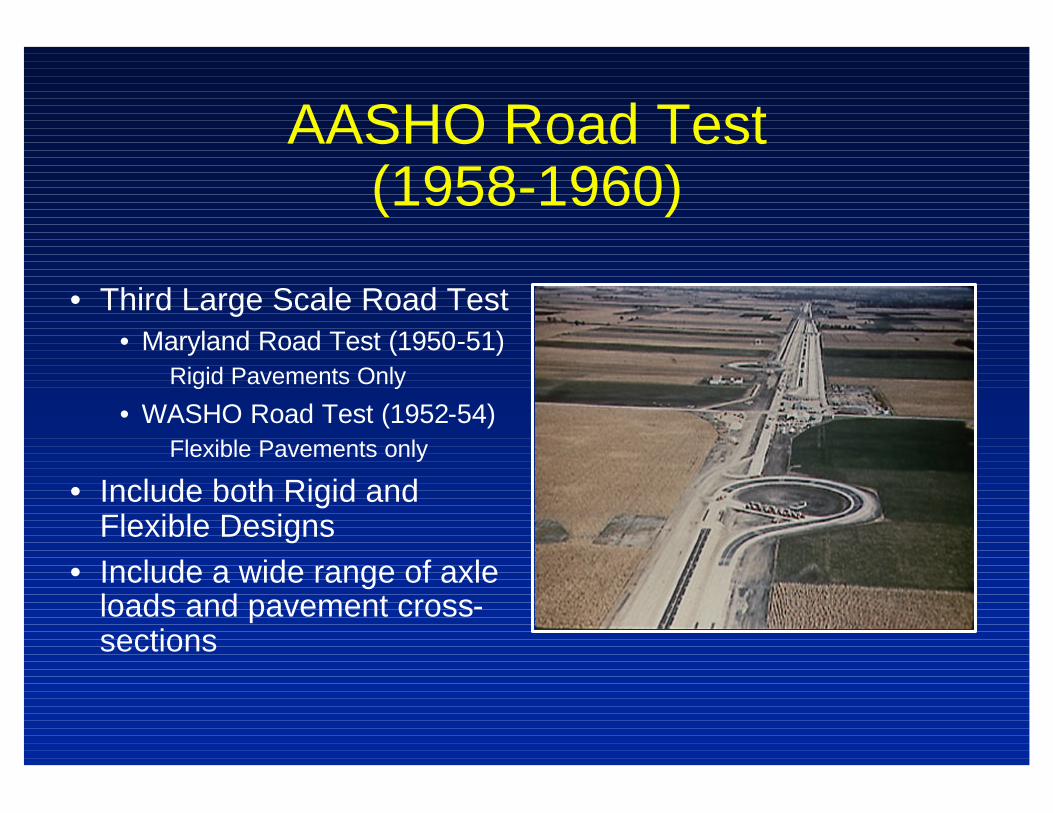
AASHO Road Test(1958-1960)
• Third Large Scale Road Test• Maryland Road Test (1950-51)
Rigid Pavements Only
• WASHO Road Test (1952-54)Flexible Pavements only
• Include both Rigid and Flexible Designs
• Include a wide range of axle loads and pavement cross-sections

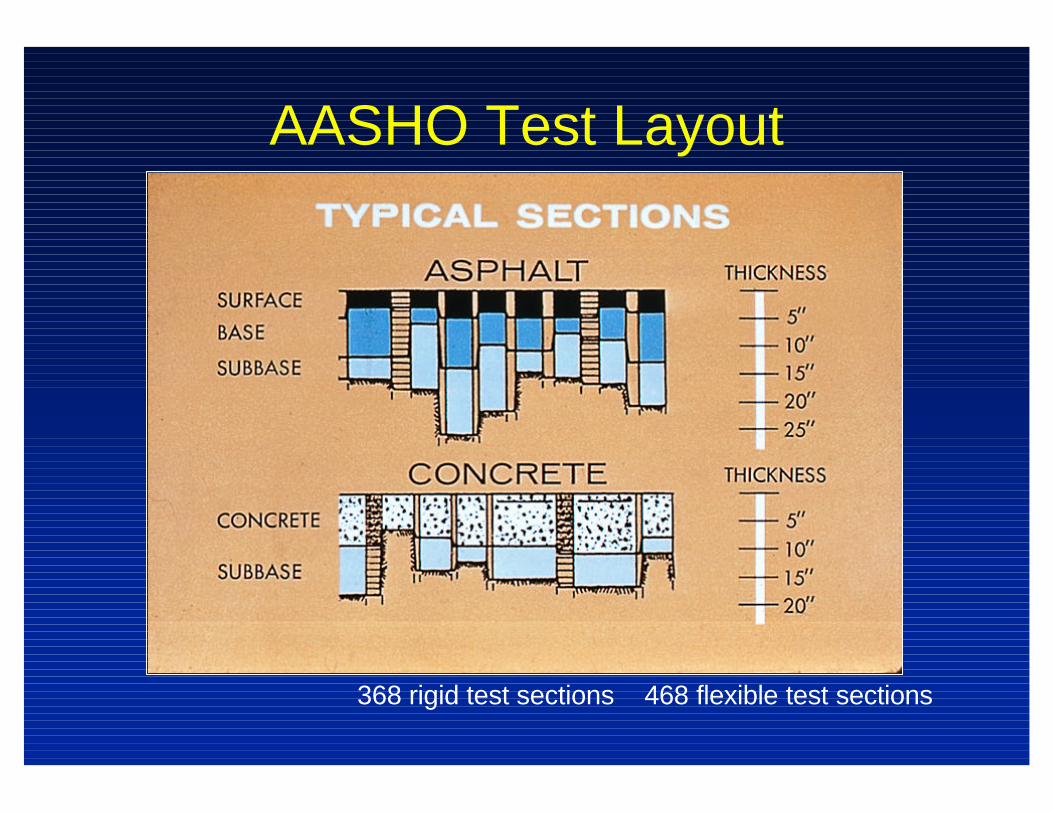
AASHO Test Layout
AASHO Test Layout
368 rigid test sections 468 flexible test sections

Max Single Axle
Max Tandem Axle
AASHO Test Traffic

AASHO Road Test PerformanceSurviving Sections
Loop 3
1.0
2.0
3.0
4.0
5.0
0 250 500 750 1000 1250
Ser
vice
abili
ty
Concrete (36 Sect)
Asphalt (4 Sect)
Loop 4
1.0
2.0
3.0
4.0
5.0
0 250 500 750 1000 1250Load Applications
Ser
vice
abili
ty
Loop 5
1.0
2.0
3.0
4.0
5.0
0 250 500 750 1000 1250
Ser
vice
abili
ty
Loop 6
1.0
2.0
3.0
4.0
5.0
0 250 500 750 1000 1250Load Applications
Ser
vice
abili
ty
Concrete (38 Sect)
Asphalt (10 Sect)
Concrete (39 Sect)
Asphalt (11 Sect)
Concrete (47 Sect)
Asphalt (17 Sect)

AASHTO Design Procedures & Changes
1961-62 AASHO Interim Guide for the Design of Rigid and Flexible Pavements
1972 AASHTO Interim Guide for the Design of Pavement Structures - 1972
1981 Revised Chapter III on Portland Cement Concrete Pavement Design
1986 Guide for the Design of Pavement Structures1993 Revised Overlay Design Procedures1998 Revised Portland Cement Concrete Pavement Design

Log(ESALs) Z * s + 7.35*Log(D +1) - 0.06R o=
( )
+Log
PSI4.5 - 1.5
1+1.624*10
D
7
+
∆
18 46.
Standard Normal Deviate
OverallStandard Deviation
Depth
( )+ 4.22 - 0.32pt *[ ]
( )
LogS' C D 1.132
215.63* J * D -18.42
E / k
c d0.75
0.75
c
−
0 25.
* *
Change in Serviceability
Terminal Serviceability
DrainageCoefficient
Load Transfer
Modulus ofRupture
Modulus of Elasticity
Modulus ofSubgrade Reaction
1986-93 Rigid Pavement Design Equation

AASHTO DESIGN Traffic
ESAL’s or E-18’s The number and weight of all axle loads from the anticipated vehicles expected during the pavement design life - expressed in 18-kip (80 kN) Equivalent Single Axle Loads for each type of pavement.
—Rigid ESAL’s or E-18’s
—Flexible ESAL’s or E-18’s

AASHTO DESIGN Traffic - ESALs
Equivalent Number of 18k Single Axle Loads

ESALs GENERATED BY DIFFERENT VEHICLES/DAY
VEHICLE NUMBER RIGIDESALs
FLEXIBLEESALs
Single Units 2 Axle 20 6.38 6.11Busses 5 13.55 8.73Panel Trucks 10 10.89 11.11Semi-tractor Trailer 3 Axles 10 20.06 13.41Semi-tractor Trailer 4 Axles 15 39.43 29.88Semi-tractor Trailer 5 Axles 15 57.33 36.87Automobile, Pickup, Van 425 1.88 2.25
Total 500 149.52 108.36

AASHTO DESIGNTraffic
Load Equivalence Factor (LEF) The Ratio of the Effect (Damage) of a Specific Axle Load on Pavement Serviceability to the Effect Produced by an 18-kip Axle Load at the AASHO Road Test.
Change for each: Pavement TypeThicknessTerminal Serviceability.

AASHTO DESIGNTraffic
Load Equivalence Factor (LEF)
No. of repetitions of 18-k SAL Load causing given ∆PSI No. of repetitions of X-k Y-Axle Load for a same ∆PSI
Change for each: Pavement TypeThicknessTerminal Serviceability.

For a Given Stress or Strain:
LOAD EQUIVALENCY FACTORSFOR A GIVEN PAVEMENT STRUCTURE
Stress or Strain of X-kip Load on Axle Type Y
Stress or Strain of 18-kip Load on a Single Axle

For a Given Serviceability Loss:
LOAD EQUIVALENCY FACTORSFOR A GIVEN PAVEMENT STRUCTURE
# of Repetitions of X-kip Load on Axle Type Y
# of Repetitions of 18-kip Load on a Single Axle
PSI PSI

ConcreteResponse
AsphaltResponse
Since pavement responses are different, the equivalency factors (LEFs) are different. When multiplying the traffic by the different equivalencies, you get different ESALs
AASHTO DESIGN Traffic

Subgrade and Subbases
• Subbase• Layer of material
directly below the concrete pavement.
• Subgrade• Natural ground, graded,
and compacted on which the pavement is built.
Subbase
Subgrade
Concrete Section

Subgrade / Subbase Strength
Modulus of Subgrade Reaction, k
Reaction
Stacked Plates
Hydraulic Jack Pressure Gauge
Deflection Dial at 1/3 Points
k (psi/in) = unit load on plate / plate deflection

Subgrade and SubbasesDesign
• Subgrade strength is not a critical element in the thickness design.
• Has little impact on thickness.
• Need to know if pavement is on:• Subgrade (k ≈ 100 psi/in.),
• Granular subbase (k ≈ 150 psi/in.),
• Asphalt treated subbase (k ≈ 300 psi/in.)
• Cement treated/lean concrete subbase (k ≈ 500 psi/in.).
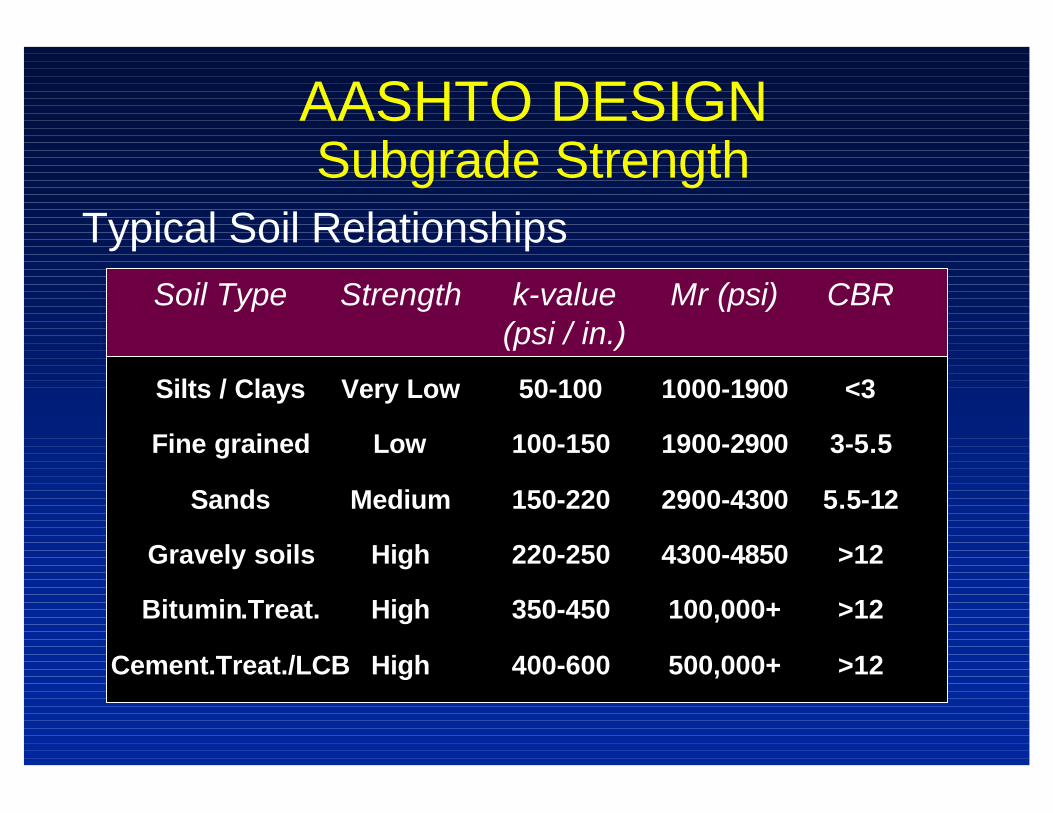
AASHTO DESIGNSubgrade Strength
Typical Soil Relationships
Soil Type Strength k-value(psi / in.)
Mr (psi) CBR
Silts / Clays Very Low 50-100 1000-1900 <3
Fine grained Low 100-150 1900-2900 3-5.5
Sands Medium 150-220 2900-4300 5.5-12
Gravely soils High 220-250 4300-4850 >12
Bitumin.Treat. High 350-450 100,000+ >12
Cement.Treat./LCB High 400-600 500,000+ >12

Subgrade and SubbasesPerformance
• Proper design and construction are absolutely necessary if the pavement is to perform.
• Must be uniform throughout pavement’s life.
• Poor subgrade/subbase preparation can not be overcome with thickness.
• Any concrete pavement, built of any thickness, will have problems on a poorly designed and constructed subgrade or subbase.

UNIFORMITY:
The Key To
GOOD PAVEMENT
PERFORMANCE

Design for Uniform Support
• Expansive soils
• Frost susceptible soils
• Pumping (loss of Support)
• Cut-fill transitions
• Poorly compacted excavations• Utility work• Culverts
Sources of Non-Uniform Support

PAVEMENT DESIGNSubbase Effects
The current Design does not model the contribution of bases accurately.
At the AASHO Road Test, it was found that the concrete pavements with granular bases could carry about 30% more traffic.
The current design procedures allows concrete pavements built with granular bases to carry about 5 - 8% more traffic.

Flexural Strength (S’c) Determination
Head of Testing Machine
L/3
Span Length = L
d=L/3
Span Length = L
L/2
Third-point Loading Center-point Loading
Concrete Properties

Concrete Properties
f’c = Compressive Strength (psi)S’c = Flexural Strength (psi)
S’c = 8-10 √ √ f’c
Head of Testing Machine
Cylinder Depth
Compressive Strength f’c

Concrete Properties
Use average, in-field strength for design
(not minimum specified)
If specify minimum flexural strength at 28-day of 550 psi & allow 10% of beams to fall below minimum:
STEP 1Estimate SDEV:9% for typical ready mix.SDEV = 550 * 0.09 = 50 psi
STEP 2S’c design = S’c minimum + z * SDEV
S’c design = 550 + 1.282 * 50S’c design = 614 psi

Drainage
Conditions for Pumping• Subgrade Soil that will go
into Suspension
• Free water between Slab and Subgrade
• Frequent Heavy wheels loads / Large Deflections

Drainage
• Major Conclusions• For Doweled PCC
Pavements, Drainage has little affect on Faulting
• Does reduce D-cracking
• Drainage significantly reduces fatigue cracking and rutting in AC Pavements
• Day lighted drainage works best with permeable bases
NCHRP 1-34: Subsurface Drainage for Pavements

Load Transfer
• A slabs ability to share its load with neighboring slabs
• Dowels
• Aggregate Interlock
• Concrete Shoulders• Tied Concrete, curb & gutter,
and extended lane have same effect.
L= x
U= 0
Poor Load Transfer
Load Transfer
Good Load Transfer
L= x/2 U = x/2
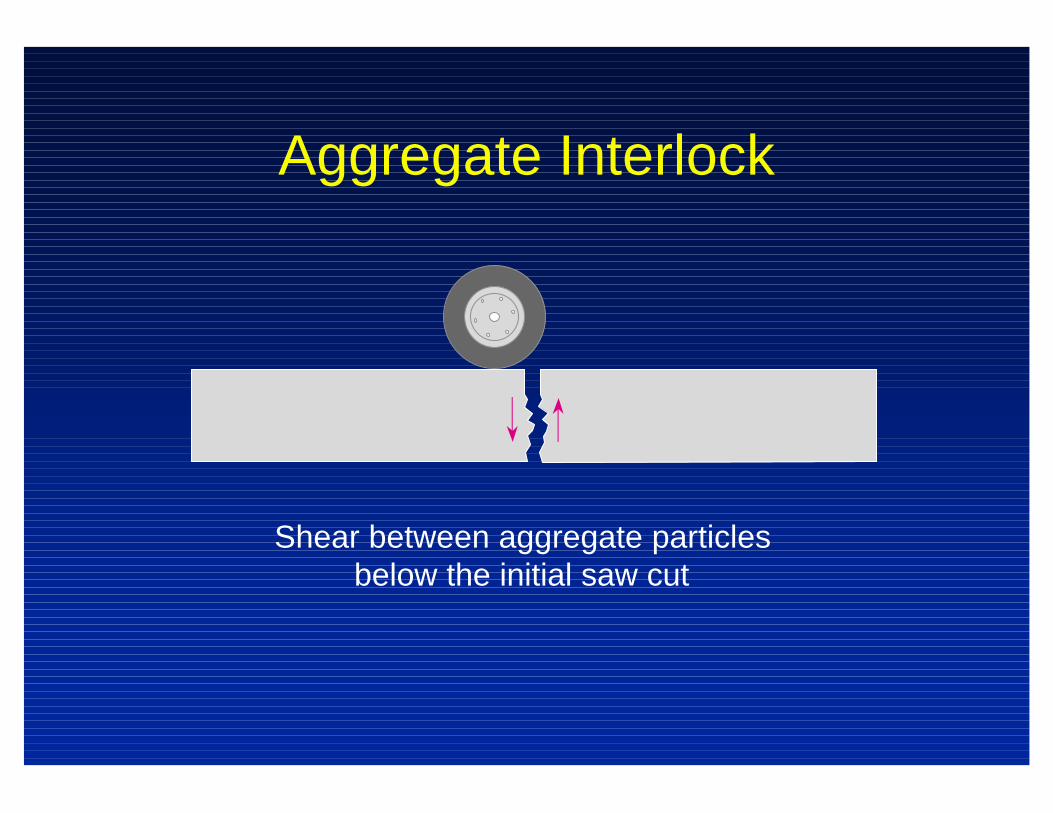
Aggregate Interlock
Shear between aggregate particlesbelow the initial saw cut

Aggregate Interlock

Dowel bars
• Lengths from 15-18 in.
• 6.0 in. min. embedment length
• Diameter• 1.25 - 1.50 in. for roads
• 1.5 - 2.0 in. for airports
• Epoxy or other coating used in harsher climates for corrosion protection

Deflections in Concrete Pavement
12 ft Lanes
Outside Pavement Edge (free edge)
Longitudinal Centerline(acts as tied concrete shoulder)
Undoweled transverse Joint Doweled transverse Joint
2 Di
~2.5 Di5 Di
~3.5 Di
Di Di
Load Transfer

AASHTO DESIGN
Effect of Dowels and Shoulders
0.0E+00
1.0E+07
2.0E+07
3.0E+07
4.0E+07
7 8 9 10 11 12Thickness
Allo
wab
le E
SA
Ls
Dowels & Shoulders
Dowels & No Shoulders
No Dowels & Shoulders
No Dowels & No Shoulders

Concrete Pavement Design
• Exclude dowels if:• Slab thickness < 7.0 in
• Include dowels if:• Slab thickness > 8.0 in.
TrucksControl
Thickness
To Dowel or Not to Dowel?

AASHTO DESIGNReliability
The statistical factors that influence pavement performance are:
• RELIABILITY, R • The statistical probability that a pavement will meet
its design life.
• STANDARD DEVIATION, so• The amount of statistical error present in the design
equations resulting from variability in materials, construction, traffic, etc.
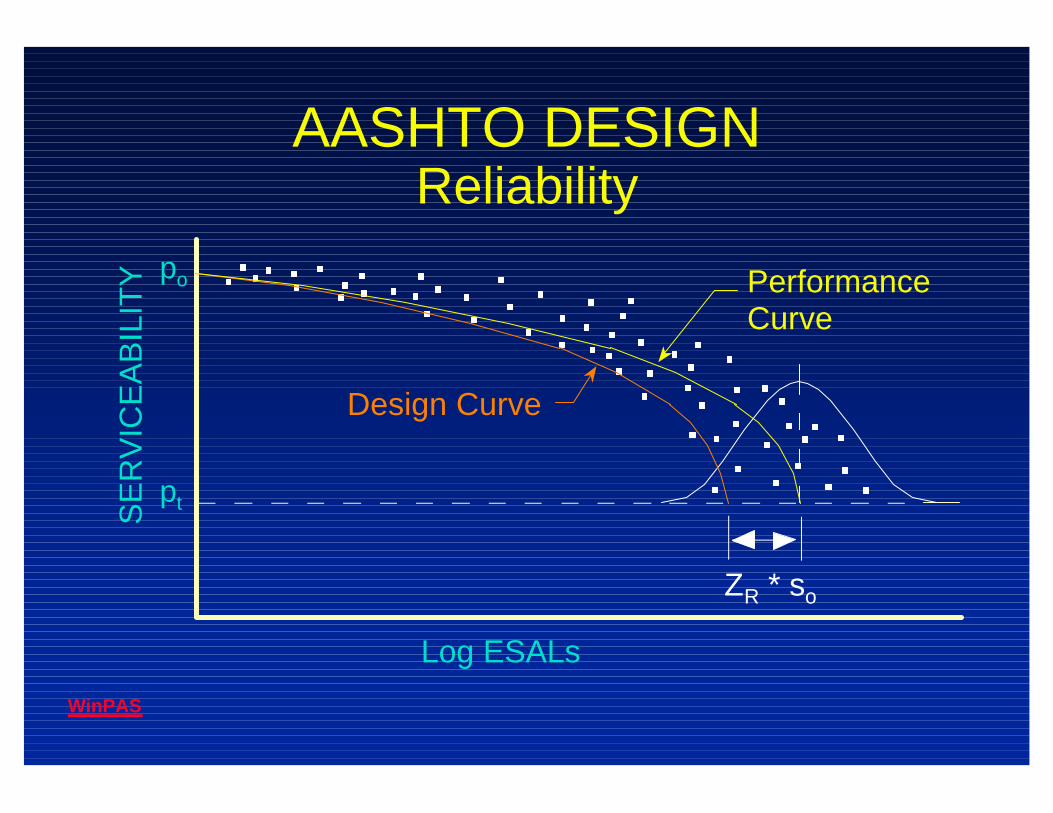
AASHTO DESIGNReliability
Log ESALs
SE
RV
ICE
AB
ILIT
Y
pt
po
Design Curve
PerformanceCurve
ZR * so
WinPAS
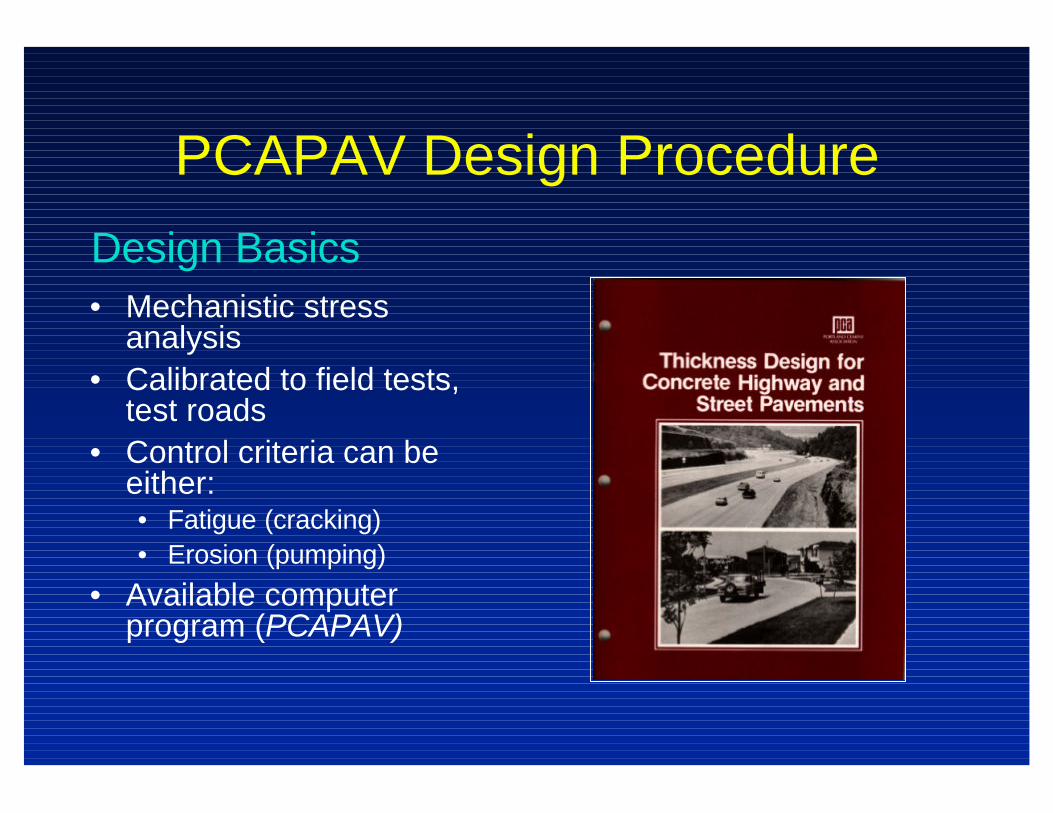
PCAPAV Design Procedure
• Mechanistic stress analysis
• Calibrated to field tests, test roads
• Control criteria can be either:• Fatigue (cracking)• Erosion (pumping)
• Available computer program (PCAPAV)
Design Basics

Fatigue
• Midslab loading away from transverse joint produces critical edge stresses
Erosion
• Corner loading produces critical pavement deflections
Transverse joint Transverse joint
Critical Loading Positions

Differences Between Design Procedures
• Traffic Classification:• AASHTO - uses 18-kip ESALs
• PCA - uses axle load distribution
• Reliability• AASHTO - Reliability
• PCA - Load Safety Factors
• Drainage

PCAPAV Design
• Fatigue • Keeps pavement stresses due to repeated loads within
safe limits
• Erosion• Limits the effects of pavement deflections at edges,
joints and corners.
Two design criteria:

PCAPAV Design Procedure
• Concrete Properties• Flexural strength (modulus of rupture)
• Subgrade Strength, or subgrade-subbase combination• modulus of subgrade reaction, k-value
• Weights, frequencies, and types of truck axle loads
• Load Transfer
• Load Safety Factor
• Design Period
Design Factors

PCAPAV Design Traffic
• Numbers & weights of heavy axle loads expected during the design life
• ADT (average daily traffic in both directions)
• ADTT (average daily truck traffic in both directions)• Includes only trucks with six tires or more
• Does not include panel and pickup trucks and other four-tire vehicles.
• Axle loads of trucks

PCAPAV DesignTraffic
• Axle loads Distribution• The number of single
and tandem axles over the design period
• Expressed as Axles per 1000 trucks
• Does not include panel and pickup trucks and other four-tire vehicles.
Axle loadKips
Single Axles28-3026-2824-2622-2420-2218-2016-1814-1612-1410-12
Tandem Axles48-5244-4840-4436-4032-3628-3224-2820-2416-2012-16
Axles/1000Trucks
0.581.352.775.929.8321.6728.2438.8353.94168.85
1.963.9411.4834.2781.4285.54152.2390.52112.81124.69
Axles indesign period
6,31014,69030,14064,410106,900235,800307,200422,500586,900
1,837,000
21,32042,870124,900372,900885,800930,700
1,656,000984,900
1,227,0001,356,000
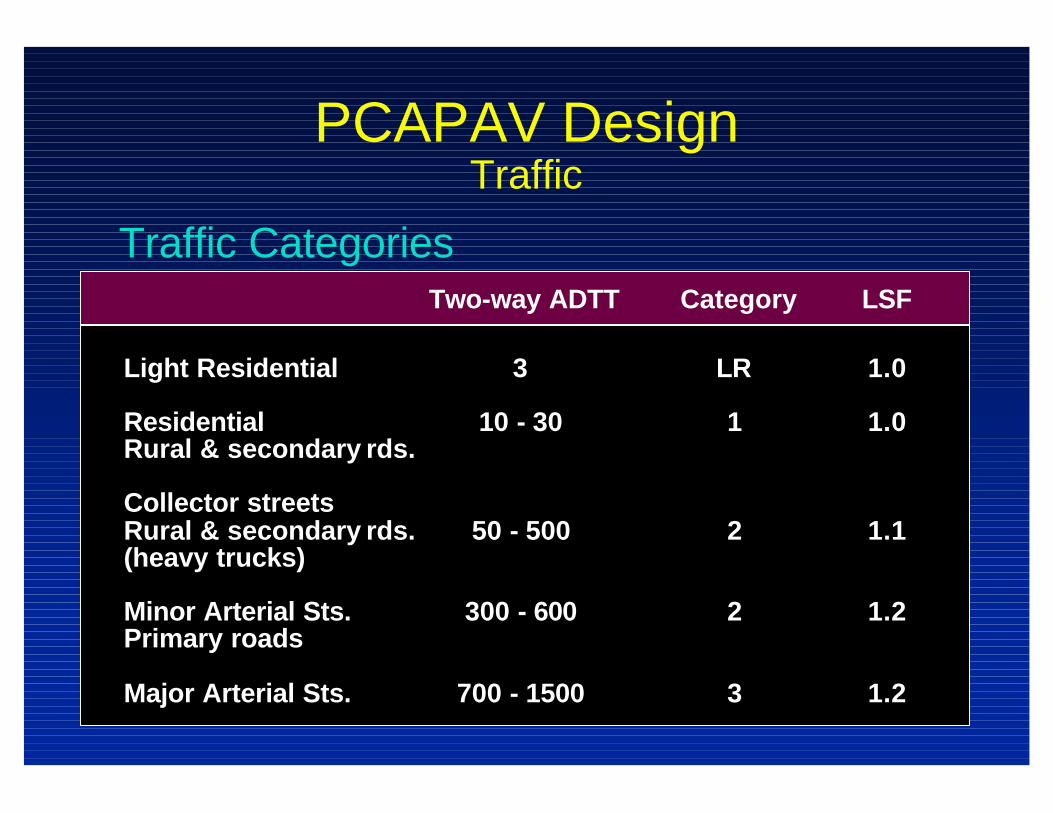
PCAPAV DesignTraffic
Light Residential
ResidentialRural & secondary rds.
Collector streetsRural & secondary rds.(heavy trucks)
Minor Arterial Sts.Primary roads
Major Arterial Sts.
3
10 - 30
50 - 500
300 - 600
700 - 1500
LR
1
2
2
3
1.0
1.0
1.1
1.2
1.2
Two-way ADTT Category LSF
Traffic Categories

PCAPAV DesignLoad Safety Factors
• Interstate, interprovincial, multilane projects• LSF = 1.2.
• Highways and arterial streets• LSF = 1.1
• Roads, residential streets, and other streets that carry small volumes of truck traffic
• LSF = 1.0
Recommended values
PCAPAV

PCAPAV DesignSimplified Procedure
• Designs presented in Tabular Form• Traffic
• Type of road• Axle-load category (for the road type)• Avg. daily truck traffic• Probable maximum truck weights
• Subgrade and Subbase• Dowels & slab edge support• Concrete strength

PCAPAV DesignSimplified Procedure
Foundation Support, k, MPa/m
Flexural Strength, MPa
Light Resident.
ADTT = 50100500
ADTT = 300600
ADTT = 102050
3.8 4.1 4.5 4.1 4.53.8
165165175
150150165
190200215
190190215
215225
200215
140150150
175175190
200200
150150150
175175190
200200
140140150
140140140
165175175
165165175
190190
175190
No Dowels - No edge support
40 80
ResidentialRural & Sec. Rd.
CollectorRural & sec. Rd.
Minor Arterial
2-way ADTT = 3 150 mm 140 140 140 125 125

PCAPAV DesignSimplified Procedure
Foundation Support, k, MPa/m
Flexural Strength, MPa
Light Resident.
ADTT = 50100500
ADTT = 300600
ADTT = 102050
3.8 4.1 4.5 4.1 4.53.8
140140150
125140140
165175175
150165175
190190
175190
125125125
160160160
165175
125125140
150150165
175175
125125125
125125125
140150150
140140150
165165
150165
No Dowels - With Edge Support
40 80
ResidentialRural & Sec. Rd.
CollectorRural & sec. Rd.
Minor Arterial
2-way ADTT = 3 125 mm 125 125 125 125 125

Typical Concrete Pavement Thickness
• Depends on traffic load, subgrade, and climate. • City streets, secondary roads, and small
airports• 100 to 175 mm (4 to 7 in.)
• Primary roads and interstate highways • 175 to 280 mm (7 to 12 in.)
• Large airports • 200 to 460 mm (8 to 18 in.)

1986-93 RIGID PAVEMENT DESIGN
Factors Affecting Rigid PavementsThicknessServiceability (po, pt) Traffic (ESALs, E-18s)Load Transfer (J)Concrete Properties (S’c, Ec)Subgrade Strength (k, LS) Drainage (Cd) Reliability (R, So)

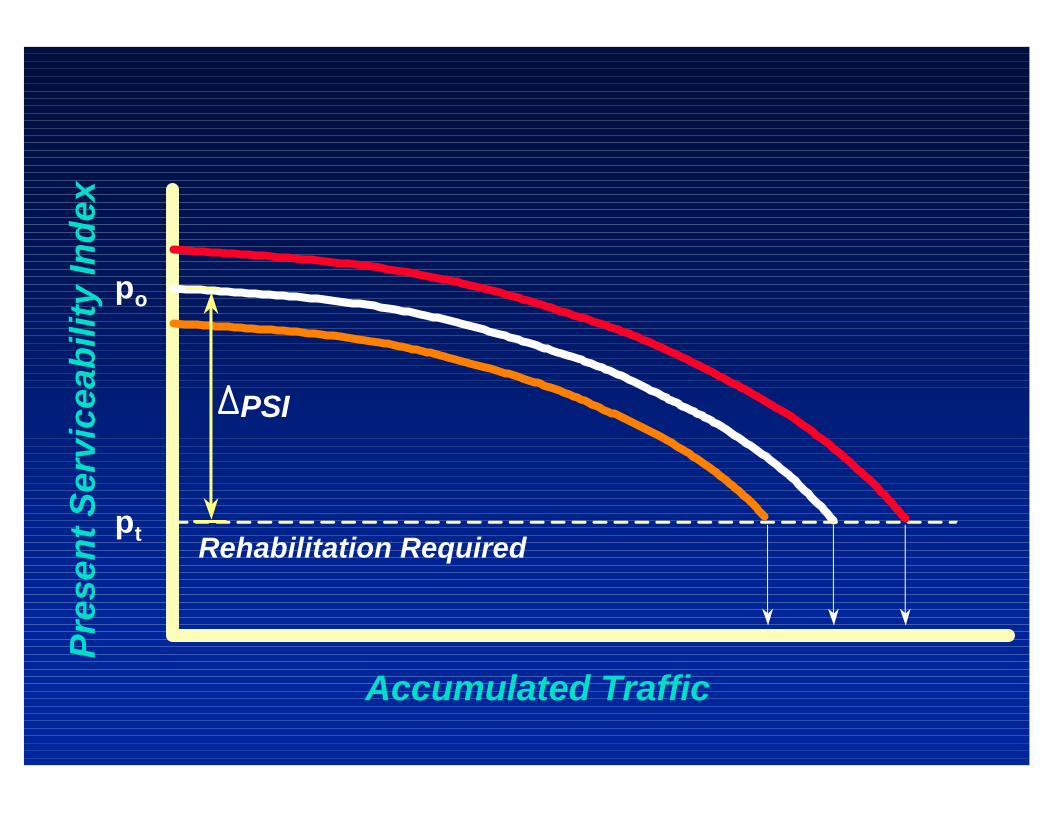
AASHTO DESIGN Serviceability
Serviceability -the pavement’s ability to serve the type of traffic (automobiles and trucks) that use the facility
Very Good
Good
Fair
Poor
Very Poor
5.0
4.0
3.0
2.0
1.0
0.0
Present Serviceability Index (PSI)
Pre
sen
t S
ervi
ceab
ility
Ind
ex
Accumulated Traffic
po
Rehabilitation Requiredpt
PSI

AASHTO DESIGNConcrete Properties
There are two concrete properties that influence pavement performance
• Flexural Strength (Modulus of Rupture), S’c– Average 28-day strength
– 3rd-Point Loading
• Modulus of Elasticity, Ec

AASHTO DESIGNConcrete Properties
Flexural Strength (S’c) Determination
Head of Testing Machine
L/3
Span Length = L
d=L/3
Span Length = L
L/2
Third-point Loading Center-point Loading

AASHTO DESIGNConcrete Properties
Use average, in-field strength for design
(not minimum specified)
If specify minimum flexural strength at 28-day of 550 psi & allow 10% of beams to fall below minimum:
STEP 1Estimate SDEV:9% for typical ready mix.SDEV = 550 * 0.09 = 50 psi
STEP 2S’c design = S’c minimum + z * SDEV
S’c design = 550 + 1.282 * 50S’c design = 614 psi

AASHTO DESIGNConcrete Properties
Modulus of ElasticityEc = 6750 S’cEc = 57,000 (f’c)0.5
Flexural Strength Modulus of Elasticity600 psi 3,900,000 psi650 psi 4,200,000 psi700 psi 4,600,000 psi

Avenues for water entry
WATER-TABLE
Water-Table Rise
CapillarySuction fromWater-Table
Natural Drainagefrom High-Ground
From Edge VaporMovement
Surface Entry
2 4
1
3
1
5
PAVEMENT
BASE
AASHTO DESIGNDrainage , Cd

AASHTO DESIGNReliability
The statistical factors that influence pavement performance are:
• RELIABILITY, R - The statistical probability that a pavement will meet its design life.
• STANDARD DEVIATION, so -The amount of statistical error present in the design equations resulting from variability in materials, construction, traffic, etc.

AASHTO DESIGNReliability
Log ESALs
SE
RV
ICE
AB
ILIT
Y
pt
po
Design Curve
PerformanceCurve
ZR * so
WinPAS

PCAPAV Design Procedure
• Mechanistic stress analysis
• Calibrated to field tests, test roads
• Control criteria can be either:
• Fatigue (cracking)• Erosion (pumping)
• Available computer program (PCAPAV)
Design Basics
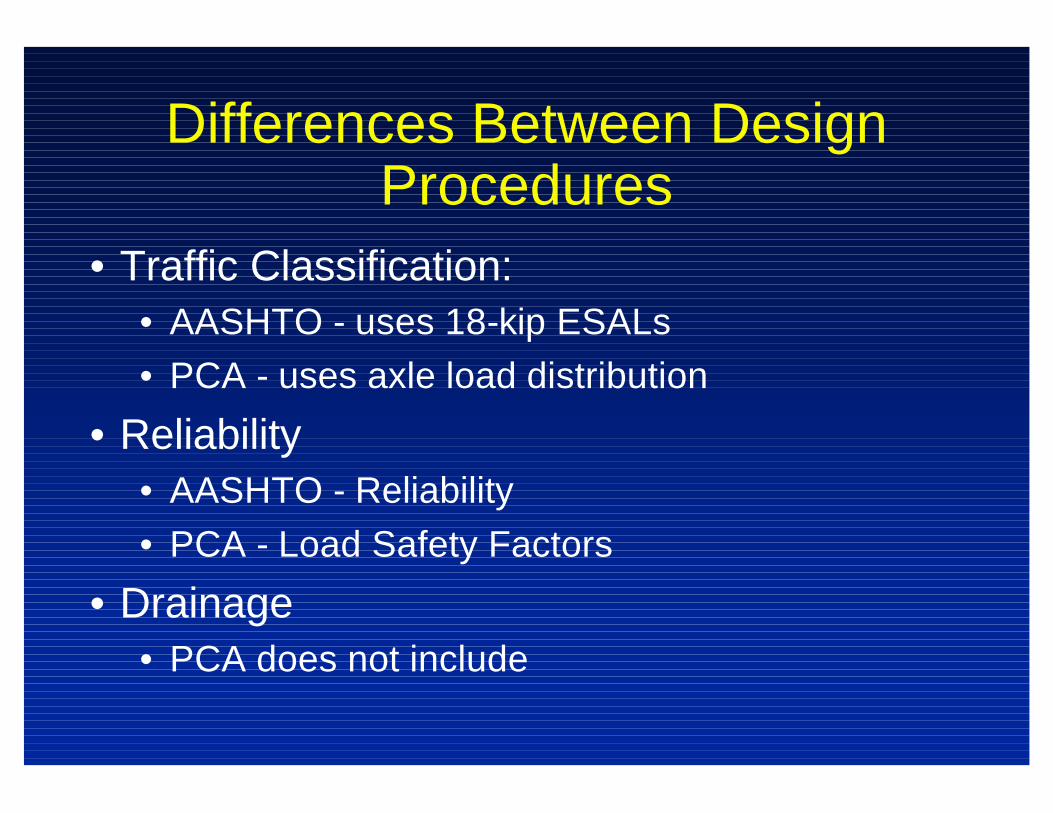
Differences Between Design Procedures
• Traffic Classification:• AASHTO - uses 18-kip ESALs
• PCA - uses axle load distribution
• Reliability• AASHTO - Reliability
• PCA - Load Safety Factors
• Drainage• PCA does not include

PCAPAV Design
• Fatigue • Keeps pavement stresses due to repeated loads within
safe limits
• Erosion• Limits the effects of pavement deflections at edges,
joints and corners.
Two design criteria:

Fatigue Analysis
• Performed for edge stresses (critical stresses)
• Based on stress ratio
• Fatigue not consumed by repetitions of one load is available for repetitions of other loads.
Equivalent Flexural Stress 28-Day Modulus of RuptureSR =
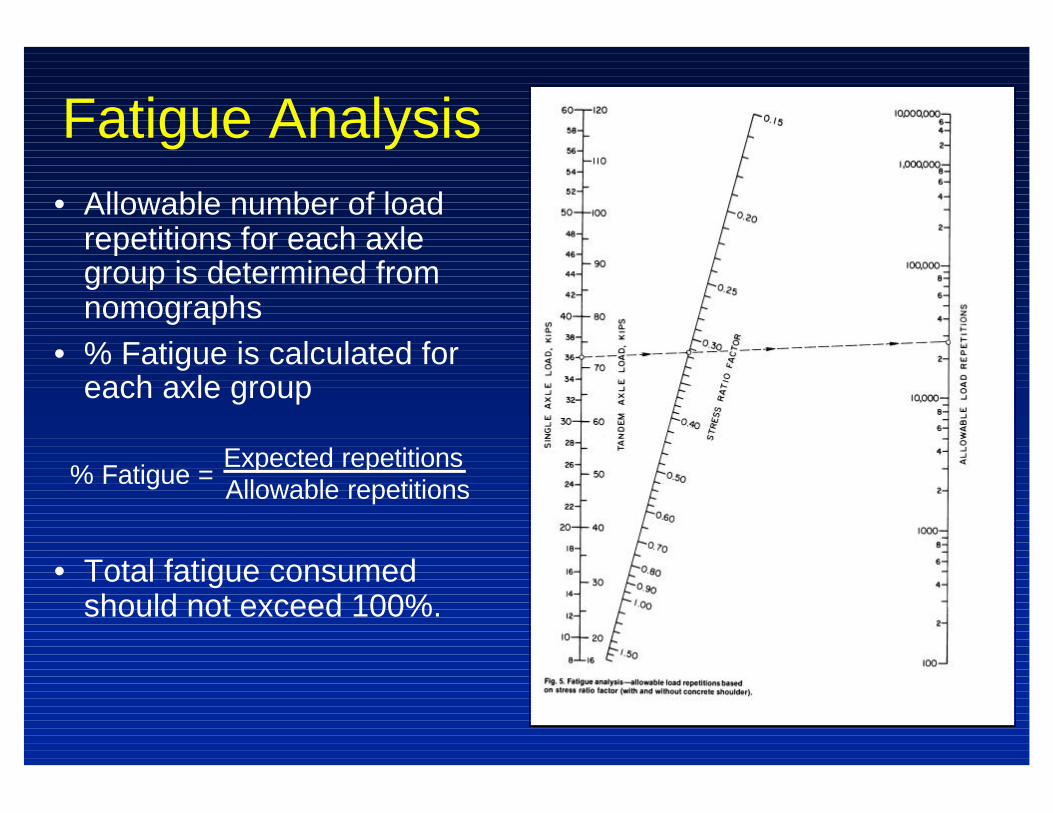
Fatigue Analysis• Allowable number of load
repetitions for each axle group is determined fromnomographs
• % Fatigue is calculated for each axle group
• Total fatigue consumed should not exceed 100%.
Expected repetitionsAllowable repetitions% Fatigue =

Erosion Analysis
• Repetitions of heavy axle loads cause:• pumping; erosion of subgrade, subbase and shoulder
materials; voids under and adjacent to the slab; and faulting of pavement joints.
• Erosion is a function of Power, or rate of work.Power = corner deflection (w) * pressure (p) * area
duration of deflection.
• A thin pavement with its shorter deflection basin receives a faster load punch than a thicker slab.

Erosion Analysis
• Performed for corner deflections (critical deflections)
• Erosion factor is determined from tables
• Allowable number of load repetitions for each axle group is determined from nomographs
• Erosion Damage is calculated for each axle group% Erosion Damage = Expected repetitions
Allowable repetitions
• Total erosion damage from all axle groups should be less than 100%

PCAPAV Design
• Fatigue usually controls design of light-traffic pavements
• Single-axles usually cause more fatigue damage
• Erosion usually controls design of undoweledmedium- and heavy-traffic pavements
• Tandem-axles usually cause more erosion damage
Design controlled by:

PCAPAV Design Procedure
• Selection of an adequate thickness is dependent upon the choice of other design features:• Jointing system
• Shoulder type
• Subbase type

PCAPAV Design Procedure Concrete Properties
• Flexural Strength (Modulus of Rupture),
• Avg. 28-day strength in 3rd-point loading
• Other Factors• Fatigue Properties
• Concrete Strength Gain with Age L/3
Span Length = L
d=L/3
Third-point Loading

PCAPAV DesignConcrete Properties
Comparison of f’c, MR, and Required Thickness
CompressiveStrength
3000 psi4000 psi5000 psi
Third PointFlexural Strength
450 - 550 psi510 - 630 psi570 - 710 psi
Effect on Slab Thickness
7.0 in6.5 in.6.0 in.

PCAPAV DesignSubgrade Properties
Modulus of Subgrade Reaction, k-value
Plate load on subgrade Plate deflection on subgradek =
5.0 psi 0.5 ink = = 100 psi / in.
Reaction
Stacked Plates Pressure Gauge
Subgrade
Plate-Load Test

PCAPAV DesignSubgrade Properties
• Plate-load test is rarely performed• time consuming & expensive
• Estimate k-value by correlation to other tests • e.g. California Bearing Ratio (CBR) or R-value tests.
• Lean concrete subbases increases k-value.
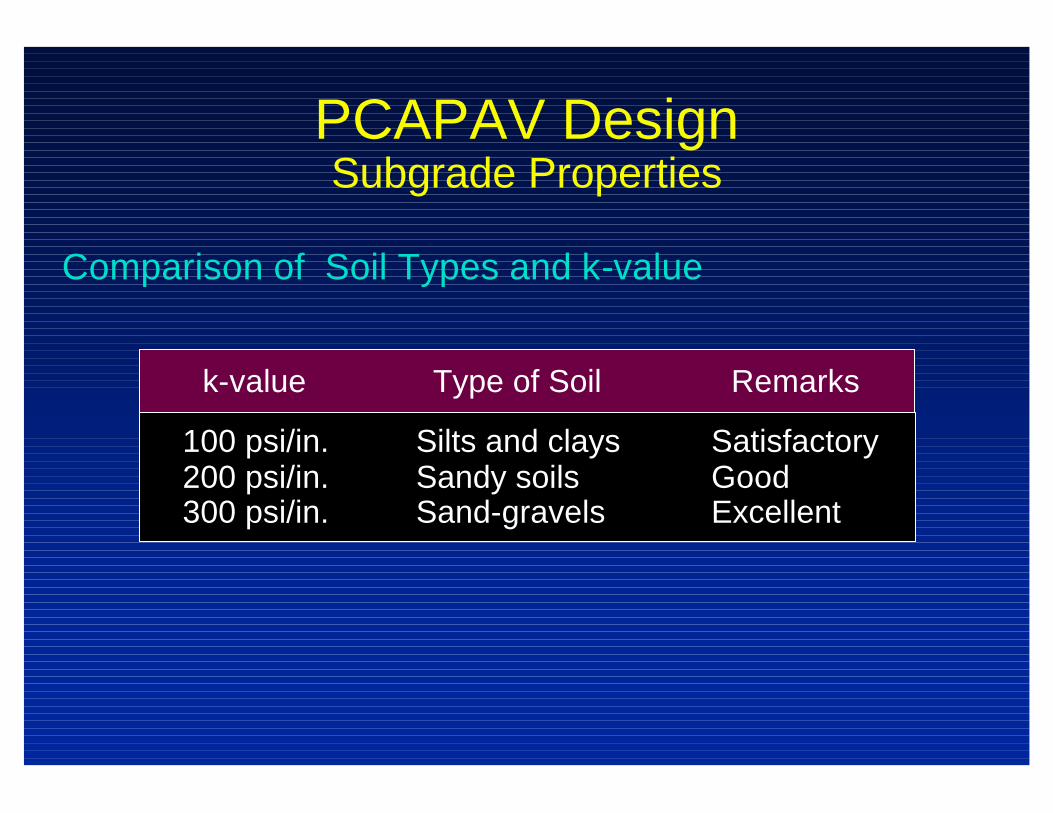
PCAPAV DesignSubgrade Properties
Comparison of Soil Types and k-value
k-value
100 psi/in.200 psi/in.300 psi/in.
Type of Soil
Silts and claysSandy soilsSand-gravels
Remarks
SatisfactoryGoodExcellent

Effect of Untreated Subbase on k-value
Subbase k-value
4 in.
85165235320
Subgradek-value (psi/in)
75150225300
6 in.
96180242330
9 in.
117210280367
12 in.
140243330430
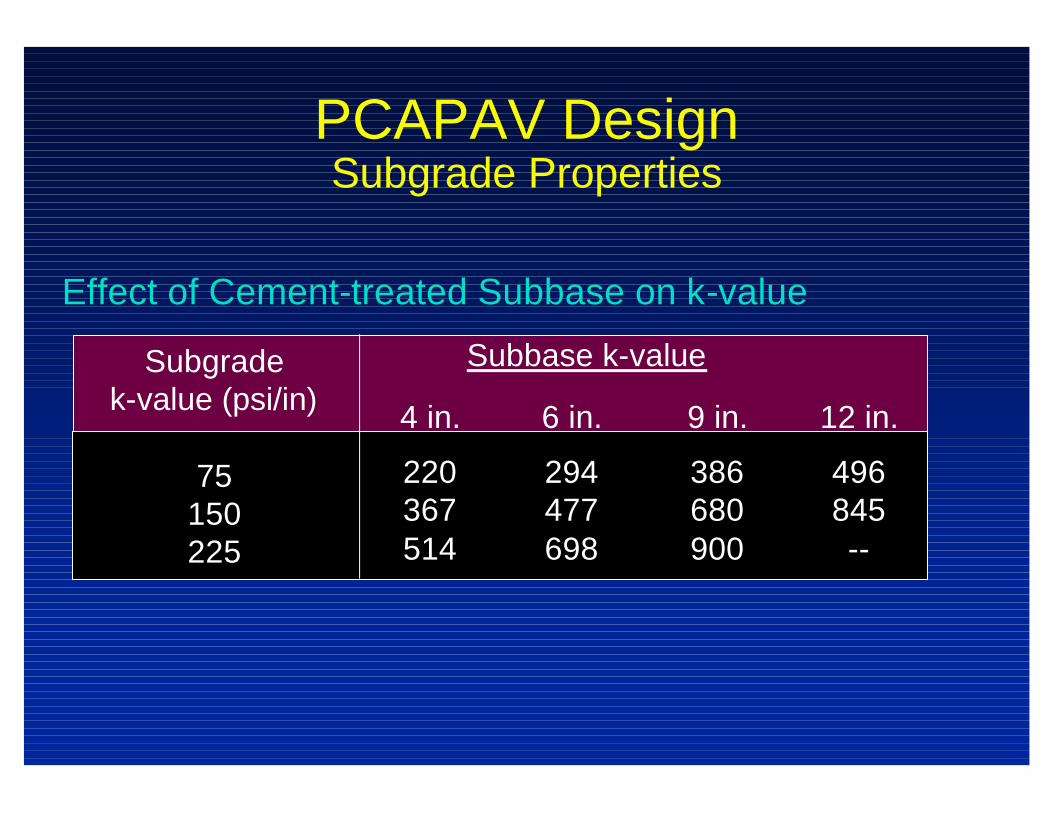
Effect of Cement-treated Subbase on k-value
Subbase k-value
4 in.
220367514
Subgrade k-value (psi/in)
75150225
6 in.
294477698
9 in.
386680900
12 in.
496845--

Effect of Untreated Subbase on k-value
Subbase k-value
4 in.
85165235320
Subgradek-value (psi/in)
75150225300
6 in.
96180242330
9 in.
117210280367
12 in.
140243330430
PCAPAV DesignSubgrade Properties
PCAPAV DesignSubgrade Properties
Effect of Cement-treated Subbase on k-value
Subbase k-value
4 in.
220367514
Subgrade k-value (psi/in)
75150225
6 in.
294477698
9 in.
386680900
12 in.
496845--
PCAPAV DesignDesign Period
• 20 to 35 years is commonly used • Shorter or longer design period may be
economically justified in some cases • A special haul road to be used for only a few years.

PCAPAV Design Traffic
• Numbers & weights of heavy axle loads expected during the design life
• ADT (average daily traffic in both directions)
• ADTT (average daily truck traffic in both directions)• Includes only trucks with six tires or more
• Does not include panel and pickup trucks and other four-tire vehicles.
• Axle loads of trucks

PCAPAV DesignTraffic
• Axle loads Distribution• The number of single
and tandem axles over the design period
• Expressed as Axles per 1000 trucks
• Does not include panel and pickup trucks and other four-tire vehicles.
Axle loadkN
Axles/1000Trucks
Axles indesign period
Single Axles125-133115-125107-11597.8-10788.8-97.880.0-88.871.1-80.062.2-71.153.3-72.244.4-53.3
0.581.352.775.929.83
21.6728.2438.8353.94
168.85
6,31014,69030,14064,410
106,900235,800307,200422,500586,900
1,837,000Tandem Axles213-231195-213178-195160-178142-160125-142107-12588.8-10771.1-88.853.3-71.1
1.963.94
11.4834.2781.4285.54
152.2390.52
112.81124.69
21,32042,870
124,900372,900885,800930,700
1,656,000984,900
1,227,0001,356,000

PCAPAV DesignTraffic
Light Residential
ResidentialRural & secondary rds.
Collector streetsRural & secondary rds.(heavy trucks)
Minor Arterial Sts.Primary roads
Major Arterial Sts.
3
10 - 30
50 - 500
300 - 600
700 - 1500
LR
1
2
2
3
1.0
1.0
1.1
1.2
1.2
Two-way ADTT Category LSF
Traffic Categories

PCAPAV DesignLoad Safety Factors
• Interstate, interprovincial, multilane projects• LSF = 1.2.
• Highways and arterial streets• LSF = 1.1
• Roads, residential streets, and other streets that carry small volumes of truck traffic
• LSF = 1.0
Recommended values

PCAPAV Design Other Loads
• Warping - moisture variations.
• Creates compressive restraint stresses in the slab bottom.
• Curling - temperature variations.• During the day, the top surface is warmer than the bottom
and stresses develop at the slab bottom.
• During the night, the top is colder and stresses develop at the slab surface.
• Assumed to cancel each other out.
Warping and Curling of Concrete

PCAPAV DesignDesign Procedures
• Rigorous• Detailed axle-load-distribution data is available
• Simplified• Axle-Load Data Not Available
• Designer does not directly use the axle-load data
• Tabular form

PCAPAV DesignRigorous Procedure
• Requires the following design factors:• Type of joint and shoulder
• Concrete flexural strength (MR) at 28 days
• k-value of subgrade or subgrade-subbase combination
• Load safety factor (LSF)
• Axle-load distribution
• Expected number of axle-load repetitions
• Use PCAPAV Computer ProgramPCAPAV

Design Tip
Don’t Drinkand Design