Design, Development and Evaluation of Thermal Properties ...
13
nanomaterials Article Design, Development and Evaluation of Thermal Properties of Polysulphone–CNT/GNP Nanocomposites Hafiz Muzammil Irshad 1 , Abbas Saeed Hakeem 2, * , Kabeer Raza 3 , Turki Nabieh Baroud 4 , Muhammad Ali Ehsan 2 , Sameer Ali 5 and Muhammad Suleman Tahir 5,6 Citation: Irshad, H.M.; Hakeem, A.S.; Raza, K.; Baroud, T.N.; Ehsan, M.A.; Ali, S.; Tahir, M.S. Design, Development and Evaluation of Thermal Properties of Polysulphone–CNT/GNP Nanocomposites. Nanomaterials 2021, 11, 2080. https://doi.org/10.3390/ nano11082080 Academic Editor: Alberto Fina Received: 28 July 2021 Accepted: 13 August 2021 Published: 16 August 2021 Publisher’s Note: MDPI stays neutral with regard to jurisdictional claims in published maps and institutional affil- iations. Copyright: © 2021 by the authors. Licensee MDPI, Basel, Switzerland. This article is an open access article distributed under the terms and conditions of the Creative Commons Attribution (CC BY) license (https:// creativecommons.org/licenses/by/ 4.0/). 1 Faculty of Materials and Chemical Engineering, GIK Institute of Engineering Sciences and Technology, Topi 23460, Khyber Pakhtunkhwa, Pakistan; [email protected] 2 Interdisciplinary Research Center for Hydrogen & Energy Storage (IRC-HES), King Fahd University of Petroleum & Minerals, Dhahran 31261, Saudi Arabia; [email protected] 3 Department of Mechanical Engineering, Khwaja Fareed University of Engineering & Information Technology (KFUEIT), Rahim Yar Khan 64200, Punjab, Pakistan; [email protected] 4 Mechanical Engineering Department, King Fahd University of Petroleum and Minerals (KFUPM), Dhahran 31261, Saudi Arabia; [email protected] 5 Department of Chemical Engineering, University of Gujrat, Gujrat 50700, Punjab, Pakistan; [email protected] (S.A.); [email protected] (M.S.T.) 6 Department of Chemical Engineering, Khwaja Fareed University of Engineering & Information Technology (KFUEIT), Rahim Yar Khan 64200, Punjab, Pakistan * Correspondence: [email protected] Abstract: Polysulphone (PSU) composites with carbon nanotubes (PSU-CNT) and graphene nanoplatelets (PSU-GNP) were developed through the solution casting process, using various weight load percentages of 1, 3, 5, and 10 wt% of CNT and GNP nanofillers. The microstructural and thermal properties of the PSU-based composites were compared. The microstructural characterisation of both composites (PSU- CNTs and PSU-GNPs) showed a strong matrix–filler interfacial interaction and uniform dispersion of CNTs and GNPs in the PSU matrix. The analysis demonstrated that both the thermal conductivity and effusivity improved with the increase in the weight percentage (wt%) of CNTs and GNPs because of the percolation effect. The polysulphone-based composite containing 10 wt% CNTs showed a remarkably high thermal conductivity value of 1.13 (W/m·K), which is 163% times higher than pure PSU. While the glass transition temperature (Tg) was shifted to a higher temperature, the thermal expansion was reduced in all the PSU-CNT and PSU-GNP composites. Interestingly, the CNTs allowed homogeneous distribution and a reasonably good interfacial network of interaction with the PSU matrix, leading to better microstructural characteristics and thermal properties than those of the PSU-GNP composites. The findings highlight the importance of controlling the nature, distribution, and content of fillers within the polymeric matrix. Keywords: polysulphone; carbon nanotube; graphene platelet; thermal properties; nanocomposite 1. Introduction Polymer materials have several advantages over metallic materials, such as high corrosion resistance, light weight, low cost, ease of processing, and chemical stability. However, there are obstacles in overcoming the high thermal expansion, low thermal conductivity, poor mechanical strength, and lower service temperature range [1]. The mismatch in thermal expansion between metallic and polymeric components is the primary cause of failure in polymer–metal joints and adhered surfaces [2]. Neat polymers usually exhibit thermal conductivity in the range of 0.1 to 0.4 W/m·K[3]. In contrast, most metals possess high thermal conductivity (100–400 W/m·K) [4]. Nanocomposites are multiphase solid materials and have one phase that is less than 100 nm in size. Nanosized particles with a high aspect ratio allow strong particle–particle interactions and lead to efficient heat energy flow. However, the ultrahigh interfacial area of Nanomaterials 2021, 11, 2080. https://doi.org/10.3390/nano11082080 https://www.mdpi.com/journal/nanomaterials
Transcript of Design, Development and Evaluation of Thermal Properties ...
nanomaterials
Article
Design, Development and Evaluation of Thermal Properties ofPolysulphone–CNT/GNP Nanocomposites
Hafiz Muzammil Irshad 1, Abbas Saeed Hakeem 2,* , Kabeer Raza 3, Turki Nabieh Baroud 4 ,Muhammad Ali Ehsan 2, Sameer Ali 5 and Muhammad Suleman Tahir 5,6
�����������������
Citation: Irshad, H.M.; Hakeem,
A.S.; Raza, K.; Baroud, T.N.; Ehsan,
M.A.; Ali, S.; Tahir, M.S. Design,
Development and Evaluation of
Thermal Properties of
Polysulphone–CNT/GNP
Nanocomposites. Nanomaterials 2021,
11, 2080. https://doi.org/10.3390/
nano11082080
Academic Editor: Alberto Fina
Received: 28 July 2021
Accepted: 13 August 2021
Published: 16 August 2021
Publisher’s Note: MDPI stays neutral
with regard to jurisdictional claims in
published maps and institutional affil-
iations.
Copyright: © 2021 by the authors.
Licensee MDPI, Basel, Switzerland.
This article is an open access article
distributed under the terms and
conditions of the Creative Commons
Attribution (CC BY) license (https://
creativecommons.org/licenses/by/
4.0/).
1 Faculty of Materials and Chemical Engineering, GIK Institute of Engineering Sciences and Technology,Topi 23460, Khyber Pakhtunkhwa, Pakistan; [email protected]
2 Interdisciplinary Research Center for Hydrogen & Energy Storage (IRC-HES), King Fahd University ofPetroleum & Minerals, Dhahran 31261, Saudi Arabia; [email protected]
3 Department of Mechanical Engineering, Khwaja Fareed University of Engineering & InformationTechnology (KFUEIT), Rahim Yar Khan 64200, Punjab, Pakistan; [email protected]
4 Mechanical Engineering Department, King Fahd University of Petroleum and Minerals (KFUPM),Dhahran 31261, Saudi Arabia; [email protected]
5 Department of Chemical Engineering, University of Gujrat, Gujrat 50700, Punjab, Pakistan;[email protected] (S.A.); [email protected] (M.S.T.)
6 Department of Chemical Engineering, Khwaja Fareed University of Engineering & InformationTechnology (KFUEIT), Rahim Yar Khan 64200, Punjab, Pakistan
* Correspondence: [email protected]
Abstract: Polysulphone (PSU) composites with carbon nanotubes (PSU-CNT) and graphene nanoplatelets(PSU-GNP) were developed through the solution casting process, using various weight load percentagesof 1, 3, 5, and 10 wt% of CNT and GNP nanofillers. The microstructural and thermal properties of thePSU-based composites were compared. The microstructural characterisation of both composites (PSU-CNTs and PSU-GNPs) showed a strong matrix–filler interfacial interaction and uniform dispersion ofCNTs and GNPs in the PSU matrix. The analysis demonstrated that both the thermal conductivityand effusivity improved with the increase in the weight percentage (wt%) of CNTs and GNPs becauseof the percolation effect. The polysulphone-based composite containing 10 wt% CNTs showed aremarkably high thermal conductivity value of 1.13 (W/m·K), which is 163% times higher than purePSU. While the glass transition temperature (Tg) was shifted to a higher temperature, the thermalexpansion was reduced in all the PSU-CNT and PSU-GNP composites. Interestingly, the CNTsallowed homogeneous distribution and a reasonably good interfacial network of interaction with thePSU matrix, leading to better microstructural characteristics and thermal properties than those of thePSU-GNP composites. The findings highlight the importance of controlling the nature, distribution,and content of fillers within the polymeric matrix.
Keywords: polysulphone; carbon nanotube; graphene platelet; thermal properties; nanocomposite
1. Introduction
Polymer materials have several advantages over metallic materials, such as highcorrosion resistance, light weight, low cost, ease of processing, and chemical stability.However, there are obstacles in overcoming the high thermal expansion, low thermalconductivity, poor mechanical strength, and lower service temperature range [1]. Themismatch in thermal expansion between metallic and polymeric components is the primarycause of failure in polymer–metal joints and adhered surfaces [2]. Neat polymers usuallyexhibit thermal conductivity in the range of 0.1 to 0.4 W/m·K [3]. In contrast, most metalspossess high thermal conductivity (100–400 W/m·K) [4].
Nanocomposites are multiphase solid materials and have one phase that is less than100 nm in size. Nanosized particles with a high aspect ratio allow strong particle–particleinteractions and lead to efficient heat energy flow. However, the ultrahigh interfacial area of
Nanomaterials 2021, 11, 2080. https://doi.org/10.3390/nano11082080 https://www.mdpi.com/journal/nanomaterials
Nanomaterials 2021, 11, 2080 2 of 13
the nanosized fillers permits a strong matrix-to-filler interaction at the level of the interfacewith the polymer matrix for the efficient transmission of thermal energy. This furtherstrengthens the mechanical and thermal properties of the material [5]. Polysulphone isan amorphous polymer with a maximum continuous use temperature of 190 ◦C, and itcan maintain its mechanical properties for an extended period of time [6]. It is utilised inmembranes because of its good thermal stability and strength [7]. Polysulphone (PSU) istypically used in food processing equipment, bioreactor membranes, fuel cell membranes,and aviation and electronic components [8]. The polysulphone–hydroxyapatite (PSU+HAp)composite is biostable and can be utilised for orthopaedic applications [9]. Polymernanocomposites filled with thermally conductive fillers such as aluminium nitride [10],CNTs, and graphene can be used to encapsulate electronic devices (photovoltaic systems)to protect them from adverse environments (i.e., high temperatures or corrosive), improvetheir performance, and extend their reliability [11–16]. Considerable research is beingconducted to develop polymer nanocomposites with improved thermal properties andlifetime behaviour in the heating, ventilation, air conditioning, and refrigeration (HVACand R) environment; computer chips; electronic packaging; LED systems, and many otherconventional and advanced applications [17–19] Thermal conductivity is a bulk propertyof polymer nanocomposites. The principal factors that affect thermal conductivity arethe filler concentration, the thermal conductivity of the filler, particle size, and interfacialthermal resistance [20]. Superior thermal properties can be obtained using suitable metallic,nitride, and oxide fillers such as aluminium nitride, cubic boron nitride, hexagonal boronnitride [21], strontium ferrite, magnetite, barite, and copper [22]. TiO2 addition (1–2 wt%)in PSU provides high thermal stability, and 40 vol% hexagonal boron nitride provides idealthermal stability with thermal conductivity of 1.1 W/m·K [23]. The thermal conductivityincreases from 0.22 to 0.93 W/m·K upon the addition of 44 vol% of magnetite (Fe3O4) [24].Zhao et al. produced hybrid composites of graphene foam with carbon fibre (CF)-reinforcedpolydimethylsiloxane (PDMS) via solution mixing and high-speed shear mixing techniques.They showed that PDMS filled with 10 wt% CF infiltrated into graphene foam could providea bulk thermal conductivity of 0.55 W/m·K. The effect of carbon fibre on the thermalproperties of the graphene polymer composite showed that with 10 wt% CF, the maximumthermal conductivity reached was 0.55 W/m·K [25]. Yang et al. developed epoxy-basedhybrid nanocomposites by introducing CNTs and GNPs through a solution casting route.The mixing of high- and low-aspect-ratio fillers resulted in a synergistic enhancement of thethermal and mechanical properties [26]. Similarly, a synergistic improvement in thermalconductivity of 0.86 W/m·K with the addition of 10 wt% CNT with Al2O3 in the PDMSmatrix has been reported [27].
A high coefficient of thermal expansion (CTE) is a limiting factor in the utilisation ofpolymers. The most common thermoplastics used in polymer composite industries havethermal expansion in the range of 25–200 ppm/K [28], which can be adjusted to lowerexpansion values by incorporating fillers with a negative (or lower) coefficient of thermalexpansion. It is possible to attain a material with approximately zero thermal expansioncombined with positive and negative expanding materials for various applications [29].Graphene and CNTs at room temperature (25 ◦C) have a negative coefficient of thermalexpansion, so they can be added to polymer matrices to lower the thermal expansionfor polymer composites effectively; however, the coefficient of thermal expansion is notaffected by the addition of less than 0.5 wt% of CNTs and GNP [30]. Conductive polymercomposites composed of carbon nanotubes and graphene have been examined for use instrain-sensing devices [31].
At room temperature (25 ◦C), the observed thermal conductivity of MWNTs is morethan 3000 W/m·K and that of single-layer graphene is approximately 5000 W/m·K [32],owing to its very high phonon mean free path [33]. Carbon nanotube (CNT) addition in apolymer matrix leads to improved percolation at lower loading and such composites havea good estimation of the thermal properties using different models [34]. However, a higherfiller loading on the nanoscale is likely to agglomerate and reduce the aspect ratio and

Nanomaterials 2021, 11, 2080 3 of 13
effective surface-area-to-volume ratio [35]. The number of interaction points (between thefillers and the polymer matrix) in the percolation network was enhanced by the addition ofnanosized fillers [36]. There are issues related to the effective dispersion of CNTs in thepolymer matrix—that is, accumulation, the limited availability of high-quality CNTs, andtheir production cost [37]. Therefore, graphene sheets offer another option for producingnanocomposites filled with graphene because of their abundant graphite precursors [38].Graphene with ultra-high thermal conductivity is a promising material for distributingheat generated in microelectronics [39]; with shallow filler content, it can significantlyimprove the thermal properties [40].
The thermal properties of similar filler materials vary drastically in various polymermatrices, and a comparison of multiple materials is difficult [24]. For many polymercomposite materials, further research is required to probe the essential thermal propertydata, including the thermal conductivity, maximum operating temperature, and coefficientof thermal expansion. Nanofillers can enhance the ultra-low thermal conductivities ofpolymers with a super-high thermal conductivity of approximately 1000 W/m·K at roomtemperature (25 ◦C) [41].
In this study, GNPs and CNTs were systematically added into the PSU matrix viaa solution mixing process to design polymer nanocomposites with improved thermalproperties. The precursors and final composite materials were characterised in termsof X-ray diffraction, microstructures, Raman scattering, thermal conductivity, thermalexpansion, and the glass transition temperature.
2. Materials and Methods
The matrix PSU was procured from Sigma-Aldrich (USA), the CNTs from Cheap Tubes(USA), and GNPs from Graphene Supermarket (USA). The GNPs were composed of 30 to50 monolayers, with average thickness in the range of 12 nm and an average lateral size of~3 µm. The matrix and reinforcement compositions in wt% are shown in Table 1, alongwith their digital illustrations, along with Table 1.
Table 1. Compositional variation of PSU and reinforcements (CNT/GNP).
Nanomaterials 2021, 11, x FOR PEER REVIEW 3 of 14
higher filler loading on the nanoscale is likely to agglomerate and reduce the aspect ratio and effective surface-area-to-volume ratio [35]. The number of interaction points (between the fillers and the polymer matrix) in the percolation network was enhanced by the addi-tion of nanosized fillers [36]. There are issues related to the effective dispersion of CNTs in the polymer matrix—that is, accumulation, the limited availability of high-quality CNTs, and their production cost [37]. Therefore, graphene sheets offer another option for producing nanocomposites filled with graphene because of their abundant graphite pre-cursors [38]. Graphene with ultra-high thermal conductivity is a promising material for distributing heat generated in microelectronics [39]; with shallow filler content, it can sig-nificantly improve the thermal properties [40].
The thermal properties of similar filler materials vary drastically in various polymer matrices, and a comparison of multiple materials is difficult [24]. For many polymer com-posite materials, further research is required to probe the essential thermal property data, including the thermal conductivity, maximum operating temperature, and coefficient of thermal expansion. Nanofillers can enhance the ultra-low thermal conductivities of poly-mers with a super-high thermal conductivity of approximately 1000 W/m·K at room tem-perature (25 °C) [41].
In this study, GNPs and CNTs were systematically added into the PSU matrix via a solution mixing process to design polymer nanocomposites with improved thermal prop-erties. The precursors and final composite materials were characterised in terms of X-ray diffraction, microstructures, Raman scattering, thermal conductivity, thermal expansion, and the glass transition temperature.
2. Materials and Methods The matrix PSU was procured from Sigma-Aldrich (USA), the CNTs from Cheap
Tubes (USA), and GNPs from Graphene Supermarket (USA). The GNPs were composed of 30 to 50 monolayers, with average thickness in the range of 12 nm and an average lateral size of ~3 µm. The matrix and reinforcement compositions in wt% are shown in Table 1, along with their digital illustrations, along with Table 1.
Table 1. Compositional variation of PSU and reinforcements (CNT/GNP).
Composition Sample IDs 1 2 3 4 5 6 7 8 9
Composition (%) Pure PSU 1% CNT 3% CNT 5% CNT 10% CNT 1% GNP 3% GNP 5% GNP 10% GNP PSU (gm) 10 9.9 9.7 9.6 9 9.9 9.7 9.6 9
CNTs/GNPs (gm) 0 0.1 0.3 0.4 1 0.1 0.3 0.4 1
The nanocomposites were processed using the solution casting method [42]. Initially, specific amounts of CNTs and GNPs were added to 10 mL of N-Methyl-2-pyrrolidone (NMP). The mixture was sonicated for 2 h using a probe sonicator (Model VC 750, Sonics,
Composition
Sample IDs 1 2 3 4 5 6 7 8 9
Composition (%) Pure PSU 1% CNT 3% CNT 5% CNT 10% CNT 1% GNP 3% GNP 5% GNP 10% GNPPSU (gm) 10 9.9 9.7 9.6 9 9.9 9.7 9.6 9
CNTs/GNPs (gm) 0 0.1 0.3 0.4 1 0.1 0.3 0.4 1
The nanocomposites were processed using the solution casting method [42]. Initially,specific amounts of CNTs and GNPs were added to 10 mL of N-Methyl-2-pyrrolidone(NMP). The mixture was sonicated for 2 h using a probe sonicator (Model VC 750, Sonics,Newtown, CT, USA) to obtain a stable suspension of the different compositions as indicatedin Table 1. After the preparation of the solution, the required amount of PSU was dissolvedin 10 mL of NMP in a separate container by magnetic stirring for a further 2 h. Themixtures were then mixed and stirred over a magnetic hot plate for another 12 h. N-
Nanomaterials 2021, 11, 2080 4 of 13
Methyl-2-pyrrolidone (NMP) was used as a solvent to dissolve PSU into a suspension withdifferent weight percentages (0, 1, 3, 5, and 10 wt%) of reinforcements (CNTs/GNPs). Thestirring of the mixture was continued for 12 h using a magnetic stirrer to obtain a fullyhomogenised mixture.
The homogenised solution was cast in a petri dish and kept in a vacuum oven for 24 hat 80 ◦C to evaporate the solvent completely. Upon drying, the developed nanocompositefilm was removed for necessary characterisation and evaluation of the thermal properties.The thermal conductivity and effusivity were measured at room temperature, 25 ◦C, usingthermal analyser equipment C-Therm-TCi, (Fredericton, NB, Canada), for which the mea-surements were based on the modified transient plane source method. The coefficients ofthermal expansion (α) were measured using a Mettler Toledo thermo-mechanical analyser(TMA/SDTA-LF/1100, Greifensee, Switzerland) from room temperature (25 ◦C) up to180 ◦C at a heating rate of 283 K/min (10 ◦C/min). The Tg was evaluated as a functionof the filler composition using differential scanning calorimetry (DSC) (Mettler Toledo,Greifensee, Switzerland).
The phase analysis of the composites was conducted using X-ray diffraction experi-ments performed using a Benchtop MiniFlex X-ray diffractometer (Rigaku, Tokyo, Japan).The XRD was operated by maintaining a tube current of 10 mA, an accelerating voltageof 30 kV, and Cu Kα1 radiation. A Raman microscope (Thermo Scientific, DXR2, Boston,MA, USA) was used to observe molecular disorientation and band characteristics with anexcitation wavelength of 455 nm (laser power of 2.5 mW), and the spectra were acquired at25 ◦C between 200 and 3500 cm−1. A field emission scanning electron microscope (FESEM)from Tescan (Lyra3, Tescan, Brno, Czech Republic) was used to characterise the surfacemorphology of the composites at an accelerating voltage of 20 kV.
3. Results and Discussion3.1. Microstructural Characterisation
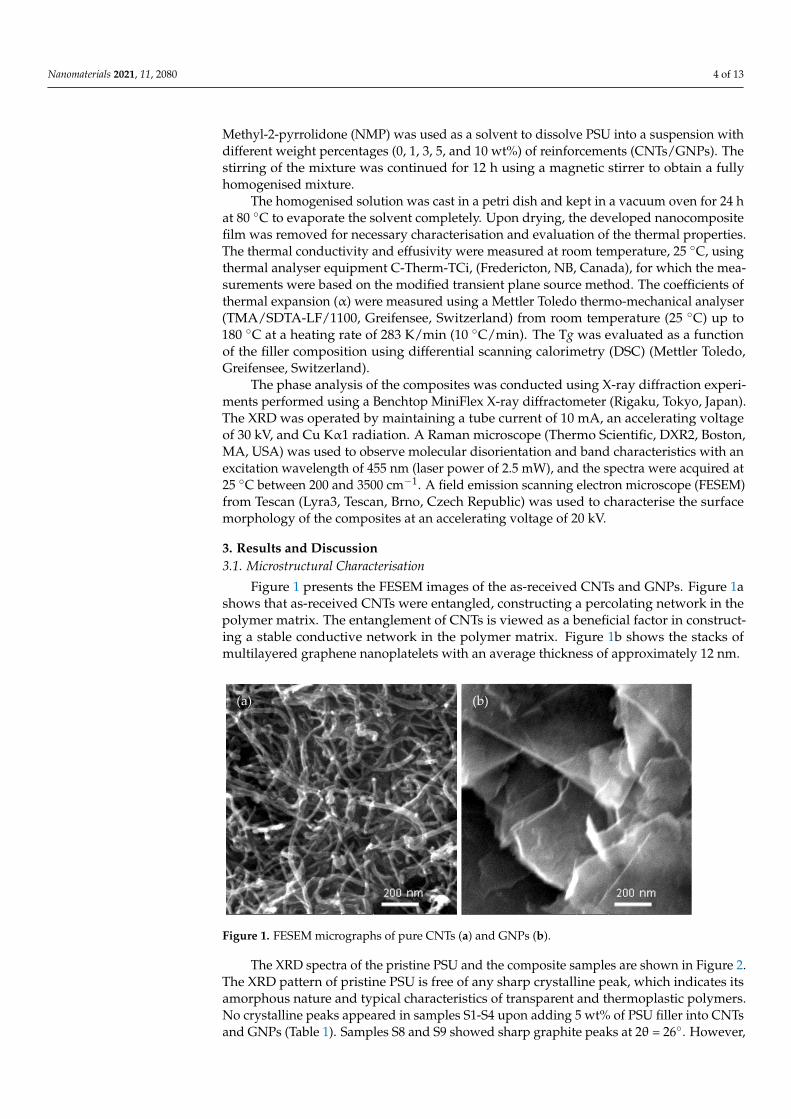
Figure 1 presents the FESEM images of the as-received CNTs and GNPs. Figure 1ashows that as-received CNTs were entangled, constructing a percolating network in thepolymer matrix. The entanglement of CNTs is viewed as a beneficial factor in construct-ing a stable conductive network in the polymer matrix. Figure 1b shows the stacks ofmultilayered graphene nanoplatelets with an average thickness of approximately 12 nm.
Nanomaterials 2021, 11, x FOR PEER REVIEW 4 of 14
Newtown, CT, USA) to obtain a stable suspension of the different compositions as indi-cated in Table 1. After the preparation of the solution, the required amount of PSU was dissolved in 10 mL of NMP in a separate container by magnetic stirring for a further 2 h. The mixtures were then mixed and stirred over a magnetic hot plate for another 12 h. N-Methyl-2-pyrrolidone (NMP) was used as a solvent to dissolve PSU into a suspension with different weight percentages (0, 1, 3, 5, and 10 wt%) of reinforcements (CNTs/GNPs). The stirring of the mixture was continued for 12 h using a magnetic stirrer to obtain a fully homogenised mixture.
The homogenised solution was cast in a petri dish and kept in a vacuum oven for 24 h at 80 °C to evaporate the solvent completely. Upon drying, the developed nanocompo-site film was removed for necessary characterisation and evaluation of the thermal prop-erties. The thermal conductivity and effusivity were measured at room temperature, 25 °C, using thermal analyser equipment C-Therm-TCi, (Fredericton, NB, Canada), for which the measurements were based on the modified transient plane source method. The coef-ficients of thermal expansion (α) were measured using a Mettler Toledo thermo-mechan-ical analyser (TMA/SDTA-LF/1100, Greifensee, Switzerland) from room temperature (25 °C) up to 180 °C at a heating rate of 283 K/min (10 °C/min). The Tg was evaluated as a function of the filler composition using differential scanning calorimetry (DSC) (Mettler Toledo, Greifensee , Switzerland).
The phase analysis of the composites was conducted using X-ray diffraction experi-ments performed using a Benchtop MiniFlex X-ray diffractometer (Rigaku, Tokyo, Japan). The XRD was operated by maintaining a tube current of 10 mA, an accelerating voltage of 30 kV, and Cu Kα1 radiation. A Raman microscope (Thermo Scientific, DXR2, Boston, MA, USA) was used to observe molecular disorientation and band characteristics with an excitation wavelength of 455 nm (laser power of 2.5 mW), and the spectra were acquired at 25 °C between 200 and 3500 cm−1. A field emission scanning electron microscope (FESEM) from Tescan (Lyra3, Tescan, Brno, Czech Republic) was used to characterise the surface morphology of the composites at an accelerating voltage of 20 kV.
3. Results and Discussion 3.1. Microstructural Characterisation
Figure 1 presents the FESEM images of the as-received CNTs and GNPs. Figure 1a shows that as-received CNTs were entangled, constructing a percolating network in the polymer matrix. The entanglement of CNTs is viewed as a beneficial factor in constructing a stable conductive network in the polymer matrix. Figure 1b shows the stacks of multi-layered graphene nanoplatelets with an average thickness of approximately 12 nm.
Figure 1. FESEM micrographs of pure CNTs (a) and GNPs (b).
(b) (a)
Figure 1. FESEM micrographs of pure CNTs (a) and GNPs (b).
The XRD spectra of the pristine PSU and the composite samples are shown in Figure 2.The XRD pattern of pristine PSU is free of any sharp crystalline peak, which indicates itsamorphous nature and typical characteristics of transparent and thermoplastic polymers.No crystalline peaks appeared in samples S1-S4 upon adding 5 wt% of PSU filler into CNTsand GNPs (Table 1). Samples S8 and S9 showed sharp graphite peaks at 2θ = 26◦. However,

Nanomaterials 2021, 11, 2080 5 of 13
the corresponding samples with CNT addition (S4 and S5) did not display any sharppeaks at the same diffraction angle. This observation is attributed to the more significantmolecular weight of GNPs, which produced comparatively higher crystallinity in S8 andS9 samples.
Nanomaterials 2021, 11, x FOR PEER REVIEW 5 of 14
The XRD spectra of the pristine PSU and the composite samples are shown in Figure 2. The XRD pattern of pristine PSU is free of any sharp crystalline peak, which indicates its amorphous nature and typical characteristics of transparent and thermoplastic poly-mers. No crystalline peaks appeared in samples S1-S4 upon adding 5 wt% of PSU filler into CNTs and GNPs (Table 1). Samples S8 and S9 showed sharp graphite peaks at 2θ = 26°. However, the corresponding samples with CNT addition (S4 and S5) did not display any sharp peaks at the same diffraction angle. This observation is attributed to the more significant molecular weight of GNPs, which produced comparatively higher crystallinity in S8 and S9 samples.
Figure 2. X-ray diffraction (XRD) patterns of PSU-CNT and PSU-GNP samples. Numbers (1)–(9) in parentheses correspond to numbers of samples for which compositions are described in Table 1.
Analysis of the XRD patterns of the pristine PSU and PSU-CNT and PSU-GNP nano-composites (Figure 2) showed the crystallinity of the composites. The XRD pattern of pure PSU (Figure 2(1)) showed a broad diffraction peak at approximately 2θ = 18°, indicating a primarily amorphous structure for PSU. In the PSU-CNT nanocomposites, there was no indication of a sharp peak, even in the presence of CNTs in the polymer matrix. Notably, when the CNT content was increased to 10 wt% (Figure 2(5)), a diffraction peak appeared at approximately 2θ = 26°. For PSU-GNP nanocomposites, with the addition of a small amount of graphene (1–3 wt%), the nanocomposites showed identical XRD patterns to pure PSU. However, when the graphene content was increased to 5 or 10 wt%, a diffrac-tion peak was observed at approximately 2θ = 27°, which demonstrates the aggregation of graphene nanoplatelets, especially for the 10 wt% graphene (Figure 2(9)). The absence of a peak in the composites with lower concentrations confirms dispersion within the re-inforcements in the matrix [43]. Peak broadening at higher concentrations (Figure 2(5),(9)) demonstrates a slight change in the polysulphone structure, which perhaps may be due to the dominant interactions of weak Van der Waals forces.
The molecular disorientation and band characteristics were observed via Raman spectroscopy. The Raman spectrum of pure PSU shows typical peaks at ~790, ~1147, ~1583, and ~3065 cm−1. The band characteristics of PSU, CNT, and GNPS (composite) are shown in the Raman spectra in Figure 3, which shows that the D and G bands appeared at 1175 and 1650 cm−1, respectively. These are slightly shifted from the characteristic peaks (i.e., centred at 1345 and 1565 cm−1) of carbon nanoallotrope materials [44]. The increase in the intensity ratios of the D to G bands shows a reduction in the order (carbon atoms) as the amount of reinforcement increases. This phenomenon can be attributed to hydrogen bonding interactions between the polymer matrix chains and reinforcements [31].
Figure 2. X-ray diffraction (XRD) patterns of PSU-CNT and PSU-GNP samples. Numbers (1)–(9) inparentheses correspond to numbers of samples for which compositions are described in Table 1.
Analysis of the XRD patterns of the pristine PSU and PSU-CNT and PSU-GNPnanocomposites (Figure 2) showed the crystallinity of the composites. The XRD pat-tern of pure PSU (Figure 2(1)) showed a broad diffraction peak at approximately 2θ = 18◦,indicating a primarily amorphous structure for PSU. In the PSU-CNT nanocomposites,there was no indication of a sharp peak, even in the presence of CNTs in the polymermatrix. Notably, when the CNT content was increased to 10 wt% (Figure 2(5)), a diffrac-tion peak appeared at approximately 2θ = 26◦. For PSU-GNP nanocomposites, with theaddition of a small amount of graphene (1–3 wt%), the nanocomposites showed identicalXRD patterns to pure PSU. However, when the graphene content was increased to 5 or10 wt%, a diffraction peak was observed at approximately 2θ = 27◦, which demonstratesthe aggregation of graphene nanoplatelets, especially for the 10 wt% graphene (Figure 2(9)).The absence of a peak in the composites with lower concentrations confirms dispersionwithin the reinforcements in the matrix [43]. Peak broadening at higher concentrations(Figure 2(5),(9)) demonstrates a slight change in the polysulphone structure, which perhapsmay be due to the dominant interactions of weak Van der Waals forces.
The molecular disorientation and band characteristics were observed via Ramanspectroscopy. The Raman spectrum of pure PSU shows typical peaks at ~790, ~1147,~1583, and ~3065 cm−1. The band characteristics of PSU, CNT, and GNPS (composite) areshown in the Raman spectra in Figure 3, which shows that the D and G bands appeared at1175 and 1650 cm−1, respectively. These are slightly shifted from the characteristic peaks(i.e., centred at 1345 and 1565 cm−1) of carbon nanoallotrope materials [44]. The increase inthe intensity ratios of the D to G bands shows a reduction in the order (carbon atoms) asthe amount of reinforcement increases. This phenomenon can be attributed to hydrogenbonding interactions between the polymer matrix chains and reinforcements [31].

Nanomaterials 2021, 11, 2080 6 of 13Nanomaterials 2021, 11, x FOR PEER REVIEW 6 of 14
Figure 3. Raman analysis of PSU−CNT and PSU−GNP nanocomposites. Numbers (2), (5), (6), and (9) in parentheses correspond to sample IDs and compositions described in Table 1.
The D band peak is associated with disorder arising from the Raman scattering pro-cess in disordered carbon atoms. In contrast, the G band peak results from the in-plane tangential stretching of carbon–carbon bonds. However, the relative intensity ratio of ID/IG is a good indicator of disorder; a higher value of this ratio indicates a higher number of defects [45]. Therefore, the defect level can be assessed by determining the intensity ratio of the D and G band peaks (ID/IG ratio) [36]. The ID/IG ratios of the 10 wt% CNTs and graphene polymer composites were 1.6 and 1.4, respectively, indicating that the de-fect level of the 10 wt% CNT composite was higher than that of the 10 wt% GNPs. The ID/IG ratio increased, confirming that the fillers were structurally intact and their concen-tration governed the Raman spectra of the developed nanocomposites [44]. Figure 4 shows the FESEM micrographs of the fractured surfaces of the PSU-CNT and PSU-GNP composites. The formation of a three-dimensional CNT network and interconnectivity in the PSU matrix can be observed in the FESEM images (Figure 4b–i).
Figure 3. Raman analysis of PSU-CNT and PSU-GNP nanocomposites. Numbers (2), (5), (6), and (9)in parentheses correspond to sample IDs and compositions described in Table 1.
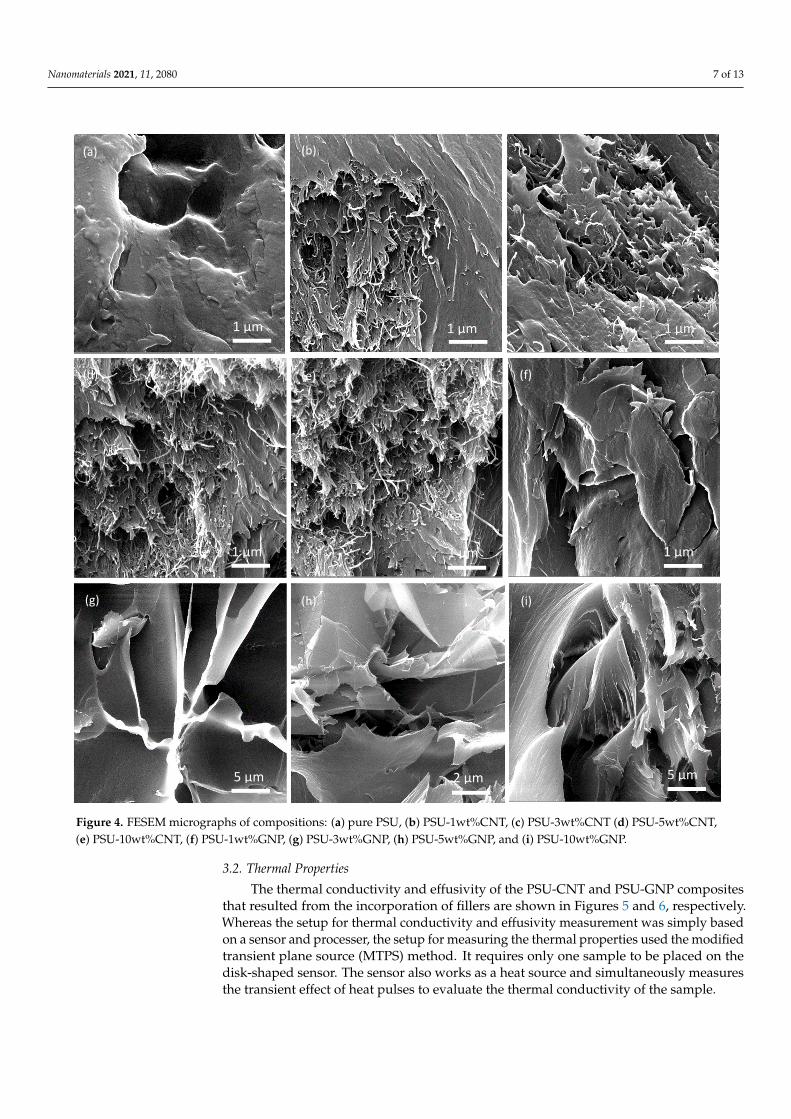
The D band peak is associated with disorder arising from the Raman scatteringprocess in disordered carbon atoms. In contrast, the G band peak results from the in-planetangential stretching of carbon–carbon bonds. However, the relative intensity ratio ofID/IG is a good indicator of disorder; a higher value of this ratio indicates a higher numberof defects [45]. Therefore, the defect level can be assessed by determining the intensityratio of the D and G band peaks (ID/IG ratio) [36]. The ID/IG ratios of the 10 wt% CNTsand graphene polymer composites were 1.6 and 1.4, respectively, indicating that the defectlevel of the 10 wt% CNT composite was higher than that of the 10 wt% GNPs. The ID/IGratio increased, confirming that the fillers were structurally intact and their concentrationgoverned the Raman spectra of the developed nanocomposites [44]. Figure 4 shows theFESEM micrographs of the fractured surfaces of the PSU-CNT and PSU-GNP composites.The formation of a three-dimensional CNT network and interconnectivity in the PSU matrixcan be observed in the FESEM images (Figure 4b–i).
The developed composites possessed a larger contact area and better interactionbetween the CNTs, as well as improved matrix percolation and synergistic enhancement.The interfacial interaction network formation in both types of reinforcements was excellentand suitable for a conductive path with high thermal conductivity. At higher loadings(10 wt%), the dispersion of CNTs is better than GNPs because intermolecular Van der Waalsforces are much weaker in CNTs when compared with GNPs. It is evident from Figure 4f–ithat the GNPs were well-dispersed in the matrix at lower concentrations, showing goodcompatibility when compared with higher concentrations. Hence, it was observed that theCNTs had better and easier dispersion in the PSU matrix than the GNPs.
The PSU-GNP composite with 10 wt% of GNP was closely combined and stacked,leading to the aggregation of graphene, as shown in Figure 4i, which was also confirmedby the XRD peak at 2θ = 27◦. The strong surface–surface attraction between the filler sheetscould lower the dispersion in the matrix [38]. GNPs have strong Van der Waals forcesbetween the adjacent planes of carbon rings, which potentially results in agglomeration,defects, or flaws in the PSU-GNP composites (Figure 4i) when compared with the CNTcounterpart. Therefore, well-dispersed, thermally conductive fillers play a vital role toamplify phonon transport and hence to synergistically enhance thermal conductivity.
Nanomaterials 2021, 11, 2080 7 of 13Nanomaterials 2021, 11, x FOR PEER REVIEW 7 of 14
Figure 4. FESEM micrographs of compositions: (a) pure PSU, (b) PSU-1wt%CNT, (c) PSU-3wt%CNT (d) PSU-5wt%CNT, (e) PSU-10wt%CNT, (f) PSU-1wt%GNP, (g) PSU-3wt%GNP, (h) PSU-5wt%GNP, and (i) PSU-10wt%GNP.
The developed composites possessed a larger contact area and better interaction be-tween the CNTs, as well as improved matrix percolation and synergistic enhancement. The interfacial interaction network formation in both types of reinforcements was excel-lent and suitable for a conductive path with high thermal conductivity. At higher loadings (10 wt%), the dispersion of CNTs is better than GNPs because intermolecular Van der Waals forces are much weaker in CNTs when compared with GNPs. It is evident from Figure 4f–i that the GNPs were well-dispersed in the matrix at lower concentrations, showing good compatibility when compared with higher concentrations. Hence, it was observed that the CNTs had better and easier dispersion in the PSU matrix than the GNPs.
The PSU-GNP composite with 10 wt% of GNP was closely combined and stacked, leading to the aggregation of graphene, as shown in Figure 4i, which was also confirmed by the XRD peak at 2θ = 27°. The strong surface–surface attraction between the filler sheets
1 µm
(a)
1 µm
(b)
1 µm
(c)
1 µm
(d)
1 µm
(e)
1 µm
(f)
5 µm
(g)
2 µm
(h)
5 µm
(i)
Figure 4. FESEM micrographs of compositions: (a) pure PSU, (b) PSU-1wt%CNT, (c) PSU-3wt%CNT (d) PSU-5wt%CNT,(e) PSU-10wt%CNT, (f) PSU-1wt%GNP, (g) PSU-3wt%GNP, (h) PSU-5wt%GNP, and (i) PSU-10wt%GNP.
3.2. Thermal Properties
The thermal conductivity and effusivity of the PSU-CNT and PSU-GNP compositesthat resulted from the incorporation of fillers are shown in Figures 5 and 6, respectively.Whereas the setup for thermal conductivity and effusivity measurement was simply basedon a sensor and processer, the setup for measuring the thermal properties used the modifiedtransient plane source (MTPS) method. It requires only one sample to be placed on thedisk-shaped sensor. The sensor also works as a heat source and simultaneously measuresthe transient effect of heat pulses to evaluate the thermal conductivity of the sample.
Nanomaterials 2021, 11, 2080 8 of 13
Nanomaterials 2021, 11, x FOR PEER REVIEW 8 of 14
could lower the dispersion in the matrix [38]. GNPs have strong Van der Waals forces between the adjacent planes of carbon rings, which potentially results in agglomeration, defects, or flaws in the PSU-GNP composites (Figure 4i) when compared with the CNT counterpart. Therefore, well-dispersed, thermally conductive fillers play a vital role to amplify phonon transport and hence to synergistically enhance thermal conductivity.
3.2. Thermal Properties The thermal conductivity and effusivity of the PSU-CNT and PSU-GNP composites
that resulted from the incorporation of fillers are shown in Figures 5 and 6, respectively. Whereas the setup for thermal conductivity and effusivity measurement was simply based on a sensor and processer, the setup for measuring the thermal properties used the modified transient plane source (MTPS) method. It requires only one sample to be placed on the disk-shaped sensor. The sensor also works as a heat source and simultaneously measures the transient effect of heat pulses to evaluate the thermal conductivity of the sample.
The experimental thermal conductivity results of the PSU-CNT and PSU-GNP com-posites were correlated with the theoretical model published by Raza et al. [46], which can be used for dilute concentrations of percolating single and hybrid fillers in polymer com-posites. It was observed that the results were close to the predictions of the model at lower concentrations of up to 5 wt%. However, the deviations at 10 wt% can be attributed to the agglomeration among the nanoparticles and related defects, which were ignored by the theoretical model.
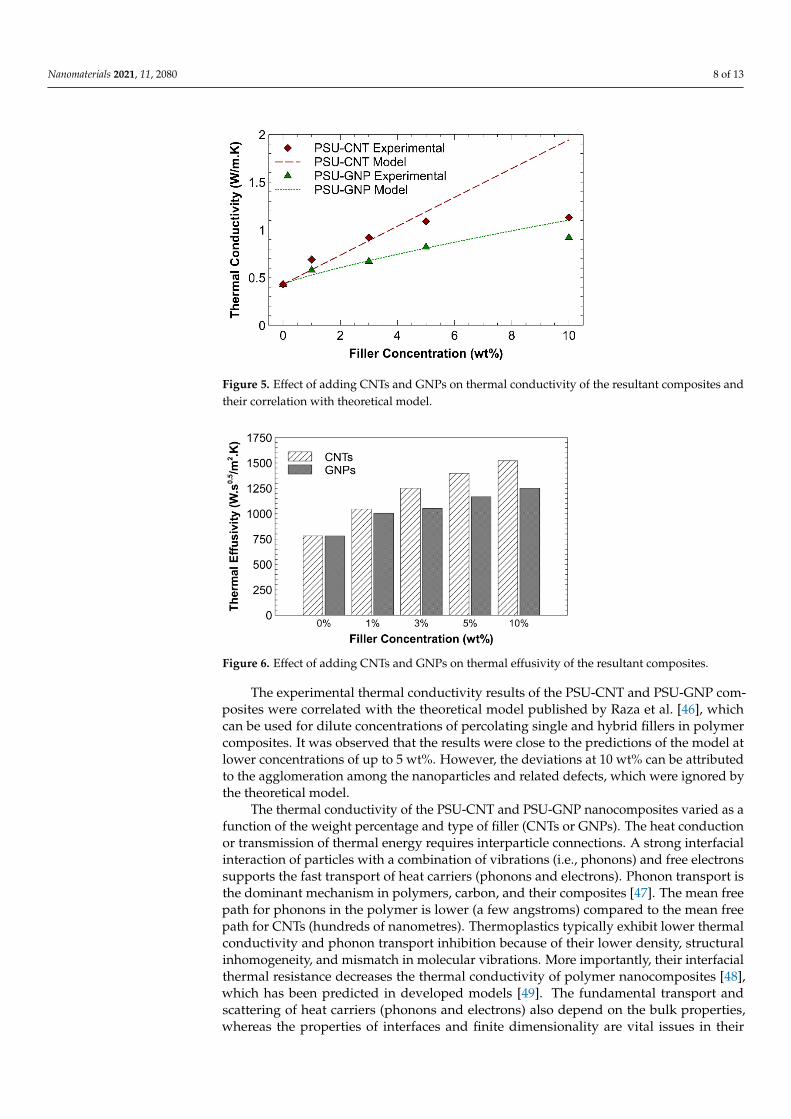
Figure 5. Effect of adding CNTs and GNPs on thermal conductivity of the resultant composites and their correlation with theoretical model.
Figure 5. Effect of adding CNTs and GNPs on thermal conductivity of the resultant composites andtheir correlation with theoretical model.
Nanomaterials 2021, 11, x FOR PEER REVIEW 9 of 14
Figure 6. Effect of adding CNTs and GNPs on thermal effusivity of the resultant composites.
The thermal conductivity of the PSU-CNT and PSU-GNP nanocomposites varied as a function of the weight percentage and type of filler (CNTs or GNPs). The heat conduc-tion or transmission of thermal energy requires interparticle connections. A strong inter-facial interaction of particles with a combination of vibrations (i.e., phonons) and free elec-trons supports the fast transport of heat carriers (phonons and electrons). Phonon transport is the dominant mechanism in polymers, carbon, and their composites [47]. The mean free path for phonons in the polymer is lower (a few angstroms) compared to the mean free path for CNTs (hundreds of nanometres). Thermoplastics typically exhibit lower thermal conductivity and phonon transport inhibition because of their lower den-sity, structural inhomogeneity, and mismatch in molecular vibrations. More importantly, their interfacial thermal resistance decreases the thermal conductivity of polymer nano-composites [48], which has been predicted in developed models [49]. The fundamental transport and scattering of heat carriers (phonons and electrons) also depend on the bulk properties, whereas the properties of interfaces and finite dimensionality are vital issues in their applications [14]. The PSU-CNT composite with 10 wt% CNTs showed increased thermal conductivity compared to that of the PSU-GNP nanocomposite with 10 wt%.
The polysulphone–CNT composite with 10 wt% CNTs shows an enhancement in thermal conductivity of 163%, which is approximately 50% higher (increase) in compari-son to the addition of 10 wt% graphene nano-platelets. This can be ascribed to the for-mation of an interconnecting network with strong coupling at the PSU–CNT interface in the case of CNTs, as predicted from the FESEM micrographs (Figure 4b–e). The formation of the interconnecting network is much better at lower concentrations—that is, 1–5 wt% CNT/GNPs (Figure 4b,c,f–g). The formation of an interconnecting/percolating network promotes heat flow. It reduces the phonon scattering at the interface between the rein-forcements and polymers, which can improve the thermal transport in composites [41]. At higher reinforcement loading, interfacial thermal resistance obstructs further improve-ment in the thermal transport of charge carriers (phonons and electrons). The thermal properties of composites are a function of the volume fraction, aspect ratio, alignment, and adhesion interface condition between the particles and the matrix [50]. Nanofillers (such as CNTs and GNPs) with a high aspect ratio form a percolating network. These are promising candidates for high conductivity owing to their high-aspect-ratio nanofillers [33]. However, for graphene, there is a high probability of sheet-to-sheet contact even at comparatively low graphene loading because of the overlapping electronic clouds of neighbouring carbon atoms [38]. However, these conditions are well shown in Figure 4f–i; with better distribution, the conductivity can be improved to 114% compared to that of a neat (pristine) polymer. Thermal effusivity is a measure of the ability of a material to exchange thermal energy with its surroundings [51]. Table 2 shows the positive correla-tions between the amount of filler and the thermal effusivity.
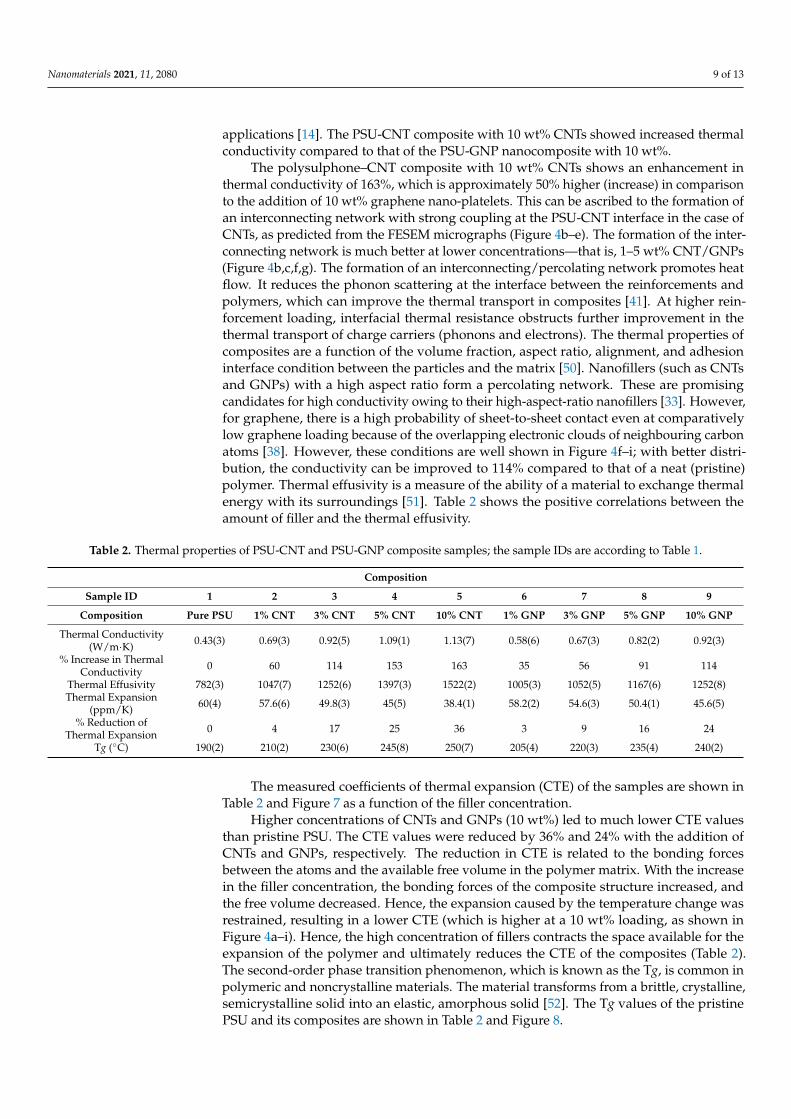
Figure 6. Effect of adding CNTs and GNPs on thermal effusivity of the resultant composites.
The experimental thermal conductivity results of the PSU-CNT and PSU-GNP com-posites were correlated with the theoretical model published by Raza et al. [46], whichcan be used for dilute concentrations of percolating single and hybrid fillers in polymercomposites. It was observed that the results were close to the predictions of the model atlower concentrations of up to 5 wt%. However, the deviations at 10 wt% can be attributedto the agglomeration among the nanoparticles and related defects, which were ignored bythe theoretical model.
The thermal conductivity of the PSU-CNT and PSU-GNP nanocomposites varied as afunction of the weight percentage and type of filler (CNTs or GNPs). The heat conductionor transmission of thermal energy requires interparticle connections. A strong interfacialinteraction of particles with a combination of vibrations (i.e., phonons) and free electronssupports the fast transport of heat carriers (phonons and electrons). Phonon transport isthe dominant mechanism in polymers, carbon, and their composites [47]. The mean freepath for phonons in the polymer is lower (a few angstroms) compared to the mean freepath for CNTs (hundreds of nanometres). Thermoplastics typically exhibit lower thermalconductivity and phonon transport inhibition because of their lower density, structuralinhomogeneity, and mismatch in molecular vibrations. More importantly, their interfacialthermal resistance decreases the thermal conductivity of polymer nanocomposites [48],which has been predicted in developed models [49]. The fundamental transport andscattering of heat carriers (phonons and electrons) also depend on the bulk properties,whereas the properties of interfaces and finite dimensionality are vital issues in their
Nanomaterials 2021, 11, 2080 9 of 13
applications [14]. The PSU-CNT composite with 10 wt% CNTs showed increased thermalconductivity compared to that of the PSU-GNP nanocomposite with 10 wt%.
The polysulphone–CNT composite with 10 wt% CNTs shows an enhancement inthermal conductivity of 163%, which is approximately 50% higher (increase) in comparisonto the addition of 10 wt% graphene nano-platelets. This can be ascribed to the formation ofan interconnecting network with strong coupling at the PSU-CNT interface in the case ofCNTs, as predicted from the FESEM micrographs (Figure 4b–e). The formation of the inter-connecting network is much better at lower concentrations—that is, 1–5 wt% CNT/GNPs(Figure 4b,c,f,g). The formation of an interconnecting/percolating network promotes heatflow. It reduces the phonon scattering at the interface between the reinforcements andpolymers, which can improve the thermal transport in composites [41]. At higher rein-forcement loading, interfacial thermal resistance obstructs further improvement in thethermal transport of charge carriers (phonons and electrons). The thermal properties ofcomposites are a function of the volume fraction, aspect ratio, alignment, and adhesioninterface condition between the particles and the matrix [50]. Nanofillers (such as CNTsand GNPs) with a high aspect ratio form a percolating network. These are promisingcandidates for high conductivity owing to their high-aspect-ratio nanofillers [33]. However,for graphene, there is a high probability of sheet-to-sheet contact even at comparativelylow graphene loading because of the overlapping electronic clouds of neighbouring carbonatoms [38]. However, these conditions are well shown in Figure 4f–i; with better distri-bution, the conductivity can be improved to 114% compared to that of a neat (pristine)polymer. Thermal effusivity is a measure of the ability of a material to exchange thermalenergy with its surroundings [51]. Table 2 shows the positive correlations between theamount of filler and the thermal effusivity.
Table 2. Thermal properties of PSU-CNT and PSU-GNP composite samples; the sample IDs are according to Table 1.
Composition
Sample ID 1 2 3 4 5 6 7 8 9
Composition Pure PSU 1% CNT 3% CNT 5% CNT 10% CNT 1% GNP 3% GNP 5% GNP 10% GNP
Thermal Conductivity(W/m·K) 0.43(3) 0.69(3) 0.92(5) 1.09(1) 1.13(7) 0.58(6) 0.67(3) 0.82(2) 0.92(3)
% Increase in ThermalConductivity 0 60 114 153 163 35 56 91 114
Thermal Effusivity 782(3) 1047(7) 1252(6) 1397(3) 1522(2) 1005(3) 1052(5) 1167(6) 1252(8)Thermal Expansion
(ppm/K) 60(4) 57.6(6) 49.8(3) 45(5) 38.4(1) 58.2(2) 54.6(3) 50.4(1) 45.6(5)
% Reduction ofThermal Expansion 0 4 17 25 36 3 9 16 24
Tg (◦C) 190(2) 210(2) 230(6) 245(8) 250(7) 205(4) 220(3) 235(4) 240(2)
The measured coefficients of thermal expansion (CTE) of the samples are shown inTable 2 and Figure 7 as a function of the filler concentration.
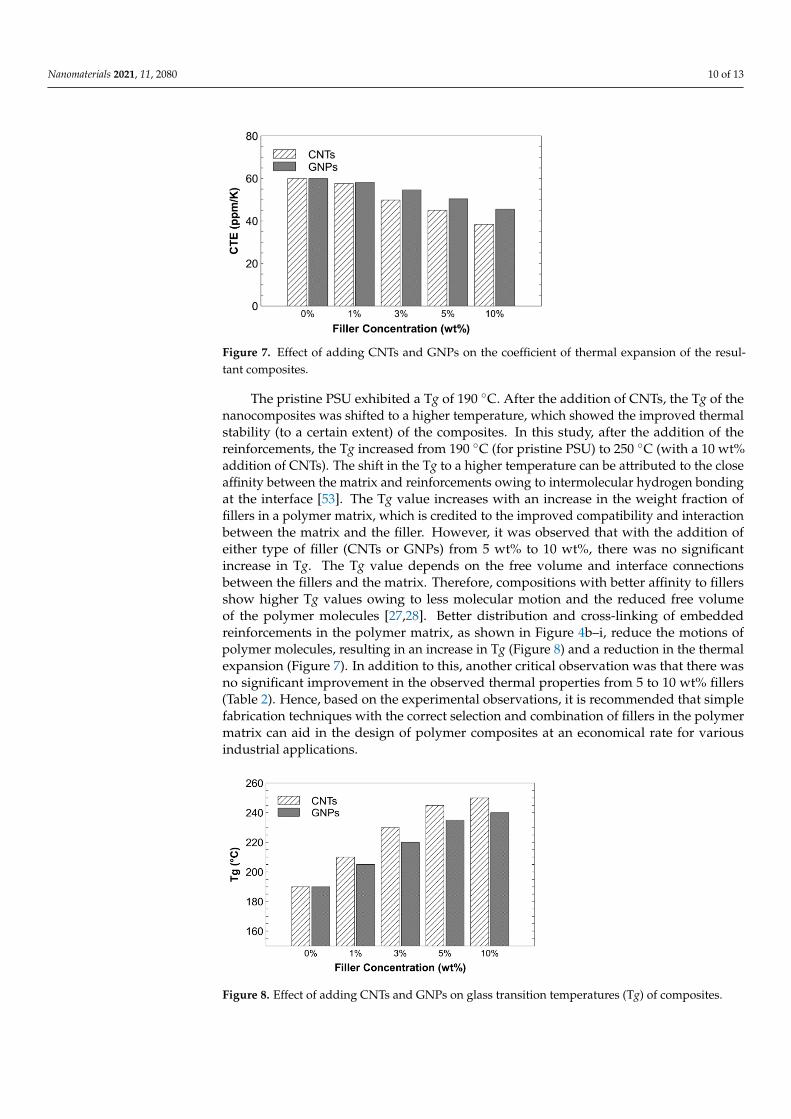
Higher concentrations of CNTs and GNPs (10 wt%) led to much lower CTE valuesthan pristine PSU. The CTE values were reduced by 36% and 24% with the addition ofCNTs and GNPs, respectively. The reduction in CTE is related to the bonding forcesbetween the atoms and the available free volume in the polymer matrix. With the increasein the filler concentration, the bonding forces of the composite structure increased, andthe free volume decreased. Hence, the expansion caused by the temperature change wasrestrained, resulting in a lower CTE (which is higher at a 10 wt% loading, as shown inFigure 4a–i). Hence, the high concentration of fillers contracts the space available for theexpansion of the polymer and ultimately reduces the CTE of the composites (Table 2).The second-order phase transition phenomenon, which is known as the Tg, is common inpolymeric and noncrystalline materials. The material transforms from a brittle, crystalline,semicrystalline solid into an elastic, amorphous solid [52]. The Tg values of the pristinePSU and its composites are shown in Table 2 and Figure 8.
Nanomaterials 2021, 11, 2080 10 of 13
Nanomaterials 2021, 11, x FOR PEER REVIEW 10 of 14
The measured coefficients of thermal expansion (CTE) of the samples are shown in Table 2 and Figure 7 as a function of the filler concentration.
Figure 7. Effect of adding CNTs and GNPs on the coefficient of thermal expansion of the resultant composites.
Higher concentrations of CNTs and GNPs (10 wt%) led to much lower CTE values than pristine PSU. The CTE values were reduced by 36% and 24% with the addition of CNTs and GNPs, respectively. The reduction in CTE is related to the bonding forces be-tween the atoms and the available free volume in the polymer matrix. With the increase in the filler concentration, the bonding forces of the composite structure increased, and the free volume decreased. Hence, the expansion caused by the temperature change was restrained, resulting in a lower CTE (which is higher at a 10 wt% loading, as shown in Figure 4a–i). Hence, the high concentration of fillers contracts the space available for the expansion of the polymer and ultimately reduces the CTE of the composites (Table 2). The second-order phase transition phenomenon, which is known as the Tg, is common in pol-ymeric and noncrystalline materials. The material transforms from a brittle, crystalline, semicrystalline solid into an elastic, amorphous solid [52]. The Tg values of the pristine PSU and its composites are shown in Table 2 and Figure 8.
Figure 8. Effect of adding CNTs and GNPs on glass transition temperatures (Tg) of composites.
The pristine PSU exhibited a Tg of 190 °C. After the addition of CNTs, the Tg of the nanocomposites was shifted to a higher temperature, which showed the improved ther-mal stability (to a certain extent) of the composites. In this study, after the addition of the reinforcements, the Tg increased from 190 °C (for pristine PSU) to 250 °C (with a 10 wt% addition of CNTs). The shift in the Tg to a higher temperature can be attributed to the close affinity between the matrix and reinforcements owing to intermolecular hydrogen bonding at the interface [53]. The Tg value increases with an increase in the weight fraction
Figure 7. Effect of adding CNTs and GNPs on the coefficient of thermal expansion of the resul-tant composites.
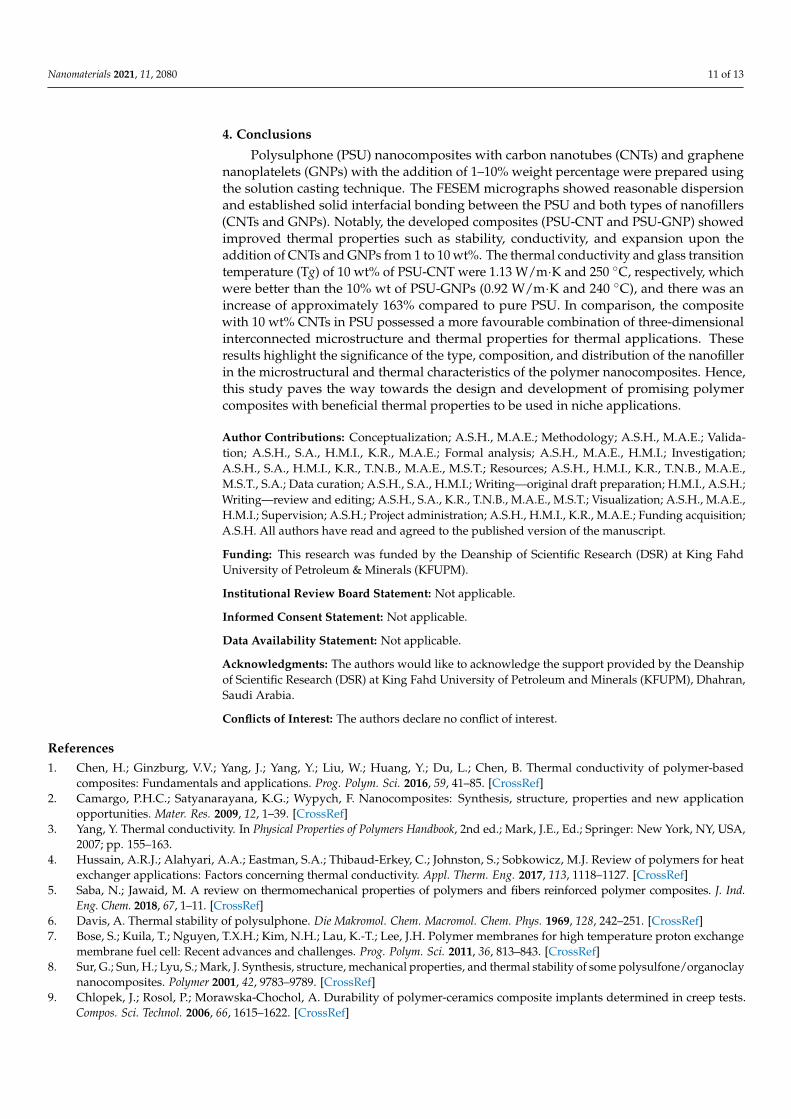
The pristine PSU exhibited a Tg of 190 ◦C. After the addition of CNTs, the Tg of thenanocomposites was shifted to a higher temperature, which showed the improved thermalstability (to a certain extent) of the composites. In this study, after the addition of thereinforcements, the Tg increased from 190 ◦C (for pristine PSU) to 250 ◦C (with a 10 wt%addition of CNTs). The shift in the Tg to a higher temperature can be attributed to the closeaffinity between the matrix and reinforcements owing to intermolecular hydrogen bondingat the interface [53]. The Tg value increases with an increase in the weight fraction offillers in a polymer matrix, which is credited to the improved compatibility and interactionbetween the matrix and the filler. However, it was observed that with the addition ofeither type of filler (CNTs or GNPs) from 5 wt% to 10 wt%, there was no significantincrease in Tg. The Tg value depends on the free volume and interface connectionsbetween the fillers and the matrix. Therefore, compositions with better affinity to fillersshow higher Tg values owing to less molecular motion and the reduced free volumeof the polymer molecules [27,28]. Better distribution and cross-linking of embeddedreinforcements in the polymer matrix, as shown in Figure 4b–i, reduce the motions ofpolymer molecules, resulting in an increase in Tg (Figure 8) and a reduction in the thermalexpansion (Figure 7). In addition to this, another critical observation was that there wasno significant improvement in the observed thermal properties from 5 to 10 wt% fillers(Table 2). Hence, based on the experimental observations, it is recommended that simplefabrication techniques with the correct selection and combination of fillers in the polymermatrix can aid in the design of polymer composites at an economical rate for variousindustrial applications.
Nanomaterials 2021, 11, x FOR PEER REVIEW 10 of 14
The measured coefficients of thermal expansion (CTE) of the samples are shown in Table 2 and Figure 7 as a function of the filler concentration.
Figure 7. Effect of adding CNTs and GNPs on the coefficient of thermal expansion of the resultant composites.
Higher concentrations of CNTs and GNPs (10 wt%) led to much lower CTE values than pristine PSU. The CTE values were reduced by 36% and 24% with the addition of CNTs and GNPs, respectively. The reduction in CTE is related to the bonding forces be-tween the atoms and the available free volume in the polymer matrix. With the increase in the filler concentration, the bonding forces of the composite structure increased, and the free volume decreased. Hence, the expansion caused by the temperature change was restrained, resulting in a lower CTE (which is higher at a 10 wt% loading, as shown in Figure 4a–i). Hence, the high concentration of fillers contracts the space available for the expansion of the polymer and ultimately reduces the CTE of the composites (Table 2). The second-order phase transition phenomenon, which is known as the Tg, is common in pol-ymeric and noncrystalline materials. The material transforms from a brittle, crystalline, semicrystalline solid into an elastic, amorphous solid [52]. The Tg values of the pristine PSU and its composites are shown in Table 2 and Figure 8.
Figure 8. Effect of adding CNTs and GNPs on glass transition temperatures (Tg) of composites.
The pristine PSU exhibited a Tg of 190 °C. After the addition of CNTs, the Tg of the nanocomposites was shifted to a higher temperature, which showed the improved ther-mal stability (to a certain extent) of the composites. In this study, after the addition of the reinforcements, the Tg increased from 190 °C (for pristine PSU) to 250 °C (with a 10 wt% addition of CNTs). The shift in the Tg to a higher temperature can be attributed to the close affinity between the matrix and reinforcements owing to intermolecular hydrogen bonding at the interface [53]. The Tg value increases with an increase in the weight fraction
Figure 8. Effect of adding CNTs and GNPs on glass transition temperatures (Tg) of composites.
Nanomaterials 2021, 11, 2080 11 of 13
4. Conclusions
Polysulphone (PSU) nanocomposites with carbon nanotubes (CNTs) and graphenenanoplatelets (GNPs) with the addition of 1–10% weight percentage were prepared usingthe solution casting technique. The FESEM micrographs showed reasonable dispersionand established solid interfacial bonding between the PSU and both types of nanofillers(CNTs and GNPs). Notably, the developed composites (PSU-CNT and PSU-GNP) showedimproved thermal properties such as stability, conductivity, and expansion upon theaddition of CNTs and GNPs from 1 to 10 wt%. The thermal conductivity and glass transitiontemperature (Tg) of 10 wt% of PSU-CNT were 1.13 W/m·K and 250 ◦C, respectively, whichwere better than the 10% wt of PSU-GNPs (0.92 W/m·K and 240 ◦C), and there was anincrease of approximately 163% compared to pure PSU. In comparison, the compositewith 10 wt% CNTs in PSU possessed a more favourable combination of three-dimensionalinterconnected microstructure and thermal properties for thermal applications. Theseresults highlight the significance of the type, composition, and distribution of the nanofillerin the microstructural and thermal characteristics of the polymer nanocomposites. Hence,this study paves the way towards the design and development of promising polymercomposites with beneficial thermal properties to be used in niche applications.
Author Contributions: Conceptualization; A.S.H., M.A.E.; Methodology; A.S.H., M.A.E.; Valida-tion; A.S.H., S.A., H.M.I., K.R., M.A.E.; Formal analysis; A.S.H., M.A.E., H.M.I.; Investigation;A.S.H., S.A., H.M.I., K.R., T.N.B., M.A.E., M.S.T.; Resources; A.S.H., H.M.I., K.R., T.N.B., M.A.E.,M.S.T., S.A.; Data curation; A.S.H., S.A., H.M.I.; Writing—original draft preparation; H.M.I., A.S.H.;Writing—review and editing; A.S.H., S.A., K.R., T.N.B., M.A.E., M.S.T.; Visualization; A.S.H., M.A.E.,H.M.I.; Supervision; A.S.H.; Project administration; A.S.H., H.M.I., K.R., M.A.E.; Funding acquisition;A.S.H. All authors have read and agreed to the published version of the manuscript.
Funding: This research was funded by the Deanship of Scientific Research (DSR) at King FahdUniversity of Petroleum & Minerals (KFUPM).
Institutional Review Board Statement: Not applicable.
Informed Consent Statement: Not applicable.
Data Availability Statement: Not applicable.
Acknowledgments: The authors would like to acknowledge the support provided by the Deanshipof Scientific Research (DSR) at King Fahd University of Petroleum and Minerals (KFUPM), Dhahran,Saudi Arabia.
Conflicts of Interest: The authors declare no conflict of interest.
References1. Chen, H.; Ginzburg, V.V.; Yang, J.; Yang, Y.; Liu, W.; Huang, Y.; Du, L.; Chen, B. Thermal conductivity of polymer-based
composites: Fundamentals and applications. Prog. Polym. Sci. 2016, 59, 41–85. [CrossRef]2. Camargo, P.H.C.; Satyanarayana, K.G.; Wypych, F. Nanocomposites: Synthesis, structure, properties and new application
opportunities. Mater. Res. 2009, 12, 1–39. [CrossRef]3. Yang, Y. Thermal conductivity. In Physical Properties of Polymers Handbook, 2nd ed.; Mark, J.E., Ed.; Springer: New York, NY, USA,
2007; pp. 155–163.4. Hussain, A.R.J.; Alahyari, A.A.; Eastman, S.A.; Thibaud-Erkey, C.; Johnston, S.; Sobkowicz, M.J. Review of polymers for heat
exchanger applications: Factors concerning thermal conductivity. Appl. Therm. Eng. 2017, 113, 1118–1127. [CrossRef]5. Saba, N.; Jawaid, M. A review on thermomechanical properties of polymers and fibers reinforced polymer composites. J. Ind.
Eng. Chem. 2018, 67, 1–11. [CrossRef]6. Davis, A. Thermal stability of polysulphone. Die Makromol. Chem. Macromol. Chem. Phys. 1969, 128, 242–251. [CrossRef]7. Bose, S.; Kuila, T.; Nguyen, T.X.H.; Kim, N.H.; Lau, K.-T.; Lee, J.H. Polymer membranes for high temperature proton exchange
membrane fuel cell: Recent advances and challenges. Prog. Polym. Sci. 2011, 36, 813–843. [CrossRef]8. Sur, G.; Sun, H.; Lyu, S.; Mark, J. Synthesis, structure, mechanical properties, and thermal stability of some polysulfone/organoclay
nanocomposites. Polymer 2001, 42, 9783–9789. [CrossRef]9. Chlopek, J.; Rosol, P.; Morawska-Chochol, A. Durability of polymer-ceramics composite implants determined in creep tests.
Compos. Sci. Technol. 2006, 66, 1615–1622. [CrossRef]

Nanomaterials 2021, 11, 2080 12 of 13
10. Sohail, O.B.; Sreekumar, P.; De, S.; Jabarullah Khan, M.; Hakeem, A.; Alshaiban, A.A.; Al-Harthi, M.A. Thermal effect of ceramicnanofiller aluminium nitride on polyethylene properties. J. Nanomater. 2012, 2012, 87. [CrossRef]
11. Lu, X.; Xu, G. Thermally conductive polymer composites for electronic packaging. J. Appl. Polym. Sci. 1997, 65, 2733–2738.[CrossRef]
12. Raza, K.; Akhtar, S.S.; Arif, A.F.M.; Hakeem, A.S. Design of a Composite Encapsulation for Concentrated Photovoltaic SystemsWith Improved Performance. ASME Int. Mech. Eng. Congr. Expo. 2019. [CrossRef]
13. Raza, K.; Akhtar, S.S.; Arif, A.F.M.; Hakeem, A.S. Computational design and development of high-performance polymer-composites as new encapsulant material for concentrated PV modules. Sci. Rep. 2020, 10, 1–14. [CrossRef] [PubMed]
14. Schelling, P.K.; Shi, L.; Goodson, E. Managing heat for electronics. Mater. Today 2005, 8, 30–35. [CrossRef]15. Tyagi, M.; Tyagi, D. Polymer nanocomposites and their applications in electronics industry. Int. J. Electron. Electr. Eng. 2014,
7, 603–608.16. Wong, C.; Bollampally, R.S. Thermal conductivity, elastic modulus, and coefficient of thermal expansion of polymer composites
filled with ceramic particles for electronic packaging. J. Appl. Polym. Sci. 1999, 74, 3396–3403. [CrossRef]17. Khan, M.Y.; Khan, A.; Elsharif, A.M.; Helal, A.; Yamani, Z.; Hakeem, A.S. Mixed dimensional nanostructure (UiO66 decorated
MWCNT) as nanofiller in MMMs for enhanced CO2/CH4 separation. Chem. A Eur. J. 2021, 27, 11132–11140. [CrossRef] [PubMed]18. Yu, J.; Cennini, G. Improving thermal conductivity of polymer composites in embedded LEDs systems. Microelectron. J. 2014,
45, 1829–1833. [CrossRef]19. Zahir, M.H.; Helal, A.; Hakeem, A.S. Hybrid polyMOF materials prepared by combining an organic polymer with a MOF and
their application for solar thermal energy storage. Energy Fuels 2021, 35, 10199–10209. [CrossRef]20. Tessema, A.; Zhao, D.; Moll, J.; Xu, S.; Yang, R.; Li, C.; Kumar, S.K.; Kidane, A. Effect of filler loading, geometry, dispersion and
temperature on thermal conductivity of polymer nanocomposites. Polym. Test. 2017, 57, 101–106. [CrossRef]21. Gu, J.; Meng, X.; Tang, Y.; Li, Y.; Zhuang, Q.; Kong, J. Hexagonal boron nitride/polymethyl-vinyl siloxane rubber dielectric
thermally conductive composites with ideal thermal stabilities. Compos. Part A Appl. Sci. Manuf. 2017, 92, 27–32. [CrossRef]22. Weidenfeller, B.; Höfer, M.; Schilling, F.R. Thermal conductivity, thermal diffusivity, and specific heat capacity of particle filled
polypropylene. Compos. Part A Appl. Sci. Manuf. 2004, 35, 423–429. [CrossRef]23. Yang, Y.; Wang, P.; Zheng, Q. Preparation and properties of polysulfone/TiO2 composite ultrafiltration membranes. J. Polym. Sci.
Part B Polym. Phys. 2006, 44, 879–887. [CrossRef]24. Weidenfeller, B.; Höfer, M.; Schilling, F. Thermal and electrical properties of magnetite filled polymers. Compos. Part A Appl. Sci.
Manuf. 2002, 33, 1041–1053. [CrossRef]25. Zhao, Y.-H.; Zhang, Y.-F.; Bai, S.-L.; Yuan, X.-W. Carbon fibre/graphene foam/polymer composites with enhanced mechanical
and thermal properties. Compos. Part B Eng. 2016, 94, 102–108. [CrossRef]26. Yang, S.-Y.; Lin, W.-N.; Huang, Y.-L.; Tien, H.-W.; Wang, J.-Y.; Ma, C.-C.M.; Li, S.-M.; Wang, Y.-S. Synergetic effects of graphene
platelets and carbon nanotubes on the mechanical and thermal properties of epoxy composites. Carbon 2011, 49, 793–803.[CrossRef]
27. Hong, J.; Lee, J.; Jung, D.; Shim, S.E. Thermal and electrical conduction behavior of alumina and multiwalled carbon nanotubeincorporated poly (dimethyl siloxane). Thermochim. Acta 2011, 512, 34–39. [CrossRef]
28. Takenaka, K.; Ichigo, M. Thermal expansion adjustable polymer matrix composites with giant negative thermal expansion filler.Compos. Sci. Technol. 2014, 104, 47–51. [CrossRef]
29. Takenaka, K. Negative thermal expansion materials: Technological key for control of thermal expansion. Sci. Technol. Adv. Mater.2012, 13, 013001. [CrossRef]
30. Hu, N.; Jia, B.; Arai, M.; Yan, C.; Li, J.; Liu, Y.; Atobe, S.; Fukunaga, H. Prediction of thermal expansion properties of carbonnanotubes using molecular dynamics simulations. Comput. Mater. Sci. 2012, 54, 249–254.
31. Hu, C.; Li, Z.; Wang, Y.; Gao, J.; Dai, K.; Zheng, G.; Liu, C.; Shen, C.; Song, H.; Guo, Z. Comparative assessment of the strain-sensing behaviors of polylactic acid nanocomposites: Reduced graphene oxide or carbon nanotubes. J. Mater. Chem. C 2017,5, 2318–2328. [CrossRef]
32. Balandin, A.A.; Ghosh, S.; Bao, W.; Calizo, I.; Teweldebrhan, D.; Miao, F.; Lau, C.N. Superior thermal conductivity of single-layergraphene. Nano Lett. 2008, 8, 902–907. [CrossRef]
33. Han, Z.; Fina, A. Thermal conductivity of carbon nanotubes and their polymer nanocomposites: A review. Prog. Polym. Sci. 2011,36, 914–944. [CrossRef]
34. Martin-Gallego, M.; Bernal, M.; Hernandez, M.; Verdejo, R.; López-Manchado, M.A. Comparison of filler percolation andmechanical properties in graphene and carbon nanotubes filled epoxy nanocomposites. Eur. Polym. J. 2013, 49, 1347–1353.[CrossRef]
35. Díez-Pascual, A.M.; Ashrafi, B.; Naffakh, M.; González-Domínguez, J.M.; Johnston, A.; Simard, B.; Martinez, M.T.; Gómez-Fatou,M.A. Influence of carbon nanotubes on the thermal, electrical and mechanical properties of poly (ether ether ketone)/glass fiberlaminates. Carbon 2011, 49, 2817–2833. [CrossRef]
36. Kim, H.S.; Jang, J.-U.; Yu, J.; Kim, S.Y. Thermal conductivity of polymer composites based on the length of multi-walled carbonnanotubes. Compos. Part B Eng. 2015, 79, 505–512. [CrossRef]
37. Ma, P.-C.; Siddiqui, N.A.; Marom, G.; Kim, J.-K. Dispersion and functionalization of carbon nanotubes for polymer-basednanocomposites: A review. Compos. Part A Appl. Sci. Manuf. 2010, 41, 1345–1367. [CrossRef]

Nanomaterials 2021, 11, 2080 13 of 13
38. Kotov, N.A. Materials science: Carbon sheet solutions. Nature 2006, 442, 254. [CrossRef]39. Zhang, Y.-F.; Zhao, Y.-H.; Bai, S.-L.; Yuan, X. Numerical simulation of thermal conductivity of graphene filled polymer composites.
Compos. Part B Eng. 2016, 106, 324–331. [CrossRef]40. Kuilla, T.; Bhadra, S.; Yao, D.; Kim, N.H.; Bose, S.; Lee, J.H. Recent advances in graphene based polymer composites.
Prog. Polym. Sci. 2010, 35, 1350–1375. [CrossRef]41. Liao, Q.; Liu, Z.; Liu, W.; Deng, C.; Yang, N. Extremely high thermal conductivity of aligned carbon nanotube-polyethylene
composites. Sci. Rep. 2015, 5, 16543. [CrossRef] [PubMed]42. Du, J.; Bai, J.; Cheng, H. The present status and key problems of carbon nanotube based polymer composites. Express Polym. Lett.
2007, 1, 253–273. [CrossRef]43. Ionita, M.; Pandele, A.M.; Crica, L.; Pilan, L. Improving the thermal and mechanical properties of polysulfone by incorporation of
graphene oxide. Compos. Part B Eng. 2014, 59, 133–139. [CrossRef]44. Vidakis, N.; Petousis, M.; Tzounis, L.; Velidakis, E.; Mountakis, N.; Grammatikos, S.A. Polyamide 12/multiwalled carbon
nanotube and carbon black nanocomposites manufactured by 3D printing fused filament fabrication: A comparison of theelectrical, thermoelectric, and mechanical properties. C 2021, 7, 38.
45. Tzounis, L.; Pegel, S.; Zafeiropoulos, N.E.; Avgeropoulos, A.; Paipetis, A.S.; Stamm, M. Shear alignment of a poly (styrene-butadiene-styrene) triblock copolymer/MWCNT nanocomposite. Polymer 2017, 131, 1–9. [CrossRef]
46. Raza, K.; Siddiqui, M.U.; Arif, A.F.M.; Akhtar, S.S.; Hakeem, A.S. Design and development of thermally conductive hybridnano-composites in polysulfone matrix. Polym. Compos. 2019, 40, 1419–1432. [CrossRef]
47. Balandin, A.A. Thermal properties of graphene and nanostructured carbon materials. Nat. Mater. 2011, 10, 569. [CrossRef][PubMed]
48. Zabihi, Z.; Araghi, H. Effect of functional groups on thermal conductivity of graphene/paraffin nanocomposite. Phys. Lett. A2016, 380, 3828–3831. [CrossRef]
49. Nan, C.-W.; Liu, G.; Lin, Y.; Li, M. Interface effect on thermal conductivity of carbon nanotube composites. Appl. Phys. Lett. 2004,85, 3549–3551. [CrossRef]
50. Shenogin, S.; Xue, L.; Ozisik, R.; Keblinski, P.; Cahill, D.G. Role of thermal boundary resistance on the heat flow in carbon-nanotubecomposites. J. Appl. Phys. 2004, 95, 8136–8144. [CrossRef]
51. Kemaloglu, S.; Ozkoc, G.; Aytac, A. Properties of thermally conductive micro and nano size boron nitride reinforced siliconrubber composites. Thermochim. Acta 2010, 499, 40–47. [CrossRef]
52. Verdejo, R.; Bernal, M.M.; Romasanta, L.J.; Lopez-Manchado, M.A. Graphene filled polymer nanocomposites. J. Mater. Chem.2011, 21, 3301–3310. [CrossRef]
53. Nayak, L.; Rahaman, M.; Khastgir, D.; Chaki, T. Thermal and electrical properties of carbon nanotubes based polysulfonenanocomposites. Polym. Bull. 2011, 67, 1029. [CrossRef]