DESIGN, DEVELOPMENT AND EVALUATION OF ORAL CONTROLLED DRUG...
226
DESIGN, DEVELOPMENT AND EVALUATION OF ORAL CONTROLLED DRUG DELIVERY SYSTEM (FOR ACECLOFENAC, AN ANTI-INFLAMMATORY DRUG) Thesis Submitted To THE TAMILNADU Dr. M.G.R. MEDICAL UNIVERSITY, GUINDY, CHENNAI-600-032 In partial fulfillment of the requirement for the award of the degree of DOCTOR OF PHILOSOPHY FACULTY OF PHARMACY Submitted by K.MASILAMANI, M.Pharm Under the supervision of PROF. Dr.V. RAVICHANDIRAN, M.Pharm., Ph.D., PRINCIPAL Vels College of Pharmacy Velan Nagar Pallavaram, Chennai-600117 Tamilnadu, India MARCH 2012
Transcript of DESIGN, DEVELOPMENT AND EVALUATION OF ORAL CONTROLLED DRUG...

DESIGN, DEVELOPMENT AND EVALUATION OF ORAL
CONTROLLED DRUG DELIVERY SYSTEM
(FOR ACECLOFENAC, AN ANTI-INFLAMMATORY DRUG)
Thesis Submitted To
THE TAMILNADU Dr. M.G.R. MEDICAL UNIVERSITY, GUINDY,
CHENNAI-600-032
In partial fulfillment of the requirement for the award of the degree of
DOCTOR OF PHILOSOPHY
FACULTY OF PHARMACY
Submitted by
K.MASILAMANI, M.Pharm
Under the supervision of
PROF. Dr.V. RAVICHANDIRAN, M.Pharm., Ph.D.,
PRINCIPAL
Vels College of Pharmacy
Velan Nagar
Pallavaram, Chennai-600117
Tamilnadu, India
MARCH 2012

DECLARATION
This is to certify that the thesis, entitled “Design, development and evaluation of oral
controlled drug delivery system (for Aceclofenac, an Anti-inflammatory drug)” is
submitted to The Tamilnadu Dr. M.G.R. Medical University, Chennai in partial
fulfillment of the requirements for the award of degree of Doctor of Philosophy is the
record of original research work done by me under the guidance and supervision of
Prof. Dr. V. Ravichandiran, Principal, Vels College of Pharmacy, Pallavaram,
Chennai-600117 for the academic year 2008 – 2012 and the thesis has not formed the
basis for the award of any Degree, Diploma, Associateship, Fellowship or other similar
title.
Date:
Place : K.MASILAMANI

Prof. Dr. V. Ravichandiran., M.Pharm., Ph.D.,
Principal and Guide
Vels College of Pharmacy
Velan Nagar
Pallavaram, Chennai – 600117
Tamil Nadu, India
CERTIFICATE
This is to certify that the thesis entitled “Design, development and evaluation of oral
controlled drug delivery system (for Aceclofenac, an Anti-inflammatory drug)” is
submitted to The Tamilnadu Dr. M.G.R. Medical University, Chennai in partial
fulfillment of the requirements for the award of degree of Doctor of Philosophy is the
record of original research work done by Mr. K.Masilamani, M.Pharm., for the
academic year 2008 – 2012 under my supervision and guidance and the thesis has not
formed the basis for the award of any degree, diploma, associateship, fellowship or
other similar title.
Date:
Place: Prof. Dr. V. RAVICHANDIRAN

ACKNOWLEDGEMENT
“The joy, satisfaction and euphoria that come along with the successful
completion of any work would be incomplete unless we mention the names of the
people who made it possible, whose constant guidance and encouragement served as a
beam of light and crowned our efforts.”
First and foremost I would like to thank my adorable project guide
Prof. Dr. V. Ravichandiran, M.Pharm., Ph.D., Principal, Vels College of Pharmacy for
his valuable guidance, constructive criticism, constant encouragement and intelligent
decisions made my work easy. It is my privilege to express my deep sense of gratitude
to my Chairman, Dr. Ishari Ganesh, Vels College of Pharmacy, Pallavaram, Chennai.
No words can substitute the timely help and valuable suggestions extended by
Dr. K. Chinnasamy during the course of my work.
My heartful thanks to Dr. A. Nirmala, R. Vishnuvardh, R. Ajitha Nayac for
their kind support throughout the study.
My heartful of thanks to Dr.M.Thamizhmozhi, Principal, Aadhibagawan
college of pharmacy, Cheyyar for his mentorship, innovative ideas, constant inspiration
and encouragement for successful completion of this work.
I would like to express my deep sense of gratitude to Dr. S.Satheshkumar,
Professor and Head, Dept of Pharmaceutics, Vels university for his supported during
my course tenure report.
I express my gratitude to Dr. J. Anbu, Head, Department of Pharmacology,
Dr. K.F.H. Nazeer Ahamed, Department of Pharmacology, Vels University, Chennai
and Mr.V.Kamalakannan, QA manager, Caplin Point, Pondicherrry without whose
support my work would not be completed.
I would like to place on record my deepest gratitude to Mr. V. Lavakumar,
Mr.N.Venkatesh, Mr.P.Balaji , P.Saravanakumar, Vidyabhushan, Sathishkumar,
SK.Fakruddin and R.Harish Kumar for their moral support during my project work.

I would like to make sincere thanks to Mr.B.Senthilnathan, Mrs.T.Saraswathi,
Mr.Sampath, Mrs.M.Sumithra and Mrs.A.Vijayalakshmi for their help and support to
carry out my project work.
I would like to thank my friends Mrs.S.Abirami, Mrs. M.Charumathi,
Mrs.M.Shobana and Mr. E.Nagarajan for their motivation and encouragement for
carrying out my project.
I would like to express my thanks to my uncle Mr.Suresh Natarajan and
Mr.A.Sivakumar for their encouragement.
I would like to thank all faculty members and the non-teaching staff of Vels
College of Pharmacy, Chennai, for their scholarly guidance and constant
encouragement for carrying out this work successfully.
Last but not the least, I express my sincere thanks to one and all and also to
those whom I might have missed to mention, for contributing their help directly and
indirectly for successful completion of this work.
(K.MASILAMANI)

List of Abbreviations Used
bid - twice daily
0C - degree celsius
Cm - Centimeter
DSC - Differential Scanning Calorimetry
EC - Ethyl cellulose
eg - Example
FT-IR - Fourier transform infra red
HCl - Hydrochloric acid
hr - Hours
KBr - Potassium bromide
kg - Kilogram
L - Litre
µg - Microgram
µL - Microlitre
µg - Microgram
MEC - Minimum Effective Concentration
mg - milligram
MTC - Maximum Therapeutic Concentration
min - Minutes
mL - Millilitre
mV - milliVolt
NS - Nanosuspension
NaOH - Sodium hydroxide
NS - Nanosuspension
NP - Nanoparticle
OCDDS - Oral controlled drug delivery systems
OT - Osmotic tablets
PMMA - polymethy (methacryalic acid)
rpm - revolution per minute
SD - Standard deviation
S.E.M - Standard error mean
V/V - Volume / Volume

W/V - Weight / Volume
W/W - Weight / Weight
MLBG - modified locust bean gum
% - Percentage

CCOONNTTEENNTTSS CHAPTER
NO.
CONTENTS
PAGE NO
1
INTRODUCTION 01
Oral controlled drug delivery systems 01
Osmotic drug delivery systems 07
Microspheres 15
Nanosuspension 24
Inflammation and anti-inflammatory drugs 31
2 AIM AND OBJECTIVES 37
3 LITERATURE REVIEW 39
4 PLAN OF WORK 61
5 DRUG AND ADDITIVES PROFILE 63
6 MATERIALS AND EQUIPMENTS 77
7 PREFORMULATION STUDIES 80
8
ACECLOFENAC OSMOTIC TABLETS 87
Methods 87
Results and Discussion 90
9
ACECLOFENAC MICROSPHERES 100
Methods 100
Results and Discussion 104
10
ACECLOFENAC NANOSUSPENSION 113
Methods 116
Results and Discussion 118
11
PHARMACOLOGICAL STUDIES 137
Anti-inflammatory studies 137
Anti-arthritic model 138
Gastrointestinal tolerability studies 138
12 STABILITY STUDIES 146
13 SUMMARY AND CONCLUSION 150
14 BIBLIOGRAPHY 158
15 PUBLICATIONS 184

LIST OF FIGURES
S.No PARTICULARS Fig.No
1 Hypothetical plasma concentration-time profile curve of
conventional, SR and CR formulatlions
1.1
2 Basic model of osmotic pressure powered drug delivery
system
1.2
3 Push pull osmotic pump 1.3
4 Controlled porosity pump 1.4
5 Structure of aceclofenac 5.1
6 UV spectra of Aceclofenac 7.1
7 IR spectra 7.2 to 7.30
8 DSC thermograms 7.31 to
7.58
9 Standard graph of aceclofenac in pH 1.2 buffer 7.59
10 Standard graph of aceclofenac in pH 6.8 buffer 7.60
11 Standard graph of aceclofenac in pH 7.4 7.61
12 Percentage cumulative drug release of osmotic tablets
containing aceclofenac(0T1-OT4)
8.1
13 Percentage cumulative drug release of osmotic tablets
containing aceclofenac(0T5-OT8)
8.2
14 Percentage cumulative drug release of osmotic tablets
containing aceclofenac(0T9-OT13)
8.3
15 Percentage cumulative drug release of osmotic tablets
containing aceclofenac(0T10))
8.4
16 Release kinetics of osmotic tablets containing
aceclofenac (OT10)-Higuchi model
8.5
17 Release kinetics of osmotic tablets containing
aceclofenac (OT10)-korsemayer model
8.6
18 Particle size of aceclofenac microspheres formulations 9.1
19 Drug content of aceclofenac microspheres formulations 9.2
20 Entrapment efficiencies of aceclofenac microspheres 9.3
formulations
21 SEM picture of M4 formulation 9.1
22 SEM picture of M5 formulation 9.2
23 SEM picture of M13 formulation 9.3
24 In vitro release profile of aceclofenac from microspheres-
cumulative drug release Vs Time in hrs
9.4
25 Higuchi model 9.5
26 Korse mayer model 9.6
27 Nanosuspensions of aceclofenac 10.1
28 SEM phots OF F-14BYM, F-15BYH, F-23CYM & F-
24CYH
10.2
29 Particle size of formulation of aceclofenac
nanosuspension
10.3
30 Zeta potential of nanosuspensions of aceclofenac- F-
14BYM
10.4
31 Zeta potential of nanosuspensions of aceclofenac- F-
15BYH
10.5
32 Zeta potential of nanosuspensions of aceclofenac- F-
23CYM
10.6
33 Zeta potential of nanosuspensions of aceclofenac- F-
24CYH
10.7
34 Percentage drug content of aceclofenac nanosuspension
formulation
10.8
35 Percentage entrapment efficiency of aceclofenac
nanosuspension formulation
10.9
36 Cumulative drug release Vs time in hrs for optimized
trials
10.10
37 Cumulative drug release Vs time in hrs for F-14BYM 10.11
38 Higuchi model for optimized trials 10.12
39 Higuchi model for F-14BYM 10.13
40 Koresemayer peppas 10.14
41 Effect of aceclofenac loaded nanosuspension and
microspheres on paw value thikness in rats with
11.1

carrageenan
42 FA induced inflammatory score day 14 11.2
43 FA induced inflammatory score day 21 11.3
44 Macroscopical view of stomach of the rats treated with
control & standard
11.4
45 Macroscopical view of stomach of the rats treated with
aceclofenac nanosuspension
11.5
46 Macroscopical view of stomach of the rats treated with
aceclofenac microsphers.
11.6
LIST OF TABLES
TABLE NO PARTICULARS PAGE NO
1.1. Application of osmotic drug delivery system 14
1.2. Application of microspheres in drug delivery 23
1.3. Applications of nanosuspension 30
1.4 Classification of NSAIDs 36
6.1 Materials used 77
6.2 Equipments used 78
7.1 Physical characteristics of Aceclofenac 83
7.2 Concentration and absorbance of aceclofenac in
pH 1.2, pH 6.8 and pH 7.4 85
8.1 Formulalation of aceclofenac osmotic tablets 87
8.2 Formulalation of aceclofenac osmotic tablets 88
8.3 Precompression parameters of granules 90
8.4 Results of thickness, hardness, friability of
aceclofenac osmotic tablets
91
8.5 Results of average weight and drug content 92

8.6 In vitro drug release profile of aceclofenac
osmotic tablets (OT1-OT4)
93
8.7 In vitro drug release profile of aceclofenac
osmotic tablets (OT5-OT8)
93
8.8 In vitro drug release profile of aceclofenac
osmotic tablets (OT9-OT13)
94
9.1 Polymer mix eudragit L100:PLGA 100
9.2 Formulation of aceclofenac microspheres 101
9.3 Flow property studies of aceclofenac
microspheres
104
9.4 Mean particle size, drug content and entrapment
efficiency (M1-M15)
106
9.5 Cumulative drug release M4, M5, M13 109
10.1 Formulation of aceclofenac nanosuspension 113
10.2 Formulation of aceclofenac nanosuspension 114
10.3 Formulation of aceclofenac nanosuspension 115
10.4 Optimization of aceclofenac nanosuspension
formulation
121
10.5 Particle size analysis of aceclofenac suspension 123
10.6 Zeta potential values of optimized formulation 126
10.7 Drug content(%) of aceclofenac nanosuspension 129
10.8 Entrapment efficiency of aceclofenac
nanosuspension
131
10.9 Drug release data of aceclofenac nanosuspension 133
12.1 Stability studies of osmotic tablet containing
aceclofenac (OT-10) AT TEMP.40°C/RH75%
146

12.2 Stability studies of osmotic tablet containing
aceclofenac (OT-10) AT TEMP.40°C/RH75%
drug release
147
12.3 Stability Studies of Aceclofenac microspheres
(M4)
148
12.4 Stability Studies of Aceclofenac Nanosuspension
(F-14BYM)
148

1
1. INTRODUCTION
ORAL CONTROLLED DRUG DELIVERY SYSTEMS
Oral drug delivery is the most common and frequently used system to deliver drugs
and gained more attention because of its flexibility in designing the dosage form when
compared to other routes. Oral route is one of the most suitable, convenient, safe,
economic and effective way to deliver the drug1.
For maintaining drug concentration in blood within the therapeutic window, the
conventional dosage forms needed to be taken several times a day. This results in
significant fluctuations of drug level in blood and thus producing poor therapeutic efficacy,
toxicity and unwanted side effects2.
The goal of any newer drug delivery system is to release the desired amount of
drug at the target site in the body. Two parameters have to be considered for the drug
delivery system, one is the time which the drug is released from the dosage form and the
other is the quantity of the drug which is released. Conventional system fails to control
these two parameters.
The problems associated with conventional formulations are
i) The dose missed may lead to poor patient compliance
ii) Maintenance of steady state is difficult
iii) Possibility of side effects
In terms of sustained or controlled systems the drug is released in a predetermined
rate for specified time duration.
The novel controlled drug delivery systems provide beneficial in patients with
chronic illness, while conventional system have little or no control over drug release and
leads to patient non-compliance.

2
Fig.1.1 Hypothetical Plasma Concentration –
Time profile curve of Conventional, SR and CR formulations.
The above figure clearly depicts that,
Multiple dosing of conventional formulation may not produce steady state
concentration; it may cross sub-therapeutic or toxic level easily.
SR produces long lasting effect, but in certain cases less than therapeutic level.
CR produces constant level of drug concentration throughout the treatment period
In order to overcome the drawbacks of conventional drug delivery systems, several
technical advancements have been led to the development of controlled drug delivery
system that could revolutionize the therapeutic regimen and provide a number of
therapeutic benefits.
Controlled drug delivery systems are the one which delivers the active medicament
at predetermined rate for a specified time period.
Conventional, fast dissolving, sustained or controlled delivery of drugs can also be
achieved through oral route. Biological half-life is the major parameter which an R& D
person has to look up to design a sustained or controlled drug delivery.
3
Need for Controlled Oral Drug Delivery Systems:
The development of controlled release systems by oral route will lead to:
Improved patient convenience due to less frequency of drug administration.
Minimized fluctuation and maintains steady-state levels of drug
concentration in blood.
More consistent and prolonged therapeutic effect.
Decreased intensity of adverse effects and toxicity.
Maximum drug utilization resulting in reduction of total quantity of doses.
Improved bioavailability of drugs.
A greater selectivity of pharmacological activity.
Reduction in health care costs.
Ideal characteristics of drugs to design as controlled drug delivery3:
The drug should possess half-life within the range of 2-8 hrs.
Drugs possessing wide therapeutic index.
Drugs which require enhanced bioavailability.
The drug to be loaded in the dosage form should be less than 1gm.
Disease conditions which the controlled release is required.
Reduction in cost due to overall reduction in dose of the drug.
Drugs possessing side effects in conventional therapy.
A common dose of the drug must be useful for larger population, rather
than individualized dose requirement.
Usually controlled release systems are designed to release the drug for a period of
12hr to 24hr but in some cases it may be designed to release for several days also.
Advantages of oral controlled release systems:
Therapeutically it reduces the drug plasma level fluctuation and maintains
steady plasma level over the specified period of time.
Reduction in adverse effects.

4
Usually adverse effects arise when the drug crosses the maximum
therapeutic level or toxic level. This usually happens in conventional dosage
forms. In controlled delivery, drug is maintained within therapeutic
window. Reduction in drug quantity by designing CR also holds
responsibility for reduction in side effects.
Reduction in dosing frequency which may solve patient problems
For better tolerability of some drugs in vivo – E.g. Rivastigmine tartrate4
Cost effective
Disadvantages of Controlled Release Delivery System:
Difficult to achieve in vitro-in vivo correlations
In some cases burst release may produce dose dumping
Patient education is needed to avoid crushing / breaking of CR systems
High cost due to utilization of advanced technologies for their
manufacturing.
Factors influencing design of oral controlled release products:
To make a dosage form successful it is important prerequisite to monitor the
following factors carefully.
The physicochemical properties can be studied through in vitro studies and
biological properties can be studied through in vivo studies.
FACTORS INFLUENCING DESIGN OF CR
A) PHYSICOCHEMICAL FACTORS B) BIOLOGICAL FACTORS
Solubility
Partition coefficient
Molecular size
Stability
pKa
Absorption
Distribution
Metabolism
Half life
Toxicity
Dose size

5
MECHANISM OF ORAL CONTROLLED RELEASE:
The mechanisms of oral controlled release are as follows:
i) Diffusion
ii) Dissolution
iii) Diffusion and Dissolution
iv) Osmosis
v) Ion-exchange resin
(i) Diffusion Controlled Systems:
In these systems, the drug release rate is determined by diffusion through a water
insoluble polymer. The diffusion devices may be of reservoir or matrix. In reservoir type a
core of active medicament is surrounded by a polymeric membrane. Fick’s first law of
diffusion is applicable for this type5. Coating materials like gelatin, celluloses, PMMA,
HPC, PVA may be used to design reservoir type6. In matrix type the dissolved or dispersed
drug is distributed uniformly throughout the polymer. This type follows Higuichi model.
(ii) Dissolution controlled systems:
In these systems dissolution of the therapeutic agent is controlled by coating the
drug by encapsulating substances like polymer which shows slow release. The release time
can be altered by governing the control of polymeric coating layers7. These systems may
be encapsulated or matrix products.
(iii) Dissolution & diffusion controlled release system:
Drug is surrounded by a partially soluble membrane. Pores to release the drug are
formed by dissolution. The pores, only permits water to entry into it. From the pores the
drug is diffused out. Drug release rate is calculated by8
Release rate = AD(Cc-Cd)/L
Where A= Surface area
D = diffusion coefficient of drug through pore in coating
L = diffusion path length
Cc = concentration of drug in the core
Cd = concentration in the dissolution medium

6
(iv) Osmosis:
Osmosis is one of the effective mechanisms to achieve oral controlled release.
Usually osmotic systems have 3 components namely osmogen, semi-permeable membrane
and delivery orifice9. The semi-permeable membrane allows water inside the core, but
doesn’t allow the drug to come out. Osmotic agent creates osmotic pressure which induces
the diffusion of drug in controlled manner through the delivery orifice.
(v) Ion-Exchange Resins:
In this system drug is released by exchange of drug ions attached with the resin by
the ions of dissolution media. The driving force required for exchange of ions may be
derived from electrostatic interactions. Opposite charged resin may suit the attachment for
the drug with the resin.
Currently available oral controlled drug delivery systems are osmotic tablets,
floating tablets, matrix tablets, colonic release, plastic matrices, ion exchange resin tablets,
film coated tablets, enteric coated and delayed release tablets, swellable tablets,
mucoadhesive tablets, multiple unit tablets, repeat action tablets, floating capsules,
microgranules, spheroids, beads, pellets, microcapsules, microspheres and nanoparticles.
Polymers in the preparation of oral controlled drug delivery systems10
:
Polymers are macromolecules comprising of small molecular units named
monomers. These monomers are linked to form linear polymers, branched polymers or
cross linked polymers. The biodegradable polymers can be defined as polymers comprised
of monomers linked to one another through functional groups and have unstable linkages.
They are biologically degraded or eroded by enzymes.
In the preparation of controlled release dosage forms, the polymer acts as a carrier
for drug which aids in achieving controlled and targeted drug delivery. The polymers used
should be inert, non-toxic and easy to fabricate.

7
ORAL OSMOTIC SYSTEMS:
The rate and extent of drug absorption generally depends on various factors such as
physicochemical properties of the drug, presence of excipients, etc. Physiological
parameters which influence drug concentration include presence/absence of food, pH of
GIT, GI motility, pH of stomach etc11
.
Therapeutic agents can be effectively delivered in a controlled pattern over a long
period of time by osmotic drug delivery systems.
Interestingly, this system is pH independent and other physiological parameters and
hence regulates the release by optimizing the properties of drug and systems.
Merits of Osmotic drug delivery systems12,13
:
Provides ease in formulation with simple operational procedures
Ensures better compliance with reducing dose intervals
Drug release is independent of gastric pH, food etc.
Follows zero-order rate in delivery
Delayed or pulsed delivery possible
Predictable and programmable delivery rate
Drugs of varying solubility can be easily incorporated
Food interaction is minimal
Disadvantages:
High cost
Dose dumping
Principle of Osmosis:
It is a phenomenon which a solvent molecule travels from lower concentration part
to higher concentration part across a semipermeable membrane.
The effect of osmosis was first reported by Abbe Nollet, in 1748, but Pfeffer
reported the osmotic effect by using a selectively permeable membrane to water however
impermeable to solute, which showed separation of sugar solution from pure water14
.
Vant’Hoff established the analogy between the Pfeffer results and the ideal gas laws by the
expression15
.

8
Π = n2RT
Where, n = molar concentration of solute in solution
R= gas constant
T = Absolute temperature
Fig 1.2. Osmotic pressure delivery system
Criteria to be followed to achieve zero order release:
Amount of osmogen used should be sufficient to maintain saturated solute
in osmotic agent compartment
Osmotic activity of the environment to be either a constant or negligibly
small
Osmotic reflux coefficient should be constant or very close to unity, which
means ideally a semipermeable membrane, selectively permeable to water
but not to osmotic drug to be used
Delivery orifice to be made sufficiently large and highly deformable
partition should be used
Steps involved in release of drug from an osmotic delivery system:
In general, the release of the drug from an osmotic pump occurs in three stages
Movement of solvent across a semi-permeable membrane from lower
concentration of solute to higher concentration of solute.
Development of osmotic pressure inside the osmotic system
Pumping out of drug solution/suspension through the delivery orifice in
controlled manner

9
Factors affecting rate of drug release:
The major factors which affect the rate of drug release from the osmotic drug
delivery systems are drug solubility, osmotic pressure, orifice size and semipermeable
membrane.
Basic components of osmotic pumps:
The components required for formulation of osmotic pumps are drug, osmogens,
semipermeable membrane, polymers, wicking agents, surfactants, coating solvents,
plasticizers, flux regulators and pore formers16
.
i) Drug and Osmogen:
Sometimes drug may act as an osmogen and may show good aqueous solubility.
Usually drug in salt form is more soluble than the parent drug. If drug does not possess
osmogenic property, osmotic salt and other sugar may be added to formula. An ideal
osmogen should possess osmotic activity and aqueous solubility. Examples are NaCl, KCl,
NaHCO3, methylcellulose etc.
ii) Semipermeable membrane:
The unique property of semipermeable membrane utilized for osmotic pump is that
it permits only movement of water into system, and hence effectively isolates the
dissolution process from GI environment.The increased permeability would be achieved by
ideal membrane material.
Cellulose acetate is most commonly employed as a semipermeable membrane for
preparation of osmotic pumps. Other examples include agar acetate, amylasetriacetate,
polyacetals, polyglycolic acid, poly lactic acids etc17
.
iii) Hydrophilic/Hydrophobic polymers:
Polymers are mainly incorporated in the formula of osmotic systems containing
matrix core. Selection of polymer is based on solubility of drug as well as amount and
release rate of drug from pump.
Eg. Ethyl cellulose, HPMC, wax materials, CMC etc18
.

10
iv) Wicking agents:
It is an agent with capacity to absorb water into porous system of a delivery device.
The main function of this agent is to draw water inside the surface of tablet core, thereby
creating network of amplified surface area.
Eg. Colloidal silicon dioxide, kaolin, titanium dioxide, alumina, SLS etc19
.
v) Surfactants:
Surfactants are substances which are added to wall forming agents20
. They act by
regulating energy of materials to improve their blending and helps in maintaining integrity
in environment during drug release time period.
Eg. Polyoxethylenated glyceryl retinoleate, polyoxyethylenated castor oil, poly ethylene
oxide, glyceryl laureates etc.
vi) Coating solvents:
Inert inorganic and organic solvents are used for manufacturing the wall of osmotic
device for making polymeric solution.
Eg. Methylene chloride, methanol, acetone, IPA, ethyl acetate, cyclohexane etc.
vii) Plasticizers:
Plasticizers are used to increase permeability of membrane, by increasing water
diffusion co-efficient. Film forming properties of polymers can also be enhanced by
addition of plasticizers and low molecular weight diluents. Plasticizer converts hard and
brittle polymer to soft and pliable material and hence mechanically more strength.
Eg. Dialkyl phthalate, trioctyl Po4, alkyl adipates, triethyl citrate and other citrates21
.
viii) Flux regulators:
These are agents added to wall forming materials, thereby assist to regulate, fluid
permeability through membrane.
Eg. Polyalkylene glycols, polybutylene, polypropylene, polyamylene etc.
ix) Pore formers:
Pore forming agents are the substances which are added in the coating material to
form pores when they come in contact with water. CPOP are designed to release the drug
with the help of pores formed by pore forming agents22
.
Eg. PEG 400, diethyphthalate, mannitol

11
Osmotic pumps classification:
i) Single chamber osmotic pumps:
Elementary osmotic pump (EOP):
EOP is the simplest version of osmotic pump which does not require any special
technology or equipment. This consists of moderately water soluble drug with or without
an osmotic agent in a single layered core, walled by a semipermeable membrane23
. When
swallowed, water from GIT enters core via membrane, dissolving the drug and the
solubilized drug is pumped via the exit orifice. This is a continuous phenomenon; the drug
is completely dissolved and pushed out, but at a declined rate. It delivers about 60-80%
content at a systematic and constant rate with time lag of 30 – 60 minutes.

12
ii) Multichambered Types:
a) Push Pull Osmotic Pump (PPOP):
It is modified version of EOP. This system facilitates delivery of poorly as well as
highly water soluble drugs at constant rate. This system has two layers one is push layer
and another is pull layer. Drug is present in pull layer. The push layer consists of
polymeric osmogen with other additives which has the ability to form drug suspension in
situ24
. These layers bonded together by compression and result in single bilayered core.
Further the tablet core is coated with semipermeable membrane; followed by a hole which
is drilled on the medicament side of the tablet. When placed in water, the osmotic
attraction pulls water into compartment to form drug suspension in situ. The same occurs
in non-drug layer and results in volumetric expansion causing push of drug suspension out
of delivery orifice.
b) Osmotic pump with non-expanding second chamber:
This contains two compartments, in which the first one contains the drug and the
second compartment is intended for the exapandable biologically inert osmogenic agent.
Both the compartments are connected with a hole17
. When water enters, solution of
osmotic agent resulted in first chamber passes to the drug chamber via connecting hole and
mixes with drug solution leaving device via microporous membrane present in the walls of
the chamber. This type is useful to deliver insoluble drugs.
iii) Other special types:
a) Controlled porosity osmotic pumps (CPOP):
In CPOP drug with osmogen and other additives are compressed and coated with
semipermeable membrane along with a pore forming material. The specialty of the system

13
is there is no special drilling required. The drug is released due to the formation of pores
by pore forming agents.
The orifice in CPOP is made to form by addition of leachable water soluble
component in material used for coating. The rate of flow16
from CPOP system can be
caluculated by the formula.
Rate of flow dV/dt = AK/h (DP-DR)
Where, K = Membrane permeability
A = Area of membrane
DP = osmotic pressure difference
DR = hydrostatic pressure difference
The major advantage of the CPOP system is that the drug is released from whole
surface of device instead from the single hole hence reduces gastric irritation. Complicated
laser drilling is not required and also facilitates very smaller size of tablet with suitable
coating material.
b) Monolithic osmotic systems:
This system contains polymeric matrix which is water soluble. Hence while in
contact with water, imbibition may result in rupture of polymeric matrix, which surrounds
the drug capsule. This starts with outer environment initially resulting in a serial fashion to
reach the inner matrix.
c) Osmotic bursting pump:
It is identical with EOP and comparatively smaller in size, but with no delivery
orifice. Contents are released to the environment by the hydraulic pressure which is
exerted on inner wall which rupture resulting because of water imbibition. The thickness of
the semipermeable membrane controls the release of drug and hence facilitates pulsated
drug release25
.

14
d) OROS – CT:
It is designed for colon targeting. It is designed as either with single osmotic agent
or with numerous (as many as 5-6) push pull osmotic unit compiled in a hard gelatin
capsule13
. While in contact with GIT contents gelatin capsule dissolve and fluids enter
through the enteric coating and cause swelling of push compartment and the drug is
released from orifice at controlled rate due to formation of flowable gel in drug
compartment. Mainly employed for OD or BID dosing of targeted drug delivery of colon.
e) Multiparticulate delayed release systems (MPDRS):
MPDRS comprises mainly pellets of drug with or without osmogen, coated with
semipermeable membrane. In this system saturated solution of soluble compartment results
due to penetration of water to the core resulting in swelling of membrane and pores are
formed. The drug release follows zero order kinetics.
f) Liquid oral osmotic systems (L-OROS):
L-OROS systems were developed to manufacture a drug in dissolved state in liquid
and released from a soft gelatin capsule. It is preferred for delivery of liquid form, as
being associated with extended release and high bioavailability26
.
EVALUATION:
Drug content, osmotic pressure, swelling properties, orifice diameter, membrane thickness
and dissolution test are the evaluation parameters to be checked for osmotic systems.
Table 1.1. APPLICATIONS OF OSMOTIC DRUG DELIVERY SYSTEMS:
S.No Drug Category Osmogen Type
1 Ibuprofen27
Anti-inflammatory NaCl, PEG 6000 EOP
2 Isradipine & Anti-hypertensive PEO PPOP
Chlorpheniramine maleate28
Anti-histaminic
3 Isradipine29
Anti-hypertensive PEO PPOP
4 Diltiazem HCl30
Anti-anginal NaCMC, mannitol EOP
5 Nifedipine24
Anti-anginal KCl, PEO PPOP
6 Pramipexole31
Anti-parkinsonism Nacl, NaHCO3,
mannitol
PPOP
7 Theophylline32
Anti-asthmatic KCl, tartaric acid CPOP
8 Pentazocine33
Analgesic NaCl, pectin PPOP
9 Diclofenac34
Anti-inflammatory NaCl CPOP
10 Glipizide19
Anti-diabetic Mannitol CPOP

15
MICROSPHERES:
Microspheres are the novel drug delivery systems in which the drug can be
incorporated into a carrier to provide controlled and targeted release thereby reducing the
risk of dose dumping, short gastric residence time and systemic toxicity35
. Drug release is
achieved by diffusion, dissolution, erosion or osmosis.
Microspheres can be simply defined as mono or multi nuclear materials embedded
in spherical coating matrix. These are small solid spherical particles typically with a size
range of 1 to 1000μm. They are usually made up of biodegradable polymeric materials
which may be synthetic, natural or modified natural type.
Microsphere can solve problems of conventional dosage forms and enhances the
therapeutic efficacy of a drug. Microspheres are free flowing powders which make it easy
for compressing into tablets or filling in capsules36,37
. The flow property, elegancy and fine
texture are due to its spherical shape.
Microspheres with very small size have colloidal properties. The colloidal property
is one of the factors which influence the pharmacological activity of the incorporated
drug38
.
Microspheres can be best utilized for targeting to tumor cells, gastro-intestinal (GI)
inflammations and diseases related to brain39
. Microspheres are composed of matrix
systems and are spherical in shape whereas microcapsules may either be spherical or non-
spherical in shape. Microcapsules are small discrete particles, which contain a core
material surrounded by a coating or shell. Microcapsules contain entrapped drug
surrounded by capsule wall.
Advantages40-41
:
The major advantages of the microspheres includes
Enhanced bioavailability
Reduced side effects
Sustained and controlled delivery of the drug can be achieved

16
Targeting of drugs to the particular site of action can be achieved
Manufacturing methods are simple and reproducible
Free flowing character makes it easy to formulate it into tablets or capsules
Bitter taste of drugs can be masked
Wide range of routes of administration
Limitations41.42
:
Difficulty in achieving the desired particle size
Difficulty in large scale manufacturing
Encapsulation efficiency may be less in most cases
Polymeric material makes this drug delivery system costly
Factors affecting drug release from microspheres:
In microspheres drug is encapsulated in a polymeric matrix which provides
sustained release. The drug release may be affected by many factors such as polymer, drug
polymer combined effect, additives used, sphere porosity, crystallinity, size distribution,
entrapment efficiency, manufacturing process and pH based target environment.
METHOD OF PREPARATION:-
Different methods are employed for the preparation of microspheres. It includes,
Solvent evaporation
Solvent extraction
Single emulsion method
Double emulsion method
Polymerization technique
1. Normal polymerization
2. Interfacial polymerization
Phase separation co-acervation technique
Spray drying and spray congealing
Freeze drying
Precipitation

17
i) Solvent evaporation:-
It is most frequently used method for the preparation of microspheres. In this
method aqueous drug solution is added to an organic polymeric phase. Then, the mixture is
stirred continuously until the formation of primary emulsion. Stirring at elevated
temperatures may result in evaporation of volatile organic solvent leaving the solid
microspheres. Solid microspheres are then washed, centrifuged and freeze dried. The
resultant dried microspheres possess good flow property which makes it easy for handling.
Polyvinyl alcohol, polyvinyl pyrolidone can be used as emulsifying agent. This method is
applicable to wide range of liquid and solid drugs. This technique is suitable for
incorporation of both water soluble and insoluble drugs43
.
ii) Solvent extraction:
This is one of the simplest methods used for the preparation of microspheres. In
this method the organic phase is removed by addition of a liquid which precipitates the
polymer. The liquid added should be miscible in both water and organic solvent. The
factors which affect the rate of solvent removal are temperature of aqueous layer and
solubility of the polymer40
.
iii) Single emulsion technique:
In this technique, microspheres are usually prepared from natural polymers such as
proteins and carbohydrates. The polymeric aqueous phase which contains drug is
emulsified with oily phase by using an emulsifying agent. Next step is cross linking which
is achieved either by heat or chemical crosslinking agents. Examples of chemical cross
linking agents include glutaraldehyde, formaldehyde, terephthaloyl chloride, diacid
chloride etc44
. Exposure of drugs with chemical cross linkers for a prolonged period may
cause damage to the drugs. Cross linking by heat is not applicable for heat sensitive
materials45
.
iv) Double emulsion technique:
Unlike single emulsion method, both natural and synthetic polymers are used for
double emulsion. The steps involved in formation of double emulsion are
i) Formation of primary emulsion (w/o) using low HLB value surfactants

18
ii) Formation of double emulsion (w/o/w) using high HLB value surfactants
The primary emulsion is formed by emulsifying the aqueous drug solution in
polymeric lipophilic dispersed medium. The drug in the aqueous phase is encapsulated by
the polymer from the dispersed medium. The primary emulsion so formed is subjected to
homogenization and it is re-emulsified with aqueous solution of high HLB value
surfactants. This leads to formation of double emulsion. The double emulsion, so formed is
then subjected to solvent evaporation/extraction to remove the solvent. This method is
suitable for water soluble and macromolecular drugs46
.
v) Polymerization techniques
The polymerization techniques are
1. Normal polymerization
2. Interfacial polymerization
Normal polymerization
Normal polymerization may be carried out by using different techniques as given
below:
- Bulk polymerization
- Suspension polymerization
- Emulsion polymerization
Bulk polymerization
Heating monomers with a substance, usually a catalyst is performed to initiate the
polymerization reaction47
. The catalyst accelerates the rate of reaction. The polymer
obtained by this reaction can be molded as microspheres. Drug is added during the process
of polymerization.
Suspension polymerization
Suspension polymerization is also known as bead, granular or pearl polymerization.
In this technique, monomer is heated with drug as droplets dispersion in continuous phase.
The droplets may contain an initiator and other additives. Monomer is mechanically
dispersed in the continuous phase. The monomer should be insoluble or slightly soluble in
19
water, so that it precipitates when polymerization reaction takes place which makes it easy
for separation. Monomers with high water solubility are not suitable for this technique48
.
Emulsion polymerization
In this technique the monomer is added drop wise with continuous stirring to the
phase which contains drug and emulsifying agent. The monomer aggregates to form
polymers, subsequently to nuclei which entrap the core material.
The rate of reaction for the conversion of monomers to polymers is rapid. The major
disadvantage of suspension and emulsion polymerization is association of polymers with
unreacted monomers and/or other additives. In some cases surfactant may degrade the
polymer49
.
Interfacial polymerization:
This technique involves reaction of different monomers at the interface between
two immiscible phases which leads to the formation of polymers. The monomers from the
different phase diffuse rapidly and polymerization takes place in the interface.
vi) Phase separation coacervation:
Coacervation process can be applied for both solids and liquid core materials6. This
technique involves formation of immiscible phases of core material, solvent and a coating
material. These immiscible phases can be achieved by change in temperature, addition of
salts or by reaction between two polymers. The next step is deposition of coating material
on the core material, followed by rigidization of the coating. If one polymer is used it is
called as simple coacervation and when two or more polymers are present it is known as
complex coacervation. Simple coacervation may be achieved by the addition of a non-
solvent, micro ions, or a temperature change. Complex coacervation is achieved by
reaction of two polymers50
.
vii) Spray drying and spray congealing
Spray drying and spray congealing methods involve formation of fine droplets and
subsequent drying which leads to the formation of microspheres. Polymeric solution is

20
prepared by dissolving polymer in suitable volatile solvents such as dichloromethane,
acetone etc51
. The drug is then dispersed in the above polymer solution under high speed
mixing. The dispersion formed is sprayed in hot air for drying which leads to formation of
fine microspheres. Cyclone separator is used to separate the microparticles. Aseptic
conditions can be maintained for spray drying which makes it suitable for parenteral
preparation. Plasticizers inclusion may impart spherical and smooth surface to the
microspheres52
.
viii) Freeze Drying:
This method involves freezing of prepared emulsion. The mechanism involved in
freeze drying is sublimation. Usually the continuous phase is organic, which is removed by
sublimation at specified low temperature and pressure. This results in formation of solid
polymeric microspheres of the dispersed phase. This method can be used successfully for
thermo-sensitive materials, but due to expensive its usage is limited.
ix) Precipitation:
This technique is variation of solvent evaporation. Solvents may be removed by
addition of a cosolvent. This results in precipitation of microspheres.
EVALUATION OF MICROSPHERES:
The microspheres are subjected to the following tests.
i) Particle size analysis
ii) Surface Morphology
iii) Drug-Excipient Compatibility studies
iv) Flow Properties
v) Drug content
vi) Percentage yield
vii) Encapsulation efficiency
viii) Drug Release studies
ix) Zeta potential

21
i) Particle Size Analysis:
The particle size and particle size distribution plays an important role in entrapment
of drug and drug release from the microspheres. Particle size can be determined by using a
laser diffraction particle size analyzer or by optical microscopy53
. In the former method,
microspheres are suspended in distilled water, sonicated and the particle size is measured
by using the designed software. In the later method, the particles are measured by
observing it under optical microscope. The particle size is expressed as volume mean
diameter in micrometer.
Particle size distribution can be quantified by sieve analysis, optical microscopy,
laser diffraction or by coulter counter analysis54
.
ii) Surface Morphology:
Scanning electron microscopy gives information about the surface morphology of
microspheres. The microspheres are mounted on a copper cylinder using double sided
adhesive tape. Then it is coated by ions using ion sputtering device. The coated sample is
examined under microscope and photographed. Atomic force microscopy (AFM) can also
be used to study the surface morphology of microspheres55
. In this technique the samples
are placed on mounted slab using double sided adhesive tapes and observed under
microscope. Transmission electron microscopy (TEM) can also be used for identifying the
surface morphology56
.
iii) Drug –Excipient Compatibility studies:
Drug –excipient compatibility studies can be performed by FTIR, TLC and DSC
techniques57
.
iv) Powder flow properties:
Flow property plays an important role in solid substances. Microspheres are
subjected to flow properties such as density, angle of repose, porosity and Hausners ratio58
.
The density of microspheres can be determined by pycnometer. Angle of repose is
measured by funnel method. Porosity is calculated from the bulk and true density.
Hausner’s ratio also gives information about flow property.
v) Drug content:
Drug content can be estimated by weighing specified quantity of microspheres,
dissolving it in suitable solvent, followed by filtration and analyzing by suitable method.

22
vi) Percentage yield:
Percentage yield of microspheres is calculated by using the following equation59
.
Percentage yield = [Practical yield / Theoretical yield] x 100
vii) Encapsulation efficiency:
Encapsulation efficiency is the amount of drug that is encapsulated in the
formulation of microspheres. A weighed quantity of microspheres are lysed to release the
drug and added to suitable buffers and then stirred for specified period. The solution is
filtered and diluted appropriately and analyzed by suitable method. The entrapment
efficiency is calculated by the following formula60
Encapsulation efficiency = [Actual drug content / Theoretical drug content] × 100
viii) Drug release studies:
In vitro studies can be performed by beaker or dissolution apparatus. In the beaker
method, microspheres are made to adhere at the bottom of the beaker containing the
medium and stirred uniformly by using overhead stirrer. Volume of medium used may
vary from 50- 500 ml and the stirring speed from 60-300 rpm61
. In the dissolution
apparatus method, microspheres are placed in dissolution medium in the apparatus, rotated
for specified time, and then samples are withdrawn at regular intervals and analyzed by
suitable method. Sink conditions should be maintained.
ix) Zeta Potential:
Zeta potential is a property which is exhibited by a particle in suspension.
Isoelectric point is defined as the pH at which the zeta potential is zero. Zeta potential can
be measured by using zetasizer and the values help to judge the stability of the
microspheres62
.

23
1.2. APPLICATIONS OF MICROSPHERES IN DRUG DELIVERY:
S.
No
Drug Category/Use Carrier used Method of
Preparation
1 Acetazolamide63
Diuretic Eudragit RL
Eudragit RS
Solvent evaporation
2 Atenolol64
Anti-hypertensive Ethyl cellulose Solvent evaporation
3 Aspirin65
Anti-inflammatory Eudragit RS100 Solvent partition
4 Aceclofenac 66,67
Anti-inflammatory Rosin Solvent evaporation
Eudragit RS100 Solvent evaporation
5 Piroxicam68
Anti-inflammatory Hyaluronate Spray drying
6 Diltiazem HCl69
Anti-hypertensive Eudragit,
Ethyl cellulose
Solvent evaporation
7 Diclofenac70
Anti-inflammatory Ethyl cellulose Solvent diffusion
8 Flurbiprofen71,72
Anti-inflammatory Pectin:HPMC Solvent diffusion
Eudragit L100,
Eudragit S100
Solvent evaporation
9 Ibuprofen73
Anti-inflammatory Ethyl cellulose Solvent evaporation
10 Indomethacin74
Anti-inflammatory Ethylcellulose Multiple
emulsification
11 Ketorolac75
Anti-inflammatory Ethylcellulose,
Eudragit R100,
Eudragit S100
Emulsion diffusion
12 Metformin76
Antidiabetic Ethyl cellulose Solvent evaporation
13 Mephenamic
acid77
Anti-inflammatory Chitosan Emulsion
congealing
14 Nifedipine78,79
Anti-anginal Ethyl cellulose Solvent evaporation
Methacrylate Phase separation

24
NANO DRUG DELIVERY SYSTEMS:
Nano as the name itself implies that these systems are in nano size.
Nanotechnology is a broad field which involves variety of applications including drug
delivery, medical diagnostics etc. These systems have some peculiar properties such as
increased surface area, specific targeting, optical properties and less toxicity when
compared to other systems80
.
Norio Taniguchi, in 1974 used the term nanotechnology at first time81
. These
systems provide efficient way of drug delivery particularly for chronic therapy
management82
.
Various drug delivery systems available in nanotechnology are nanosuspensions,
nanoparticles, nanocapsules, nanoemulsion, SLN, nanocrystals, magnetic nanoparticles,
nanotubes, nanoshells etc.
NANOSUSPENSION:
Nanosuspensions are colloidal systems stabilized by surfactants. These are
dispersed systems in which the drug acts as dispersed phase83
.
Unique features of nanosuspension84, 85
:
Stable for longer period, as it avoids Ostwald ripening
Drug dissolution/saturation velocity increased
Improved bioavailability
Manufacturing methods are simple
Flexibility in designing dosage forms and route of administration
Suitable for both lyophilic/lyophobic drug
Problems in nanosuspensions86
:
High cost
Toxicity produced by solvents or stabilizers
Chances of agglomeration

25
ADDITIVES IN NANOSUSPENSIONS:
The additives used in nanosuspension are briefly given below:
i) Stabilizer:
Stabilizers are one of the important additives used in the formulation of
nanosuspension. These agents help to wet the drug materials fully and also avoid Ostwald
ripening, thereby producing stable nanosuspension. Drug and stabilizer at particular ratio
yield stable preparation. Usually stabilizers used in nanosuspension are surfactants.
Eg: Poloxamers, lecithins, polysorbates87
ii) Co-surfactants:
Co-surfactants have great impact in the preparation of microemulsion template for
nanosuspension.
Eg. Trancutol, ethanol, methanol, isopropanol88
iii) Organic solvent:
Organic solvents are used in the preparation of nanosuspension to dissolve the solid
substances. The solvents used should be water miscible and non-hazardous. The process of
removal of solvents from the product should be easy and cost effective.
Eg. Ethanol, methanol, isopropanol, chloroform, dichloromethane89
iv) Miscellaneous additives:
Additives such as buffers, osmogens and cryoprotectant are used in the formulation
whenever necessary90
.
Eg. Buffer – Phosphate buffer
Osmogen – mannitol
Cryoprotectant – PEG, mannitol
MANUFACTURING METHODS OF NANOSUSPENSION:
The methods followed for the preparation of nanosuspension
Bottom up approach
Top down approach
Other techniques

26
BOTTOM UP APPROACH:
Bottom up approach methods include precipitation. This method involves
assembling of molecules to form nanosize materials. In this technique the drug is dissolved
in solvent then added to non-solvent to precipitate the particles. This is simple and user
friendly. Precipitation can be combined with high stirring.
The problem in this technique involved is growth of drug particles, but can be
rectified by surfactant. In this technique the materials are constructed to form
nanoparticles. This method is suitable for the drugs which are soluble in aqueous or non-
aqueous solvent. Commonly used methods are microemulsion, microprecipitation, melt
precipitation91
.
TOP DOWN APPROACH:
In this top down approach the large particles or microparticles are disintegrated to
form nanoparticles.
The technologies include
Milling
Media milling (nanocrystals)
Dry co-grinding
Homogenization
Homogenization with high pressure in aqueous solvents
Homogenization with high pressure in non-aqueous solvents
Milling:
Media milling:
This method was introduced by Liversidge et al92
. This is wet milling technique. In
this method, nanoparticles are prepared by using high shearing force which is produced by
impaction which causes the drug to disintegration. Drug, stabilizer and required solvents
are kept in the milling chamber and rotated at high shear rate at controlled temperature.
These mills contain balls or pearls. These produce impact mechanism, which may produce
nanoparticles. This method is well suitable for drugs which are poorly soluble in both
aqueous and organic solvents. These are suitable for pilot scale up. Residues in the final
product are the problematic issue in this method. Time consuming and scale up may create
problem in some cases

27
Dry co-grinding:
This method involves preparation of nanosuspension by dry milling93
.
Glibenclamide, griseofulvin nanosuspension can be prepared by dry co-grinding. HPMC,
PEG, PVP and some souble polymers are used in this method94
. This method is easy to
operate and quietly cost effective as it can be preceded without organic solvents.
Homogenization:
This method involved three steps
Dispersion of drug in solvent which contains stabilizer
Homogenization of presuspension formed in step1 with low pressure
Homogenization with high pressure in aqueous or non-aqueous solvents.
Homogenization with high pressure in aqueous media:
Dissocubes method was introduced by Muller95
. Dissocubes are prepared by using
piston type homogenizers with high pressure. The principle involved in the size reduction
is cavitation and further by particles collision. Due to the formation of cavitation, the
implosion forces are created which are sufficient to size reduce the micro particles to
nanoparticles. The micronized drug is used to produce nanosuspensions. Before
homogenization process, the micronized drug is prepared as suspension by stirrers. The
suspension is given pressure in the in the homogenization gap to achieve nano size. There
is no erosion of the materials. Both dilute and concentrated solutions can be prepared. This
method is expensive. The equipment can be operated under varying pressure from
minimum of 100 to maximum of 2000 bars. The capacity of the homogenizers may be
from 40ml to few thousand liters. The size of particle obtained is indirectly proportional to
the pressure applied. Particle size is also indirectly proportional to the number of
homogenization cycles.
Homogenization with high pressure in non-aqueous solvents
In this type of homogenization, non-aqueous solvents are used. The drugs which
are labile thermally and chemically can be processed by using nonaqueous solvents96
. The
solvents used may be PEG. The nanosuspension can be homogenized at 0ºC and
sometimes even at -20ºC which is called as deep freeze homogenization.

28
OTHER TECHNIQUES:
Emulsion/Microemulsion as templates
Supercritical fluid method
Emulsion/Microemulsion as template97
:
Emulsion/microemulsion can be used to formulate nanosuspension. The drugs
those are soluble either in organic solvent or aqueous solvent. Microemulsion requires less
energy for the production of nanosuspension. Nanosuspension may be prepared by loading
the drug in organic solvent and dispersing the solution in aqueous phase with the aid of
suitable emulgents. The organic solvent is evaporated, so that drug precipitates and forms
nanosuspension. The particle size is based on the emulsion droplet size. Nanosuspension
may also be prepared from emulsion and diluting it with aqueous phase, which may lead to
diffusion of dispersed phase into the dispersed medium, which results in formation of
nanosuspension.
Supercritical fluid method98
:
Solvents normally used in the preparation of nanoparticles may produce hazard to
environment. So it is better to use supercritical fluid which may be safe.
By using SC fluids, supercritical anti-solvent (SAS) or rapid expansion of
supercritical solution (RESS) method can be employed.
In SAS method, a solvent in liquid state is selected which is miscible with SC fluid.
The solute is miscible with solvent but not in SC fluid. This controversy produces
precipitation of solute, which results in nanoparticles.
In RESS method, the solute is dissolved in SC fluid and then expanded by nozzle
into low pressure area, which leads to formation of precipitate. The technique involves
high concentrations of stabilizers. Due to super saturation there may be chance for
overgrowth of particles which may lead to form amorphous or polymorph.

29
NANOSUSPENSION EVALUATION:
Following tests are to be performed for the nanosuspension formulation.
Particle size
Zeta potential
Morphology
Saturation solubility and dissolution velocity
Entrapment efficiency
Particle size:
The average particle size is one of the parameter to be considered for the
nanosuspension. Particle size affects the properties such as dissolution, saturation
solubility, stability etc. This parameter can be calculated by photo correlation
spectroscopy, coulter counter, laser diffraction99
. Particle shape can be visualized by
AFM100
. Polydispersity monitors the physical stability of the nanosuspension. It should be
less for prolonged stability.
Zeta potential:
Zeta potential is an important parameter to be considered as it is directly relates the
stability of the product. This can be measured by zeta sizer. Drug and stabilizer do have
property of affecting the zeta potential. Nanosuspension stabilized by electrostatic method
may have zeta potential of ≥ ±30mV and stabilized by combination of steric and
electrostatic may have zeta potential of ≥ ±20mV101
.
When zeta potential increases, the particle surface charge increases, which
produces increase in electrostatic forces, which ultimately leads to stable preparation.
Morphology:
X-ray diffraction, SEM and TEM analysis are used to identify the morphological
characters of the nanosuspension. Due to high pressure, nanosuspension may change in
their structure which may be amorphous or other polymorphic forms. The changes
occurred in the preparation of nanosuspension can be well identified by these techniques.
Saturation solubility and dissolution velocity:
Nano concept emerged to solve the poor solubility issues. Solubility increases by
reducing the particle size. These parameters give information about the dissolution and
drug release.

30
These can be determined in different physiological buffers. These parameters are to
be considered carefully particularly in SR/CR dosage forms.
Entrapment efficiency:
This is a parameter which gives information about the entrapment of drug in
polymer. From this we can determine what type of carrier is suitable for particular drug.
The amount of carrier required can also be determined by this parameter.
Table 1.3. APPLICATIONS OF NANOSUSPENSIONS:
S.
No
Drug Category/Use Stabilizer Method of
Preparation
1. Aceclofenac104
Anti-inflammatory Pluronic F-68 Nanoprecipitation
2. Revaprazan
HCl105
Proton pump
inhibitor
Polaxamer 188 Homogenization
(high pressure)
3 Glibenclamide106
Anti-diabetic SLS, Lutrol
F68, Tween 80
Media milling
4 Fenofibrate107
Antihyperlipidemi
c
Vitamin E
TPGS
Homogenization
(high pressure)
5 Itraconazole108
Anti-fungal Poloxamer 407 Milling
6 Atorvastatin109
Anti-
hyperlipidemic
Polaxamer 188 Homogenization
(high pressure)
7 Phenytoin110
Anti-convulsant SLS, Tween 80 Millling
8 Celecoxib111
Anti-inflammatory Tween 80,
PVP, SDS
Emulsion diffusion
9 Buparvaquone112
Antibiotic Poloxamer 188, Homogenization
(high pressure)
10 Miconazole113
Anti-infective SDS milling
11 Piroxicam114
Anti-inflammatory Poloxamer 188, Homogenization
(high pressure)
12 Rutin115
Anti-allergic, anti-
inflammatory
SDS Homogenization
(high pressure)
13 Griseofulvin116
Antifungal Lecithin Precipitation
Emulsion template
Dry co-grinding
14 Amphotericin
B117
Antifungal Tween 80
pluronic F68,
Sodium cholate
Homogenization
(high pressure)

31
NANOSUSPENSION IN ORAL DELIVERY:
Although nanosuspension can be delivered through different routes such as oral,
pulmonary, parenteral and ocular, the oral route of delivery is prominent and safe. The
nanosuspension can be freeze dried and filled in capsules or compressed into tablets102
.
Even it can be given as oral liquids. The nanosuspension by oral route makes patient
convenience as well as increase in absorption and bioavailability. Bupravaquone, an
antibiotic face bioavailability problem in normal delivery, but there is increase in
absorption in nanosuspension. Likewise amphotericin B, danazol bioavailability characters
are also increased by preparing it in nanosuspension. For GI inflammations, targeting can
also be achieved by using polymeric carriers in the formulation of nanosuspensions.
Fenofibrate nanosuspensions have higher bioavailability than the ordinary micronized
drugs. The first USFDA approved nanocrystal tablet was Rapamune which holds increased
bioavailability than the conventional one103
.
INFLAMMATION AND ANTI-INFLAMMATORY DRUGS:
Inflammation is a term which is derived from the Latin word – Inflammare, means
burn. Injury to the human body will produce a series of chemical changes in the injured
area. Inflammation is the physiological response of vascular tissues to harmful stimuli,
such as damaged cells, pathogens, producing edema due to the extravasations of fluid,
proteins and accumulation of leucocytes at the inflammatory site118
. Inflammatory diseases
cover a broad spectrum of conditions such as rheumatoid arthritis, osteoarthritis, allergic
rhinitis, multiple sclerosis, ankylosing spondylitis, asthma, inflammatory bowel disease,
and cardiovascular diseases. The features of inflammation are increased blood flow,
increased capillary permeability, increased migration of leucocytes into the affected area,
clotting of fluid due to excessive leaking of fibrinogen and other proteins into the
interstitial space from the capillaries and swelling of the tissue cells.
Causes of inflammation
Physical: Environmental like severe cold and heat, mechanical injury
(accident) etc.
Chemical: Acid burns, drugs, venom

32
Infection: Bacteria, viruses, fungi and other parasites
Immune: Allergies and autoimmune conditions
Ischemia: Tissue death due to lack of restricted blood supply known as
infarct.
Signs and symptoms of inflammation:
The signs and symptoms of inflammation include redness, pain, swelling and heat.
ACUTE INFLAMMATION119
Acute inflammation develops within minutes or hours and generally lasts for hours
to days based on the type and severity of the tissue damage. Acute inflammation is a rapid
and initial response to foreign substance such as microbes and tissue injury. During this
inflammation, leukocytes and plasma proteins are released at the site of injury producing
vascular changes and cellular events.
Vascular changes:
After the tissue damage, within seconds there may be vasoconstriction followed by
vasodilatation leading to increased blood flow causing erythema (redness) to the area. Due
to increased permeability of blood vessels, protein rich fluids extravasate into the
extravascular tissues, causing the RBCs to become more concentrated, thereby increasing
blood viscosity and slowing the circulation. The leukocytes adhering the endothelium got
activated and proteolytic enzymes are released causing endothelial injury.
Cellular events:
The leukocytes released from the vascular lumen to the extravascular space. This
consists of following events
Margination and Rolling along the walls of blood vessels
As blood flows from capillaries to venules, circulating cells are removed by
laminar flow. Further the small red cells move faster than large white cells, thereby
pushing leukocytes out the central column and interact with the endothelial cells.
This process is called as margination. Subsequently the leukocytes tumble on
endothelial cells, mediated by selectins. This process is called as rolling.

33
Adhesion and Transmigration
Transient bond is formed between the leukocytes and endothelial cell
surfaces mediated by integrins. This is known as adhesion.
Migration to chemotactic stimulus
The sticked leukocytes migrate through the vessel wall by squeezing at
intercellular junction and escapes out to the extravascular space known as
migration. Lecukocytes after crossing endothelium and other parts, finally it
reaches the site of injury by a process known as chemotaxis. The chemotactic
substance includes leukotrienes B4, cytokines etc.
CHRONIC INFLAMMATION:
In chronic inflammation, active inflammation, injury and tissues healing proceeds
simultaneously for long duration. It differs from acute inflammation by infiltration of
plasma cells, which are distinguished by vascular changes, edema and neutrophilic
infiltrate. It happens due to chronic infections by microbes that are hard to eradicate,
immune mediated inflammatory diseases and prolonged exposure to toxic agents like
inhaled particulate silica120
.
Cell mediators:
a) Macrophages:
They are diffusely scattered in almost all connective tissues, liver, lymph nodes,
spleen, CNS, lungs and migrate to the site of injury within 1 to 2 days from the onset of
acute inflammation. It reaches the extravascular tissue and transformed into larger and
possess greater ability to kill ingested organisms. After activation, it secrets biological
active products like proteases, AA metabolites, cytokines IL-1 and TNF resulting in tissue
injury and fibrosis.
a) Lymphocytes:
Both T and B lymphocytes migrate into inflammatory sites. T cells produce
cytokines-INF-γ, an activator of macrophages and promote cytokine secretion.
b) Plasma cells:
Plasma cells producing antibodies are developed from activated B lymphocytes.

34
c) Eosinophil:
Eosinophils are found in inflammatory sites around infections and typically
associated with allergies.
d) Mast cells:
These are distributed in connective tissues throughout the body, with IgE antibody
mast cells are triggered to release histamines and AA metabolites121
.
INFLAMMATION MEDIATORS
These are the substances producing inflammation through a specific receptor.
The mediators for acute and chronic inflammation are given explained below.
Acute inflammation:
Plasma proteins: Complement, coagulation, fibrinolytic and kinin systems.
Lipids: Eicosanoids, Platelet activating factor
Others: Histamine, serotonin, endotoxin, nitric oxide
Chronic inflammation:
Cytokine proteins Interleukin-1, Interleukin-6 and TNF-α
Complement system:
Antigen-antibody complexes formed during infection, the endotoxins of gram
negative bacteria, kinin products, fibrinolytic and coagulation systems activates the
complement system122
.
Coagulation system:
Coagulation system converts soluble fibrinogen into insoluble fibrin, a major
component in the exudate of acute inflammation123
.
Fibrinolytic system:
The lysis of fibrin into degradation products may effect locally on vascular
permeability124.
Kinin system:
Kinins are activated by coagulation factor XII125
. Bradykinin a chemical mediator
of pain causes pain vasodilation, edema etc126
.

35
Eicosanoids:
These inflammatory mediators are generated from phospholipids and controls many
physiological process127
.
Platelet activating factor:
PAF is an inflammatory mediator released by pro-inflammatory cells, vascular
endothelial cells and platelets128
. Asthma patients have high level of PAF.
Histamine:
It is a chemical inflammatory mediator present in leukocytes, platelets, basophils
and mast cells. It causes increased vascular permeability and vascular dilatation
immediately129
. In rheumatoid arthritis and asthma, increased mast cells are present due to
increased histamine level.
Serotonin:
Serotonin acts as an inflammatory mediator and presents in high level in platelets
and mast cells130
.
Endotoxin:
Endotoxin triggers complement activation causing vasodilation and increased
vascular permeability which may be due to formation of anaphylatoxins C3a and C5a131
.
Nitric oxide:
Nitric oxide syntheses enzyme present in endothelium and macrophage produces
nitric oxide from arginine may cause cytotoxic, vasodilator and anti-platelet aggregation132
.
Cytokines:
Cytokines are the signaling chemicals released from various immune cells. The
duration of inflammatory response is controlled by it. Cytokines may be pro-inflammatory
or anti-inflammatory. Microglia produces pro-inflammatory cytokines which increases the
inflammatory reactions. The inflammatory reactions are reduced by anti-inflammatory
cytokines133
.

36
TREATMENT OF INFLAMMATION:
Inflammation should be treated if it continues to persist. It is usually persistent in
chronic conditions with occasional acute aggravations. Inflammation may be treated by the
following drug therapies.
Non-steroidal Anti-inflammatory drugs:
NSAIDs inhibit the release of prostaglandins, a prime chemical mediator of
inflammation.
Corticosteroids:
Steroids inhibit the release of prostaglandins by the cells which in turn inhibit the
function of WBC,
Anti-histamines:
Anti-histamines inhibit histamine release by blocking basophils and mast cells.
CLASSIFICATION OF NSAIDs:
Currently lots of drugs are available in the market to treat inflammatory disorders
but only very few are free from toxicity. Gastrointestinal problems associated with the use
of anti-inflammatory drugs are still under research.
NSAIDs can be classified as follows:
Table 1.4: Classification of NSAIDs
NSAIDs DRUGS
Salicylates Aspirin, Salsalate, Diflunisal
Propionic acid derivatives Naproxen, Ibuprofen, Ketoprofen, Loxoprofen, Fenoprofen,
Flurbiprofen, Oxaprazin
Acetic acid derivatives Aceclofenac, Diclofenac, Ketorolac, Sulindac,
Indomethacin, Nabumetone, Etodolac
Enolic acid derivatives Tenoxicam, Piroxicam, Droxicam, Lornoxicam, Meloxicam
Fenamic acid derivatives Flufenamic Acid, Mefenamic Acid, Tolfenamic Acid
COX-2 inhibitors Rofecoxib, Celecoxib, Valdecoxib, Parecoxib

37
2. AIM AND OBJECTIVES
Aceclofenac is a drug commonly used in the management of pain and inflammation
in various conditions such as
post-traumatic, cervical and low back pain
ankylosing spondylitis
rheumatoid arthritis and osteoarthritis
This drug, on long term usage, specifically by oral route is reported to cause
adverse effects including gastritis. So it is a need to develop safe and effective oral drug
delivery system for aceclofenac. The following are the specific reasons which demand the
development of oral controlled drug delivery system for aceclofenac:
Due to its short half-life of 4- 4.3hrs, frequency of administration is increased. A
well designed oral controlled delivery can reduce the frequency of dosing
Due to its severe gastrointestinal (GI) irritation and other side effects, controlled
delivery of aceclofenac at optimal concentration may considerably reduce the
adverse effects
Comparing to other routes, oral route is preferable with respect to safety, comfort
and reliability. Hence controlled delivery of aceclofenac by oral route is ideal.
Controlled release of aceclofenac will reduce the frequency of dosing and may
increase patient convenience
For many inflammatory disorders including arthritis, administration of NSAID’s
for long period of time is unavoidable and hence the development of controlled
release of aceclofenac, a popular NSAID is most demanding.
Wide market opportunities are available

38
The overall aim and objective of the present work is to:
Improve the overall therapeutic efficacy of aceclofenac by controlled release
Minimize the adverse effects
Reduce the overall dose and dosing frequency of aceclofenac
Achieve improved patient compliance
To achieve the above said objectives the plan is executed
To formulate oral controlled drug delivery systems like Osmotic tablets,
Microspheres and Nanosuspensions of Aceclofenac.
To evaluate the formulated products of Osmotic tablets, Microspheres and
Nanosuspensions of Aceclofenac
To optimize process and formulation variables
To perform anti-inflammatory activity and GI tolerability studies
To perform stability studies of optimized formulation of Osmotic tablets,
Microspheres and Nanosuspension of Aceclofenac

39
3. LITERATURE REVIEW
Bodmeier R and Chen H. (1989) encapsulated indomethacin, ibuprofen, and hetoprofen
by solvent evaporation using polymers ethylcellulose, poly(e-caprolactone), PMMA,
polystyrene, and Eudragit RS and RL134
. Indomethacin-poly(e-caprolactone)
microspheres were prepared by a melt-dispersion without using organic solvents. The
release of indomethacin from EC microspheres was too slow. The release of ibuprofen
& ketoprofen was increased by using more permeable polymers. The rate of
precipitation of polymer and drug during microsphere formation were dependent upon
the solvent selected.
Malamataris S and Avgerinos A (1990) produced indomethacin CR microspheres by
using eudragit RS and RL in different drug polymer ratios using emulsion solvent-
diffusion method135
. The size varied from 7μm to 380 μm. Porosity values ranged from
62.4 – 89.4. Drug loading and release depended on drug polymer ratios, polymer
combinations and solvent diffusion method. Increase in polymer content produced
increase in size and decrease in porosity. Drug release followed first order kinetics.
Kim CK et al., (1994) prepared terbutaline sulfate microspheres by an emulsion-
solvent evaporation method from Eudragit RS136
. The micropellets formed using
aluminium tristearate as a smoothing agent were very spherical and narrow range size
distribution. The average size of microspheres decreased as the polymer:drug ratio
increased. The 12 h sustained release pattern was observed with formulated
microspheres at a polymer/drug ratio of 9:1 which showed equivalent release
specifications when compared with commercial TBS.
Okada H et al., (1994) developedPLGA and PLA microsphere system loaded with
leuprorelin acetate by microencapsulation technique137
. Microspheres of high
entrapment and little initial burst release were obtained. The microsphere system using
PLGA and PLA is very useful in designing targeted/controlled delivery to attain potent

40
therapy by reducing the dose than the daily injection and hence improves patient
compliance.
Cuzzolin L et al., (1994) evaluated the anti-inflammatory efficacy of diclofenac and a
new original diclofenac-derivate, nitrofenac at doses of 0.3 and 3 mg kg-’ per OS to
adjuvant arthritic rats at the 14th, 21st and 28th days after arthritis induction and also
the gastrointestinal tract was examined macroscopically for any presence of lesions138
.
The results showed that the daily oral administration of diclofenac and nitrofenac a.t 3
mg/kg significantly inhibited arthritis development, total disappearance of Escherichia
coli on 1st and also 7 days after the last drug administration and no ulcers were
observed macroscopically with either drug, even if some alterations in the mucosa and
haemorrhagic effusions were more evident in rats treated with diclofenac at 3 mg/kg. In
conclusion, the better gastrointestinal tolerability observed in nitrofenac-treated rats
could be attributed to the release of nitric oxide
Sriwonanya M and Bodmeier R (1997) entrapped the water soluble cationic drugs
(chlorpheniramine maleate, pseudoephedrine HCI and propranolol HC1) with
amberlite IRP69 by solvent evaporation139
. The formed resin particles were entrapped
with EC, PMMA and eudragit RS100. Entire resin particles were entrapped with
eudragit RS100 and negligible drug release was reported when compared with other
polymers which may be due to interaction of polymer with unlike charged resin. All
resin particles were encapsulated with Eudragit RS 100, a cationic polymer with
quaternary ammonium, and showed negligible drug release was when compared to the
other polymers due to the interactions of the polymer with the oppositely charged resin
particles, which prevented hydration and swelling of the resin.
Ganza-Gonzalez A et al., (1999) investigated the usefulness of chitosan and
chondroitin sulphate microspheres by spray drying of aqueous polymer dispersions for
controlled release of metoclopramide hydrochloride in oral administration140
. The
study reveals that the chitosan microspheres showed good control release (more than 8
h) when prepared with more than 15% formaldehyde (w/w with respect to polymer),

41
and release rates were little affected by medium pH. Release from chitosan
microspheres prepared with 20% formaldehyde was independent of pH, suggesting that
this may be the most appropriate formulation. The size distribution of the chitosan
microparticles was almost-spherical, clearly bimodal, and the release rate is largely
governed by rate of diffusion through the matrix.
Liu L et al., (2000) prepared nifedipine monolithic osmotic tablet coated with cellulose
acetate and drilled with orifices on both sides141
. Dissolution profiles of optimized
formula have been compared with commercial capsule and PPOT. From the results it
was concluded that PEO of molecular weight 300, 000 g/mol was appropriate
thickening agent and 0.25–1.41 mm orifice size was optimum orifice size. Plasticizer
tiracetin decreased the nifedipine release and PEG increased the release. This system
was capable of delivering drug at zero-order upto 24h.
Tuncay M et al., (2000) formulated diclofenac CR for intra-articular route by solvent
evaporation method142
. The particle size of microspheres were determined
approximately 5-10μm. Based on the molecular weight of polymer, the surface
morphology varied. The drug release from microspheres depended on molecular
weight, loading, particle size and porosity. 99m TC-HIG was utilized as
radiopharmaceutical to study the arthritic lesions. There was no remarkable difference
between the group treated with PLGA diclofenac sodium microspheres and control
group.
Adibkia K et al., (2001) investigated piroxicam loaded eudragit RS100 nanoparticles
by solvent extraction technique143
. The formulated nanoparticles were smooth spherical
shape and followed weibull model for diffusion. Animal studies indicated that the
inflammation was inhibited predominantly in nanosuspension than microsuspension.
Hickey T et al., (2002) developed dexamethasone loaded PLGA microspheres for
continuous delivery for over a period of 1 month, using an oil-in-water emulsion
technique144
. The standard microsphere systems did not provide the desired release
42
profile since, following an initial burst release, a delay of 2 weeks occurred prior to
continuous drug release. Predegraded microspheres started to release dexamethasone
immediately but the rate of release decreased after only 2 weeks. A combination of
standard and predegraded system was utilized to avoid the delay and to program a
continuous delivery of dexamethasone for one month.
Esposito E et al., (2002) produced ascorbic acid loaded eudragit L, RL, RS
microspheres by spray-drying method145
. The formulation showed a good morphology
and size distribution. Encapsulation efficiencies were found to be in the range of 98-
100%. 60% of drug release from microspheres of eudragit L, eudragit RL, eudragit
RL/L and eudragit RS/L were achieved in 100 min, 82 min, 75-77min, and 70 min
respectively. The drug release didn’t affected significantly by nature of polymer. The
size and morphology made it suitable for oral delivery in treating colorectal cancer.
Bravo SA et al (2002), developed diclofenac sodium uncoated HPMC matrix tablets by
wet granulation technique146
. The weight variation, thickness, hardness and friability
were found to be optimal. The effect of MCC, lactose and starch on drug release of
tablets were studied. Starch 4% as glidant produced good flowing of powders. Drug
release was controlled by starch and lactose (8.5% both) at 1:1 ratio with MCC (5% or
7.5%). HPMC matrix tablets prolonged the release when compared to conventional
one. The diclofenac matrix tablets were stable during the storage of 3 months. This
matrix tablets avoided the GI side effects.
Lamprecht A et al., (2003) prepared 5-fluorouracil loaded eudragit P4135 microsphere
by o/w emulsion process147
. Process parameters were optimized for drug release and
loading. The drug release from eudragit P4135F microsphere was less than 35% up to
6hr at pH 6.8 and immediate release within 30 min at pH 7.4. Addition of RS100
produced only minimal changes in drug release. The formulation proved as promising
delivery of 5FU for colon targeting in cancer stages.

43
Parikh RH et al, (2003) prepared PLGA microspheres of 5-FU by emulsion solvent
evaporation method and optimized the process parameters using 32
factorial design148
.
Effects on dispersed phase volume of the primary emulsion and continuous phase
volume of the secondary emulsion on % yield, particle size and encapsulation
efficiency were studied. Increase in dispersed phase volume of primary emulsion was
directly proportional to particle size and indirectly proportional to % yield and
encapsulation efficiency. Increase in continuous phase volume of the secondary
emulsion was indirectly proportional to % yield, particle size and encapsulation
efficiency. Reproducibility of results achieved for batch to batch. SEM studies depicted
that particles existed as aggregates.
Lu EX et al., (2003) studied a naproxen MOTS, using gum arabic as osmogen,
suspending and swelling agent, cellulose acetate as membrane and PEG 400 as
plasticizer149
. The effects of membrane thickness, orifice diameter, gum arabic and
PEG 400 on dissolution were studied. From the results it was concluded that MOTS
can be successfully used for water insoluble drugs as oral controlled delivery.
Kayser O et al., (2003) formulated amphotericin B nanosuspension by high pressure
homogenization117
. The diameter of the particles was found to be 528 nm. GI stability
was determined in artificial GI fluids at various pH. From the in-vivo study reports,
micronised amphotericin B (5 mg/kg) did not show any curative effect whereas,
amphotericin B nanosuspension, showed decreased liver parasite by 28.6% compared
to untreated controls revealing the therapeutic efficacy of amphotericin B as
nanosuspensions for oral administration.
Lamprecht A et al., (2004) designed calcitonin microspheres for colonic delivery by
using eudragit P4135F by double emulsion. In vitro release was less than 20% in 4 hr
at pH 6.8 buffer and fast release was observed in pH 7.4 buffer150
. Cmax of
carboxyfluorescein was around 60 min, but in microsphere it was identified after 4 hr.
Microspheres produced 4 fold increase in the area above the curve of blood level
calcium compared to levels reached after calcitonin solution. Chitosan in the

44
microsphere as absorption enhancer didn’t produce any significant effect. This system
proved as a promising device for colonic calcitonin delivery.
Wang Y et al., (2004) described coating of silica nanoparticles by SAS method using
supercritical CO2 as anti-solvent and eudragit as coating material151
. The process
involved formation of nucleation with polymer followed by subsequent growth on the
surface of the nanoparticles achieved by mass transfer and phase transition forming a
matrix structure by agglomeration of the coated nanoparticles. FTIR, TEM, SEM
EELS were used to analyze coated silica nanoparticles.
Okimoto K et al., (2004) investigated the use of a controlled-porosity osmotic tablet
using (SBE)7m-β-CD as solubilizer and also as an osmogen for selected poorly and
highly soluble drugs152
. Dissolution was followed according to Japanese
Pharmacopoeia. The osmotic tablets were placed in the dissolution medium for two
hours and assayed by HPLC and gravimetry. The appropriate composition ratio
correlates to the drug concentration in the core tablet. The present results proved that
(SBE)7m- β-CD served as a solubilizer and also as an osmogen.
Patel JK et al., (2005) formulated chitosan mucoadhesive microspheres loaded with
glipizide by emulsification technique using chitosan as polymer and glutaraldehyde as
crosslinker153
. The microspheres characters were affected by drug polymer ratio,
stirring speed and amount of cross linker. Microspheres were spherical, free flowing,
exhibited good mucoadhesion property with high entrapment efficiency. A 32
factorial
design was used to optimize drug polymer ratio and stirring speed. The optimized
batch exhibited EE of 75%, swelling index of 1.42, mucoadhesion of 78% after 1 hour
and release of more than 12 hours. In vivo studies also supported the presence
hypoglycemic effect in wistar rats.
Hori M et al., (2005) prepared chitosan microparticles loaded with ovalbumin and
chitosan microparticles of ovalbumin coated with eudragit L100 by ionic gelation and
solvent evaporation method154
. The microparticles contained particle size of 2.3μm and

45
ovalbumin content of 34.4%. Eudragit L100 coated microparticles contained particle
size of 47.9-161.1μm and ovalbumin content of 3.6%-20.5%. The chitosan
microparticles were dissolved spontaneously in JP 14 first fluid, but not in second
fluid. So release was retarded in second fluid. Eudragit L100 coated microparticles
release was retarded in both first and second JP 14 fluid. From the in vivo results it was
concluded that eudragit L100 coated microparticles were useful in inducing intestinal
immune response.
Duarte AR et al., (2006) prepared naproxen microspheres by precipitation techniques
using EC/MC blends155
. For EC/MC microspheres and encapsulation of naproxen
solvent evaporation and SAS method were used. Microspheres formulated by SAS
method have high loading with controlled release. It followed Fick’s law of diffusion.
Kocbek P et al., (2006) formulated ibuprofen nanosuspension with particle size of less
than 100nm by melt emulsification and compared it with solvent diffusion method156
.
Melt emulsification gained more importance because of its avoidance of organic
solvents but particle size is greater than the nanosuspension prepared by solvent
diffusion. Tween80 and PVP K25 in combination in melt emulsification produced
smallest particle size. Further dissolution rate was increased to 65% within 10 min
which produced increased bioavailability with decreased gastric irritation.
Dashora K. et al, (2006) prepared microparticulate system of aceclofenac, an anti-
inflammatory drug by modified solvent evaporation using different variables like
cellulose acetate and aceclofenac ratios (1:9, 1:6, 1:3 & 1:1), stirring time (5-15 min)
and agitation speed (500-1,500 rpm)157
. The particle size increased from 80.2±1.4 to
97.3 ± 2.06 μm when the cellulose acetate concentration increases and it reduced in
increased agitation and stirring time conditions. At higher speed irregular shape
produced. A 1:6 (cellulose acetate: aceclofenac) ratio with 10 min stirring time at 1000
rpm created microspheres of high entrapment efficiency and uniform size with good
flow property and. Dissolution studies were performed for conventional, SR and

46
microspheres and the results obtained were 3h, 6h and more than 12h respectively. All
preparations followed first order and diffusion mechanism.
Liu L and Che B158
(2006) formulated atenolol osmotic tablet by coating the core tablet
by compression with punch with needle. PEO was used as suspending agent, sodium
chloride as osmogen, ethyl cellulose as polymeric membrane and PEG 400 as
plasticizer. The drug release was affected by the size of core tablet in the range of
(1.00–1.14) mm. Independent of dissolution media and agitation rate, the osmotic
tablet was found to deliver atenolol at a constant rate up to 24 h. The method simplified
the preparation of osmotic tablet by elimination of laser drilling.
Ramesh Babu V et al., (2006) developed carbohydrate polymeric microspheres,
containing sodium alginate and methylcellulose loaded with nifedipine by w/o
emulsion method159
. Cross linking was achieved by glutaraldehyde. Prepared
microspheres were characterized by DSC, SEM, particle size analyzer and invitro
release. The results suggested the distribution of nifedipine through polymer and
formation of spherical particles. The drug was released in a controlled fashion up to
12h.
Ruckmani K et al., (2007) formulated cytarabine HCl loaded eudragit L100
nanoparticles by emulsion polymerization, targeting to the tumor site160
. The
formulation exhibited sustained release up to 30 h, particle size ranged from 400–800
nm, spherical and uniform. The in-vitro release studies revealed that the formulation
had improved stability in biological fluids. In tumor bearing mice the altered
hematological parameters were restored by administering the cytarabine HCl
nanoparticles for 9 days and it increased the life span. From these studies it was
concluded that increased therapeutic quality of drug can be achieved.
Shakeel F et al., (2007) formulated aceclofenac nanoemulsion by spontaneous
emulsification method161
. The drug release of optimized formulation by diffusion cell
exhibited significant increase in steady state, permeability coefficient and enhancement

47
ratio. The F1 trial consisted of drug, triacetin, labrafil, tween 80, transcutol and water.
In vivo studies also strongly suggested that nanoemulsion are potential than the
conventional gel.
Hanafy A et al., (2007) studied the bioavailability of 4 types of fenofibrate
formulations including dissocube, SLN and two microsuspensions (reference)107
. Both
the colloidal systems showed two fold increase in bioavailability when compared to
reference. Between the two colloidal systems, no significant differences were found in
AUC, Cmax and tmax, which revealed that nanosuspensions were suitable delivery
improving the bioavailability of poorly soluble drugs.
Rastogi A et al., (2007) produced and evaluated spherical microspheres by using
sodium alginate as carrier to prolong the release of INH by modified emulsification
method162
. The results revealed that the microspheres had smooth surface, discrete and
spherical in shape with average particle size of 3.719 m. The particle size of the
microspheres increased with increase in concentration of polymer, cross-linker and
crosslinking time. The EE range was found to be 40–91%. EE increased upto 7.5%
increase in concentration of Concentration of the cross-linking agent up to 7.5% caused
increase in the EE. Optimized formulation was found to possess good bioadhesion of
72.25±1.015% resulting in sustained retention in the small intestine. Drug loading of
91% was recorded for the optimized formulation. In pH 1.2, nearly 26% of INH was
released in 6 h and in pH 7.4, 71.25% was released in 30 h.
Devarajan PV and Sonavane GS (2007) formulated eudragit L100 and eudragit RSPO
nanoparticles loaded with gliclazide by controlled precipitation and solvent evaporation
methods respectively163
. Both the polymeric nanoparticles showed high entrapment
efficiency and further addition of surfactants also produced increase in EE. Particle size
was altered by variations in drug polymer ratio. The formulation showed sustained
release of gliclazide from Eudragit L100 and Eudragit RSPO NP. The prepared
nanoparticles showed stability up to 6 months.

48
Farhana Yesmin et al., (2008) prepared aceclofenac agarose beads by ionotropic
gelation method. Entrapment efficiency and swelling index were found to be maximum
of 100±5 % and 18.22% respectively for beads containing 1:2 ratio of aceclofenac and
agar164
. Dissolution values for half of the formulations were higuichi and remaining
first order. With increased agar concentration, swelling index was increased and the
release of aceclofenac was reduced and with increased electrolyte concentration, it was
reverse.
Gonzalez M et al., (2008) prepared aspirin nanoencapsules by modified double
emulsion, using Eudragit L100 and L30 D-55165
. The average particle size was around
300 nm, EE found higher than 90%.The release profiles depicted initial small burst
release which was suitable to release in intestine rather than gastric medium.
Mutalik S et al., (2008) developed aceclofenac SR double-layer tablet using chitosan,
HPMC and CAP166
. IR and DSC studies showed the absence of drug-additive
reactions. Stability and pharmacokinetic studies were performed. M7 trial showed no
remarkable difference in in vivo test when compared to commercial product.
Liu L and Xu X (2008) prepared nifedipine bilayer osmotic tablet consisting push and
pull layer coated by ethyl cellulose containing polyethylene glycol 400 using pan
coating167
. PVP as suspending agent, NaCl as osmogen, and CCS as expanding agent
were utilized in the formulation. A part of drug layer left uncoated to obtain an aperture
for drug release. The optimized formulation produced 24hr release and followed zero
order.
Radhika PR et al., (2008) formulated aceclofenac delayed release microspheres by
solvent evaporation using CAP as enteric polymer168
. The effect of HPMCP, eudragit
L100 and eudragit S100 on aceclofenac release had been evaluated. HPMCP exhibited
positive influence and eudragit L100 and S100 exhibited negative influence. The
encapsulation efficiency was found to be 75.65-96.52%. Dissolution release followed

49
first order kinetics. The ratio 1:8:2 of aceclofenac:CAP:HPMCP produced delayed
release and considered as best formulation
.
Chirag N et al., (2008) studied the formulation of aceclofenac bioadhesive
microspheres by double emulsion solvent evaporation technique using polycarbophil as
polymer169
. The microspheres were spherical shape with good flow property. The drug
polymer ratio of 1:5 showed drug release of 89% within 10hr, mucoadhesion of 79%
and entrapment of 38%. Further IR and DSC of microspheres didn’t produce any drug
polymer incompatibilities. The in vitro release followed Higuchi model.
Attama AA et al., (2008) prepared combination of homolipid and phospholipid SLN
for diclofenac sodium for human cornea produced from HENC and epithelial cells170
.
The results revealed that the preparation had high entrapment efficiency with expected
permeation characters.
Trivedi P et al., (2008) microencapsulated aceclofenac using eudragit S100, RL 100,
and RS 100 by emulsion-solvent evaporation171
. The microspheres were freely
flowable, white and spherical in shape. The entrapment efficiency, angle of repose,
bulk & tapped density, Carr’s index and Hausner’s ratio were found to be 60-82%,
16.1 ± 0.62-24 ± 0.59, 0.311 ± 0.006-0.562 ± 0.012, 0.373 ± 0.01-0.735 ± 0.02, 14.04 ±
0.026 to 27.25 ± 1.405 and 1.14 ± 0.026-1.37 ± 0.03 respectively. The particle size was
found to be 79.7016-144.840 µm. The drug-polymer concentration of dispersed phase
influenced the particle size and drug release properties and all the formulations at
higher pH followed the Matrix-Higuchi model.
Tamizhrasi S et al., (2009) prepared lamivudine loaded eudragit nanoparticles by
nanoprecipitation method using different ratios of lamivudine to eudragit and
evaluated172
. The formulated nanoparticles had spherical particles; size increased from
121 ± 8 to 403 ± 4 nm with increase in eudragit concentration. The drug release was
achieved up to 24hr and followed zero order. The product remained stable for 2
months.
50
Lakshmana Prabu S et al., (2009) microencapsulated aceclofenac by o/w emulsion
solvent evaporation method using rosin. The effect of formulation variables
drug:polymer ratio, PVA concentration and dichloro methane volume were
examined66
. The prepared batches were characterized for particle size distribution, EE
and in vitro release behavior. The study reveals that drug: polymer ratio had a
considerable effect on the entrapment efficiency; however particle size distribution of
microspheres was more dependent on the volume of dichloromethane and polyvinyl
alcohol concentration rather than on the drug: polymer ratio. Drug, polymer
concentrations were varied to obtain optimum release profile for sustaining the action
of the drug.
Ho LTM et al., (2009) prepared ketoprofen loaded polymeric drug nanoparticles with
Eudragit E 100 by solvent evaporation173
. SEM, FTIR and size distribution were
performed. The average size of nanoparticles was found to be 150 nm. and the
morphology structure was investigated by scanning electron microscopy (SEM).The
EE depends on the integration of drug and polymer and glass transition temperature of
polymer.
Gattani YS et al., (2009) formulated aceclofenac gastroretentive microspheres by the
emulsification solvent-evaporation technique by using eudragit RS10067
. Effects of
eudragit concentration, temperature and stirring rate on size and drug release were
evaluated. The microspheres remained buoyant and released the aceclofenac for more
than 12hr. Increase in polymer concentration produced increase in size and decrease in
drug release. The prepared microspheres exhibited prolonged drug release and
remained buoyant for more than 12 h. No significant effect of the stirring rate during
preparation on drug release was observed.
Prakash Rao B et al., (2009) studied on swellable CPOP tablet containing theophylline
by direct compression and wet granulation methods based on Taguchi Orthogonal
Array design for core and Fraction Factorial design for coating32
. Ethyl cellulose

51
solutions with varying amount of PEG 400 and plasdone were used for spray coating.
USP paddle type apparatus was used for dissolution and the release was found to be
98.2%. SEM analysis conformed the formation of pores. Drug release was studied
using USP Type I paddle type apparatus and the membrane morphology of the delivery
system was determined by scanning electron microscopy (SEM).
Manjanna KM et al., (2009) formulated sodium alginate microbeads of aceclofenac by
ionotropic gelation method174
. The microbeads exhibited no significant drug polymer
interactions, particle size of 596.45 ± 1.04μm to 880.10 ± 0.13μm and % EE of 63.24 -
98.90%. Sphericity, particle size, size distribution, swelling ratio and EE were directly
proportional to the concentration of sodium alginate, CaCl2 and cross-linking time. The
release of aceclofenac sodium was examined in pH 1.2 for initial 2 h, in pH 6.8 up to
6h and in pH 7.2 up to 24h. Drug release was pH dependent and showed negligible in
pH 1.2. At neutral aceclofenac was released by swelling and erosion.
Yadav AV et al., (2009) formulated aceclofenac enteric microcapsules by emulsion
solvent evaporation using retardant polymer ethyl cellulose175
. Microcapsules prepared
were discrete, free flowing and spherical in shape. Particle size, %Entrapment
efficiency and % yield were 1350 μm to 532.5μm, 24.56% to 41.45% and 26.69% to
40.34% respectively. The drug release continued over a period of 12hrs and followed
higuchi model.
Selvakumar K and Yadav AV (2009) prepared Carvedilol loaded eudragit E100
nanoparticles by the nanoprecipitation method using poloxamer 407 as stabilizer176
.
The particle size varied from 190-270nm and encapsulation efficiency of 85-91%. The
drug released within 5 minutes. By the results it was concluded that eudragit E100
nanoparticles loaded with carvedilol can be successfully used for the management of
hypertension.
Patel DJ et al., (2009) formulated famotidine nanosuspension by nanoprecipitation
technique177
. The combination of less amount of stabilizer with low speed produced

52
transparentbluish-whitenanosuspensions withmean particle size of 566 nm. The
resultant nanosuspension had enhanced release rate. The nano sized drug batch,F1
released 42% within 10 min whereas micronized drug batch, F7 released 2.5% only.
Shakeel F et al., (2009) compared pharmacokinetic profile of nanoemulsion gel,
nanoemulsion, and marketed tablet of aceclofenac by transdermal and oral application
on Wistar male rats178
. The absorption of aceclofenac when compared to oral tablet
formulation, the transdermally applied nanoemulsion gel and nanoemulsion resulted in
2.60 and 2.95 fold increase in bioavailability indicating that the nanoemulsions can be
fruitfully used as effective vehicle for enhancement of bioavailability of aceclofenac.
Jawahar N et al., (2009) developed carvedilolnanoparticles by nanoprecipitation
method using PLGA and Pluronic F-68. Particle size of 132-234nm were achieved179
.
EE and drug release was found to be 77.6% and 72% at 24hr respectively.
Biodistribution studies suggested that at higher concentration carvedilol may be
delivered to the target sites.
Agnihotri SM and Vavia PR. (2009) Prepared PLGA and poly (lactide-co-glycolide-
leucine) nanosuspensions of diclofenac sodium by solvent evaporation180
. This system
possessed improved bioavailabilty. In vitro studies produced extended release of
diclofenac. The stability of this formulation was good throughout the period of six
months. The drug release data evidenced that the product can deliver drug for 24hrs.
Khushwant S et al., (2009) developed nine batches of Cytarabine-loaded PLGA
nanoparticles by modified nanoprecipitation181
. A 32 factorial design was used to
optimize the volume of cosolvent (0.22 to 0.37 ml) and non-solvent (1.7 to 3.0 ml).
Again 32
optimization factorial design was used for drug:polymer ratio considering the
mean particle size (125±2.5 nm), and % entrapment efficiency (21.8±2.0%). Optimized
formulation showed minimum increase in their particle size, and zeta potential of −29.7
mV. Nanoparticles released the drug up to 24 h. The formulations were stored in freeze
53
dried condition at 2-8°C and the stability studies indicated that the formulation was
stable in particle size and drug content for a period 2 months.
Raghavendra Rao NG et al., (2010) developed chitosan microparticles loaded with
aceclofenac by ionotropic gelation technique182
. Increase in TPP concentration; pH and
cross-linking time decreased the drug release. With increase in cross-linking time, the
particle size reduced and found to be between 1194.1 to 1568.9 μm. In pH 7.4
phosphate buffer showed slight burst release in first hour followed by prolonged
release for 8 hrs. The values of regression coefficient r2
were found to be greater (≤
0.9541) for first order than for zero order (≤ 0.8740) and the r2
value for Higuchi was ≤
0.9805 suggesting diffusion controlled process.
Xia D et al., (2010) prepared and evaluated nitrendipine nanosuspensions by the
precipitation–ultrasonication183
. The particle size was 209±9 nm and zeta potential of
was −13.9±1.9 mV. XRPD and DSC results showed that the shape of nanocrystals was
flaky and no consdierable crystalline changes were observed. By reducing the particle
size, the dissolution rate markedly increased. In rats Cmax and AUC0→12 values of
nanosuspension was approximately 6.1 and 5.0 fold increase respectively than that of
marketed tablets.
Mothilal M et al., (2010) formulated osmotically controlled oral drug delivery system
by wet granulation for metoprolol succinate using varying concentrations of
mannitol184
. The tablets were subjected to dip coating with cellulose acetate. All
evaluation tests were performed. Orifice size was analyzed by SEM. The amount of
osmogen used and pore size were directly proportional to rate of drug release upto the
optimum concentration.
Verma A et al., (2010) encapsulated selected drugs within PMMA copolymer
(Eudragit RS100 and Eudragit RL100), by solvent evaporation method185
. Magnesium
stearate was used as stabilizer in concentration of 0.3% (v/v). In vitro dissolution tests
for all the selected formulations exhibited a prolonged release for almost 24 hr. The

54
mean particle size of microspheres ranged from 75 to 225 μm, a spherical and uniform
appearance with rough surface and encapsulation efficiency ranged from 72.72 to
95.88% (w/w). Mechanism of release was found to be Higuchi type. In vivo study of
microspheres showed significant analgesic and anti‐inflammatory activities of
microspheres for longer period of time in albino wistar rats when compared to the
parent drug. This study indicated that eudragit microspheres sustain the release of drug
but also minimize the side effects.
Kumar KK et al., (2010) prepared controlled release aceclofenac microcapsules by
solvent evaporation186
. The granules are encapsulated into the capsules and subjected to
particle size, dissolution, encapsulation efficiency and compared with commercial
marketed product. Ethylcelllulose, liquid paraffin, cyclohexane and emulsifying agent
were added in the formulation. Results showed that 1:6 ratio had 99.08% EE, and 98%
drug release.
Sheaikh S et al., (2010) designed OCDDS containing aceclofenac187
. This system
utilized the osmotic principle for drug delivery, so that the release rate was independent
of pH, food and physiological factors etc. Formulation 2a released maximum of 96% in
controlled passion.
Cetin M et al., (2010) formulated and evaluated Eudragit L100 & Eudragit
L100/PLGA nanoparticles loaded with diclofenac sodium188
. Prepared Nanoparticles
were spherical in shape with particle size of 241-274nm. Entrapment efficiency was
found to be 25.8-62%. Drug release studies showed that initial burst release of 38-47%
occurred during the first 4 hr. Maximum drug release for Eudragit L100 nanoparticles
was 92% at 12hr. Eudragit L 100/PLGA (20:80), Eudragit L100/PLGA (30:70),
Eudragit L100/PLGA (50:70) nanoparticles produced drug release of 56%, 69% and
81% at 72h respectively.
Deveswaran R et al., (2010) formulated aceclofenac SR microspheres using egg
albumin189
. The particle size, entrapment efficiency and percentage yield was found to
be 99.6 μm, 65.2% and 96.99% respectively. The drug released within 10hrs for 1:1

55
drug polymer ratio and sustained for 12 hrs for 1:2 drug polymer ratio. Ths study
reduced the dosing frequency and improved the patient compliance.
Chakraborty S et al., (2010) prepared microspheres of aceclofenac by gelation
technique190
. Combination of sodium alginate and carbopol934 were used as retardant.
All formulations showed good flow property, particle size and % swelling.
Microspheres are spherical in shape. Mucoadhesive property increased with increase in
polymer concentration. In vitro results showed that increase in polymer concentration
caused decrease in drug release. F7 trial sustained release for 12 hr.
Manjanna KM et al., (2010) developed oral SR microbeads of aceclofenac by ionic
gelation using sodium alginate and calcium chloride191
. The process was optimized for
parameters drug:polymer ratio, rotational speed and cross-linking time. Increase in
polymer and crosslinker concentration, resulted in increased size, flow properties and
entrapment efficiency. The average particle size and EE were found to be 596.45 ±
1.04 to 880.10 ± 0.13 μm and 63-98%. The drug was released at negligible rate for first
2 hr and controlled rate for upto 24hrs.
Patel HR and Patel MM. (2010) prepared and evaluated osmotic controlled
mucoadhesive cup-core containing aceclofenac192
. Formulations containing HPMC had
higher swelling index. The drug release studies showed a release up to 12 h following
zero order kinetics with diffusion mechanism. Further the formulation showed
significant anti-inflammatory activity (P<0.001) without hypersensitive reaction. The
results revealed that OCMC overcomes the problems associated with bucoadhesive
tablet.
Chakraborty S et al., (2010) prepared and evaluated algino-pectinate bioadhesive
microspheres of aceclofenac193
. Drug release was fast in alginate and prolonged in
algini-pectinate microspheres. The microspheres exhibited good biodhesion character
with high EE. Based on the in vivo test results the algino-pectinate microspheres
exhibited sustained release.

56
Khandai M et al., (2010) prepared aceclofenac loaded sericin- alginate microspheres by
gelation technique using a blend of sodium alginate and sericin as release retardant and
evaluated for particle size, flow behavior, swelling properties, surface morphology
study by SEM and in vitro drug release etc194
. All the formulations showed good flow
property as compared to the pure drug. The result showed that the release of all the
formulations was gradually decreased on increasing the polymer concentration
following zero order kinetics followed by case-II diffusion. Ex- vivo mucoadhesion
study depicts that when the polymer concentration was increased the mucoadhesion
nature was also increased. FTIR study showed that the major peaks of pure drug were
almost intact in the formulation.
Ahad HA et al., (2010) developed matrix tablets of Aceclofenac with Prosopis
cumanensis gum and evaluated once-daily sustained release of the tablets195
. The
formulated tablets found to have better uniformity of weight and drug content with low
SD values. The dissolution study proved that the dried Prosopis cumanensis gum can
be used as a matrix forming material for making once daily sustained release matrix
tablets.
Chella N et al., (2010) formulated microspheres of diclofenac sodium using EC as
retardant material by w/o emulsion method using methylenechloride/ethanol solvent
system; span 80 and n-hexane were added in the formulation of microspheres196
.
Prepared microspheres were sphere shape, excellent flowing with EE of 51.2% and
release upto 10hr. The system follows diffusion controlled mechanism.
Kakran M et al., (2010) fabricated artemisinin nanoparticles by evaporative
precipitation and investigated by full factorial design197
. The result revealed that the
prepared nanoparticles showed decreased crystallinity with increased drug
concentration. Particle size was found to be 100–360 nm, the optimized formulation
holds dissolution of 75.9%.
57
Kietzmann D et al., (2010) formulated carboxyfluorescein microspheres with eudragit
100, for colon targeting198
. Kinetic parameters of microspheres were compared to oral
and rectal. Bioavailability of oral route was lowered in colitis than the healthy group
(colitis group 3.0 ± 0.9, healthy group 8.4 ± 1.5) and comparable results were obtained
in rectal route (colitis group 1.8 ± 0.8, healthy group 5.6 ± 2.1). But the microspheres
showed minimal difference between colitis and healthy groups (colitis group 2.3 ± 0.4,
healthy group 1.9 ± 0.8).
Arias JL et al., (2010) investigated polycaprolactone loaded with ftorafur and
diclofenac sodium aimed to achieve better therapeutic activity199
. Drug was loaded by
surface adsorption and interfacial polymer disposition methods. High loading with
small burst release achieved by these techniques.
Pandey S. (2010) formulated itraconazole nanosuspension by pearl milling method
using ZrO2 beads as a milling media, poloxamer 407 as stabilizer and glycerol as
wetting agent200
. The nanosuspension was optimized by considering parameters like
stirring period and ratio of milling media keeping. The optimized formulation showed a
mean particle size of 294nm, high assay value, higher release in 0.1N HCl, with no
significant change in crystalline nature.
Wakode R et al., (2010) developed pramipexole PPOP tablets for parkinsonism31
.
Pramipexole PPOP consists of polymeric push layer and drug pull layer coated with
cellulose acetate and PEG. In vitro and in vivo studies conformed that the developed
formulation persists its pramipexole plasma level for 24 hr period.
Gowda DV et al., (2010) formulated a drug loaded transdermal film by casting method
using sodium alginate and MLBG201
. The effects of drug polymer ratio, plasticizer
concentration on drug release were studied. The films showed 1.90 to1.95 mg/sq.cm of
drug content, 0.29 to 0.38 mm thickness and found to be compatible and stable.
Increase in MLGB and decrease in sodium alginate caused decreased folding
endurance. In-vitro tests produce controlled release for 24hr. Absence of erythema,

58
edema or ulceration suggested that prepared transdermal films were effective with
good skin tolerability.
Gaikwad A et al., (2010) prepared furosemide loaded eudragit RS100 nanoparticles
with various drug carrier ratios by using nanoprecipitation method for oral delivery202
.
The results indicated the sphericity with particle size of 163nm to 378 nm, entrapment
efficiency of 14.95 ± 0.06 to 69.73±0.03%, and drug release up to 24 hrs. It followed
higuchi kinetics. Zeta potential supported the stability, and further stability study for 60
days produced the good stability of the product.
Guerrero S et al., (2010) prepared ketotifen loaded chitosan microspheres by spray
drying followed by addition of glutaraldehyde in methanol as cross-linker for
controlled release200
. Results indicated that high load of drug (92 ± 6 μg KT/mg) and
spherical microspheres of size 1.0–1.3 μm were achieved. Further results showed that
loading of KT decreased with cross-linking (52 ± 2– 46 ± 7 μg KT/mg). KT release
was detected in blood at 24 h.
Yadav IK et al., (2010) developed aceclofenac matrix tablets consisting of hydrophilic
& hydrophobic polymers by direct compression using optimizing parameter as drug
polymer ratio204
. In vitro release of F1, F4 and F7 batches extended up to 12 hrs and
followed zero order. Drug release was reduced by increasing the polymer
concentration. Stability studies for 3 months indicated that the product was stable and
the polymers used were suitable for delivery of aceclofenac.
Ahad HA et al., (2010) investigated Prosophis juliflora as matrix material for once a
daily aceclofenac tablets by using drug and matrix material ratios of 1:0.25, 1:0.375,
1:0.5, 1:0.675 & 1:0.750205
. The flow properties of the gum were recorded. The tablets
were evaluated for thickness, hardness, friability, uniformity of weight, swelling and in
vitro release. All the recorded values were within the limit. From the dissolution values
it can be concluded that Prosophis juliflora can be used as polymeric matrix carrier for
SR tablets.

59
Xu WJ et al., (2011) prepared and optimized controlled porosity osmotic tablets for
salvianolic acid (SA) using experimental design methods including an artificial neutral
network method206
. Three causal factors, i.e., drug, osmotic pressure promoting agent
rate, PEG400 content in coating solution and coating weight, were evaluated based on
their effects on drug release rate.The linear correlation coefficient of the accumulative
amount of drug release and the time of 12h, r(Y1), and the sum of the absolute value
between measured and projected values, Y2, were used as outputs to optimize the
formulation. The weight expression Y¼(1_Y1)2þY2 2 was used in the calculation.
Furthermore, the ANN and uniform design gave similar optimization results, but ANN
projected the outputs better than the uniform design. This paper showed that the release
rateof salvianolic acid B and that of the total salvianolic acid was consistent in the
optimized formulation.
Reza KhZ et al., (2011) formulated aceclofenac monolithic osmotic tablet and
investigated the formulation variables including amount of explotab and sodium
chloride207
. Both explotab and sodium chloride produced positive effects. The optimal
orifice size was 800 μm. Incorporation of polyethylene glycol (PEG) in CA membrane
improved drug release. This system followed zero order for 24 hrs.
Li W et al., (2011) prepared 3 suspensions containing revaprazan hydrochloride by
high pressure homogenization and evaluated the same105
. The reports revealed that both
microsuspension and nanosuspension exhibited and remained as crystalline in nature.
In vivo tests for coarse, micro and nano suspension were determined. Nanosuspension
exhibited notable increase in AUC, Cmax, Tmax and MRT when compared with
coarse, but microsuspension didn’t produce any difference in pharmacokinetic
parameters. The work made an impact on enhanced oral bioavailability of revaprazan
HCl by reducing the particle size reduction.
Gao L et al., (2011) prepared a stable quercetin nanosuspension by using evaporative
precipitation and high homogenization process208
. The particle size and zeta potential

60
of the nanosuspension prepared by first method was similar to that of second one. In
first method the dried powder showed crystalline to amorphous state and in second
crystallinity was maintained. First method produced higher dissolution than the second.
Both the methods were feasible and superior over the quercetin solution.
Zhang ZH et al., (2011) developed an expert system for poorly water soluble drugs as
PPOP209
. Hundreds of PPOP were considered to poorly soluble drugs with inert
additives. By utilizing knowledge database, rule base and from researchers an expert
system was builded based on the reports of PPOP formulations. Famotidine was
selected as model drug to validate the expert system.

61
4. PLAN OF WORK
The plan of work was given below
I. PREFORMULATION STUDIES
i) Analysis of Aceclofenac
UV Spectroscopy
IR Spectroscopy
Melting point
Loss on drying
Angle of repose
Bulk density and tapped density
Compressibility index
Hausner’s ratio
ii) Drug-Excipient compatibility studies
IR Spectroscopy
DSC technique
iii) Preparation of standard graph of aceclofenac
II. FORMULATION AND EVALUATION STUDIES:
i) Formulation and evaluation of Aceclofenac osmotic tablets
Formulation of aceclofenac oral osmotic tablets (OT1-OT13)
Evaluation of aceclofenac oral osmotic tablets (OT1-OT13)
Content uniformity
Weight variation test
Thickness
Hardness test
Friability test
Osmotic pressure
In vitro dissolution

62
ii) Formulation and evaluation of Aceclofenac microspheres
Formulation of aceclofenac microspheres (M1 – M15)
Evaluation of aceclofenac microspheres (M1 - M15)
Flow properties
Particle size
Morphology
Drug content
Entrapment efficiency
In vitro release
iii) Formulation and evaluation of Aceclofenac nanosuspension
Formulation of aceclofenac nanosuspension (F1 – F27)
Evaluation of aceclofenac nanosuspension (F1 – F27)
Particle size
Morphology
Zeta potential
Drug content
Entrapment efficiency
In vitro release
III. PHARMACOLOGICAL STUDIES:
Anti-inflammatory studies
GI tolerability studies
IV. STABILITY STUDIES:
Stability studies of best formulation (Osmotic tablets - OT10)
Stability studies of best formulation (Microspheres - M4)
Stability studies of best formulation (Nanosuspension - F-14BYM)

63
5. DRUG PROFILE AND ADDITIVES PROFILE
ACECLOFENAC
Synonyms:
Airtal, Falcol, PR-82/3, Gerbin, Preservex
Chemical Name:
2,[(2,6-dichlorophenyl)amino]benzene acetic acid carboxy methyl ester
2-[(2,6-dichlorophenyl)amino]phenyl acetoxy acetic acid
Glycolic acid [O-(2,6 – dichloroanilino)phenyl] acetate ester
Molecular Formula:
C16H13Cl2NO4
Molecular structure:
Fig.5.1 ACECLOFENAC
Molecular Weight:
354.2
Where C → 54.26%, H → 3.7%, Cl →20.02%, O→ 18.07%, N → 3.95%
Description:
Aceclofenac is a new Non-steroidal anti-inflammatory drug (NSAID) which acts
on inflammatory sites.
Physical Appearance:
Crystalline white powder

64
Percentage purity:
99.0 – 101.0%
Melting point:
149 - 153ºC
Loss on drying:
Maximum of 0.5% calculated on basis of drying 1gm at 100 - 105ºC
Solubility:
Insoluble in water, however spontaneously soluble in acetone, dimethyl formamide,
ethanol and in methanol.
Identification210
:
i) 50mg of drug is dissolved in methanol and diluted to 100ml. From the above
solution 2ml is diluted to 50ml with the same solvent. The diluted solution is
examined at nanometer of 220 to 370. The absorption maximum shows at 275nm.
ii) It can be identified by IR spectrum. Sample spectrum is compared with aceclofenac
standard.
iii) 10mg of drug is dissolved in 10ml of alcohol. From this 1ml of solution is taken, to
this, 0.2ml of mixture (6g/l Potassium ferricyanide solution and 9g/l ferric chloride
solution) is added. This solution is allowed to stand for 5 minutes in light protected
place. Then 3ml of 10g/l HCl solution is added. Again this solution is allowed for
15 minutes. A blue color is developed and precipitate formed.
PHARMACOLOGY:
Mechanism of Action211
:
The multifactor mechanism of aceclofenac may be given as follow
i) Inhibition of interleukins-beta and tumor necrosis factor in the inflammatory
cells (Intracellular action):
Interleukins-beta, tumor necrosis factor are released by inflammatory cells
which are responsible for the production of prostaglandin E2. Aceclofenac inhibits
COX (cyclooxygenase) activity; thereby suppress the prostaglandin E2 synthesis.
Aceclofenac penetrates into the affected cells and hydrolyzed to active drug. This
active drug inhibits interleukin and tumor necrosis factor, which may result in
suppression of synthesis of prostaglandins.

65
ii) Stimulation of synthesis of extracellular matrix in human articular cartilages:
Aceclofenac stimulates extracellular matrix synthesis by inhibiting the
action of cytokines. This leads to inhibition of development of inflammatory cells,
inhibition of increased synthesis of MMP and proteoglycan production.
iii) Inhibition of neutrophil adhesion and accumulation:
Aceclofenac contains diphenylamine core which is responsible for
inhibition of transmigration of neutrophils to inflammatory cells and tissues.
PHARMACOKINETICS212
:
Absorption:
After oral administration, aceclofenac immediately and completely absorbed. Tmax
reached between 1.25 - 3 hours of administration. Food may alter the absorption rate.
Bioavailability is 60-70%.
Distribution:
Aceclofenac is having high affinity to protein (99.7%). It penetrates to the synovial
fluid. The Volume of distribution (Vd) is around 30 Litres.
Metabolism:
Aceclofenac is metabolized in human microsomes and hepatocytes as hydroxyl
metabolites. The chief metabolite is 4’-hydroxyaceclofenac. Some other metabolites
include 5-hydroxyaceclofenac, diclofenac and 5-hydroxydiclofenac.
Elimination:
Approximately 70 -80% of dose administered is eliminated through renal excretion.
Around 20% is eliminated through faeces. Elimination half-life is 4-4.3 hrs. Eliminated as
glucuronides of aceclofenac.
THERAPEUTIC USES213
:
Aceclofenac is catergorized as anti-inflammatory and analgesic.
It is used in conditions of pain and inflammations in
Rheumatoid arthritis
Osteoarthritis
Ankylosing spondylitis
Post-traumatic pain

66
Cervical pain
Low back pain
DOSING PARAMETERS:
Normal adults – Maximum 200mg/day
Elderly patients- Same as adult as there is no change in ADME
Children – No clinical data
Hepatic insufficiency
Severe – not recommended
Mild/moderate – 100mkg/day
DRUG INTERACTIONS214
:
Aceclofenac produces interactions with some drugs which are listed below:
Lithium, methotrexate and digoxin. Acelclofenac increases the blood level of these
drugs which may cause toxicity.
Risk of bleeding in GIT with anti-clotting drugs like ticlopidine, warfarin, heparin
Aceclofenac and ketoralac cause haemorrhage
Aceclofenac and quinoline antibiotics produce convulsion
Aceclofenac with frusemide, reduces the effect of the later/latter
Aceclofenac with cyclosporine may induce risk of nephrotoxicity
Aceclofenac with corticosteroids may produce stomach irritation
ADVERSE DRUG REACTIONS215, 216
:
Aceclofenac produces the adverse reactions give below
Dyspepsia, vomiting diarrhoea, abdominal pain
Flatulence, constipation, gastritis, constipation, ulcerative stomatitis
Dizziness, headache, allergic reactions, increase in weight
Rash, pruritis
Increased serum creatinine and urea
Blood disorders such as anaemia, thrombocytopenia, granulocytopenia, neutropenia
Cardiovascular disorders such as palpitation, edema, flushing
Nephrotic syndrome

67
Psychiatric disorders such as depression, somnolence, insomnia
PRECAUTIONS/WARNINGS215, 216
:
In some disease state aceclofenac should be used with caution. Such states include
Hepatic Porphyria (Blood disorder caused by liver defect)
Bleeding conditions
Crohn’s disease
Reduced heart function
Elderly patients those easily affected by adverse reactions
Peptic ulcers
GI inflammation
Reduced kidney function
Patients undergone recently major surgery
Stomach and intestinal disorder
CONTRAINDICATIONS217
:
In some disease conditions aceclofenac should be avoided. Such states include
Peptic or duodenal ulcer
Bleeding in Stomach or intestine
Kidney failure
Asthma, acute rhinitis or urticarial
7th to 10th months of pregnancy which may cause delayed delivery, neonatal
respiratory hypertension, renal function
During lactation. If it is essential can be given
STORAGE:
It should be stored in air tight container. It should be protected away from light.
PREPARATIONS:
Aceclofenac is available as conventional tablets, SR tablets, capsules and gel.
68
ADDITIVES PROFILE
SODIUM BICARBONATE218,219
:
Synonyms: Baking soda, sodium acid carbonate, monosodium carbonate
Chemical Name: Carbonic acid monosodium salt
Molecular formula: NaHCO3
Molecular weight: 84.01
Description: White, odourless crystalline inorganic salt.
Solubility: Soluble in water (96g/l at 20ºC), Insoluble in ether & ethanol.
Melting point: 270ºC
Particle size: Based on the grades particle size may range from 15 to 300 μm.
Density: 2.15 at 20ºC
Bulk Density: 0.8690 g/cubic cm
Tapped density: 1.3690 g/cubic cm
LOD: 40%
Storage: Should be stored in well closed container.
Incompatibilities: It may produce CO2 with acidic and alkaloidal salts.
Applications: Antacid and osmotic agent. In effervescent tablets it is used to
produce CO2. It can be used as buffering agent or as stabilizer in
tooth paste.
SODIUM CHLORIDE219, 220
:
Synonym: Hopper salt, rock salt, table salt
Molecular formula: NaCl
Molecular weight: 58
Description: White, isometric orthorhombic cubic crystal form.
Solubility: Soluble in water, slightly soluble in ethanol
Melting point: 800.8 ºC
Boiling point: 1,465 ºC
Refractive index: 1.544
Density: 2.16 g/cc

69
Bulk density: 1.154 g/cc
Angle of repose: 32º
LOD: < 0.5%
Hardness: 2.5 (Moh scale)
Storage: Stored in well closed container
Applications: Solid dosage form diluent, osmogen
POTASSIUM CHLORIDE219,221
:
Synonyms: K-lyte, k-lor
Molecular formula: KCl
Molecular weight: 74.55
Description: Crystalline, white to colourless, KCl naturally occurs as sylvite.
Solubility: Soluble in water and ethanol, insoluble in ether.
Melting point: 773ºC
Refractive index: 1.456
Specific gravity: 1.988
Bulk density: 0.96 g/cc
Angle of repose: 28-30º
LOD: Maximum 1% (105 ºC for 2 hrs)
Percentage purity: 99-100.5%
Toxicity: Cardiac, GI ulcer, diarrhea, vomiting and hyperkalemia
Storage: Store in air tight container
Incompatibility: incompatible with amphotericin, phenytoin, mannitol
Applications: Pharmaceutically used as an osmogen and electrolyte replenisher.
Widely used in food materials like cheeses, soup, sauces and drinks
HYDROXYPROPYL METHYL CELLULOSE219, 222
:
Synonyms: Methocel, Methylcellulose, cellulose, hydroxypropylmethyl ether,
hypromellose
Molecular weight: Ranges between 10000 to 1500000
Description: Odourless, tasteless, creamy white powder
Solubility: Forms viscous solution in water. Insoluble in ethanol, ether and

70
chloroform.
Melting point: Browning at 190 - 200ºC and charring at 225 - 230 ºC
Viscosity: 4000 mPa s (2% aqueous solution of HPMC K4M )
Specific gravity: 1.26
True density: 1.326 g/cm3
Bulk Density: 0.341g/cm3
Tapped density: 0.557g/cm3
Loss on drying: Maximum of 5%
Residue on ignition: 1.5%
Storage: Well closed container.
Incompatibility: It produces molecular adducts with sodium salicylate, sulfathiazole
and tannins.
Applications: Used in tablet manufacturing as binder, sustained release and film
material. It can also be used as thickening and suspending agent in
ophthalmic preparations.
MICROCRYSTALLINE CELLULOSE219, 223
:
Synonyms: Avicel, cellulose crystalline, tabulose, fibrocel
Molecular formula: (C6H10O5)n Where n 220
Molecular weight: 36000
Description: White, odourless, crystalline powder comprising porous particles
Solubility: Insoluble in water, organic solvents, slightly soluble in 5% NaOH
Melting point: 260 - 270ºC
True Density: 1.512 to 1.668 g/ml
Bulk Density: 0.32 g/cc
Tap Density: 0.45 g/cc
Particle size: Ranges from 20 to 200μm
Moisture level: < 5%
Storage: Stored in well closed container free from moisture
Incompatibility: It may produce incompatibility with strong oxidants

71
Applications: MCC at different concentrations it can be used for different
purposes. 20 to 90% is used as adsorbent, 5 to 20%, and 5 to 15%
used as anti-adherent and disintegrants respectively.
PVP K30224
:
Synonym: Povidone
Chemical Name: 1-Ethenyl-2-pyrolidinone homopolymer
Molecular weight: 50,000 (approx.)
Molecular formula: (C6H9NO)n
Description: White creamy odourless powder, hygroscopic nature.
Solubility: Soluble in chloroform, methanol, ethanol and water .
Insoluble in ether.
Preparation: By spray drying
Storage: Air tight containers
Applications: Used in pharmaceutical formulations as granulating agent,
suspending agent, coating material or viscosity builders.
MAGNESIUM STEARATE219, 224
:
Synonyms: Magnesium salt, octadecanoic acid, stearic acid
Chemical Name: Octadecanoic acid magnesium
Molecular Formula: [CH3(CH2)16COO]2Mg
Molecular weight: 591.34
Description: Fine, white, precipitated powder having stearic acid faint odour and
taste. It adheres to the skin.
Solubility: Slightly soluble in benzene and ethanol (warm conditions).
Insoluble in water, ethanol and ether.
Melting point: 126-130ºC
True density: 1.09 g/ml
Bulk density: 0.15 g/ml
Tapped density: 0.28 g/ml
Surface area: 1.6-14.8m2/g
Storage: Well closed container, cool and dry place
72
Incompatibilities: With oxidizing substances, strong acids, alkalis, and some vitamins.
Applications: Used as lubricant in tablet/capsule preparation.
Commonly used in food, cosmetic and pharmaceutical industries.
TALC224
:
Synonyms: Purtalc, Magsil star, soap stone
Formula: Mg6(Si2O5)4(OH)4
Description: White to dim colour, odourless, crystalline in nature. Sticks on skin.
Solubility: Insoluble in organic solvents and water.
pH: 6.5 – 10 (20% aqueous soln.)
Specific gravity: 2.7 to 2.8
Bulk density: 0.21 g/cc
Hardness: 1-1.5 (Moh scale)
LOD: Less than 1%
Storage: Stored in well closed container.
Incompatibilities: With quarternary ammonium type of compounds
Applications: Lubricant in tablet and capsule formulations.
It is also used in the CR formulation as dissolution retardant.
It is also used in clarification of liquids.
CELLULOSE ACETATE225
:
Synonyms: Acetylcellulose
Chemical name: Cellulose diacetate and cellulose triacetate
Description: Powder or pellets with no taste and odour.
Solubility: Soluble in acetone-water mixture.
Melting point: 230 - 300 ºC
Glass transition (Tg):170-190ºC
Density: 0.4g/ml
Loss on drying: less than or equal to 5%
Storage: Stored in cool and dry place.
Incompatibility: With acidic and alkaline materials.
Applications: As a coating material for SR systems.

73
POLYETHYLENE GLYCOL 400225
:
Synonyms: Polyoxyethylene glycol, carbowax, Macrogol
Chemical name: α hydro-ω-hydroxypoly(oxy-1,2-ethanediol)
Molecular formula: HO-CH2-(CH2-O-CH2)8.7-CH2-OH
Avg mol weight: 380-420
Description: Clear, colourless viscous liquid with characteristic odour and bitter
taste
Solubility: Miscible in ethanol, chloroform, fixed oils and in organic solvents.
Immiscible in water, methanol, ethyl acetate.
Density: 1.12 g/cm3 at RT
Viscosity: 105-130 cP
Refractive index: 1.46
Storage: Store in well closed container.
Applications: Plasticizer, ointment & suppository base, poreformer in osmotic
systems.
EUDRAGIT L100226
:
Synonyms: Polymethymethacrylate, Kollicoat
Chemical name: Poly(methacrylic acid methylmethacrylate)
Structure:
Avg. mol. wt.: 1, 23,000 (approx.)
Description: White powder, with faint odour
Solubility: Soluble in methanol & acetone, insoluble in water and ethylacetate.
Glass ignition temp: >150ºC
RI: 1.39
Acid value: 315 mg Potassium chloride/gram Eudragit L100
True density: 0.83-0.85 g/ml

74
Bulk density: 0.39 g/ml
Tapped density: 0.42 g/ml
LOD: 5% dried at 110 ºC for 6 hrs
Storage: Protected from heat and moisture
Applications: Enteric coating polymer, binder, film former.
PLGA227, 228. 229
:
Synonyms: Resomer
Molecular formula: [(C6H8O4)x(C4H4O4)y]n
Molecular structure:
x = no. of lactic acid units, y = no. of glycolic acid units
Wt. Avg. mol. wt: Varies from 5000 to 20000.
Description: It is a biocompatible/biodegradable polymer synthesized from lactic
acid and glycolic acid. Amorphous in nature.
Solubility: Soluble in acetone, ethylacetate, but insoluble in water, methanol
and ethanol.
Tg: 40-60ºC
Degradation: Degraded into glycolic and lactic acids in body by hydrolysis.
Storage: Stored in a temperature of -20ºC.
Applications: It can be successfully used for sustained release formulations. It can
be used for preparation of microspheres, nanoparticles for effective
and targeted delivery of drugs.
POLYVINYL ALCOHOL219
:
Synonyms: Gelvatol, mowiol, PVA.
Solubility: Soluble in water.
Formula: (C2H4O)x
Molecular weight: 20,000 to 2,00,000

75
Melting point: 228ºC
Specific gravity: 1.19-1.31 at RT
Density: 1.19-1.31g/cm3
Properties: Odourless, high tensile strength. Water reduces the tensile strength.
It is completely degradable nontoxic material.
Uses: Film forming agent, stabilizer in emulsions, suspensions etc.
ETHANOL219
:
Synonym: Alcohol, ethyl alcohol, synasol
Molecular Formula: C2H5OH
Molecular weight: 46.07
Boiling point: 78.5ºC
Density: 0.789 g/cc
Properties: Polar because of –OH group. It can form hydrogen bond easily.
Miscibility: Miscible with water at all concentrations.
Applications: Wide range of applications in pharmaceutical field and in other
fields. It is used as a solvent for extraction of many drugs. The major
advantage of ethanol is its capability of free from microorganisms.
METHYLENE CHLORIDE219
:
Synonym: Dichloromethane
Molecular formula: CH2Cl2
Description: Colourless liquid and volatile in nature.
Applications: Used as solvent in preparation of microspheres and nanoparticles.
METHANOL219
:
Synonyms: Methyl alcohol, carbinol
Molecular Formula: CH3OH
Molecular Weight: 32.04 g/mol
Description: White colourless liquid with alcoholic odour, miscible in water.
Boiling point: 64.7ºC
Melting point: -97 ºC

76
Flash point: 12ºC
Applications: Used as solvent in preparation of bulk drugs, micro & nanoparticles.
ACETONE219
:
Synonyms: dimethyl ketone, dimethyl formaldehyde
Chemical name: 2-Propanone
Molecular formula: C3H6O
Molecular weight: 58.08
Description: Colourless volatile liquid.
Solubility: Miscible in water and ethanol.
Odour: Fruity
Boiling point: 56.2ºC
Melting point: 94.35ºC
Density: 0.7899 g/ml
Applications: Used as solvent in formulation of microspheres and nanoparticles.
Widely used as a solvent in production of various compounds like
methacrylic acid, bisphenol etc.
TWEEN 80219
:
Synonym: Polysorbate 80, Alkest, Crillet 4
Formula: C64H124O26
Molecular weight: 1310 daltons
Description: Non-ionic surfactant obtained from polyethoxylated sorbitan and
oleic acid. Amber colour viscous liquid.
Solubility: Soluble in water, methanol and ethanol. Insoluble in mineral oil.
Relative density: 1.07 (RT)
Viscosity: 400 to 620 cps
Melting point: -20.5ºC
HLB Value: 15
Surface tension: 42.5 dynes/cm
CMC: 13 to 15 mg/litre
Applications: Emulsifier, stabilizer.

77
6. MATERIALS AND EQUIPMENTS
The materials and equipments used for the preparation of osmotic tablets,
microspheres and nanosuspension were given below:
Table 6.1. MATERIALS USED
S.No Material Source
1. Aceclofenac Tablets India Ltd., Chennai
2. Sodium bicarbonate Sisco research laboratories pvt ltd, Mumbai
3. Sodium chloride Sisco research laboratories pvt ltd, Mumbai
4. Potassium chloride Sisco research laboratories pvt ltd, Mumbai
5. Microcrystalline cellulose Indian research products,Chennnai
6. PVP K30 Sisco research laboratories pvt ltd, Mumbai
7. HPMC K4M β-pura laboratories pvt., ltd,chennai
8. Talc Otto Chemika-Biochemika reagents,
Mumbai
9. Magnesium stearate Loba chemie pvt, ltd,mumbai
10. PEG 400 β-pura laboratories pvt ltd,chennai
11. Cellulose acetate Otto Chemika-Biochemika reagents,
Mumbai
12. Eudragit L100 Loba chemie pvt, ltd,mumbai
13. PLGA Sigma Aldrich, St.Louis
14. Acetone Sisco research laboratories pvt ltd, Mumbai
15. PVA Indian research products,Chennai
16. Tween 80 Otto Chemika-Biochemika reagents, Mumbai

78
17. Ethanol Loba chemie pvt ,ltd,mumbai
18. Methylene chloride RFCL Limited, Rankem, Newdelhi
19. Methanol Loba chemie pvt ,ltd,Mumbai
20. Potassium Bromide (IR Grade) Merck, Goa
21. HCl RFCL Limited, Rankem, Newdelhi
22. Potassium dihydrgen sulphate Central drug house (p) ltd,Mumbai(andheri)
23. Sodium hydroxide pellets Merck Ltd., Mumbai
Table 6.2. EQUIPMENTS USED
S.No. Equipments Model / Source/Supplier
1. Compression machine Rimek, minipress, UK
2. Mechanical sieve shaker Hicon, grover enterprises New Delhi.
3. Hot air oven for drying Hicon, grover enterprises New Delhi.
4. Coating pan Hicon grover enterprises, New Delhi
5. Bulk density apparatus Veego, Mumbai
6. Vernier caliper Mitutoyo cd - 6 cs, Japan
7. Hardness tester Tablet hardness tester,Shankar
8. Friabilator EF - 2 Electrolab, Mumbai
9. Weighing balance Sartorious, Germany
10. Ultraprobe sonicator Electrosonic industries, EI 250 UP,
Mumbai
11. Magnetic stirrer Remi instruments, Mumbai
12. Ultra centrifuge Remi instruments, Mumbai

79
13. FTIR Alphar T0, Bruker, New Delhi
14. Ultraviolet spectrophotometer UV-1700, Shimadzu, Mumbai
15. Differential Scanning calorimeter DSC 60 Shimadzu, Mumbai
16. Melting point apparatus Campbell Electronics, Mumbai
17. Scanning Electron Microscope FEI-Quanta 200F, USA
18. Zetasizer Malvern zetasizer ,ZS90, UK
19. Franz diffusion cell Aar Gee Automation & Control,
Mohali, India
20. Dissolution tester Electrolab TDT - 08 L, Mumbai
21. pH meter DI-707Digisun Electronics.
Hyderabad
22. Stability chamber Thermolab Scientific equipments Pvt.
Ltd., Mumbai

80
7. PREFORMULATION
Preformulation is defined as application of biopharmaceutical principles to the
physicochemical properties of the drug. It is a phase of R & D process developed to
achieve a safe and effective dosage form.
PREFORMULATION STUDIES:
ANALYSIS OF ACECLOFENAC:
i) UV Spectroscopy231
:
50mg of sample was dissolved in methanol and then diluted to 100ml with the
same. 2ml of the above solution was diluted to 50ml with methanol. This solution was
scanned between 220nm to 370nm. The UV curve obtained was given in results and
discussion section as Fig 7.1.
ii) IR Spectroscopy231
:
IR spectra of aceclofenac, was obtained by a Perkin-Elmer Fourier transform
infrared spectrophotometer using KBr pellets. KBr pellets were prepared by gently mixing
the aceclofenac with KBr (1:100). The scanning range used was 4000 to 400cm-1. The
obtained graph was compared with the reference standard. The IR graph was given in
results and discussion part Fig 7.2.
iii) Melting point:
Aceclofenac MP was measured by capillary tube method232
. The readings were given
in table 7.1
iv) Loss on drying:
One gram of Aceclofenac was heated to a temperature of 105ºC in hot air oven
until it attained constant weight. The formula to calculate LOD was233
The results were recorded and given in the table 7.1.

81
v) Angle of repose:
It was measured by fixed funnel technique234
. In this technique a funnel containing
aceclofenac was kept at a fixed height, and it was allowed to flow to the ground surface
which contains graph paper. The height (h) and radius (r) of the heap formed was measured
and from this value angle of repose (θ) was determined by the formula
θ = tan-1
(h/r)
The results were recorded and given in table 7.1.
vi) Bulk density & Tapped density:
Weighed amount of aceclofenac was placed in a measurable cylinder, the volume
(untapped) was noted and then the measurable cylinder was tapped until the volume
remains constant. Bulk and Tapped densities were calculated by the following formulas234
The results were recorded and presented in results and discussion section, table 7.1.
vii) Compressibility Index:
CI of the powder was determined from the bulk and tap density as follows4
The results were recorded and presented in results and discussion section, table 7.1.
viii) Hausner’s ratio:
It was calculated as
The results were recorded and presented in results and discussion section, table 7.1.

82
DRUG-EXCIPIENT COMPATIBILITY STUDIES
IR Spectroscopy
IR spectra of pure aceclofenac, additives and combination of aceclofenac with
additives were obtained by using Perkin-Elmer Fourier transform infrared
spectrophotometer using KBr pellets235
. KBr pellets were prepared by gently
mixing the sample with KBr. The scanning range used was 4000 to 400cm-1
. IR
spectra for the samples were given in results and discussion section from Fig. 7.2 to
Fig. 7.30.
DSC technique
For DSC studies aceclofenac, additives and combination of aceclofenac with
additives were sealed in aluminum pans and the DSC thermograms were recorded
at a heating rate of 10°/min235
. DSC thermograms were given in results and
discussion section from Fig. 7.31 to Fig. 7.58.
PREPARATION OF STANDARD GRAPH OF ACECLOFENAC:
Standard graphs of the drug were prepared using standard aceclofenac solution in
acid buffer pH 1.2, phosphate buffer pH 6.8 & pH 7.4 containing 5 to 50μg. The
absorbance was measured at 275nm. Linear relationship was observed with absorption to
concentration of drug. The values of absorbance related to concentration were given in
table 7.2 and graphs were given in fig 7.59, 7.60, 7.61.
RESULTS AND DISCUSSION:
The UV, IR and melting point studies helped to identify the aceclofenac. The
obtained UV and IR spectra of the sample were similar to that of standard. The spectra
were represented in Fig 7.1 & 7.2.

83
Fig. 7.1. UV Spectra of Aceclofenac
Physical Characteristics:
Physical characteristics indicated that aceclofenac possess poor flow.
The results were given below:
Table 7.1. Physical characteristics of Aceclofenac
S.No Particulars Results
1. Melting point 150ºC
2. LOD 0.2%
3 Angle of repose 40.32 ± 0.16
4 Bulk density 0.560 ±0.015
5 Tapped density 0.720 ± 0.025
6 Compressibility Index 22.21 ± 0.7
7 Hausner’s ratio 1.285 ± 0.013

84
DRUG-EXCIPIENT COMPATIBILITY STUDIES
IR and DSC analysis:
Aceclofenac contains one carbonyl, one ester and one secondary amine group
which have characteristic band values around 3276, 1770 and 3317cm-1
. These
characteristic bands were observed in all of the recorded IR spectra. The DSC thermogram
revealed that the additives showed superimposition on thermogram, however mild preshift
was observed. The FTIR and DSC results revealed that there was no interaction between
the drug and additives used in the formulation. The IR and DSC were shown from Fig. 7.2
to Fig. 7.58.

85
STANDARD GRAPH OF ACECLOFENAC:
Table 7.2. Concentration and absorbance of aceclofenac in
pH 1.2, pH 6.8 and pH 7.4
S.No
Conc
(μg/ml)
Absorbance
pH 1.2 pH 6.8 pH 7.4
1 5 0.042 0.035 0.138
2 10 0.080 0.067 0.260
3 15 0.120 0.095 0.382
4 20 0.152 0.123 0.488
5 25 0.192 0.148 0.612
6 30 0.228 0.178 0.722
7 35 0.265 0.210 0.852
8 40 0.298 0.241 0.973
9 45 0.335 0.267 1.099
10 50 0.375 0.296 1.218

86
Fig 7.59
Fig 7.60
Fig 7.61

87
8. ACECLOFENAC OSMOTIC TABLETS
METHOD OF PREPARATION:
Aceclofenac osmotic tablets were prepared by wet granulation method31
using
different osmotic agents - sodium bicarbonate sodium chloride and potassium chloride.
Osmogen concentrations were optimized by performing 13 trails (OT1-OT13). The
prepared osmotic tablets contain two layers: push and pull layers. Aceclofenac, osmotic
agents, MCC were blended together using alcoholic solution of PVP K30 as binder. The
wet mass was sieved and dried. Then the dried granules were lubricated. Similarly the push
compartment was also prepared. Colouring agent was added to the push layer for
identification. The prepared push and pull layer granules were compressed as bilayer
tablets. The prepared core tablets were coated with cellulose acetate. PEG 400 was used as
pore forming agent
Table 8.1. Formulation of Aceclofenac Osmotic Tablets
Pull compartment
S.No
Ingredients
Trials (in mg)
OT1 OT 2 OT 3 OT4 OT 5 OT 6 OT 7
1. Aceclofenac 200 200 200 200 200 200 200
2. sodium bicarbonate 50 - - 25 25 - 75
3. Sodium chloride - 50 - 25 - 25 -
4. Potassium chloride - - 50 - 25 25 -
4. MCC 50 50 50 50 50 50 25
5. PVP K30 20 20 20 20 20 20 20
6. Talc 4 4 4 4 4 4 4
7. Magnesium stearate 1 1 1 1 1 1 1
Push compartment
1. MCC 50 50 50 50 50 50 50
2. HPMC K4M 50 50 50 50 50 50 50
3. Sodium bicarbonate 75 75 75 75 75 75 75
4. PVP K30 20 20 20 20 20 20 20
5. Magnesium stearate 5 5 5 5 5 5 5

88
Table 8.2. Formulation of Aceclofenac Osmotic Tablets
Pull compartment
S.No
Ingredients
Trials (in mg)
OT 8 OT 9 OT 10 OT11 OT12 OT13
1. Aceclofenac 200 200 200 200 200 200
2. sodium bicarbonate - - 50 50 25 25
3. Sodium chloride 75 - 25 50
4. Potassium chloride - 75 - 25 - 50
4. MCC 25 25 25 25 25 25
5. PVP K30 20 20 20 20 20 20
6. Talc 4 4 4 4 4 4
7. Magnesium stearate 1 1 1 1 1 1
Push compartment
1. MCC 50 50 50 50 50 50
2. HPMC K4M 50 50 50 50 50 50
3. Sodium bicarbonate 75 75 75 75 75 75
4. PVP K30 20 20 20 20 20 20
5. Magnesium stearate 5 5 5 5 5 5
EVALUATION:
Evaluation of pre compression parameters of granules
The powder blend was evaluated for its physical characteristics bulk density, tapped density,
angle of repose, compressibility index, and Hausner’s ratio30
. The results were given in
results and discussion in table 8.3.
Evaluation of post compression parameters of granules
The prepared tablets were evaluated for thickness, hardness, friability, weight variation, drug
content and in vitro drug release25
.
Thickness
Thickness of a table is measured by using vernier calipers. The results were given in table
8.4

89
Hardness Test:
Hardness of a tablet depends on wt. of the material utilized, space between upper and
lower punches, quantity of excipients used in formulation. Hardness was carried out by
hardness tester. The results were given in table 8.4
Friability Test
Friability test indicated the withstand abrasion during handling and transportation.
Friabiliator used for this purpose. Twenty tablets were weighed and subjected to rotating
chamber of the apparatus and rotated for 25 rpm for 4 minutes. After that, the tablets were
collected and reweighed. The formula to calculate the friability was
F = 100 W
]WW[ 0
Where Wo = Initial weight of 20 tablets.
W = Final weight of 20 tablets.
The results were given in table 8.4
Weight variation:
Twenty tables were weighed and the average weight was calculated. Then the tablets were
individually weighed and the percent weight variation was calculated. The results were
given in table 8.5
Drug content
Twenty tablets were weighed and powdered. 0.05gm equivalent to aceclofenac was
weighed and transferred into 100ml volumetric flask, dissolved and volume made upto
100ml. From this solution 5 ml was to diluted to 50ml with ethanol. The absorbance was
measured at 275nm using UV spectrophotometer. The results were given in table 8.5
In Vitro Drug Release Study
The in vitro dissolution34
was performed using pH1.2, 6.8 and 7.4 buffers. Samples were
taken at regular intervals upto 24hrs and analyzed spectrophotometrically. The results were
given in table 8.6, 8.7 and 8.8.

90
RESULTS AND DISCUSSION:
Pre compression parameters of granules:
Table 8.3 Pre compression parameters of granules
Trial
Angle of
repose (º)
Bulk
density
(g/ml)
Tapped
density
(g/ml)
Compressibility
index (%)
Hausner’s
Ratio
OT1 27.05± 0.02 0.62 ± 0.01 0.71 ± 0.01 12.67±0.01 1.14±0.01
OT2 27.27± 0.06 0.64 ± 0.02 0.72 ± 0.01 11.11±0.03 1.12±0.03
OT3 27.49± 0.17 0.65 ± 0.04 0.73 ± 0.04 10.90±0.04 1.12±0.03
OT4 27.98± 0.24 0.66 ± 0.05 0.73 ± 0.04 9.51±0.01 1.10±0.01
OT5 28.44± 0.21 0.63± 0.02 0.74± 0.05 14.86±0.04 1.17±0.01
OT6 28.43± 0.12 0.67± 0.01 0.74 ± 0.03 7.45±0.03 1.10±0.02
OT7 28.51± 0.21 0.67± 0.03 0.75 ± 0.03 10.66±0.01 1.11±0.01
OT8 27.94± 0.22 0.66± 0.05 0.71± 0.08 8.57±0.04 1.07±0.02
OT9 28.13± 0.18 0.62± 0.01 0.73± 0.04 15.06±0.01 1.17±0.02
OT10 28.21± 0.11 0.67 ± 0.01 0.74 ± 0.03 9.45±0.01 1.10±0.04
OT11 28.22± 0.21 0.66± 0.05 0.72± 0.01 8.69±0.03 1.09±0.03
OT12 28.13± 0.18 0.62± 0.01 0.73± 0.03 14.82±0.03 1.19±0.02
OT13 28.26± 0.23 0.65± 0.04 0.71± 0.06 8.45±0.01 1.09±0.01
The precompression parameters of the granules indicated that the powder was freely
flowing. As the granules were freely flowable, it was suggested that the granules were
suitable for compression. All the batches of granules passed the test.

91
Table 8.4. Results of thickness, hardness and friability
of aceclofenac osmotic tablets
Formulations Thickness (mm) Hardness
(kg/cm2)
Friability (%)
OT1 5.49 ± 0.19 7.5 ±0.11 1.20 ± 0.10
OT2 5.44 ± 0.01 8 ± 0.17 1.24 ± 0.15
OT3 5.48 ± 0.11 8 ± 0.17 1.21 ± 0.07
OT4 5.42 ± 0.26 8 ± 0.17 1.13 ±0.05
OT5 5.48 ± 0.10 8 ± 0.17 1.14 ± 0.02
OT6 5.47 ± 0.05 7.5 ±0.11 1.02 ± 0.06
OT7 5.42 ± 0.26 8 ± 0.17 1.09 ± 0.12
OT8 5.27± 0.23 7.5 ±0.11 1.21 ± 0.07
OT9 5.41 ± 0.22 8 ± 0.17 1.13 ±0.05
OT10 5.27 ± 0.23 7.5 ±0.11 1.09 ± 0.12
OT11 5.43 ± 0.32 8 ± 0.17 1.21 ± 0.07
OT12 5.27± 0.23 7.5 ±0.11 1.09 ± 0.12
OT13 5.23 ± 0.12 8 ± 0.17 1.20 ± 0.10
There is no significant change in the thickness, hardness and friability for all the batches
(OT1-OT10).

92
Table 8.5. Results of average weight and drug content
Formulatio
ns
Avg. wt (mg)
Assay (%)
Before coating After coating
OT1 524.90 ± 0.45 550.12± 0.43 98.55± 0.97
OT2 525.22 ± 0.14 551.48± 0.38 98.39 ± 0.51
OT3 524.97 ± 0.15 550.34± 0.54 99.22 ± 1.01
OT4 524.92 ± 0.10 551.35± 0.65 98.07 ± 1.26
OT5 522.20 ± 0.21 550.34± 0.39 99.53 ± 1.82
OT6 523.89 ± 0.11 550.47± 0.39 99.22 ± 0.33
OT7 526.04 ± 0.25 551.43± 0.43 97.22 ± 0.58
OT8 524.04 ± 0.16 550.75± 0.28 99.34 ± 0.58
OT9 523.04 ± 0.17 550.29± 0.61 99.55 ± 0.58
OT10 525.04 ± 0.19 551.18 ± 0.47 99.80 ± 0.58
OT11 526.04 ± 0.13 551.32 ± 0.63 99.62 ± 0.58
OT12 524.04 ± 0.27 550.26 ± 0.84 99.28 ± 0.58
OT13 523.04 ± 0.18 550.13 ± 0.35 99.44 ± 0.58
Average weight and assay
There was no significant changes in average weight and assay for all formulations
(OT1-OT13)
The average weight before coating was around 525mg and after coating was
550mg. The drug content for all the formulations were nearly 100% which
indicated that there was no drug loss by manufacturing process or by additives.

93
Table 8.6. In vitro drug release profile of aceclofenac osmotic tablets (OT1- OT4)
S.No Time (hrs) Cumulative percentage release of aceclofenac
OT1 OT2 OT3 OT4
1 0 0 0 0 0
2 2 17.3± 0.11 18.5± 0.11 12± 0.12 9.05± 0.15
3 4 36.3± 0.12 37.3± 0.24 29± 0.09 16.32± 0.11
4 6 44.3± 0.09 47.12± 0.09 37± 0.08 33.21± 0.13
5 8 56.7± 0.13 58.24± 0.24 48.13± 0.11 42.23± 0.12
6 12 62.01 ± 0.14 65.25 ± 0.31 59.32± 0.12 52.42± 0.26
7 16 70.18± 0.21 76.31± 0.17 68.42± 0.08 62.34± 0.23
8 20 82.24± 0.25 84.56± 0.22 75.3± 0.12 71.27± 0.16
9 24 85.27± 0.19 87.12± 0.24 80.15± 0.22 78.32± 0.31
Table 8.7. In vitro drug release profile of aceclofenac osmotic tablets (OT5- OT8)
S.No Time (hrs) Cumulative percentage release of aceclofenac
OT5 OT6 OT7 OT8
1 0 0 0 0 0
2 2 9.27± 0.25 8.0± 0.14 8.76± 0.12 9.24± 0.15
3 4 19.26± 0.23 16.0± 0.08 19.23± 0.09 20.45± 0.11
4 6 39.24± 0.35 25.3± 0.11 27.41± 0.08 28.46± 0.13
5 8 49.36± 0.19 34.8± 0.09 36.61± 0.11 41.54± 0.12
6 12 66.13± 0.25 49.8± 0.13 52.72± 0.12 53.72± 0.09
7 16 79.23± 0.27 66.8± 0.08 68.28± 0.08 69.41± 0.13
8 20 84.29± 0.24 82.8± 0.14 85.54± 0.39 87.54± 0.23
9 24 89.23± 0.25 88.9± 0.12 90.32± 0.28 91.82± 0.36

94
Table 8.8. Invitro drug release profile of aceclofenac osmotic tablets (OT9- OT13)
S.No Time
(hrs)
Cumulative percentage release of aceclofenac(%)
OT9 OT10 OT11 OT12 OT13
1 0 0 0 0 0 0
2 2 10.18± 0.09 12.36± 0.14 12.23± 0.12 11.82± 0.11 12.83± 0.19
3 4 28.24± 0.12 29.56± 0.08 27.56± 0.04 26.23± 0.17 25.54± 0.15
4 6 42.32± 0.14 45.73± 0.11 41.21± 0.09 39.12± 0.12 38.92± 0.28
5 8 68.25± 0.09 68.92± 0.09 62.35± 0.02 60.24± 0.15 59.25± 0.11
6 12 74.13± 0.13 76.57± 0.13 72.24± 0.08 70.25± 0.22 69.73± 0.22
7 16 81.96± 0.12 86.68± 0.08 82.16± 0.14 81.81± 0.19 80.08± 0.14
8 20 84.26 ± 0.36 91.28± 0.14 89.02± 0.11 87.56± 0.34 86.74± 0.25
9 24 90.79± 0.23 94.3± 0.12 92.86± 0.09 91.12± 0.23 90.58± 0.22
IN VITRO RELEASE:
The effect of same amount of three different osmogens (sodium bicarbonate,
sodium chloride and potassium chloride) and the combinations of these osmogens
exhibits significant increase in rate and extent of drug release were observed.
All the prepared osmotic tablets of aceclofenac showed one hour delayed drug
release, which may be attributed to time elapsed for imbibition of osmotic core
with the release medium. After one hour, almost all the batches exhibited linear and
controlled drug release profiles.
Sodium chloride (25mg) and sodium bicarbonate (50mg) based push pull osmotic
tablets of aceclofenac (OT10) exhibited little higher rate and extent of drug release
than potassium chloride(25mg) and sodium bicarbonate (50mg) based tablets.
The results showed that the concentration of osmotic agent is directly proportional
to the drug release. Hence there was considerable increase in drug release based on
the increase in concentration of osmogen.

95
Three types of medium were chosen to carry out the in vitro dissolution studies
from the result indicated that the rate of release was moderately affected by PH. it
reveals that osmotic tablets are unaffected by the ph off the medium.
The in vitro drug release results of formulations (OT1- OT6) were not found to be
satisfactory for controlled release due to lesser concentration of osmogens.
The formulations (OT7-OT13) showed profound increase in the dissolution profile
due the combination of increased concentration of osmogens.
The formulation (OT10) gave desired drug release profile (94.2%) in 24 hrs. Hence
formulation (OT10) was selected as an optimized batch and was chosen for
stability studies. The concentration of combination of osmogen used in this (OT10)
batch was found to be sodium chloride 25mg and sodium bicarbonate 50mg
RELEASE KINETICS:
To know the mechanism of drug release from various preparations the data were
treated according to zero order, first order, Higuchi and korse mayer equation. The release
rate kinetic data for all the equations were shown in graph. Fig 8.1 to 8.5. The value fitted
to zero order plot and its regression value was 0.9912, as its value is close to 1, it was
conformed that it followed zero order release. The mechanism of drug release was further
cconformed by korsemayer and peppas plot. According to this 0.5 is Fickian diffusion, 0.5
< n < 1 is anomalous transport or Non-Fickian transpory, 1 is Case II transport, n > 1 is
Super case II transport. The n value of the formulation OT10 was 1.2664 and hence it
suggests supercase II transport.

96
Figure:8.1 Percentage cumulative drug release of osmotic tablets containing
aceclofenac(OT1-OT4)
Figure:8.2 Percentage cumulative drug release of osmotic tablets containing
aceclofenac(OT5-OT8)

97
Figure:8.3 Percentage cumulative drug release of osmotic tablets containing
aceclofenac(OT9-OT13)
Figure:8.4 Percentage cumulative drug release of osmotic tablets containing
aceclofenac(OT10)

98
Figure:8.5 Release kinetics of osmotic tablets containing aceclofenac(OT10)-Higuchi
Model
Figure:8.6 Release kinetics of osmotic tablets containing aceclofenac(OT10)- Korsemayer
model.

99
CONCLUSION:
The osmotic tablets containing aceclofenac (OT10) with sodium chloride and sodium
bicarbonate had exhibited ideal controlled release. The formulation (OT10) gave desired
drug release profile (94.2%) in 24 hrs The formulation fitted to zero order release with
super case II transport.

100
9. ACECLOFENAC MICROSPHERES
METHODS:
Formulation of aceclofenac microspheres:
Preparation of polymer mix:
The microsphere formulations were made with varying proportion of the drug
polymer ratio as well as varying concentrations of two polymers (polymer mix) Eudragit L
100 and PLGA. Polymer mix of Eudragit L100: PLGA in the ratios of 1:1, 1:2 and 1:3
were prepared. The internal variation in the polymer mix were designated as a, b and c.
Table 9.1. Polymer mix Eudragit L100: PLGA(ratio)
Polymer mix code
Eudragit L100:PLGA
A 1:1
B 1:2
C 1:3
Preparation of Aceclofenac Microspheres:
Mixture of EudragitL100 and PLGA polymers in different ratios were used for the
formulation of aceclofenac loaded Eudragit:PLGA microspheres as given in table 9.1 and
table 9.2. PVA (3%w/v) was added for stabilizing the microspheres188
. Eudragit L100 and
drug were dissolved in ethanol and PLGA was dissolved in acetone, respectively.
Subsequently the Eudragit solution in ethanol was added slowly to the PLGA solution in
acetone with a constant stirring and stirring is continued to remove the solvent. Then the
microspheres were washed and resuspended in distilled water and lyophilized.

TABLE 9.2. FORMULATION OF ACECLOFENAC MICROSPHERES
S.
No
Ingredients
Batches of Microspheres
M1 M2 M3 M4 M5 M6 M7 M8 M9 M10 M11 M12 M13 M14 M15
1 Aceclofenac
(mg)
100 100 100 100 100 100 100 100 100 100 100 100 100 100 100
2 Eudragit
L100 (mg)
50 33.3 25 75 50 37.5 100 66.6 50 125 83.3 62.5 150 100 75
3. PLGA (mg) 50 66.7 75 75 100 112.5 100 134.4 150 125 166.7 187.5 150 200 225
4 Aceclofenac:
Polymer mix
1:1a 1:1b 1:1c 1:1.5a 1:1.5b 1:1.5c 1:2a 1:2b 1:2c 1:2.5a 1:2.5b 1:2.5c 1:3a 1:3b 1:3c
5. PVA(%w/v) 3 3 3 3 3 3 3 3 3 3 3 3 3 3 3
6 Ethanol(ml) 70 70 70 70 70 70 70 70 70 70 70 70 70 70 70
7 Acetone(ml) 30 30 30 30 30 30 30 30 30 30 30 30 30 30 30

102
CHARACTERIZATION OF ACECLOFENAC MICROSPHERES
Flow property studies142
:
Angle of repose, bulk density, tapped density, compressibility index and Hausners ratio were
determined and the values recorded were recorded in table 9.3.
Determination of mean particle size of microspheres236
Particle size analysis of drug-loaded microspheres was performed using stereomicroscope
which was calibrated using calibrated micrometers. The microscope was equipped with the
software Bioplus-55 Video Plan-11UP through a camera. A small amount of dry
microspheres were suspended in glycerin. A small drop was of suspension was placed on a
clean glass slide. The slide with specimen was observed under the microscope (100X). An
image was taken with the help of camera and the particle size was determined using
software. The particle size calculation was carried out in triplicate and the values were given
in table 9.4.
Scanning electron microscopy199
:
For the external morphology studies, air dried particles were visualized using scanning
electron microscopy. The samples were mounted on a metal slab with double adhesive tape
and coated with platinum under vacuum.
Drug content160
For drug content analysis the microsphere formulations were centrifuged in a centrifuge and
the amount of drug was measured by ultraviolet (UV) spectrophotometer at 275nm. Loading
capacity is the maximum amount of drug that can be incorporated in the microspheres.
where is the actual drug content in a weighed quantity of microspheres and is the
weighed quantity of microspheres.

103
Entrapment efficiency5:
The encapsulation efficiency is the amount of added drug (in percent) that is encapsulated in
the formulation of microspheres.
where is the actual drug content in a weighed quantity of microspheres, and is
the theoretical amount of drug in microspheres calculated from the quantity added in the
process
In Vitro Drug Release Studies2
In vitro release studies were carried out using USP type I apparatus at 37 ± 0.5 C in 900 ml
dissolution medium (pH1.2, 6.8 and 7.4) for 24 h. Microspheres equivalent to 200 mg drug
was placed into the baskets (tied using muslin cloth), and rotated at 100 rpm. Samples were
taken at regular intervals up to 24hr and analyzed by spectrophotometrically at 275 nm.
Stability Studies5
The optimized formulation of microspheres were selected and subjected to stability studies
as per ICH guidelines. Samples were withdrawn at predetermined time intervals of 15, 30,
45, 60 and 90 days, and then evaluated.

104
RESULTS AND DISCUSSION:
Flow property studies:
Angle of repose, bulk density, tapped density, CI and Hausner’s ratio were calculated and
given below table 9.3. From the values it was indicated that all the prepared microspheres
had good flow property.
Table 9.3 Flow property studies of aceclofenac microspheres
Batch
Angle of
repose
(Mean± SD)
Bulk
density(g/ml
Mean± SD
Tapped
density(g/ml)
Mean± SD
CI (%)
Mean± SD
Hausner’s
ratio
Mean±SD
M1 18.6 ± 0.20 0.31±0.01 0.37±0.01 16.4±1.1 1.19±0.1
M2 15.1± 0.62 0.42±0.01 0.507±0.13 16.3±1.3 1.20±0.2
M3 17.5 ± 0.19 0.52±0.01 0.594±0.01 13.4±0.9 1.14±0.01
M4 18.3±0.14 0.42±0.02 0.509±0.02 17.3±1.1 1.21±0.1
M5 20.7± 0.58 0.49±0.02 0.582±0.01 15.8±0.8 1.18±0.05
M6 24.0 ± 0.59 0.62±0.03 0.735±0.04 15.6±2.2 1.18±0.02
M7 19.1± 0.56 0.56±0.02 0.652±0.22 14.1±2-3 1.16±0.1
M8 18.5 ± 0.16 0.61±0.10 0.726±0.01 15.9±3.2 1.18±0.1
M9 16.1 ± 0.62 0.51±0.12 0.614±0.01 16.9±1.4 1.01±0.2
M10 17.5 ± 0.16 0.45±0.08 0.517±0.03 12.9±1.2 1.14±0.4
M11 18.1 ± 0.64 0.52±0.09 0.626±0.20 16.9±1.2 1.20±0.1
M12 17.6 ± 0.16 0.55±0.02 0.652±0.01 15.6±1.2 1.18±0.2
M13 19.8 ± 0.54 0.63±0.01 0.723±0.01 14.7±0.6 1.14±0.2
M14 18.6 ± 0.18 0.60±0.01 0.716±0.09 16.2±0.9 1.19±0.3
M15 18.8 ± 0.54 0.59±0.01 0.703±0.09 16.0±1.1 1.19±0.01

105
Mean Particle Size, Drug content and Entrapment Efficiency:
Mean particle size was determined by optical microscopy and the average particle size was
calculated. The mean particle size and entrapment efficiency were determined for all the
batches (M1- M15) and results were given in Table 9.4. Particle sizes of all the formulations
were in micro particular size range and it was maximum of 630±36µm with M13 and
minimum of 20±10µm with M4. The increase in the concentration of the dissolved
Eudragit L100 might have caused a considerable increase in the viscosity of organic phase
and reduced the stirring efficiency resulted in the formation of the larger emulsion droplets,
which have yielded microspheres with increased particle size237
The molecular weight of the polymers used in the formulation is an important factor which
decides the drug entrapment. The molecular weight of Eudragit L100 is 320,000 g/mol and
PLGA is above 30,000 and this may considerably increased the entrapment efficiency and
maximum entrapment efficiency was reported at a drug: polymer ratio of 1:1.5a, in which
the proportion of the polymers Eudragit L100 and PLGA are equal and this is in agreement
with earlier reports. In addition, a higher viscosity of the organic phase causes a better
distribution of the drug in the matrix. On the contrary, lowering the viscosity of the organic
phase allows drugs to come close to the surface during the formation of and to dissolve in
the surrounding aqueous medium, resulting in lower drug content. The entrapment
efficiency was found to be maximum 86.6±0.6% with M4 and the minimum was indicated
by 25±1.1% with M3. Drug content was minimum of 21.1%±0.5 in M8 and maximum of
64.1±0.9 in M4. The results indicated that the entrapment efficiency was directly related to
drug content based on the polymer concentration.
Among all the microsphere formulations prepared, M4, M5 and M13 shows desirable
entrapment efficiency and hence selected for the further studies where the concentration of
aceclofenac:polymer mix were 1:1.5a, 1:1.5b and1:3a respectively.
SCANNING ELECTRON MICROSCOPY
The morphology of the optimized formulation of microspheres was found to be discrete,
smooth and spherical. The SEM photos were given in fig 9.1, 9.2 and 9.3.

Table 9.4. Mean Particle Size, Drug content and Entrapment Efficiency (M1-M15)
Parameter
Trials
M1 M2 M3 M4 M5 M6 M7 M8 M9 M10 M11 M12 M13 M14 M15
Particle
size(µm)
310
±24
255
±42
120
±58
20
±10
50
± 15
35
± 23
442
±56
338
±42
147
±26
302
±43
282
±53
253
±52
630
±36
575
±34
502
±15
Drug Content
(%)
42.5
±0.9
24.1
±0.5
27.3
±0.6
64.1
±0.9
31.0
±0.5
35.5
±0.8
19.9
±0.3
21.1
±0.5
21.5
±0.4
30.4
±0.7
34.7
±0.7
41.4
±1.0
28.3
± 0.4
40.7
± 0.6
36.8
± 0.5
Entrapment
efficiency (%)
32.3
±1.0
29.4
±0.7
25
±1.1
86.6
±0.6
50.3
±0.5
45.6
±1.2
60.5
±0.8
52.7
±0.6
49
±0.4
65.3
±0.7
53.7
±1.4
50.7
±1.2
67.1
±0.5
55.5
±1.3
53.6
±0.9
Particle size values expressed as ± S.E.M in µm of triplicate trials
Entrapment efficiency values expressed as ± S.D in µm of triplicate trials

107
Fig. 9.1. Particle size of Aceclofenac Microspheres formulations
Fig. 9.2. Drug content of Aceclofenac Microspheres formulations
Fig. 9.3. Entrapment efficiencies of Aceclofenac Microspheres formulations

108
SEM PHOTOS OF FORMULATIONS M4, M5, M13
Fig 9.1. SEM picture of M4 formulation
Fig 9.2. SEM picture of M5 formulation Fig 9.3. SEM picture of M13 formulation

109
IN-VITRO RELEASE STUDIES
Based on the particle size and entrapment efficiency the optimized formulations (M4,
M5 and M13) were selected for further studies. The in vitro release profile of M4, M5
and M13 indicated controlled release of aceclofenac with maximum of 96.6±1.6%,
88.6±1.8% and 76.2±1.9%, respectively. The analysis of the above data indicates
that the formulation M4 possess the ideal particle size of 20±10µm and higher
entrapment efficiency of 86.6±0.6%. The in vitro release profile of this formulation was
found to follow zero order kinetics with a controlled release for 24h. Hence, the
formulation M4 was subjected for in vivo anti-inflammatory, anti-arthritic and gastro
intestinal tolerability tests.
Table 9.5 % Cumulative Drug Release of M4, M5 and M13
% CUMULATIVE DRUG RELEASE
Hours M4 M5 M13
0.5 2.2±0.2 2.7± 0.2 2.5±0.3
1 3.4±0.1 4.2±0.4 3.8±0.1
1.5 7.2±0.4 6.9±0.2 4.9±0.2
2 9.5±0.7 7.5±0.8 6.2±0.4
2.5 12.7±0.6 9.1±0.7 8.1±0.3
3 15.4±1.1 11.5±1.5 11.7±0.5
4 19.9±0.9 14.7±1.2 14.5±0.7
5 26.8±0.9 17.9±1.0 17.2±0.6
6 31.7±1.3 24.6±1.2 20.3±1.0
8 36.8±1.5 32.1±1.7 25.9±1.8
10 45.1±1.2 49.7±1.5 33.7±2.6
12 57.6±1.5 58.5±0.9 46.1±1.7
16 71.3±1.3 65.9±1.5 59.0±2.0
20 82.5±1.7 73.0±1.3 67.2±1.9
24 96.6±1.6 88.6±1.8 76.2±1.9

110
RELEASE KINETICS:
To know the mechanism of drug release from various preparations the data were treated
according to zero order, first order, Higuchi and korse mayer equation. The release rate
kinetic data for all the equations were shown in graph. Fig 9.4, 9.5 and 9.6. The value
fitted to zero order plot and its regression value was 0.982, as its value is close to 1, it
was conformed that it followed zero order release. The mechanism of drug release was
further cconformed by korsemayer and peppas plot. According to this 0.5 is Fickian
diffusion, 0.5 < n < 1 is anomalous transport or Non-Fickian transpory, 1 is Case II
transport, n > 1 is Super case II transport. The n value of the formulation M4 was
0.9904 and hence it suggests non fickian diffusion.
Fig. 9.4 In vitro Release profile of aceclofenac from microspheres

111
Fig 9.5 HIGUCHI MODEL
FIG 9.6. KORSE MAYER MODEL
CONCLUSION:
Aceclofenac microspheres prepared with drug polymer mix in the ratio of (1:1.5a) and
3% PVA concentration (M4) was observed to possess better entrapment efficiency of
86.6%, invitro release of 96.6±0.11%.The particle size value of M4 also found to be

112
good when compared to other formulations. The least particle size of 20±10nm was
also observed with this formulation. Hence, M4 can be selected as best formulation
among the other formulations.
Microparticulate drug delivery systems are considered and accepted as a reliable tool to
deliver the drug to the target site with specificity, to maintain the desired concentration
at the site of interest without untoward effects. Microencapsulation is a useful method
which prolongs the duration of drug effect significantly and improves patient
compliance.
Eventually the total dose and few adverse reactions may be reduced since a steady
plasma concentration is maintained. In recent years much research in drug delivery has
been focused on degradable polymer microspheres. Administration of medication via
such systems is advantageous because microspheres can be ingested or injected, can be
tailored for desired release profiles and in some cases it can provide organ-targeted
release. The microencapsulation process enables conversion of liquids to solids,
altering colloidal and surface properties, providing environmental protection and
controlling the release characteristics by using the coating materials.
The success of any microencapsulation method depends on many factors such as the
drug solubility, partition co-efficiency, polymer composition, molecular weight etc.
Among the various microencapsulation methods, emulsion solvent evaporation
technique is often widely used to prepare microcapsules of water insoluble drugs
(within the water insoluble polymer). Microspheres are formed by the evaporation of an
organic solvent from dispersed oil droplets containing both polymer and drug
The aim of the present work was to encapsulate aceclofenac with Eudragit L100 and
PLGA, the effect of different formulation variables such as concentration of polymer
and eudragit L 100 and PLGA and the effect of these variables on particle size
distribution, encapsulation efficiency and its in vitro release behavior. Aceclofenac is
an ideal candidate for this controlled release formulation, resulting in more
reproducible drug absorption and reducing the risk of local irritations compared to
conventional dosage forms.

10. ACECLOFENAC NANOSUSPENSION
Table 10.1. Formulation of Aceclofenac Nanosuspension
S.No. Ingredients Batches of nanosuspension containing Aceclofenac
F-1AXL F-2AXM F-3AXH F-4AYL F-5AYM F-6AYH F-7AZL F-8AZM F-9AZH
1 Drug:Polymer 1:1 1:1 1:1 1:1 1:1 1:1 1:1 1:1 1:1
2 Tween 80 0.01% 0.01% 0.01% 0.02% 0.02% 0.02% 0.03% 0.03% 0.03%
3 Methylene Chloride 5ml 5ml 5ml 5ml 5ml 5ml 5ml 5ml 5ml
4 Methanol 2ml 2ml 2ml 2ml 2ml 2ml 2ml 2ml 2ml
5 Sonication time 2min 4 min 6 min 2min 4 min 6 min 2min 4 min 6 min
6. Agitation Speed 2000rpm 4000rpm 6000rpm 2000rpm 4000rpm 6000rpm 2000rpm 4000rpm 6000rpm
7. Distilled water 45 ml 45 ml 45 ml 45 ml 45 ml 45 ml 45 ml 45 ml 45 ml

Table 10.2. Formulation of Aceclofenac Nanosuspension
S.No. Ingredients Batches of nanosuspension containing Aceclofenac
F-10BXL F-11BXM F-12BXH F-13BYL F-14BYM F-15BYH F-16BZL F-17BZM F-18BZH
1 Drug:Polymer 1:2 1:2 1:2 1:2 1:2 1:2 1:2 1:2 1:2
2 Tween 80 0.01% 0.01% 0.01% 0.02% 0.02% 0.02% 0.03% 0.03% 0.03%
3 Methylene Chloride 5ml 5ml 5ml 5ml 5ml 5ml 5ml 5ml 5ml
4 Methanol 2ml 2ml 2ml 2ml 2ml 2ml 2ml 2ml 2ml
5 Sonication time 2min 4 min 6 min 2min 4 min 6 min 2min 4 min 6 min
6. Agitation Speed 2000rpm 4000rpm 6000rpm 2000rpm 4000rpm 6000rpm 2000rpm 4000rpm 6000rpm
7. Distilled water 45 ml 45 ml 45 ml 45 ml 45 ml 45 ml 45 ml 45 ml 45 ml

Table 10.3. Formulation of Aceclofenac Nanosuspension
S.No. Ingredients Batches of nanosuspension containing Aceclofenac
F-19CXL F-20CXM F-21CXH F-22CYL F-23CYM F-24CYH F-25CZL F-26CZM F-27CZH
1 Drug:Polymer 1:3 1:3 1:3 1:3 1:3 1:3 1:3 1:3 1:3
2 Tween 80 0.01% 0.01% 0.01% 0.02% 0.02% 0.02% 0.03% 0.03% 0.03%
3 Methylene Chloride 5ml 5ml 5ml 5ml 5ml 5ml 5ml 5ml 5ml
4 Methanol 2ml 2ml 2ml 2ml 2ml 2ml 2ml 2ml 2ml
5 Sonication time 2min 4 min 6 min 2min 4 min 6 min 2min 4 min 6 min
6. Agitation Speed 2000rpm 4000rpm 6000rpm 2000rpm 4000rpm 6000rpm 2000rpm 4000rpm 6000rpm
7. Distilled water 45 ml 45 ml 45 ml 45 ml 45 ml 45 ml 45 ml 45 ml 45 ml

116
METHODS
FORMULATION OF ACECLOFENAC NANOSUSPENSION (NS):
Nanosuspension (NS) containing aceclofenac were prepared by o/w emulsion
method using Eudragit L100180
. The polymer and drug (200mg) were dissolved in
methanol and added to 5ml of methylene chloride by stirring. This solution was then
slowly added into water containing Tween 80 and was kept at a low temperature using
an ice water bath. During addition, the mixture was vigorously mixed using magnetic
stirrer. The resulting emulsion obtained was sonicated in a probe sonicator, and further
stirring was continued for 60 minutes. Solvent residues were allowed to evaporate
under a slow magnetic stirring of the NS at room temperature (20°- 23°C) for 8–12
hours. The following critical parameters were optimized:
1. Drug polymer ratio
2. Concentration of surfactant(Tween 80)
3. Sonication time/Agitation speed
OPTIMIZATION OF FORMULATION
Multifactorial design was applied for determining the effect of drug: polymer ratio(X1),
Concentration of the surfactant(X2) and effect of agitation(X3) on two responses,
particle size (Y1), entrapment efficiency and drug content (Y2). With different
formulation parameters 27 trials of nanosuspension were prepared. The results were
categorized as: positive effect (+1), no effect (0) and negative effect (-1). The details of
the parameters studied were represented in the table 10.4.
CHARACTERIZATION OF NANOSUSPENSION:
Scanning Electron Microscopy (SEM)
The morphology studies of the prepared formulations were investigated using
scanning electron microscopy199
. The samples were mounted on a metal stab with
double adhesive tape and coated with platinum under vacuum. The results were given
in results and discussion section.
Determination of Particle Size and Surface Charge
The particle size analysis (using dynamic light scattering as the basic principle
of operation) and zeta-potential measurement (using Doppler electrophoresis as the
basic principle of operation) were analysed by Zetasizer Nano ZS238
(Malvern
Instruments, UK). For the analysis, the nanoparticle sample of the desired
concentration was flushed through a folded capillary cell (DTS1060) and the
measurement was carried out on the second filling; a sufficient sample volume was

117
used to completely cover the electrodes of the cell. To avoid air bubbles in the cell, the
sample was injected slowly and analysis was only carried out if there were no visible
air bubble inclusions present. After successful inspection, the cell was placed into the
Zetasizer and equilibrated at 20ºC (close to the average temperature in the laboratory)
for 2 min prior to the particle size measurements, of which there were six replicates.
The measurement temperature was set and maintained by the Peltier elements in the
sample holder of the instrument. The corresponding zeta-potential measurements
(triplicate) were taken immediately after the particle size measurements. The sample
and the cell were then discarded. Malvern Instruments Dispersion Technology software
(Version 4.0) was used to control and analyze all data from the instrument. The
instrument uses dynamic light scattering, which is sometimes referred to as photon
correlation spectroscopy (PCS), to measure time dependent fluctuation of scattered
light arising from the suspension of the nanoparticles undergoing random Brownian
motion.
The diffusion coefficient of the particles is deduced and analyzed to give their
mean diameter, which is the size data presented in this study. For the zeta-potential
measurement, the instrument uses laser Doppler electrophoresis to measure the net
velocity of the nanoparticles in the liquid that results when an electric field is applied.
Determination of Drug Content
For drug content analysis, a specified volume of NS formulations was ultra-
centrifuged at 25000xg and the amount of drug in the supernatant was estimated by UV
spectrophotometer at 275 nm. The drug content of the prepared NS was determined by
the formula4:
The results were given in results and discussion section.
Determination of Drug Entrapment Efficiency
The drug entrapment efficiency of various NS formulations prepared were
calculated and was expressed in percentage. The following formula was used to
calculate the percentage drug entrapment160
:
The results were given in results and discussion section.

118
In Vitro Drug Release Studies239
The in vitro release studies of the prepared NS were carried out using a
modified Franz diffusion cell over a period of 24 h at a temperature of 37±1ºC. For
each formulation a specified amount of NS was introduced into compartment and the
open ends of the apparatus sealed with non-porous membrane to prevent evaporation.
Phosphate buffer (pH 7.4) was used and stirred. Samples were withdrawn at regular
intervals and analyzed for drug content by spectrophotometer at 275nm. Sink condition
were maintained throughout the release period. The results were given in results and
discussion section.
Stability Studies239
:
The optimized NS were investigated for their stability and their ability to
withstand temperature conditions during their storage. The NS formulations and
aqueous solution of aceclofenac were sealed in Type-I amber colored glass vials and
were stored at 2–8°C, 25°C, and 40°C. Samples from these formulations were
withdrawn at 15, 30, 45, 60 and 90 days interval and analyzed for mean particle size
and drug content. Each study was performed in triplicate. The results were given in
results and discussion section.
RESULTS AND DISCUSSION:
Preparation of Nanosuspension:
Aceclofenac loaded Eudragit L100 nanosuspension was prepared by o/w
emulsion method. The prepared were found to be turbid and stable. No visible
sedimentation was noticed atleast for a period of 7 days, when stored at 4ºC. However,
stability studies of the selected formulations were carried out separately. The
preparation was shown in fig.10.1
SEM analysis:
The SEM analysis was performed and the SEM photos of aceclofenac
nanoparticles were recorded. The particles of all the batches are almost spherical with
smooth surface, however they shown variation in size. The SEM photos of 4trials were
given in fig 10.2.
Optimization of formulation
The multifactorial design applied for determining the effect of drug: polymer
ratio(X1), Concentration of the surfactant(X2) and effect of agitation(X3) on two

119
responses, particle size (Y1) and drug content(Y2) shown evident variations with the
three parameters used for the investigation. From the results of all 27 trials the
formulations F-14BYM, F-15BYH, F-23CYM and F-24CYH were considered as ideal
and selected for further studies. They have particle size of 210±15nm, 212±23nm,
225±30nm and 220±42nm and entrapment efficiency of 89.6±0.9%, 86.2±1.6%,
88.9±1.3% and 88.6±1.5%, respectively. The formulations with F-14BYM, F-15BYH,
F-23CYM and F-24CYH were identified as the optimized formulations with respect to
particle size, drug content and entrapment efficiency, and these were selected for the
other studies. The details were given in table 10.4
Fig 10.1. Nanosuspensions of aceclofenac
(F-14BYM, F-15BYH, F-23CYM & F-24CYH)

Fig 10.2. SEM PHOTOS OF F-14BYM, F-15BYH, F-23CYM & F-24CYH
F-14BYM F-15BYH
F-23CYM F-24CYH

Table 10.4. Optimization of Aceclofenac Nanosuspension formulation
Batches
F-1AXL
F-2AXM
F-3AXH
F-4AYL
F-5AYM
F-6AYH
F-7AZL
F-8AZM
F-9AZH
P size -1 -1 +1 +1 +1 -1 -1 -1 0
Drug content -1 -1 -1 -1 -1 -1 -1 -1 -1
E.E -1 -1 -1 -1 -1 -1 -1 -1 -1
Batches
F-10BXL
F-11BXM
F-12BXH
F-13BYL
F-14BYM
F-15BYH
F-16BZL
F-17BZM
F-18BZH
P size -1 0 +1 +1 +1 +1 -1 -1 -1
Drug content -1 +1 +1 +1 +1 +1 -1 0 0
E.E 0 +1 +1 +1 +1 +1 -1 0 0
Batches
F-19CXL
F-20CXM
F-21CXH
F-22CYL
F-23CYM
F-24CYH
F-25CZL
F-26CZM
F-27CZH
P size -1 0 +1 +1 +1 +1 -1 -1 -1
Drug content +1 +1 +1 +1 +1 +1 +1 +1 +1
E.E +1 +1 +1 +1 +1 +1 +1 +1 +1
+1= Positive effect, 0= No effect, -1 = Negative effect

122
Particle Size
Increase in sonication time/agitation speed there is reduction in particle size.
Entrapment efficiency increased with the increase in polymer concentration. It is well
evident that the concentration of tween 80 played a significant role in achieving the
particle size and entrapment efficiency. The increase in tween 80 concentration, from
0.01% to 0.02% there is an increase in entrapment efficiency and decrease in particle
size. But the increase in the concentration of tween 80 from 0.02 to 0.03% the particle
size increased and entrapment efficiency decreased. This may be due to increase in
concentration of the surfactant beyond the critical micellar concentration, reduces the
effectiveness in reducing the surface tension with a consequent increase in particle size
and reduced entrapment efficiency. But this occurs only when the drug polymer ratio
1:1 and 1:2. For drug:polymer ratio 1:3 at 0.03% of tween 80 there is reduction in
particle size and entrapment efficiency. The reduction of entrapment efficiency might
be due to the formation of aggregates. The increase in polymer concentration indicated
a direct impact on entrapment efficiency and has no impact on particle size.
Increase in sonication time/agitation speed shown a reduction in particle size
and increase in entrapment efficiency. But increase in sonication time/agitation time for
drug:polymer ratio of 1:2, the particle size is increased and entrapment efficiency is
reduced for 0.02% from 4min/4000 to 6 min/6000. This may be due to particle
aggregation due to over speed. Similar phenomenon was exhibited in drug:polymer
ratio of 1:3, but the particle size and entrapment efficiency is reduced. With higher
concentration of polymer(1:3), no increase in particle size in the nanoparticle (F-
24CYH) was experienced.
This size ranges of the nanoparticles were reported to possess higher intracellular
uptake than microparticles and are considered ideal for the delivery of
biopharmaceuticals240
. The details were given in table 10.5 and fig.10.3.

Table 10.5. Particle size analysis of aceclofenac nanosuspension
Batches
F-1AXL
F-2AXM
F-3AXH
F-4AYL
F-5AYM
F-6AYH
F-7AZL
F-8AZM
F-9AZH
Particle size
(nm) 780± 36 650 ±27 510 ±22 405± 40 380 ± 36 215± 16 680± 40 602 ± 31 570± 30
Batches
F-10BXL
F-11BXM
F-12BXH
F-13BYL
F-14BYM
F-15BYH
F-16BZL
F-17BZM
F-18BZH
Particle size
(nm) 710 ± 50 590 ± 48 436± 40 405± 30 210± 15 212± 23 809± 60 760± 72 710±75
Batches
F-19CXL
F-20CXM
F-21CXH
F-22CYL
F-23CYM
F-24CYH
F-25CZL
F-26CZM
F-27CZH
Particle size
(nm) 940± 60 600± 52 500±60 460± 60 225± 30 220± 42 880± 40 780 ± 65 750 ± 50
Values expressed as ± S.E.M of triplicate trials

Fig 10. 3. PARTICLE SIZE OF FORMULATIONS OF ACECLOFENAC NANOSUSPENSION

125
Zeta Potential:
The particle charge is one among the factors that determines the physical
stability of emulsions and suspensions. The higher particles are equally charged, the
higher is the electrostatic repulsion between the particles and the higher is the physical
stability. The particle charge can be quantified as surface charge in terms of zeta
potential, which is measured e.g. via the electrophoretic mobility of the particles in an
electrical field.
Zeta potential is the electrical charge at the hydrodynamic shear plane and can
be determined from the particle mobility under an applied external electric field. The
movement of the particles will depend on the effective charge on the surface of the
individual particles. The zeta potential values are highly useful in predicting the storage
stability of colloidal dispersions. According to the zeta potential theory241
the particles
possess a surface charge, which occurs due to the dissociation of surface functional
groups, called as Nernst potential. The degree of dissociation of the functional groups
depends of the pH of the suspension, and hence the zeta potential is pH dependent. The
evaluation of zeta potential is considered as critical because the nanosuspension is
designed for oral administration and after administration they undergo a pH changes,
particularly acidic pH in the stomach, increasing to alkaline pH (pH 7) in the gastro
intestinal tract (GIT).
In general, greater the zeta potential value of a nanoparticulate system better is
the colloidal suspension stability due to repulsion effect between charged nanoparticles.
Zeta potential values in the −15 to −30 mV are common for well-stabilized
nanoparticles242
. The zeta potential values were found to be -18.6±0.3mV, -18.3±0.4
mV, -16.3±0.4 mV and -16.4±0.3 mV for the formulations F-14BYM, F-15BYH, F-
23CYM and F-24CYH respectively. These results indicate that the four batches of the
nanosuspension will be more stable on storage. Eudragit L100 is an anionic polymer
and the hence the formulations indicated negative surface charge and the variation in
the charge may be attributed by the presence of aceclofenac and tween 80.
Polysorbate 80 (Polyoxyethylen(20)sorbitan monooleate), Tween 80 possess HLB
value of 15 and it is a non-ionic surfactant with a relatively low toxicity. It is widely
used in the commercial preparations for oral use. Eg. Combantrin tablet and oral
suspension (Pfizer Consumer Healthcare 2000) contains this surfactant.

126
Table 10.6. Zeta potential values of optimized formulations
S.No Formulations Zeta Potential (mV)
1 F-14BYM -18.6±0.3
2 F-15BYH -18.3±0.4
3 F-23CYM -16.3±0.4
4 F-24CYH -16.4±0.3
Fig 10.4. Zeta potential of Nanosuspension of Aceclofenac- F-14BYM
Fig 10.5. Zeta potential of Nanosuspension of Aceclofenac- F-15BYH
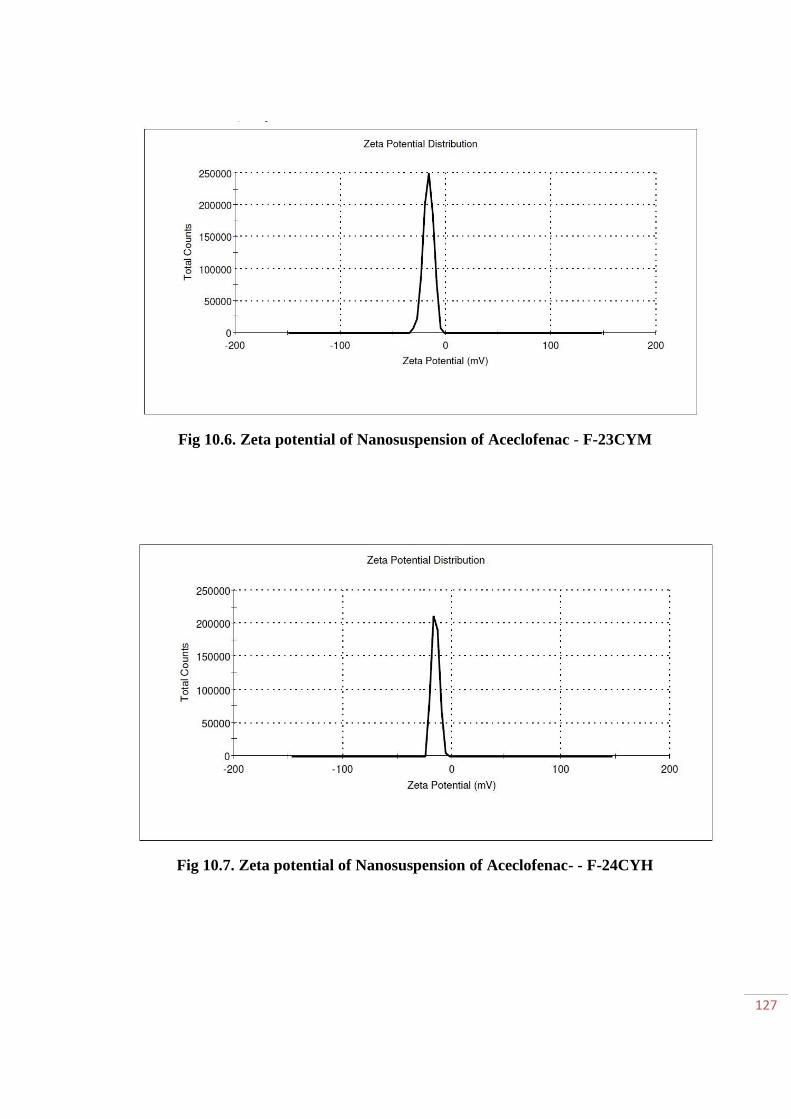
127
Fig 10.6. Zeta potential of Nanosuspension of Aceclofenac - F-23CYM
Fig 10.7. Zeta potential of Nanosuspension of Aceclofenac- - F-24CYH
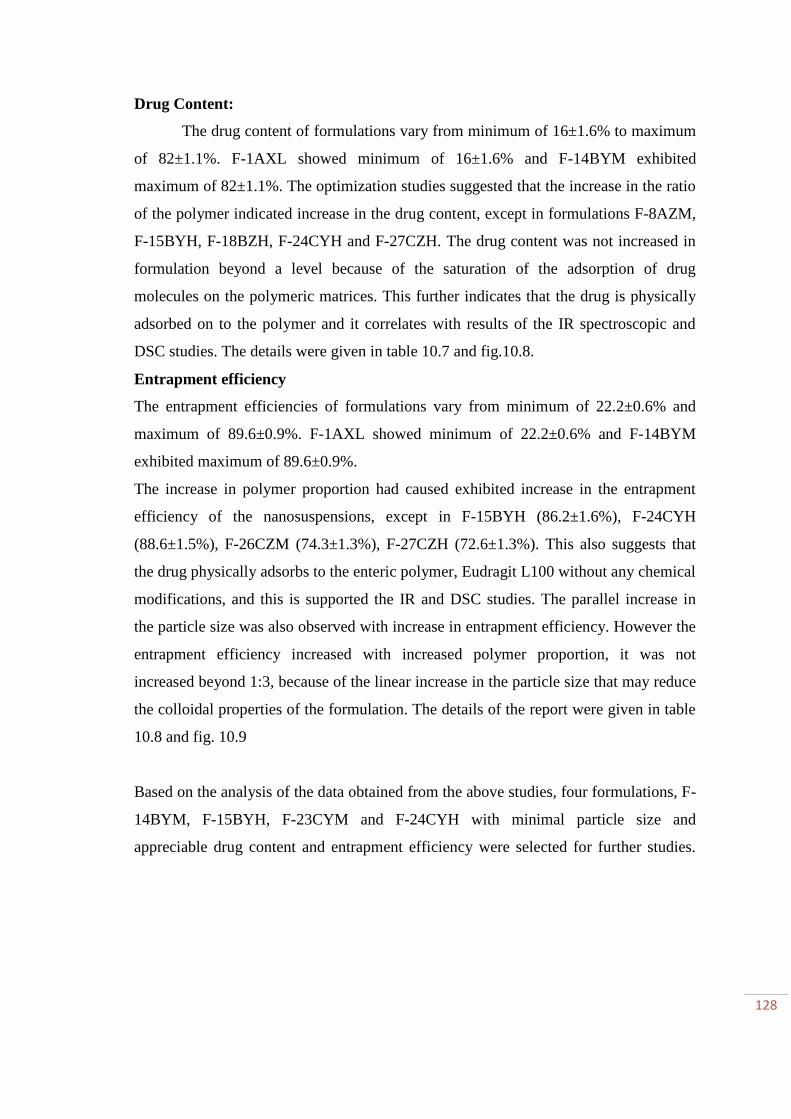
128
Drug Content:
The drug content of formulations vary from minimum of 16±1.6% to maximum
of 82±1.1%. F-1AXL showed minimum of 16±1.6% and F-14BYM exhibited
maximum of 82±1.1%. The optimization studies suggested that the increase in the ratio
of the polymer indicated increase in the drug content, except in formulations F-8AZM,
F-15BYH, F-18BZH, F-24CYH and F-27CZH. The drug content was not increased in
formulation beyond a level because of the saturation of the adsorption of drug
molecules on the polymeric matrices. This further indicates that the drug is physically
adsorbed on to the polymer and it correlates with results of the IR spectroscopic and
DSC studies. The details were given in table 10.7 and fig.10.8.
Entrapment efficiency
The entrapment efficiencies of formulations vary from minimum of 22.2±0.6% and
maximum of 89.6±0.9%. F-1AXL showed minimum of 22.2±0.6% and F-14BYM
exhibited maximum of 89.6±0.9%.
The increase in polymer proportion had caused exhibited increase in the entrapment
efficiency of the nanosuspensions, except in F-15BYH (86.2±1.6%), F-24CYH
(88.6±1.5%), F-26CZM (74.3±1.3%), F-27CZH (72.6±1.3%). This also suggests that
the drug physically adsorbs to the enteric polymer, Eudragit L100 without any chemical
modifications, and this is supported the IR and DSC studies. The parallel increase in
the particle size was also observed with increase in entrapment efficiency. However the
entrapment efficiency increased with increased polymer proportion, it was not
increased beyond 1:3, because of the linear increase in the particle size that may reduce
the colloidal properties of the formulation. The details of the report were given in table
10.8 and fig. 10.9
Based on the analysis of the data obtained from the above studies, four formulations, F-
14BYM, F-15BYH, F-23CYM and F-24CYH with minimal particle size and
appreciable drug content and entrapment efficiency were selected for further studies.

Table 10.7. Drug content (%) of aceclofenac nanosuspension
Batches
F-1AXL
F-2AXM
F-3AXH
F-4AYL
F-5AYM
F-6AYH
F-7AZL
F-8AZM
F-9AZH
Drug
content (%) 16±1.6 23±1.4 25±2.6 35±1.0 36±1.8 41±3.5 28±1.6 28±1.5 32±1.4
Batches
F-10BXL
F-11BXM
F-12BXH
F-13BYL
F-14BYM
F-15BYH
F-16BZL
F-17BZM
F-18BZH
Drug
content (%) 45±1.6 58±1.6 69±2.5 64±2.5 82±1.1 79±2.3 46±1.1 48±1.6 48±1.8
Batches
F-19CXL
F-20CXM
F-21CXH F-22CYL F-23CYM F-24CYH F-25CZL F-26CZM F-27CZH
Drug
content (%) 59±1.0 60±1.5 62±2.2 65±1.3 81±1.6 80±1.1 69±1.3 69±1.7 66±1.6
Values expressed as ±S.D in percentage

Fig 10.8. PERCENTAGE DRUG CONTENT OF ACECLOFENAC NANOSUSPENSION FORMULATIONS
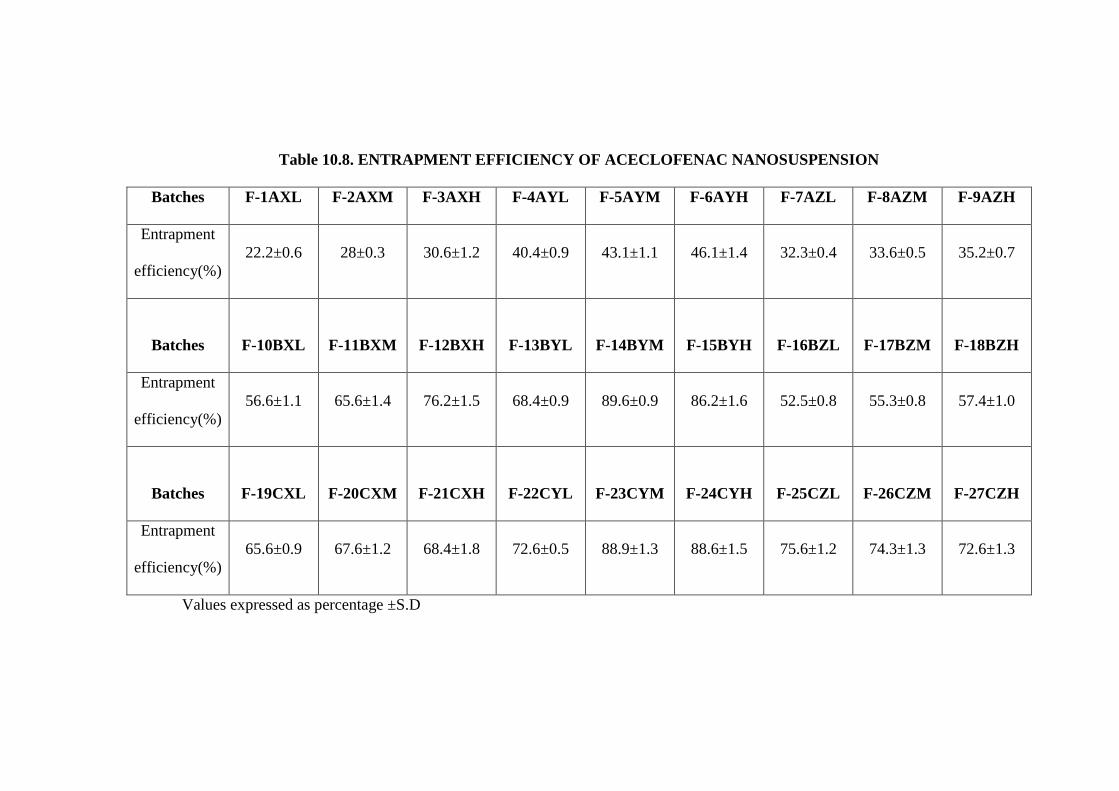
Table 10.8. ENTRAPMENT EFFICIENCY OF ACECLOFENAC NANOSUSPENSION
Batches F-1AXL F-2AXM F-3AXH F-4AYL F-5AYM F-6AYH F-7AZL F-8AZM F-9AZH
Entrapment
efficiency(%)
22.2±0.6 28±0.3 30.6±1.2 40.4±0.9 43.1±1.1 46.1±1.4 32.3±0.4 33.6±0.5 35.2±0.7
Batches
F-10BXL
F-11BXM
F-12BXH
F-13BYL
F-14BYM
F-15BYH
F-16BZL
F-17BZM
F-18BZH
Entrapment
efficiency(%)
56.6±1.1 65.6±1.4 76.2±1.5 68.4±0.9 89.6±0.9 86.2±1.6 52.5±0.8 55.3±0.8 57.4±1.0
Batches
F-19CXL
F-20CXM
F-21CXH
F-22CYL
F-23CYM
F-24CYH
F-25CZL
F-26CZM
F-27CZH
Entrapment
efficiency(%)
65.6±0.9 67.6±1.2 68.4±1.8 72.6±0.5 88.9±1.3 88.6±1.5 75.6±1.2 74.3±1.3 72.6±1.3
Values expressed as percentage ±S.D

Fig 10.9. PERCENTAGE ENTRAPMENT EFFICIENCY OF ACECLOFENAC NANOSUSPENSION FORMULATIONS

133
In vitro Release studies & Release kinetics:
The in vitro release of the four formulations, F-14BYM, F-15BYH, F-23CYM and
F-24CYH were 98.7±1.2, 94.1±1.4, 85.7±2.0, and 88.5±2.2% at the end of 24 hrs,
respectively. The batch, F-14BYM released 20.2±0.5% of the loaded aceclofenac within 1
hr, which may be helpful in achieving quick onset of action. Thereafter steady controlled
release was exhibited for 24 hrs by F-14BYM.
F-15BYH released 8.3±1.2% of drug loaded in 1hr. F-23CYM and F-24CYH
releases 4.5±1% and 8.3±0.4% of drug release in 1hr. Hence it suggests that the release
profile of F-14BYM is ideal to consider the controlled release formulation for performing
the in vivo studies.
Table 10.9. Drug release data of Aceclofenac Nanosuspension
S.No Time (hr) F-14BYM(%) F-15BYH (%) F-23CYM(%) F-24CYH(%)
1 0 0 0 0 0
2 0.5 8.7±0.4 5.2±0.6 3.1±0.2 5.2±0.1
3 1 20.2±0.5 8.3±1.2 4.5±1 8.3±0.4
4 1.5 30.1±0.7 11.2±1.5 7.6±0.8 9.9±0.2
5 2 32.8±0.6 14.6±1.7 8.9±0.6 12.3±0.7
6 2.5 39.6±1.0 17.8±1.5 11.3±1.4 13.6±1.2
7 3 40.1±1.1 22.9±1.8 15.3±1.5 17.5±0.8
8 4 41.6±0.9 32.2±1.8 17.5±1.8 22.3±1.0
9 6 45.6±1.2 41.7±0.8 26.8±1.8 28.3±1.8
10 8 57.6±1.4 48.3±1.3 36.2±2.0 38.6±1.3
11 10 65.4±1.4 57.3±1.5 42.7±1.6 46.3±1.6
12 12 78.2±1.4 65.6±1.4 55.6±2.5 60.1±2.4
13 16 84.3±1.8 81.8±1.7 71.2±2.0 73.2±1.9
14 20 92.8±1.2 94.1±1.4 85.1±2.2 87.1±2.4
15 24 98.7±1.2 94.1±1.4 85.7±2.0 88.5±2.2
Cumulative release of drug expressed in percentage ±SD of triplicate trials

134
Fig 10.10 Cumulative drug release Vs Time in hrs for optimized trials
Fig 10.11 Cumulative drug release Vs Time in hrs for F-14BYM

135
Fig10.12. Higuchi model for optimized trials
Fig.10.13. Higuchi model for F-14BYM

136
Fig. 10.14 Korsemayer Peppas
To know the mechanism of drug release from various preparations the data were
treated according to zero order, first order, Higuchi and korse mayer equation. The release
rate kinetic data for all the equations were shown in graph. Fig 10.10, 10.11, 10.12, 10.13.
The value fitted to zero order plot and its regression value was 0.982, as its value is close
to 1, it was conformed that it followed zero order release. The mechanism of drug release
was further cconformed by korsemayer and peppas plot. According to this 0.5 is Fickian
diffusion, 0.5 < n < 1 is anomalous transport or Non-Fickian transpory, 1 is Case II
transport, n > 1 is Super case II transport. The n value of the formulation F-14BYM was
0.926 and hence it suggests non fickian diffusion.

137
11. PHARMACOLOGICAL STUDIES
MATERIALS AND METHODS
Animals
Healthy Male Wistar rats (120 - 170 g) obtained from the animal house of Vel’s
College of Pharmacy, Tamil Nadu, India was used for the study. Animals were housed in
polypropylene cages and were left 7 days for acclimatization to animal room maintained
under controlled condition (a 12 h light–dark cycle at 22±2 ◦C) on standard pellet diet and
water ad libitum. All animals were taken care of under ethical consideration as per the
guidelines of CPCSEA with due approval from the Institutional Animal Ethics Committee.
The approval no. was 290/CPCSEA/PH-15/13.10.2009. Animals were used for acute
toxicity study and anti-inflammatory study.
EVALUATION OF ANTI-INFLAMMATORY ACTIVITY
Method:
Carrageenan induced paw edema in rats:
Wistar albino rats were used, which were divided into 5 groups (n =6). The animals
were fasted overnight with free access to water. At the lateral malleolus portion, an ink mark
was made in the left paw. On immersing the paw till the level of lateral malleolus, volume
displaced was measured using plethysmometer that implies the basal paw volume. In the right
hind paws were injected 0.1 ml of carrageenan in isotonic saline (1%w/v) in subplantar
region of all group of animals, which induces edema. Reference and controlled drug
delivery systems [nanosuspension (F-14BYM) & microspheres (M4)] of aceclofenac were
given orally 30 minutes prior to carrageenan injection. The volume of the injected paws and
contra-lateral paws were measured at 1, 2, 3, 4 and 5 hours intervals using
plethysmometer243
. The percent Inhibition was calculated using the following formula
% Inhibition = 1 – Vt / Vc × 100
Where, Vc = Mean edema volume in control group,

138
Vt = Mean edema volume in test group.
Adjuvant induced inflammation of rat paw
Adjuvant inflammation was induced by injection of 0.1ml of heat-killed
Mycobacterium hutyricum suspended in mineral oil (10 mg/ml) into the right hind foot pad
of the rats. After 14 and 21 days, the inflammation development was evaluated. Primary
and secondary arthritic lesions were scored on an arbitrary scale as follows: left and right
hind feet each 0-7, left and right fore feet each 0- 4.5, tail 0-5, ears 0-2, nose and eyes each
0-l138
.
Gastrointestinal tolerability:
At the end of the study period, after 24 h of fasting, the animals were anaesthetized
with anesthetic ether and killed244
. The gastrointestinal tract was opened, the luminal
content removed by washing with saline solution, the tissues carefully examined for any
presence of lesions according to the standard protocol. Coprophagia was prevented during
and after the experiment.
Statistical analysis:
The statistical significance was assessed by using one-way analysis of variance
(ANOVA) and followed by Dunnet’s comparisons test. All the data are presented as mean
± SEM and p<0.05 was considered as significant.
RESULTS AND DISCUSSION:
The paw edema induced by the injection of Carrageenan is the commonly used
experimental model for acute inflammation. The edema induced by carageenan is a biphasic
event. The first phase (1-2 h) is mediated by serotonin, histamine and due to increased
synthesis of prostaglandins in damaged tissue. The late phase sustained by prostaglandin
release, mediated by Polymorphonuclear (neutrophils and monocytes), bradykinin,
leukotrienes and prostaglandins produced by tissue macrophages244. Carrageenan induced
inflammation is useful in detecting orally active anti-inflammatory agents245. Administrations
of carrageenan to normal animals showed significant (P< 0.05) increase in paw
inflammation from 1hrs to 5 hrs when compared to control. Paw edema in rats reached its

139
peak at 4 hrs after carrageenan administration. Per oral treatment of nanosuspension of
aceclofenac (F-14BYM) showed higher significant (P<0.01) reduction paw volume in rats
from 1 hrs and maintained its effect throughout the study period. In addition, microspheres
also produced a significant inhibition (P<0.05) of paw volume in rats with carrageenan
administration. Among the two different drug formulations, nanosuspension (F-14BYM)
treated inflammatory rats exhibited high anti-inflammatory response than the microspheres
(M4) (Figure 11.1).
Daily oral administration of reference aceclofenac and nano and microsphere
loaded aceclofenac at 10 mg/kg markedly and significantly inhibited arthritis development
until the end of the study period. With aceclofenac nanosuspension (F-14BYM), the
highest percentage of inhibition was observed from various day intervals than the
microspheres (M4) and reference drug (Figure 11.2 & 11.3).
The NSAIDs are used for the relief of pain and inflammation, but it increases the risk
of gastrointestinal side effects ranging from dyspepsia to symptomatic and complicated
ulcer246. Vasoactive agents (Prostaglandins, calcitonin, nitric oxide, gene related proteins) play
a role in mucosal defensive processes247.
1 2 3 4 5 60
10
20
30
40
50
Control
Carageenan
Carageenan + NS
Carrageenan + MS
Carrageenan + Aceclofenac
**
****
**
**
****
**
*** ***
******
**
****** ***
Paw
vo
lum
e th
ickn
ess
in m
m
Fig. 11.1. Effect of aceclofenac loaded nanosuspension and microspheres on paw volume
thickness in rats with carrageenan

140
Fig. 11.1 represents the effect of aceclofenac loaded nanosuspension (F-14BYM);
microspheres(M4) and plain aceclofenac in rats with paw edema. It was observed from the
figure that carageenan administration to rats significantly (P< 0.05 – P < 0.001) increases
the paw volume thickness from 1 hrs to 6 hrs of time period than control. Rats treated with
nanosuspension (F-14BYM) showed significant decrease in the paw volume at different
time period from 1 hrs to till end of the study as compared with carrageenan treated paw
volume. Further microspheres (M4) treated rats showed significant decrease in paw
volume from 3 hrs to till end of the study. However the attenuation of paw volume in rats
administered with plain aceclofenac sodium was noted from 4 hrs after carrageenan
challenge.
Hin
d Fee
t
Fore
FeetTai
l
Ear
sN
ose
Hin
d Fee
t
Fore
FeetTai
l
Ear
sN
ose
Hin
d Fee
t
Fore
FeetTai
l
Ear
sN
ose
Hin
d Fee
t
Fore
FeetTai
l
Ear
sN
ose
0
2
4
6
8FA ControlFA + NSFA + MSFA + Aceclophenac
******
**
*
*****
*
Sco
re
Fig. 11.2. FA induced inflammatory score day 14
Figure 11.2 represents the effect of aceclofenac loaded nanosuspension (F-14BYM);
microspheres (M4) and plain aceclofenac in freund’s adjuvant (FA) induced inflammation
in rats. Administration of aceclofenac nanosuspension has shown significant (P<0.001)

141
reduction in lesion scores than the freund’s adjuvant treated rats. In addition, microspheres
loaded with aceclofenac also showed significant effect in reducing scores only in hind paw,
tail and nose than control FA treated rats. However there is no significant reducing effect
was noted in plain aceclofenac.
Hin
d Fee
t
Fore F
eetTail
EarsN
ose
Hin
d Fee
t
Fore F
eetTail
EarsN
ose
Hin
d Fee
t
Fore F
eetTail
EarsN
ose
Hin
d Fee
t
Fore F
eetTail
EarsN
ose
0
2
4
6
8FA ControlFA + NSFA + MSFA + Aceclophenac
***
***
**
*
*** **
*
**
*
*
Sco
re
Fig. 11.3. FA induced inflammatory score day 21
Fig. 11.3 represents the effect of aceclofenac loaded nanosuspension (F-14BYM); micro
sphere and plain aceclofenac in freund’s adjuvant induced inflammation in rats.
Administration of aceclofenac nanosuspension has shown significant (P<0.001) reduction
in lesion scores than the freund’s adjuvant treated rats. In addition, microsphere loaded
aceclofenac also showed significant effect in reducing scores only in hind paw (P<0.001),
fore paw (P<0.01) nose than control FA treated rats. However there was no significant
reducing effect was noted in plain aceclofenac.
Gastrointestinal tolerability
Gastric ulcers are open sores in the lining of the upper GIT. They include duodenal ulcers
and gastric ulcers. Gastric ulcer is one among the most serious diseases in the world. The
etiology factors that may induce ulcer in human being are several they are stress, chronic

142
use of anti-inflammatory drugs and continuous alcohol ingestion, spicy food among
others248
.
Oral administration of the test drugs F-14BYM (aceclofenac nanosuspension) and
M4 (microspheres) to the different groups of animals clearly produced a mucosal damage
characterized by mild to multiple hemorrhage red bands. F-14BYM showed decreased
intensity of gastric mucosal damages induced by the aceclofenac compared with control
group. It was represented in table 11.1 and fig.11.4, 11.5 and 11.6.
METHODOLOGY:
Scoring of ulcer will be made as follows:
Normal stomach - (0), Red coloration - (0.5), Spot ulcer - (1), Hemorrhagic streak- (1.5)
Ulcers - (2), Perforation - (3)
Mean ulcer score for each animal was expressed as Ulcer Index. The percentage of Ulcer
protection was determined as follows249
.
MACROSCOPICAL VIEW OF STOMACH OF THE RATS:
Fig. 11.4 (Control & Standard)
Control: Drug treated rat’s shows congestion, oedema, mucosal damage.
Standard: Ranitidine 20mg/kg shows protection of mucosal layer
Fig. 11.5 (Aceclofenac Nanosuspension F-14BYM)
10mg/kg shows protection of mucosal layer.
Fig. 11.6. (Aceclofenac Microspheres M4)
10mg/kg shows protection of mucosal layer.

143
Table: 11.1 Influence of Aceclofenac Nanosuspension (F-14BYM) and
Microspheres (M4) on gastric ulcer induction.
Group Treatment Ulcer index
I Control 11.4± 0.05
II Ranitidine 3.1 ± 0.4
III F-14BYM (10mg/kg) 4.6 ± 0.03
IV M4 (10mg/kg) 8.4 ± 0.04
In the present study both F-14BYM and M4 showed reduced gastric ulceration.
When compared to M4, nanosuspension F-14BYM showed reduced gastric ulceration.
Fig. 11.4 Macroscopical view of stomach of the rats treated
with control & standard
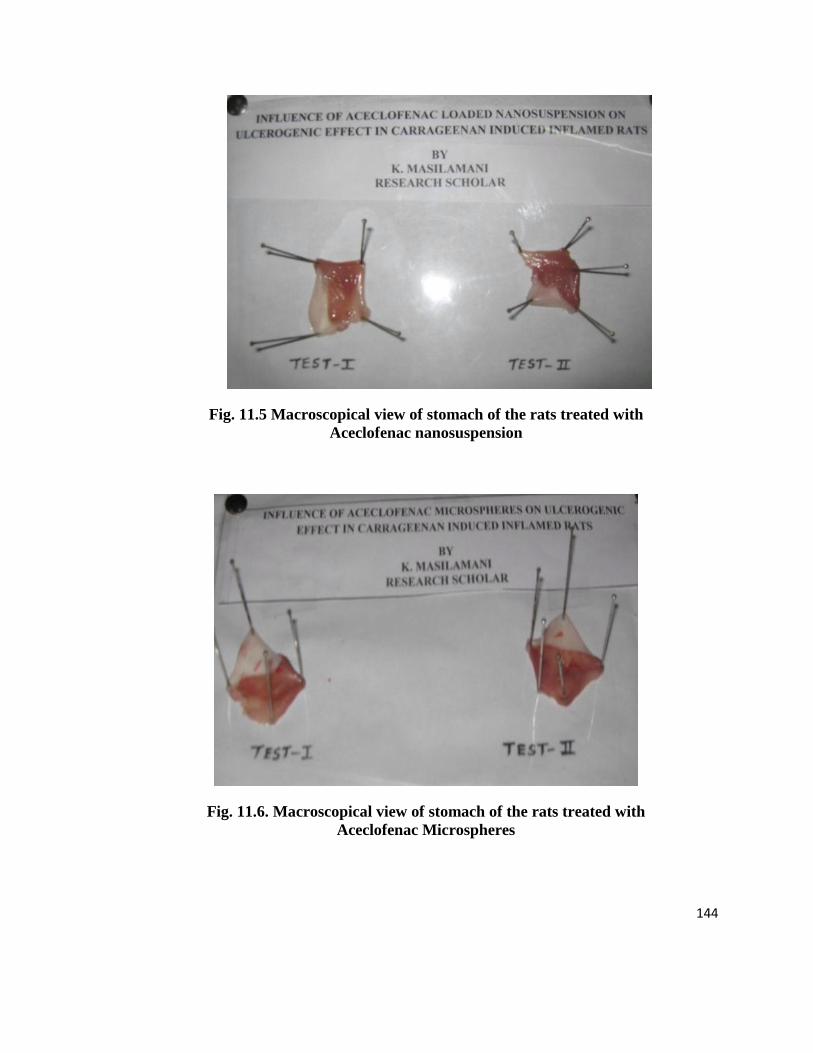
144
Fig. 11.5 Macroscopical view of stomach of the rats treated with
Aceclofenac nanosuspension
Fig. 11.6. Macroscopical view of stomach of the rats treated with
Aceclofenac Microspheres

145
CONCLUSION:
Aceclofenac is an ideal drug for converting into the controlled release formulation
and in the present investigation Aceclofenac loaded microspheres, nanosuspensions were
successfully developed with desirable release profiles as per USP specifications and
optimized the variables. From the above studies, the formulated controlled release dosage
forms of aceclofenac showed an improved therapeutic effect and a better dosage form with
decreased or no side effects (mainly the ulcerogenic potential) for the management of
inflammation.

146
12. STABILITY STUDIES
OSMOTIC TABLETS
The osmotic tablets (OT10) had not shown any visible changes including colour at least for
90 days. The tablets were stored at 40oC /RH75% for 90 days in stability test chamber. The
formulation were subjected to various quality control test were performed at pre-
determined intervals. The formulation had not indicated any significant changes in the
parameters like Drug Content (%), Weight variation,Thickness (mm), Hardness (kg/cm2)
and Friability (%).However, a slight alteration in the extent of release of aceclofenac was
reduced by 2.74% after 90 days.
Table 12.1. Stability Studies of osmotic tablet containing Aceclofenac (OT-10) at
Temp 40oC /RH75%
Parameters
Days
15 30 45 60 90
Drug Content (%) 99.89 ±0.20 99.51
±0.28
99.40
±0.34
98.83
±0.22 98.50 ±0.51
Weight variation 551.22 ±
0.25
551.22
±0.35
551.22
±0.42
551.22
±0.58
551.22
±0.65
Thickness (mm) 5.27 ± 0.29 5.27 ±0.17 5.27
±0.31 5.27 ±0.25 5.27 ±0.20
Hardness (kg/cm2) 7.5 ±0.37 7.5 ±0.20 7.5 ±0.38 7.5 ±0.22 7.3 ±0.41
Friability (%) 1.0 ± 0.54 1.04 ± 0.24 1.10 ±
0.15
1.05 ±
0.16 1.12 ± 0.31
Values expressed ±SD of triplicate trials

147
Table 12.2. Stability Studies of osmotic tablet containing Aceclofenac (OT-10) at
Temp 40oC /RH75%-Drug Release
S.No Time
(hrs)
Cumulative percentage release of aceclofenac(%)
15 30 45 60 90
1 0 0 0 0 0 0
2 2 12.23± 0.24 11.36± 0.15 11.16± 0.11 10.24± 0.28 09.12± 0.21
3 4 28.11± 0.08 27.13± 0.06 26.11± 0.24 22.69± 0.08 20.56± 0.12
4 6 46.22± 0.21 42.83± 0.86 41.14± 0.65 40.64± 0.24 40.22± 0.44
5 8 68.92± 0.17 66.32± 0.19 66.12± 0.22 63.45± 0.21 60.66± 0.13
6 12 76.57± 0.13 73.57± 0.23 71.19± 0.43 70.61± 0.29 69.15± 0.87
7 16 75.12± 0.15 86.68± 0.08 84.55± 0.10 82.74± 0.15 80.11± 0.21
8 20 92.14± 0.20 90.21± 0.47 89± 0.16 88.12± 0.32 85.28± 0.41
9 24 94.04± 0.26 93.3± 0.35 92.6± 0.65 91.61± 0.20 91.3± 0.12
Microspheres
The optimized formulation of M4 was subjected to stability studies by storing the samples
at three variant temperature conditions, i.e 2-8, 25 and 40oC. Samples were withdrawn at
predetermined time intervals of 15, 30, 45, 60 and 90 days, and then evaluated for the
particle size and drug content. The results show that there were no considerable changes in
the parameters studied, however minor changes in the particle size and drug content at
elevated temperature conditions. This suggests that the formulations were stable under
norma conditions, the ideal storage of the microsphere formulation at temperatures is less
than 25oC.

148
Table 12.3. Stability Studies of Aceclofenac microspheres (M4)
Temp
Parameters
Days
15 30 45 60 90
2-8oC
Particle Size (µm) 21±10 21±12 21±12 21±15 21±13
Drug content (%) 65±0.2 65±0.5 65.±0.7 64.75±0.5 64.50±0.5
25oC
Particle Size (µm) 21±10 21±22 22±12 22.5±19 23±25
Drug content (%) 65 ±0.1 64.5±0.4 64.5±1.2 64.25±1.0 63.25±1.2
40oC
Particle Size (µm) 21±8.0 21±22 22±10 23±17 24±20
Drug content (%) 65±0.3 62±0.7 60.25±0.9 61±1.9 60.25±2.0
Values expressed ±SD of triplicate trials
Nanosuspension:
None of the NS formulations indicated any symptoms of agglomeration, sedimentation or
colour change during the period of assessment. However the formulations were subjected
to particle size analysis and drug content evaluation which are considered to be very
critical parameters in deciding the stability of the nanosuspensions. The formulation F-
14BYM stored at 2-8oC retained the particle size (210nm) with minor variation (0.5%)
until 90days.
Table 12.4. Stability Studies of Aceclofenac Nanosuspension (F-14BYM)
Temp
Parameters
Days
15 30 45 60 90
2-8oC
Particle Size (nm) 210±18 210±22 210±22 210±25 210±25
Drug Content (%) 82±0.2 82±0.2 81.50±0.4 81.50±0.5 81.50±0.7
25oC
Particle Size (nm) 210±20 210±25 210±25 215±15 215±20
Drug Content (%) 82 ±0.1 82±0.4 81.25±0.8 81.25±1.2 81.25±1.5
40oC
Particle Size (nm) 210±18 210±22 212±15 218±15 218±20
Drug Content (%) 82±0.7 82±0.9 81.25±1.0 81.25±1.6 80.25±2.0
Values expressed ±SD of triplicate trials

149
The formulations stored at 25oC exhibited a negligible increase in particle size (5nm) with
a minor decrement in the drug content (0.75%). A considerable increase in particle size
(8nm) was recorded with parallel drug degradation (1.75%) with in the period of 90 days.
The study suggests storage in cool condition for the NS F-14BYM, although the product is
stable even above 25oC. The use of steric stabilizer, tween 80 might have played a vital
role in achieving the stability of this formulation.

150
13. SUMMARY AND CONCLUSION:
Oral drug delivery is the most common and frequently used system to deliver drugs
and it is one of the most suitable, convenient, safe, economic and effective way to deliver
the drug. Aceclofenac is a drug commonly used in the management of pain and
inflammation in various conditions like post-traumatic, cervical and low back pain,
ankylosing spondylitis, rheumatoid arthritis and osteoarthritis. This drug, on long term
usage, specifically by oral route is reported to cause adverse effects including gastritis. So
the situation demands development of safe and effective oral drug delivery system for
aceclofenac.
Its short half-life (4- 4.3hrs), which demands frequent administration and severe
gastrointestinal (GI) irritation and other side effects demands the development of a
controlled release formulation. Thus the overall aim and objective of the present work was
to:
Enhance the overall therapeutic efficacy of aceclofenac by controlled release
Minimize the adverse effects
Reduce the overall dose and dosing frequency of aceclofenac
Achieve improved patient compliance
To achieve the above goals oral controlled drug delivery systems like Osmotic tablets,
Microspheres and Nanosuspensions of Aceclofenac were developed, optimized and
evaluated in vitro and in vivo.
The preformulation studies were performed for the drug and excipients. The
melting point, loss on drying, angle of repose, bulk density, tap density, Hausner’s ratio
compressibility index were calculated. The flow property studies indicated that the
aceclofenac has poor flow properties.
151
Compatibility studies of IR and DSC studies were performed and these reports
suggested no chemical interaction between aceclofenac and the polymers/excipients used
for the development of various formulations.
Aceclofenac osmotic tablets were prepared by wet granulation method using
different osmotic agents - sodium bicarbonate sodium chloride, and potassium chloride and
their concentrations were optimized performing 13 trails (OT1-OT13). Cellulose acetate
was used as semipermeable membrane and PEG 400 as pore forming agent. The
precompressional parameters of aceclofenac granules like bulk density, tapped density,
angle of repose, compressibility index, hausner ratio were evaluated. The results of pre
compression parameters and post compression parameters were found to be within the
limits and there was no significant change in the pre compression parameters and post
compression parameters of all the formulations (OT1-OT13). The maximum drug content
was obtained with the OT10 which was found to be 99.80 ± 0.58%. The invitro release
studies carried out on the osmotic tablets indicated the effect of same amount of three
different osmogens (sodium bicarbonate, sodium chloride and potassium chloride) and the
combinations of these osmogens exhibits significant increase in rate and extent on drug
release. All the prepared push pull osmotic tablets of Aceclofenac (OT9- OT13) had shown
one hour delayed drug release, which may be attributed to time elapsed for imbibition of
osmotic core with the release medium. After one hour, almost all the batches exhibited
linear and controlled drug release profiles. Sodium chloride(25mg) and sodium
bicarbonate(50mg) based push pull osmotic tablets of aceclofenac (OT10) exhibited little
higher rate and extent of drug release than potassium chloride(25mg) and sodium
bicarbonate(50mg) based tablets. The drug release also increased significantly with
increase in the concentration of osmotic agent.
Three different medium simulating the GI pH were used to carry out the in vitro
dissolution studies and the results indicated that the rate of release was moderately affected
by pH. The invitro drug release results of formulations (OT1- OT6) were not found to be
official limits for controlled release due to lesser concentration of osmogens. Further, the

152
formulations (OT7-OT13) showed profound increase in the dissolution profile due the
increased concentration of osmogens in combination mode. The formulation (OT10) gave
desired drug release profile of 94.3% in 24 hrs in which a combination of sodium chloride
(25mg) and sodium bicarbonate (50mg) were used as osmogens in this formulation.
The microsphere formulations were made with varying proportion of the drug
polymer ratios as well as varying concentrations of two polymers (polymer mix) Eudragit
L 100 and PLGA. For this polymer mix of Eudragit L100: PLGA in the ratios of 1:1,1:2
and 1:3. The internal variation in the polymer mix were designated as a, b and c.
Aceclofenac loaded Eudragit:PLGA microspheres were prepared by using PVA
(3%w/v) as stabilizer. Eudragit L100 and drug were dissolved in ethanol and PLGA was
dissolved in acetone, respectively. Subsequently the Eudragit solution in ethanol was
added slowly to the PLGA solution in acetone with a constant stirring and stirring is
continued to remove the solvent. Then the microspheres were washed and resuspended in
distilled water and lyophilized.
The prepared microspheres were characterized by determining the particle size, drug
content, entrapment efficiency, invitro release and stability studies. The determination of
the particle size was carried out by optical microscopy and there was an increase in particle
size with increase in polymer concentration. The mean particle size of the formulation M4
was 20±10μm and M13was 630±36µm, indicated the lowest and the highest particle size.
The entrapment efficiency of the microspheres were also found to be varying and was
maximum of 86.6±0.6% with M4 and minimum 25±1.1% with M3. The morphology of
the optimized formulation of microspheres was found to be discrete, smooth and spherical.
Based on the particle size and entrapment efficiency the optimized formulations (M4, M5
and M13) were selected for further studies. The in vitro release profile of M4, M5 and
M13 indicated controlled release of aceclofenac with maximum of 96.6±1.6, 88.6±1.8 and
76.2±1.9%, respectively. The formulation M4 was subjected for in vivo anti-inflammatory,
anti-arthritic and gastro intestinal tolerability tests as it exhibited maximum release at 24
hrs along with other optimal characters. M4 was exhibited for stability studies. Samples

153
were withdrawn at predetermined time intervals of 15, 30, 45, 60 and 90 days, and then
evaluated for the particle size and drug content.
Aceclofenac loaded Eudragit L100 nanosuspension was prepared by o/w emulsion
method. The product and process parameters involved were optimized by the application
of multifactorial design. The prepared NS were characterized by study of morphological
characters, determination of particle size analysis, zeta potential, drug content, entrapment
efficiency, invitro release and stability studies.
From the results of the optimization studies data, the formulations F-14BYM, F-
15BYH, F-23CYM and F-24CYH were considered as ideal and selected for further
studies. They have particle size of 210±15nm, 212±23nm, 225±30nm and 220±42nm and
entrapment efficiency of 89.6±0.9%, 86.2±1.6%, 88.9±1.3% and 88.6±1.5%, respectively.
The formulations with F-14BYM, F-15BYH, F-23CYM and F-24CYH were identified as
the optimized formulations with respect to particle size, drug content and entrapment
efficiency, and these were selected for the other studies. The SEM analysis was performed
and the SEM photos of aceclofenac nanosupension were recorded. The particles of all the
batches are almost spherical with smooth surface, however they shown variation in size.
Increase in sonication time/agitation speed there is reduction in particle size. Entrapment
efficiency increased with the increase in polymer concentration. It is well evident that the
concentration of tween 80 played a significant role in achieving the particle size and
entrapment efficiency. The increase in tween 80 concentration, from 0.01% to 0.02% there
is an increase in entrapment efficiency and decrease in particle size. But the increase in the
concentration of tween 80 from 0.02 to 0.03% the particle size increased and entrapment
efficiency decreased. The zeta potential values were found to be -18.6±0.3mV, -18.3±0.4
mV, -16.3±0.4 mV and -16.4±0.3 mV for the formulations F-14BYM, F-15BYH, F-
23CYM and F-24CYH respectively. These results indicate that the four batches of the
nanosuspension had more stability on storage. Eudragit L100 is an anionic polymer and the
hence the formulations indicated negative surface charge and the variation in the charge
may be attributed by the presence of aceclofenac and tween 80. The drug content of
formulations varied from minimum of 16±1.6% to maximum of 82±1.1%. F-1AXL
154
showed minimum of 16±1.6% and F-14BYM exhibited maximum of 82±1.1%. The
optimization studies suggested that the increase in the ratio of the polymer indicated
increase in the drug content, except in formulations F-8AZM, F-15BYH, F-18BZH, F-
24CYH and F-27CZH. The entrapment efficiencies of formulations vary from minimum of
22.2±0.6% and maximum of 89.6±0.9%. F-1AXL showed minimum of 22.2±0.6% and F-
14BYM exhibited maximum of 89.6±0.9%.
The increase in polymer proportion caused increase in the entrapment efficiency of the
nanosuspensions, except in F-15BYH (86.2±1.6%), F-24CYH (88.6±1.5%), F-26CZM
(74.3±1.3%), F-27CZH (72.6±1.3%). Based on the analysis of the data obtained from the
above studies, four formulations, F-14BYM, F-15BYH, F-23CYM and F-24CYH with
minimal particle size and appreciable drug content and entrapment efficiency were selected
for further studies.
The in vitro release of the four formulations, F-14BYM, F-15BYH, F-23CYM and
F-24CYH were 98.7±1.2, 94.1±1.4, 85.7±2.0, and 88.5±2.2% at the end of 24 hrs,
respectively. F-15BYH released 8.3±1.2% of drug loaded in 1hr. F-23CYM and F-24CYH
releases 4.5±1% and 8.3±0.4% of drug release in 1hr. Hence it suggests that the release
profile of F-14BYM is ideal to consider the formulation for performing the in vivo
studies.
None of the NS formulations indicated any symptoms of agglomeration, sedimentation or
colour change during the period of assessment. However the formulations were subjected
to particle size analysis and drug content evaluation which are considered to be very
critical parameters in deciding the stability of the nanosuspensions. The formulation F-
14BYM stored at 2-8oC retained the particle size (210nm) with minor variation (0.5%)
until 90days.
The formulations stored at 25oC exhibited a negligible increase in particle size
(5nm) with a minor decrement in the drug content (0.75%). A considerable increase in
particle size (8nm) was recorded with parallel drug degradation (1.75%) with in the period
of 90 days. The study suggests storage in cool condition for the NS F-14BYM, although
the product is stable even above 25oC.

155
The selected formulations of microsphere (M4) and nanosuspensions (NS F-
14BYM) were subjected for the evaluation of in vivo anti-inflammatory activity in rats.
The paw edema induced by the injection of Carrageenan is the commonly used
experimental model for acute inflammation. Administrations of carrageenan to normal
animals showed significant (P< 0.05) increase in paw inflammation from 1hr to 5 hrs when
compared to control. Paw edema in rats reached its peak at 4 hrs after carrageenan
administration. Per oral treatment of nanosuspension of aceclofenac showed higher
significant (P<0.01) reduction paw volume in rats from 1 hrs and maintained its effect
throughout the study period. In addition, microspheres (M4) also produced a significant
inhibition (P<0.05) of paw volume in rats with carrageenan administration. Among the two
different drug formulations, nanosuspension (NS F-14BYM) treated inflammatory rats
exhibited high anti-inflammatory response than the microspheres. No ulcers were observed
in nanosuspension treated arthritic rats, even if in some rats treated with reference and
microspheres and nanosuspension of aceclofenac thin inflammatory reactions of the wall
and hemorrhagic effusions were present after administration of the highest dose. From the
above studies, the formulated controlled release dosage forms of aceclofenac showed an
improved therapeutic effect and a better dosage form with decreased side effects (mainly
the ulcerogenic potential) for the management of inflammation.
156
CONCLUSION:
The present work was aimed at the development of controlled drug delivery of
aceclofenac for oral route. Three dosage forms were developed.
Osmotic controlled tablets
Microspheres
Nanosuspension
The osmotic tablets (OT10) contain sodium bicarbonate and sodium chloride s
osmogen indicated ideal controlled release of aceclofenac. It released 94.3 ± 0.2% of the
drug at the pH 7.4. This formulation do not cause any gastric irritation because, the release
of drug on the acidic pH is very low. The therapeutic efficacy will be improved due to the
controlled release for 24 hrs.
The microspheres containing aceclofenac M4 indicated excellent flow properties
when compared with pure aceclofenac. Thus the micronized particles (20±10μm) and
higher entrapment efficiency (86.6±0.6%) were achieved. The formulation was stable
atleast for 90 days and indicated controlled release for 24 hrs. The formulation exhibited
better score in ulcerative index in the in vivo studies carried out in rats.
The nanosuspension containing aceclofenac exhibited most of the ideal characters
required for an oral controlled release dosage forms. The colloid particles (F-14BYM) of
lower particle size (210± 15 nm) aided with negatively charged surface charge (-18.6±0.3
mV) has been achieved. The release profile indicated an intial burst release for achieving
the initial loading dose followed by continuous release up to 24 hr. The in vivo animal
studies indicated

157
- Improved anti-inflammatory and arthritic activity
- No sign of ulcer was recorded in nanosuspension treated rats.
Although controlled release was achieved with the osmotic tablets and
microspheres, nanosuspensions exhibited the ideal characters including in vitro and in vivo
studies. The animal studies revealed that GI irritation of aceclofenac has been eliminated.
The selected formulations of the three drug delivery systems were found to be stable.
Hence it can be concluded that the newly developed oral controlled drug delivery systems
of aceclofenac is considered to be ideal and effective in the management of inflammation.
The research work demonstrated the capability of the drug delivery systems- osmotic
controlled tablets, microspheres and nanosuspension of aceclofenac, whereas the dosage
forms can serve as an effective delivery system for other drugs with similar characters.

158
14. BIBLIOGRAPHY
1. Fasinu P, Pillay V, Ndesendo VM, Du Toit LC, Choonara Y.E. Diverse
approaches for the enhancement of oral drug bioavailability. Biopharmaceutics &
Drug Disposition 2011 May; 32(4):185-209.
2. Kalantzi LE, Karavas E, Koutris EX, Bikiaris DN. Recent advances in oral
pulsatile drug delivery. Recent patents on drug delivery & formulation 2009 Jan;
3(1):49-63.
3. Emami J, Varshosaz J, SalijoughiAn N. Development and evaluation of controlled
release buccoadhesive verapamil hydrochloride tablets. DARU. 2008; 16(2):60-69.
4. Shah R, Khanna SC, Kalb O, Ogorka J. Oral controlled release formulations class:
Preparations characterized by special physical form. Patents Docs US Patent
application number US 2011/0038897 2011; 1-15.
5. Siepmann F, Eckart K, Maschke A, Kolter K, Siepmann J. Modeling drug release
from PVAc/PVP matrix tablets. Journal of Controlled Release 2010 Jan;41(2):216-
222.
6. Singh MN, Hemant KS, Ram M, Shivakumar HG. Microencapsulation: A
promising technique for controlled drug delivery. Res Pharm Sci. 2010; 5(2):65-77.
7. Singh BN. Modified-release solid formulations for colonic delivery. Recent patents
on drug delivery & formulation 2007; 1(1):53-63.
8. Singh BN, Kwon Kim. H. Drug delivery Oral route, Encyclopedia of
Pharmaceutical Technology, 2007. vol 1. p.1242-1261.
9. Kumar P, Singh S, Rajinikanth PS, Mishra B. An overview of osmotic pressure
controlled release oral formulation. J. Pharm. Res. 2006; 5:34-45.
10. Freiberg S, Zhu XX. Polymer microspheres for controlled release. International
Journal of Pharmaceutics, 2004, 282(1-2): 1-18
11. Gupta BP, Thakur N, Jain NP, Banweer J, Jain S. Osmotically controlled drug
delivery system with associated drugs. Journal of Pharmacy and Pharmaceutical
Sciences 2010;13(4):571-588

159
12. Kaushal AM, Garg S. An update on osmotic drug delivery patents. Pharmaceutical
Technology 2003; 27:38-44.
13. Verma RK, Krishna DM, Garg S. Formulation aspects in the development of
osmotically controlled oral drug delivery systems. Journal of Controlled Release
2002 Feb; 79(1-3):7-27.
14. Santus G, Baker RW. Osmotic drug delivery: a review of the patent literature.
Journal of Controlled Release 1995; 35(1):1-21
15. Jacobus Henricus van’t Hoff. The role of osmotic pressure in the analogy between
solutions and gases. Journal of membrane Science 1995; 100(1):39-44.
16. Gadwal Piyush, Rudrawal Pankaj, Ahamed Dabeer, Ahmed Ayaj. A review on
osmotically regulated devices. International Journal of Pharmacy & Life Sciences
2010; 1(6):302-312.
17. Dandagi PM, Koradia NV, Gadad AP, Mastiholimath VS, Sanghvi MM. Oral
osmotic delivery system: An update. International Journal of Research in
Pharmaceutical Sciences 2011; 2(2):225-236.
18. Ghosh S and B. Barik B. Preparation and evaluation of aceclofenac sustained
release formulation, IJPRIF, 2009, 1(9):34-56
19. Mahalakshmi R, Sastri P, Ravikumar, Kalra A, Kanagale P, Narkhede R.
Enhancement of dissolution of glipizide from controlled porosity osmotic pump
using a wicking agent and a solubilizing agent. International Journal of pharmTech
Research 2009; 1(3):705-711.
20. Martin A, Bustamante P, Chun AHC. Physical chemical principles in the
pharmaceutical sciences in Physical pharmacy. Lea & Febiger 4th Edition
Philadelphia, 1993; p 423-452.
21. Sastry S, Phanidhar K, Brian B. Osmotic controlled drug delivery system: In
Design of controlled release drug delivery systems. McGraw Hill companies, INC,
Newyork 2006; 203-229.

160
22. Ajaybabu CH, Prasadarao M, Vijayaratna J. Controlled porosity osmotic pump
tablets-An overview. Journal of Pharmaceutical Research & Health Care 2010;
2(1):114-126.
23. Shokri J, AhmadiP, Rashidi P, Shahsavari M, RajabiSiahboomi A, Nokhodchi A.
Swellable elementary osmotic pump (SEOP): An effective device for delivery of
poorly water soluble drugs. European Journal of Pharmaceutics and
Biopharmaceutics 2008 Feb; 68(2):289-297.
24. Liu L, Ku J, Khang G, Lee B, Rhee JM. Nifedipine controlled delivery by
sandwiched osmotic tablet system. Journal of Controlled Release 2000
Aug;68(2):145-156.
25. Parmar NS, Vyas SK, Jain NK. Osmotic pump-A novel drug delivery system: In
Advances in controlled and novel drug delivery. CBS publishers, New Delhi
2001:18-39.
26. Khavare NB, Dasankoppa FS, Najundaswamy NG. A Review on key parameters
and components in designing of osmotic controlled oral drug delivery systems,
Indian Journal of Novel Drug Delivery 2010;2(4):122-131.
27. Ozdemir N, Sahin J. Design of a controlled release osmotic pump system of
ibuprofen. International Journal of Pharmaceutics 1997; 1(1):91-97.
28. Malaterre V, Ogorka J, Loggia N, Gurny R. Approach to design push pull osmotic
pumps. International Journal of Pharmaceutics 2009 Jul; 376(1-2):56-62.
29. Malaterre V, Metz H, Ogorka J, Gurny R, Loggia N, Mader K. Benchtop-magnetic
resonance imaging (BT-MRI) characterization of push pull osmotic controlled
release systems. Journal of Controlled release 2009 Jan; 133(1):31-36.
30. Prabakaran D, Singh P, Kanujia P, Vyas SP. Effect of hydrophilic polymers on the
release of diltiazem hydrochloride from elementary osmotic pumps. International
Journal of Pharmaceutics 2003 Jun; 259(1-2):173-179.
31. Wakode R, Bajaj A. Formulation and in vivo evaluation of once a day push pull
osmotic tablet. International Journal of Pharma and Biosciences 2010; 1(4):44-56.

161
32. PrakashRao B, Geetha M, Puroshotham N, Utpal S. Optimization and development
of swellable controlled porosity pump tablet for theophylline. Tropical Journal of
Pharmaceutical Research 2009; 8(3):247-255.
33. Mishra B, Makesh BK, Sankar C. Oral push pull osmotic pumps of pentazocine
hydrochloride: Development and valuation. Indian Journal of Pharmaceutical
Sciences 2006; 68(1):85-87.
34. Edavalath S, Shivanand K, Kalyani P. Prakashrao B, Divakar G. Formulation
development and optimization of controlled porosity osmotic pump tablets of
diclofenac sodium. International Journal of Pharmacy and Pharmaceutical Sciences
2011; 3(1):80-87.
35. Kim KK, Pack DW. Microspheres for Drug Delivery: In Biological and Biomedical
Nanotechnology, Springer, 2006; 1:19-50.
36. Najmuddin M, Patel VA, Ali A, Shelar S, Tousif K. Development and evaluation
of pulsatile drug delivery system of Flurbiprofen. Research Journal of
Pharmaceutical Biological and Chemical Sciences, 2010; 1(2):284-290.
37. Sengel-Turk CT, Hasçicek C, Gonul N. Microsphere-based once-daily modified
release matrix tablets for oral administration in angina pectoris. Journal of
Microencapsulation 2008 Jun; 25(4):257-266.
38. Rangel-Yagui CO, Pessoa A Jr, Tavares Lc. Micellar solubilization of drugs.
Journal of Pharmacy and Pharmaceutical Sciences 2005 Jul; 8(2):147-163.
39. Davis SS, Illum L. Microspheres as drug carrier systems. In Drug carrier system.
Wiley Interscience Publication. 1989; 9:131-154
40. Dubey R, Shami TC, BhaskerRao KU. Microencapsulation technology and
applications. Defence Science Journal 2009; 59(1):82-95.
41. Varde NK, Pack DW. Microspheres for controlled release drug delivery. Expert
opinion on Biological Therapy 2004 Jan; 4(1):35-51.
42. Takada K. Microfabrication-derived DDS: From batch to individual production.
Drug Discoveries and Therapeutics 2008; 2(3):140-155.

162
43. Nair R, Reddy BH, Ashokkumar CK, Kumar KJ. Application of Chitosan
microspheres as a drug carrier: A review. Journal of Pharmaceutical Sciences and
Research 2009; 1(2):1-12.
44. Gupta Mr, Kapoor R, Sudheesh Ms, Patil UK. An applauded novel drug delivery
system for arthritis using NSAIDs by microencapsulation technique-A review. Der
Pharmacia Lettre 2010; 2(4):335-354.
45. Zhang XZ, Wu DQ, Chu CC. Effect of the crosslinking level on the properties of
temperature-sensitive poly(N-isopropylacrylamide hydrogels. Journal of Polymer
Science: Polymer physics, 2003 Feb; 41(6):582-593.
46. Lassalle V, Ferreira ML. PLA Nano- and Microparticles for drug delivery: An
overview of the methods of preparation. Macromolecular Bioscience 2007 Jun;
7(6):767-783.
47. Yang F, Zhou JY, Kordonski V, Jacobs SD. Indentation size effect of thermoset
polymer: Allyl diglycol carbonate (CR-39). Journal of Materials Science Letters
1996; 15(17):1523-1525.
48. Chai XS, Schork FJ, Decinque A, Wilson K. Measurment of the solubilities of
Vinylic monomers in water. Industrial & Engineering Chemistry Research 2005
Jan; 44(14):5256-5258.
49. Buckmann AJP, Nabuurs T, Overbeek GC. Self crosslinking polymeric dispersants
used in emulsion polymerization. Paint & Coating Industry 2002; 18(10):96-112.
50. C.Dekruif. Complex coacervation of proteins and anionic polysaccharides. Current
Opinion in Colloid Interface Science 2004; 9(5):340-349.
51. Rawat M, Saraf S, Saraf S. Influence of selected formulation variables on the
preparation of enzyme-entrapped Eudragit S100 microspheres. AAPS
PharmSciTech, 2007 Dec; 8(4):1-9.
52. Shah VR, Shinde ML, Patil SB, Nikam MB, Ghodke DS, Shah RR. Impact of
selected variables on the preparation of Aceclofenac microspheres by spray drying
using full factorial design, International Journal of PharmTech Research 2011;
3(2):1066-1072.

163
53. Chan LW, Tan LH, Heng PW. Process analytical technology: Application to
particle sizing in spray drying. AAPS PharmSciTech. 2008; 9(1):259-266.
54. Jaspart S, Piel G, Delattre L, Evrard B. Solid lipid microparticles: formulation,
preparation, characterization, drug release and applications. Expert Opinion on
Drug Delivery 2005 Jan; 2(1):75-78.
55. Guangming Li, Cai Q, Bei JZ, Wang S. Relationship between morphology structure
and composition of polycaprolactone/poly(ethylene oxide)/Polylactide copolymeric
microspheres. Polymers for Advanced Technologies 2002 Sep; 13(9):636-643.
56. Lv JN, Fang SJ, Chen L. Preparation and characterization of affinity polymer basic
microspheres by soap-free emulsion polymerization. Chinese Journal of Polymer
Science 2009; 27(1):101-108.
57. ZakiAhmad MD, Kumar V, Kumar A, Akhter S. Drug-excipient(s) interactions and
compatibility study: A Review. Journal of Pharmacy Research 2010; 3(9):2092-
2095.
58. Patel AR, Mahajan AN, Shah DA. Preparation and in vitro characterization of
porous carrier-based floating microspheres of model drug for gastric delivery. Der
Pharmacia Lettre, 2011; 3(3):432-442.
59. Mathew ST, Devi S, Sandhya KV. Formulation and evaluation of Ketorolac
Tromethamine-loaded Albumin microspheres for potential intramuscular
administration. AAPS PharmSciTech. 2007 Feb; 8(1):1-9.
60. Jelvehgari M, Maghsoodi M, Nemati H. Development of theophylline floating
microballoons using cellulose acetate butyrate and/or Eudragit RL 100 polymers
with different permeability characteristics. Journal of Research in Pharmaceutical
Sciences, 2010; 5(1):29-39.
61. NarasimhaRao R, Sampathkumar M, Dileepkumar K, Vineeth P. Formulation and
evaluation of capcitabine microspheres. International Journal of Pharmacy &
Technology 2011; 3(2):2599-2632.
164
62. Zhang XQ, Intra J, Salem AK. Comparative study of poly(lactic-co-glycolic acid)-
polyethyleneimine-plasmid DNA microparticles prepared using double emulsion
methods. Journal of Microencapsulation 2008 Feb; 25(1):1-12.
63. Haznedar S, Dortunc B. Preparation and in vitro evaluation of Eudragit
microspheres containing Acetazolamide. International Journal of Pharmaceutics
2004 Jan;269(1):131-140.
64. Yadav N, Mohite DD, Pawar KR, Pawar UR, Bhise SB, Sande TA. Synthesis and
characterization of sustained release Atenolol microspheres by solvent evaporation
technique. Journal of Pharmaceutical Science and Technology 2011;3(2):559-562.
65. Vachon MG, Nairn JG. The influence of microencapsulation using Eudragit RS100
on the hydrolysis kinetics of acetylsalicylic acid. Journal of Microencapsulation
1997 May-Jun; 14(3):281-301.
66. Lakshmana Prabu S, Shirwaikar AA, Shirwaikar A, Kumar A. Formulation and
evaluation of sustained release microspheres of rosin containing Aceclofenac. ARS
Pharmaceutica, 2009; 50(2):51-62.
67. Gattani YS, Kawtikwar PS, Sakarkar DM. Formulation and evaluation of gastro
retentive multiparticulate drug delivery system of aceclofenac. International Journal
of ChemTech Research 2009; 1(1):1-10.
68. Piao MG, Kim JH, Kim JO, Lyoo WS, Lee MH, Yong CS, Choi HG. Enhanced
oral bioavailability of piroxicam in rats by hyaluronate microspheres. Drug
Development and Industrial Pharmacy 2007 Apr;33(4):485-491.
69. Turk CT, Hascicek C, Gonul N. Evaluation of drug polymer interaction in
polymeric microspheres containing diltiazem hydrochloride. Journal of Thermal
Analysis and Calorimetry 2009; 95(3):865-869.
70. Jani GK, Gohel MC. Effects of selected formulation parameters on the
entrapment of Diclofenac sodium in ethyl cellulose microspheres. Journal of
Controlled Release 1997 Jan; 43(2-3):245-250.

165
71. Orlu M, Cevher E, Araman A. Design and evaluation of colon specific drug
delivery system containing flurbiprofen microsponges. International Journal of
Pharmaceutics, 2006 Aug; 328(1-2):103-117.
72. Najmuddin M, Patel V, Ahmed A, Shelar S, Khan T. Preparation and evaluation of
flurbiprofen microcapsule for colonic drug delivery system. International Journal of
Pharmacy and Pharmaceutical Sciences 2010; 2(2):83-87.
73. T.Sudhamani, Noveenkumar reddy K, Ravikumar VR, Revathi R, Ganesan V.
Preparation and evaluation of Ethyl cellulose microspheres of Ibuprofen for
sustained drug delivery. International Journal of Pharma Research and
Development 2010; 2(8):119-125
74. Roy S, Pal M, Gupta BK. Indomethacin-loaded microspheres: Design and
preparation by a multiple-emulsification technique and their in vitro evaluation,
Pharmaceutical Research 1992; 9(9):1132-1136.
75. Barhate SD, Rupnar YS, Sonvane RM, Pawar KR, Rahane RD. Formulation and
evaluation of floating microspheres of ketorolac trometamol. International Journal
of Pharmaceutical Research and Development 2009 Nov;1(9):1-8
76. Patel A, Ray S, Thakur RS. In vitro evaluation and optimization of controlled
release floating drug delivery system of metformin hydrochloride. DARU. 2006;
14(2):57-64
77. Rahul Nair, Ashokkumar CK, Vishnupriya K. Formulation and in vitro-in vivo
evaluation of sustained release chitosan microspheres containing mefanamic acid.
Journal of Pharmaceutical Science and Technology 2011; 3(3):563-569.
78. Dinarvan R, Zainali B, Attyabi F. Effects of formulation variables on nifedipine
microspheres prepared by solvent evaporation technique. DARU. 2001;9(1-2):33-
40
79. Huang J, Wigent RJ, Bentzley CM, Schwartz JB. Nifedipine solid dispersion in
microparticles of ammonio methacrylate copolymer and ethylcellulose binary blend
for controlled drug delivery: Effect of drug loading on release kinetics.
International Journal of Pharmaceutics, 2006 Aug; 319(1-2):44-54.
166
80. Zhang L, Gu FX, Chan JM, Wang AZ, Langer RS, Farokh OC. Nanoparticles in
Medicine: Therapeutic applications and developments. Clinical Pharmacology &
Therapeutics 2008; 83:761-769.
81. Garcia-Fuentes M, Torres D, Alonso MJ. Design of lipid nanoparticles for the oral
delivery of hydrophilic macromolecules, Colloids and Surfaces B: Biointerfaces,
2002, 27: 159-168
82. ScholerN, Krause K, Kayser O, Muller RH, Borner K, Hahn H, Liensenfeld O.
Atovaquone nanosuspensions show excellent therapeutic effect in a new murine
model of reactivated toxoplasmosis. Antimicrobial agents and chemotherapy 2001;
45(6):1771-1779.
83. Ravichandiran R. Nanotechnology-based drug delivery systems.
Nanobiotechnology 2009;5(1-4):17-33.
84. Delmas T, Piraux H, Couffin AC, Texier I, Vinet F, Poulin P, Cates ME, Bibete J.
How to prepare and stabilize very small nanoemulsions. Langmuir 2011;
27(5):1683-1692.
85. Koteeshwara KB, Reddy MS, Anup N, Madhavan N. Nanosuspensions: A novel
drug delivery approach. International Journal of Research in Ayurveda & Pharmacy
2011; 2(1):162-165.
86. Patravale VB, Date AA, Kulkarni RM. Nanosuspensions: a promising drug
delivery strategy. Journal of Pharmacy and Pharmacology 2004; 56(7):827-840.
87. Teeranachaideekul V, Junyaprasert VB, Souto EB, Muller RH. Development of
ascorbyl palmitate nanocrystals applying the nanosuspension technology.
International Journal of Pharmaceutics 2008; 354(1-2):227-234.
88. Shah T, Patel D, Hirani J, Amin AF. Nanosuspensions as a Drug delivery system:
A comprehensive review. Drug Delivery Technology 2007; 7(9):42-53.
89. Keck CM, Muller RH. Drug nanocrystals of poorly soluble drugs produced by high
pressure homogenization. European Journal of Pharmaceutics and
Biopharmaceutics 2006; 62(1):3-16.

167
90. Gupta S, Samanta MK, Raichur AM. Dual-drug delivery system based on In Situ
gel-forming nanosuspension of Forskolin to enhance antiglaucoma efficacy. AAPS
PharmSciTech. 2010; 11(1):322-335.
91. Venkatesh T, Avinashkumar Reddy, Deena dalith M, Ashokkumar CK.
Nanosuspensions: Ideal approach for the drug delivery of poorly water soluble
drugs. Der Pharmacia Lettre 2011; 3(2):203-213
92. Keck CM, Kobierski S, Mauludin R, Muller RH. Second generation of drug
nanocrystals for delivery of poorly soluble drugs: smart crystals technology.
DOSIS. 2008;24(2):124-128.
93. Wongmekiat A, Tozuka Y, Oguchi T, Yamamoto K. Formation of fine drug
particles by cogrinding with cyclodextrins. I. The use of beta-cyclodextrin
anhydrate and hydrate. Pharmaceutical Research 2002;19(2):1867-1872
94. Itoh K, Pongpeerpat A, Tozuka Y, Oguchi T, Yamamoto K. Nanoparticle
formation of poorly water soluble drugs from ternary ground mixtures with PVP
and SDS. Chemical and Pharmaceutical Bulletin 2003; 51(2):171-174.
95. Jens-Uwe AH Junghanns, Muller RH. Nanocrystal technology, drug delivery and
clinical applications. International journal of Nanomedicine 2008;3(3):295-310.
96. Katteboinaa S, Chandrasekhar P, Balaji S. Drug nanocrystals: A novel formulation
approach for poorly soluble drugs. International Journal of PharmTech Research
2009; 1(3):682-694.
97. Zili Z, Sfar S, Fessi H. Preparation and characterization of poly-ε-caprolactone
nanoparticles containing griseofulvin. International Journal of Pharmaceutics 2005;
294(1-2):261-267.
98. Young TJ, Mawson S, Johnsoton KP, Henriska IB. Rapid expansion from
supercritical to aqueous solution to produce submicron suspension of water
insoluble drugs. Biotechnology Progress 2000; 16(3):402-407.
99. Manoharan C, Basarkar A, Singh J. Various Pharmaceutical Disperse Systems: In .
Pharmaceutical suspensions: From formulation development to Manufacturing,

168
Kulshreshtha AK, Singh ON, Michael Wall G AAPS Press, Springer, New york ,
2010; 1-38.
100. Gupta S, Brouwer P, Bandyopadhyay S, Patil S, Briggs R, Jain J, Seal S.
TEM/AFM investigation of size and surface properties of nanocrystalline ceria.
Journal of Nanoscience and Nanotechnology 2005; 5(7):1101-1107.
101. Jacobs C, Muller RH. Production and characterization of a budesonide
nanosuspension for pulmonary administration. Pharmaceutical Research 2002;
19(2):189-194.
102. Kesisoglou F, Panmai S, Wu Y. Nanosizing-Oral formulation development and
biopharmaceutical evaluation. Advanced Drug Delivery Reviews 2007 Jul;
59(7):631-644.
103. Gulsun T, Gursoy R, Oner L. Nanocrystal technology for oral delivery of poorly
soluble drugs. FABAD Journal of Pharmaceutical Sciences 2009; 34(1):55-65
104. Shakeel F, Ramadan W, Shafiq S. Solubility and dissolution improvement of
aceclofenac using different nanocarriers. Journal of Bioequivalence &
Bioavailability 2009; 1(2):39-43.
105. Li W, Yang Y, Tian Y, Xu X, Chen Y, Mu L, Zhang Y, Fang L. Preparation and
in vitro/in vivo evaluation of revaprazan hydrochloride nanosuspension,
International journal of Pharmaceutics, 2011 Apr; 408(1-2):157-162.
106. Singh SK, Srinivasan KK, Gowthamarajan K, Singare DS, et al. Investigation of
preparation parameters of nanosuspension by top-down media milling to improve
the dissolution of poorly water soluble glyburide, European Journal of
Pharmaceutics and Biopharmaceutics 2011 Aug; 78(3):441-446
107. Hanafy A, Spahn-Langguth, H, Vergnault G, Grenier M, Grozdanis T, Lenhardt T,
Langguth P. Pharmacokinetic evaluation of oral fenofibrate nanosuspensions and
SLN in comparison to conventional suspensions of micronized drug, Advanced
Drug Delivery Reviews 2007 Jul; 59(6):419-426

169
108. Nakarani M, Misra AK, Patel JK, Vaghani SS. Itraconazole nanosuspension for
oral delivery: Formulation, characterization and in vitro comparison with marketed
formulation, DARU. 2010;18(2):84-90.
109. Arunkumar N, Deecraman M, Rani C, Mohanraj KP, Venkateskumar K.
Preparation and solid state characterization of atorvastatin nanosuspensions for
enhanced solubility and dissolution. International journal of pharmTech Research
2009; 1(4): 1725-1730.
110. Niwa T, Miura S, Danjo K. Universal wet milling technique to prepare oral
nanosuspension focused on discovery and preclinical animal studies-Development
of particle design method, International Journal of Pharmaceutics 2011;405(1-
2):218-227.
111. Dolenc A, Kristl J, Baumgartner S, Planinsek O. Advantages of celecoxib
nanosuspension: formulation and transformation into tablets, International Journal
of Pharmaceutics 2009;376(1-2):204-212.
112. Muller RH, Jacobs C. Buparvaquone mucoadhesive nanosuspension: preparation,
optimization and long-term stability, International Journal of Pharmaceutics 2002;
237(1-2):151-161.
113. Cerdeira AM, Mazzotti M, Gander B. Miconazole nanosuspensions: Influence of
formulation variables on particle size reduction and physical stability.
International Journal of Pharmaceutics 2010; 396(1-2):210-218.
114. Lai F, Pini E, Angioni G, Manca ML, Perricci J, Sinico C, Fadda AM.
Nanocrystals as tool to improve piroxicam dissolution rate in novel orally
disintegrating tablets. European Journal of Pharmaceutics and Biopharmaceutics
2011; 79(3):552-558.
115. Maluludin R, Muller RH, Keck CM. Development of an oral rutin nanocrystal
formulation. International Journal of Pharmaceutics 2009;370(1-2):202-209.
116. Trotta M, Gallarate M, Carlotti ME, Morel S. Preparation of griseofulvin
nanoparticles from water dilutable microemulsions. International Journal of
Pharmaceutics 2003; 254(2): 235-242.

170
117. Kayser O, Olbrich C, Yardley V, Kiderlen AF, Croft SL. Formulation of
amphotericin B as nanosuspension for oral administration. International Journal of
Pharmaceutics 2003; 254(1): 73-75.
118. Guyton AC, Hall JE. Resistance of the body to infection: Leukocytes,
Granulocytes, the monocyte-macrophage system and inflammation. In, Textbook
of Medical Physiology. 10th edition. Gopsons papers Ltd., Noida 2001; 397-399.
119. Ryan GB, Majno G. Acute inflammation A review. Am J Pathol.1977; 86(1):183-
276.
120. Dinarello CA. Role of interleukins-1 and tumor necrosis factor in systemic
responses to infection and inflammation. In, Inflammation: Basic Principles and
Clinical Correlates. Gallin, J.I., Goldstein, I.M., and Snyderman, R. 2nd ed.
Raven Press, NewYork, 1992:211-232.
121. Cotran RS, Kumar V, Robbins SL, Schoen FJ. Inflammation and repair: Robbins.
Pathologic Basis of Disease. Philadelphia: W.B Saunders Company. 1994; 51-93
122. Rang HP and Dale MM. Local Hormones, Inflammation and Allergy. In,
Pharmacology. 2nd ed. Churchill Livingstone, ELBS, 1999:243-279.
123. Davie EW, Fujikawa K and Kisiel W. The coagulation cascade: initiation,
maintenance, and regulation. Biochemistry 1991; 30:10363-70.
124. Rang HP. Dale MM. Ritter JM and Moore PK. Local hormone, Inflammation and
Immune reactions. In: Pharmacology. 5th ed. International Print-O-Pac Ltd.,
Noida, 2005: 232.
125. Bhoola KD. Figueroa CD and Worthy K. Bioregulation of kinins: kallikreins,
kininogens, and kininases. Pharmacol. Rev. 1992; 44:1-80.
126. Schmaier AH, Rojkjaer R, Shariat-Madar Z. Activation of the plasma
kallikrein/kinin system on cells: a revised hypothesis. Thromb. Haemost.1999;
82:226-233.
127. Moncada S, Vane JR. Pharmacology and endogenous roles of prostaglandin
endoperoxides, thromboxane A2, and prostacyclin. Pharmacol. Rev. 1978; 30:293-
331.

171
128. Braquet P, Touqui L, Shen TY, Vargaftig BB. Perspectives in platelet activating
factor research. Pharmacol Rev. 1987; 39:97-145.
129. Gaboury JP, Johnston B, Niu XF and Kubes P. Mechanisms underlying acute mast
cell-induced leukocyte rolling and adhesion in vivo. J. Immunol. 1995; 154:804-
813.
130. Robert LJ and Morrow JD. Analgesic-Antipyretic and Anti-inflammatory Agents
and Drugs Employed in the treatment of GOUT. In, Goodman and Gilman’s, The
Pharmacological Basis of Therapeutics, 10th ed., 2001:867-731.
131. Ishii S, Nagase T, Tashiro F, Ikuta K, Sato S, Waga I, Kume K, Miyazaki J and
Shimizu T. Bronchial hyperactivity, increased endotoxin lethality, and
melanocytic tumorigenesis in transgenic mice overexpressing platelet-activating
factor receptor. EMBO J. 1997; 16: 131-42.
132. Moncada S, Palmer RM and Higgs EA. Nitric oxide: physiology, pathophysiology
and pharmacology. Pharmacol. Rev. 1991; 43:109-42.
133. Ignarro LJ, Cirino G, Casini A and Napoli C. Nitric oxide as a signaling molecule
in the vascular system: an overview. J. Cardiovasc. Pharmacol. 1999; 34:879-86.
134. Bodmeier R, Chen H. Preparation and characterization of microspheres containing
the anti-inflammatory agents, indomethacin, ibuprofen and ketoprofen. Journal of
Controlled Release 1989; 10(2):167-175.
135. Malamataris S and Avgerinos A. Controlled release indomethacin microspheres
prepared by using an emulsion solvent-diffusion technique. International Journal
of Pharmaceutics 1990; 62(2-3):105-111.
136. Kim CK, Kim MiJ, Oh KH. Preparation and evaluation of sustained release
microspheres of terbutaline sulfate. International Journal of Pharmaceutics 1994;
106(3):213-219.
137. Okada H, Yamamoto M, Heya T, Inoue Y, Kamei S, Ogawa Y, Toguchi H. Drug
delivery using biodegradable microspheres. Journal of Controlled Release 1994;
28(1-3):121- 129.

172
138. Cuzzolin L, Conforti A, Donini M, Adami A, Del Soldata P, Benoni G. Effects on
intestinal microflora, gastrointestinal tolerability and anti-inflammatory efficacy of
diclofenac and nitrofenac in adjuvant arthritic rats. Pharmacological Research
1994; 29(1): 89-97.
139. Sriwonanya M, Bodmeier R. Entrapment of drug-loaded ion-exchange particles
within polymeric microparticles. International Journal of Pharmaceutics 1997;
158(1):29-38.
140. Ganza-Gonzaalez A, Anguiano-Igea S, Otero-Espinar FJ, Blanco Mendez J.
Chitosan and chondroitin microspheres for oral-administration controlled release
of metoclopramide. European Journal of Pharmaceutics and Biopharmaceutics
1999; 48(2): 149 -155.
141. Liu L, Khanga G, Rhee JM, Lee HG. Monolithic osmotic tablet system for
nifedipine delivery. Journal of Controlled Release 2000; 67(2-3):309–322.
142. Tuncay M, Calis S, Kas HS, Ercan MT, Peksoy I, Hincal AA. Diclofenac sodium
incorporated PLGA (50:50) microspheres: formulation considerations and in
vitro/in vivo evaluation. International Journal of Pharmaceutics 2000; 195(1-2):
179-188.
143. Adibkia K, Siahi Shadbad MR, Nokhodchi A, Javadzedeh A. Piroxicam
nanoparticles for ocular delivery: physicochemical characterization and
implementation in endotoxin-induced uveitis. J Drug Target. 2007; 15(6):407-416
144. Hickey T, Kreutzer D, Burgess DJ, Moussy F. Dexamethasone/PLGA
microspheres for continuous delivery of an anti-inflammatory drug for implantable
medical devices. Biomaterials 2002; 23(7):1649-1656.
145. Esposito E, Cervellati F, Menegatti E, Nastruzzi C, Cortesi R. Spray dried
Eudragit microparticles as encapsulation devices for vitamin C. International
Journal of Pharmaceutics. 2002; 242(1-2):329-334.
146. Bravo SA, Lamas MC, Salomon CJ. In vitro studies of diclofenac sodium
controlled release from biopolymeric hydrophilic matrices. J Pharm Pharm Sci.
2002; 5(3):213-219.

173
147. Lamprecht A, Yamamoto H, Takeuchi H, Kawashima Y. Microsphere design for
the colonic delivery of 5-fluorouracil. Journal of Controlled Release 2003;
90(3):313–322.
148. Parikh RH, Parikh JR, Dubey RR, Soni HN, Kapadia KN. Poly (D,L-Lactide-co-
glycolide) microspheres containing 5-flurouracil: optimization of process
parameters. AAPS PharmSciTech. 2003; 4(2):14-21.
149. Lu EX, Jiang ZQ, Zhang QZ, Jiang XG. A water-insoluble drug monolithic
osmotic tablet system utilizing gum arabic as an osmotic, suspending and
expanding agent. Journal of Controlled Release 2003; 92:375– 382.
150. Lamprecht A, Yamamoto H, Takeuchi H, Kawashima Y. pH-sensitive
microsphere delivery increases oral bioavailability of calcitonin. Journal of
Controlled Release 2004; 98(1):1– 9.
151. Wang Y, Dave RN, Pfeffer R. Polymer coating/encapsulation of nanoparticles
using a supercritical anti-solvent process. Journal of Supercritical Fluids 2004;
28(1):85–99.
152. Okimoto K, Tokunaga Y, Ibuki R, Irieb R, Uekama K, Rajewski RA, Stella VJ.
Applicability of (SBE)7m-CD in controlled-porosity osmotic pump tablets
(OPTs). International Journal of Pharmaceutics 2004; 286(1-2):81–88.
153. Patel JK, Patel RP, Amin AF, Patel MM. Formulation and evaluation of
mucoadhesive glipizide microspheres. AAPS PharmSciTech. 2005; 6(1):49-55.
154. Hori M, Onishi H, Machida Y. Evaluation of eudragit-coated chitosan
microparticles as an oral immune delivery system. International Journal of
Pharmaceutics 2005; 297(1-2):223–234
155. Duarte AR, Costa MS, Simplicio AL, Cardoso MM, Duarte CM. Preparation of
controlled release microspheres using supercritical fluid technology for delivery of
anti-inflammatory drugs. International Journal of Pharmaceutics 2006; 308(1-
2):68–174.

174
156. Kocbek P, Baumgartner S, Kristl J. Preparation and evaluation of nanosuspensions
for enhancing the dissolution of poorly soluble drugs. International Journal of
Pharmaceutics 2006; 312(1-2):179-186.
157. Dashora K. Saraf S, Saraf S. Effect of processing variables on micro particulate
system of aceclofenac. Pak J Pharm Sci., 2006; 19(1):6-10.
158. Liu L, Che B. Preparation of monolithic osmotic pump system by coating the
indented core tablet. European Journal of Pharmaceutics and Biopharmaceutics
2006; 64(2):180–184.
159. Rameshbabu V, Sairam M, Kallappa H, Tejraj A. Preparation of sodium alginate–
methylcellulose blend microspheres for controlled release of nifedipine.
Carbohydrate Polymers 2007; 69(2): 241–250.
160. Ruckmani K, Sivakumar M, Satheeshkumar S. Nanoparticular drug delivery
system of cytarabine hydrochloride (CTH) for improved treatment of lymphoma.
Journal of Biomedical Nanotechnology 2007; 3(1):90–96.
161. Shakeel F, Baboota S, Ahuja A, Ali J, Agil M, Shafiq S. Nanoemulsions as
vehicles for transdermal delivery of aceclofenac. AAPS PharmSciTech. 2007;
8(4):1-9.
162. Rastogi A, Sultana Y, Aqil M, Ali A, Kumar S, Chuttani C, Mishra AK. Alginate
microspheres of isoniazid for oral sustained drug delivery. International Journal of
Pharmaceutics 2007; 334(1-2):71–77
163. Devarajan PV, Sonavane GS. Preparation and in vitro/in vivo evaluation of
gliclazide loaded eudragit nanoparticles as sustained release carriers. Drug
Development and Industrial Pharmacy 2007; 33(2):101–111.
164. Yesmin F, Mesbah Uddin Talukder MD, Islam MS, Laila S, Haque T. Evaluation
of aceclofenac loaded agarose beads prepared by ionotropic gelation method.
Stamford Journal of Pharmaceutical Sciences 2008; 1(1&2):10-17.
165. Gonzalez M, Rieumont J, Dupeyron D, Perdomo I, et al. Nanoencapsulation of
acetyl salicylic acid within enteric polymer nanoparticles. Rev.Adv.Mater.Sci.
2008; 17:71-75.
175
166. Mutalik S, Manoj K, Reddy MS, Kushtagi P, Usha AN, Anju P, Ranjith AK,
Udupa N. Chitosan and enteric polymer based once daily sustained release tablets
of aceclofenac: in vitro and in vivo studies. AAPS PharmSciTech. 2008; 9(2):651-
659.
167. Liu L, Xu X. Preparation of bilayer-core osmotic pump tablet by coating the
indented core tablet. International Journal of Pharmaceutics 2008; 352(1-2):225-
230.
168. Radhika PR, Lugman M, Borkhataria CH, Preparation and evaluation of delayed
release aceclofenac microspheres. Asian Journal of Pharmaceutics 2008; 2(4):252-
254.
169. Chirag N, Narendra C, Sandip P, Upendra P, Keyur A, Dhruti N. Design and
characterization of bioadhesive microspheres prepared by double emulsion solvent
evaporation method. Acta Pharmaceutica Sciencia 2009; 51(3):261-270.
170. Attama AA, Reichi S, Muller-Goymann CC. Diclofenac sodium delivery to the
eye; in vitro evaluation of novel solid nanoparticle formulaltion using human
cornea construct. International Journal of Pharmaceutics 2008; 355(1-2):307-313.
171. Trivedi P, Verma AML, Garud N. Preparation and characterization of aceclofenac
microspheres. Asian J Pharm. 2008; 2(2):110-115.
172. Tamizhrasi S, Shukla T, Shivkumar A, Rathi V, Rathi JC. Formulation and
evaluation of lamivudine loaded polymethacrylic acid. International Journal of
PharmTech Research 2009; 1(3):411-415.
173. Ho LTM, Chi NT, Nhan LNT, Chien DM. Preparation of drug nanoparticles by
emulsion evaporation method, APCTP–ASEAN Workshop on Advanced
Materials Science and Nanotechnology (AMSN08) IOP. Publishing Journal of
Physics: Conference Series. 2009; 187: 012047.
174. Manjanna KM, Shivakumar B, Pramodkumar TM. Formulation of oral sustained
release aceclofenac sodium microbeads. International Journal of PharmTech
Research 2009; 1(3):940-952.

176
175. Yadav AV, Shete AS, Dabke AP, Shinde VR. Formulation and in-vitro evaluation
of aceclofenac microcapsules. International Journal of pharmTech Research 2009;
1(2):135-138.
176. Selvakumar K, Yadav AV. Formulation and evaluation of carvedilol loaded
eudragit E100 nanoparticles. International Journal of pharmTech Research 2009;
1(2):179-183.
177. Patel DJ, Pandya VM, Patel JK. Influence of formulation parameters on
famotidine nanosuspension produced by nanoprecipitation technique. International
Journal of Pharmaceutical Research 2009; 1(4):21-27.
178. Shakeel F, Faisal MS, Shafiq S. Comparative pharmacokinetic profile of
aceclofenac from oral and transdermal application. Journal of Bioequivalence &
Bioavailability 2009; 1(1):13-17.
179. Jawahar N, Venkatesh DN, Sureshkumar R, Senthil V et al. Development and
characterization of PLGA-nanoparticles containing carvedilol. J.Pharm. Sci. &
Res. 2009; 1(3):123-128.
180. Agnihotri SM, Vavia PR. Diclofenac-loaded biopolymeric nanosuspensions for
ophthalmic application. Nanomedicine: Nanotechnology, Biology, and Medicine.
2009; 5(1):90–95.
181. Khushwant S, Yadav L, Krutika S. Modified nanoprecipitation method for
preparation of cytarabine-loaded PLGA nanoparticles. AAPS PharmSciTech.
2010; 11(3): 1456-1465.
182. Raghavendra Rao NG, Kulkarni U, Deshmukh A, Suresh DK. Preparation and
characterization of ionotropic cross-linked chitosan microparticles for controlled
release of aceclofenac. International Journal of Pharmaceutical Sciences and Drug
Research 2010; 2(2):107-111.
183. Xia D, Quan P, Piao H, Sun S, Yin Y, Cui F. Preparation of stable nitrendipine
nanosuspensions using the precipitation–ultrasonication method for enhancement
of dissolution and oral bioavailability. European Journal of Pharmaceutical
Sciences 2010; 40(4):325–334.

177
184. Mothilal M, Damodharan N, Lakshmi KS, Barathraj SV, Srikrishna T.
Formulation and in vivo evaluation of osmotic drug delivery system of metoprolol
succinate. International Journal of Pharmacy and Pharmaceutical Sciences. 2010;
2(2):64-68.
185. Verma A, Tripathi A, Saraf SA, Saraf S. Fabrication and Evaluation of Sustained
Release Microspheres of Ketorolac Tromethamine. International Journal of
Pharmacy and Pharmaceutical Sciences. 2010; 2(4):44-48.
186. Kumar KK, Raveendranath VT, Jakeer MD. Preparation and evaluation of
controlled release microcapsules of aceclofenac. Journal of Pharmacy Research.
2010; 3(8):1936-1938.
187. Sheaikh S, Mohale D, Chandewar A. Evaluation of Effect of food and other
gastrointestinal factors on osmotic tablet of aceclofenac. Journal of Pharmacy
Research. 2010; 3(11):2752-2755.
188. Cetin M, Atila A, Kadioglu Y. Formulation and In vitro Characterization of
eudragit L100 and eudragitL100-PLGA nanoparticles containing diclofenac
sodium. AAPS PharmSciTech. 2010; 11(3):1250-1256.
189. Deveswaran R, Manavalan R, Madhavan R. Formulation and evaluation of
albumin microspheres containing aceclofenac. International Journal of
Pharmaceutical Sciences Review and Research 2010; 4(1):112-117.
190. Chakraborty S, Dinda SC, Patra ChN, Khandai M. Fabrication and
characterization of algino-carbopol microparticulate system of aceclofenac for oral
sustained drug delivery. International Journal of Pharmaceutical Sciences Review
and Research 2010; 4(2): 192-199.
191. Manjanna KM, Pramodkumar TM, Shivakumar B. Calcium alginate cross-linked
polymeric microbeads for oral sustained drug delivery in arthritis. Drug
Discoveries & Therapeutics 2010; 4(2):109-122.
192. Patel HR, Patel MM. Development of osmotically controlled mucoadhesive cup-
core (OCMC) tablet for the anti-inflammatory activity. Iranian Journal of
Pharmaceutical Research 2010; 9(1):21-26.

178
193. Chakraborty S, Khandai M, Sharma A, Patra ChN et al. Preparation, in vitro and
in vivo evaluation of algino-pectinate bioadhesive microspheres: An investigation
of the effects of polymers using multiple comparison analysis. Acta Pharm. 2010;
60(3):255–266.
194. Khandai M, Chakraborty S, Sharma A, Patnaik S. Preparation and evaluation of
algino-sericin mucoadhesive microspheres: An approach for sustained drug
delivery. Journal of Advanced Pharmaceutical Research 2010; 1(1):48-60.
195. Ahad HA, Kumar CS, Raghu CPV Bhanu UT, Raju A, Abhilash C, Mohan VG.
Formulation and evaluation of once-daily sustained release aceclofenac Prosopis
cumanensis gum matrix tablets. JITPS. 2010; 1(1):53–63.
196. Chella N, Yadav KK, Vempatti R. Preparation and evaluation of ethyl cellulose
microspheres containing diclofenac sodium by novel w/o/o emulsion method.
J.Pharm. Sci. & Res. 2010; 2(12):884-888.
197. Kakran M, Sahoo NG, Li L, Judeh Z, Wang Y, Chong K and Loh L.
Fabrication of drug nanoparticles by evaporative precipitation of nanosuspensions.
International Journal of Pharmaceutics. 2010; 383(1-2):285–292.
198. Kietzmann D, Moulari B, Beduneau A, Pellequer Y, Lamprecht A. Colonic
delivery of carboxyfluorescein by pH-sensitive microspheres in experimental
colitis. European Journal of Pharmaceutics and Biopharmaceutics 2010;
76(2):290–295.
199. Arias JL, Lopez-viota M, Saez-Fernandez E, Ruiz MA. Formulation and
physicochemical characterization of poly(e-caprolactone) nanoparticles loaded
with ftorafur and diclofenac sodium. Colloids and Surfaces B: Biointerfaces. 2010;
75(1):204–208.
200. Pandey S. Itraconazole Nanosuspension Meant for Oral Use: Development of
formulation, characterization and in vitro comparison with some marketed
formulations. Scholar Research Library 2010; 2(1):162-171.

179
201. Gowda DV, Rajesh N, Somashekhara CN and Siddaramaiah. Development and
evaluation of aceclofenac loaded transdermal film. International Journal of
PharmTech Research 2010; 2(4):2224-2233.
202. Gaikwad A, Tamizhrasi S, Sorti A, Gavali P, Mehare G. Formulation and in-vitro
characterization of polymethacrylic acid nanoparticle containing frusemide.
International Journal of PharmTech Research 2010; 2(1):300-304.
203. Guerrero S, Teijon C, Muniz E, Teijon JM, Blanco MD. Characterization and in
vivo evaluation of ketotifen-loaded chitosan microspheres. Carbohydrate Polymers
2010; 79(4):1006–1013.
204. Yadav IK, Singh HP, Singh RP, Tiwari PK, Chandra D, Jaiswal D. Jain DA.
Formulation, evaluation and optimization of aceclofenac sustained release matrix.
International Journal of PharmTech Research 2010; 2(1):592-598.
205. Ahad HA, Kumar CS, Yesupadam P, Harika B, Deepika D, Lakshmi LV, Sekhar
CA. Formulation and evaluation of once daily sustained release aceclofenac
Prosophis juliflora gum matrix tablets. International Journal of Pharmaceutical
Sciences Review and Research 2010; 1(2):23-28.
206. Xu WJ, Li N, Gao CK. Preparation of controlled porosity osmotic pump tablets for
salvianolic acid and optimization of the formulation using an artificial neural
network method. Acta Pharmaceutica Sinica B 2011; 1(1):64–70.
207. Reza KhH, Vikram SN, Kumaravelrajan R. Formulation and optimization of
aceclofenac monolithic osmotic pump. International Journal of Pharmaceutical
Sciences Review and Research 2011; 6(2):42-47.
208. Gao L, Liu G, Wang X, Liu F, Xu Y, Ma J. Preparation of a chemically stable
quercetin formulation using nanosuspension technology. International Journal of
Pharmaceutics 2011; 404(1-2):231–237.
209. Zhang ZH, Dong HY, Png B, Liu HF,Li CL, Liang M, Pan WS. Design of an
expert system for the development and formulation of push–pull osmotic pump
tablets containing poorly water-soluble drugs. International Journal of
Pharmaceutics. 2011; 410(1-2):41–47.

180
210. Indian pharmacopoeia, Indian Pharmacopoeia commission, Govt of India, Ministry
of Health and Family welfare, 2007: 63-66.
211. Maneiro E, Lopez-Armada MJ, Fernandez sueiro JL, Galdo F, Blanco FJ.
Aceclofenac increases the synthesis of interleukin 1 receptor antagonist and
decreases the production of nitric oxide in human articular chondrocytes. The
Journal of Rheumatology 2001; 28(12):2692-2699.
212. Pareek A, Chandanwale AS, Oak J, Jain UK, Kapoor S. Efficacy and safety of
aceclofenac in the treatment of osteoarthritis: a randomized double-blind
comparative clinical trial versus diclofenac – an Indian experience. Current
Medical Research and Opinion 2006;22(5):977-988.
213. Wankhade VP, Sridhar E, Ingole SD, Sheaikh, Kawirkwar PS. To evaluate the
effect of food and other GI factors on osmotic tablet of Aceclofenac, Research
Journal of Pharmacy and Technology, 2010, 3(4): 1053-1057.
214. Aceclofenac Detailed info. [Internet] 2011 Available from
http://www.mims.com/USA/drug/info/aceclofenac/aceclofenactype=full&mtype=
generic.
215. S.S. Patil and P.V.Kasture. Studies on preparation and evaluation of Biodegradable
Poly(lactide-co-glycolide) microsphere of Aceclofenac, CMU.J.Nat.Sci, 2007,
6(2): 195-205.
216. Gupta V, Shukla SK, Shrivastava SM, Shukla S et al. Studies of in vitro evaluation
and formulation of Aceclofenac loaded PLGA microspheres, International Journal
of Pharmacology, 2010, 6(5): 726-731
217. Aceclofenac.[Internet]Availablehttp://www.medindia.net/doctors/drug_information
/aceclofenac.htm.
218. Li Y, Hou S, Bi Y, Zheng Y et al. Novel two step release system for the traditional
chinese medicine compound danshen. Yakugaku Zasshi. 2007; 127(9):1473-1484.
219. Rowe RC, Sheskey PJ, Owen SC. Handbook of pharmaceutical excipients. 5th
edition. London, Pharmaceutical Press, UK and Washington, American
Pharmacists Association, USA. 2006.

181
220. Heng PW, Hao J, Chan Lw, Chew SH. Influences of osmotic agents in diffusion
layer on drug release from multilayer coated pellets. Drug Dev Ind Pharm. 2004;
30(2):21-220.
221. Thakor RS, Majmudar FD, Patel JK, Rajuput GC, Patel MP. Development and
evaluation of osmotic drug delivery system for calcium channel blocker drug. Der
Pharmacia Lettre 2010; 2(3):43-51.
222. Al-Tabakha MM. HPMC capsules: current status and future prospects. Journal of
Pharmacy and Pharmaceutical Sciences 2010; 13(3):428-442.
223. Colbert JC, Xiheng H, Kirklin DR. Enthalpy of combustion of Microcrystalline
Cellulose. Journal of Research of the NBS. 1981; 86(6):1-6.
224. Williams III RO, McGinity JW. Compaction properties of microcrystalline
cellulose and sodium sulfathiazole in combination with talc or magnesium stearate.
J Pharm Sci. 1989; 78(12):1025-1034.
225. Yuan J, Shang PP, Wu.SH. Effects of polyethylene glycol on morphology,
thermomechanical properties and water vapor permeability of cellulose acetate-free
films.Pharmaceutical Technology Oct 2001; 62-73.
226. Eudragit L100. [Internet].http://eudragit.evonik.com/product/eudragit/en/products-
services/eudragit-products/enteric-formulations/l-100/pages/default.aspx.
227. Muthu Ms. Nanoparticles based on PLGA and its co-polymer: An overview. Asian
Journal of Pharmaceutics. 2009; 3(4):266-273.
228. Mittal G, Sahana DK, Bhardwaj V, Kumar MNVR. Estradiol loaded PLGA
nanoparticles for oral administration: Effect of polymer molecular weight and
copolymer composition on release behavior in vitro and in vivo, Journal of
Controlled Release, 2007, 119(1): 77-85.
229. Dai J, Nagai T, Wang X, Zhang T et al. pH-sensitive nanoparticles for improving
the bioavailability of cyclosporine A. International Journal of Pharmaceutics. 2004;
280(1-2):229-240.
230. Park TG. Degradation of poly(lactic-co-glycolic acid) microspheres: effect of
copolymer composition. Biomaterials 1995; 16(15):1123-1130.
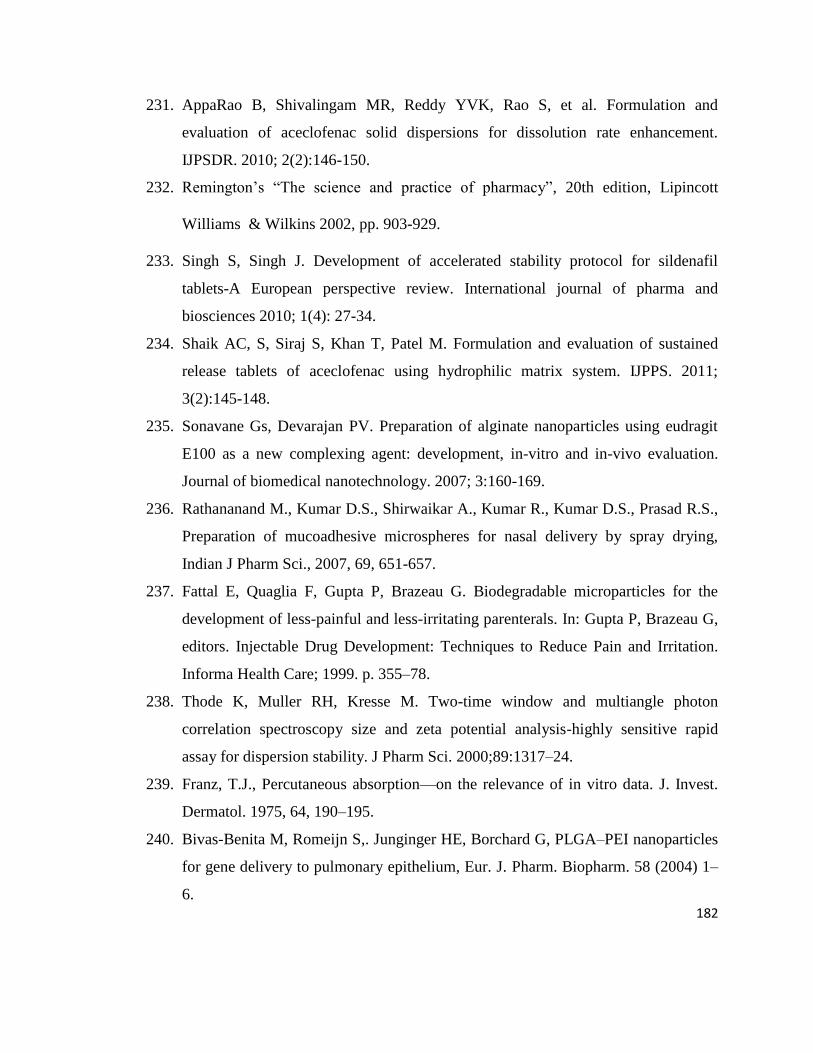
182
231. AppaRao B, Shivalingam MR, Reddy YVK, Rao S, et al. Formulation and
evaluation of aceclofenac solid dispersions for dissolution rate enhancement.
IJPSDR. 2010; 2(2):146-150.
232. Remington’s ―The science and practice of pharmacy‖, 20th edition, Lipincott
Williams & Wilkins 2002, pp. 903-929.
233. Singh S, Singh J. Development of accelerated stability protocol for sildenafil
tablets-A European perspective review. International journal of pharma and
biosciences 2010; 1(4): 27-34.
234. Shaik AC, S, Siraj S, Khan T, Patel M. Formulation and evaluation of sustained
release tablets of aceclofenac using hydrophilic matrix system. IJPPS. 2011;
3(2):145-148.
235. Sonavane Gs, Devarajan PV. Preparation of alginate nanoparticles using eudragit
E100 as a new complexing agent: development, in-vitro and in-vivo evaluation.
Journal of biomedical nanotechnology. 2007; 3:160-169.
236. Rathananand M., Kumar D.S., Shirwaikar A., Kumar R., Kumar D.S., Prasad R.S.,
Preparation of mucoadhesive microspheres for nasal delivery by spray drying,
Indian J Pharm Sci., 2007, 69, 651-657.
237. Fattal E, Quaglia F, Gupta P, Brazeau G. Biodegradable microparticles for the
development of less-painful and less-irritating parenterals. In: Gupta P, Brazeau G,
editors. Injectable Drug Development: Techniques to Reduce Pain and Irritation.
Informa Health Care; 1999. p. 355–78.
238. Thode K, Muller RH, Kresse M. Two-time window and multiangle photon
correlation spectroscopy size and zeta potential analysis-highly sensitive rapid
assay for dispersion stability. J Pharm Sci. 2000;89:1317–24.
239. Franz, T.J., Percutaneous absorption—on the relevance of in vitro data. J. Invest.
Dermatol. 1975, 64, 190–195.
240. Bivas-Benita M, Romeijn S,. Junginger HE, Borchard G, PLGA–PEI nanoparticles
for gene delivery to pulmonary epithelium, Eur. J. Pharm. Biopharm. 58 (2004) 1–
6.

183
241. Muller, R.H., 1996. Zetapotential und Partikelladung in der Laborpraxis. APV
paperback series, vol. 37. Wissenschaftliche Verlagsgesellschaft, Stuttgart.
242. Jacobs, C., Kayser, O., Müller, R.H, Nanosuspensions as a new approach for the
formulation for the poorly soluble drug tarazepide. Int.J. Pharm. 2000; 196:161-164
243. Winter CA, Risley EA, Nuss GW. Carrageenan induced edema in hind paw of the
rat as assay for anti-inflammatory drugs, Proc Soc Exp Bio Med. 1962; 111: 544-
547.
244. Brito ARMS., Antonio MA, Oral anti-inflammatory and antiulcerogenic activities
of a hydroalcoholic extract and partitioned fractions of Turnera ulmifolia
(Turneraceae), J Ethnopharmacol, 61 (1998), 215.
245. Di-Rosa M, Firoud JP, Willoughby DA, Studies of the acute inflammatory
response induced in rats in different sites by carrageenan and turpentine, J Patho,
104 (1971) 15-59.
246. Hawkey CJ, Laine L, Simon T, Quan H, Shingo S, Evans J, Incidence of
gastrodeodenal ulcers in patients with rheumatoid arthritis after 12 weeks of
rofecoxib, naproxen, or placebo: a multicentre, randomized, double blind study,
Gut 52 (2003) 820.
247. Ehrlich K, Sicking C, Respondek M, Peskar BM, Interaction of cyclooxygenase
isoenzymes, nitric oxide, and afferent neurons in gastric mucosal defense in rats, J
Pharmacol Exp Ther, 308 (2004) 277.
248. Kulkarni S.K. hand book of Experimental Pharmacology, Vallabha Prakashan,
New Delhi, 1999, 148-150.
249. Surendra. S. Evaluation of gastric anti ulcer activity of fixed oil of tulsi and
possible Mechanism, Indian journal of experimental biology. 1999, 253-257.

IR SPECTRA
Fig. 7.2. IR spectra of Aceclofenac
Fig. 7.3. IR spectra of Sodium bicarbonate

Fig. 7.4. IR spectra of Sodium chloride
Fig. 7.5. IR spectra of Potassium chloride

Fig. 7.6. IR spectra of MCC (microcrystalline cellulose)
Fig. 7.7. IR spectra of PVP K30

Fig. 7.8. IR spectra of Talc
Fig. 7.9. IR spectra of Magnesium stearate

Fig. 7.10. IR spectra of HPMC K4M
Fig. 7.11. IR spectra of Cellulose acetate

Fig. 7.12. IR spectra of Aceclofenac + sodium bicarbonate
Fig. 7.13. IR spectra of Aceclofenac + Sodium chloride

Fig. 7.14. IR spectra of Aceclofenac + Potassium chloride
Fig. 7.15. IR spectra of Aceclofenac + MCC (microcrystalline cellulose)

Fig. 7.16. IR spectra of Aceclofenac + PVP K30
Fig. 7.17. IR spectra of Aceclofenac + Talc

Fig. 7.18. IR spectra of Aceclofenac + Magnesium stearate
Fig. 7.19. IR spectra of Aceclofenac + HPMC K4M

Fig. 7.20. IR spectra of Aceclofenac + Cellulose acetate
Fig. 7.21. IR spectra of Aceclofenac + sodium bicarbonate + MCC + PVPK30
+talc + Magnesium stearate + HPMC K4

Fig. 7.22. IR spectra of Aceclofenac + sodium bicarbonate +sodium chloride+
MCC + PVPK30 + talc + Magnesium stearate + HPMC K4
Fig. 7.23. IR spectra of Aceclofenac + sodium bicarbonate +potassium
chloride+ MCC + PVPK30 +talc + Magnesium stearate + HPMC K4

Fig. 7.24. IR spectra of Aceclofenac + sodium chloride +potassium chloride+
MCC + PVPK30 + talc + Magnesium stearate + HPMC K4
Fig. 7.25. IR spectra of Aceclofenac + sodium bicarbonate + Sodium chloride
+ Potassium chloride +MCC (microcrystalline cellulose) + PVPK30
+talc+Magnesium stearate + HPMC K4 + Cellulose acetate

Fig. 7.26. IR spectra of Eudragit L100
Fig. 7.27. IR spectra of PLGA

Fig. 7.28. IR spectra of Aceclofenac + Eudragit L100
Fig. 7.29. IR spectra of Aceclofenac + PLGA

Fig. 7.30. IR spectra of Aceclofenac + Eudragit L100 + PLGA

DIFFERENTIAL SCANNING CALORIMETRY
Fig. 7.31. DSC of Aceclofenac
Fig. 7.32. DSC of Sodium bicarbonate

Fig. 7.33. DSC of Sodium chloride
Fig. 7.34. DSC of Potassium chloride

Fig. 7.35. DSC of MCC (microcrystalline cellulose)
Fig. 7.36. DSC of PVP K30

Fig. 7.37. DSC of Talc
Fig. 7.38. DSC of Magnesium stearate

Fig. 7.39. DSC of HPMC K4M
Fig. 7.40. DSC of Aceclofenac + sodium bicarbonate
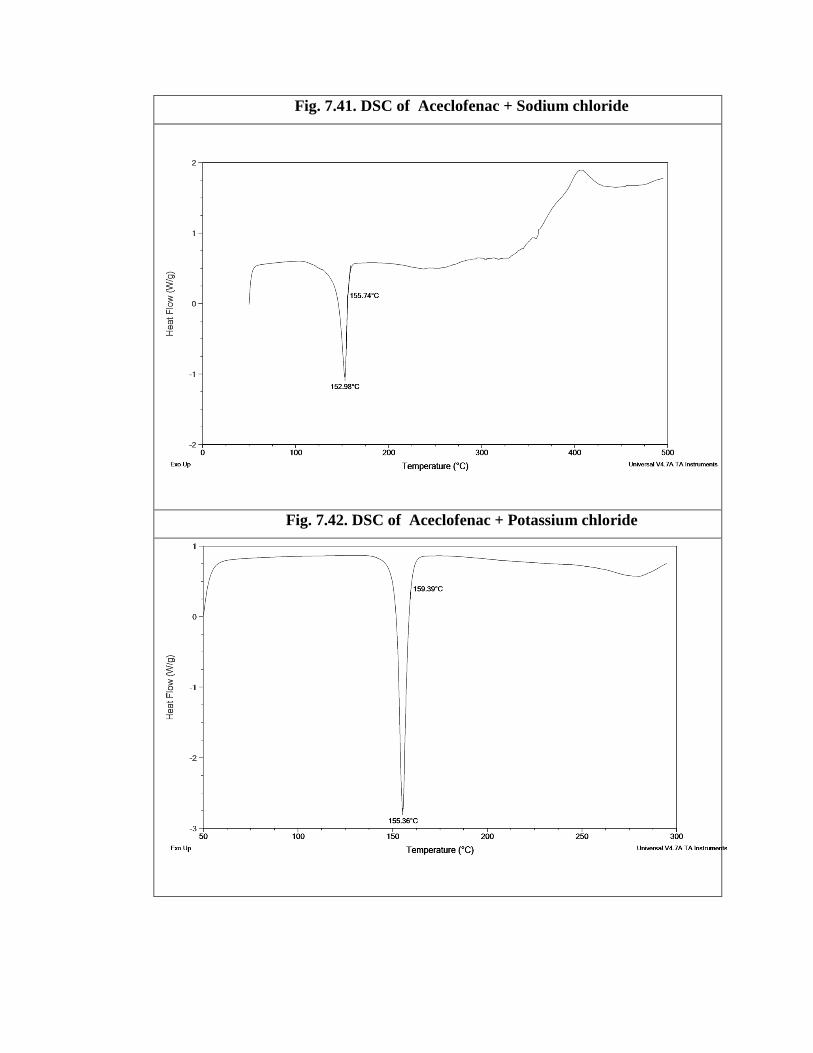
Fig. 7.41. DSC of Aceclofenac + Sodium chloride
Fig. 7.42. DSC of Aceclofenac + Potassium chloride

Fig. 7.43. DSC of Aceclofenac + MCC (microcrystalline cellulose)
Fig. 7.44. DSC of Aceclofenac + PVP K30

Fig. 7.45. DSC of Aceclofenac + Talc
Fig. 7.46. DSC of Aceclofenac + Magnesium stearate

Fig. 7.47. DSC of Aceclofenac + HPMC K4M
Fig. 7.48. DSC of Aceclofenac + Cellulose acetate

Fig. 7.49. DSC of Aceclofenac + sodium bicarbonate + MCC + PVPK30
+talc + Magnesium stearate + HPMC K4
Fig. 7.50. DSC of Aceclofenac + sodium bicarbonate +sodium chloride+
MCC + PVPK30 + talc + Magnesium stearate + HPMC K4

Fig. 7.51. DSC of Aceclofenac + sodium bicarbonate +potassium
chloride+ MCC + PVPK30 +talc + Magnesium stearate + HPMC K4
Fig. 7.52. DSC of Aceclofenac + sodium chloride +potassium chloride+
MCC + PVPK30 + talc + Magnesium stearate + HPMC K4

Fig. 7.53. DSC of Aceclofenac + sodium bicarbonate + Sodium chloride +
Potassium chloride +MCC (microcrystalline cellulose) + PVPK30
+talc+Magnesium stearate + HPMC K4 + Cellulose acetate
Fig. 7.54. DSC of Eudragit L100

Fig. 7.55. DSC of PLGA
Fig. 7.56. IR spectra of Aceclofenac + Eudragit L100

Fig. 7.57. DSC of Aceclofenac + PLGA
Fig. 7.58. DSC of Aceclofenac + Eudragit L100 + PLGA