DESIGN COLLABORATIVE BSurv(QLD) MRICS CPP J Lidis … · 109420/A Location of The Sebel in Sydney...
32
G W Smith BSurv(QLD) MCP(MIT) MIS(Aust) FPIA MRTPI FAPI CPP H M Sanders MPhil(Lon) MSc(Rdg) FPIA MRTPI MRICS CPP J Lidis BTP (UNSW) MPIA CPP DESIGN COLLABORATIVE Pty Limited ABN 36 002 126 954 ACN 002 126 954 Planning and Development Consultants Level 4 225 Clarence St Sydney NSW 2000 Ph: (02) 9262 3200 Fax: (02) 9262 3601 DX: 13030 Syd Market St Email: [email protected] GAMING MACHINES ACT 2008 LOCAL IMPACT ASSESSMENT CLASS 2 CITIGATE SEBEL HOTEL ALSO KNOWN AS THE SEBEL SURRY HILLS 28 ALBION STREET SYDNEY PREPARED ON INSTRUCTIONS FROM THE LICENSEE MICHAEL SHERIDAN JANUARY 2011 REF: 109420 16r LIA2
Transcript of DESIGN COLLABORATIVE BSurv(QLD) MRICS CPP J Lidis … · 109420/A Location of The Sebel in Sydney...

G W Smith BSurv(QLD) MCP(MIT) MIS(Aust) FPIA MRTPI FAPI CPP
H M SandersMPhil(Lon) MSc(Rdg) FPIA MRTPI MRICS CPP
J Lidis BTP (UNSW) MPIA CPP
DESIGN COLLABORATIVE Pty Limited
ABN 36 002 126 954
ACN 002 126 954
Planning and Development Consultants
Level 4 225 Clarence St Sydney NSW 2000 Ph: (02) 9262 3200 Fax: (02) 9262 3601 DX: 13030 Syd Market St Email: [email protected]
GAMING MACHINES ACT 2008 LOCAL IMPACT ASSESSMENT CLASS 2 CITIGATE SEBEL HOTEL ALSO KNOWN AS THE SEBEL SURRY HILLS 28 ALBION STREET SYDNEY PREPARED ON INSTRUCTIONS FROM THE LICENSEE MICHAEL SHERIDAN JANUARY 2011 REF: 109420 16r LIA2
Design Collaborative Pty Ltd
Local Impact Assessment Class 2 i Ref: 109420 16r LIA2 The Sebel, Surry Hills G W Smith 28 Albion Street, Surry Hills, Sydney January 2011
CONTENTS
EXECUTIVE SUMMARY ......................................................................................................1
1. INTRODUCTION ...........................................................................................................6
2. GENERAL INFORMATION REQUIRED BY THE GUIDELINES........................6
3. SPECIFIC INFORMATION REQUIRED BY THE GUIDELINES .........................7
4. VENUE SPECIFIC INFORMATION REQUIRED BY THE GUIDELINES ........10
5. LOCAL COMMUNITY ...............................................................................................11
6. GAMING AND SOCIAL PROFILE DATA...............................................................12
7. HOW MUCH OF THEIR INCOMES DID ADULTS SPEND ON EGMS? ...........18
8. PERCEIVED SOCIAL IMPACTS AND ECONOMIC BENEFITS........................19
9. CONSULTATION.........................................................................................................20
TABLES ...................................................................................................................................21
Plans
109420/A Location of The Sebel in Sydney
109420/B Google Earth image of The Sebel and its surrounds
109420/C Local Government Areas within 5kms of The Sebel
109420/D Plan showing clubs and hotels within 1km of The Sebel
109420/E Plan showing schools, hospitals, places of public worship and community and sporting facilities within 1km of The Sebel
Annexures
1 Floor plans of the public areas of The Sebel
2. Plan showing location of gaming room
3. Patron survey report
4. Evidence of notification of intention to submit an LIA
5. Copy of letter from Sydney City Council
6. Copy of letter from the Gambling Treatment Centre of University of Sydney

Design Collaborative Pty Ltd
Local Impact Assessment Class 2 1 Ref: 109420 16r LIA2 The Sebel, Surry Hills G W Smith 28 Albion Street, Surry Hills, Sydney January 2011
EXECUTIVE SUMMARY
ES1 The Citigate Sebel Hotel, now trading as the Sebel Surry Hills (Sebel) (Licence No LIQH400120621), has a gaming machine threshold (gmt) of 15 and keeps 15 electronic gaming machines (egm). The owner of the Sebel – Schwartz Family Company Pty Ltd – is seeking to increase its gmt to 17, a low-range increase of 2, under Clause 34 of the Gaming Machine Regulation 2010. ES2 The Sebel is in the City of Sydney (the City) which the Casino Liquor and Gaming Control Authority (the Authority) has classified as a Band 3 LGA under Section 33 of the Gaming Machines Act 2001 (the Act). Any application for an increase in a gmt in a Band 3 LGA is required, by Section 35 of the Act, to be accompanied by a Class 2 Local Impact Assessment (LIA2). ES3 In this instance, the owner of the Sebel is the owner of the Macquarie Hotel which is also in the City, some 400 metres north of the Sebel. There are poker machine permits attached to the licence of the Macquarie Hotel. It proposes – if this LIA2 is approved – to transfer two of those permits from the Macquarie Hotel to the Sebel. ES4 This document constitutes the LIA2 required to accompany the application for the increase in the Sebel’s gmt. It has been prepared on behalf of the owner and the licensee, by Design Collaborative Pty Ltd (DC). ES5 The Sebel stands at the north western corner of Albion and Mary Streets, Surry Hills. Plan 109420/A shows its location on a street map of Sydney while Plan 109420/B is a Google Earth image of the hotel and its immediate surrounds. ES6 Plan 109420/D shows the locations of known registered clubs and hotels (including those with licences endorsed under Section 16 of the Liquor Act 2007) in that area. ES7 Plan 109420/E shows the locations of known schools (excluding privately operated language and like training schools), hospitals and public places of worship and sporting and community facilities in that area. ES8 The Sebel is a 271-room, 4½-star-rated, hotel which caters for international and domestic travellers. The Sebel provides 10 conference rooms with capacities ranging from 10 to 220. The public areas of the hotel are located on the ground and first floors. The ground floor contains a large reception foyer, a business centre, function rooms, bistro, lounge and gaming room. The first floor contains function rooms and a restaurant. The Sebel’s accommodation occupies the balance of the building which rises, in part, to 11 storeys above Albion Street. The ground floor bistro, lounge and gaming room is known as the Townhouse (Townhouse).

Design Collaborative Pty Ltd
Local Impact Assessment Class 2 Ref: 109420 16r LIA2 The Sebel, Surry Hills G W Smith 28 Albion Street, Surry Hills, Sydney January 2011
2
ES9 The Sebel’s approved trading hours are: Monday to Saturday, 5am – 12 midnight; Sunday, 10am – 10pm; Good Friday, 12 noon – 10pm; Christmas Day, 12 noon – 10pm; and December 31, 5am – 2am the following day. ES10 The Sebel’s egms are only accessible to players between 10am and 11pm, Monday to Saturday, and 10am to 10pm, Sunday as a result of a condition of consent in D2007/821/B. ES11 In order to establish the current patron profile in the Townhouse, the owner retained People for Places and Spaces to conduct interview surveys with patrons. Annexure 3 contains its report on that survey. ES12 No measurable increase in patronage is anticipated if two additional egms are installed. ES13 The egms installed in the Sebel are supervised, maintained and operated in accordance with all requirements of the Gaming Machines Act 2001 and the Gaming Machine Regulation 2010 as well as industry guidelines. ES14 The Sebel has, effectively, two clienteles. One consists of those who are either resident guests of the Sebel or who attend functions held at it. During the 10 months from July 2009 to April 2010, 43.7% of room nights sold were to domestic guests and 56.3% to international guests. The second consists very largely of people who work or live nearby and who patronise the Townhouse. The two are quite distinct and different. The licensee reports that – from his observations – relatively few resident guests patronise the Townhouse and almost none who attend functions do so. ES15 The City seems to be the best option to adopt as the local community of the Sebel. At least, it – as a community - falls under a single local government. ES16 The requisite gaming data are provided in Tables 3 to 11 inclusive. There are nine other LGAs within five kilometres of the Sebel. Data is provided for the City, each of those nine LGAs and NSW. ES17 Tables 3 to 6 set out the numbers of egms and the amounts spent on egms in the 10 LGAs. ES18 The total number of egms in the ten LGAs fell by 1,425 between 2006 and 2010, a decline of 12%. In the City, the total number of egms fell by 366 (or 7%) with the number of egms in clubs declining by 443 (or 27%) but the number in hotels increasing by 37 (or 1%).

Design Collaborative Pty Ltd
Local Impact Assessment Class 2 Ref: 109420 16r LIA2 The Sebel, Surry Hills G W Smith 28 Albion Street, Surry Hills, Sydney January 2011
3
ES19 In the City, expenditures on egms rose by 10% between 2005 and 2006 and then fell by 3% in 2007, 8% in 2008 and by 1% in 2009. Overall, the decrease between 2005 and 2009 was 3.5%. ES20 In the remaining LGAs, expenditures on egms rose by varying amounts between 2005 and 2006. All had overall decreases in expenditures on egms by 2009, except for Waverley which had an overall increase of 4.3%. ES21 The falls in expenditures on egms shown in Table 6 do not correlate with the numbers of egms in the LGAs and that suggests that gaming expenditure is not dependent on the number of egms in an area, at least, where there are substantial numbers of egms. ES22 Table 8 shows that, except in Randwick and Mosman, the density of egms fell in all LGAs, generally by a greater amount than the NSW density did. However, Table 8A also shows a fall in Randwick and a greater fall in the City, largely due to reasonably rapid population growth. ES23 Tables 9 and 10 show that average expenditure per adult on egms has fallen considerably in all of the 10 LGAs examined since 2006 although it has risen in NSW. ES24 Table 11 sets out average annual takings (profit) per egm in each of the 10 LGAs and in NSW in constant dollars. While those averages fell in Leichhardt, Lane Cove and Mosman, they rose in all other areas. ES25 The requisite social profile data are provided in Tables 12 to 16 inclusive. ES26 Table 12 lists the following population characteristics:-
• The City and Randwick, the two LGAs with universities (and, in the case of the City, many other higher educational establishments and hospitals) had markedly higher percentages of those aged 18-24 than the other areas. In the other areas, including NSW, the percentages were similar.
• Conversely, the City (but not Randwick) had a much lower percentage of those aged
over 60 than the other areas.
• Only Botany Bay reached the NSW’s level of indigenous persons at 2% with the City recording 1% along with Randwick, Leichhardt and Marrickville.
• Only Botany Bay had a higher percentage of those that did not complete Year 12 than
NSW. The City, Woollahra, Waverley, Lane Cove, North Sydney and Mosman had percentages which were less than half that for NSW.

Design Collaborative Pty Ltd
Local Impact Assessment Class 2 Ref: 109420 16r LIA2 The Sebel, Surry Hills G W Smith 28 Albion Street, Surry Hills, Sydney January 2011
4
• Botany Bay had three times the NSW percentage of those employed as labourers in the workforce and Marrickville equalled NSW. The City had half the NSW level.
• The City’s percentage of those in administrative and support services in the workforce
equalled the NSW percentage and most of the other LGAs had close to that level except Botany Bay where the percentage was over 250% higher.
ES27 In terms of unemployment, Table 12 also reveals that all of the LGAs had lower levels than NSW (6%) with the levels in the wealthier LGAs being the lowest. The City (with 5%) ranked with Randwick, Botany Bay and Marrickville. ES28 Table 12 also lists the relationships in households in the 10 LGAs and NSW. The City is distinguishable by having a population which included low proportions of married couples, households with children and lone parents but it had high proportions of young adults, defacto couples, group households and lone persons. These characteristics are, no doubt, influenced by it being the home of a large ‘gay’ community. Nevertheless, they suggest that it may also contain groups who could exhibit higher than normal levels of susceptibility to gaming problems. ES29 Table 13 sets out the five most-frequently-mentioned countries of birth as reported in the 2006 Census for each of the 10 LGAs. It is evident that all of the LGAs contain substantial proportions of persons born in many countries. Those countries ranked fifth in each LGA accounted for – at the highest – 2.7% of the total, ie, each overseas country contributed a very small proportion of residents. ES30 Table 14, setting out the distributions of weekly household incomes, shows:-
• that in the City and Botany Bay, there were about the same percentages of households with incomes under $500/week (18.8% in the City and 22.7% in Botany) as in NSW (20%). In all the other LGAs, those percentages were lower with Mosman recording 8.8%, Woollahra 9% and North Sydney 9.5%
• that at the higher end of the income scale, the City recorded 42.2% earning over
$1,500/week compared to 31.2% in NSW. Mosman recorded 55.3% and Leichhardt, 53.2%. On the other hand, Botany Bay recorded 28.8% well below Marrickville, the next lowest, with 38.8%
• the great range of wealth which occurs across households in the City. It had the
highest percentage of very low incomes, a consequence of the large public housing estates it contains in Waterloo, Surry Hills, Glebe and Woolloomooloo as well as in numerous private boarding houses and the like. While not having the highest percentage in the highest income group, it rated well above the NSW level, a consequence of it incorporating areas of marked wealth such as Elizabeth Bay, Potts Point, Pyrmont and like Harbourside areas. Low income has been linked to greater susceptibility to gambling problems.
Design Collaborative Pty Ltd
Local Impact Assessment Class 2 Ref: 109420 16r LIA2 The Sebel, Surry Hills G W Smith 28 Albion Street, Surry Hills, Sydney January 2011
5
ES31 Table 15, setting out median incomes in 2006, shows that:-
• nine of the ten LGAs had higher median incomes than NSW did but, in Marrickville, all the medians were slightly below the NSW levels
• in the City, the median weekly income for individuals was 56% above that in NSW
but, despite that, it ranked the fourth lowest among the 10 LGAs • the City’s median weekly family income was 54% above that in NSW and again it
ranked the fourth lowest among the 10 LGAs but its median weekly household income was only 16% above NSW’s and it again ranked as the fourth lowest. Its low household income maybe a reflection of the smaller average number of persons per household in the City.
ES32 Table 16 sets out the SEIFA levels for the 10 LGAs. ABS did not provide SEIFA for NSW but, in terms of the SEIFA for disadvantage, NSW level was in the range between 975 and 1000. On that basis, only Botany Bay fell below the NSW level on that index. Among the 10 LGAs, the City was ranked towards the lower end on each of the SEIFA indices. ES33 Table 17 sets out the estimated average annual expenditure on egms as a percentage of annual median household expenditure in 2006. The City’s percentage was well above those of all the other LGAs and NSW. That seems to be due to it attracting expenditure on egms from non-residents who include workers, shoppers, people seeking entertainment and tourists, both domestic and international. ES34 An increase of two in the gmt of a hotel with an existing gmt of 15 in an area where there are, literally, hundreds of egms, is unlikely to have any perceptible positive or negative social impact on the local community. ES35 Any negative effects arising from the addition of two egms at the Sebel would appear to be very limited. Moreover, any such effects should be offset by the removal of three egms from the Macquarie Hotel, some 400 metres away. At the LGA level, there would be a decrease in the numbers of egms which should – if anything – have a beneficial effect. ES36 The owner of the Sebel recognises that the Authority has a policy of requiring applicants for increases in gmt to offer to make a positive contribution to the local community. The owner is a recognised benefactor of charitable and like organisations. In this instance, it proposes to make a donation of $50,000 to the NSW University of Technology (which is based less than a kilometre from the Sebel) for educational purposes. That University serves the local community regardless of how it is defined and improvement to it will benefit that community.
Design Collaborative Pty Ltd
Local Impact Assessment Class 2 Ref: 109420 16r LIA2 The Sebel, Surry Hills G W Smith 28 Albion Street, Surry Hills, Sydney January 2011
6
1. INTRODUCTION The Citigate Sebel Hotel, now trading as the Sebel Surry Hills (Sebel) is a 271-room, 4½-star-rated hotel which caters for international and domestic travellers. It faces Albion Street, west of Mary Street, Surry Hills. The Sebel provides 10 conference rooms with capacities ranging from 10 to 220. The public areas of the hotel are located on the ground and first floors. The ground floor contains a large reception foyer, a business centre, function rooms, bistro, lounge and gaming room. The first floor contains function rooms and a restaurant. The Sebel’s accommodation occupies the balance of the building which rises, in part, to 11 storeys. Those who use most of the public areas of the hotel are, principally, guests of the hotel (and, in some cases, their guests) and people attending functions. However, its ground floor Townhouse Restaurant/Lounge and Bar and gaming room (the Townhouse) are popular with local workers and residents. The Sebel has a gaming machine threshold (gmt) of 15 and keeps 15 electronic gaming machines (egm). The owner of the Sebel – Schwartz Family Company Pty Ltd - is seeking to increase its gmt by 2, a low range increase, under Clause 34 of the Gaming Machine Regulation 2010. The Sebel is in the City of Sydney (the City) which the Casino Liquor and Gaming Control Authority (the Authority) has classified as a Band 3 LGA under Section 33 of the Gaming Machines Act 2001 (the Act). Any application for an increase in a gmt in a Band 3 LGA is required, by Section 35 of the Act, to be accompanied by a Class 2 Local Impact Assessment (LIA2). In this instance, the owner of the Sebel is the owner of the Macquarie Hotel which is also in the City, some 400 metres north of the Sebel. There are poker machine permits attached to the licence of the Macquarie Hotel. It proposes – if this LIA2 is approved – to transfer those permits from the Macquarie Hotel to the Sebel. This document constitutes the LIA2 required to accompany the application for the increase in the Sebel’s gmt. It has been prepared on behalf of the owner and the licensee, by Design Collaborative Pty Ltd (DC). 2. GENERAL INFORMATION REQUIRED BY THE GUIDELINES a) The Sebel Surry Hills (Licence No LIQH400120621) stands at the north western corner of
Albion and Mary Streets, Surry Hills. Plan 109420/A shows its location on a street map of Sydney while Plan 109420/B is a Google Earth image of the hotel and its immediate surrounds.
b) The Sebel’s present gmt is fifteen (15). The increase sought in its gmt is 2. c) The Sebel is situated in the City of Sydney. As shown on Plan 109420/C, there are nine
other LGAs which extend to within 5kms of The Sebel. They are the LGAs of -
Design Collaborative Pty Ltd
Local Impact Assessment Class 2 Ref: 109420 16r LIA2 The Sebel, Surry Hills G W Smith 28 Albion Street, Surry Hills, Sydney January 2011
7
CLGCA Band Woollahra 1 Waverley 2 Randwick 2 Botany Bay 2 Leichhardt 1 Marrickville 2 Lane Cove 1 North Sydney 1
Mosman 1 d) Plans 109420/D and E are maps of the area lying within a 1km radius of The Sebel.
• Plan 109420/D shows the locations of known registered clubs and hotels (including those with licences endorsed under Section 16 of the Liquor Act 2007) in that area.
• Plan 109420/E shows the locations of known schools (excluding privately operated
language and like training schools), hospitals and public places of worship and sporting and community facilities in that area.
Each identified establishment is numbered and each map is accompanied by a legend which classifies the establishment and gives its name.
e) The Sebel – as a business – is owned by Schwartz Family Company Pty Ltd (ACN 001
531 335) f) The owner’s contact details are:
Address: 25 Spring Street, Bondi Junction NSW 2022 Postal Address: as above Telephone (business hours): 02 9369 0000 Facsimile: 02 9369 0001 Email: [email protected]
3. SPECIFIC INFORMATION REQUIRED BY THE GUIDELINES a) The Sebel Surry Hills (Sebel) is a 271-room, 4½-star-rated, hotel which caters for
international and domestic travellers which faces Albion Street, west of Mary Street, in Surry Hills. The Sebel also provides 10 conference rooms with capacities ranging from 10 to 220. The public areas of the hotel are located on the ground and first floors. The ground floor contains a large reception foyer, a business centre, function rooms, bistro, lounge and gaming room. The first floor contains function rooms and a restaurant. The Sebel’s accommodation occupies the balance of the building which rises, in part, to 11 storeys above Albion Street.
Those who use most of the public areas of the hotel are, principally, guests of the hotel
(and, in some cases, their guests) and people attending functions. However, the Townhouse is popular with local workers and residents.
Design Collaborative Pty Ltd
Local Impact Assessment Class 2 Ref: 109420 16r LIA2 The Sebel, Surry Hills G W Smith 28 Albion Street, Surry Hills, Sydney January 2011
8
b) The Sebel’s approved trading hours are:
Monday to Saturday 5am – 12 midnight Sunday 10am – 10pm Good Friday 12 noon – 10pm Christmas Day 12 noon – 10pm December 31 5am – 2am the following day
As a major 4½-star-rated accommodation hotel, it has mini-bars in guests’ rooms and 24-
hour room service. The City of Sydney determined D/2007/821/B on 13 August 2007. It permitted works at
the Sebel including the construction of “a new timber deck in the undercroft area for bar and cafe use”: That deck is now the Sebel’s gaming room. D/2007/821/B contains conditions which affect the use of that deck, viz:
(2) The hours of operation of the bar and restaurant are restricted to between 10am
and 11pm, Monday to Saturday inclusive and 10am to 10pm Sundays;
(7)(a) The use of the front outdoor area shall be restricted to a maximum of 50 people; Consequently, the Sebel’s egms are only accessible to players between 10am and 11pm, Monday to Saturday, and 10am to 10pm Sunday.
c) Annexure 1 contains a set of plans which illustrate the floor layouts of the eleven levels
of the Sebel to which the public and/or guests have access. There is a 126-space carpark beneath the Sebel for the vehicles of guests.
It is proposed that the two additional egms to be kept, if this LIA2 is approved, be
installed in the Sebel’s existing gaming room which has only recently been completed. That room only has space for two additional egms. Annexure 2 is a plan showing the location of the gaming room and the proposed location of the two egm sought.
d) In order to establish the current patron profile in the Townhouse, the owner retained
People for Places and Spaces to conduct interview surveys with patrons. Annexure 3 contains its report on that survey.
Summarising the results of the 200 interviews undertaken during visits on two Thursdays
and two Fridays in July 2010; they reveal -
• 40% were males
• 81% were aged between 26 and 60 years
• 17.5% had professional occupations
• 14% occupied managerial positions
• 46% held clerical positions
• 76% lived in the Sydney metropolitan area (see below) 16% lived in other parts of NSW 8% lived inter-state
• 79% spoke English only

Design Collaborative Pty Ltd
Local Impact Assessment Class 2 Ref: 109420 16r LIA2 The Sebel, Surry Hills G W Smith 28 Albion Street, Surry Hills, Sydney January 2011
9
• The most-common language spoken other than English was Hindi which accounted for 3.5% of the total followed by Filipino and Spanish, each of which accounted for 1%. Eighteen languages other than English were encountered
• 96% were employed
• 67% worked in Surry Hills, with 32% working in Centennial Place, a high rise office complex opposite the Sebel
• 12% worked in Regional NSW
• 7% worked interstate
• 4% worked in the CBD
• 4% worked in suburban Sydney In terms of suburbs of residence, 10% lived in the City of Sydney and no other suburbs
accounted for more than 2% of those interviewed. Those interviewed lived in 100 suburbs spread from Helensburgh, in the south, to Mt Colah, in the north, and from Vaucluse in the east to as far west as Mt Druitt, St Clair, Abbotsbury and Campbelltown.
[Up to 24% of those interviewed could have been guests of the Sebel in that they lived
outside the Sydney metropolitan area but some of those who lived outside the metropolitan area may have been attending offices nearby.]
e) No measurable increase in patronage is anticipated if two additional egms are installed. f) The egms installed in the Sebel are supervised, maintained and operated in accordance
with all requirements of the Gaming Machines Act 2001 and the Gaming Machine Regulation 2010 as well as industry guidelines. In particular:
• the licensee and all staff involved in gaming-related duties hold Responsible Conduct
of Gambling Certificates. Copies of those certificates are kept on premises and are available for inspection by relevant authorities
• the Sebel operates a self-exclusion scheme which complies with the provisions of the legislation through the AHA’s GameCare
• the Sebel has an arrangement with the AHA GameCare in relation to the provision of problem gambling counselling and patrons are advised of the “gambling HELP” service
• staff have training in self-exclusion and on referral to counselling services • all required signage and notices are displayed in conspicuous positions and maintained • gambling counselling service contact cards are displayed in the gaming room • a clock is visible from each seated position in the gaming room • an ATM is located in the Townhouse at the Sebel but it is not in the gaming room • the Sebel does not provide credit • there is a limit of $2,000 on cash payments for winnings • the Sebel will not cash cheques • the Sebel does not offer or provide promotional prizes that are indecent or offensive • the Sebel does not offer any inducements to gaming

Design Collaborative Pty Ltd
Local Impact Assessment Class 2 Ref: 109420 16r LIA2 The Sebel, Surry Hills G W Smith 28 Albion Street, Surry Hills, Sydney January 2011
10
• staff are not permitted to play the gaming machines when on duty at the Sebel • the presence of poker machines is not made known outside the Sebel.
4. VENUE SPECIFIC INFORMATION REQUIRED BY THE GUIDELINES a) As set out above, the application which this LIA2 accompanies seeks approval to keep two
(2) egm in a 271 room, 4½-star-rated, hotel in Surry Hills, close to Central Railway Station.
b) There are 15 egm in the Sebel. c) The Sebel has, effectively, two clienteles. One consists of those who are either resident
guests of the Sebel or who attend functions held at it. The second consists very largely of people who work or live nearby and who patronise the Townhouse. The two are quite distinct and different. The licensee reports that – from his observations – relatively few resident guests patronise the Townhouse and almost none who attend functions do so.
d) The following data about resident guests has been extracted from the Sebel’s internal
records for the ten months from July 2009 to April 2010:
• in terms of room nights sold, 43.7% were to domestic guests and 56.3% to international guests
• the average percentages of rooms sold to guests from the Australian states and
territories were:
Queensland 6.2% New South Wales 20.8% Victoria 8.4% Western Australia 2.2% South Australia 2.3% Northern Territory 0.2% Tasmania 0.8% ACT 3.4% (These percentages add to more than 43.7% due to rounding to the nearest tenth of a percent.) • The contributions made by guests from individual countries vary substantially from
month to month. For example, in one month, the USA accounted for nearly 14% of all rooms sold but, over the other nine months, it accounted for an average of only 3%
• The country accounting for the highest average proportion of rooms sold was China
(at 10.5%). Other significant contributors were Japan, New Zealand and the United Kingdom
e) The Sebel has operated at about its practical capacity in terms of room occupancy in
recent years. f) The patron profile of those who patronise the Townhouse and gaming room are set out in
3(d) above.
Design Collaborative Pty Ltd
Local Impact Assessment Class 2 Ref: 109420 16r LIA2 The Sebel, Surry Hills G W Smith 28 Albion Street, Surry Hills, Sydney January 2011
11
5. LOCAL COMMUNITY
Section 36 (3)(d) of the Gaming Machines Act reads –
“(d) in the Case of a class 2 LIA:
(i) the proposed increase in the gaming machine threshold for the relevant venue will have a positive impact on the local community where the venue is situated,…..”
and Clause 39 (5) of the Gaming Machine Regulation reads –
“A Class 2 LIA must:
(a) specify the positive impact (both social and economic) that the proposed increase in the gaming machine threshold for the relevant venue will have on the local community (including details of the benefits that the venue will provide)….”
It is therefore necessary to define the local community of the relevant venue, ie, the Sebel. There is no guidance in the legislation or in the Guidelines for Applicants, issued by the Casino Liquor and Gaming Control Authority, about how the local community should be defined. In the former legislation, it was described as “the people in the area or group from which the persons utilising the services and facilities of the hotel concerned are likely to be drawn”. As set out in 4(c), the Sebel is utilised by two quite distinct groups of people –
i) those who use it for accommodation and conferences and
ii) those who use its Townhouse as their “local hotel” for socialising, drinking, meals and gaming.
The first group consists – insofar as the people who use the Sebel for accommodation are concerned – of people who appear to live outside the Sydney metropolitan area. The home addresses of those who use it for conferences are not known but, logically, it would seem a majority of them probably reside in the metropolitan area. Those who use the Townhouse appear either to live or work nearby. The latter are a small minority since only 10% of those interviewed lived in the City of Sydney (see 4(d) above). The majority lived in places spread across the Sydney metropolitan area.
Considering part, at least, of the first group of those who utilise the Sebel live in the metropolitan area and as most of those who utilise it as their local hotel live in that area but outside the City of Sydney, it would seem that the Sydney metropolitan area, with its 4,000,000 population, would be one option in selecting the area where the people utilising the Sebel reside. However, such an area is so large that it is illogical to describe it as “a local community”. Similarly, it is illogical to attempt to define some small area close to, or within walking distance, of the Sebel as its local community for at least, two reasons:-
i) many – if not the majority – of the people who utilise the Sebel in such an area are
workers who do not live in that area; and

Design Collaborative Pty Ltd
Local Impact Assessment Class 2 Ref: 109420 16r LIA2 The Sebel, Surry Hills G W Smith 28 Albion Street, Surry Hills, Sydney January 2011
12
ii) every one of those people has other hotels (with gaming machines) within a similar distance as the Sebel from their home or place of work.
As the legislation requires data to be provided for all LGAs within 5 kms radially of the Sebel, ie, the 10 listed in 2(c) above, those 10 LGAs also provide an option for a surrogate local community. In total, those 10 LGAs accounted for 32% of the places of residence of those interviewed in the Townhouse. It is estimated that there are about 600,000 adults in the 10 LGAs. Again, that is such a large number that they would scarcely be deemed to be a local community. Moreover, they are both geographically separated (by Sydney Harbour) and socially and economically diverse (as is illustrated by the tables below). These are factors which mitigate against them being considered “a community” of any kind. In these circumstances, an arbitrary decision must be made. Despite it being only the place of residence of 10% of those surveyed at the Townhouse and having a population of over 160,000, the City of Sydney seems to be the best option to adopt as a surrogate of the local community of the Sebel. At least, it – as a community - falls under a single local government. 6. GAMING AND SOCIAL PROFILE DATA The tables set out on pages 21 – 30 are based on information provided by the Office of Liquor Racing and Gaming (OLGR) supplemented by data from the Australian Bureau of Statistics (ABS). Each table sets out data for each of the ten LGAs lying, or extending to, within five kilometres of the Sebel identified in 2(c) above (the 10 LGAs). Tables 2, 3 and 4 set out “raw” data as supplied by OLGR. Tables 12, 13, 14 and 15 contain data sourced from the ABS. Table 1 (on page 18) contains data from the Casino Liquor and Gaming Control Authority (CLGCA) and the ABS as does Table 7 but it also contains data prepared specifically for this LIA by DC. The presence of “visitors” affects ratios expressed in terms of population, eg, the density of egms. As Table 1 (on page 21) shows, in every LGA, some visitors were counted on the night of the 2006 Census despite it being conducted on a date selected to avoid popular holiday times, particularly, school vacation periods. The percentages of the total population counted in the Census are - in general terms – about equal across almost all the ten LGAs. However, in the City of Sydney, 15.8% of the population counted were visitors on the night of the 2006 Census. They equated to 24,738 people, a number sufficient to distort the results appreciably. However, due to limitations on the disaggregation of Census data, it is not possible to ascertain how many of the 13,468 overseas visitors recorded in the City were adults. In an endeavour to overcome this difficulty, OLGR has provided tables showing the estimated resident adult populations annually in each of the ten LGAs for the period between 2001 and 2007 based on estimates provided by the ABS. Those estimates do not align with the results from the Census. DC has then projected the data provided by OLGR over the years 2008, 2009 and 2010. Thus there seems likely to be inherent inaccuracies in those tables which depend on population data. For that reason, DC has rounded some figures in some tables to avoid conveying the impression that the values produced for the various LGAs are precise.

Design Collaborative Pty Ltd
Local Impact Assessment Class 2 Ref: 109420 16r LIA2 The Sebel, Surry Hills G W Smith 28 Albion Street, Surry Hills, Sydney January 2011
13
There appear to be other problems with some of the data provided. Table 2 (on page 21) sets out a comparison of the numbers of egms in hotels and clubs which are connected to the central monitoring system in each of the ten LGAs and the number of entitlements authorised in each of them. Both data was supplied by OLGR. The number of egms should not exceed the number of entitlements and it does not in any of the LGAs insofar as clubs are concerned but that is not the case with hotels. In this LIA, the numbers of egms connected to the central monitoring system are used throughout. Finally, as the City of Sydney has been selected as the local community for the purpose of the LIA, the discussion that follows each table tends to focus on the City with the object of identifying any characteristic that might suggest its population could be at greater risk of problem gambling. a) Table 3 (on page 22) sets out the numbers of egms in the 10 LGAs from 2006 to 2010.
As supplied by OLGR, the numbers of egms in clubs, is as at May each year while those for egms in hotels are at June each year. However, to simplify computations, it has been assumed they are data for the same point in time. Because May and June fall near the end of the financial year but near the middle of the calendar year, annual figures are based on calendar years. Data for NSW is also included.
Table 3 reveals that - • The total number of egms in the ten LGAs fell by 1,425 between 2006 and 2010, a
decline of 12%. The number of egms in hotels remained relatively consistent over that time and the decline in total numbers resulted, primarily, from a reduction in egms in clubs.
• In the City, the total number of egms fell by 366 (or 7%) with the number of egms in
clubs declining by 443 (or 27%) but the number in hotels increasing by 37 (or 1%). • The number of egms in clubs fell in all ten LGAs. • The numbers of egms in hotels rose in the City and Randwick, was stable in the Botany
Bay, Lane Cove and Mosman and fell in the remaining five LGAs.
b) Table 4 (on page 23) sets out the amounts spent on egms (or profits of egms) in current dollars, in each of the ten LGAs and NSW by quarter in each calendar year from 2005 to 2009 and provides annual totals for each area.
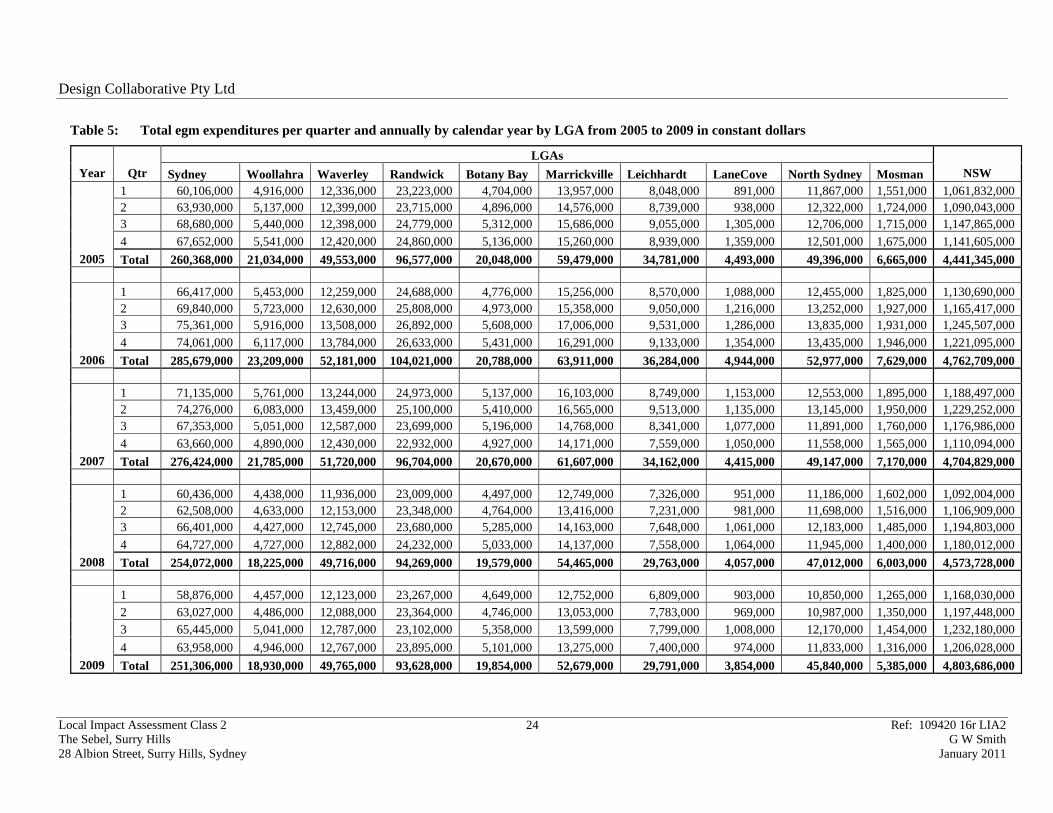
c) Table 5 (on page 24) sets out the same data as in Table 3 but expresses it in constant
dollar values (taken as at the 2009 value) thereby eliminating changes due to inflation. d) Table 6 (on page 25) reduces the data in Table 5 to a more readily-appreciated form. Table 6 provides insights into true trends in expenditures on egms over the five years in the 10 LGAs. It reveals:- • In the City, expenditures on egms rose by 10% between 2005 and 2006 and then fell by
3% in 2007, 8% in 2008 and by 1% in 2009. Overall, the decrease between 2005 and 2009 was 3.5%.

Design Collaborative Pty Ltd
Local Impact Assessment Class 2 Ref: 109420 16r LIA2 The Sebel, Surry Hills G W Smith 28 Albion Street, Surry Hills, Sydney January 2011
14
• The next-largest expenditures on egms were recorded in Randwick where they rose by 8% between 2005 and 2006 but fell by 10% between 2006 and 2009. Overall, there was a decrease of 3.1%.
• Marrickville recorded the third-largest expenditures over the five years. Again,
expenditures rose by 7% between 2005 and 2006 but fell 2006 to 2009 by 18% resulting in an overall decrease of 11.4%.
• The fourth-largest expenditures were in Waverley where they rose by 5% between 2005
and 2006 but the fall from 2006 to 2009 was 5% to show an overall increase of 4.3%. • The fifth-largest expenditures were in North Sydney where they rose by 7% between
2005 and 2006 but the fall from 2006 to 2009 was 13% with the overall decrease being 7.2%.
In the remaining LGAs in descending order of decrease in expenditures between 2005 and 2009, Table 6 shows the following falls:-
Mosman 19.2% Leichhardt 14.3% Lane Cove 14.2% Woollahra 10.0% Botany Bay 1.0% These falls do not correlate with the numbers of egms in the LGAs and that suggests that gaming expenditure is not dependent on the number of egms in an area, at least, where there are substantial numbers of egms. e) Table 7 (on page 25) sets out the adult populations of each of the 10 LGAs as recorded
at the 2001 Census and the 2006 Census together with the ABS estimates of those populations for 2005, 2006 and 2007 and projections, made by DC, of those estimates for 2008, 2009 and 2010.
f) Table 8 (on page 26) sets out the densities of egms in each of the 10 LGAs and NSW
for each year from 2006 to 2010 as provided by OLGR. Since OLGR did not allow for any population growth between 2007 and 2010, the densities shown in Table 8 are inflated in those years. Table 8A (on page 26) sets out the densities of egms calculated from the data in Tables 3 and 7 for 2008, 2009 and 2010.
Table 8 shows that, except in Randwick and Mosman, the density of egms fell in all
LGAs, generally by a greater amount than the NSW density did. However, Table 8A also shows a fall in Randwick and a greater fall in the City, largely due to reasonably rapid population growth.
g) Table 9 (on page 26) shows the estimated average annual expenditure per adult on egms
in each of the 10 LGAs in NSW for the five years to 2009 in constant dollars. It is based on Tables 5 and 7.
Table 9 shows that, in all the ten LGAs, the average amounts spent by adults annually
fell but that figure rose in NSW.

Design Collaborative Pty Ltd
Local Impact Assessment Class 2 Ref: 109420 16r LIA2 The Sebel, Surry Hills G W Smith 28 Albion Street, Surry Hills, Sydney January 2011
15
h) The percentage changes in average annual expenditure per adult on egms from 2005 to 2009 are set out in Table 10 (on page 27).
i) Table 11 (on page 27) sets out average annual takings (profit) per egm in each of the 10
LGAs and in NSW in constant dollars. While those averages fell in Leichhardt, Lane Cove and Mosman, they rose in all other
areas. j) Table 12 (on page 28) sets out the characteristics of the populations and relationships in
households, listed in the Guidelines, for the 10 LGAs and NSW as recorded at the 2006 Census.
Examining each item in Table 12 in turn, those dealing with population reveal: • Percentage aged 18-24: The City and Randwick, the two LGAs with universities (and,
in the case of the City, many other higher educational establishments and hospitals) had markedly higher percentages than the other areas. In the other areas, including NSW, the percentages were similar.
• Percentage aged over 60: Conversely, the City (but not Randwick) had a much lower
percentage than the other areas. Apart from Woollahra and Mosman (which had higher percentages than NSW did) and Botany Bay (which had the same percentage as NSW), the other areas had lower percentages of those over 60 than NSW did.
• Percentage of indigenous persons: Only Botany Bay reached the NSW’s level of 2%
with the City recording 1% along with Randwick, Leichhardt and Marrickville. • Percentage that did not complete Year 12: Only Botany Bay had a higher percentage
than NSW. The City, Woollahra, Waverley, Lane Cove, North Sydney and Mosman had percentages which were less than half that for NSW.
• Percentage employed as labourers in the workforce: Botany Bay had three times the
NSW percentage and Marrickville equalled NSW. The City had half the NSW level. • Percentage in administrative and support services in the workforce: The City’s
percentage equalled the NSW percentage and most of the other LGAs had close to that level except Botany Bay where the percentage was over 250% higher.
In terms of unemployment, all of the LGAs had lower levels than NSW (6%) with the levels in the wealthier LGAs being the lowest. The City (with 5%) ranked with Randwick, Botany Bay and Marrickville. The data on relationships in households is based on the numbers of people aged 15 or over. It shows: - • Married couples: The City had just over half the percentage of married persons recorded
in NSW. In the other LGAs, the percentages were generally about the NSW percentage. • Defacto couples: The City, Waverley, Leichhardt and North Sydney had levels about
twice that in NSW with only Botany Bay and Lane Cove being at, or below, that level.

Design Collaborative Pty Ltd
Local Impact Assessment Class 2 Ref: 109420 16r LIA2 The Sebel, Surry Hills G W Smith 28 Albion Street, Surry Hills, Sydney January 2011
16
• If married and defacto couples are considered together, they accounted for 38% of the City’s households compared to 46% in NSW. Most of the other LGAs had percentages close to the NSW level with Botany Bay having the lowest (at 41%), while Marrickville (with 49%) had the highest.
• Lone parents: Botany Bay had the same level as NSW but all the other LGAs had levels
below that. • Households with child under 15: Only Botany Bay, Marrickville, Lane Cove and
Mosman approached the NSW level. The City had about a third of that level. • Households with dependant children: All LGAs except the City, Leichhardt and North
Sydney, had about the NSW level but those three had lower percentages. • Non-dependant children: The City had less than half the NSW level. Only Randwick,
Botany Bay and Marrickville had percentages close to the NSW level. • Other related individual: The City had twice the NSW level as did Randwick
(probably, again reflecting their higher educational establishments and large hospitals). • Group households: The City had over five times the NSW percentage with Woollahra,
Waverley, Randwick, Leichhardt and North Sydney also having much higher percentages than NSW.
• Lone persons: All the LGAs had higher percentages than NSW with only Marrickville
being close to that percentage. The City had two and a half times the NSW percentage followed closely by North Sydney.
• The City is distinguishable by having a population which included low proportions of
married couples, households with children and lone parents but it had high proportions of young adults, defacto couples, group households and lone persons. These characteristics are, no doubt, influenced by it being the home of a large ‘gay’ community. Nevertheless, they suggest that it may also contain groups who could exhibit higher than normal levels of susceptibility to gaming problems.
k) Table 13 (on page 29) sets out the five most frequently mentioned countries of birth as
reported in the 2006 Census for each of the 10 LGAs and NSW. • Not surprisingly, Australia was the most frequently nominated country of birth in all of
the LGAs and in NSW. In the City and Waverley, those born in Australia did not constitute the majority and, in Botany Bay, they did so by only a slender margin. All of LGAs had lower percentages of Australian-born than NSW did.
• England was the second most frequently mentioned country of birth in NSW and in all
of the LGAs except Botany Bay (where Bangladesh displaced it) and Marrickville (where Greece was ranked second by a small margin). In all the LGAs, the percentage born in England was higher than in NSW.
• In the City, China ranked as the third most frequently mentioned country of birth
followed by New Zealand and Indonesia but the top five countries only accounted for
Design Collaborative Pty Ltd
Local Impact Assessment Class 2 Ref: 109420 16r LIA2 The Sebel, Surry Hills G W Smith 28 Albion Street, Surry Hills, Sydney January 2011
17
53.2% of the countries of birth of the total population. • It is evident that all of the LGAs contain substantial proportions of persons born in many
countries. As Table 13 shows, those countries ranked fifth in each LGA accounted for – at the highest – 2.7% of the total, ie, each overseas country contributed a very small proportion of residents.
l) Table 14 (on page 29) sets out the distributions of weekly household incomes in the 10
LGAs and NSW as recorded at the 2006 Census. • Table 14 shows that, in the City and Botany Bay, there were about the same percentages
of households with incomes under $500/week (18.8% in the City and 22.7% in Botany) as in NSW (20%). In all the other LGAs, those percentages were lower with Mosman recording 8.8%, Woollahra 9% and North Sydney 9.5%.
• At the higher end of the income scale, the City recorded 42.2% earning over
$1,500/week compared to 31.2% in NSW. Mosman recorded 55.3% and Leichhardt, 53.2%. On the other hand, Botany Bay recorded 28.8% well below Marrickville, the next lowest, with 38.8%.
• Table 14 reflects the great range of wealth which occurs across households in the City.
It had the highest percentage of very low incomes, a consequence of the large public housing estates it contains in Waterloo, Surry Hills, Glebe and Woolloomooloo as well as in numerous private boarding houses and the like. While not having the highest percentage in the highest income group, it rated well above the NSW level, a consequence of it incorporating areas of marked wealth such as Elizabeth Bay, Potts Point, Pyrmont and like Harbourside areas. Low income has been linked to greater susceptibility to gambling problems.
m) Table 15 (on page 30) sets out the median incomes recorded in the 10 LGAs and NSW
in 2006. • Table 15 shows that nine of the ten LGAs had higher median incomes than NSW did
but, in Botany Bay, all the medians were slightly below the NSW levels. • In the City, the median weekly income for individuals was 56% above that in NSW but,
despite that, it ranked the fourth lowest among the 10 LGAs. • The City’s median weekly family income was 54% above that in NSW and again it
ranked the fourth lowest among the 10 LGAs but its median weekly household income was only 16% above NSW’s and it again ranked as the fourth lowest. Its low household income maybe a reflection of the smaller average number of persons per household in the City.
n) Table 16 (on page 30) sets out the SEIFA levels for the 10 LGAs. ABS did not provide
SEIFA for NSW but, in terms of the SEIFA for disadvantage, NSW level was in the range between 975 and 1000. On that basis, only Botany Bay fell below the NSW level on that index.
Among the 10 LGAs, the City was ranked towards the lower end on each of the SEIFA indices.

Design Collaborative Pty Ltd
Local Impact Assessment Class 2 Ref: 109420 16r LIA2 The Sebel, Surry Hills G W Smith 28 Albion Street, Surry Hills, Sydney January 2011
18
7. HOW MUCH OF THEIR INCOMES DID ADULTS SPEND ON EGMS? Since income data is only available from the 2006 Census, this analysis can only be made for that year. As Tables 9 and 10 show, average expenditure per adult on egms has fallen considerably in all of the 10 LGAs examined since 2006 although it has risen in NSW. Table 17 (on page 30) sets out the estimated average expenditure per adult on egms in each LGA and in NSW in 2006 as a percentage of the annual median household income reported in the 2006 Census for the respective areas. Annual median household income has been calculated by multiplying median weekly household income (as shown in Table 15) by 52. Since average expenditure of egms has fallen but – in broad terms, at least – incomes have risen between 2006 and 2010, the results shown in Table 17 overstate the current percentages. The percentage spent by adults resident in the City is much higher than for any of the other nine LGAs or for NSW. One explanation for that is that – as the largest centre of employment and shopping in NSW and as it contains the greatest concentration of the most popular entertainment venues – it attracts expenditure on egms from adults who are not residents of the LGA. The Sebel’s clientele surveyed evidence that circumstance. There is no data available by which the contribution of non-residents might be assessed. However, on the basis that the City is said to attract, on average, over half a million workers, shoppers, visitors, students and the like each weekday (ie, roughly three times its total resident population) it would not seem unreasonable to surmise that, say, half the expenditure on egms is made by non-residents. If that were the case, the percentage of income spent on egms in the City would be comparable with the percentages spent by adults in Waverley, Randwick, Botany Bay and Marrickville. That is to be expected as there are no great differences in the characteristics of the populations of those LGAs. However, none of the percentages shown on Table 17 are “correct” for two reasons – i) adults move across LGA boundaries to play egms, eg, while they are working outside
the LGA where they reside or if there is a large popular club or hotel just across the boundary such as East Leagues Club in Bondi Junction which probably attracts people living in the Woollahra LGA; and
ii) there are few households that have median household incomes. Some have much higher
incomes but an equal number have lower incomes. Thus the data in Table 17 can only be taken to be broadly indicative. It suggests that the average adult in Lane Cove, Mosman and Woollahra spend little on egms. Each of these is an LGA with high median incomes (Table 15), high SEIFA (Table 16), low densities of egms and low estimated average expenditures on egms. Their populations are well-educated with many employed in higher status occupations. Which characteristics have led to their situations? Are wealthier, better-educated, adults less interested in egms? Do they spend less on all forms of gambling or are their gambling patterns different? Whatever the reason, there appear to be some inferences that can be made for the City. The City, as an LGA, contains a population whose socio-economic status ranges from the highest to the lowest in our society. The former are those who live on or near the Harbour while the latter include some who live in places such as Redfern and Waterloo as well as the
Design Collaborative Pty Ltd
Local Impact Assessment Class 2 Ref: 109420 16r LIA2 The Sebel, Surry Hills G W Smith 28 Albion Street, Surry Hills, Sydney January 2011
19
homeless. Between those extremes, there are adults of every socio-economic status. How much of their incomes any one of them may spend is not known. It seems reasonable to assume that the majority of the adults living in the City are similar in their approaches to spending income on egms as their peers are elsewhere in NSW. That observation needs to be tempered by recognition of the City’s atypical household structure and its significant proportion of low income households. These may be associated with higher than average susceptibility to gambling problems. 8. PERCEIVED SOCIAL IMPACTS AND ECONOMIC BENEFITS An increase of two in the gmt of a hotel with an existing gmt of 15 in an area where there are, literally, hundreds of egms, is unlikely to have any perceptible positive or negative social impact. In this instance, where – if the gmt threshold increase is approved – it is envisaged that that two egm will be moved from the Macquarie Hotel to the Sebel, there is even less likelihoods of any perceptible impact. That is because the egms would be moved some 400 metres, ie, between hotels which serve similar clienteles drawn from almost the same area. At the LGA level, there would be no impact. In addition, there would be a decrease of one in the total number of egms in the City and in the number in the area close to the Sebel due to the forfeiture requirements of the legislation. The negative impact from the two additional machines being sought would be, almost wholly, confined to that on those with gambling problems or who are problem gamblers. At the outset, the licensee is not aware of anyone who plays the egms at the Sebel being a problem gambler, eg, no-one has applied to be excluded from its gaming room and his staff report that no one – at least in recent years – has enquired about assistance with a gambling problem. That is some indication that the Sebel’s present gaming clientele may not be prone to problem gambling. The addition of two egms to its gaming room is not expected to increase the numbers of adults attracted to the Sebel as a whole or to the Townhouse, in particular. What the two additional egms would do is “relieve the pressure” on its existing egms at peak times. That is to say, on Thursday and Friday afternoons and at some weekday lunchtimes, when the greater numbers of workers come to the Townhouse and want to play the egms. The 15 egms presently kept cannot meet the demand during some peak periods. The two additional egm would assist in relieving that situation. (As noted in 3(c) above, the gaming room can only accommodate two additional egms.) If there are any among the Sebel’s existing gaming clientele who have, or may be moving towards having, gambling problems, it is unlikely that the additional capacity the two egm would provide would influence them, their behaviours or their progression towards those problems. That is because, outside those peak periods, there are usually egms which are not being played. Players present outside the work-related peak periods, tend to be local residents. The characteristics of those with gambling problems are said to include that they tend to play frequently and/or for relatively long periods. While workers visiting the Townhouse regularly, may play frequently, the short periods available to workers at lunch times means that they would not be able to play for extended periods. However, some may play for longer periods after finishing work. Such players are almost certainly to play in off-peak as well as in peak periods. If they play at lunchtimes or even after work, they are likely to be among the
Design Collaborative Pty Ltd
Local Impact Assessment Class 2 Ref: 109420 16r LIA2 The Sebel, Surry Hills G W Smith 28 Albion Street, Surry Hills, Sydney January 2011
20
first to start to play and the last to stop. When they are likely to start playing, there are currently egms available to play and the addition of two more would make little difference to them accessing machines. In these circumstances, any negative effects the addition of two egms at the Sebel would appear to be very limited. Moreover, any such effects should be offset by the removal of three egms from the Macquarie Hotel, some 400 metres away. Similarly, the positive effects of the addition of two egms at the Sebel would be limited, largely, to the benefits it would afford recreational players who – at present – sometimes cannot gain access to an egm when they wish to play, particularly, during lunch times. At the same time, there appears to be no similar problem at the Macquarie Hotel (which currently has 23 egms and a gmt of 28). That is to say, the loss of three egms from the Macquarie Hotel is not likely to adversely affect the amenity of players at that hotel. Under Clause 39 (5)(a), an LIA is required to specify “details of the benefits the venue will provide”. The owner of the Sebel recognises that the Authority has a policy of requiring applicants for increases in gmt to offer to make a positive contribution to the local community. The owner is a recognised benefactor of charitable and like organisations. In this instance, it proposes to make a donation of $50,000 to the NSW University of Technology (which is based less than a kilometre from the Sebel) for educational purposes. That University serves the local community regardless of how it is defined and improvement to it will benefit that community. 9. CONSULTATION
As required by the legislation, when OLGR was requested to supply the gaming data used in this LIA on 1 September 2010, a public notice was placed in The Sydney Morning Herald and all entities required to be notified were advised of the request by letters posted on 2 September 2010. Copies of those documents form Annexure 4. The City of Sydney responded on 27 September 2010. It raised no objection to the application. A copy of its letter forms Annexure 5. Ms C Braganza of the Gambling Treatment Centre at the University of Sydney also responded. A copy of her letter is attached as Annexure 6. Subsequent telephone conversations revealed that the Centre was not opposed to the application per se. Arrangements have now been made to meet with the senior personnel of the Centre in mid-January for an exchange of ideas and research with the objective of better defining the Centre’s position, the delay being due to Ms Braganza being on extended leave and other commitments by both parties. No other entity responded.

Design Collaborative Pty Ltd
Local Impact Assessment Class 2 Ref: 109420 16r LIA2 The Sebel, Surry Hills G W Smith 28 Albion Street, Surry Hills, Sydney January 2011
21
TABLES
Table 1: Categorisation by Band of the ten LGAs together with percentage of the total population counted in the 2006 Census who were visitors to the LGA
LGA
Band
% of population at 2006 Census who were “visitors”*
Sydney 3 15.8 Woollahra 1 4.8 Waverley 2 5.2 Randwick 2 4.8 Botany Bay 2 3.5 Leichhardt 1 3.9 Marrickville 2 3.2 Lane Cove 1 4.3 North Sydney 1 6.4 Mosman 1 3.9
* visitors are defined as persons who were counted in the LGA but who lived elsewhere. Source: Casino Liquor and Gaming Control Authority and ABS.
Table 2: Numbers of entitlements authorised and egms connected to the central monitoring system in clubs at 31 May 2010 and in hotels at 30 June 2010
Hotels Clubs
Area
No. of authorised
entitlements No. egms installed Difference
No. entitlements
No. installed Difference
Sydney 3,424 3,655 231 1,748 1,216 -532 Woollahra 220 208 -12 188 169 -19 Waverley 174 218 44 858 517 -341 Randwick 293 365 72 1,354 1,290 -64 Botany Bay 167 174 7 207 200 -7 Leichhardt 423 450 27 262 64 -198 Marrickville 505 565 60 523 363 -160 Lane Cove 21 21 0 92 91 -1 North Sydney 275 301 26 469 382 -87 Mosman 32 32 0 128 120 -8 NSW 21,964 23,640 1,676 76,038 71,275 -4,763
Source: OLGR

Design Collaborative Pty Ltd
Local Impact Assessment Class 2 22 Ref: 109420 16r LIA2 The Sebel, Surry Hills G W Smith 28 Albion Street, Surry Hills, Sydney January 2011
Table 3: Numbers of egms in clubs and hotels and in total in the ten LGAs and NSW as at May (for clubs) and as at June (for hotels) 2006 to 2010
No. of egms in:
Clubs Hotels Totals
Area 2006 2007 2008 2009 2010 2006 2007 2008 2009 2010 2006 2007 2008 2009 2010
Sydney¹ 1,659 1,539 1,531 1,461 1,216 3,578 3,618 3,641 3,689 3,655 5,237 5,157 5,172 5,150 4,871
Woollahra 195 182 170 170 169 251 249 240 226 208 446 431 410 396 377
Waverley 731 727 689 671 517 223 225 224 218 218 954 952 913 889 735
Randwick 1,387 1,287 1,353 1,305 1,290 353 362 368 365 365 1,740 1,649 1,721 1,670 1,655
Botany Bay 216 215 207 209 200 172 174 174 174 174 388 389 381 383 374
Marrickville 677 641 488 408 363 571 579 575 565 565 1,248 1,220 1,063 973 928
Leichhardt 244 229 229 214 64 464 466 472 456 450 708 695 701 670 514
Lane Cove 102 102 100 94 91 21 21 21 21 21 123 123 121 115 112
North Sydney 487 456 515 400 382 337 318 320 320 301 824 774 835 720 683
Mosman 126 126 123 123 120 32 32 32 32 32 158 158 155 155 152
Totals 5,824 5,504 5,405 5,055 4,412 6,002 6,044 6,067 6,066 5,989 11,826 11,548 11,472 11,121 10,401
NSW 74,273 73,421 72,819 71,836 71,275 24,053 23,943 23,732 23,769 23,640 98,326 97,364 96,551 95,605 94,915
¹The figures for Sydney and NSW exclude the 1,500 egms installed in Star City Casino. Source: OLGR

Design Collaborative Pty Ltd
Local Impact Assessment Class 2 23 Ref: 109420 16r LIA2 The Sebel, Surry Hills G W Smith 28 Albion Street, Surry Hills, Sydney January 2011
Table 4: Total egm expenditures per quarter and annually by calendar year by LGA and in NSW from 2005 to 2009 in current dollars
LGAs NSW Year Qtr Sydney Woollahra Waverley Randwick Botany Bay Marrickville Leichhardt Lane Cove North Sydney Mosman
1 67,083,000 5,487,000 13,768,000 25,919,000 5,250,000 15,577,000 8,982,000 994,000 13,244,000 1,731,000 1,185,080,000 2 71,350,000 5,733,000 13,838,000 26,467,000 5,464,000 16,268,000 9,753,000 1,047,000 13,752,000 1,924,000 1,216,566,000 3 76,651,000 6,071,000 13,837,000 27,655,000 5,928,000 17,507,000 10,106,000 1,456,000 14,181,000 1,914,000 1,281,099,000 4 75,504,000 6,184,000 13,862,000 27,746,000 5,732,000 17,032,000 9,976,000 1,516,000 13,952,000 1,869,000 1,274,113,000
2005 Total 290,588,000 23,475,000 55,305,000 107,787,000 22,374,000 66,384,000 38,817,000 5,013,000 55,129,000 7,438,000 4,956,858,000
1 71,401,000 5,862,000 13,178,000 26,541,000 5,134,000 16,401,000 9,213,000 1,169,000 13,390,000 1,962,000 1,215,534,000 2 75,080,000 6,153,000 13,578,000 27,744,000 5,346,000 16,510,000 9,729,000 1,307,000 14,247,000 2,072,000 1,252,867,000 3 81,016,000 6,359,000 14,522,000 28,909,000 6,029,000 18,282,000 10,246,000 1,382,000 14,873,000 2,076,000 1,338,967,000 4 79,618,000 6,576,000 14,819,000 28,631,000 5,839,000 17,514,000 9,818,000 1,456,000 14,443,000 2,092,000 1,312,723,000
2006 Total 307,115,000 24,950,000 56,097,000 111,825,000 22,348,000 68,707,000 39,006,000 5,314,000 56,953,000 8,202,000 5,120,091,000
1 75,156,000 6,087,000 13,992,000 26,385,000 5,427,000 17,013,000 9,243,000 1,218,000 13,262,000 2,002,000 1,255,675,000 2 78,475,000 6,426,000 14,220,000 26,519,000 5,716,000 17,501,000 10,051,000 1,199,000 13,888,000 2,060,000 1,298,735,000 3 71,161,000 5,336,000 13,299,000 25,039,000 5,489,000 15,602,000 8,813,000 1,138,000 12,563,000 1,859,000 1,243,514,000 4 67,258,000 5,166,000 13,133,000 24,228,000 5,205,000 14,972,000 7,986,000 1,109,000 12,211,000 1,653,000 1,172,841,000
2007 Total 292,050,000 23,015,000 54,644,000 102,171,000 21,837,000 65,088,000 36,093,000 4,664,000 51,924,000 7,574,000 4,970,765,000
1 61,244,000 4,498,000 12,096,000 23,317,000 4,561,000 12,920,000 7,424,000 964,000 11,336,000 1,624,000 1,106,611,000 2 63,344,000 4,695,000 12,316,000 23,660,000 4,832,000 13,595,000 7,327,000 995,000 11,854,000 1,536,000 1,121,716,000 3 67,289,000 4,486,000 12,915,000 23,997,000 5,360,000 14,352,000 7,750,000 1,075,000 12,346,000 1,505,000 1,210,785,000 4 65,593,000 4,790,000 13,055,000 24,556,000 5,105,000 14,326,000 7,659,000 1,079,000 12,105,000 1,418,000 1,195,797,000
2008 Total 257,470,000 18,469,000 50,382,000 95,530,000 19,858,000 55,193,000 30,160,000 4,113,000 47,641,000 6,083,000 4,634,909,000
1 58,876,000 4,457,000 12,123,000 23,267,000 4,649,000 12,752,000 6,809,000 903,000 10,850,000 1,265,000 1,168,030,000 2 63,027,000 4,486,000 12,088,000 23,364,000 4,746,000 13,053,000 7,783,000 969,000 10,987,000 1,350,000 1,197,448,000 3 65,445,000 5,041,000 12,787,000 23,102,000 5,358,000 13,599,000 7,799,000 1,008,000 12,170,000 1,454,000 1,232,180,000 4 63,958,000 4,946,000 12,767,000 23,895,000 5,101,000 13,275,000 7,400,000 974,000 11,833,000 1,316,000 1,206,028,000
2009 Total 251,306,000 18,930,000 49,765,000 93,628,000 19,854,000 52,679,000 29,791,000 3,854,000 45,840,000 5,385,000 4,803,686,000 Source: OLGR
Design Collaborative Pty Ltd
Local Impact Assessment Class 2 Ref: 109420 16r LIA2 The Sebel, Surry Hills G W Smith 28 Albion Street, Surry Hills, Sydney January 2011
24
Table 5: Total egm expenditures per quarter and annually by calendar year by LGA from 2005 to 2009 in constant dollars
LGAs Year Qtr Sydney Woollahra Waverley Randwick Botany Bay Marrickville Leichhardt LaneCove North Sydney Mosman
NSW
1 60,106,000 4,916,000 12,336,000 23,223,000 4,704,000 13,957,000 8,048,000 891,000 11,867,000 1,551,000 1,061,832,000 2 63,930,000 5,137,000 12,399,000 23,715,000 4,896,000 14,576,000 8,739,000 938,000 12,322,000 1,724,000 1,090,043,000 3 68,680,000 5,440,000 12,398,000 24,779,000 5,312,000 15,686,000 9,055,000 1,305,000 12,706,000 1,715,000 1,147,865,000 4 67,652,000 5,541,000 12,420,000 24,860,000 5,136,000 15,260,000 8,939,000 1,359,000 12,501,000 1,675,000 1,141,605,000
2005 Total 260,368,000 21,034,000 49,553,000 96,577,000 20,048,000 59,479,000 34,781,000 4,493,000 49,396,000 6,665,000 4,441,345,000
1 66,417,000 5,453,000 12,259,000 24,688,000 4,776,000 15,256,000 8,570,000 1,088,000 12,455,000 1,825,000 1,130,690,000 2 69,840,000 5,723,000 12,630,000 25,808,000 4,973,000 15,358,000 9,050,000 1,216,000 13,252,000 1,927,000 1,165,417,000 3 75,361,000 5,916,000 13,508,000 26,892,000 5,608,000 17,006,000 9,531,000 1,286,000 13,835,000 1,931,000 1,245,507,000 4 74,061,000 6,117,000 13,784,000 26,633,000 5,431,000 16,291,000 9,133,000 1,354,000 13,435,000 1,946,000 1,221,095,000
2006 Total 285,679,000 23,209,000 52,181,000 104,021,000 20,788,000 63,911,000 36,284,000 4,944,000 52,977,000 7,629,000 4,762,709,000
1 71,135,000 5,761,000 13,244,000 24,973,000 5,137,000 16,103,000 8,749,000 1,153,000 12,553,000 1,895,000 1,188,497,000 2 74,276,000 6,083,000 13,459,000 25,100,000 5,410,000 16,565,000 9,513,000 1,135,000 13,145,000 1,950,000 1,229,252,000 3 67,353,000 5,051,000 12,587,000 23,699,000 5,196,000 14,768,000 8,341,000 1,077,000 11,891,000 1,760,000 1,176,986,000 4 63,660,000 4,890,000 12,430,000 22,932,000 4,927,000 14,171,000 7,559,000 1,050,000 11,558,000 1,565,000 1,110,094,000
2007 Total 276,424,000 21,785,000 51,720,000 96,704,000 20,670,000 61,607,000 34,162,000 4,415,000 49,147,000 7,170,000 4,704,829,000
1 60,436,000 4,438,000 11,936,000 23,009,000 4,497,000 12,749,000 7,326,000 951,000 11,186,000 1,602,000 1,092,004,000 2 62,508,000 4,633,000 12,153,000 23,348,000 4,764,000 13,416,000 7,231,000 981,000 11,698,000 1,516,000 1,106,909,000 3 66,401,000 4,427,000 12,745,000 23,680,000 5,285,000 14,163,000 7,648,000 1,061,000 12,183,000 1,485,000 1,194,803,000 4 64,727,000 4,727,000 12,882,000 24,232,000 5,033,000 14,137,000 7,558,000 1,064,000 11,945,000 1,400,000 1,180,012,000
2008 Total 254,072,000 18,225,000 49,716,000 94,269,000 19,579,000 54,465,000 29,763,000 4,057,000 47,012,000 6,003,000 4,573,728,000
1 58,876,000 4,457,000 12,123,000 23,267,000 4,649,000 12,752,000 6,809,000 903,000 10,850,000 1,265,000 1,168,030,000 2 63,027,000 4,486,000 12,088,000 23,364,000 4,746,000 13,053,000 7,783,000 969,000 10,987,000 1,350,000 1,197,448,000 3 65,445,000 5,041,000 12,787,000 23,102,000 5,358,000 13,599,000 7,799,000 1,008,000 12,170,000 1,454,000 1,232,180,000 4 63,958,000 4,946,000 12,767,000 23,895,000 5,101,000 13,275,000 7,400,000 974,000 11,833,000 1,316,000 1,206,028,000
2009 Total 251,306,000 18,930,000 49,765,000 93,628,000 19,854,000 52,679,000 29,791,000 3,854,000 45,840,000 5,385,000 4,803,686,000

Design Collaborative Pty Ltd
Local Impact Assessment Class 2 Ref: 109420 16r LIA2 The Sebel, Surry Hills G W Smith 28 Albion Street, Surry Hills, Sydney January 2011
25
Table 6: Total expenditure on egms per annum over the five calendar years from 2005 to 2009
Total egm expenditure by LGA (Constant $2009)
Area 2005 2006 2007 2008 2009
Sydney 260,368,000 285,679,000 276,424,000 254,072,000 251,306,000
Woollahra 21,034,000 23,209,000 21,785,000 18,225,000 18,930,000
Waverley 49,553,000 52,181,000 51,720,000 49,716,000 49,765,000
Randwick 96,577,000 104,021,000 96,704,000 94,269,000 93,628,000
Botany Bay 20,048,000 20,788,000 20,670,000 19,579,000 19,854,000
Marrickville 59,479,000 63,911,000 61,607,000 54,465,000 52,679,000
Leichhardt 34,781,000 36,284,000 34,162,000 29,763,000 29,791,000
Lane Cove 4,493,000 4,944,000 4,415,000 4,057,000 3,854,000
North Sydney 49,396,000 52,977,000 49,147,000 47,012,000 45,840,000
Mosman 6,665,000 7,629,000 7,170,000 6,003,000 5,385,000
Total 602,394,000 651,623,000 623,804,000 577,161,000 571,032,000
NSW 4,441,345,000 4,762,709,000 4,704,829,000 4,573,728,000 4,803,686,000
Table 7: Adult populations and estimated adult populations* by LGA at the 2001 Census,
2006 Census and the ABS’s estimated adult populations for 2005, 2006 and 2007 and projections thereof
Area
2001 Census
2006 Census 2005 2006 2007 2008 2009 2010
Sydney 102,640 142,953 145,581 151,696 155,480 159,000 162,500 166,000
Woollahra 41,697 41,142 43,987 44,113 44,211 44,300 44,400 44,500
Waverley 49,610 50,594 53,671 54,323 54,862 55,400 55,900 56,400
Randwick 97,942 99,111 104,132 104,693 105,818 106,900 108,000 109,100
Botany Bay 27,633 28,173 29,503 29,642 29,830 30,000 30,200 30,400
Marrickville 60,604 60,185 63,179 63,612 64,145 64,600 65,150 65,700
Leichhardt 52,041 40,783 43,274 43,379 43,800 44,150 44,500 45,000
Lane Cove 23,932 23,677 25,029 24,870 24,918 24,960 25,000 25,000
North Sydney 48,703 51,649 54,530 55,123 55,357 55,600 55,900 56,200
Mosman 20,782 20,885 22,239 22,244 22,318 22,400 22,500 22,600
Total 525,584 559,152 585,125 593,695 600,739 607,310 614,050 620,900
*Adult population is the population aged 18 years and over. Sources: ABS, OLGR and DC.

Design Collaborative Pty Ltd
Local Impact Assessment Class 2 Ref: 109420 16r LIA2 The Sebel, Surry Hills G W Smith 28 Albion Street, Surry Hills, Sydney January 2011
26
Table 8: EGM densities (number of egms per 1000 adults) by LGA for the last five years (as at May/June each year)
No. of egms per 1000 adults Area 2006 2007 2008 2009 2010 Sydney 34 33 33 33 31 Woollahra 10 10 9 9 9 Waverley 18 17 17 16 13 Randwick 16 16 16 16 16 Botany Bay 13 13 13 13 12 Marrickville 20 19 17 15 15 Leichhardt 16 16 16 15 12 Lane Cove 5 5 5 5 4 North Sydney 15 14 15 13 12 Mosman 7 7 7 7 7 NSW 19 18 18 18 18
Table 8A: Egm densities by LGA for the years 2008, 2009 and 2010 based on Tables 3 and 7
No. of egms per 1000 adults Area 2008 2009 2010 Sydney 33 32 29 Woollahra 9 9 8 Waverly 17 16 13 Randwick 16 15 15 Botany Bay 13 13 12 Marrickville 16 15 14 Leichhardt 16 15 11 Lane Cove 5 5 5 North Sydney 15 13 12 Mosman 7 7 7
Table 9: Estimated average annual expenditure per adult on egms (constant $2009)*
Average Annual Expenditure per adult in constant dollars ($2009) Area 2,005 2,006 2,007 2,008 2,009 Sydney 1,788 1,883 1,778 1,634 1,616 Woollahra 478 526 469 412 426 Waverley 923 961 943 906 847 Botany Bay 680 701 693 653 657 Randwick 927 994 914 891 885 Marrickville 941 1,005 960 772 821 Leichhardt 804 836 780 680 680 Lane Cove 179 199 177 163 155 North Sydney 906 961 888 849 832 Mosman 300 343 321 269 241 NSW 862 915 892 867 911
* As the adult populations between 2006 and 2009 are estimates, there is the potential for the expenditures shown for those years to be imprecise.

Design Collaborative Pty Ltd
Local Impact Assessment Class 2 Ref: 109420 16r LIA2 The Sebel, Surry Hills G W Smith 28 Albion Street, Surry Hills, Sydney January 2011
27
Table 10: Percentages change in average annual expenditure per adult on egms by LGA, 2005 to 2009
Area % Sydney (-) 9.6 Woollahra (-) 10.9 Waverley (-) 8.2 Randwick (-) 4.5 Botany Bay (-) 3.3 Marrickville (-) 12.8 Leichhardt (-) 15.6 Lane Cove (-) 13.4 North Sydney (-) 8.2 Mosman (-) 19.7 NSW (+) 5.7
Table 11: Average annual expenditure per EGM by LGA, 2005-2009 (constant $2009)
Average Annual Expenditure per EGM in constant dollars ($2009)
Area 2005 2006 2007 2008 2009 Sydney 48,443 54,615 53,307 48,999 49,300
Woollahra 46,561 52,243 48,468 44,752 48,160
Waverley 50,746 54,755 55,198 54,483 54,973
Randwick 54,325 59,730 58,300 55,517 56,284
Botany Bay 51,635 53,647 53,687 51,431 52,421
Marrickville 44,881 51,355 50,873 46,884 53,536
Leichhardt 46,780 51,284 48,750 43,465 44,413
Lane Cove 36,745 39,950 35,825 33,544 33,944
North Sydney 59,442 65,343 61,394 57,209 65,490
Mosman 42,178 48,289 45,592 38,728 34,913
NSW 44,967 48,512 48,289 47,417 50,312

Design Collaborative Pty Ltd
Local Impact Assessment Class 2 Ref: 109420 16r LIA2 The Sebel, Surry Hills G W Smith 28 Albion Street, Surry Hills, Sydney January 2011
28
Table 12: Selected characteristics of the populations of LGAs and NSW at the 2006 Census (Percentages rounded to the nearest whole number)
LGA
Characteristic Sydney Woollahra Waverley Randwick Botany Bay Marrickville Leichhardt Lane Cove North
Sydney Mosman NSW Total Resident Population 157,874 % 50,490 % 61,212 % 121,036 % 35,993 % 72,256 % 49,057 % 30,553 % 58,580 % 26,390 % 6,528,689 % No. of persons aged: 18-24 25,503 16 3,852 8 4,986 8 15,829 13 3,371 9 6,932 10 3,474 7 2,485 8 5,161 9 1,776 7 601,454 9 No. of persons aged: 60 years and over 18,106 11 10,786 21 10,332 17 20,878 17 6,937 19 10,348 14 6,776 14 5,437 18 9,954 17 5,566 21 1,223,400 19 No. of persons of indigenous origin 1,981 1 99 0 195 0 1,474 1 632 2 1,078 1 409 1 62 0 110 0 26 0 138,507 2 No. of persons who did not complete Year 12 in High School 23,450 15 7,039 14 10,207 17 28,361 23 2,312 42 19,048 26 10,244 21 5,668 19 8,562 15 4,259 16 2,487,712 38 No. of persons employed as : Labourers 3,320 2 448 1 1,140 2 3,166 3 1,910 12 2,621 4 870 2 476 2 723 1 256 1 277,549 4 No. of persons employed as: Administrative and support services 10,859 7 3,201 6 3,938 6 9,518 8 3,011 18 5,927 8 3,832 8 2,418 8 5,127 9 1,823 7 447,950 7 Percentage of the population aged 15 or over unemployed 4,311 5 710 3 1,083 4 2,763 5 936 5 2,035 5 939 3 485 3 1,065 3 358 3 183,157 6 Relationship in Household Husband or wife in registered marriage 24,528 22 15,475 37 16,143 33 35,806 34 13,110 36 25,224 42 14,165 33 11,258 41 16,578 33 9,628 41 2,394,428 40 Partner in de facto marriage 18,318 16 3,878 9 5,361 11 8,505 8 1,677 5 4,155 7 6,021 14 1,700 6 6,541 13 1,666 7 364,903 6 Lone parent 3,350 3 1,331 3 1,705 4 4,399 4 1,745 5 2,151 4 1,609 4 865 3 1,448 3 682 3 275,800 5 Child under 15 8,046 7 6,013 14 7,134 14 15,639 15 6,057 17 9,948 17 6,351 15 5,059 19 4,905 10 4,188 18 1,215,947 20 Dependent student (15-24 years) 2,158 2 2,075 5 1,998 4 4,565 4 1,552 4 2,910 5 1,324 3 1,576 6 1,402 3 1,392 6 303,887 5 Non-dependent child) 3,100 3 1,699 4 2,087 4 6,436 6 2,888 8 4,220 7 1,819 4 1,305 5 1,501 3 882 4 414,436 7 Other related individual 4,185 4 782 2 1,082 2 3,875 4 1,215 3 1,656 3 1,009 2 638 2 1,250 3 312 1 136,365 2 Unrelated individual living in family household 2,344 2 304 1 491 1 1,319 1 328 1 492 1 419 1 195 1 383 1 116 1 50,002 1 Group household member 18,548 16 2,834 7 4,583 9 9,194 9 1,139 3 2,466 4 3,184 7 1,103 4 4,289 9 673 3 180,733 3 Lone person 25,451 23 6,775 16 7,776 16 13,211 13 3,424 10 6,038 10 6,526 15 3,296 12 10,804 22 3,540 15 571,653 9 Visitor (from within Australia) 2,997 3 742 2 1,095 2 1,888 2 435 1 874 2 918 405 2 950 2 382 2 119,515 2
Source: 2006 Census

Design Collaborative Pty Ltd
Local Impact Assessment Class 2 29 Ref: 109420 16r LIA2 The Sebel, Surry Hills G W Smith 28 Albion Street, Surry Hills, Sydney January 2011
Table 13: The five most-common countries of birth in the ten LGAs and NSW from 2006 Census Ranking in Percentages of total enumerated population
1 2 3 4 5 LGA Country % Country % Country % Country % Country % Sydney Australia 40.5 England 4.2 China 3.5 New Zealand 3.0 Indonesia 2.0 Woollahra Australia 55.9 England 6.2 South Africa 3.4 New Zealand 2.8 USA 1.4 Waverley Australia 48.3 England 5.7 South Africa 4.0 New Zealand 3.0 Ireland 1.3 Randwick Australia 54.7 England 4.1 China 2.9 New Zealand 2.3 Indonesia 2.2 Botany Bay Australia 50.5 Bangladesh 3.0 Greece 2.8 New Zealand 2.6 China 2.5 Marrickville Australia 55.3 Greece 3.6 England 3.4 Vietnam 3.3 New Zealand 2.7 Leichhardt Australia 63.8 England 6.9 New Zealand 3.3 Italy 2.1 Ireland 0.9 Lane Cove Australia 63.1 England 4.8 New Zealand 2.5 China 2.3 India 1.4 North Sydney Australia 55.4 England 6.8 New Zealand 3.6 Japan 1.9 China 1.7 Mosman Australia 62.2 England 8.8 New Zealand 3.0 USA 1.8 South Africa 1.6 NSW Australia 69.0 England 3.2 China 1.7 New Zealand 1.6 Vietnam 0.9
Source: 2006 Census Table 14: Weekly household income distribution by LGA and NSW at the 2006 Census
LGAs Income range in $2006
Sydney
%
Woollahra
%
Waverley
%
Randwick
%
Botany Bay
%
Marrickville
%
Leichhardt
%
Lane Cove
%
North Sydney
%
Mosman
%
NSW %
<$249 11.4 4.6 6.5 9.1 10.7 7.0 6.1 4.7 5.0 4.5 7.9 250-499 7.4 4.4 6.9 8.6 12.0 9.0 6.4 5.7 4.5 4.3 12.1 500-799 11.4 9.3 11.9 12.3 14.8 13.6 9.5 9.9 9.5 9.6 16.0 800-999 6.0 5.0 5.7 6.0 6.9 7.1 4.8 4.8 5.4 5.3 6.5
1,000-1,399 12.1 9.6 11.9 12.9 15.3 28.1 10.5 11.4 11.4 10.2 15.0 1,400-1,999 14.1 12.2 13.4 13.8 12.8 15.1 13.9 14.4 15.6 12.7 13.1
>$2,000 28.1 41.8 31.6 25.8 16.0 23.7 39.3 38.0 39.5 42.6 18.1 Partial income stated / All incomes not stated 9.7 13.1 12.2 11.4
11.7 10.0 9.7 10.9 9.0 11.2 11.2
Source: 2006 Census

Design Collaborative Pty Ltd
Local Impact Assessment Class 2 30 Ref: 109420 16r LIA2 The Sebel, Surry Hills G W Smith 28 Albion Street, Surry Hills, Sydney January 2011
Table 15: Median incomes in the LGAs and NSW from 2006 Census (in 2006 dollars)
Median weekly income of: LGA Individuals Families Households Sydney 717 1,819 1,204 Woollahra 976 2,654 1,917 Waverley 765 1,928 1,446 Randwick 593 1,579 1,185 Botany Bay 453 1,166 995 Marrickville 595 1,460 1,160 Leichhardt 895 2,307 1,733 Lane Cove 811 2,295 1,729 North Sydney 1,010 2,510 1,772 Mosman 969 2,675 1,916 NSW 461 1,181 1,036
Source: 2006 Census Table 16: SEIFAs for the ten LGAs (2006 Census)
SEIFA Advantage and Disadvantage Economic Education & Sydney 1111 (7)* 1027 (8)* 976 (10)* 1160 (7)* Woollahra 1191 (2) 1122 (2) 1116 (2) 1208 (3) Waverley 1145 (6) 1082 (6) 1062 (6) 1164 (6) Randwick 1100 (8) 1045 (7) 1036 (7) 1110 (8) Botany Bay 987 (10) 962 (10) 977 (9) 962 (10) Marrickville 1065 (9) 1007 (9) 998 (8) 1092 (9) Leichhardt 1149 (5) 1083 (5) 1070 (5) 1176 (5) Lane Cove 1173 (4) 1117 (3) 1108 (3) 1188 (4) North Sydney 1184 (3) 1114 (4) 1073 (4) 1217 (1) Mosman 1198 (1) 1130 (1) 1128 (1) 1213 (2)
* The numbers in parenthesis give the rankings of each LGA in the column. Source: ABS Table 17: Estimated average annual expenditure per adult on egms in 2006 as a percentage
of the annual median household income for each LGA and NSW
LGA % Sydney 3.23 Woollahra 0.57 Waverley 1.37 Randwick 1.73 Botany Bay 1.46 Marrickville 1.79 Leichhardt 1.00 Lane Cove 0.24 North Sydney 1.12 Mosman 0.37 NSW 1.83


![26-28 June 2012 Sebel Hotel Albert Park, Melbourneeprints.usq.edu.au/22133/4/1Conference2012-ebook-final_20-June[1].pdfClimate Adaptation in Action 2012 Sharing knowledge to adapt](https://static.fdocuments.net/doc/165x107/5ffcb0b905126646e0130785/26-28-june-2012-sebel-hotel-albert-park-1pdf-climate-adaptation-in-action-2012.jpg)