Design and Validation of a Tool for Neurite Tracing and … · Design and Validation of a Tool for...
14
Design and Validation of a Tool for Neurite Tracing and Analysis in Fluorescence Microscopy Images E. Meijering, M. Jacob, J.-C. F. Sarria, P. Steiner, H. Hirling,M. Unser Cytometry, vol. 58A, no. 2, April 2004, pp. 167-176 Background: For the investigation of the molecular mechanisms involved in neurite outgrowth and differentiation, accurate and reproducible segmentation and quantification of neuronal processes is a prerequisite. To facilitate this task, we developed a semiautomatic neurite tracing technique. This paper describes the design and validation of the technique. Methods: The technique was compared to fully manual delineation. Four observers repeatedly traced selected neurites in 20 fluorescence microscopy images of cells in culture, using both methods. Ac- curacy and reproducibility were determined by comparing the tracings to high-resolution reference tracings, using two error measures. Labor intensiveness was measured in numbers of mouse clicks re- quired. The significance of the results was determined by a Student t-test and by analysis of variance. Results: Both methods slightly underestimated the true neurite length, but the differences were not unanimously significant. The average deviation from the true neurite centerline was a factor 2.6 smaller with the developed technique compared to fully manual tracing. Intraobserver variability in the respec- tive measures was reduced by a factor 6.0 and 23.2. Interobserver variability was reduced by a factor 2.4 and 8.8, respectively, and labor intensiveness by a factor 3.3. Conclusions: Providing similar accuracy in measuring neurite length, significantly improved accuracy in neurite centerline extraction, and significantly improved reproducibility and reduced labor intensive- ness, the developed technique may replace fully manual tracing methods. Keywords: Cell culture, neurite outgrowth, fluorescence microscopy, neurite tracing, interactive seg- mentation, pattern recognition, computer-assisted image analysis, software validation. INTRODUCTION The development of the nervous system is an intricate process involving many different factors (1). The molecular mechanisms regulating neurite outgrowth, differentiation, synapse formation and plasticity are still being vigorously studied. In order to cope with the ever increasing amount of image data gen- erated for such studies, accurate and user-friendly image analysis tools are indispensable. Of particular importance is the ability, prior to morphometric analysis, to make accurate representations of the neu- ronal processes present in the images. Early attempts to automate this task were not very successful, and since then neurite tracing has been done primarily by the labor-intensive process of manual delin- eation (2). In the past decade, despite the considerable progress in computer technology, only a handful of renewed efforts towards automated neurite tracing have been published. Notable techniques devel- oped recently are those based on vectorial tracking (3)—reminiscent of earlier techniques for tracing chromosomes (4), or retinal vasculature (5)—and multiscale feature analysis (6). Both techniques were developed for application to 3D confocal microscopy image stacks. In this paper we are concerned with the problem of accurately detecting and tracing individual neu- rites in 2D fluorescence microscopy images of cells in culture. Whereas the computational cost of digital image processing techniques for this task can be expected to be smaller in 2D than in 3D, from a morpho- logical perspective the problem is in fact more complicated. The reason for this, inherent to 2D imaging
Transcript of Design and Validation of a Tool for Neurite Tracing and … · Design and Validation of a Tool for...
Design and Validation of a Tool for Neurite Tracingand Analysis in Fluorescence Microscopy Images
E. Meijering, M. Jacob, J.-C. F. Sarria, P. Steiner, H. Hirling, M. Unser
Cytometry, vol. 58A, no. 2, April 2004, pp. 167-176
Background: For the investigation of the molecular mechanisms involved in neurite outgrowth anddifferentiation, accurate and reproducible segmentation and quantification of neuronal processes is aprerequisite. To facilitate this task, we developed a semiautomatic neurite tracing technique. Thispaper describes the design and validation of the technique.
Methods: The technique was compared to fully manual delineation. Four observers repeatedly tracedselected neurites in 20 fluorescence microscopy images of cells in culture, using both methods. Ac-curacy and reproducibility were determined by comparing the tracings to high-resolution referencetracings, using two error measures. Labor intensiveness was measured in numbers of mouse clicks re-quired. The significance of the results was determined by a Student t-test and by analysis of variance.
Results: Both methods slightly underestimated the true neurite length, but the differences were notunanimously significant. The average deviation from the true neurite centerline was a factor 2.6 smallerwith the developed technique compared to fully manual tracing. Intraobserver variability in the respec-tive measures was reduced by a factor 6.0 and 23.2. Interobserver variability was reduced by a factor2.4 and 8.8, respectively, and labor intensiveness by a factor 3.3.
Conclusions: Providing similar accuracy in measuring neurite length, significantly improved accuracyin neurite centerline extraction, and significantly improved reproducibility and reduced labor intensive-ness, the developed technique may replace fully manual tracing methods.
Keywords: Cell culture, neurite outgrowth, fluorescence microscopy, neurite tracing, interactive seg-mentation, pattern recognition, computer-assisted image analysis, software validation.
INTRODUCTION
The development of the nervous system is an intricate process involving many different factors (1). Themolecular mechanisms regulating neurite outgrowth, differentiation, synapse formation and plasticityare still being vigorously studied. In order to cope with the ever increasing amount of image data gen-erated for such studies, accurate and user-friendly image analysis tools are indispensable. Of particularimportance is the ability, prior to morphometric analysis, to make accurate representations of the neu-ronal processes present in the images. Early attempts to automate this task were not very successful,and since then neurite tracing has been done primarily by the labor-intensive process of manual delin-eation (2). In the past decade, despite the considerable progress in computer technology, only a handfulof renewed efforts towards automated neurite tracing have been published. Notable techniques devel-oped recently are those based on vectorial tracking (3)—reminiscent of earlier techniques for tracingchromosomes (4), or retinal vasculature (5)—and multiscale feature analysis (6). Both techniques weredeveloped for application to 3D confocal microscopy image stacks.
In this paper we are concerned with the problem of accurately detecting and tracing individual neu-rites in 2D fluorescence microscopy images of cells in culture. Whereas the computational cost of digitalimage processing techniques for this task can be expected to be smaller in 2D than in 3D, from a morpho-logical perspective the problem is in fact more complicated. The reason for this, inherent to 2D imaging
A TOOL FOR NEURITE TRACING AND ANALYSIS 2
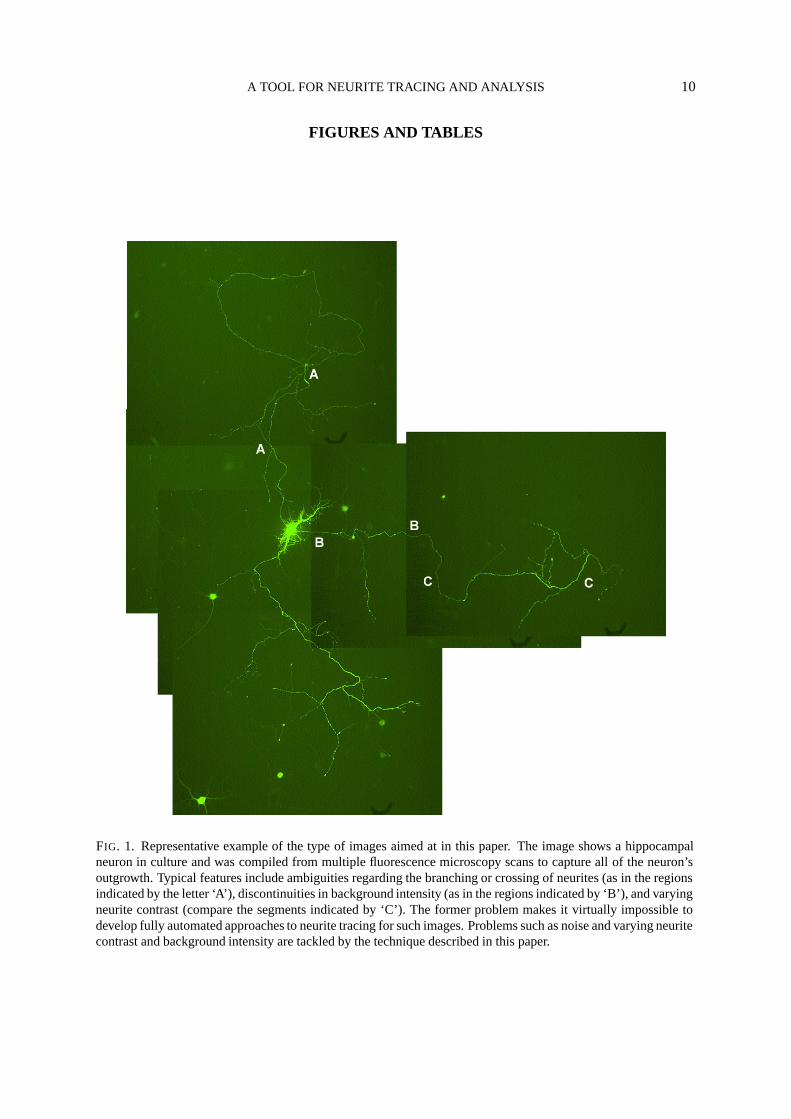
of 3D structures, is that the images may contain ambiguities regarding the branching or crossing of neu-rites. In addition, the neurites may sometimes be out of focus, have very low contrast, or even containlarge gaps. And when composed of several scans to increase the field of view, the images may show dis-continuities in background intensity, as illustrated in Fig. 1. It is clear that automated procedures basedon intensity thresholding and skeletonization (7–10) would fail to yield correct results for such images.Several authors have abandoned tracing altogether and have resorted to heuristic approaches to estimatethe morphometric features of interest (11–13). An alternative, vectorial-tracking technique, publishedjust before completion of our paper, was successfully applied to images of retinal explants (14), but doesnot address the just mentioned problems seen in our type of images.
Because of the complexity of the problem it is not surprising that in practice nothing much haschanged since the early days, as our recent literature survey revealed. A search in the PubMed database(National Library of Medicine, Bethesda, MD) for papers published from 2001 till present containing,in the title, the keyword ‘outgrowth’ combined with any of ‘neuron’, ‘neurite’, ‘axon’, ‘dendrite’, ortheir adjectives, yielded 190 responses. Of these 190 papers we studied 102 that were electronicallyaccessible through our library and in which it was stated explicitly that neurite length was measured. In64 of these, no details whatsoever were given as to how the measurements were carried out or what imageanalysis tools were used, and it seems reasonable to suspect that neurites were traced fully manually. In20 cases, use was made of commercial image analysis software tools—in total, 10 different tools werementioned. In the remaining 18 cases, use was made of personally developed or public domain imageanalysis software, with NIH-Image (National Institutes of Health, Bethesda, MD) and its variants beingby far most popular. To our knowledge, none of the reported software tools, whether commercial or not,provides an automated and scientifically validated neurite tracing facility.
Based on this observation and our own experiences with the burden and poor reproducibility offully manual approaches, we conclude that there is still a great need for image analysis tools facilitatingneurite tracing and possibly leading to more accurate and more consistent measurements. It will beclear, from what has just been said, that the design of fully automated techniques for our purpose willremain a difficult problem and it seems likely that some form of user interaction will always be requiredto resolve ambiguities. Accepting this fact and attempting to meet at least part of the needs, we havedeveloped an interactive neurite tracing technique. It exploits the expertise of the user in resolvingambiguities but greatly simplifies the task of tracing long stretches of manifest neurites. In this paperwe describe the design of our technique and present the results of validation experiments revealingthe potential improvement in accuracy and reproducibility and the reduction in user interaction of thetechnique compared to fully manual delineation.
MATERIALS AND METHODS
Tracing Technique
Neurite tracing using our technique consists of (i) a detection phase, in which every individual pixelin the image is assigned a value indicating its likelihood of belonging to a neurite, and (ii) the actualtracing phase, in which consecutive pixels that are most likely to represent the centerlines of the neuritesare linked together to constitute the tracings. The former is a preprocessing step and is carried out fullyautomatically, the latter requires user interaction. Here we outline the respective algorithms developedfor performing the two tasks. Details are given in the Appendix.
Our approach to detection is based on the observation that in fluorescence microscopy images, neu-rites are bright, elongated structures superimposed on a dark, noisy background. When representingimages as gray-level landscapes, such structures manifest themselves as ridges. It is known (15–18) thatridge-like image structures are well detected by means of second-order differential operators. Specifi-cally, the local principal ridge directions at any point in an image are given by the eigenvectors of thesecond-derivative matrix computed from the intensity values around that point. Due to the symmetry ofthis matrix, the eigenvectors are orthogonal, with the eigenvector corresponding to the smaller absolute
A TOOL FOR NEURITE TRACING AND ANALYSIS 3
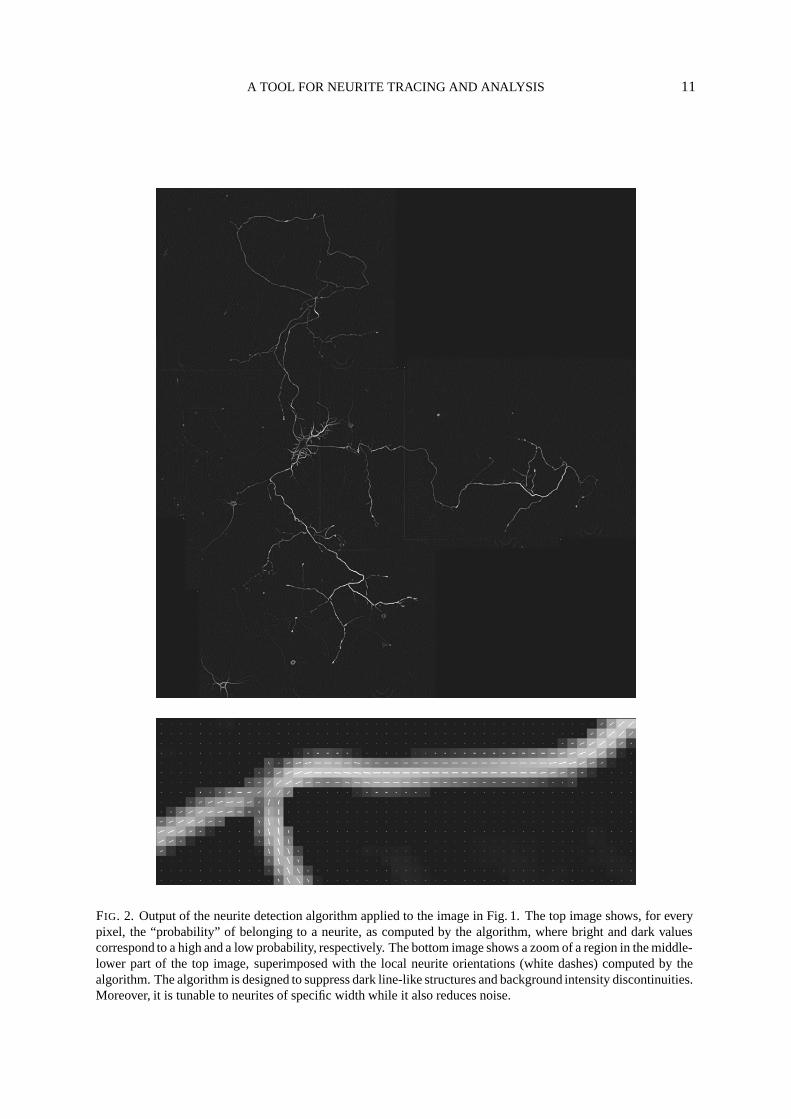
eigenvalue pointing in the longitudinal direction of the ridge. Comparing the eigenvalue magnitudes,the algorithm computes for each pixel in the image a measure of “neuriteness”. In addition, it storesfor each pixel the local ridge orientation as indicated by the mentioned eigenvector. The output of thisdetector when applied to the image in Fig. 1 is shown in Fig. 2.
Our approach to linking of consecutive ridge pixels derives from the so-called live-wire segmentationparadigm (19–22). It consists in the selection of a starting point by the user followed by the applicationof a search algorithm to find the optimal paths from that point to all other points in the image, where‘optimal’ means having a globally minimal cumulative cost according to a predefined function. Oncecomputed and stored, the paths can be displayed in real time as the user moves the cursor towards theend of the neurite of interest, until the presented path starts to deviate too much from what is consideredthe optimal tracing by the user. The tracing can then be fixed up to that point by a single mouse click,after which the algorithm proceeds by presenting optimal paths from that point. The process is iterateduntil the entire neurite has been traced and can be repeated to trace multiple neurites. In cases where theuser is not completely satisfied with the paths presented, which may sometimes occur in regions withvery low neurite contrast, it is possible to switch to manual delineation.
Cell Images
The images used for the validation of our neurite tracing technique were taken from a previously pub-lished study (23) into the involvement of the neuronal sec1, or murine unc18a (nSec1/Munc18a) proteinin neurite formation. In brief, this study was carried out in culture by overexpression of nSec1/Munc18aand of Munc18b in PC12 cells followed by nerve growth factor differentiation, and in primary hippocam-pal neurons prepared from postnatal day-zero rats. For details regarding the experimental procedures werefer to the mentioned paper. Fluorescence images of the cells after immunostaining for the transfectedproteins (in the case of GFP-tagged proteins, their intrinsic fluorescence was used) were acquired byusing a 10× objective on an Axioplan microscope (Carl Zeiss, Germany) in combination with a DC100digital camera (Leica Microsystems, Germany). For many cells, to increase the field of view, multipleimages were taken to capture all of the cell’s outgrowth. In these cases, composite images were createdby matching the individual images visually, using Photoshop (Adobe Systems Inc., San Jose, CA). Fromthe total of about 170 cell images, we selected, prior to our validation experiments, 20 representativesample images, one of which is shown in Fig. 1. Per image we selected a single neurite or neurite seg-ment of interest. The neurites were chosen to include all potential sources of tracing errors, such asvarying noise and contrast, background intensity discontinuities, and complexities in shape.
Validation Setup
The neurite tracing technique was implemented in the Java programming language (Sun MicrosystemsInc., Santa Clara, CA) in the form of a plugin for ImageJ (National Institutes of Health, Bethesda, MD),the computer-platform independent public domain image analysis program inspired by NIH-Image. Af-ter initial, visual experimentation with the technique applied to a small number of cell images, notincluded in the sample set used for the validation, the different parameters of the detection and tracingalgorithms were fixed to the values given in Table 1. As a representative instance of the fully manualtracing methods encountered in the literature we used the “segmented line selections” tool of ImageJ.Similar to our semiautomatic technique, this tracing tool requires indicating points on the neurite ofinterest. Contrary to our technique, however, the points are connected simply by straight lines.
Four observers (two expert cell biologists and two expert computer scientists) participated in thevalidation experiments, which consisted of three sessions. The sessions were carried out separately andindependently by the four observers. In the first session the observers traced the neurites of interest bymeans of the usual fully manual method. The start and end positions of the neurites were indicated bycrosshair pointers, the coordinates of which were loaded automatically along with the images. Uponcompletion, the tracings were stored automatically along with information on the amount of user inter-
A TOOL FOR NEURITE TRACING AND ANALYSIS 4
action required. The session was carried out three times to allow for variability analyses. In the secondsession, also carried out in triple, the observers repeated the experiments, but now using the describedsemiautomatic neurite tracing technique. For both sessions, the observers were asked to minimize userinteraction, as measured by the number of mouse clicks, while at the same time attaining a sufficientdegree of tracing accuracy, according to their own visual judgment.
In order to obtain accurate reference tracings, required for the quantitative analyses described here-after, high-resolution versions of the original images were generated by scaling up with a factor of 10using a high-quality interpolation method: cubic spline interpolation (24, 25). In the third session, theobservers were asked to perform fully manual tracing once again to delineate the neurites of interest inthese high-resolution images. The motto for this session was to be as accurate as possible, regardless ofthe amount of interaction required. After completion of this session the resulting tracings were mappedback to the original images to yield reference tracings with a precision of 1/10th of a pixel. It will beclear that this approach to neurite tracing is infeasible in practice due to the 100-fold increase in therequired storage capacity as well as a substantial increase in user interaction. For this study, however,the extra efforts allowed us to obtain very precise reference tracings, which we believe may reliably betaken as the “gold standard” in the quantitative analyses.
Quantitative Analyses
The accuracy of the tracings from the first two sessions was determined by comparison with the corre-sponding reference tracings from the third session, using two different error measures. As a first measurewe used the difference in length between the tracing and the actual neurite, as given by the referencetracing, divided by the length of the latter. A value larger or smaller than zero for this ratio indicates,respectively, an over- or underestimation of the true length. While relevant for studies measuring neuritelength only, this measure does not, however, give an indication of how well the tracings really follow theneurite, since any two tracings may have the same length and yet be completely different. As a second,complementary measure, therefore, we used the average deviation of the tracing from the neurite, asgiven by the reference tracing, over the full length. Specifically, this measure was computed by addingthe areas spanned by the segments of the tracing and the reference tracing between any two subsequentintersections of the tracings, and dividing by the length of the reference tracing.
For each of the 480 tracings (4 observers × 2 sessions × 3 rounds × 20 neurites), the values forthe two error measures were computed by comparing the tracing to each of the observers’ referencetracing for the corresponding neurite. For each of the two measures, the resulting four error values wereaveraged to yield a consensus error. The variability in the consensus errors was computed both perobserver and between observers. Denoting by ε(o, s, r, n) the consensus error (either length differenceratio, εL, or average deviation, εD) for any observer (o), session (s), round (r), and neurite (n), wecomputed the intraobserver variability from the three rounds as
VARεintra(o, s, n) =
13
3∑
i=1
3∑
j=i+1
|ε(o, s, ri, n) − ε(o, s, rj , n)|.
The interobserver variability was computed by comparing the consensus errors (again, either lengthdifference ratios or average deviations) from the three rounds of all four observers as
VARεinter(s, n) =
154
4∑
k=1
4∑
l=k+1
3∑
i=1
3∑
j=1
|ε(ok, s, ri, n) − ε(ol, s, rj , n)|.
The labor intensiveness of semiautomatic versus fully manual tracing was analyzed by comparing thenumber of mouse clicks required per tracing.
A TOOL FOR NEURITE TRACING AND ANALYSIS 5
Finally, the statistical significance of the outcome of each comparison of the two techniques wasdetermined by means of a two-sided paired Student t-test (26). Specifically, for each of the measuresseparately, the test was applied to the corresponding 20 pairs of figures resulting from the 20 neurites(n) traced in each of the two sessions (s). Except for the interobserver variability, which combines theeffects of all observers, the test was carried out separately for each observer (o). For the accuracy andlabor intensiveness measures, the figures per neurite were first averaged over the three rounds (r). Thenull hypothesis for the test was that the two techniques would give similar results. The probability ofthis hypothesis being true was analyzed at levels p < 0.05, p < 0.01, and p < 0.001. In order toassess the overall significance of the different factors involved, we applied a full-factorial univariateanalysis of variance (ANOVA), with ‘sessions’ as fixed factor (corresponding to the two techniquesbeing compared) and ‘observers’, ‘rounds’, and ‘neurites’ as random factors. The analyses were carriedout using the statistical software package SPSS (SPSS Inc., Chicago, IL).
RESULTS
The results of the validation experiments are presented graphically in Fig. 3. The graphs show, for eachmeasure of comparison and for each of the observers, the full range and the mean of the observed values,as well as the statistical significance of the differences between the results of fully manual tracing and oursemiautomatic tracing technique according to the paired t-test. From the results with the length differ-ence ratio measure, shown in the top-left graph, it follows that both techniques tend to underestimate thetrue neurite length—our semiautomatic technique even slightly more so than the fully manual method.Averaging over all observers, we found that the deviation from the true length was about −1.0% for thefully manual method and about −1.5% for our semiautomatic technique. The differences between thetwo techniques were, however, not unanimously significant, which suggests that overall, our techniqueperforms comparable to fully manual tracing when it comes to measuring lengths only. Indeed, the re-sults of ANOVA indicated that the factor ‘sessions’ was not significant (p > 0.05) for this measure. Norwere any of the other main factors significant. We did, however, find a significant interaction between‘sessions’ and ‘observers’ (p < 0.01) and between ‘sessions’ and ‘neurites’ (p < 0.001), which suggeststhat the accuracy of length measurements with our technique is dependent on the user and also on theshape of the neurites being traced, as was to be expected.
All other measures of comparison yielded values larger than or equal to zero, in accordance withtheir definitions, with smaller values indicating better performance. From the results with these mea-sures, presented in the remaining graphs of Fig. 3, it follows that our semiautomatic technique outper-forms the fully manual method. In virtually all cases the differences between the two techniques werefound to be very significant (p < 0.001) according to the paired t-test. This is in agreement with theresults of the ANOVA, which indicated that with the average deviation and labor intensiveness mea-sures, the factor ‘sessions’ had a very significant effect (p < 0.001) on the outcome. Here too, we foundsignificant interactions between ‘sessions’ and ‘observers’ (p < 0.05) and between ‘sessions’ and ‘neu-rites’ (p < 0.001). In addition, with the latter measure, we found a significant effect for the main factors‘observers’ (p < 0.05) and ‘neurites’ (p < 0.001), as well as for the three-way interaction between‘sessions’, ‘observers’, and ‘neurites’ (p < 0.001), which confirms that with our technique, the amountof interaction required depends on the user and on the neurites being traced.
The improvement ratio per measure and per observer can be deduced from the mean values indicatedin the graphs. Alternatively, computing the ratios on a per-neurite basis and then taking averages overall observers, we found that the reduction in errors with our semiautomatic tracing technique comparedto fully manual tracing was a factor 2.6 for the average deviation measure, a factor 6.0 and 23.2 forthe intraobserver variability of, respectively, the length difference and average deviation measure, anda factor 2.4 and 8.8 for the interobserver variability of the respective measures. User interaction wasreduced by a factor 3.3. To compare: the interaction was a factor 15.5 less than what was required forcreating the high-resolution reference tracings.
A TOOL FOR NEURITE TRACING AND ANALYSIS 6
DISCUSSION
From the validation results we conclude that the semiautomatic neurite tracing technique described inthis paper yields a significant improvement over fully manual tracing methods in terms of true neuritecenterline representation, reproducibility, and user interaction. In terms of length measurement, how-ever, it follows that overall, the differences between the two are not significant. Analyzing the tracingsafterwards we found that the underestimation of length may be ascribed to the fact that both techniquestend to shortcut strongly wiggling or sharply bending neurites. With fully manual tracing, shortcutting isinevitable when trying to limit the amount of user interaction. With our semiautomatic technique, short-cutting occurs mainly when the contrast is relatively low, which causes shorter routes to have a lowercumulative cost. In both cases, the influence on the results is user controllable. The results suggest,therefore, that the observers were not biased towards either technique in performing the experiments:while showing significantly larger variability, the results with fully manual tracing were on averagequite accurate. Notice that, incidentally, this latter observation seems to justify the use of fully man-ual tracing methods in studies involving large numbers of neurite measurements—a result that, to ourknowledge, has never been demonstrated before in the literature.
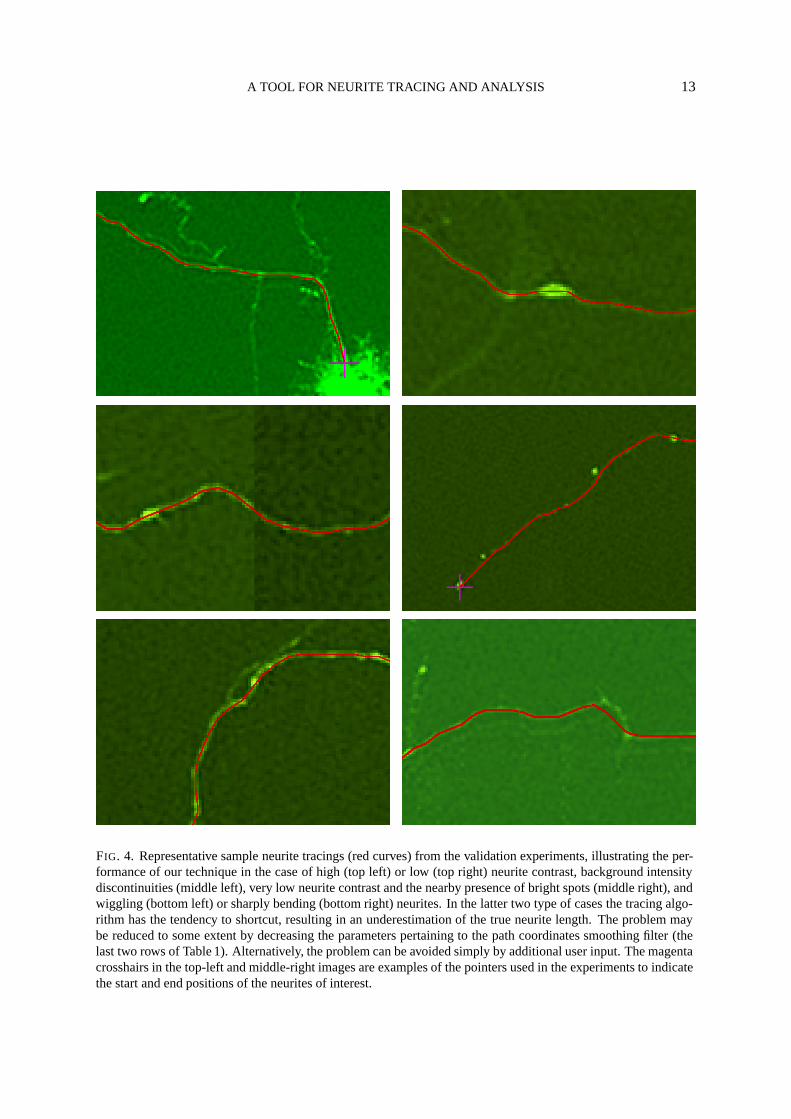
Because our technique employs a so-called global optimization algorithm and second-order imagefeature analysis, it is very robust against noise, varying or discontinuous background intensities, andvarying or even locally diminishing neurite contrast, as illustrated by the sample tracings in Fig. 4. Asa result, it can be applied to a wide range of images without changing its parameters. The number ofparameters to be set by the user is very small. More importantly, the parameters do not in any way rep-resent hard thresholds—the algorithms are free of user-controllable binary decisions. A disadvantage ofthe technique is that it still requires user interaction, which limits its applicability to images containingmanageable amounts of neurites only. Although, for reasons mentioned in the introduction, it seemsimpossible to eliminate all user interaction, it remains a challenge to further automate the technique andto investigate its potential for other applications. One possibility to reduce the number of mouse clicks,for example, would be to automatically compute landmarks to serve as input for the optimization algo-rithm. Since the algorithm appears to have no problems with tracing neurite segments whose orientationchanges only gradually from point to point, a logical approach would be to choose high-curvature andbranch points for this purpose. This will be a topic for future research.
To facilitate the use of our technique, we have worked the algorithms into a full-fledged softwaretool. Due to our choice for the specific programming language and image processing environmentdescribed earlier, the tool is in principle computer-platform independent. By optimizing the implemen-tation of the algorithms we have been able to achieve acceptable processing speeds, even when using anormal personal computer: for an image or region of size 800 × 800 pixels, the preprocessing time re-quired for detecting the neurites and computing their orientations, and the time required for recomputingoptimal paths after each mouse click, are both in the order of 1 second with a 2.4GHz Intel Pentium IVprocessor. By analogy with its hosting application, we have named our tool ‘NeuronJ’. Apart fromimplementing the necessary ways and means to interact with the mentioned algorithms, the tool alsoprovides the possibility to label and color tracings, to store them to and load them from disk, and tocompute and display the dimensions of individual tracings as well as the statistics of measurements onselected or all tracings. In our institutes, NeuronJ has been received very positively and has replaced thelabor intensive fully manual tracing tools. The software is freely available for non-commercial purposesfrom http://www.imagescience.org/meijering/software/neuronj/.
ACKNOWLEDGMENTS
The research described in this paper was initiated while the primary author was with the BiomedicalImaging Group of the Swiss Federal Institute of Technology in Lausanne (EPFL), Switzerland, and was
A TOOL FOR NEURITE TRACING AND ANALYSIS 7
completed while he was with the Biomedical Imaging Group Rotterdam of the Erasmus MC—UniversityMedical Center Rotterdam, in the Netherlands. The validation study was carried out in collaborationwith the Laboratory of Cellular Neurobiology of the EPFL.
LITERATURE CITED
1. Levitan IB, Kaczmarek LK. The Neuron: Cell and Molecular Biology. 3rd edition. Oxford: Oxford UniversityPress; 2002.
2. Capowski JJ. Computer Techniques in Neuroanatomy. New York, NY: Plenum Press; 1989.
3. Al-Kofahi KA, Lasek S, Szarowski DH, Pace CJ, Nagy G, Turner JN, Roysam B. Rapid Automated Three-Dimensional Tracing of Neurons from Confocal Image Stacks. IEEE Transactions on Information Technologyin Biomedicine 2002;6:171–187.
4. Houtsmuller AB, Smeulders AWM, Voort HTM van der, Oud JL, Nanninga N. The Homing Cursor: A Toolfor Three-Dimensional Chromosome Analysis. Cytometry 1993;14:501–509.
5. Can A, Shen H, Turner JN, Tanenbaum HL, Roysam B. Rapid Automated Tracing and Feature Extractionfrom Retinal Fundus Images using Direct Exploratory Algorithms. IEEE Transactions on Information Tech-nology in Biomedicine 1999;3:125–138.
6. Dima A, Scholz M, Obermayer K. Automatic Segmentation and Skeletonization of Neurons from Con-focal Microscopy Images Based on the 3-D Wavelet Transform. IEEE Transactions on Image Processing2002;11:790–801.
7. Jap Tjoen San ERA, Schmidt-Michels MH, Spruijt BM, Oestreicher AB, Schotman P, Gispen WH. Quan-titation of the Growth-Associated Protein B-50/GAP-43 and Neurite Outgrowth in PC12 Cells. Journal ofNeuroscience Research 1991;29:149–154.
8. Malgrange B, Delree P, Rigo JM, Baron H, Moonen G. Image Analysis of Neuritic Regeneration by Adult RatDorsal Root Ganglion Neurons in Culture: Quantification of the Neurotoxicity of Anticancer Agents and of ItsPrevention by Nerve Growth Factor or Basic Fibroblast Growth Factor but Not Brain-Derived NeurotrophicFactor or Neurotrophin-3. Journal of Neuroscience Methods 1994;53:111–122.
9. Kim J, Gillies D. Automatic Morphometric Analysis of Neural Cells. Machine Graphics & Vision1998;7:693–709.
10. Bilsland J, Rigby M, Young L, Harper S. A Rapid Method for Semi-Quantitative Analysis of Neurite Out-growth from Chick DRG Explants using Image Analysis. Journal of Neuroscience Methods 1999;92:75–85.
11. Ventimiglia R, Jones BE, Møller A. A Quantitative Method for Morphometric Analysis in Neuronal Cell Cul-ture: Unbiased Estimation of Neuron Area and Number of Branch Points. Journal of Neuroscience Methods1995;57:63–66.
12. Isaacs KR, Hanbauer I, Jacobowitz DM. A Method for the Rapid Analysis of Neuronal Proportions andNeurite Morphology in Primary Cultures. Experimental Neurology 1998;149:464–467.
13. Rønn LCB, Ralets I, Hartz BP, Bech M, Berezin A, Berezin V, Møller A, Bock E. A Simple Procedure forQuantification of Neurite Outgrowth Based on Stereological Principles. Journal of Neuroscience Methods2000;100:25–32.
14. Weaver CM, Pinezich JD, Lindquist WB, Vazquez ME. An Algorithm for Neurite Outgrowth Reconstruction.Journal of Neuroscience Methods 2003;124:197–205.
15. Sato Y, Nakajima S, Shiraga N, Atsumi H, Yoshida S, Koller T, Gerig G, Kikinis R. Three-Dimensional Multi-Scale Line Filter for Segmentation and Visualization of Curvilinear Structures in Medical Images. MedicalImage Analysis 1998;2:143–168.
16. Frangi AF, Niessen WJ, Hoogeveen RM, Walsum T van, Viergever MA. Model-Based Quantitation of 3-DMagnetic Resonance Angiographic Images. IEEE Transactions on Medical Imaging 1999;18:946–956.
17. Geusebroek JM, Smeulders AWM. A Minimum Cost Approach for Segmenting Networks of Lines. Interna-tional Journal of Computer Vision 2001;43:99–111.
A TOOL FOR NEURITE TRACING AND ANALYSIS 8
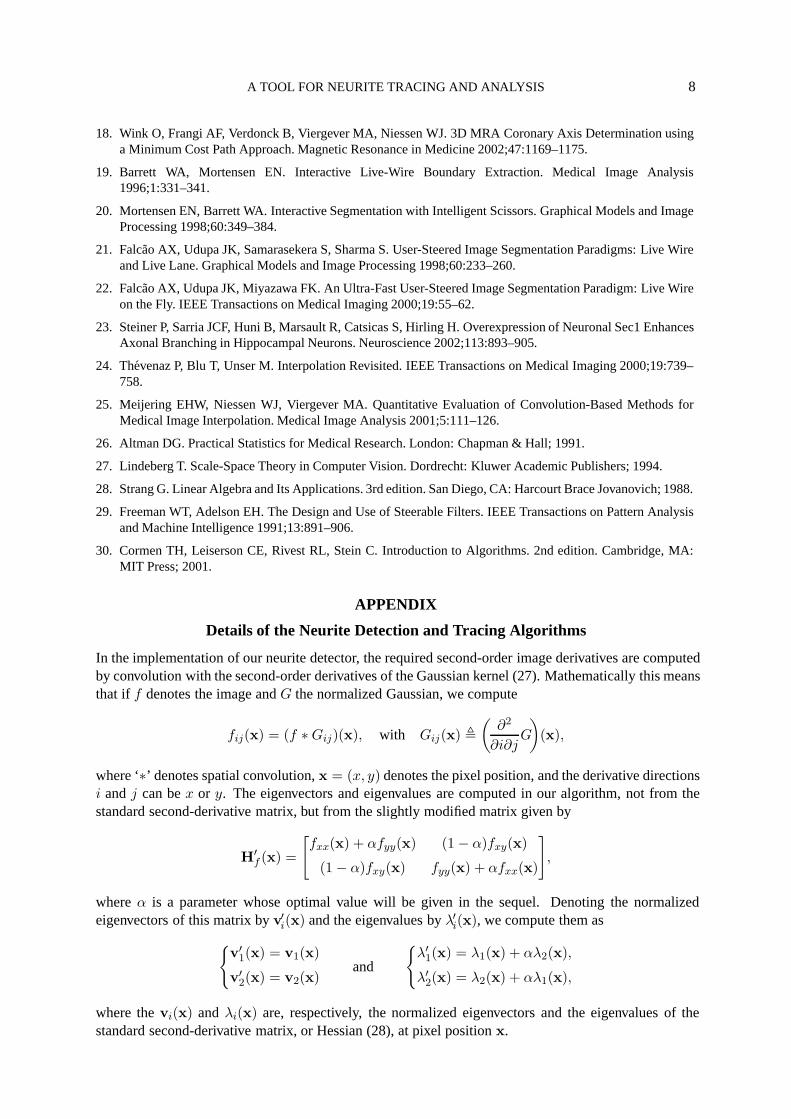
18. Wink O, Frangi AF, Verdonck B, Viergever MA, Niessen WJ. 3D MRA Coronary Axis Determination usinga Minimum Cost Path Approach. Magnetic Resonance in Medicine 2002;47:1169–1175.
19. Barrett WA, Mortensen EN. Interactive Live-Wire Boundary Extraction. Medical Image Analysis1996;1:331–341.
20. Mortensen EN, Barrett WA. Interactive Segmentation with Intelligent Scissors. Graphical Models and ImageProcessing 1998;60:349–384.
21. Falcao AX, Udupa JK, Samarasekera S, Sharma S. User-Steered Image Segmentation Paradigms: Live Wireand Live Lane. Graphical Models and Image Processing 1998;60:233–260.
22. Falcao AX, Udupa JK, Miyazawa FK. An Ultra-Fast User-Steered Image Segmentation Paradigm: Live Wireon the Fly. IEEE Transactions on Medical Imaging 2000;19:55–62.
23. Steiner P, Sarria JCF, Huni B, Marsault R, Catsicas S, Hirling H. Overexpression of Neuronal Sec1 EnhancesAxonal Branching in Hippocampal Neurons. Neuroscience 2002;113:893–905.
24. Thevenaz P, Blu T, Unser M. Interpolation Revisited. IEEE Transactions on Medical Imaging 2000;19:739–758.
25. Meijering EHW, Niessen WJ, Viergever MA. Quantitative Evaluation of Convolution-Based Methods forMedical Image Interpolation. Medical Image Analysis 2001;5:111–126.
26. Altman DG. Practical Statistics for Medical Research. London: Chapman & Hall; 1991.
27. Lindeberg T. Scale-Space Theory in Computer Vision. Dordrecht: Kluwer Academic Publishers; 1994.
28. Strang G. Linear Algebra and Its Applications. 3rd edition. San Diego, CA: Harcourt Brace Jovanovich; 1988.
29. Freeman WT, Adelson EH. The Design and Use of Steerable Filters. IEEE Transactions on Pattern Analysisand Machine Intelligence 1991;13:891–906.
30. Cormen TH, Leiserson CE, Rivest RL, Stein C. Introduction to Algorithms. 2nd edition. Cambridge, MA:MIT Press; 2001.
APPENDIX
Details of the Neurite Detection and Tracing Algorithms
In the implementation of our neurite detector, the required second-order image derivatives are computedby convolution with the second-order derivatives of the Gaussian kernel (27). Mathematically this meansthat if f denotes the image and G the normalized Gaussian, we compute
fij(x) = (f ∗ Gij)(x), with Gij(x) �(
∂2
∂i∂jG
)(x),
where ‘∗’ denotes spatial convolution, x = (x, y) denotes the pixel position, and the derivative directionsi and j can be x or y. The eigenvectors and eigenvalues are computed in our algorithm, not from thestandard second-derivative matrix, but from the slightly modified matrix given by
H′f (x) =
[fxx(x) + αfyy(x) (1 − α)fxy(x)
(1 − α)fxy(x) fyy(x) + αfxx(x)
],
where α is a parameter whose optimal value will be given in the sequel. Denoting the normalizedeigenvectors of this matrix by v′i(x) and the eigenvalues by λ′i(x), we compute them as
{v′
1(x) = v1(x)
v′2(x) = v2(x)
and
{λ′
1(x) = λ1(x) + αλ2(x),
λ′2(x) = λ2(x) + αλ1(x),
where the vi(x) and λi(x) are, respectively, the normalized eigenvectors and the eigenvalues of thestandard second-derivative matrix, or Hessian (28), at pixel position x.
A TOOL FOR NEURITE TRACING AND ANALYSIS 9
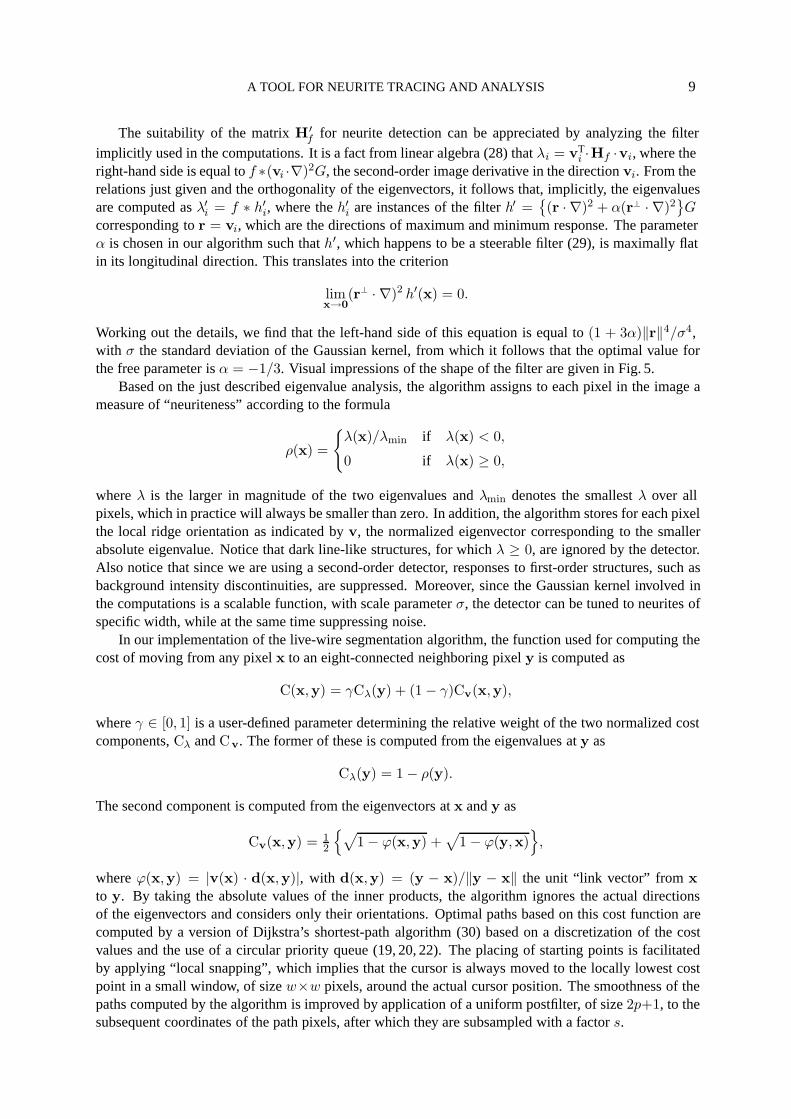
The suitability of the matrix H′f for neurite detection can be appreciated by analyzing the filter
implicitly used in the computations. It is a fact from linear algebra (28) that λi = vTi ·Hf ·vi, where the
right-hand side is equal to f ∗(vi ·∇)2G, the second-order image derivative in the direction vi. From therelations just given and the orthogonality of the eigenvectors, it follows that, implicitly, the eigenvaluesare computed as λ′i = f ∗ h′
i, where the h′i are instances of the filter h′ =
{(r · ∇)2 + α(r⊥ · ∇)2
}G
corresponding to r = vi, which are the directions of maximum and minimum response. The parameterα is chosen in our algorithm such that h′, which happens to be a steerable filter (29), is maximally flatin its longitudinal direction. This translates into the criterion
limx→0
(r⊥ · ∇)2 h′(x) = 0.
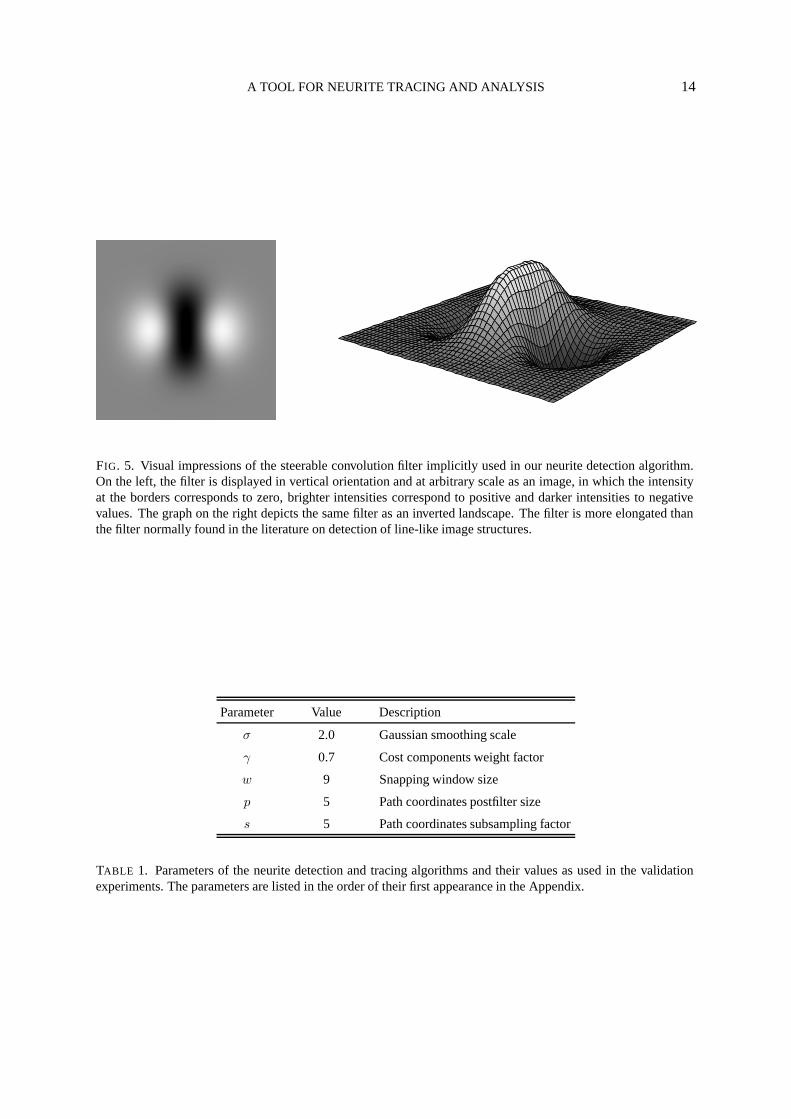
Working out the details, we find that the left-hand side of this equation is equal to (1 + 3α)‖r‖4/σ4,with σ the standard deviation of the Gaussian kernel, from which it follows that the optimal value forthe free parameter is α = −1/3. Visual impressions of the shape of the filter are given in Fig. 5.
Based on the just described eigenvalue analysis, the algorithm assigns to each pixel in the image ameasure of “neuriteness” according to the formula
ρ(x) =
{λ(x)/λmin if λ(x) < 0,
0 if λ(x) ≥ 0,
where λ is the larger in magnitude of the two eigenvalues and λmin denotes the smallest λ over allpixels, which in practice will always be smaller than zero. In addition, the algorithm stores for each pixelthe local ridge orientation as indicated by v, the normalized eigenvector corresponding to the smallerabsolute eigenvalue. Notice that dark line-like structures, for which λ ≥ 0, are ignored by the detector.Also notice that since we are using a second-order detector, responses to first-order structures, such asbackground intensity discontinuities, are suppressed. Moreover, since the Gaussian kernel involved inthe computations is a scalable function, with scale parameter σ, the detector can be tuned to neurites ofspecific width, while at the same time suppressing noise.
In our implementation of the live-wire segmentation algorithm, the function used for computing thecost of moving from any pixel x to an eight-connected neighboring pixel y is computed as
C(x,y) = γCλ(y) + (1 − γ)Cv(x,y),
where γ ∈ [0, 1] is a user-defined parameter determining the relative weight of the two normalized costcomponents, Cλ and Cv. The former of these is computed from the eigenvalues at y as
Cλ(y) = 1 − ρ(y).
The second component is computed from the eigenvectors at x and y as
Cv(x,y) = 12
{√1 − ϕ(x,y) +
√1 − ϕ(y,x)
},
where ϕ(x,y) = |v(x) · d(x,y)|, with d(x,y) = (y − x)/‖y − x‖ the unit “link vector” from xto y. By taking the absolute values of the inner products, the algorithm ignores the actual directionsof the eigenvectors and considers only their orientations. Optimal paths based on this cost function arecomputed by a version of Dijkstra’s shortest-path algorithm (30) based on a discretization of the costvalues and the use of a circular priority queue (19, 20, 22). The placing of starting points is facilitatedby applying “local snapping”, which implies that the cursor is always moved to the locally lowest costpoint in a small window, of size w×w pixels, around the actual cursor position. The smoothness of thepaths computed by the algorithm is improved by application of a uniform postfilter, of size 2p+1, to thesubsequent coordinates of the path pixels, after which they are subsampled with a factor s.
A TOOL FOR NEURITE TRACING AND ANALYSIS 10
FIGURES AND TABLES
FIG. 1. Representative example of the type of images aimed at in this paper. The image shows a hippocampalneuron in culture and was compiled from multiple fluorescence microscopy scans to capture all of the neuron’soutgrowth. Typical features include ambiguities regarding the branching or crossing of neurites (as in the regionsindicated by the letter ‘A’), discontinuities in background intensity (as in the regions indicated by ‘B’), and varyingneurite contrast (compare the segments indicated by ‘C’). The former problem makes it virtually impossible todevelop fully automated approaches to neurite tracing for such images. Problems such as noise and varying neuritecontrast and background intensity are tackled by the technique described in this paper.
A TOOL FOR NEURITE TRACING AND ANALYSIS 11
FIG. 2. Output of the neurite detection algorithm applied to the image in Fig. 1. The top image shows, for everypixel, the “probability” of belonging to a neurite, as computed by the algorithm, where bright and dark valuescorrespond to a high and a low probability, respectively. The bottom image shows a zoom of a region in the middle-lower part of the top image, superimposed with the local neurite orientations (white dashes) computed by thealgorithm. The algorithm is designed to suppress dark line-like structures and background intensity discontinuities.Moreover, it is tunable to neurites of specific width while it also reduces noise.

A TOOL FOR NEURITE TRACING AND ANALYSIS 12
-6
-5
-4
-3
-2
-1
0
1
2
3
4
O1 O2 O3 O4
** **
ε L(p
erce
nt)
0
0.5
1
1.5
2
2.5
3
3.5
4
O1 O2 O3 O4
*** *** *** ***
ε D(p
ixel
s)
0
0.5
1
1.5
2
2.5
3
3.5
4
O1 O2 O3 O4
*** * *** ***
VA
Rε L in
tra
(per
cent
)
0
0.2
0.4
0.6
0.8
1
1.2
1.4
1.6
O1 O2 O3 O4
*** *** *** ***V
AR
ε D intr
a(p
ixel
s)
0
0.5
1
1.5
2
2.5
O1234
***
VA
Rε L in
ter(p
erce
nt)
0
0.2
0.4
0.6
0.8
1
O1234
***
VA
Rε D in
ter
(pix
els)
0
10
20
30
40
50
60
O1 O2 O3 O4
*** *** *** ***
Inte
ract
ion
(clic
ks)
FIG. 3. Graphical presentation of the results of the validation experiments comparing fully manual tracing (solidbars) and our semiautomatic tracing technique (dotted bars). The graphs show, from top left to bottom right, thelength difference ratio (εL), the average deviation (εD), the intraobserver variability for εL and εD, the interobservervariability for εL and εD, and the amount of user interaction required (see the main text for details on thesemeasures). The bars show the full range of observed values for each of the observers, with the black circle aroundthe middle of each bar indicating the mean value. The four observers (denoted by O1, O2, O3, and O4, where thefirst two were cell biologists and the latter two computer scientists) are indicated at the bottom of the graphs. Theasterisks on top of each graph indicate for each observer the probability for the null hypothesis of equivalence tobe true based on the paired t-test applied to the data presented. The different levels of probability considered arep < 0.001 (***), p < 0.01 (**), p < 0.05 (*), and any probability larger than 0.05 (no asterisk).
A TOOL FOR NEURITE TRACING AND ANALYSIS 13
FIG. 4. Representative sample neurite tracings (red curves) from the validation experiments, illustrating the per-formance of our technique in the case of high (top left) or low (top right) neurite contrast, background intensitydiscontinuities (middle left), very low neurite contrast and the nearby presence of bright spots (middle right), andwiggling (bottom left) or sharply bending (bottom right) neurites. In the latter two type of cases the tracing algo-rithm has the tendency to shortcut, resulting in an underestimation of the true neurite length. The problem maybe reduced to some extent by decreasing the parameters pertaining to the path coordinates smoothing filter (thelast two rows of Table 1). Alternatively, the problem can be avoided simply by additional user input. The magentacrosshairs in the top-left and middle-right images are examples of the pointers used in the experiments to indicatethe start and end positions of the neurites of interest.
A TOOL FOR NEURITE TRACING AND ANALYSIS 14
FIG. 5. Visual impressions of the steerable convolution filter implicitly used in our neurite detection algorithm.On the left, the filter is displayed in vertical orientation and at arbitrary scale as an image, in which the intensityat the borders corresponds to zero, brighter intensities correspond to positive and darker intensities to negativevalues. The graph on the right depicts the same filter as an inverted landscape. The filter is more elongated thanthe filter normally found in the literature on detection of line-like image structures.
Parameter Value Description
σ 2.0 Gaussian smoothing scale
γ 0.7 Cost components weight factor
w 9 Snapping window size
p 5 Path coordinates postfilter size
s 5 Path coordinates subsampling factor
TABLE 1. Parameters of the neurite detection and tracing algorithms and their values as used in the validationexperiments. The parameters are listed in the order of their first appearance in the Appendix.


![Ray-Tracing based Validation of Spatial Consistency for ... · in 3GPP 3D model [8]. Figure 1 illustrates one example of an urban environment used in the ray-tracing simulator. The](https://static.fdocuments.net/doc/165x107/5fd89146f4c52f40824fa331/ray-tracing-based-validation-of-spatial-consistency-for-in-3gpp-3d-model-8.jpg)