Design and Use of the Microsoft Excel Solver - uni … · MICROSOFT EXCEL SOLVER...
27
Copyright q 1998, Institute for Operations Research and the Management Sciences 0092-2102/98/2805/0029/$5.00 This paper was refereed. COMPUTERS/COMPUTER SCIENCE—SOFTWARE INTERFACES 28: 5 September–October 1998 (pp. 29–55) Design and Use of the Microsoft Excel Solver Daniel Fylstra Frontline Systems Inc., PO Box 4288, Incline Village, Nevada 89450 Leon Lasdon Department of Management Science and Information Systems, College of Business Administration, University of Texas, Austin, Texas 78712 John Watson Software Engines, 725 Magnolia Street, Menlo Park, California 94025 Allan Waren Computer and Information Science Department, Cleveland State University, Cleveland, Ohio 44115 In designing the spreadsheet optimizer that is bundled with Microsoft Excel, we and Microsoft made certain choices in de- signing its user interface, model processing, and solution algo- rithms for linear, nonlinear, and integer programs. We describe some of the common pitfalls users encounter and remedies available in the latest version of Microsoft Excel. The Solver has many applications and great impact in industry and education. S ince its introduction in February 1991, the Microsoft Excel Solver has become the most widely distributed and almost surely the most widely used general- purpose optimization modeling system. Bundled with every copy of Microsoft Ex- cel and Microsoft Office shipped during the last eight years, the Excel Solver is in the hands of 80 to 90 percent of the 35 mil- lion users of office-productivity software worldwide. The remaining 10 to 20 per- cent of this audience use either Lotus 1-2-3 or Quattro Pro, both of which now include very similar spreadsheet solvers, based on the same technology used in the Excel Solver. This widespread availability has spawned many applications in industry and government. In education, increasing numbers of MBA and undergraduate busi- ness instructors have adopted the Excel Solver as their tool for introducing stu- dents to optimization: most management science textbooks now include coverage of the Excel Solver, and several recent texts use it exclusively in the optimization chapters. We review the background and design
-
Upload
nguyenthuy -
Category
Documents
-
view
226 -
download
0
Transcript of Design and Use of the Microsoft Excel Solver - uni … · MICROSOFT EXCEL SOLVER...

Copyright q 1998, Institute for Operations Researchand the Management Sciences0092-2102/98/2805/0029/$5.00This paper was refereed.
COMPUTERS/COMPUTER SCIENCE—SOFTWARE
INTERFACES 28: 5 September–October 1998 (pp. 29–55)
Design and Use of the Microsoft Excel Solver
Daniel Fylstra Frontline Systems Inc., PO Box 4288,Incline Village, Nevada 89450
Leon Lasdon Department of Management Science andInformation Systems, College of BusinessAdministration, University of Texas,Austin, Texas 78712
John Watson Software Engines, 725 Magnolia Street,Menlo Park, California 94025
Allan Waren Computer and Information Science Department,Cleveland State University, Cleveland, Ohio 44115
In designing the spreadsheet optimizer that is bundled withMicrosoft Excel, we and Microsoft made certain choices in de-signing its user interface, model processing, and solution algo-rithms for linear, nonlinear, and integer programs. We describesome of the common pitfalls users encounter and remediesavailable in the latest version of Microsoft Excel. The Solverhas many applications and great impact in industry andeducation.
Since its introduction in February 1991,the Microsoft Excel Solver has become
the most widely distributed and almostsurely the most widely used general-purpose optimization modeling system.Bundled with every copy of Microsoft Ex-cel and Microsoft Office shipped duringthe last eight years, the Excel Solver is inthe hands of 80 to 90 percent of the 35 mil-lion users of office-productivity softwareworldwide. The remaining 10 to 20 per-cent of this audience use either Lotus1-2-3 or Quattro Pro, both of which nowinclude very similar spreadsheet solvers,
based on the same technology used in theExcel Solver.
This widespread availability hasspawned many applications in industryand government. In education, increasingnumbers of MBA and undergraduate busi-ness instructors have adopted the ExcelSolver as their tool for introducing stu-dents to optimization: most managementscience textbooks now include coverage ofthe Excel Solver, and several recent textsuse it exclusively in the optimizationchapters.
We review the background and design

FYLSTRA ET AL.
INTERFACES 28:5 30
philosophy of the Excel Solver. We seek toexplain why the Excel Solver works theway it does, to clear up some commonmisunderstandings and pitfalls, and tosuggest ideas for good modeling practicewhen using spreadsheet optimization. Wealso briefly survey applications of theExcel Solver in industry and educationand describe how practitioners who arenot affiliated with the OR/MS communityuse it. The example models in this paperare available on Practice Online at(http://silmaril.smeal.psu.edu/pol.html)and at http://www.frontsys.com/interfaces.htm. Much more information—over 200 web pages at this writing—isavailable on Frontline Systems’ WorldWide Web site (http://www.frontsys.com).
The Microsoft Excel Solver combines thefunctions of a graphical user interface(GUI), an algebraic modeling languagelike GAMS [Brooke, Kendrick, andMeeraus 1992] or AMPL [Fourer, Gay, andKernighan 1993], and optimizers for linear,nonlinear, and integer programs. Each ofthese functions is integrated into the hostspreadsheet program as closely as possi-ble. Many of the decisions we and Micro-soft made in designing the Solver weremotivated by this goal of seamlessintegration.
Optimization in Microsoft Excel beginswith an ordinary spreadsheet model. Thespreadsheet’s formula language functionsas the algebraic language used to definethe model. Through the Solver’s GUI, theuser specifies an objective and constraintsby pointing and clicking with a mouseand filling in dialog boxes. The Solverthen analyzes the complete optimizationmodel and produces the matrix form re-
quired by the optimizers in much thesame way that GAMS and AMPL do.
The optimizers employ the simplex,generalized-reduced-gradient, and branch-and-bound methods to find an optimal so-lution and sensitivity information. TheSolver uses the solution values to updatethe model spreadsheet and provides sensi-tivity and other summary information onadditional report spreadsheets.Background and Design Philosophyof the Excel Solver
The Microsoft Excel Solver and its coun-terparts in Lotus 1-2-3 97 and Corel Quat-tro Pro were not the first spreadsheet op-timizers; that distinction belongs to What’sBest!, conceived by Sam Savage, LinusSchrage, and Kevin Cunningham in 1985and marketed by General OptimizationInc. for the Lotus 1-2-3 Release 2 spread-sheet [Savage 1985]. What’sBest! is stillavailable in versions for each of the majorspreadsheets and is now sold and sup-ported by Lindo Systems Inc. Other earlyspreadsheet optimizers included FrontlineSystems’ What-If Solver [Frontline Sys-tems 1990], Enfin Software’s Optimal Solu-tions [Enfin Software 1988], and LotusDevelopment’s Solver in earlier versionsof 1-2-3 [Lotus Development 1990].
The design approach of What-If Solver,implemented in the graphical user inter-face of Excel, was chosen by Microsoftover several alternatives includingWhat’sBest!; by Borland (the original de-velopers of Quattro Pro) over an earliersolver developed internally by that com-pany; and later by Lotus over their owninternally developed solver. A major rea-son for this outcome, we believe, is thatthe Excel Solver had as its design goal

MICROSOFT EXCEL SOLVER
September–October 1998 31
Figure 1: The Goal Seek feature of MicrosoftExcel predated the Solver. This feature usesiterative methods to solve a simple equation(formula in the “set cell” equal to the “value”)in one variable (the “changing cell”).
“making optimization a feature of spread-sheets,” whereas other packages, such asWhat’sBest!, “use the spreadsheet to dooptimization.” In many small ways, theExcel Solver caters to the tens of millionsof spreadsheet users, rather than to thetens of thousands of OR/MS professionals.
Although OR/MS professionals readilylearn to use the Excel Solver, they oftenfind certain aspects of its design puzzlingor at least different from their expecta-tions. In most cases, the differences aredue to (1) the architecture of spreadsheetprograms, (2) the expectations of the ma-jority of spreadsheet users who are notOR/MS professionals, or (3) the desires ofthe spreadsheet vendors (Microsoft in thecase of the Excel Solver).The Architecture of SpreadsheetPrograms
Because of the architecture of spread-sheet programs, it is easy to create spread-sheet models that contain discontinuousfunctions or even nonnumeric values.These models usually cannot be solvedwith classical optimization methods. Thespreadsheet’s formula language is de-signed for general computations and notjust for optimization. Indeed, Excel sup-ports a rich variety of operators and sev-eral hundred built-in functions, as well asuser-written functions. In contrast, GAMS,AMPL, and similar modeling languagesinclude only a small set of operators andfunctions sufficient for expressing linear,smooth nonlinear, and integer optimiza-tion models.The Expectations of Spreadsheet Users
The Excel Solver was designed to meetthe expectations of spreadsheet users—inparticular, users of earlier versions of Ex-
cel—rather than traditional OR/MS pro-fessionals. An example is the terminologyit uses in dialog boxes, such as “TargetCell” (for the objective) and “ChangingCells” (for the decision variables). We usedthese terms—at Microsoft’s request—tomirror the terms used in the Goal Seekfeature, which predated the Solver inExcel and in other spreadsheet programs.The Goal Seek feature, which spreadsheetusers often describe as “what-if in re-verse,” solves a nonlinear function of onevariable for a specified value. Spreadsheetusers see the Excel Solver as a more pow-erful successor to the Goal Seek feature[Person 1997]. Figure 1 shows Excel’s GoalSeek dialog box, and Figure 2 shows theSolver Parameters dialog box with itssimilar terminology.The Desires of the Spreadsheet Vendors
The influence of the spreadsheet ven-dors’ desires is reflected in the way theSolver determines whether the model islinear or nonlinear. By default, the Solverassumes that the model is nonlinear. Theuser must select the Assume Linear Modelcheck box in the Solver Options dialog box

FYLSTRA ET AL.
INTERFACES 28:5 32
Figure 2: The Solver Parameters dialog is used to define the optimization model. The terms“Set Target Cell” (for the objective) and “Changing Cells” (for the variables) and the “Valueof” option were derived from the earlier Goal Seek feature.
to override this assumption; the Solverdoes not attempt to automatically deter-mine whether the model is linear by in-specting the formulas making up themodel. Most of Excel’s several hundredbuilt-in functions and all user-writtenfunctions would have to be treated as “notlinear” (smooth nonlinear or discontinu-ous over their full domains) in an auto-matic test. But users sometimes createmodels using these functions and thenadd constraints that result in a linearmodel over the feasible region. Microsoftwanted a general approach that wouldsupport such cases and specified the useof the check box, as well as the use of thenonlinear solver as the default choice.The Role of Bundled SpreadsheetSolvers
The “free” bundled version of the ExcelSolver described in this paper and similar
products, such as What’sBest! PersonalEdition, represent the low end of the rangeof spreadsheet solver functionality, capac-ity, and performance. More powerful ver-sions are available and these versions aremost often used to solve problems in in-dustry. For example, where the standardExcel Solver supports just 200 decisionvariables, Frontline Systems’ Large-ScaleLP Solver (a component of the PremiumSolver Platform) supports up to 16,000variables, and Lindo Systems’ What’sBest!Extended Edition supports up to 32,000variables. Table 1 summarizes the charac-teristics of the Premium Solver productsoffered by Frontline Systems.
Like most optimization software, theExcel Solver has steadily improved in per-formance over the years. Although solu-tion times are model dependent, in overallterms, the Solver in Excel 97 offers about

MICROSOFT EXCEL SOLVER
September–October 1998 33
Excel Built-InSolver
PremiumSolver
PremiumSolverPlus
Premium SolverPlatform
NLP variables/constraints
200/100 `
bounds400/200 `
bounds400/200 `
bounds1000/1000 ` bounds
LP variables/constraints
200/unlimited
800/unlimited 800/unlimited 2000/unlimited to16,000/unlimited
Setupperformance
1x 1–50x 1–50x 1–50x
NLPperformance
1x 1x 1.5x 2–10x
LP performance 1x 2–3x 2–3x Large scaleMIP performance 1x 5–10x 25–50x 25–50xSelection of
optimizersFixed set Fixed set Fixed set Multiple choices, field-
installableLP/QP methods Simplex
w/boundsEnhanced
simplexw/bounds
Enhancedsimplex,dual,quadratic
Sparse simplex, LU,Markowitz
MIP methods B&B Enhanced B&B EnhancedB&B, P&P,dual,simplex
Enhanced B&B, P&P,dual, simplex
NLP methods GRG2 GRG2 EnhancedGRG2
LSGRG, SQP, etc.
Reports Standard:Answer,Limits,Sensitivity
Standard `
Linearity,Feasibility
Standard `
Linearity,Feasibility
Standard ` Linearity,Feasibility
Table 1: The characteristics of the enhanced Excel Solvers are summarized in this table. For in-teger problems, “B&B” refers to branch and bound and “P&P” refers to preprocessing andprobing. For nonlinear problems, “GRG” refers to the generalized reduced gradient methodand “SQP” refers to sequential quadratic programming.
five times the performance of that in Excel5.0 and perhaps 20 times the performanceof the earliest version in Excel 3.0 (assum-ing a constant hardware platform). ThePremium Solver further improves mixed-integer problem solution times by a factorof 25 to 50 over the Excel 97 Solver(Table 1). While spreadsheet solvers areunlikely to compete with dedicated optim-izers, such as CPLEX and OSL, they doprovide a practical platform for solving
real-world optimization problems.User Interface and Selectionof Objectives, Decision Variables,and Constraints
In the Excel Solver, as in an algebraicmodeling system, the optimization modelis defined by algebraic formulas (whichappear in spreadsheet cells). Excel’s for-mula language can express a wide rangeof mathematical relationships, but Excelhas no facilities for distinguishing decision
FYLSTRA ET AL.
INTERFACES 28:5 34
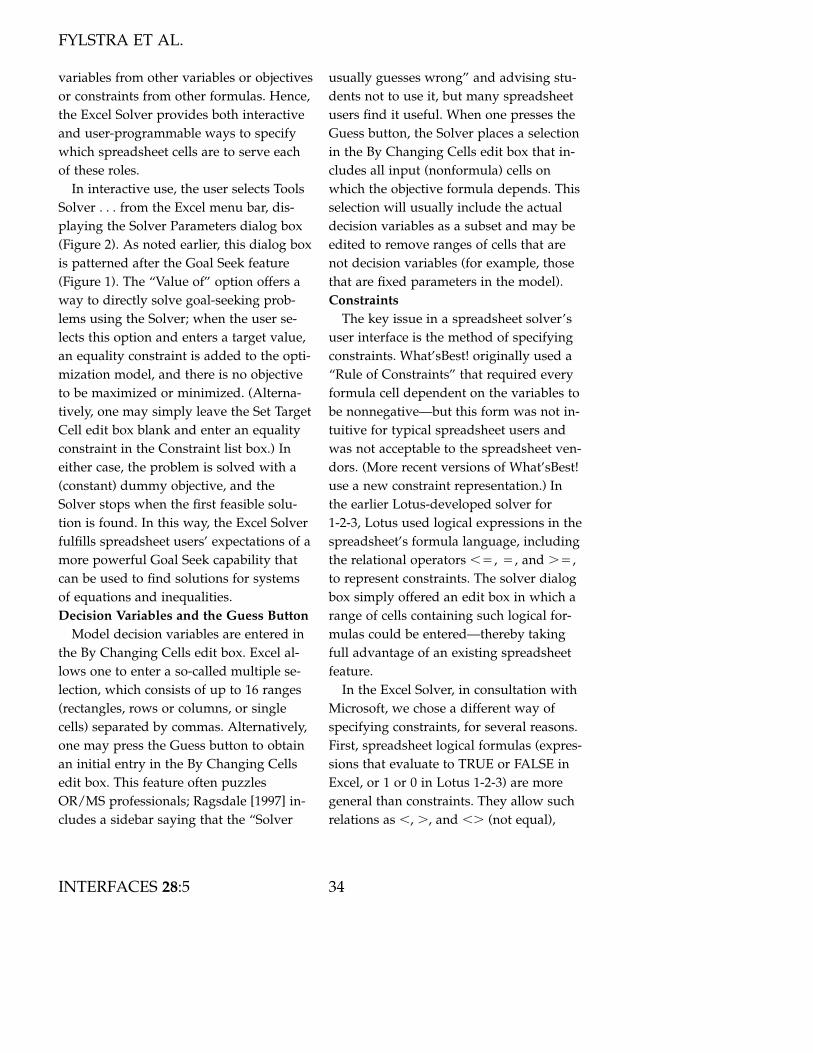
variables from other variables or objectivesor constraints from other formulas. Hence,the Excel Solver provides both interactiveand user-programmable ways to specifywhich spreadsheet cells are to serve eachof these roles.
In interactive use, the user selects ToolsSolver . . . from the Excel menu bar, dis-playing the Solver Parameters dialog box(Figure 2). As noted earlier, this dialog boxis patterned after the Goal Seek feature(Figure 1). The “Value of” option offers away to directly solve goal-seeking prob-lems using the Solver; when the user se-lects this option and enters a target value,an equality constraint is added to the opti-mization model, and there is no objectiveto be maximized or minimized. (Alterna-tively, one may simply leave the Set TargetCell edit box blank and enter an equalityconstraint in the Constraint list box.) Ineither case, the problem is solved with a(constant) dummy objective, and theSolver stops when the first feasible solu-tion is found. In this way, the Excel Solverfulfills spreadsheet users’ expectations of amore powerful Goal Seek capability thatcan be used to find solutions for systemsof equations and inequalities.Decision Variables and the Guess Button
Model decision variables are entered inthe By Changing Cells edit box. Excel al-lows one to enter a so-called multiple se-lection, which consists of up to 16 ranges(rectangles, rows or columns, or singlecells) separated by commas. Alternatively,one may press the Guess button to obtainan initial entry in the By Changing Cellsedit box. This feature often puzzlesOR/MS professionals; Ragsdale [1997] in-cludes a sidebar saying that the “Solver
usually guesses wrong” and advising stu-dents not to use it, but many spreadsheetusers find it useful. When one presses theGuess button, the Solver places a selectionin the By Changing Cells edit box that in-cludes all input (nonformula) cells onwhich the objective formula depends. Thisselection will usually include the actualdecision variables as a subset and may beedited to remove ranges of cells that arenot decision variables (for example, thosethat are fixed parameters in the model).Constraints
The key issue in a spreadsheet solver’suser interface is the method of specifyingconstraints. What’sBest! originally used a“Rule of Constraints” that required everyformula cell dependent on the variables tobe nonnegative—but this form was not in-tuitive for typical spreadsheet users andwas not acceptable to the spreadsheet ven-dors. (More recent versions of What’sBest!use a new constraint representation.) Inthe earlier Lotus-developed solver for1-2-3, Lotus used logical expressions in thespreadsheet’s formula language, includingthe relational operators ,4, 4, and .4,to represent constraints. The solver dialogbox simply offered an edit box in which arange of cells containing such logical for-mulas could be entered—thereby takingfull advantage of an existing spreadsheetfeature.
In the Excel Solver, in consultation withMicrosoft, we chose a different way ofspecifying constraints, for several reasons.First, spreadsheet logical formulas (expres-sions that evaluate to TRUE or FALSE inExcel, or 1 or 0 in Lotus 1-2-3) are moregeneral than constraints. They allow suchrelations as ,, ., and ,. (not equal),

MICROSOFT EXCEL SOLVER
September–October 1998 35
which are not easily handled by currentoptimization methods, as well as such log-ical operators as AND, OR, and NOT. Sec-ond, relations such as A1 . 4 0, are eval-uated by the spreadsheet as strictlysatisfied or unsatisfied, whereas an optimi-zation algorithm evaluates constraintswithin a tolerance. For example, if A1 4
10.0000005, the Excel Solver would treatA1 .4 0 as satisfied (using the defaultPrecision setting of 1016 or 0.000001), butthe logical formula 4 A1 .4 0 in a cellwould display as FALSE. Third, con-straints almost always come in blocks orindexed sets, such as A1:A10 .4 0, and itis very advantageous for users to be ableto enter such constraints and later viewand edit them in block form. Hence, theExcel Solver provides a Constraint list boxin the Solver Parameters dialog box whereusers can add, change, or delete blocks of
constraints by clicking the correspondingbuttons.
In accord with the GUI conventionsused throughout Excel, one can selectblocks of cells for decision variables andfor left-hand sides and right-hand sides ofconstraints by typing coordinates or byclicking and dragging with the mouse.The latter method is far more often used.Excel also allows the user to define sym-bolic names for individual cells or rangesof cells (through the Insert Name menuoption). The Excel Solver will recognizeany names the user has defined for the ob-jective, variables, and blocks of constraintsand will display them in the Solver Pa-rameters dialog box (Figure 3).
For those who prefer to use spreadsheetlogical formulas for constraints, the ExcelSolver will read and write constraints inthis form, when the Load Model and Save
Figure 3: Excel users can define symbolic names for single cells or ranges of cells, which theSolver will use. This dialog depicts the same model as in Figure 2 with the aid of definednames, resulting in a much more readable model.

FYLSTRA ET AL.
INTERFACES 28:5 36
Figure 4: The Solver Options dialog box isused to select algorithmic options and to settolerances for the Excel Solver’s solutionmethods.
Model buttons in the Solver Options dia-log box are used.Solver Options
The user can control several options andtolerances used by the optimizers throughthe Solver Options dialog box (Figure 4).In the standard Excel Solver, all such op-tions appear in one dialog box; in the Pre-mium Solver products, where many moreoptions and tolerances are available, eachoptimizer has a separate dialog box.
The Max Time and the Iterations editboxes control the Solver’s running time.The Show Iteration Results check box in-structs the Solver to pause after each ma-jor iteration and display the current “trialsolution” on the spreadsheet. In lieu ofthese options, however, the user can sim-ply press the ESC key at any time tointerrupt the Solver, inspect the current it-erate, and decide whether to continue orto stop.
The Assume Linear Model check boxdetermines whether the simplex methodor the GRG2 nonlinear programming algo-
rithm will be used to solve the problem.The Use Automatic Scaling check boxcauses the model to be rescaled internallybefore solution. The Assume Non-Negative check box places lower boundsof zero on any decision variables that donot have explicit bounds in the Con-straints list box.
The Precision edit box is used by all ofthe optimizers and indicates the tolerancewithin which constraints are consideredbinding and variables are considered inte-gral in mixed-integer-programming (MIP)problems. The Tolerance edit box (a some-what unfortunate name, but Microsoft’schoice) is the integer optimality or MIP-gap tolerance used in the branch-and-bound method. The GRG2 algorithm usesthe Convergence edit box and Estimates,Derivatives, and Search option buttongroups.Modeling Practice
Excel, including the Solver, offers manyconvenient ways to select and manipulateblocks of cells for variables and con-straints. Modelers should take advantageof this feature by laying out optimizationmodels with indexed sets (for example,products, regions, or time periods) alongthe columns and rows of tables or blocksof cells. We also highly recommend thepractice of defining names for indexed setsof variables and constraints and even forsingle cells. For example, the structure ofthe model with names defined as shownin Figure 3 is far more easily grasped thanthe same model with cell coordinateranges as shown in Figure 2. Blocks ofconstraint values can often be computedmore easily with Excel’s array of formulas,which provide some of the high-level fea-

MICROSOFT EXCEL SOLVER
September–October 1998 37
tures of algebraic modeling languages,though without all of the flexibility ofsuch languages.
For further suggestions on modelingpractice for spreadsheet optimization, weencourage readers to consult Conway andRagsdale [1997].User Programmability
The user-programmable interface of-fered by the Excel Solver—a feature rarelyfound in other optimization modeling sys-tems—is critically important to the manycommercial users who are using Excel andMicrosoft Office as a platform for develop-ing custom applications. Every interactive,GUI-based action supported by the ExcelSolver has a counterpart function call inVisual Basic for Applications (VBA), Ex-cel’s built-in programming language. (Theearlier Excel macro language is also sup-ported for backward compatibility.) Allcomponents of Excel share this feature,making it a flexible platform for decisionsupport applications. For example, thenew marketing textbook [Lilien andRangaswamy 1997] includes a number ofExcel Solver models that are controlled byVBA programs.Model Extraction and Evaluation of theJacobian Matrix
Like an algebraic modeling system suchas GAMS or AMPL, the Excel Solver ex-tracts the optimization problem from thespreadsheet formulas and builds a repre-sentation of the model suitable for an op-timizer. For a linear programming (LP)problem, the focus of this model represen-tation is the LP coefficient matrix. In moregeneral terms, this is the Jacobian matrixof partial derivatives of the problem func-tions (objective and constraints) with re-
spect to the decision variables. In LP prob-lems, the matrix entries are constant andneed to be evaluated only once at the startof the optimization. In nonlinear program-ming (NLP) problems, the Jacobian matrixentries are variable and must be recom-puted at each new trial point.
The Jacobian matrix could be obtainedeither analytically by symbolic differentia-tion of the spreadsheet formulas [Ng andChar 1979]; or during function evaluationthrough so-called automatic differentiationmethods [Griewank and Corliss 1991]; orit could be approximated by finite differ-ences [Gill, Murray, and Wright 1981]. Thischoice is a major design decision in anyoptimization modeling system, with manytrade-offs. What’sBest! can be regarded asusing the symbolic algebraic approach;systems such as GAMS and AMPI use au-tomatic differentiation; and the ExcelSolver uses finite differences.
The most important reason for choosingthe finite difference approach for the ExcelSolver was the requirement, set by Micro-soft, that it support all of Excel’s built-infunctions as well as user-written functions.Symbolic differentiation would have beendifficult for many of Excel’s several hun-dred functions (and in fact, What’sBest! re-jects most of them) and impossible for user-written functions. To use automaticdifferentiation we would have had to mod-ify the Excel recalculator and require user-written functions (often coded in other lan-guages) to supply both function andderivative values, neither of which waspossible. On the other hand, finitedifferences could be efficiently calculatedusing the finely tuned Excel recalculatoras is.

FYLSTRA ET AL.
INTERFACES 28:5 38
The Solver is concerned only with thoseformulas that relate the objective and con-straints to the decision variables; it treatsall other formulas on the spreadsheet asconstant in the optimization problem. Ex-cel, 1-2-3, and Quattro Pro all implement aform of minimal recalculation in whichonly those formulas that are dependent onthe cell values that have changed need tobe recalculated.
In calculating finite differences, the[i,j]th element of the Jacobian matrix is ap-proximated by the formula
f (x ` d e ) 1 f (x)i j i where d 4 eps |1 4 x |.jd
In this formula, ej is the jth unit vector andeps is a perturbation factor, typically 1018
approximately equal to the square root ofthe machine precision [Gill, Murray, andWright 1981]. After an initial recalculationto evaluate f(x), the Solver perturbs eachvariable in turn, recalculates the spread-sheet, and obtains values for the jth col-umn of the Jacobian matrix. Hence theprocess requires n ` 1 recalculations foran n variable problem; each recalculationafter the first perturbs just one variableand resets another, thereby taking advan-tage of the spreadsheet’s minimal recalcu-lation feature.Modeling Practice
The use of finite differences in the ExcelSolver has a number of implications forspreadsheet modelers. The Solver’s modelprocessing allows users to employ any ofExcel’s several hundred built-in functions,as well as user-written functions, in con-structing the spreadsheet. While many ofthese functions have nonlinear or non-smooth values, they can be used freely to
compute parameters of the model that donot depend on the decision variables, evenif the optimization model is an LP. Indeed,it is often convenient to use IF, CHOOSE,and table LOOKUP functions in calculat-ing parameters, and we frequently seethese functions in models created by com-mercial users of Frontline Systems’ Pre-mium Solver products.
Computing finite differences does, how-ever, take time to recalculate the spread-sheet. Bearing in mind that Excel will re-calculate every formula on the currentworksheet that depends on the decisionvariables—even those not involved in theoptimization model—modelers can mini-mize this time by keeping auxiliary calcu-lations on a separate worksheet. Becauseof the significant overhead in recalculatingmultiple worksheets, the Excel Solver cur-rently requires that cells for the decisionvariables, the objective, and the left-handsides of constraints appear on the activesheet, although model formulas and right-hand sides of constraints can refer to othersheets.
For users with models that take a longtime to recalculate, we strongly recom-mend an upgrade to Excel 97, the latestversion of Excel at this writing. Recalcula-tion performance is greatly improved inthis version, and the Solver is correspond-ingly faster on the majority of models.Frontline Systems’ Premium Solver prod-ucts offer additional ways to speed upevaluation of the Jacobian matrix (Table 1),and we plan further improvements in thisarea.Solving Linear Problems
When a user checks the Assume LinearModel box (Figure 4) the Excel Solver uses

MICROSOFT EXCEL SOLVER
September–October 1998 39
a straightforward implementation of thesimplex method with bounded variablesto find the optimal solution. This code op-erates directly on the LP coefficient matrix(that is, the Jacobian), which is determinedusing finite differences. The standard ExcelSolver stores the full matrix, includingzero entries; however, no matrix rows arerequired for simple variable bounds.Frontline Systems’ Large-Scale LP Solver(Table 1) relies on a sparse representationof the matrix and of the LU factorizationof the basis with dynamic Markowitz re-factorization, yielding better memory us-age and improved numerical stability onlarge-scale problems.Automatic Scaling and Related Pitfalls
Earlier versions of the standard ExcelSolver had no provision for automaticscaling of the coefficient matrix; they usedvalues directly from the user’s spread-sheet. Since it is easy to rescale the objec-tive and constraint values on the spread-sheet itself, we did not think thatautomatic scaling would be needed, espe-cially for linear problems. We were wrong.Over the years, we have received manyspreadsheet models from users—includingbusiness school instructors—that did notseem to solve correctly. In virtually all ofthese cases, the model was very poorlyscaled—for example, with dollar amountsin millions for some constraints and returnfigures in percentages for others—yet noneof these users identified scaling as a prob-lem. It seems that in the widespread moveto emphasize modeling over algorithms,such issues as scaling (still important inusing software) have been de-emphasizedor forgotten.
To improve performance of the nonlin-
ear solver in Excel 4.0, we added the UseAutomatic Scaling check box to the SolverOptions dialog box. But this dug a deeperpitfall for users with linear problems, sincethis automatic scaling option had no effecton the linear solver—and users often over-looked the documentation of this fact inExcel’s online Help.
In Excel 97, the Use Automatic Scalingbox applies to both linear and nonlinearproblems. If the user checks this box andthe Assume Linear Model box, the Solverrescales columns, rows, and right-handsides to a common magnitude before be-ginning the simplex method. It unscalesthe solution values before storing theminto cells on the spreadsheet. With this en-hancement, the simplex solver is able tohandle most poorly scaled models withoutany extra effort by the user.Linearity Test and Related Pitfalls
For the reasons outlined earlier, the Ex-cel Solver asks the user to specify whetherthe model is linear, but it does perform asimple numerical test to check the linearityassumption for reasonableness. This li-nearity test gave rise to another pitfall,again for poorly scaled models. Prior toExcel 97, the Solver performed this test af-ter it had obtained a solution using thesimplex method. It used these solutionvalues x* and the initial values x0 for thevariables to check that the objective andeach constraint function fi(x), evaluated byrecalculating the spreadsheet, satisfied thefollowing condition:
0 0 0|f (x*) 1 (f (x ) ` ¹f (x )(x* 1 x ))| # tol.i i i
Here ¹fi(x0) is the function gradient, thatis, the appropriate row of the LP coeffi-cient matrix, and tol is the Precision value

FYLSTRA ET AL.
INTERFACES 28:5 40
in the Solver Options dialog box with adefault value of 1016.
Given that the model might contain anyof the hundreds of Excel built-in functionsas well as user-written functions and thatthe test is performed at discrete points,this test cannot be perfect; very occasion-ally, a model with nonlinear, or even dis-continuous functions, will pass the linear-ity test. In practice, however, this linearitytest almost always detects situations inwhich the user has accidentally set up amodel that doesn’t satisfy the linearity as-sumption—and truly linear models willalways pass the linearity test, as long asthey are well scaled.
Unfortunately, linear models that arepoorly scaled will sometimes fail this test.Since the resulting error message is “Theconditions for Assume Linear Model arenot satisfied,” the user who is not con-scious of the effect of poor scaling may notrealize that this is the problem. (The onlysaving grace is that very poorly scaledmodels, which might otherwise yield in-correct answers in the absence of auto-matic scaling, almost always give this er-ror message instead.)
In Excel 97, we have substantially re-vised the linearity test. The Solver per-forms a quick check before solving theproblem by verifying that the problemfunctions, evaluated at several multiples ofthe initial variable values, satisfy theabove condition. If the problem fails thistest, the user is warned against using thesimplex method. When the Solver finds anoptimal solution using the simplexmethod it performs a further check. It ver-ifies that the objective function and con-straint slacks, obtained by recalculating
the spreadsheet at the optimal point,match the values provided by the LP solu-tion within the Precision value in theSolver Options dialog. As long as the userselects the Use Automatic Scaling box, sothat the values in the LP matrix are wellscaled internally, this test should be robusteven for poorly scaled models.Modeling Practice
Students (and instructors) who use Ex-cel 97, with its automatic scaling and itsimproved linearity test, can avoid the pit-falls described earlier. We strongly encour-age business school instructors to upgradeto Excel 97 as soon as possible. Schoolsstill using Windows 3.1 can obtain an aca-demic version of Frontline Systems’ Pre-mium Solver for Excel 5.0 with the sameenhancements, but support for this 16-bitversion will be limited in the future. Still,we emphasize that, while we have usedscaling methods favored in the literature[Gill, Murray, and Wright 1981], no auto-matic scaling method is perfect. It will al-ways be possible to create examples thatcause problems in spite of automatic scal-ing, and we suggest that instructors de-vote at least some time to explaining thelimitations of finite precision computerarithmetic to students. Ragsdale [1997] ad-dresses scaling briefly but effectively, forinstance. The example model in Figure 5,which is available for download on Prac-tice Online, is a poorly scaled variant ofthe Working Capital Management work-sheet distributed with Excel. It will yield anonoptimal solution (of all zeroes) in Excel5.0 and 7.0 and in Excel 97 if the Use Au-tomatic Scaling box is cleared. It yields thecorrect solution in Excel 97 if the userchecks the Use Automatic Scaling box.

MICROSOFT EXCEL SOLVER
September–October 1998 41
Figure 5: This spreadsheet, which can be downloaded from Practice Online as FIGURE5.XLS, isa poorly scaled model that “fools” the linearity test in earlier Excel versions, yielding the mes-sage “The conditions for Assume Linear Model are not satisfied.”
Solving Nonlinear ProblemsWhen the Assume Linear Model box in
the Solver Options dialog is cleared, theExcel Solver uses the generalized reducedgradient method, as implemented in theGRG2 code [Lasdon et al. 1978], to solvethe problem. Like other gradient-basedmethods, GRG2 is guaranteed to find a lo-cal optimum only on problems with con-tinuously differentiable functions and thenonly in the absence of numerical difficul-ties (such as degeneracy or ill condition-ing). However, GRG2 has a reputation forrobustness, compared with other nonlinearoptimization methods, on difficult prob-lems where these conditions are not fullysatisfied.Problem Representation
GRG2 requires function values and theJacobian matrix (which is not constant fornonlinear models). The Excel Solver ap-proximates the Jacobian matrix using finite
differences as described earlier and re-evaluates it at the start of each majoriteration.Automatic Scaling
A poorly scaled model can cause evenmore problems for GRG2 than for the sim-plex method. The earliest version of theExcel Solver used variable and constraintvalues directly from the spreadsheet, butas of Excel 4.0 (released in 1992), theSolver rescales both variable and functionvalues internally if the user checks the UseAutomatic Scaling box in the Solver Op-tions dialog box. Unlike the simplex code,which uses gradient values for scaling (asof Excel 97), the GRG2 algorithm in Exceluses typical-value scaling. In this approachGRG2 rescales the decision variables andproblem functions by dividing by their ini-tial values at the beginning of the solutionprocess. (We chose this approach becauseour tests showed that gradient-based scal-

FYLSTRA ET AL.
INTERFACES 28:5 42
ing was not very effective on typical non-linear spreadsheet models where scalingwas a problem.)GRG2 Stopping Conditions
Like the simplex method, the GRG2 al-gorithm will stop when it finds an optimalsolution, when the objective appears to beunbounded, when it can find no feasiblesolution, or when it reaches the time limitor maximum number of iterations. Fornonlinear models, an “optimal solution”means that the Solver has found a localoptimum where the Kuhn-Tucker condi-tions are satisfied to within the conver-gence tolerance; the message displayed is“Solver found a solution.” GRG2 alsostops when the current solution meets a“slow progress” test: The relative changein the objective is less than the conver-gence tolerance for the last five iterations.In this case, the message displayed is“Solver converged to the current solu-tion.” In previous Excel versions, the con-vergence tolerance was fixed at 1014 or1015 (depending on the version) andcould not be changed by the user. In Excel97, there is new Convergence edit box(Figure 4) that sets this tolerance.
The message “Solver could not find afeasible solution” occurs when the GRG2algorithm terminates with a positive sumof infeasibilities. This almost always indi-cates a truly infeasible model, but withnonlinear problems this can occur (rarely)in feasible problems if GRG2 finds a localoptimum of the phase one objective (thesum of the infeasibilities) or if GRG2 sim-ply terminates in phase one due to slowprogress. Remedies available through theSolver Options dialog box (Figure 4) in-clude using automatic scaling, increasing
the feasibility tolerance (Precision option),decreasing the convergence tolerance tomake it more difficult to terminate inphase one, trying central differences, andtrying other starting points.Nonsmooth Functions
The convergence results for gradient-based methods, such as GRG2, depend ondifferentiability of the problem functions.The spreadsheet formula language is de-signed to express arbitrary calculations,and users can easily create optimizationmodels that include nonsmooth functions,that is, functions with discontinuous val-ues or first partial derivatives at one ormore points. Examples of such functionsare ABS, MIN and MAX, INT andROUND, CEILING and FLOOR, and thecommonly used IF, CHOOSE, andLOOKUP functions. Expressions involvingrelations (outside the context of Solver-recognized constraints) and such Booleanoperators as AND, OR, and NOT are dis-continuous at their points of transition be-tween FALSE and TRUE values.
The presence of any of these (or manyother) functions in a spreadsheet does notnecessarily mean that the optimizationmodel is nonsmooth. For example, an IFfunction whose conditional expression isindependent of the decision variables andwhose result expressions are smooth is it-self smooth. Similar statements apply tothe other functions mentioned above.
Even if the problem is nonsmooth,GRG2 may never encounter a point of dis-continuity. This depends on the path thatthe algorithm takes, which depends on thestarting point. GRG2 may simply skipover a discontinuity or may never encoun-ter a region where discontinuities occur.

MICROSOFT EXCEL SOLVER
September–October 1998 43
Problems occur when the finite differenceprocess (which approximates partial deriv-atives) spans both sides of a discontinuity,for then the estimated derivatives arelikely to be very large. If GRG2 is converg-ing to a local solution where the objectiveis nonsmooth, inaccurate derivative esti-mates near the solution are likely to causeit to oscillate about that point and to ter-minate because of a small fractionalchange in the objective.Modeling Practice
The path GRG2 takes and the scaling
factors it uses depend on the initial valuesof the variables. Users should take care tostart the solution process with values forthe variable cells that are representative ofthe values expected at the optimal solu-tion, rather than with arbitrary values,such as all zeroes. The example spread-sheet in Figure 6, which is available fordownload on Practice Online, is an Excelversion of a product-mix and pricingmodel from Fylstra [1992]. If the model issolved with initial values of zero for allfour variables, GRG2 stops immediately,
Figure 6: This spreadsheet, which can be downloaded from Practice Online as FIGURE6.XLS,causes the GRG2 nonlinear solver to stop at a nonoptimal solution if the initial values of allvariables are zero. GRG2 finds the correct optimal solution for initial variable values that makethe profits per unit positive.

FYLSTRA ET AL.
INTERFACES 28:5 44
declaring this point to be an “optimal so-lution” (in fact, this point is a Kuhn-Tucker point). With initial values thatmake each quantity to build and the profitper unit positive, GRG2 finds the correctoptimal solution. Alternatively, if onechanges the constraint that requires pro-duction to be less than or equal to demandto an equality constraint, GRG2 is able tofind the correct solution even with initialvalues of zero, since it can solve for certainvariables in terms of others.
We encourage users who encounter dif-ficulty with slow progress or who receivethe message “Solver converged to the cur-rent solution” to upgrade to Excel 97,which allows them to control the conver-gence tolerance. The example model in
Figure 7, also available for download onPractice Online, is a variant of the QuickTour worksheet distributed with Excel. Ifthis model is solved in Excel 97 with thedefault convergence tolerance of 1014, theSolver stops with the message “Solverconverged to the current solution” and anobjective value of $79,705.55, just short ofthe true optimum. If the convergence tol-erance is tightened to 1015, the Solverstops with “Solver found a solution” andan objective value of $79,705.62. (In Excel5.0 and 7.0, solving this model yields theoptimal objective of $79,705.62, becausethe convergence tolerance is hard-wired inthese versions to 1015.)
GRG2 uses the value in the Precisionedit box shown in Figure 4 (default 1016)
Figure 7: This spreadsheet, which can be downloaded from Practice Online as FIGURE7.XLS,shows how the GRG2 nonlinear solver can stop with the message “Solver converged to the cur-rent solution.” With a tighter convergence tolerance, it stops at a slightly better, optimal pointwith the message “Solver found a solution.”

MICROSOFT EXCEL SOLVER
September–October 1998 45
for its feasibility tolerance. Constraints areclassified as active when they are withinthis (absolute) tolerance of one of theirbounds and are violated when their boundviolation exceeds this tolerance. The de-fault value is rather tight for nonlinearproblems, and users may find that theycan solve some problems with nonlinearconstraints faster or even to a better resultif they increase this value. We recommend1014 for nonlinear problems but cautionagainst using values greater than 1012.Users requiring high accuracy may preferthe default value. For nonlinear problems,maximum accuracy results from choosingcentral differences and the default feasibil-ity tolerance.
When a model is nonsmooth or noncon-vex, we recommend trying several differ-ent starting points. If GRG2 reachesroughly the same final point, one can befairly confident that this is a global solu-tion. If not, one can choose the best of thesolutions obtained.
For further information on reduced gra-dient methods and the GRG2 solver, seeLasdon and Smith [1992].Solving Problems with IntegerConstraints
When a problem includes integer vari-ables, the Excel Solver invokes a branch-and-bound (B&B) algorithm that can useeither the simplex method or GRG2 tosolve its subproblems. The user indicateswhich of the decision variables are integerby adding constraints, such as A1:A10 4
integer (or, in Excel 97, A1:A10 4 binary),where A1:A10 is a range of variable cells.(One enters such constraints by selecting“int” or “bin” from the Relation list in theAdd or Change Constraints dialog box.)
The branch-and-bound algorithm startsby solving the relaxed problem (withoutthe integer constraints) using either GRG2or the simplex method, yielding an initialbest bound for the problem including theinteger constraints. The algorithm then be-gins branching and solving subproblemswith additional (or tighter) bounds on theinteger variables. A subproblem whose so-lution satisfies all of the integer constraintsis a candidate for the solution of the over-all problem; the candidate with the bestobjective value so far is saved as the in-cumbent. The algorithm uses the best ob-jective of the remaining nodes to be fath-omed to update the best bound. Each timethe algorithm finds a new incumbent, itcomputes the relative difference betweenits objective and the current best bound,yielding an upper bound on the improve-ment in the objective that might be ob-tained by continuing the solution process:
Objective(Incumbent) 1 Objective(BestBound).
Objective(BestBound)
If this value is less than or equal to theTolerance edit box value (Figure 4), the al-gorithm stops. Some users have failed tonotice that the default tolerance amount isnot zero but 0.05 and have therefore con-cluded that the Excel Solver was not find-ing the correct integer solution. We chosethis default value, at Microsoft’s request,to limit the time taken by nontrivial inte-ger problems. It often happens that thebranch-and-bound algorithm finds a rea-sonably good solution fairly quickly andthen spends a great deal of time finding(or verifying that it has found) the true in-teger optimal solution.
In the standard Excel Solver, the branch-

FYLSTRA ET AL.
INTERFACES 28:5 46
and-bound algorithm uses a breadth-firstsearch that branches on the unfathomednode with the best objective. Frontline Sys-tems’ Premium Solver products use muchmore elaborate strategies (Table 1). Theseinclude a depth-first search that continuesuntil it finds an incumbent, followed by abreadth-first search; more sophisticatedrules for choosing the next node to be fath-omed; rules for reordering the integer vari-ables chosen for branching; use of the dual-simplex method for the subproblems; andpreprocessing-and-probing (P&P) strategiesfor binary integer variables. These im-provements often dramatically reduce solu-tion time on integer problems (Table 1).
It is possible to solve nonlinear integerproblems with the Excel Solver, but usersshould be aware of the intrinsic limitationsof this process. On a linear problem, thesimplex method can conclusively deter-mine whether each subproblem is feasibleand, if so, return the globally optimal so-lution to that subproblem. On nonlinearinteger problems, the GRG algorithm (orany gradient-based method) may fail tofind a feasible solution for a subproblemeven though one exists, or it may return alocal optimum that is not global. This alsomeans that the best bound used by thebranch-and-bound algorithm will be basedon local optima found by GRG2 and thismay not be the global optimum. Becauseof this, the branch-and-bound algorithm isnot guaranteed to find the true integer op-timum for nonlinear problems, althoughit will often succeed in finding a “good”integer solution.Modeling Practice
It is important for users to understandthe role of the Tolerance edit box value. In
a classroom environment, instructors maywish to have students set this value tozero to ensure that the Solver will con-tinue branching until it finds the optimalinteger solution.
Users attempting to solve nonlinear in-teger problems should also take carefulnote of the limitations cited above for thebranch-and-bound algorithm when usedwith GRG2.
Even small, academic-size integer prob-lems may require a great deal of solutiontime with the standard Excel Solver. Hereagain, we recommend an upgrade to Excel97, which will improve solution times forboth linear and nonlinear subproblems.An even better alternative is Frontline Sys-tems’ Premium Solver for Excel 97, whichoffers algorithmic improvements to reduceboth the number of subproblems and thetime spent on each one. An academic ver-sion of the Premium Solver is availableand has proven quite popular with busi-ness school instructors.Saving the Solution and ProducingSolver Reports
When one of the Excel Solver’s optimiz-ers returns a solution, the Solver places thesolution values into the decision variablecells, recalculates the spreadsheet, and dis-plays the Solver Results dialog box(Figure 8). From this dialog box, the usercan choose to keep the optimal solution, ordiscard it and restore the initial values ofthe variables. In addition, the user can se-lect one or more reports, which the Solverwill then produce in the form of addi-tional worksheets inserted into the currentworkbook.
Assuming that the user (or a Visual Ba-sic program controlling the Solver) decides

MICROSOFT EXCEL SOLVER
September–October 1998 47
Figure 8: The Solver Results dialog box is displayed whenever the Solver stops. It allows theuser to keep the solution or restore the original values of the variable cells and produce one ormore of the Solver’s reports.
to keep the solution, the Solver updates allof the model’s results appropriately, in-cluding the objective, the constraints, andother auxiliary calculations that depend onthe decision variables. One can use any ofthese model values to draw charts andgraphs, update external databases, and thelike using standard Excel facilities. A Vi-sual Basic program may also inspect thevalues and may further manipulate themor store them for later use. For example, itis an easy classroom exercise to generateand graph the efficient frontier in a portfo-lio optimization problem in finance.
The standard Excel Solver can producethree types of reports: the Answer Report(Figure 9), the Sensitivity Report (Figure10), and the Limits Report (Figure 11). ThePremium Solver products (Table 1) canalso produce a Linearity Report and a Fea-sibility Report. The Linearity Report high-lights the constraints involved when an at-tempt to solve with the simplex methodfails the linearity test described earlier. TheFeasibility Report highlights an “irreduci-ble inconsistent system” of constraints[Chinneck 1997] when an attempt to solvea linear problem yields no feasible
solution.The Answer Report provides the initial
and final values of the variables and theobjective and optimal values for each con-straint’s left-hand side as well as slackvalues for nonbinding constraints.
The Sensitivity Report provides final so-lution values and dual values for variablesand constraints in both linear and nonlin-ear models. For linear models, the dualvalues are labeled “reduced costs” and“shadow prices”; their values and rangesof validity are included in the report. Fornonlinear models, the dual values arevalid only for small changes about the op-timal point, and they are labeled “reducedgradients” and “Lagrange multipliers.”
The Solver creates the Limits Report byrerunning the optimizer with each deci-sion variable selected in turn as the objec-tive, both maximizing and minimizing,while holding all other variables fixed attheir optimal values. The report shows theresulting lower limit and upper limit foreach variable and the corresponding valueof the original objective function. OR/MSprofessionals are sometimes puzzled bythe inclusion of this report, but Microsoft

FYLSTRA ET AL.
INTERFACES 28:5 48
Figure 9: The Answer Report summarizes the initial and final values of the variables, con-straints, and objective and indicates whether the constraints are binding (satisfied with equal-ity) or have slack.
specified it for competitive reasons, sincethe former Lotus-developed solver in 1-2-3featured a similar report.Report Pitfalls
There are two pitfalls that users some-times encounter with these reports. Themore common problem arises from thefact that the report spreadsheets are con-structed so that each cell “inherits” its for-matting from the corresponding cell in theuser’s model. This feature, which Micro-soft specified, has the advantage that the
report values are automatically formattedwith dollars and cents, percent symbols,scientific notation, or whatever customformatting was used in the model. The pit-fall arises when users format their modelsto display variable and constraint valuesrounded to integers (say), which causesthe corresponding dual values to be for-matted as integers also. Not realizing this,some users think that the dual values arewrong. However, the Solver stores thedual values to full precision on the report

MICROSOFT EXCEL SOLVER
September–October 1998 49
Figure 10: The Sensitivity Report shows, for linear problems, reduced costs for the variablesand shadow prices for the constraints, as well as the ranges of validity of these dual values.
Figure 11: The Limits Report shows the objective value obtained by maximizing and minimiz-ing each variable in turn while holding the other variables’ values constant.

FYLSTRA ET AL.
INTERFACES 28:5 50
spreadsheet; one can inspect each value byselecting it with the mouse, and one caneasily reformat the values to whatever pre-cision one desires.
The second pitfall relates only to theSensitivity Report. The Excel Solver recog-nizes constraints that are simple boundson the variables and passes them in thisform to both the simplex and GRG2 op-timizers, where they are handled more ef-ficiently than if they were included as gen-eral constraints. If one of these constraintsis binding at the solution this actuallymeans that the corresponding decisionvariable has been driven to its bound. Thedual value for this binding constraint willappear as a reduced cost for the decisionvariable, rather than as a shadow price forthe constraint; it will be nonzero if thevariable was nonbasic at the solution. (Infact, constraints that are simple bounds onthe variables are never listed in the Con-straints section of the Sensitivity Report.)
We encourage modelers to take advan-tage of the fact that the reports are spread-sheets. Not only can they view them butthey can easily modify them, use them todraw charts and graphs, transfer them toother programs, or inspect them using Vi-sual Basic programs. Since the reportsshow a text label as well as a cell referencefor each variable and constraint, users caneasily design their spreadsheet models sothat meaningful labels appear on the re-ports. The algorithm for constructing theselabels is very simple: starting from thevariable or constraint cell on the modelworksheet, the Solver looks left and up forthe first text label in the same row andthe first text label in the same column. Itthen concatenates these two labels to
form the label that appears for that cell inthe report.
Users should avoid the pitfalls citedabove. Because the default formatting forcells is general, report values will appearto full precision unless the user definescustom formatting for the variable or con-straint cells. If one wants such formatting,one must simply bear in mind its effect onthe reports. To see the dual values for sim-ple variable bounds in the Constraints sec-tion of the Sensitivity Report, one canmodify the constraint right-hand side tobe (say) the formula 0 ` 5 rather than theconstant 5. In this case, the Solver will notrecognize the constraint as a simple vari-able bound. In Frontline Systems’ Pre-mium Solver products, we changed thisreport so that dual values always appearin the Constraints section of the report,even for constraints that are recognized assimple variable bounds, making thiswork-around unnecessary.Use of the Solver in Industry
We have heard many opinions aboutuse of the Excel Solver from OR/MS pro-fessionals. Many view spreadsheet solversas suitable only for quite small problemsor only for educational rather than indus-trial use. Some wonder how such tools canbe successfully employed by individualswith little if any formal training inOR/MS methods. Some, seeing little usageof the Excel Solver among their colleagues,think that the Solver is widely distributedbut not very widely used.
We do not have enough systematic datato project the actual number of users ofthe Excel Solver among the 30-million-pluscopies of Microsoft Office and Excel dis-tributed to date. But based on our contacts

MICROSOFT EXCEL SOLVER
September–October 1998 51
with users and the data we do have, webelieve that OR/MS professionals are see-ing only the proverbial tip of the icebergand that use of the Excel Solver is farmore widespread than their commentswould suggest.Problem Size
Having worked with commercial usersfor more than five years, we are very con-fident that spreadsheet solvers are capableof solving the majority of industrial LPmodels, as well as many integer and non-linear models. We base this belief on ourown experience and on information aboutproblem size gained in discussions withother vendors of (non-spreadsheet-based)optimization software. In fact, we believethat the median-size industrial LP modelis smaller than many OR/MS profession-als might expect—possibly as small as2,000 rows and columns. Spreadsheet op-timizers can readily handle problems wellabove this size.Model Developers
OR/MS professionals usually create op-timization models in situations where themodeling task is challenging enough andthe economic value of the problem is largeenough to justify expert consulting help.These problems are often much larger thanour median size estimate. But this is a tinypart of the spectrum of optimization appli-cations that we see. Many spreadsheetmodels are straightforward, successfuladaptations of classic forms, such as trans-portation, blending, multiperiod inventory,and portfolio-optimization problems.These models are created by functionalmanagers who base them on the examplessupplied with Excel or found in variousbooks (indeed, such users often seek out
the textbooks that we feature on the Front-line Systems’ Web site). In other cases,these spreadsheet optimization models arecreated by outside consultants with indus-try expertise, rather than OR/MS expertiseper se.OR/MS Training
Every day we see successful Solver ap-plications created by spreadsheet userswith little or no formal OR/MS training.Users of Frontline Systems’ PremiumSolver products are typically solving LPmodels in the range of several hundred toa few thousand (some as large as 10,000)decision variables and constraints and in-teger and nonlinear problems of some-what smaller size. Although this group isself-selected for applications more ambi-tious than those built with the standardExcel Solver, we estimate that 90 to 95 per-cent of these users have no affiliation withthe OR/MS community. They are clearly“dispersed practitioners” [Geoffrion 1991].
Yet this is just another layer of the ice-berg. A much larger number of ExcelSolver users visit Frontline Systems’ WorldWide Web site (www.frontsys.com), whichreceives more than 10,000 “hits” per day.We have some survey data on these usersthat indicate that a surprising number ofSolver applications are below 200 vari-ables in size but are of sufficient value thattheir developers are planning to distributecopies of these applications within theirorganizations or commercially. Thissurvey data and our experience in techni-cal support lead us to believe that thisclass of applications is at least fivetimes and perhaps 10 times larger thanthe class of applications above 200variables.

FYLSTRA ET AL.
INTERFACES 28:5 52
Still deeper in the iceberg are thesmaller-size spreadsheet solver applica-tions that are developed for use withinonly one department or office and not forredistribution. These users may well findthat the standard Excel Solver, Microsofttechnical support, and the variety of tradebooks about Excel meet all of their needs.We believe that this group is the largest ofall, but we are unable to estimate its size.In any case, we are reasonably certain thatOR/MS professionals collectively are in-volved in, at most, a fraction of one per-cent of the Excel Solver applications actu-ally in use.Economic Value
Small optimization models may yieldhigh economic value. In one case, a For-tune 50 company (which prefers to remainanonymous) used the standard ExcelSolver to build a purchasing logisticsmodel used in negotiating contracts forover a billion dollars worth of a singlecommodity. This model, whose size was afunction of the number of supplier loca-tions and company plants, fit within the200-variable limit of the standard Solver.Savings from use of this model amountedto nearly $3 million in the first round ofpurchasing negotiations and the companyestimates future savings of $7 million peryear. A major difference from the OR/MSsuccesses of the 1970s was the time and ef-fort required to formulate, test, and gainacceptance of this model. One individual,with no formal OR/MS training, com-pleted the entire project in three person-months, with about one month spent onthe actual optimization model. The result-ing spreadsheet is operated directly by thesenior vice president of purchasing. The
return on investment in such applicationprojects is extremely high.Use of the Solver in Education
Spreadsheets have become the preferredtool for teaching quantitative methods toundergraduate and graduate business stu-dents. Their use is strongly endorsed in arecent report of the operating subcommit-tee of the INFORMS Business School Edu-cation Task Force [Jordan et al. 1997]. InJuly 1994, the presidents of ORSA andTIMS, Dick Larson and Gary Lilien, char-tered the INFORMS Business School Edu-cation Task Force in response to the de-cline of OR/MS content in businesseducation that began in the early ’90s. Thetask force’s survey of business schoolOR/MS faculty (306 responses) revealedthat many faculty members planned to in-crease their use of spreadsheets (Table 2)to strengthen the role of OR/MS in theirMBA programs.
The subcommittee also conducted struc-tured telephone interviews with programadministrators at 21 of the leading MBAprograms in the US. One of the questionsthey asked was “What particular sets ofquantitative skills are in greatest demandfrom employers of your graduates?” Theinterpretation of responses was “Demandfor particular ‘hard’ OR/MS skills is verylow. Where technique is needed, it in-volves statistics more than OR/MS. Thereis demand for general skill in model for-mulation and interpretation and in quanti-tative reasoning.” A related question was“What level of competence is appropriatefor MBAs?” and it had the summarized re-sponse “MBAs need to be able to usespreadsheets and statistical software at thelevel of the ‘educated consumer.’ ”

MICROSOFT EXCEL SOLVER
September–October 1998 53
Questions and responses %
Which of the following “fixes” have the highest potential to strengthen the role of MS/ORin your particular school of business?
More use of cases and real-world examples 60More emphasis on modeling skills and numeracy and less on algorithms 55Better math background for students 49Use of spreadsheets instead of special purpose OR/MS software 39
What changes are you planning to make in your MS/OR course in the near future?More emphasis on modeling and less on the teaching of algorithms 55Increasing the role of the computer in the course 43More use of spreadsheets in the course 37More case analyses 34
Table 2: Two questions and the most often selected responses from the INFORMS BusinessSchool Education Task Force’s 1997 survey of business school OR/MS faculty (306 respon-dents).
The authors of the report conclude thatOR/MS courses in business schoolsshould focus on common, realistic busi-ness situations, acknowledge importantnonmathematical issues, use spreadsheets,and emphasize model formulation andassessment more than model structuring.Recommendations include the following:embed analytical material strongly in abusiness context; use spreadsheets as a de-livery vehicle for OR/MS algorithms; andstress the development of general model-ing skills.
There are now strong trends in these di-rections, most of which began well beforethe INFORMS report appeared. They aremost prominent in the form of new text-books for the basic OR/MS course for un-dergraduate or graduate business stu-dents. Such texts include those of Hesse[1997], Ragsdale [1997], Winston andAlbright [1997], a revision of the Eppenand Gould text [Eppen et al. 1998], and abook by Sam Savage [1997]. The authorsuse spreadsheet models as the focusaround which they base all discussion and
examples. All use the Excel Solver for op-timization, and several use spreadsheetadd-ins for decision tree analysis andMonte Carlo simulation. All include a diskcontaining a complete set of spreadsheetfiles, bundled with the text and intendedfor student use, and an instructor’s disk orCD-ROM containing spreadsheets for eachproblem and case. Some contain a shellversion of the instructor spreadsheets, inwhich the members and formulas areomitted. These greatly ease the instructor’stask of grading many spreadsheets, espe-cially when he or she uses the gradingmacros that are provided for someproblems.
In the introductions to these texts, theauthors advocate a course based on learn-ing modeling by doing examples. They in-clude many traditional examples from theoperations management area of business:production and inventory planning, distri-bution inventory models, and so forth. Inaddition, they include problems from fi-nance (portfolio selection, options pricing,cash management), and marketing (sales-

FYLSTRA ET AL.
INTERFACES 28:5 54
force allocation). Problems in finance andmarketing are often of more interest toMBA students than the traditional opera-tions examples.
Outside the traditional OR/MS course,new texts are also appearing with a focuson spreadsheets. For example, the market-ing textbook by Lilien and Rangaswamy[1997] includes 17 models in Excel, mostusing the Solver, controlled by the au-thors’ programs written in Visual Basic forApplications.
For more on configuring a successfulOR/MS course for business students seethe articles by Bodily [1996] and Powell[1995] and many other articles in the“Teachers forum” section of Interfaces.Conclusions and Directionsfor Future Work
We designed the Excel Solver to “makeoptimization a feature of spreadsheets.”Where OR/MS professionals tend to see itas simply another tool for doing optimiza-tion, managers in industry tend to see it asan extension of spreadsheet technologythat enables them to solve resource-allocation problems in a new way, in theirown work groups, without outside help.
Our most important direction for futurework is to extend the range of optimiza-tion problems that managers can solvewithout special OR/MS training or out-side help. Classical linear and smooth non-linear functions are too restrictive formany of the problems our users want tosolve. The use of integer variables andspecial constraints to express such con-structs as fixed charges and either-or con-ditions is unnecessarily complex for users;familiar spreadsheet functions, such as IF,CHOOSE, and LOOKUP (which may de-
pend on the variables), could be used toexpress these concepts directly. In the fu-ture, we would like to support the creationof optimization models using as much ofthe full power of the spreadsheet formulalanguage as possible. To do this, we expectto perform more analysis and transforma-tion of the spreadsheet formulas, obtainingthe Jacobian matrix through a combinationof automatic differentiation of the mostcommon operators and functions and theselective use of finite differences for oth-ers. We are also considering approaches toglobal optimization and heuristics and al-gorithmic methods that yield good solu-tions that may not be provably optimal(for example, clustering methods, geneticalgorithms, and simulated annealing),since our users have clearly indicated theirinterest in such methods.
Spreadsheets, such as Excel, have be-come so ubiquitous that they serve as akind of lingua franca for quantitativemodels, understood by nearly every deci-sion maker in industry, government, andeducation. Because of this universality,spreadsheet software has become an excel-lent delivery vehicle for such OR/MStechniques as optimization, as the ExcelSolver clearly demonstrates. We encourageOR/MS professionals to gain experiencewith these tools and explore the world ofspreadsheet-based problem solving thatcontinues to grow outside the traditionalboundaries of the field.
We also encourage OR/MS profession-als to communicate with Microsoft andwith Frontline Systems about their desiresfor the Excel Solver. E-mail is the preferredmethod: Microsoft welcomes feedback onthe Solver and other Excel features sent to

MICROSOFT EXCEL SOLVER
September–October 1998 55
[email protected], while FrontlineSystems welcomes feedback sent [email protected]. By making their voicesheard, OR/MS professionals can influencethe future direction of software such as theExcel Solver.ReferencesBodily, S. 1996, “Teaching MBA quantitative
business analysis with cases,” Interfaces, Vol.26, No. 6, pp. 132–149.
Brooke, A.; Kendrick, D.; and Meeraus, A.1992, GAMS, A User’s Guide, Boyd and Fra-ser, Danvers, Massachusetts.
Chinneck, J. W. 1997, “Finding a useful subsetof constraints for analysis in an infeasible lin-ear program,” INFORMS Journal on Comput-ing, Vol. 9, No. 2, pp. 164–174.
Conway, D. and Ragsdale, C. 1987, “Modelingoptimization problems in the unstructuredworld of spreadsheets,” Omega, Vol. 25, No.3, pp. 313–322.
Enfin Software Corporation 1988, Optimal So-lutions User Manual, San Diego, California.
Eppen, G. D.; Gould, F.; Schmidt, C.; Moore, J.;and Weatherford, L. 1998, IntroductoryManagement Science: Decision Modeling withSpreadsheets, fifth edition, Prentice Hall, En-glewood Cliffs, New Jersey.
Fourer, R.; Gay, D. M.; and Kernighan, B. W.1993, AMPL: A Modeling Language for Mathe-matical Programming, Duxbury Press, PacificGrove, California.
Frontline Systems Inc. 1990, What-If Solver UserGuide, Incline Village, Nevada.
Frontline Systems Inc. 1994, Solver User Guide:Premium, Quadratic, and Large-Scale LP Solv-ers, Incline Village, Nevada.
Fylstra, D. 1992, The Student Edition of What-IfSolver, Addison-Wesley Longman, Reading,Massachusetts.
Geoffrion, A. M. 1991, “Forces, trends, and op-portunities in management science andoperations research,” Operations Research, Vol.4, No. 3, pp. 423–445.
Gill, P. E.; Murray, W.; and Wright, M. H. 1981,Practical Optimization, Academic Press, SanDiego, California.
Griewank, A. and Corliss, G. F. 1991, AutomaticDifferentiation of Algorithms: Theory, Implemen-tation, and Application, SIAM Press, Philadel-
phia, Pennsylvania.Hesse, R. 1997, Managerial Spreadsheet Modeling
and Analysis, Richard D. Irwin, Burr Ridge,Illinois.
Jordan, E.; Lasdon, L.; Lenard, M.; Moore, J.;Powell, S.; and Willemain, T. 1997, “OR/MSand MBA’s—Mediating the mismatches,”OR/MS Today, February, pp. 36–41.
Lasdon, L. S.; Waren, A. D.; Jain, A.; and Ratner,M. 1978, “Design and testing of a generalizedreduced gradient code for nonlinear program-ming,” ACM Transactions on Mathematical Soft-ware, Vol. 4, No. 1, pp. 34–49.
Lasdon, L. S. and Smith, S. 1992, “Solving largesparse nonlinear programs using GRG,”ORSA Journal on Computing, Vol. 4, No. 1, pp.2–15.
Lilien, G. and Rangaswamy, A. 1997, MarketingEngineering: Computer-Assisted MarketingAnalysis and Planning, Addison-Wesley Long-man, Reading, Massachusetts.
Lotus Development Corp. 1990, 1-2-3/G UserGuide, Cambridge, Massachusetts.
Ng, E. and Char, B. W. 1979, “Gradient and Ja-cobian computation for numerical applica-tions,” Proceedings of the 1979 Macsyma User’sConference, Washington, DC, pp. 604–621.
Person, R. 1997, Using Microsoft Excel 97, QueCorp./Macmillian Computer Publishing, In-dianapolis, Indiana.
Powell, S. G. 1995, “Teaching the art of model-ing to MBA students,” Interfaces, Vol. 25, No.3, pp. 88–94.
Ragsdale, C. T. 1997, Spreadsheet Modeling andDecision Analysis, second edition, South-Western Publishing, Cambridge,Massachusetts.
Savage, S. L. 1985, What’sBest! User Manual,General Optimization Inc., Chicago, Illinois.
Savage, S. L. 1997, INSIGHT Business AnalysisTools for Excel, Duxbury Press, Pacific Grove,California.
Winston, W. L. and Albright, S. C. 1997, Practi-cal Management Science: Spreadsheet Modelingand Applications, Duxbury Press, PacificGrove, California.