Design and Performance Evaluation of Circular Chisel Plow ... · chisel plow designed in the form...
18
International Journal of Emerging Technology and Advanced Engineering Website: www.ijetae.com (ISSN 2250-2459, ISO 9001:2008 Certified Journal, Volume 4, Issue 11, November 2014) 1 Design and Performance Evaluation of Circular Chisel Plow in Calcareous Soil Meselhy, A. A. 1 1 Researcher in Soil Conservation and Water Resources Department, Desert Research Center, Egypt. Abstract - The research aims to design and manufacture of circular chisel plow which cultivates the soil in peripheral circles form not in straight lines as the traditional chisel plow. These peripheral circles repeated and moving forward along a tillage operation direction and make cultivated area consists of overlapping cultivated circles, which increases the tillage efficiency compared with traditional chisel plow. The circular chisel plow designed in the form of circular an average diameter of 1.5 meters spread over the circumference of plow seven shanks with seven chisel blades were willing to work in four directions. The circular chisel plow consists of two parts, a fixed part of the three hitch point with tractor and other moving part based on a central axis with ball bearing this is a moving part which carries the seven shanks. The circular chisel plow moves two movements: the first movement is conventional movement to forward direction with tractor and the second movement is rotational by P.T.O of the tractor, where the rotational motion of the plow make cultivated peripheral circles of soil this cultivated circles repeated along the line of tillage operation. As a result of the two movement (forward and rotational) the chisel blades of circular plow work in all directions, from north to south and vice versa, east to west and vice versa and move diagonally. These movements in many directions allowing to this plow for producing more fragmentation of soil clods and leave the soil surface more leveling unlike with traditional chisel plow. So that the chisel blade for the circular chisel plow consists of four perpendicular blades to cultivate the soil in all directions with the rotation of the plow. The efficiency of circular chisel plow in fragmentation of soil clods increases by increasing the rotation velocity of the plow as fast as compared with the forward speed of tractor, which makes a more number of cultivated circles per unit area and increases the degree of the fragmentation of soil clods. The evaluation process for circular chisel plow was performed by carrying out two field experiments in Maryut Research Station in Alexandria governorate through calcareous sandy clay loam soil as follows: The first field experiment conducted to select the optimum rotation velocity for the circular chisel plow so that three rotation velocity were tested (30, 60 and 90 r.p.m) the results showed that velocity of 90 r.p.m achieved the pest results compared with other velocities 30 and 60 r.p.m, where obtained the highest increasing percentage in actual field capacity, field efficiency, soil porosity and fuel consumption. But achieved the highest decreasing percentage in soil bulk density, soil penetration resistance, soil mean weight diameter, soil surface roughness, pulling force and the tillage cost. The second field experiment conducted to evaluate the performance of the circular chisel plow by compared between three plows (traditional chisel plow, circular chisel plow without rotational motion and circular chisel plow with rotational motion, at rotation velocity has been tested in the first experiment (90 r.p.m)), three levels of the tractor forward speed (3.5 km/h, 5.5 km/h and 7.5 km/h) and two levels of tractor passes (one pass and two passes) the treatment of circular chisel plow with rotational motion achieved the pest results compared with traditional chisel plow and circular chisel plow without rotational motion, especially at forward speed of 7.5 km/h and two passes, where this treatment achieved the highest increasing percentage in actual field capacity, field efficiency, soil porosity and wheat yield of (grain, straw and biological yield). But achieved the highest decreasing percentage in soil bulk density, soil penetration resistance, soil mean weight diameter, soil surface roughness and pulling force. The circular chisel plow with rotational motion at forward speed of 7.5 km/h and two passes achieved the highest percentage of fuel consumption, but showed a high rates of the performance rates, high productivity of wheat crop and the highest increasing percentage in net profit about of (35% and 20%) compared with traditional chisel plow and circular chisel plow without rotational motion at the same operation conditions respectively. Keywords - Calcareous soil, circular chisel plow, power requirements, soil physical properties, traditional chisel plow, and wheat yield. I. INTRODUCTION The design of tillage tools to accomplish different level of soil preparation is a very complex engineering work. This is based on the fact that different crops require different soil preparations. Different soil conditions also require different tillage operations. Shape and size are usually the first parameters to be considered in the design of any tillage tool. The shape influences the pattern of soil movement and final soil conditions while the size determines the power required to pull the tool through the soil. Although the designer can control tool shape and size, tools cannot perform optimally without proper combination and orientation of the tool design parameters. Tillage tools of different shapes and sizes have been designed and constructed for the purpose of soil manipulation.
Transcript of Design and Performance Evaluation of Circular Chisel Plow ... · chisel plow designed in the form...

International Journal of Emerging Technology and Advanced Engineering
Website: www.ijetae.com (ISSN 2250-2459, ISO 9001:2008 Certified Journal, Volume 4, Issue 11, November 2014)
1
Design and Performance Evaluation of Circular Chisel Plow in
Calcareous Soil Meselhy, A. A.
1
1Researcher in Soil Conservation and Water Resources Department, Desert Research Center, Egypt.
Abstract - The research aims to design and manufacture of
circular chisel plow which cultivates the soil in peripheral
circles form not in straight lines as the traditional chisel plow.
These peripheral circles repeated and moving forward along a
tillage operation direction and make cultivated area consists
of overlapping cultivated circles, which increases the tillage
efficiency compared with traditional chisel plow. The circular
chisel plow designed in the form of circular an average
diameter of 1.5 meters spread over the circumference of plow
seven shanks with seven chisel blades were willing to work in
four directions. The circular chisel plow consists of two parts,
a fixed part of the three hitch point with tractor and other
moving part based on a central axis with ball bearing this is a
moving part which carries the seven shanks. The circular
chisel plow moves two movements: the first movement is
conventional movement to forward direction with tractor and
the second movement is rotational by P.T.O of the tractor,
where the rotational motion of the plow make cultivated
peripheral circles of soil this cultivated circles repeated along
the line of tillage operation. As a result of the two movement
(forward and rotational) the chisel blades of circular plow
work in all directions, from north to south and vice versa, east
to west and vice versa and move diagonally. These movements
in many directions allowing to this plow for producing more
fragmentation of soil clods and leave the soil surface more
leveling unlike with traditional chisel plow. So that the chisel
blade for the circular chisel plow consists of four
perpendicular blades to cultivate the soil in all directions with
the rotation of the plow. The efficiency of circular chisel plow
in fragmentation of soil clods increases by increasing the
rotation velocity of the plow as fast as compared with the
forward speed of tractor, which makes a more number of
cultivated circles per unit area and increases the degree of the
fragmentation of soil clods. The evaluation process for
circular chisel plow was performed by carrying out two field
experiments in Maryut Research Station in Alexandria
governorate through calcareous sandy clay loam soil as
follows: The first field experiment conducted to select the
optimum rotation velocity for the circular chisel plow so that
three rotation velocity were tested (30, 60 and 90 r.p.m) the
results showed that velocity of 90 r.p.m achieved the pest
results compared with other velocities 30 and 60 r.p.m, where
obtained the highest increasing percentage in actual field
capacity, field efficiency, soil porosity and fuel consumption.
But achieved the highest decreasing percentage in soil bulk
density, soil penetration resistance, soil mean weight diameter,
soil surface roughness, pulling force and the tillage cost.
The second field experiment conducted to evaluate the
performance of the circular chisel plow by compared between
three plows (traditional chisel plow, circular chisel plow
without rotational motion and circular chisel plow with
rotational motion, at rotation velocity has been tested in the
first experiment (90 r.p.m)), three levels of the tractor
forward speed (3.5 km/h, 5.5 km/h and 7.5 km/h) and two
levels of tractor passes (one pass and two passes) the
treatment of circular chisel plow with rotational motion
achieved the pest results compared with traditional chisel
plow and circular chisel plow without rotational motion,
especially at forward speed of 7.5 km/h and two passes, where
this treatment achieved the highest increasing percentage in
actual field capacity, field efficiency, soil porosity and wheat
yield of (grain, straw and biological yield). But achieved the
highest decreasing percentage in soil bulk density, soil
penetration resistance, soil mean weight diameter, soil surface
roughness and pulling force. The circular chisel plow with
rotational motion at forward speed of 7.5 km/h and two passes
achieved the highest percentage of fuel consumption, but
showed a high rates of the performance rates, high
productivity of wheat crop and the highest increasing
percentage in net profit about of (35% and 20%) compared
with traditional chisel plow and circular chisel plow without
rotational motion at the same operation conditions
respectively.
Keywords - Calcareous soil, circular chisel plow, power
requirements, soil physical properties, traditional chisel plow,
and wheat yield.
I. INTRODUCTION
The design of tillage tools to accomplish different level
of soil preparation is a very complex engineering work.
This is based on the fact that different crops require
different soil preparations. Different soil conditions also
require different tillage operations. Shape and size are
usually the first parameters to be considered in the design
of any tillage tool. The shape influences the pattern of soil
movement and final soil conditions while the size
determines the power required to pull the tool through the
soil. Although the designer can control tool shape and size,
tools cannot perform optimally without proper combination
and orientation of the tool design parameters. Tillage tools
of different shapes and sizes have been designed and
constructed for the purpose of soil manipulation.
International Journal of Emerging Technology and Advanced Engineering
Website: www.ijetae.com (ISSN 2250-2459, ISO 9001:2008 Certified Journal, Volume 4, Issue 11, November 2014)
2
One of the most important performance criteria in tillage
tool design is the force needed to pull the tool through a
given soil (Gill and Vanden-Berg, 1967). Wismer et al.
(1968) reported that the active elements of tillage
implements can produce negative draft. Bernacki et al.
(1972) mentioned that, active implements driven by the
P.T.O shaft of the tractor. The speed of soil cutting is
always higher than the travel speed of the implement. Total
power requirements for active elements are high even
though they have low or negative draft requirements. Hillel
(1982) found that bulk density is nearly always altered by
tillage operations. An ideal soil contains about 50% solid
particles and 50% pore space by volume. Palmer and
Kruger (1982) mentioned that the pulling force for tillage
operation was dependent on implement travel speed. Singh
(1983) mentioned that tillage is a major operation for
seedbed preparation and is one of the largest material
handling operations. It is one of the major items of energy
and cost expenditure in crop production. The energy input
in soil manipulation is exceeded only by the level of energy
input in irrigation. Thus, increasing the effectiveness of
tillage. Jacobs and Harrol (1983) indicated that according
to the previous researches, about 60% of total energy
required for preparing the soil is used for tillage and
preparing a good seedbed. Therefore it is very important to
know which parameters can reduce the cost of tillage and
traffic in fields. Upadhyaya et al. (1984) mentioned that
draft also depends on soil conditions and geometry of the
tillage implements. Tractive efficiency occurs at about 5%
wheel slip on concrete, 10% on firm soil, 13% on tilled soil
and 15% on soft or sandy soil. It is most desirable to
operate near this slip to obtain maximum. Grisso and
Perumpral (1985) showed one of the main aims of a good
farm manager is to prepare the soil for planting in the
shortest possible time. This can be accomplished by
maximizing the field capacity of the tillage implement. The
field capacity, which is the rate of field coverage, is the
product of the width and speed of operation. The choice is,
therefore, between operating large equipments at low speed
or smaller equipments at higher speed. The combination
that accomplishes the task in the shortest time and keeps
the power requirements and accompanying fixed and
operating costs at a minimum is usually selected. In making
this decision, the relationship between tool force and speed
must be known. Kepner et al. (1987) reported that tillage
is one of the most fundamental and essential operations in
agricultural production. It might be defined as the
manipulation of soil to develop a desirable soil structure for
seed-bed or root-bed to provide adequate air capacity and
to establish specific surface configuration for planting
operations.
Chi and Kushwaha (1990) mentioned that draft force
are mainly influenced by physical and mechanical
properties of soil, tillage tool geometry, operation depth
and speed. Bengough and Mullins (1990) mention that
cone penetration resistance measures are useful for
assessing soil strength. Chang and Lindwall (1990)
indicated from a literature review that soil property changes
due to tillage are related to several things. Those things
include soil type, type of tillage equipment, tillage depth,
forward speed, soil conditions such as moisture content at
the time of tillage and climatic conditions. Yassen et al.
(1992) reported that increasing the plowing depth and
travel speed decreased mean weight diameter (MWD).
Singh et al. (1992) reported that penetration resistance is a
measure of soil strength and an indicator of how easily
roots can penetrate into soil, and thus a measure of plant
growth and crop yield. Suliman et al. (1993) used five
different tillage treatment and they found that both the soil
bulk density and the penetration resistance decreased after
all the tillage treatments while, both of them increased with
increasing the forward speed and tillage depth. Srivastava
et al. (1993) reported that one of the tillage implements
widely used by farmers is the chisel plow which is
considered to be a primary tillage implement because it is
mainly used for the initial soil working operations. Grisso
et al. (1994) found that the effect of speed on implement
draft depends on the soil type and the type of implement. It
has been widely reported that the draft forces on
implements increase significantly with speed and the
relationship varies from linear to quadratic. Ros et al.
(1995) indicated that tillage tools direct energy into the soil
to cause some desired effect such as cutting, breaking,
inversion, or movement of soil. Soil is transferred from an
initial condition to a different final condition by this
process. Makanga et al. (1997) mentioned that seedbed
preparation greatly contributes towards the overall cost of
farm operations, implying that significant savings are
possible through optimized design and development of
tillage machinery. Al-Suhaibani and Al-Janobi (1997)
evaluated the effects of tillage depth and forward speed on
draft of moldboard, disk and chisel plows on sandy loam
soil. The results showed that draft increased with increases
of forward speed and tillage depth for all the implements
and the moldboard and chisel plow had highest and lowest
specific draft, respectively. El-Said et al. (1998) found that
the value of soil penetration resistance increased by
increasing soil layer depth to increase the soil compaction.
Also, he indicated that the soil physical properties affected
by soil tillage treatments could influence the yield level of
grown crops.

International Journal of Emerging Technology and Advanced Engineering
Website: www.ijetae.com (ISSN 2250-2459, ISO 9001:2008 Certified Journal, Volume 4, Issue 11, November 2014)
3
Aggregate size, moisture content, penetration resistance,
and bulk density are important soil physical properties. Soil
moisture content is a very important parameter for cutting
and milling the soil by moldboard plow. With low soil
moisture content the cohesion force between particles of
soil is very strong and a lot of energy is needed during
tillage. Also after tillage there are big clods in the field.
With the higher soil moisture content, tillage equipment
cannot be used in the field. Taniguchi et al. (1999)
reported that an increase in tillage operating speed resulted
in more soil pulverization. Marquesda Silva and Soares
(2000) showed that tillage tools have impacts on the
translocation of the soil surface. Tillage operations reduce
erosion and increase the roughness. Metwalli et al. (2000)
found that soil bulk density decreased after tillage with
mouldboard plow, chisel plow (one pass) and chisel plow
(two passes) and rotary plough compared with that before
tillage. Khader (2000) reported that power and energy
requirements for tilling the soil increased by increasing the
tilling depth and operating speed. Mouazen and Ramon
(2002) reported that the draught force of a tillage
implement increases with increasing bulk density. The
relationship between draught and speed has been reported
as linear, second-order polynomial, parabolic and
exponential. These differences occur as a result of the
inertia required to accelerate soil, effect of shear rate on
shear strength and effect of shear rate on soil-metal friction,
all of which vary with soil type and condition. Macmillan
et al. (2002) reported that implement width, operating
depth and speed are factors that affect draft of a tillage
implement. Stenitzer and Murer, (2003) found that yields
of wheat increased 1.6 Mg/ha and yields of soybean
increased 1.5 Mg/ha for each 1 MPa decrease in mean
profile cone index. These results were shown on a loamy
sand. Zoz and Grisso (2003) reported that drawbar power
is defined by pull (or draft) and travel speed. Therefore, the
ideal tractor converts all the energy from the fuel into
useful work at the drawbar. Khadr (2004) concluded that
the fuel consumption, the overall energy efficiency and the
specific energy were increased with the increase of the
agricultural operating speed. Also, he indicated that net fuel
consumption of a tractor was found to be dependent upon
implement draft and plowing depth. Vidal et al. (2005)
mentioned that soil roughness describes the micro
variations in surface elevation resulting mainly from
management practices and is one of the main factors
influencing wind and water erosion. Abdel-Aal et al.
(2005) indicated that the soil bulk density and soil
penetration resistance were decreased after tillage.
Mamman and Oni (2005) reported that a soil particle size
range of 1 to 5 mm is required for seedbeds.
Draught is an important parameter for measuring and
evaluating implement performance for energy
requirements. Sahu and Raheman (2006) reported that the
draft of the tillage implements was significantly affected by
depth and speed of operation and with increase in depth
and speed of operation, the draft of the tillage implements
increased. This was because of the higher soil resistance
and more volume of soil handled with increase in depth and
higher force required accomplishing the soil acceleration
with increase in speed of operation. Boydas and Turgut
(2007) found that soil physical properties are extremely
vital to plant growth. The influence of tillage implements
on soil physical properties is significant. Panachuki et al.
(2010) found that up to 3.8 times higher surface roughness
after tillage compared before tillage. Boulal et al. (2011)
mentioned that the water storage capacity of the soil
surface depends almost exclusively on the surface
roughness. Alvarez-Mozos et al. (2011) showed that
different tillage tools have different impacts on the
translocation of the soil surface. The water storage capacity
of the soil surface depends almost exclusively on the
surface roughness. Julieta et al. (2012) mentioned that the
method of soil preparation affected of the soil surface
roughness indices significantly, demonstrating the
importance of soil tillage for the physical conditions on the
soil surface. Reported also before tillage the soil surface
roughness ranged from 3.89 to 5.99 cm and before tillage
soil surface roughness values did not differ significantly
and that an average of these values can be considered. After
soil tillage the soil surface roughness values ranged from
6.56 to 13.03 cm and the test showed that the soil surface
roughness values were 2.2 times higher after tillage
compared with before tillage because moving the soil by
tilling raises the soil surface level.
Therefore, the primary objective of this research was to
design and manufacture the circular chisel plow after that
evaluation the circular chisel plow by conducted the field
experiment in calcareous sandy clay loam soil to compare
the performance of circular chisel plow with traditional
chisel plow in different levels of tractor forward speed and
the number of tractor passes.
II. MATERIALS AND METHODS
Circular chisel plow was manufactured locally and the
evaluation process for the performance of this plow
achieved by conducting field experiment which carried out
in Maryut Experimental Station, Desert Research Center.
This study was carried out in the winter season 2013-2014
(from November 2013 to May 2014) with an experimental
area of about 1.5 feddans.

International Journal of Emerging Technology and Advanced Engineering
Website: www.ijetae.com (ISSN 2250-2459, ISO 9001:2008 Certified Journal, Volume 4, Issue 11, November 2014)
4
Tillage operation for all treatments was conducted at
20cm of tillage depth, 20% of soil moisture content (dry
base, d.b.), 40.48 % of Ca Co3 content (calcareous soil) and
the soil texture was sandy clay loam.
A. Implements Specifications:
Specifications of the implements used in this study were
summarized in Table (1).
Table 1
Some specifications of the implements.
Implement Specifications
Tractor Ursus C-385 (4 cylinders) the tractor mass
2560kg, 51.5kW (70HP). P.T.O shaft
speed 540 and 1000 r.p.m. Rear and front
wheels diameters 15.5-38 inch and 7.5-20
inch respectively.
Traditional
chisel plow
Mounted type with 150cm working width.
Seven shanks (2.5 x 7cm) arranged in two
rows. Each shank carry the chisel blade
(6cm width). The plow mass 250 kg.
Circular
chisel plow
Mounted type with 150 cm working
diameter. Seven shanks (4.5 x 4.5cm)
arranged on the circumference of the plow
body, which rotates on a central axis by
tractor P.T.O as shown in figures (1 and 2).
Each blade (6cm width) consists of four
chisel blades perpendicular to each other
which has the same dimension and
specifications for the blade of traditional
chisel plow which used in this study as
shown in figure (3). The plow mass 280
kg.
B. Experimental Procedure:
The following are the experimental details:
1. Experimental design:
Experiment area was about of 1.5 fed. This area was
divided into two pieces (two field experiments). The first
field experiment carried out to evaluate the circular chisel
plow at three levels of rotation velocity and choice the
optimum velocity of them to use it in the second
experiment. It was established as a one way completely
randomized in three replicates, divided into three plots
involved three rotation velocity (30, 60 and 90 r.p.m)
resulted in a total of 9 plots, each of 100m2. The second
field experiment carried out to compare two types of plows,
traditional chisel plow and circular chisel plow at different
levels of tractor forward speed and number of tractor
passes.
It was established as a split split plots in three replicates,
divided into three main plots involved three types of plows
(traditional chisel plow, circular chisel plow without
rotation and circular chisel plow with rotation). Each main
plot includes three sub-plots, which involved three forward
speeds (3.5, 5.5 and 7.5 km/h). Each sub-plot includes three
sub-sub-plots, which involved two number of tractor passes
(one pass and two passes). Each sub-sub-plot resulted in a
total of 54 plots, each of 100m2.
2. Wheat seeds and planting method:
The wheat was planted by seeder machine in November,
with a rate of 50 kg/fed (variety of Sakha 8) and harvested
in May.
3. Harvesting:
Before harvesting wheat crop, three randomized samples
were taken by hand from each plot using a wooden square
frame (1m2) as a simpler to determine the wheat yield per
feddan. Finally, the wheat crop was harvested using a
mounted mower and threshing by thresher. Moisture
content of wheat grain at harvesting was 12% d.b.
C. Measurements:
1. Soil bulk density.
Measured by using a core samples (Three replicates for
each sample) according to Black et al (1965) method.
2. Total soil porosity.
Determined according to Black et al. (1965) equation
as follows:
Where: Sp : Total soil porosity, (%);
ρd : Bulk density of the soil, (g/cm3) and
ρs : Density of solid soil substance, it was
assumed to be constant (2.65 g/cm3).
3. Soil penetration resistance:
Measured by a Japanese cone index penetrometer (SR-2,
DIK-500)
4. Soil mean weight diameter (M.W.D).
M.W.D. was determined according to Van Bavel,
(1949) as follows:
……….…….… (3)

International Journal of Emerging Technology and Advanced Engineering
Website: www.ijetae.com (ISSN 2250-2459, ISO 9001:2008 Certified Journal, Volume 4, Issue 11, November 2014)
5
Where: xi : The mean weight diameter of each fractions,
(mm); wi : The weight of the soil retained on i
th sieve,
(gm);
wT : The total weight of the soil retained on the
sieves, (gm);
ε I : Sieve mesh and
i : Number of sieves.
5. Soil surface roughness.
A pin meter was specifically designed on the basis of a
review of the literature (Burwell et al., 1963; Podmore
and Huggins, 1981; Wagner and Yiming, 1991) and in
keeping with the plot size (1m2) Figure (4).
Figure 1: Circular chisel plow.

International Journal of Emerging Technology and Advanced Engineering
Website: www.ijetae.com (ISSN 2250-2459, ISO 9001:2008 Certified Journal, Volume 4, Issue 11, November 2014)
6
Figure 2: Elevation and side views of the circular chisel plow.
Figure 3 Elevation and plan views of the chisel blade of circular chisel plow.

International Journal of Emerging Technology and Advanced Engineering
Website: www.ijetae.com (ISSN 2250-2459, ISO 9001:2008 Certified Journal, Volume 4, Issue 11, November 2014)
7
Figure 4: Pin-meter.
The pin-meter consisted of a row of 35cm high pins
placed in a frame in which they could slide up or down to
conform to surface irregularities. The pin heads were
marked with a blue band to better visualize their respective
positions when in contact with the soil. The device was
designed to be moved horizontally without disturbing the
pin patterns. The total height of the instrument, which made
of aluminum, was 85 cm. The pins were set against a white
backing to ensure the visibility of the blue bands. With
rows containing 50 pins spaced at 20mm intervals, each x-
axis reading covered one full meter of ground. The y-axis
readings were taken by sliding the instrument across the
one square meter plots. The cells on the resulting grid
measured 20 x 20 mm, and a total of 2500 readings were
taken per square meter. An earlier study (Garcia Moreno,
2006) showed this spacing to be sufficient to measure the
surface roughness. Soil surface roughness was computed
through the standard deviation (SD) as follow:
……..…… (4)
Where: xi is the location of the ith
measurement, Z ( x i ) is
the elevation, is the average value of set
Z( x i ) and N is the number of data points.
6. Theoretical and actual field capacity and field
efficiency.
Theoretical and actual field capacity and field efficiency
were calculated by using equations mentioned by kepner
et al, (1978).
7. Pulling force
Draft force was measured by hydraulic dynamometer
which, coupled between the two tractors with the attaching
chisel plough to estimate its draught force. A considerable
number of readings were taken at a time interval 10
seconds to obtain an accurate average of draught force.
The hitch was always adjusted in order to keep the line
of pull as horizontal as possible.
8. Fuel consumption rate.
Fuel consumption per unit time was determined by
measuring the volume of fuel consumed during plowing
time. It was calculated using the fuel meter equipment as
shown in Figure (5). The length of line which marked by
the marker tool on the paper sheet represents the fuel
consumption. The fuel meter was calibrated prior and the
volume of fuel was determined accurately.
Figure 5: Fuel meter for measuring fuel consumption.
9. Total cost of performing a tillage operation.
Total hourly cost was determined according to EL-
Awady (1978) as follows:
Where:
C: Hourly cost, (L.E./h);
p: Initial price of the tractor, (L.E);
h: Yearly working hours of tractor. (h/year);
L: Life expectancy of the tractor (year);
t: Annual taxes and overheads ratio, (%);
f: Fuel price, (L.E./L);
m: The monthly average wage, (L.E./month);
1.2: Factor accounting for lubrications;
RFC: Actual rate of fuel consumption, (L/h);
i: Annual interest rate, (%);
r: Annual repairs and maintenance ratio for tractor,
(%);
: Initial price of the preparing implement, (L.E);
: Yearly working hours of preparing implement,
(h/year);
: Annual repairs and maintenance ratio for
preparing implement, (%);

International Journal of Emerging Technology and Advanced Engineering
Website: www.ijetae.com (ISSN 2250-2459, ISO 9001:2008 Certified Journal, Volume 4, Issue 11, November 2014)
8
L1: Life expectancy of preparing implement (year)
and
144: Operator monthly average working hours,
(h).
Total cost per unit area was determined as follows:
Tca = C /Afc …………………………… (6)
Where: Tca : Total cost of unit area, (L.E/fed);
Afc : Actual field capacity, (Fed/h) and
C : Hourly cost, (L.E/h).
III. RESULTS AND DISCUSSION
Two field experiments were carried out as follows:
The first field experiment was conducted to evaluation
the circular chisel plow at three levels of rotation velocity
to choice the optimum velocity of them and using it in the
second experiment. The results showed that:
Effect of rotation velocity on measurements of the first
experiment.
The results presented in Table (2) pointed that in
general, actual field capacity, field efficiency, soil porosity
and fuel consumption increased when increasing rotation
velocity of the circular chisel plow and the rotation velocity
of 90 r.p.m achieved the highest average increasing
percentage of all previous measurements compared with
velocities 30 and 60 r.p.m about of (22% - 10%), (22% -
10%), (11% - 7%) and (8% - 17%) respectively. But found
that soil bulk density, soil penetration resistance, mean
weight diameter, soil roughness surface, pulling force and
tillage operation cost decreased when increasing rotation
velocity of the circular chisel plow and the rotation velocity
of 90 r.p.m achieved the highest average decreasing
percentage of all previous measurements compared with
velocities 30 and 60 r.p.m about of (11% - 6%), (38% -
22%), (59% - 42%), (62% - 42%), (17% - 8%) and (13% -
7%) respectively. The results showed that the rotation
velocity of 90 r.p.m is the optimum rotation velocity from
all velocities which tested in the first experiment so that
this velocity used in the second experiment when using the
circular chisel plow with rotational motion.
The second field experiment was carried out to compare
two types of plows, traditional chisel plow and circular
chisel plow at different of tractor forward speed and
number of tractor passes. The results showed that:
Effect of study treatments on actual field capacity, field
efficiency, pulling force and fuel consumption.
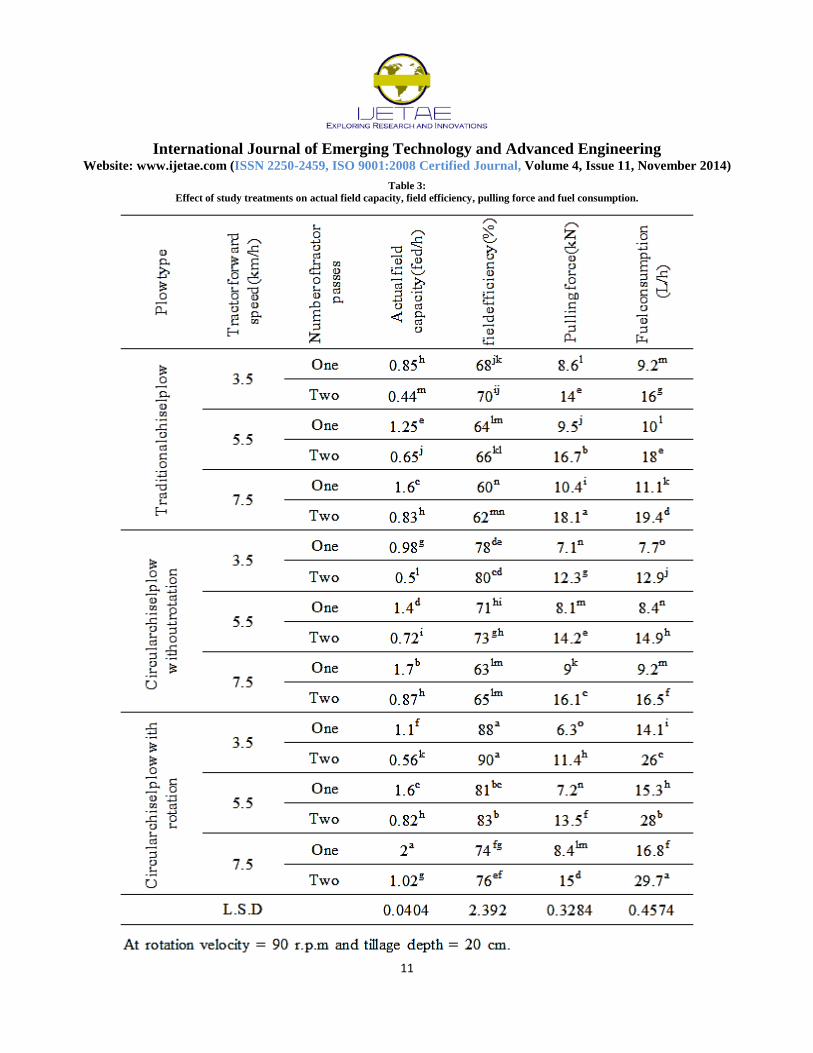
From the results as shown in Table (3) found that actual
field capacity increased with increasing forward speed and
decreased with increasing number of plow passes where the
average increasing percentage at forward speed 7.5 km/h
were (81% and 25%) compared with others two speeds 3.5
km/h and 5.5 km/h respectively. The average decreasing
percentage for actual field capacity at two passes was
(49%) compared with one pass. But field efficiency
decreased with increasing forward speed and increased
with increasing number of plow passes where the average
increasing percentage at forward speed 7.5 km/h were
(16% and 9%) compared with others two speeds 3.5 km/h
and 5.5 km/h respectively. The average increasing
percentage for field efficiency at two passes was (3%)
compared with one pass. The results showed that when
using circular chisel plow with rotational motion the actual
field capacity and field efficiency increased compared with
circular chisel plow without rotational motion and
traditional chisel plow where the average increasing
percentage were (15% and 26%) and (14% and 26%) for
actual field capacity and field efficiency respectively. The
average increasing percentage for actual field capacity and
field efficiency when using circular chisel plow without
rotational motion compared with traditional chisel plow
was (10% and 10%) respectively. The circular chisel plow
caused increasing of actual field capacity and field
efficiency compared with traditional chisel plow because
the circular shape for the circular chisel plow compared
with traditional chisel plow as shown in Figure (6).

International Journal of Emerging Technology and Advanced Engineering
Website: www.ijetae.com (ISSN 2250-2459, ISO 9001:2008 Certified Journal, Volume 4, Issue 11, November 2014)
9
Table 2:
Effect of rotation velocity on measurements of the first experiment
For example if the circular chisel plow rotation in 60
r.p.m (about one r.p.sec) therefore the plow make complete
cultivated circle of the soil after make 1/7 rotation of plow
in other words the plow make seven cultivated circles after
one sec. and assuming that the plow moved to the forward
at forward speed one m/sec so that the plow will make
seven cultivated circles in this meter of soil and the tillage
area is about of 1.5m x 2.5m as shown in Figure (6). But
the tillage area for traditional chisel plow is about of 1.5m
x 1m as shown in Figure (6). So that the circular chisel
plow cultivated the big area of soil than the cultivated area
by traditional chisel plow at the seam tillage width and
forward speed. Data in Table (3) showed that pulling force
and fuel consumption increased with increasing forward
speed and number of plow passes where the average
increasing percentage at forward speed 7.5 km/h were
(29% and 11%) and (20% and 9%) compared with others
two speeds 3.5 km/h and 5.5 km/h for pulling force and
fuel consumption respectively and the average increasing
percentage at two passes were (76% and 78%) compared
with one pass for pulling force and fuel consumption
respectively. The results showed that when using circular
chisel plow with rotational motion the pulling force
decreased compared with circular chisel plow without
rotational motion and traditional chisel plow where the
average decreasing percentage were (7% and 20%)
respectively. The average decreasing percentage for pulling
force when using circular chisel plow without rotational
motion compared with traditional chisel plow was (14%).
When using circular chisel plow with rotational motion
the fuel consumption increased compared with circular
chisel plow without rotational motion and traditional chisel
plow where the average decreasing percentage were (87%
and 55%) respectively but the fuel consumption decreased
when using circular chisel plow without rotational motion
compared with traditional chisel plow and the average
decreasing percentage was (17%). Can be summarized why
the pulling force decreased when using circular chisel plow
compared with the traditional chisel plow as the following:
- First, in the case of rotation of the circular chisel plow
by P.T.O. Because that the rotation velocity of the plow
faster than the forward speed of the tractor, the plow
cultivates the soil due to rotation force before it moves to
forward, which leading to reduce the pulling force of the
circular chisel plow compared with traditional chisel plow.
- Second, in the case of not rotation of the circular
chisel plow by P.T.O (free rotation). In this case the
circular chisel plow make free rotation around its central
axis and be in a balance position if the number of shanks of
plow on the both of sides of the central axis is equal, as
shown in Figure (7), but when the plow moves to forward
during tillage process, as a result of unequal the number of
shanks on both sides of the central axis which causing
increasing cumulative resistance of the soil on one side
than the other and causing rotation the plow around its
central axis and this rotational motion is working to
cultivate the soil and this rotation is working to avoid the
strong rocks in soil, which resulting in the end decreases
the pulling force compared with traditional chisel plow.

International Journal of Emerging Technology and Advanced Engineering
Website: www.ijetae.com (ISSN 2250-2459, ISO 9001:2008 Certified Journal, Volume 4, Issue 11, November 2014)
10
Effect of study treatments on soil bulk density, soil porosity,
soil penetration resistance, mean weight diameter and soil
roughness surface.
Table (4) showed that soil bulk density, soil penetration
resistance, mean weight diameter and soil roughness
surface decreased with increasing both of forward speed
and number of plow passes where the average decreasing
percentage at forward speed 7.5 km/h were (9% and 4%),
(38% and 24%), (42% and 25%) and (37% and 22%)
compared with others two speeds 3.5 km/h and 5.5 km/h
respectively. The average decreasing percentage for soil
bulk density, soil penetration resistance, mean weight
diameter and soil roughness surface at two passes were
(2%, 10%, 12% and 10%) compared with one pass
respectively. The results showed that when using circular
chisel plow with rotational motion soil bulk density, soil
penetration resistance, mean weight diameter and soil
roughness surface decreased compared with circular chisel
plow without rotational motion and traditional chisel plow
where the average decreasing percentage were (6% and
10%), (33% and 42%), (41% and 56%) and (44% and 53%)
for soil bulk density, soil penetration resistance, mean
weight diameter and soil roughness surface respectively.
The average decreasing percentage for soil bulk density,
soil penetration resistance, mean weight diameter and soil
roughness surface when using circular chisel plow without
rotational motion compared with traditional chisel plow
were (5%, 13%, 24% and 16%) respectively. The data in
Table (4) showed that soil porosity increased with
increasing both of forward speed and number of plow
passes where the average increasing percentage at forward
speed 7.5 km/h were (8% and 4%) compared with others
two speeds 3.5 km/h and 5.5 km/h respectively. The
average increasing percentage for soil porosity at two
passes was (2%) compared with one pass. The results
showed that when using circular chisel plow with rotational
motion soil porosity increased compared with circular
chisel plow without rotational motion and traditional chisel
plow where the average increasing percentage were (6%
and 10%) respectively. The average increasing percentage
for soil porosity when using circular chisel plow without
rotational motion compared with traditional chisel plow
was (4%).
International Journal of Emerging Technology and Advanced Engineering
Website: www.ijetae.com (ISSN 2250-2459, ISO 9001:2008 Certified Journal, Volume 4, Issue 11, November 2014)
11
Table 3:
Effect of study treatments on actual field capacity, field efficiency, pulling force and fuel consumption.

International Journal of Emerging Technology and Advanced Engineering
Website: www.ijetae.com (ISSN 2250-2459, ISO 9001:2008 Certified Journal, Volume 4, Issue 11, November 2014)
12
Figure 6: The shape of tillage area at 100 cm movement distance for traditional chisel plow and circular chisel plow.

International Journal of Emerging Technology and Advanced Engineering
Website: www.ijetae.com (ISSN 2250-2459, ISO 9001:2008 Certified Journal, Volume 4, Issue 11, November 2014)
13
Figure 7: Effect of soil resistance force on shanks of circular chisel plow when the plow is not rotation by P.T.O (free rotation).

International Journal of Emerging Technology and Advanced Engineering
Website: www.ijetae.com (ISSN 2250-2459, ISO 9001:2008 Certified Journal, Volume 4, Issue 11, November 2014)
14
Table 4:
Effect of study treatments on soil bulk density, soil porosity, soil penetration resistance, mean weight diameter and soil roughness surface.

International Journal of Emerging Technology and Advanced Engineering
Website: www.ijetae.com (ISSN 2250-2459, ISO 9001:2008 Certified Journal, Volume 4, Issue 11, November 2014)
15
Effect of study treatments on wheat yield and net profit.
Table (5) displayed that wheat grain yield, wheat straw
yield and biological yield increased with increasing both of
forward speed and number of plow passes where the
average increasing percentage at forward speed 7.5 km/h
were (30% and 13%), (32% and 14%) and (31% and 14%)
compared with others two speeds 3.5 km/h and 5.5 km/h
respectively. The average increasing percentage for wheat
grain yield, wheat straw yield and biological yield at two
passes were (10%, 7% and 8%) compared with one pass
respectively. The results showed that when using circular
chisel plow with rotational motion wheat grain yield, wheat
straw yield and biological yield increased compared with
circular chisel plow without rotational motion and
traditional chisel plow where the average increasing
percentage were (21% and 27%), (5% and 25%) and (11%
and 26%) for wheat grain yield, wheat straw yield and
biological yield respectively. The average
increasingpercentage for wheat grain yield, wheat straw
yield and biological yield when using circular chisel plow
without rotational motion compared with traditional chisel
plow were (5%, 19% and 13%) respectively. The data in
Table (5) showed that net profit increased with increasing
both of forward speed and number of plow passes where
the average increasing percentage at forward speed 7.5
km/h were (42% and 18%) compared with others two
speeds 3.5 km/h and 5.5 km/h respectively.

International Journal of Emerging Technology and Advanced Engineering
Website: www.ijetae.com (ISSN 2250-2459, ISO 9001:2008 Certified Journal, Volume 4, Issue 11, November 2014)
16
Table 5
Effect of study treatments on wheat yield and net profit.
The average increasing percentage for net profit at two
passes was (11%) compared with one pass. The results
showed that when using circular chisel plow with rotational
motion net profit increased compared with circular chisel
plow without rotational motion and traditional chisel plow
where the average increasing percentage were (20% and
35%) respectively.
The average increasing percentage for net profit when
using circular chisel plow without rotational motion
compared with traditional chisel plow was (12%).

International Journal of Emerging Technology and Advanced Engineering
Website: www.ijetae.com (ISSN 2250-2459, ISO 9001:2008 Certified Journal, Volume 4, Issue 11, November 2014)
17
IV. CONCLUSION
The previous discussions showed that the circular chisel
plow consumed more fuel in rotational motion compared
with traditional chisel plow, but this rotational motion
caused increasing of plow performance rates, improvement
the soil physical properties, decreasing pulling force and
increasing the wheat productivity, so that caused an
increasing of net profit in the end compared with traditional
chisel plow. The discussions also proved that the efficiency
of the circular chisel plow increased with increasing the
passes number of plow, increasing the rotation velocity and
increasing tractor forward speed, with note that the rotation
velocity of the circular chisel plow always be faster than
the tractor forward speed.
Recommendations:
1- Should be tested the circular chisel plow in other soil
types to determine the optimum operating conditions for
circular chisel plow in each soil type.
2- Should be compared the circular chisel plow with other
types of traditional plows, such as rotary tiller to
determinate the important advantages and disadvantages of
this plow.
REFERENCES
[1] Abdel-Aal, S. E., A. M. Kishta and A. Lotfy. 2005. Seedbed
preparation and irrigation depths affecting soil physical properties and rice yield. Misr J.Agr. Eng., 22(2); 572-591.
[2] Al-Suhaibani, S. A. and A. A. Al-Janobi. 1997. Draught requirements of tillage implements operating on sandy loam soil.
Journal of Agric. Engineering Researches 66:177-182.
[3] Alvarez-Mozos, J., C.A. Miguel, R. Gimenez, J. Casali, and U. Leibar. 2011. Implications of scale, slope, tillage operation and
direction in the estimation of surface depression storage. Soil Tillage
Res., 111: 142-153.
[4] Bengough, A. G. and C. E., Mullins. 1990. Mechanical impedance to
root growth: a review of experimental techniques and root growth responses. J. Soil Sci. 41, 341–358.
[5] Bernacki, H., J. Haman and C. Kanafojski. 1972. Agricultural Mechines (Theory and Construction). Vol. 1, Published by the
Scientific Puplications Foreign, Warsow, Poland. P: 433.
[6] Black, C. A. 1965. Methods of Soil Analysis. 1st Edn. American Society Agronomy, Madison, WI., USA.
[7] Boulal, H., H. Gómez-Macpherson, J.A. Gómez and L. Mateos. 2011. Effect of soil management and traffic on soil erosion in
irrigated annual crops. Soil Tillage Res., 11:62-70.
[8] Boydas, M. G and N. Turgut. 2007. Effect of tillage implements and operating speeds on soil physical properties and wheat emergence.
Turkish Journal of Agriculture and Forestry, 31, 399-412.
[9] Burwell, R. E., R. R. Allmaras and M. Amemiya, 1963. A field
measurement of total porosity and surface microrrelief of soils, Soil
Sci. Soc. Am. Proc., 27, 697–700.
[10] Chang, C. and C. W. Lindwall. 1990. Comparison of the Effect of
Long Term Tillage and Crop Rotation on Physical Properties of a Soil. Canadian Agri. Engineering, 32, 53-55.
[11] Chi, L. and R. L. Kushwaha. 1990. A Non-linear 3-D finite element
analysis of soil failure with tillage tool. Journal of Terra mechanics, 27(4), 343-366.
[12] El-Awady, M. N. 1978. Engineering of Tractor and Agricultural Machinery. Text Book, (in Arabic), Fac. Of Ag. Ain Shams Univ.,
Cairo, Egypt.
[13] El-Said, K. M., Z. M. Imara and K. El-Sayed. 1998. Effect of ploughing type on some physical properties of a clay soil. Misr J.
Agric. Eng., 15(2): 276-290.
[14] Garcia Moreno, R. 2006. Desarrollo de una metodolog´ıa para
lamedici´on de la rugosidad delsuelo, Ph.D. Dissertation,
Polytechnic University of Madrid (UPM), 120 pp.
[15] Gill, W.R. and G.E. Vanden-Berg. 1967. Soil dynamics in tillage
and traction. Agricultural Handbook No.316. Agricultural Research Services, U.S. Department of Agriculture.
[16] Grisso, R. D. and J. V. Perumpral. 1985. Review of models for
predicting the performance of narrow tillage tools. Trans. Am. Soc. Agric. Eng. (ASAE). 28(4), 1062±1067.
[17] Grisso, R. D., M. Yasin and M. F. Kocher. 1994. Tillage Implement Forces Operating in Silty Clay Loam. ASAE paper No.94-1532, St.
Joseph, Mich., USA.
[18] Hillel, D. 1982. Introduction to Soil Physics. Academic Press, Inc. Orlando, FL. USA.
[19] Jacobs, C. O. and W. R. Harrol. 1983. Agricultural Power and Machinery. Mc Graw Hil Press, New York.
[20] Julieta B., I. C. De Maria, R. Lemos and S. Crestana. 2012.
Relations between soil surface roughness, Tortuosity, tillage treatments, rainfall Intensity and soil and water losses from a red
Yellow latosol. R. Bras. Ci. Solo, 36:1291-1297.
[21] Kepner, R. A., R. Bainer and E. L. Barger. 1978. Principles of Farm
Machinery. Ch 5, The AVI Publishing Company.
[22] Kepner, R. A., R. Bainer and E. L. Barger. 1987. Principles of farm machinery, 3th Ed. AVI Publ. Co., Inc. Westport, Cone, 392- 428.
[23] Khadr, Kh. A. A. 2000. A study some factors affecting the power tiller performance. Misr J. Agric. Eng., 17 (3): 636- 646.
[24] Khadr, Kh. A. A. 2004. Energy requirements for some seed-bed
preparation implements under Egyptian conditions. 12th Annual Conf. of Misr Society of Agric. Eng.., 21(4):481-491.
[25] Makanga, J. T., V. M. Salkhe and D. Gee-Clough. 1997. Effects of tine rake angle and aspect ratio on soil reactions in dry loam soil. J.
Terra. 34: 235-250.
[26] Mamman, E. and K. C. Oni. 2005. Draught performance of a range
of model chisel furrowers. Agricultural Engineering International:
the CIGR E journal. .PM 05 003. Vol. VII. Nov. 2005.
[27] Marquesda Silva, J. R. and J. M. C. N. Soares. 2000. Description
standards of primary tillage implements, Soil Till. Res., 57, 173–
176.
[28] Metwally, M. E., R. R. Abou-Shieshaa, R. M. Kholief and R. E.
Kanany. 2000. Effect of four different tillage systems and nitrogen sources on wheat production under improved salt affected soil. Misr
J. Agric. Eng., 17(3): 539-554.

International Journal of Emerging Technology and Advanced Engineering
Website: www.ijetae.com (ISSN 2250-2459, ISO 9001:2008 Certified Journal, Volume 4, Issue 11, November 2014)
18
[29] Mouazen, A. M., and H. Ramon, 2002. A numerical-statistical
hybrid modeling scheme for evaluation of draught requirements of a subsoiler cutting a sandy loam soil, as affected by moisture content,
bulk density and depth. Soil and Tillage Research, 63:155-165.
[30] Palmer, A. L. and I. R. Kruges. 1982. Comparative drafts of six tillage implements. In Proc. Conf. on Agric. Eng. 163-167,
Armidale, New Australia 22-24 August. Nat. Committee Agric. Eng.
Of Insttution of Engineers, Australia, Barton, Australia.
[31] Panachuki, E., I. Bertol, S. T.A. obrinho, A. C. T. Vitorino, C.M.A.
Souza and M.A. Urchei. 2010. Rugosidade da superfície do solo sob diferentes sistemas de manejo einfluenciada por chuva artificial. R.
Bras. Ci. Solo, 34:443-452.
[32] Podmore, T. H. and L. F. Huggins. 1981. An automated profile meter for surface roughness measurements, ASAE, 24, 663-665.
[33] Ros V., R. J. Smith, S. J. Marley and D. C. Erbach. (1995). Mathematical modeling and computer aided design of the passive
tillage tools, Transactions of the ASAE, 38(3), 675–683.
[34] Sahu, R. K. and H. Raheman 2006. An approach for draft prediction
of combination tillage implements in sandy clay loam soil. Soil &
Tillage Res., 90 (1-2): 145-155.
[35] Singh G. 1983. Optimal energy for tillage tools. Unpublished M
Tech Thesis, Punjab Agricultural University, Ludhiana.
[36] Singh, K. K., T. S. Colvin, D. C. Erbach and A.Q. Mughal. 1992.
Tilth index: An approach to quantifying soil tilth, Transactions of the
ASAE. 35: 1777-1785.
[37] Srivastava, A. K., C. E. Goering and R. P. Rohrbach. 1993.
Engineering Principles of Agricultural Machines. ASAE Textbook,
pp: 149-219.
[38] Stenitzer, E. and E. Murer. 2003. Impact of soil compaction upon
soil water balance and maize yield estimated by the SIMWASER model. Soil Till. Res. 73, 43–56.
[39] Suliman, A. E., G. M. Nassr and W. M. I. Adawy. 1993. A study on
the effect of different tillage systems on the physical properties of the soil. Misr J. Agr. Eng., 10 (2):169-189.
[40] Taniguchi, T., J. T. Makanga, K. Ohtoma and T. Kishimoto. 1999.
Draft and soil manipulation by a moldboard plow under different forward speed and body attachments. Transactions of the ASAE. 42:
1517-1521.
[41] Upadhyaya, S. K., T. H. Williams, L. J. Kemble and N. E. Collins.
1984. Energy requirement for chiseling in coastal plain soils. Trans.
of the ASAE. 27(6):1643-1649.
[42] Van Bavel, C. M. 1949. Mean weight diameter of soil aggregates as
a statistical index of aggregation. Soil Sci. Soc. Am. J. 14: 20-23.
[43] Vidal V´azquez, E., J. G. Vivas Miranda and A. G. Onzalez. 2005.
Characterizing anisotropy and heterogeneity of soil surface micro
topography using fractal models, Ecol. Model., 182, 337-353.
[44] Wagner, L. E. and Y. Yiming, 1991. Digitization of profile meter
photographs, Trans. ASAE, 34(2), 412-416.
[45] Wismer R. D., E. L. Wegshied, H. J. Luth and B. E. Romig. 1968.
Energy application in tillage and earth moving. SAE Paper No. 68–
677, Warren, PA.
[46] Yassen, H. A., H. M. Hassan and I. A. Hammadi. 1992. Effects of
plowing depth using different plow types on some physical properties of soil. AMA, 23(4), 21- 24.
[47] Zoz, F. M. and R. D. Grisso. 2003. Traction and Tractor
Performance, ASAE Distinguished Lecture Series 27, ASAE Publication Number 913C0403. Paper presented at Agricultural
Equipment Technology Conference held at Louisville, Kentucky,
USA between February 9-11.