DESIGN AND OPTIMIZATION OF ELECTROMAGNETIC BAND GAP …
72
VYSOKÉ UČENÍ TECHNICKÉ V BRNĚ BRNO UNIVERSITY OF TECHNOLOGY FAKULTA ELEKTROTECHNIKY A KOMUNIKAČNÍCH TECHNOLOGIÍ ÚSTAV RADIOELEKTRONIKY FACULTY OF ELECTRICAL ENGINEERING AND COMMUNICATION DEPARTMENT OF RADIO ELECTRONICS DESIGN AND OPTIMIZATION OF ELECTROMAGNETIC BAND GAP STRUCTURES NÁVRH A OPTIMALIZACE STRUKTUR S ELEKTROMAGNETICKÝM ZÁDRŽNÝM PÁSMEM DIZERTAČNÍ PRÁCE DOCTORAL THESIS AUTOR PRÁCE Ing. PETER KOVÁCS AUTHOR VEDOUCÍ PRÁCE Ing. ZBYNĚK LUKEŠ, Ph.D. SUPERVISOR BRNO 2010
Transcript of DESIGN AND OPTIMIZATION OF ELECTROMAGNETIC BAND GAP …

VYSOKÉ UČENÍ TECHNICKÉ V BRNĚ BRNO UNIVERSITY OF TECHNOLOGY
FAKULTA ELEKTROTECHNIKY A KOMUNIKAČNÍCH TECHNOLOGIÍ
ÚSTAV RADIOELEKTRONIKY
FACULTY OF ELECTRICAL ENGINEERING AND COMMUNICATION
DEPARTMENT OF RADIO ELECTRONICS
DESIGN AND OPTIMIZATION OF ELECTROMAGNETIC BAND GAP STRUCTURES
NÁVRH A OPTIMALIZACE STRUKTUR S ELEKTROMAGNETICKÝM ZÁDRŽNÝM PÁSMEM
DIZERTAČNÍ PRÁCE DOCTORAL THESIS
AUTOR PRÁCE Ing. PETER KOVÁCS AUTHOR
VEDOUCÍ PRÁCE Ing. ZBYNĚK LUKEŠ, Ph.D. SUPERVISOR
BRNO 2010

Abstract
The thesis deals with the design and optimization of periodic structures for surface waves suppression on electrically dense dielectric substrates. The design of such structures is rather complicated due to the large factor of uncertainty how the electromagnetic band gap (EBG) properties change depending on the unit cell geometry. Without a proper approach, the design of EBGs is based on trial-and-error.
In this thesis, the basic theory of electromagnetic wave propagation in metamaterials is presented first. Second, the correct dispersion diagram computation in the selected full-wave software tools is discussed. The main attention is turned then to the automated design and optimization of EBG structures using different global evolutionary algorithms. The practical exploitation of the developed technique is demonstrated on design examples of reduced-size and dual-band EBGs, periodic structures with simultaneous electromagnetic band gap and artificial magnetic conductor (AMC) properties and periodic structures acting as superstrates. The last chapter of the thesis is devoted to the experimental verification of computer models.
Keywords
Periodic structures, electromagnetic band gap, computer modeling, evolutionary algorithms.

Abstrakt
Dizertační práce pojednává o návrhu a optimalizaci periodických struktur s elektromagnetickým zádržným pásmem (EBG – electromagnetic band gap) pro potlačení povrchových vln šířících se na elektricky tlustých dielektrických substrátech. Nepředvídatelné chování elektromagnetických vlastností těchto struktur v závislosti na parametrech elementární buňky činí jejích syntézi značně komplikovanou. Bez patřičného postupu je návrh EBG struktur metodou pokusu a omylu.
V první části práce jsou shrnuty základní poznatky o šíření elektromagnetických vln v tzv. metamateriálech. Následně je diskutován správný způsob výpočtu disperzního diagramu ve vybraných komerčních programech. Jádrem dizertace je automatizovaný návrh a optimalizace EBG struktur využitím různých globálních optimalizačních algoritmů. Praktický význam vypracované metodiky je předveden na návrhových příkladech periodických struktur s redukovanými rozměry, dvoupásmovými EBG vlastnostmi, simultánním EBG a AMC (artificial magnetic conductor – umělý magnetický vodič) chováním a tzv. superstrátu. Poslední kapitola je věnována experimentálnímu ověření počítačových modelů.
Klíčová slova
Periodická struktura, elektromagnetické zádržné pásmo, počítačové modelování, evoluční algoritmy.

Prohlášení
Prohlašuji, že svou dizertační práci na téma Návrh a optimalizace struktur s elektromagnetickým zádržným pásmem (Design and optimization of electromagnetic band gap structures) jsem vypracoval samostatně pod vedením školitele a s použitím odborné literatury a dalších informačních zdrojů, které jsou všechny citovány v práci a uvedeny v seznamu literatury na konci práce.
Jako autor uvedené dizertační práce dále prohlašuji, že v souvislosti s vytvořením této dizertační práce jsem neporušil autorská práva třetích osob, zejména jsem nezasáhl nedovoleným způsobem do cizích autorských práv osobnostních a jsem si plně vědom následků porušení ustanovení § 11 a následujících autorského zákona č. 121/2000 Sb., včetně možných trestněprávních důsledků vyplývajících z ustanovení § 152 trestního zákona č. 140/1961 Sb.
V Brně dne 31. srpna 2010 ____________________________ Autor práce

Bibliographic citation
KOVÁCS, P. Design and optimization of electromagnetic band gap structures. Doctoral thesis. Brno: Brno University of Technology, 2010. 72 pages, 1 appendix.

List of abbreviations
AMC artificial magnetic conductor
BW bandwidth
DE differential evolution
DNG double-negative
DPS double-positive
EBG electromagnetic band gap
EM electromagnetic
ENG epsilon-negative
FEM finite element method
FIT finite integration technique
GA genetic algorithm
GAm genetic algorithm with multi-point crossover
GAs genetic algorithm with single-point crossover
GDS grounded dielectric slab
GP ground plane
GPS global positioning system
HFSS High Frequency Structure Simulator
LH left-handed
MD-EBG metallo-dielectric electromagnetic band gap
MNG mi-negative
MOM method-of-moment
MWS Microwave Studio
PBG photonic band gap
PEC perfect electric conductor
PMC perfect magnetic conductor
PML perfectly matched layer
PRS partially reflective surface
PSO particle swarm optimization
RH right-handed
TE transverse electric
TM transverse magnetic
UC-PBG uniplanar compact photonic band gap
VBA Visual BASIC for Application

List of symbols
c light velocity in free space; constant
d via diameter
f frequency
fAMC frequency of zero reflection phase (AMC point)
fBG_max upper limit of band gap
fBG_min lower limit of band gap
fc center frequency
fr resonant frequency
∆f-3dB -3 dB bandwidth
g unit cell parameter
h height or thickness
ha displacement between the antenna and the reflector
j imaginary unit
k wave vector
k̂ normalized wave vector
k propagation constant or wave number
k0 propagation constant or wave number in free space
la antenna length
neff effective refractive index
w unit cell parameter; weighting coefficient
B magnetic flux density vector
C capacitance; crossover constant
D electric flux density vector; translation vector
D period or lattice constant; directivity
E electric field intensity vector
Ex, y, z x-, y-, z-component of electric field vector
Etan tangential component of electric field vector
F fitness function, mutation scale factor
H magnetic field intensity vector
Hx, y, z x-, y-, z-component of magnetic field vector
Htan tangential component of magnetic field vector
L inductance
M symmetry point
P size of square metallic patch

PS power of the source
PT transmitted power
Q quality factor
R reflection coefficient
S height of the resonant cavity
S11 reflection coefficient
X symmetry point
Y shunt admittance
Z series impedance
Zs surface impedance
α decay constant into free space
ε permittivity
ε0 permittivity of free space
εeff effective permittivity
εr relative permittivity
θc critical angle
λ wavelength
µ permeability
µ0 permeability of free space
µeff effective permeability
µr relative permeability
ω angular frequency
Γ symmetry point
Π Pointing vector
vector differential operator
∂ scalar differential operator

Contents
1 Introduction 1 1.1 State of the art 2 1.2 Thesis goal 4
2 Metamaterials as periodic structures 5 2.1 Electromagnetic wave propagation in metamaterials 5 2.2 Metallo-dielectric representation of metamaterials 6 2.3 Surface waves 8
3 Analysis of electromagnetic band gap structures 12 3.1 Numerical modeling of EBGs 12 3.2 Summary 16
4 Optimization algorithms 17 4.1 Binary coded genetic algorithm 18 4.2 Differential evolution 19 4.3 Particle swarm optimization 20 4.4 Comparison of the methods 21 4.5 Summary 22
5 Design examples of periodic structures with the ele ctromagnetic band gap 24 5.1 Reduced-size EBG 24 5.2 Periodic structure with dual-band EBG properties 26 5.3 Periodic structure with simultaneous EBG and AMC properties 30 5.4 The EBG superstrate 35 5.5 Summary 40
6 Antenna experiments 41 6.1 Vertical monopole antenna on EBG surface 41 6.2 Horizontal wire antenna over AMC surface 46 6.3 Horizontal dipole antenna covered by superstrate layer 51 6.4 Summary 56
7 Conclusion 57
8 Bibliography 59
Curriculum Vitae 62
Appendix A – Photograph of the fabricated periodic structure 63
1
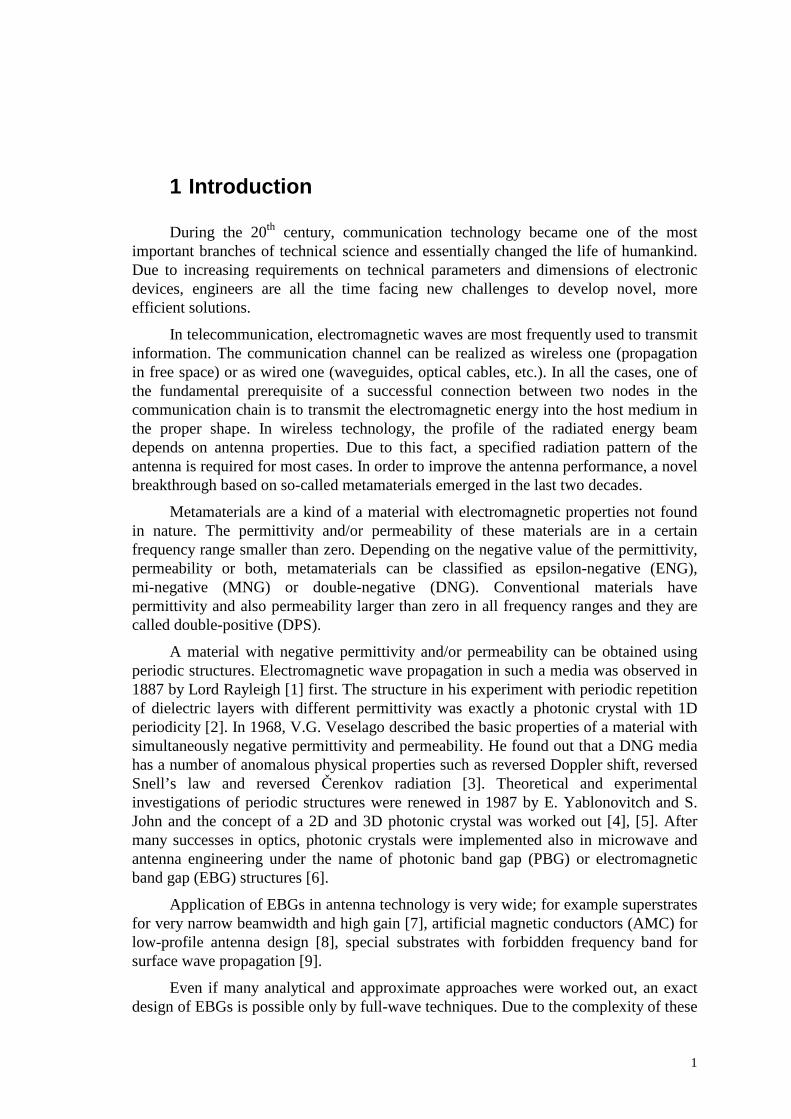
1 Introduction
During the 20th century, communication technology became one of the most important branches of technical science and essentially changed the life of humankind. Due to increasing requirements on technical parameters and dimensions of electronic devices, engineers are all the time facing new challenges to develop novel, more efficient solutions.
In telecommunication, electromagnetic waves are most frequently used to transmit information. The communication channel can be realized as wireless one (propagation in free space) or as wired one (waveguides, optical cables, etc.). In all the cases, one of the fundamental prerequisite of a successful connection between two nodes in the communication chain is to transmit the electromagnetic energy into the host medium in the proper shape. In wireless technology, the profile of the radiated energy beam depends on antenna properties. Due to this fact, a specified radiation pattern of the antenna is required for most cases. In order to improve the antenna performance, a novel breakthrough based on so-called metamaterials emerged in the last two decades.
Metamaterials are a kind of a material with electromagnetic properties not found in nature. The permittivity and/or permeability of these materials are in a certain frequency range smaller than zero. Depending on the negative value of the permittivity, permeability or both, metamaterials can be classified as epsilon-negative (ENG), mi-negative (MNG) or double-negative (DNG). Conventional materials have permittivity and also permeability larger than zero in all frequency ranges and they are called double-positive (DPS).
A material with negative permittivity and/or permeability can be obtained using periodic structures. Electromagnetic wave propagation in such a media was observed in 1887 by Lord Rayleigh [1] first. The structure in his experiment with periodic repetition of dielectric layers with different permittivity was exactly a photonic crystal with 1D periodicity [2]. In 1968, V.G. Veselago described the basic properties of a material with simultaneously negative permittivity and permeability. He found out that a DNG media has a number of anomalous physical properties such as reversed Doppler shift, reversed Snell’s law and reversed Čerenkov radiation [3]. Theoretical and experimental investigations of periodic structures were renewed in 1987 by E. Yablonovitch and S. John and the concept of a 2D and 3D photonic crystal was worked out [4], [5]. After many successes in optics, photonic crystals were implemented also in microwave and antenna engineering under the name of photonic band gap (PBG) or electromagnetic band gap (EBG) structures [6].
Application of EBGs in antenna technology is very wide; for example superstrates for very narrow beamwidth and high gain [7], artificial magnetic conductors (AMC) for low-profile antenna design [8], special substrates with forbidden frequency band for surface wave propagation [9].
Even if many analytical and approximate approaches were worked out, an exact design of EBGs is possible only by full-wave techniques. Due to the complexity of these

2
structures, stochastic methods are mainly preferred. However, their application in the field of EBGs as special substrates with suppressed electromagnetic wave propagation was explored only superficially up to now.
In the work, the attention is focused on the synthesis and optimization of so-called metallo-dielectric electromagnetic band gap (MD-EBG) structures with the forbidden surface wave propagation by means of global optimization algorithms. The developed method is universal (applicable for any type of unit cells) and is based on a full-wave characterization of EBGs and optimization of parameters of the structure to fulfill the requirements.
The organization of the thesis is following: After a brief description of fundamentals of electromagnetic wave propagation in periodic media, the analysis of EBGs by the use of the full-wave solvers CST Microwave Studio (CST MWS) and Ansoft High Frequency Structure Simulator (Ansoft HFSS) is discussed. The results of computer simulations are compared with the data published in the open literature. The next section is devoted to the implementation of global evolutionary algorithms in the design of EBGs: the binary-coded genetic algorithm with the single-point (GAs) and the multi-point (GAm) crossover, the differential evolution (DE) in the basic variant and the particle swarm optimization (PSO) are tested on the synthesis of a single-band planar square EBG unit cell to obtain the surface wave band gap with the required central frequency and the maximum bandwidth. The algorithms are mutually compared in terms of the convergence rate. Next, design examples of more complex structures with the single- and dual-band EBG operation, with simultaneous EBG and AMC properties, and an example of a periodic surface acting as superstrate are presented. The last section is devoted to the practical demonstration of the studied phenomena via computer simulations and experiments.
1.1 State of the art
Metallic sheets as reflectors or ground planes increase the gain of antennas by 3 dB by pre-directing half of the radiation into the opposite direction and partially shield objects located on the other side [10], [11]. Unfortunately, reflectors as good conducting surfaces reverse the phase of impinging electromagnetic waves. Due to that, an antenna needs to be placed at the distance one-quarter wavelength (λ/4) from the reflector to ensure the constructive interference between the incident and reflected waves. This fact disallows the realization of antennas with a very low profile. The second disadvantage of metallic sheets is supporting surface waves. Surface waves are electromagnetic waves bound to the interface of the metal and free space and are propagating from DC up to optical frequencies. If an antenna is placed near a conductive sheet it will radiate plane waves into free space, but it will also generate a current that propagates along the sheet. In the case of an infinitely large metallic plate the presence of surface waves is observable via slight reduction of antenna efficiency. However, the realistic reflector is always finite in size and diffractions of surface waves at the edges result in ripples and deep nulls in the far field radiation pattern and in a worse front-to-back ratio [10], [12].
In order to eliminate the above mentioned disadvantages of a conventional flat metal ground plane (in a narrow frequency band at least), a corrugated plane can be used. The corrugated plane is a kind of a periodic structure that consists of a series of vertical metal plates connected to each other at the bottom, see Fig. 1.1. The height of

3
the vertical plates is h = λ/4 and the distance between them (period) D is much smaller than the wavelength λ. Such a structure acts as a short-ended parallel-plate transmission line with an open end at the top. This means that the impedance at the top surface is very high and surface waves are in cutoff. Furthermore, a plane wave polarized with the electric field perpendicular to the ridges will be reflected with no phase reversal, since the effective reflection plane is at the bottom of the slots, λ/4 away [10], [12].
a) b)
Fig. 1.1 The corrugated metal slab (a), practical application of the corrugated metal slab: GPS antenna with choke ring structure [13] (b).
In a certain frequency interval, the corrugated plane successfully suppresses surface waves and reflects incident electromagnetic waves with no phase reversal. However, the corrugated plane shows several disadvantages also. Mainly, the construction is very robust and heavy (the choke ring GPS antenna in Fig. 1.b manufactured by Ashtech company is weighting 4.7 kg), the fabrication process is rather complicated and material-consuming, the height of metallic plates must be one-quarter wavelength. The overall construction of the corrugated plate can be radically simplified by folding up the one-quarter wavelength slots into lumped elements (capacitors and inductors) and distributing them in two dimensions. The periodic structure depicted in Fig. 1.2 is mainly called the “mushroom EBG” and was introduced by Sievenpiper in 1999 [10].
Fig. 1.2 The mushroom EBG structure.
Beside of the mushroom structure, many variants of purely planar (i.e. without shorting vias) metallo-dielectric EBGs were introduced, for example the uniplanar compact photonic band gap (UC-PBG) [14]. Based on theoretical considerations and experimental verifications, the planar EBGs can replace the mushroom ones in many cases. Examples of single- and multi-band planar AMCs [15] and planar EBG substrates with suppressed surface wave propagation [16] were introduced. The main disadvantage of the planar geometry is that the AMC and EBG behavior of such structures do not

4
coincidence or the frequency interval of simultaneous AMC and EBG operation is extremely narrow [17].
Due to their complex nature, the design of electromagnetic band gap structures is rather difficult. Even if some approximate [10] and analytical [18], [19] methods exist, the only approach valid for any unit cell geometry and frequency ranges has to be based on the full-wave electromagnetic simulation.
Similarly to other complex problems, techniques of global optimization can be successfully implemented in the design of periodic structures for various applications as well. Genetic algorithms have been exploited in the design of multi-band planar AMCs and AMCs with an excellent angular stability [15], [20] as well as in the design of superstrates (periodic structures based on the principle of the Fabry-Perot resonator) for the antenna gain enhancement [21]. However, the utilization of global evolutionary algorithms in the design of EBGs with the surface wave band gap was explored superficially so far. In this work, the main attention is turned to the automated synthesis of periodic structures with electromagnetic band gap properties, using full-wave computer simulations.
1.2 Thesis goal
Computer simulations based on full-wave techniques play a very important role in the design of periodic structures with the surface wave band gap. Unfortunately, only a few introductory texts and tutorials describing the correct setup of the analysis in commercially available software tools (CST MWS, Ansoft HFSS) are provided. Moreover, these texts are often incomplete and unclear.
The second difficulty in the design of EBGs is caused by the large factor of uncertainty, how the electromagnetic band gap characteristics of the structure change on the dependence of the unit cell geometry. Without a proper approach, the design of such a structure is based on trial-and-error. Heuristic algorithms as genetic algorithms (GA), differential evolution (DE), and particle swarm optimization (PSO) were successfully implemented for a broad range of complex electromagnetic problems. However, their implementation in the design of EBGs with the surface wave band gap can be shown to be a completely new task.
Based on the above mentioned facts, the dominant goals of this work can be formulated as follows:
• Correct simulation setup of EBG unit cell in full-wave software tools CST Microwave Studio and Ansoft HFSS for surface waves dispersion analysis.
• Fully automated computer design of periodic structures with surface wave band gap. The proposed method should be universal and applicable for all types of EBGs independently on the unit cell geometry. The main objectives are the position of the band gap (the central frequency) and the largest bandwidth. Different design approaches (GA, DE, PSO) should be compared from the viewpoint of the convergence rate.
• Verification of the proposed design techniques on examples of periodic structures for different applications.

5
2 Metamaterials as periodic structures
This chapter deals with the implementation of metamaterials as periodic structures. First, the basic phenomena of electromagnetic wave propagation in metamaterials are briefly discussed. Second, the metallo-dielectric representation of DPS, ENG, MNG and DNG media is introduced. Then, the propagation of surface waves on dielectric substrates and their suppression by periodic structures is described.
2.1 Electromagnetic wave propagation in metamaterials
As mentioned already, metamaterials can be realized as periodic structures. A periodic structure in electrical engineering means media, whose electromagnetic properties (permittivity, permeability, conductivity) change periodically in space. If the period D is much smaller than the wavelength λ of the propagating electromagnetic wave (D << λ), the periodic media can be considered as homogenous, and effective material properties of the periodic structure (effective permittivity εeff and effective permeability µeff) can be defined as follows [22]
ED ⋅⋅= 0εε eff , (2.1.a)
HB ⋅⋅= 0µµeff , (2.1.b)
where D is the vector of electric flux density, E the vector of electric field intensity, B the vector of magnetic flux density and H the vector of magnetic field intensity, ε0 and µ0 permittivity and permeability of free space, respectively.
The effective refractive index neff is related both to the effective permittivity and the effective permeability according to [23]
effeffeffn µε ⋅±= . (2.2)
The propagation constant k is defined using the effective refractive index [22], [23]
effnc
k ⋅= ω (2.3)
with ω being the angular frequency and c the light velocity in free space.
Based on Maxwell’s equations for plane wave propagation in isotropic media, the following relationship between the vectors of electric and magnetic field intensity can be written [22]
HEk ⋅⋅⋅
=×0
0ˆεεµµ
eff
eff , (2.4.a)
EHk ⋅⋅⋅
=×0
0ˆµµεε
eff
eff , (2.4.b)

6
where k̂ is the normalized wave vector (k̂ = k /│k│, k =│k│). For εeff and µeff positive, the effective refractive index neff in (2.2) is real and positive as well as the propagation constant k in (2.3). The wave vector k and the Pointing vector Π = E x H have the same orientation (“forward wave”). For this case, E, H and k form a right-handed rectangular system as depicted in Fig. 2.1.a. Due to that, DPS materials are called “right-handed” (RH).
If εeff or µeff is negative (i.e. the material is the type of ENG or MNG, respectively), the effective refractive index neff is imaginary as well as the propagation constant k. Electromagnetic waves in such a media are strongly attenuated.
If both εeff and µeff are negative, the effective refractive index neff and the wave vector k are real, however with the negative sign [23]. The wave vector k and the Pointing vector Π have opposite orientation (“backward wave”). Vectors E, H and k form a left-handed rectangular system as depicted in Fig. 2.1.b – DNG materials are “left-handed” (LH).
a) b)
Fig. 2.1 The right-handed material (a), the left-handed material (b).
Now, let us consider the interface of two media. The continuity of the tangential electric and magnetic field components E1,tan, E2,tan, H1,tan, H2,tan at that interface can be expressed as [24]
InterfaceInterface
n
E
jn
E
j ∂∂
⋅⋅⋅
−=∂
∂⋅
⋅⋅− tan,2
2
tan,1
1
11µωµω
, (2.5.a)
InterfaceInterface
n
H
jn
H
j ∂∂
⋅⋅⋅
=∂
∂⋅
⋅⋅tan,2
2
tan,1
1
11
εωεω . (2.5.b)
In (2.5.a) and (2.5.b), ∂/∂n represents the normal derivative and εi, µi, i = 1, 2, are the permittivity and permeability in these two media, respectively. For ε1, ε2 and/or µ1, µ2 with opposite signs, the normal derivatives of the tangential fields on both sides of the interface will have opposite signs. It means a discontinuity at the boundary of the two media, which may imply a concentrated resonant phenomenon at that interface, which is similar to the current and voltage distribution at the junction between an inductor and a capacitor at the resonance of an L-C circuit. The mechanism behind this “interface resonance” can be described in several ways. Using the equivalent circuit model [24], possible realizations of metamaterials as metallo-dielectric periodic structures can be described (see the next section).
2.2 Metallo-dielectric representation of metamaterials
Realization of metamaterials as periodic metallo-dielectric structures was intensively studied in the last decade. Nowadays, metallo-dielectric metamaterials

7
became the most widely used types of electromagnetic band gap structures in microwave and antenna techniques because of easy fabrication and compatibility with microwave circuits.
The general circuit representation of a metallo-dielectric unit cell is shown in Fig. 2.2. If D << λ, the effective permittivity and permeability of the periodic media can be expressed using the series impedance Z and shunt admittance Y of the unit cell as [25]
Dj
Yeff ⋅⋅
=⋅ω
εε 0 , (2.6.a)
Dj
Zeff ⋅⋅
=⋅ω
µµ 0 . (2.6.b)
According to the selection of L and C elements as the series and shunt components of the unit cell, four types of materials (DPS, ENG, MNG and DNG) can be realized as depicted in Fig. 2.3 (square unit cells are assumed for simplicity).
Fig. 2.2 The general circuit representation of a metallo-dielectric unit cell.
a)
b)
c)
d)
Fig. 2.3 Possible realizations of metallo-dielectric periodic structures as DPS (a), ENG (b), MNG (c), DNG (d). Left – the unit cell, right – the equivalent circuit representation.

8
A DPS material can be implemented as a 2D mesh of microstrip lines (a series inductance and a shunt capacitance to the ground plane), Fig. 2.3.a. For ENG behavior, a shunt inductance is needed in addition to a series inductance and a shunt capacitance, Fig. 2.3.b. A metallic patch on a dielectric substrate (Fig. 2.3.c) represents a series inductance and a series capacitance to neighboring cells and a shunt capacitance to the ground plane – its behavior corresponds to MNG. A metallic patch on a dielectric substrate with a shorting via (Fig. 2.3.d) acts as a DNG material due to the series inductance and the capacitance to neighboring cells, and the shunt inductance and the capacitance to the ground plane.
In practice, the MNG and DNG metamaterials are two most often applied variants of metallo-dielectric metamaterials. Whereas the MNG can suppress the transverse electric (TE) polarized waves only, the DNG is able to suppress also the transverse magnetic (TM) polarized waves as discussed later. Based on the circuit representation of four types of materials, only the DNG can generate backward waves and thus behaves as LH media. However, the circuit model of materials is valid only if the period is much shorter than the wavelength. In fact, all the periodic structures generate backward waves if the lattice constant becomes approximately half of the wavelength (Bragg’s condition) [26].
2.3 Surface waves
Dimensions of a microwave device can be significantly reduced by placing the planar layout on high-permittivity dielectrics. If the device is a patch antenna, the increase of the permittivity of the substrate causes the decrease of its operational bandwidth. A thicker dielectric slab is a potential solution to eliminate the negative effect of the increasing substrate permittivity on the antenna bandwidth. By increasing permittivity and height of dielectrics, the impact of surface wave propagation on antenna performance becomes more crucial.
Surface waves are electromagnetic waves trapped on the interface of two dissimilar materials (metal-dielectrics or dielectrics-dielectrics). In Fig. 2.4, the propagation of surface waves within a grounded dielectric slab is depicted. A wave impinging at the dielectric-air interface undergoes complete internal reflection for incident angles greater than the critical angle θc given by the expression [27]
)(sin 2
11 −−= rc εθ , (2.7)
where εr is the relative permittivity of the dielectrics. In fact, if the radiation source is a planar elementary dipole, the ratio of the power radiated into the substrate to the power radiated into the air is approximately εr
3/2 [27]. Diffraction of surface waves at boundaries of the antenna substrate causes the deformation of the radiation pattern and a worse front-to-back ratio.
Fig. 2.4 Surface wave propagation inside the grounded dielectric slab.

9
Let us now investigate the prerequisites for TM and TE surface wave propagation on a general impedance surface which properties can be described with a single parameter – the surface impedance Zs [10], [12]. The surface is positioned in the y-z plane. A surface wave propagates in the +z direction with the fields decaying exponentially with decay constant α in the +x direction (Fig. 2.5).
Fig. 2.5 A surface wave on an impedance surface.
For TM polarized surface waves, the x and z components of the magnetic field intensity and the y component of the electric field intensity are equal to zero, Hx = Hz = = Ey = 0. The z component of the electric field intensity Ez can be expressed as
xjkzz eCE α−−⋅= , (2.8)
where C is a constant and k is the propagation constant in the z direction. Recalling Ampére’s law
t∂
∂⋅=×∇ EH ε , (2.9)
and keeping in mind that only the y component of the magnetic field intensity is non-zero, equation (2.9) can be rewritten in the following form
zy
Ejx
H⋅⋅⋅=
∂∂
εω . (2.10)
Combining (2.8) with (2.10) and evaluating the integral
zy EjH ⋅
−⋅⋅⋅=α
εω 1 . (2.11)
The surface impedance Zs can be expressed as the ratio of the electric field over the magnetic field at the surface [10], [12]
( )εωα
εωα
⋅⋅=
⋅⋅−== j
jH
ETMZ
y
zs . (2.12)
In accordance with (2.12), TM waves can occur on surfaces with a positive (i.e. inductive) reactance only, and thus, the permittivity of the medium must be positive also.
In the case of the TE waves, the z component of the magnetic field intensity Hz can be written as
xjkzz eCH α−−⋅= . (2.13)
Considering Faraday’s law
t∂
∂⋅−=×∇ HE µ , (2.14)
the surface impedance for TE waves can be derived [10], [12]
10
( )α
µω ⋅⋅−=−= j
H
ETEZ
z
ys . (2.15)
Taking (2.15) into account, TE waves obviously require the negative (i.e. capacitive) surface impedance, and thus, the permeability of the medium must be positive also.
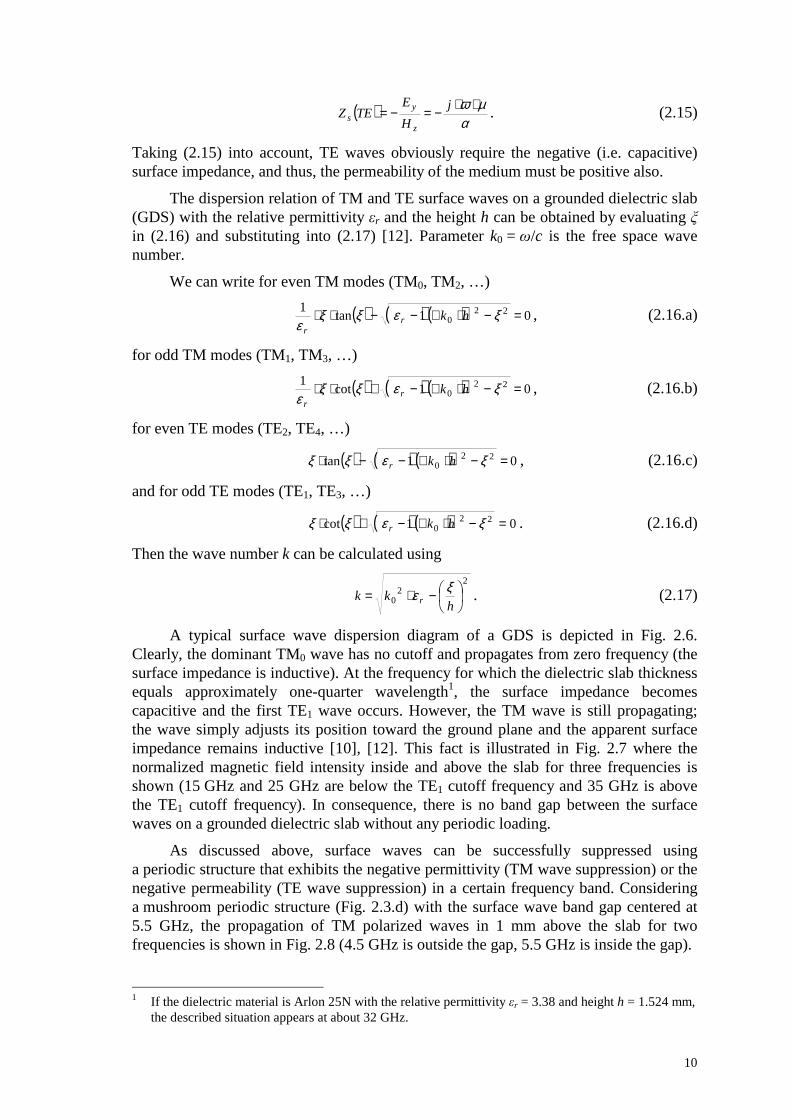
The dispersion relation of TM and TE surface waves on a grounded dielectric slab (GDS) with the relative permittivity εr and the height h can be obtained by evaluating ξ in (2.16) and substituting into (2.17) [12]. Parameter k0 = ω/c is the free space wave number.
We can write for even TM modes (TM0, TM2, …)
( ) ( ) ( ) 01tan1 22
0 =−⋅⋅−−⋅⋅ ξεξξε
hkrr
, (2.16.a)
for odd TM modes (TM1, TM3, …)
( ) ( ) ( ) 01cot1 22
0 =−⋅⋅−+⋅⋅ ξεξξε
hkrr
, (2.16.b)
for even TE modes (TE2, TE4, …)
( ) ( ) ( ) 01tan 220 =−⋅⋅−−⋅ ξεξξ hkr , (2.16.c)
and for odd TE modes (TE1, TE3, …)
( ) ( ) ( ) 01cot 220 =−⋅⋅−+⋅ ξεξξ hkr . (2.16.d)
Then the wave number k can be calculated using
2
20
−⋅=h
kk rξε . (2.17)
A typical surface wave dispersion diagram of a GDS is depicted in Fig. 2.6. Clearly, the dominant TM0 wave has no cutoff and propagates from zero frequency (the surface impedance is inductive). At the frequency for which the dielectric slab thickness equals approximately one-quarter wavelength1, the surface impedance becomes capacitive and the first TE1 wave occurs. However, the TM wave is still propagating; the wave simply adjusts its position toward the ground plane and the apparent surface impedance remains inductive [10], [12]. This fact is illustrated in Fig. 2.7 where the normalized magnetic field intensity inside and above the slab for three frequencies is shown (15 GHz and 25 GHz are below the TE1 cutoff frequency and 35 GHz is above the TE1 cutoff frequency). In consequence, there is no band gap between the surface waves on a grounded dielectric slab without any periodic loading.
As discussed above, surface waves can be successfully suppressed using a periodic structure that exhibits the negative permittivity (TM wave suppression) or the negative permeability (TE wave suppression) in a certain frequency band. Considering a mushroom periodic structure (Fig. 2.3.d) with the surface wave band gap centered at 5.5 GHz, the propagation of TM polarized waves in 1 mm above the slab for two frequencies is shown in Fig. 2.8 (4.5 GHz is outside the gap, 5.5 GHz is inside the gap).
1 If the dielectric material is Arlon 25N with the relative permittivity εr = 3.38 and height h = 1.524 mm,
the described situation appears at about 32 GHz.

11
Fig. 2.6 Typical dispersion relation of surface waves on grounded dielectric slab.
Fig. 2.7 Normalized magnetic field intensity of the TM0 surface wave inside and above of a grounded dielectric slab (εr = 3.38, h = 1.524 mm).
a) b)
Fig. 2.8 TM wave propagation on mushroom structure: 4.5 GHz – outside the band gap (a), 5.5 GHz – inside the band gap (b). The normalized electric field intensity (max(E┴) = 104 V/m)
normal to the surface is shown. CST MWS simulation.

12
3 Analysis of electromagnetic band gap structures
This section is devoted to the analysis and numerical modeling of periodic structures with the surface wave band gap using the commercial full-wave software tools CST MWS and Ansoft HFSS.
3.1 Numerical modeling of EBGs
Analysis of electromagnetic band gap structures is based on the Bloch-Floquet theorem [28] which describes the theory of wave propagation in infinite media consisting of the periodic repetition of the unit cell. The unit cell corresponds to the so-called first Brillouin zone which is the smallest polygon defined by the centre axes of vectors connecting the points of a periodic lattice around the origin [29]. The Brillouin zones for a 2D periodic structure with the square lattice are depicted in Fig. 3.1.
Fig. 3.1 A 2D periodic structure with square lattice – the Brillouin zones. Parameters kx, ky are the x and y components of the wave vector k and Dx, Dy the period in x and y directions.
The structure shown above is invariant under two fundamental and independent translation vectors Dx and Dy. The theorem states that each component uk(r) of an electromagnetic wave propagating in the periodic media can be expressed in the form
)()( rr rkk veu j ⋅= ⋅⋅ , (3.1)

13
where k is the wave vector, r the position vector and v(r) is a periodic function
)()( rDDr yx vqpv =⋅+⋅+ , (3.2)
for all integers p and q. It means the components of electromagnetic waves for any translation p·Dx + q·Dy differ in phase only
)()( )( rDDr kDDk
yxkyx ueqpu
qpj ⋅+⋅⋅⋅=⋅+⋅+ . (3.3)
According to the above-mentioned, properties of wave propagation in periodic media can be fully described considering only one unit cell and applying periodic boundary conditions at its edges.
Now, let us investigate a plane wave incidence on a periodic media with the unit cell from Fig. 2.3.c and parameters: period D = 9.9 mm, square patch size P = 6.1 mm, relative permittivity and height of the dielectric substrate εr = 2.2 and h = 1.13 mm, respectively. Ideal lossless dielectric is supposed. Because of the presence of the ground plane, magnitude of the reflection coefficient equals to one at all frequencies. The reflection phase response for TM and TE polarized impinging waves and angle of incidence υ = 0° (normal wave incidence) and υ = 89.5° (almost surface wave) is shown in Fig. 3.2. For both the TM and TE case, two types of resonance emerge [16]. The first one is a Fabry-Perot resonance at the cavity formed between the ground plane and the periodic loading. At this frequency, the incident electromagnetic wave is reflected with zero phase shift. The second one is the array resonance: the incident electromagnetic wave is reflected with a reversed phase. The Fabry-Perot resonance occurs at a different frequency then the array resonance and both these resonance frequencies are dependent on the angle of incidence.
a) b)
Fig. 3.2 Reflection phase response for the unit cell from Fig. 2.3.c and parameters described in the text: TM wave incidence (a), TE wave incidence (b). CST MWS simulation.
Using the reflection phase curves for the angle of wave incidence υ = 89.5°, basic establishments of surface wave propagation on the periodic structure can be drawn. As discussed above, the first TM0 surface mode has no lower cutoff frequency. Agreeable with that fact, the reflection phase for the TM wave incidence is near to zero degree up to the first array resonance at f = 14.45 GHz, when the incident electromagnetic wave is reflected with 180° phase shift. In the TE case, the reflection phase is almost constantly 180° up to the first Fabry-Perot type resonance at f = 13.65 GHz. At this point, the incident wave is reflected without any phase shift and the first TE1 wave begins to

14
propagate. In conclusion, a forbidden frequency band for TM waves may appear between the Fabry-Perot type and array resonance frequency, whereas a band gap for TE polarized waves may appear between the array resonance and Fabry-Perot type resonance frequency [30].
At υ = 90° incidence, the plane wave response is not a valid description any more. The exact position of pass bands and band gaps in the frequency spectrum can be obtained only by the dispersion relation of surface waves along the contour of the so-called irreducible Brillouin zone. The irreducible Brillouin zone for the 2D periodic structure with the square lattice from Fig. 3.1 is depicted in Fig. 3.3. Computing the dispersion diagram means to calculate the resonant frequencies of eigenmodes along the triangle with nodes marked Γ, X, M (symmetry points).
Fig. 3.3 The first Brillouin zone of the 2D periodic structure from Fig. 3.1. The irreducible Brillouin zone is shown.
In this work, dispersion characterization of surface waves propagating on periodic structures is investigated using CST MWS and Ansoft HFSS. The first of the mentioned uses finite integration technique (FIT) and the second one is based on finite element method (FEM). In both the programs, the unit cell of the structure under investigation has to be drawn with periodic boundary conditions applied in the appropriate directions. The phase shift is changed along the boundary of the irreducible Brillouin zone and frequencies of eigenmodes are obtained in each step. Because of slow-wave behavior of surface waves, dispersion curves are calculated only in the region under the light line, as shown in Fig. 2.6. Band gaps occur in frequency intervals, where no dispersion curves in the slow-wave region are present.
Fig. 3.4 shows the unit cell setup of a periodic structure with the square lattice from Fig. 3.1 and Fig. 3.3 for dispersion analysis in CST MWS and in HFSS. The main

15
difference between the computational models in the considered software tools consists in the following fact. HFSS uses a perfectly matched layer (PML) to represent an infinite air layer above the unit cell. In CST MWS, open boundaries are not allowed in combination with periodic walls, but only perfect electric conductor (PEC) or perfect magnetic conductor (PMC) boundary conditions can be applied. After many computer simulations in both the programs and comparing the obtained results with analytical and experimental considerations, the following rules for the correct surface waves dispersion diagram computation were stated:
• In CST MWS, an airbox with the height of about twenty times the dielectric slab thickness has to be placed over the unit cell and the PEC boundary condition should be applied instead of the open boundary on the top of the model, see Fig. 3.4.
• In HFSS, the height of the airbox of circa six times the dielectric slab thickness is sufficient and the PML boundary condition should be applied on the top of the model, see Fig. 3.4.
c ) d)
Fig. 3.4 Dispersion analysis in CST MWS (up) and in HFSS (down). The unit cell setup on the left, the applied boundary conditions with the irreducible Brillouin zone on the right.
In Fig. 3.5.a, we introduce the dispersion diagram for the same structure as in Fig. 3.2 calculated in CST MWS and in HFSS together with the one presented in [16].
a) b)

16
Fig. 3.5.b shows the measurement results of the surface wave suppression in x direction (Γ-X) [16]. Comparing these result to the reflection phase response for TM and TE plane wave incidence at υ = 89.5°, a good agreement can be found. Obviously, the array resonant frequency for TM polarization corresponds to the upper limit of a TM forbidden frequency band, whereas the Fabry-Perot type resonance for the TE polarization denotes the frequency, where the TE surface wave exceeds the light line and begins to propagate.
a) b)
Fig. 3.5 Dispersion diagram of the structure from Fig. 3.2 calculated using CST MWS, Ansoft HFSS and method-of-moment code [16] (a), measurement results [16] (b).
3.2 Summary
In this section, the analysis of periodic structures and the exploitation of the full-wave solvers CST Microwave Studio and Ansoft HFSS for dispersion diagram computation were discussed. In the open literature, only a few introductory texts and tutorials describing the correct set up of the analysis have been provided. Moreover, these texts are often incomplete and unclear. Therefore, a detailed description of the critical settings of unit cell modeling for the correct dispersion characterization of EBGs was worked out. The obtained results were compared to the results of other authors and experiments and published in [17], [31], and [32].

17
4 Optimization algorithms
Methods of global optimization are used to find optimal solutions for a given problem in a given feasible space. The global optimization can be applied not only to a final tuning, but also to a rough initial design and progressive improvement. In this thesis, four evolutionary algorithms have been implemented to test the capability of global optimization methods in the design of periodic structures with the surface wave band gap: the genetic algorithm with the single-point crossover (GAs), the genetic algorithm with the multi-point crossover (GAm), the differential evolution (DE) in the basic variant and the particle swarm optimization (PSO). The computational process of the design synthesis is controlled from Matlab in connection with CST MWS for the full-wave dispersion analysis. Matlab and CST cooperate via Visual BASIC for Application (VBA) interface. The synthesis can be divided into the following steps:
1. Initialization of the optimization algorithm,
2. Exporting the values of state variables into text file,
3. Running CST MWS and calling the VBA macro,
4. Updating the CST MWS model using the new values of state variables,
5. Running the simulation,
6. Exporting the results into text file,
7. Reading the text file with the results into Matlab,
8. Investigating the position of the band gap,
9. Assigning fitness,
10. Computing the new values of state variables.
Steps 1 to 3 are done in Matlab, steps 4 to 6 are executed by the VBA macro, and finally, the control is given back to Matlab. Reaching the last step, the procedure is repeated beginning with the second one.
This chapter is aimed to implement the above-mentioned evolutionary algorithms in the design of the planar EBG unit cell shown in Fig. 4.1.
Fig. 4.1 The EBG unit cell under consideration.
The period D and the size of the square patch P were selected as state variables to achieve the surface wave band gap in the given frequency interval (the first objective) and the maximum bandwidth (the second objective). The relative permittivity εr = 6.15

18
and the height of the dielectric substrate h = 1.575 mm are considered to be constant. The required center frequency of the band gap of the TE surface wave (occurring between the second and the third dispersion curve) is fc = 5.5 GHz. In all the cases, the fitness (or objective) function F (4.1) is formulated as a two-criterion function with respect to both the band gap position and the maximum bandwidth. The fitness function is going to be minimized. In (4.1), fBG_min is the lower limit, fBG_max the upper limit of the band gap and w1 and w2 are weighting coefficients (in this case, w1 = 1 Hz-2, w2 = 1). Credibility of the results obtained by CST MWS is checked by Ansoft HFSS.
−⋅−
−
+⋅=
cf
BGfBGfwcf
BGfBGfwF
min_max_2
2min_max_
21. (4.1)
4.1 Binary coded genetic algorithm
Genetic algorithm optimizers are robust, stochastic search methods, modeled on the principles and concepts of the natural selection and evolution [33]. The flowchart of the proposed genetic algorithms is depicted in Fig. 4.2.
The state variables of the optimized structure are binary encoded and put into a binary array (gene). Each individual is represented by 10 bits: 5 bits are used for the period D and 5 bits for the patch size P. The minimum and the maximum value of the period are set to 8.0 mm and 23.5 mm, respectively. The size of the patch is defined within the range of <0.50 D, 0.95 D>. The initial population consists of 12 random individuals. In order to delete the individuals with the highest values of the fitness function, population decimation is applied in the process of reproduction: 6 worst individuals are erased and 6 best individuals are copied without any change into the next generation (elitism). The remaining 6 new individuals are created by the crossover and the mutation (a random bit inverse). The probability of the crossover is 100 % and the probability of the mutation is set to 6 %. Because of a relatively small resolution (0.5 mm for the period), offspring are controlled in term of their originality – the process of mutation is repeated for all the newly created individuals they were already considered in previous iterations.
In this work, two variants of the genetic algorithm were realized: the first one uses the single-point crossover (genes of parameters D and P are not crossed separately), and the second one uses the multi-point crossover (genes of parameters D and P are crossed separately).
Fig. 4.2 Flowchart of the working principle of the proposed genetic algorithms.

19
In Fig. 4.3 and Fig. 4.4, results of the optimization process obtained by the GA with the single-point crossover and the GA with the multi-point crossover are depicted. Parameters of the best individuals for all the optimization methods are listed in Tab. 4.1.
a) b)
Fig. 4.3 Genetic algorithm with the single-point crossover: evaluation of the fitness function and of the lower / upper band gap frequency during 30 iterations (a), dispersion diagram of the best individual (b).
a) b)
Fig. 4.4 Genetic algorithm with the multi-point crossover: evaluation of the fitness function and of the lower / upper band gap frequency during 30 iterations (a), dispersion diagram of the best individual (b).
4.2 Differential evolution
A differential evolution algorithm in the basic variant is the second method proposed in this work for the EBG unit cell design. The crucial idea behind DE is a scheme for generating trial parameter vectors, see Fig. 4.5 [34], [35]. Individuals for the mutant population are created by adding a weighted difference between two population vectors to a third vector. After crossover and parameter control, values of the objective functions of the trial and target vector are compared: the individual with the higher value of the objective function is erased.
Similarly to the GA, the initial population of the DE algorithm consists of 12 individuals. However, the period D and the patch size P can change arbitrarily in the defined intervals (D ∈<8.0 mm, 23.5 mm>, P ∈<0.50D, 0.95D>) since D and P are real-valued parameters. A parameter of the trial vector, which overflows the defined

20
range during the differential mutation, is replaced by an allowed random value. Moreover, the DE algorithm creates 12 new individuals in each iteration cycle in comparison to 6 new individuals in case of the GA. Both the value of the mutation scale factor F and the value of the crossover constant C is set to 0.5. Fig. 4.6 shows a design example of the investigated EBG by the developed DE code.
Fig. 4.5 Working principle of the differential evolution algorithm.
a) b)
Fig. 4.6 Differential evolution: evaluation of the fitness function and of the lower / upper band gap frequency during 30 iterations (a), dispersion diagram of the best individual (b).
4.3 Particle swarm optimization
The PSO algorithm is the third method tested for the design and optimization of EBG. PSO is based on the movement and the intelligence of swarms [36]. A swarm of bees is aimed to find the best flowers in a feasible space. The bees are described by their coordinates, their velocity of movement and their value of the objective function. Each bee remembers the position of the lowest value of the fitness function reached during its fly (the personal best position). Moreover, each bee also knows the position of the

21
lowest minim revealed by the swarm together (the global best position). The velocity vector v (the direction and the speed of flight) of the bee to the area of the best flowers in the (n+1) iteration step can be expressed by the equation [36]
( ) ( )( )nbestnbestnn rrK xgxpvv −⋅⋅+−⋅⋅+⋅=+ 22111 ϕϕ , (4.2)
where K, φ1 is the personal best scaling factor and φ2 is the global best scaling factor, r1 and r2 are random numbers ranging from 0 to 1, pbest is the position of the personal best position, gbest is the location of the global best position and xn is the current position of the bee (in the n-th iteration step). For the optimization, values of constants were set to K = 0.729, φ1 = 2.8, φ2 = 1.3 [36]. Once the velocity vector of a bee is known, its new position can be calculated [36]
11 ++ ⋅∆+= nnn t vxx . (4.3)
In (4.3), ∆t is the time period the bee flies by the velocity vn+1 (in our case, ∆t was set to 1 second). In order to keep the bees in the feasible space, the “absorbing wall” boundary condition was used: if the bee reaches the border, the magnitude of the normal component of the velocity vector is set to zero.
Similarly to the previous cases, the population consists of 12 individuals, and parameters of the unit cell D and P are defined in intervals of D∈<8.0 mm, 23.5 mm> and P∈<0.50D, 0.95D>, respectively. In Fig. 4.7, an example of the planar EBG unit cell designed by PSO algorithm is shown.
a) b)
Fig. 4.7 Particle swarm optimization: evaluation of the fitness function and of the lower / upper band gap frequency during 30 iterations (a), dispersion diagram of the best individual (b).
4.4 Comparison of the methods
In the previous chapters, ability of different global evolutionary algorithms was tested in the design of EBGs suppressing the propagation of surface waves. Attention was turned to finding the optimum values of parameters D and P of the unit cell for the given permittivity εr = 6.15 and thickness h = 1.575 mm of the dielectric substrate. Results depicted in Fig 4.3, Fig 4.4, Fig 4.6 and Fig 4.7 are summarized in Tab. 4.1.
The solutions produced by the considered methods are very similar. In all the cases, the optimum values of D and P for the chosen central frequency fc = 5.5 GHz and

22
the maximum obtainable bandwidth are about 15 mm and 12 mm, respectively. The achieved relative bandwidth BW (related to fc = 5.5 GHz) is approximately 21%.
Tab. 4.1 Optimization results – properties of the planar EBG unit cells designed by different global evolutionary algorithms.
GAs GAm DE PSO
D [mm] 15.00 14.50 15.02 14.80
P [mm] 11.86 12.30 11.98 11.96
f'c [GHz] 5.53 5.50 5.47 5.53 CST MWS
BW [%] 20.93 21.61 20.96 21.90
f'c [GHz] 5.52 5.48 5.53 5.56 HFSS
BW [%] 19.47 20.18 20.98 21.09
Let us investigate the effectiveness of the considered techniques in term of the overall computational time required for the design. The dispersion relation of the planar square EBG unit cell was calculated with the phase step 20 degrees for the first three modes along the irreducible Brillouin zone shown in Fig. 3.3. Using CST MWS v. 2008 installed on a PC with the processor Intel Core Quad @ 2.66 GHz and 8 GB RAM, the average time for completing the dispersion characterization was estimated to 776 seconds. Because of the different setups of the techniques used, measuring the convergence velocity in time is reasonable. For an objective comparison of the methods, the initial population was composed from identical sets of individuals for all the algorithms, and the convergence rates were averaged over 3 realizations of the optimization (Fig. 4.8). Based on the results from Fig. 4.8, the fastest convergence is exhibited by PSO, whereas differences in accuracy of the methods are negligible.
Fig. 4.8 Comparison of the selected methods of global evolutionary algorithms – design of a single-band planar EBG unit cell.
4.5 Summary
The chapter was devoted to the utilization of global evolutionary algorithms in the design and optimization of EBG structures. Capability of four selected methods (binary-coded genetic algorithm with the single-point and the multi-point crossover, differential evolution and particle swarm optimization algorithm) was demonstrated on

23
the example of a planar square metallo-dielectric unit cell. Obviously, all the methods are able to solve the given electromagnetic problem successfully.
Comparison of the algorithms in terms of convergence rate and accuracy shows that the fastest convergence is provided by the particle swarm optimization, and the accuracy of the methods is approximately the same. Due to the long computational time needed for the dispersion diagram calculation, this establishment plays an important role in the design of more complex periodic structures.
Let us underline that the results presented above are informative only because of the low number of realizations. A more detailed study of this problem should be a part of future work.
The development described in this chapter was published in [37], [38], and [39].

24
5 Design examples of periodic structures with the electromagnetic band gap
The PSO algorithm introduced in the previous chapter is applied to the design of metallo-dielectric periodic structures with single- and dual-band EBG properties, to the design of a single-band structure with simultaneous EBG and AMC operation and to the design of a superstrate layer. The simulation results from CST MWS are checked using Ansoft HFSS.
5.1 Reduced-size EBG
In this section, the design of a single-band conventional mushroom EBG with the square metallic patch and the reduced-size structure with the square metallic patch and an additive ring (Fig. 5.1) is introduced. The given central frequency and the maximum bandwidth are objectives of the optimization.
a) b)
Fig. 5.1 The conventional mushroom EBG (a) and the reduced-size mushroom EBG with the square central patch and additive ring (b).
As discussed in chapter 2, the purely planar EBG is unable to forbid the propagation of the TM surface waves due to the absence of the vias. Therefore, the first band gap occurs between the second and the third modes (TE wave suppression). In comparison to that, the mushroom structure of the same dimensions but with the vertical rods connecting the patches to the ground plane exhibits the first band gap already between the first and the second dispersion curves (TM wave suppression, TE waves are in cutoff) at significantly lower frequencies than the planar EBG.
In many applications, the overall size of the device is strictly limited. In the case of periodic structures, the degree of the wave attenuation in such a media naturally depends on the number of the unit cell repetition (more repetitions mean a deeper band gap), e.g. [40]. Keeping in mind the above fact, two contradictory requirements can obviously be satisfied only by using the mushroom version of EBGs and not the planar one.
The resonant frequency of the conventional mushroom EBG can be reduced by replacing the simple square patch e.g. by the spiral since the inductance of the spiral is added in series to the inductance of the via [41]. The reduced-size EBG presented here is a simple modification of the conventional mushroom structure with an additional

25
square ring connected to the central patch. In this case, the eight-fold symmetry of the unit cell is disturbed slightly only (due to the presence of the strip connecting two metallic parts together). Thus, the irreducible Brillouin zone can be found for the structure in the same way as for the conventional one.
The design is aimed to find the optimum values of state variables (shown in Fig. 5.1 and defined in intervals included in Tab. 5.1) for the central frequency fc = 5.5 GHz and the largest bandwidth. Parameters D, P, g, w are optimized with the accuracy of 0.01 mm, and the via diameter d can change with the step of 0.1 mm. The dielectric substrate height and relative permittivity was chosen h = 1.575 mm and εr = 6.15 (Arlon AD600). The objective function is defined by (4.1) and the setup of the PSO algorithm is the same as in section 4.3.
Tab. 5.1 Definition intervals of the state variables of the conventional and reduced-size mushroom EBG unit cell.
Conventional EBG Reduced-size EBG
D [mm] <3 ; 10> <3 ; 10>
P [mm] <0.75D ; 0.95D> <0.75D ; 0.95D>
d [mm] <0.3 ; 0.6> <0.3 ; 0.6>
w [mm] – <0.10 ; 0.50>
g [mm] – <0.10 ; 0.30>
Both the mushroom structures under consideration were optimized in 10 iterations. The final values of unit cell parameters together with the band gap central frequency fc’ and relative bandwidth BW (related to fc = 5.5 GHz) calculated in CST MWS and Ansoft HFSS are given in Tab. 5.2. Optimization results are summarized in Fig. 5.2 and Fig. 5.3.
Based on the results presented below, the combination of the central metallic patch with the square ring obviously leads to the reduction of the overall unit cell size from 5.51 mm (conventional mushroom) to 4.02 mm (reduced-size mushroom), i.e. about 27 %. On the other hand, the conventional mushroom exhibits a band gap with a larger bandwidth than the reduced-size one. The band gap is from 4.58 GHz to 6.02 GHz (i.e. 26.2 % of relative bandwidth) for the conventional structure and from 5.06 GHz to 6.04 GHz (i.e. 17.8 % of relative bandwidth) for the reduced-size structure.
Tab. 5.2 Optimization results – properties of the conventional and reduced-size mushroom EBG unit cell.
Conventional EBG Reduced-size EBG
D [mm] 5.51 4.02
P [mm] 5.23 3.82
d [mm] 0.3 0.5
w [mm] – 0.35
g [mm] – 0.29
f'c [GHz] 5.30 5.55 CST MWS
BW [%] 26.2 17.8
f'c [GHz] 5.40 5.50 HFSS
BW [%] 27.7 17.6

26
a) b)
Fig. 5.2 The single-band conventional mushroom EBG optimized by the PSO algorithm: evaluation of the fitness function and of the lower / upper band gap frequency during 10 iterations (a), dispersion
diagram of the best individual (b).
a) b)
Fig. 5.3 The single-band reduced-size mushroom EBG optimized by the PSO algorithm: evaluation of the fitness function and of the lower / upper band gap frequency during 10 iterations (a), dispersion
diagram of the best individual (b).
5.2 Periodic structure with dual-band EBG properties
All of the periodic structures can exhibit multiple band gap properties as stated in [10], e.g. Summarizing the previous section, the first band gap occurs between the second and the third modes (TE surface wave suppression) in the case of the purely planar metallo-dielectric EBG, whereas the mushroom structure exhibits the first band gap between the first and the second dispersion curves (TM surface wave suppression). Detailed computer simulations show that the second band gap in the mushroom case corresponds to the first band gap in the planar case. In Fig. 5.4, the comparison of surface wave dispersion diagrams for the planar and the mushroom structures with the square metallic patch and identical parameters (see Fig. 4.1: D = 12 mm, P = 9 mm, εr = 3.38, h = 1.524 mm, diameter of the via d = 0.3 mm) is shown.

27
a) b)
Fig. 5.4 Comparison of dispersion diagrams for the planar (a) and the mushroom (b) structure. The band gaps are shaded gray. CST MWS simulation.
This section is aimed to show the exploitation of the developed PSO algorithm in the design of a dual-band EBG. Two structures under consideration are the conventional mushroom EBG with the simple square geometry and the EBG with the metallic patch in the form of the square Koch fractal of the 1st iteration (see Fig. 5.5). The main difficulty for the conventional mushroom EBG is hidden in the fact that the positions of the band gaps are closely dependent on each other and there is only a very small factor of freedom to tune them separately. In the case of the second EBG consisting of five square patches (one central and another four connected to the edges of the central patch), the positions of the band gaps should be almost independent because of the fractal geometry (at different frequencies, different portions of the metallic patch are in resonance). On the other hand, a more complex geometry leads to a more complex optimization problem because of the two additional unit cell parameters (the size of the central patch w and the gap g between the four extra patches) have to be considered.
a) b)
Fig. 5.5 The conventional mushroom EBG (a) and the EBG with the metallic patch in the form of the square Koch fractal of the 1st iteration (b).
The designed periodic structure is required to cover the bands fc1 = 5.30 GHz and fc2 = 10.25 GHz. In the first band gap, the TM polarized wave should be suppressed, whereas the TE wave is in cutoff. The second gap is positioned in a significantly higher frequency band, within which the TM wave does not propagate, and thus, the TE wave needs to be canceled.
Tab. 5.3 includes the intervals where the state parameters are defined. Similarly to the previous section, parameters D, P, w and g are optimized with the accuracy 0.01 mm and the via diameter d can change in the defined interval with the step 0.1 mm. A part of the design process is also aimed to determine correctly the dielectric slab considering two available substrates, Arlon 25N (the relative permittivity εr = 3.38, the height h = 1.524 mm) and Arlon AD600 (εr = 6.15 and h = 1.575 mm).

28
The objective function F is now defined as a sum of squares of partial objective functions F1 and F2
22
21 FFF += , (5.1)
where
11
min_1max_12
2
1min_1max_1
11 2c
f
ffwf
ffwF
c
BGBGc
BGBG +
+⋅−
−
+⋅= , (5.2)
and
22
min_2max_24
2
2min_2max_2
32 2c
f
ffwf
ffwF
c
BGBGc
BGBG +
+⋅−
−
+⋅= . (5.3)
In (5.2) and (5.3), fBGn_min, fBGn_max (n = 1; 2) is the lower and the upper limit of the first and the second band gap, w1, w2, w3, w4 are weighting coefficients and c1, c2 are constants. Based on many computer simulations, their optimal values were established w1 = w3 = 1 Hz-2, w2 = w4 = 0.25 and c1 = c2 = 1.
Tab. 5.3 Definition intervals of the state variables of the dual-band conventional and fractal mushroom EBG unit cells.
Conventional EBG Fractal EBG
D [mm] <5 ; 15> <5 ; 15>
P [mm] <0.50D ; 0.95D> <0.50D ; 0.95D>
d [mm] <0.3 ; 0.6> <0.3 ; 0.6>
w [mm] – <1.5 ; P>
g [mm] – <0.5 ; w-1>
h [mm], εr [ - ] [1.524 ; 3.38]
[1.575 ; 6.15]
[1.524 ; 3.38]
[1.575 ; 6.15]
The values of state parameters for the conventional dual-band EBG found by the PSO algorithm after 10 iterations are D = 8.23 mm, P = 6.17 mm, d = 0.6 mm for Arlon AD600. The first band gap lies in the frequency interval 4.37 GHz to 5.52 GHz and the second one 9.40 GHz to 11.44 GHz. The best values of state parameters for the fractal EBG optimized by the same algorithm are D = 8.26 mm, P = 4.74 mm, d = 0.3 mm, w = 1.98 mm, g = 0.92 mm for Arlon AD600. For this unit cell configuration, the first and the second band gaps are positioned in frequency intervals 5.01 GHz to 5.64 GHz and 9.63 GHz to 10.98 GHz, respectively. The optimization results are summarized in Tab. 5.4 and Fig. 5.6, Fig. 5.7. Clearly, the design process was successful and the requirements to cover the target frequency bands were satisfied in both the cases. However, the first band gap of the conventional EBG is significantly shifted to lower frequencies. For the fractal EBG, the calculated central frequencies are very close to the required values. This fact acknowledges the above-stated and indicates that complex patch geometry is more advantageous in the design of multi-band EBGs.

29
Tab. 5.4 Optimization results – properties of the conventional and fractal dual-band mushroom EBG unit cells.
Conventional EBG Fractal EBG
D [mm] 8.23 8.26
P [mm] 6.17 4.74
d [mm] 0.6 0.3
w [mm] – 1.98
g [mm] – 0.92
h [mm], εr [ - ] [1.575 ; 6.15] [1.575 ; 6.15]
f'c1 [GHz] 4.95 5.33
BW1 [%] 21.7 11.9
f'c2 [GHz] 10.42 10.31 CST MWS
BW2 [%] 19.9 13.2
f'c1 [GHz] 4.90 5.31
BW1 [%] 18.9 14.7
f'c2 [GHz] 10.38 10.06 HFSS
BW2 [%] 18.1 12.6
a) b)
Fig. 5.6 The dual-band conventional mushroom EBG optimized by the PSO algorithm: evaluation of the fitness function and the positions of the band gaps during 10 iterations (a), dispersion diagram of the best individual (b).
a) b)
Fig. 5.7 The dual-band fractal mushroom EBG optimized by the PSO algorithm: evaluation of the fitness function and the positions of the band gaps during 10 iterations (a), dispersion diagram of the best individual (b).

30
5.3 Periodic structure with simultaneous EBG and AMC properties
In the previous sections, the band-stop effect of metallo-dielectric periodic structures was investigated. However, they have also the feature of reflecting impinging electromagnetic waves at a given frequency with zero phase shift and behave as the artificial magnetic conductor (AMC) [10]. The frequency with the reflection phase equal to zero is called the AMC point, whereas the AMC bandwidth is defined as the frequency interval within which the reflection phase is smaller than +90° and greater than –90°. In many applications, the EBG and AMC properties need to be satisfied simultaneously (i.e. the AMC point must lie within the EBG band). In this work, normal wave incidence is considered.
In the case of the planar periodic structure (Fig. 2.3.c), the AMC and EBG behavior do not coincidence or the frequency interval of simultaneous AMC and EBG operation is extremely narrow [17]. Talking about the conventional mushroom structure with the square metallic patch (Fig. 2.3.d), both the position of the EBG and the position of the AMC band depend significantly on the parameters of the dielectrics and can alter separately [42].
In this section, three variants of mushroom structures are studied in terms of EBG and AMC behavior for the required EBG central frequency and also the AMC point fc = 5.5 GHz. The first structure is the conventional two-layer mushroom EBG with the simple square metallic patch. The second structure is the two-layer mushroom EBG with the metallic patch of a complex shape. The third structure is a three-layer variant with the simple square metallic patch at the top and bottom layer (the lower patch is connected to the ground plane). The structures are depicted in Fig. 5.8. In the design, two types of available dielectric substrates (Arlon 25N, Arlon AD600) were considered. The state variables D, P, P2 are optimized with the accuracy of 0.01 mm and the via diameter d with the accuracy of 0.1 mm in the intervals defined in Tab. 5.5.
a) b) c)
Fig. 5.8 Mushroom unit cells for optimization: the conventional two-layer one with the simple square metallic patch – No.1 (a), the two-layer one with the metallic patch of a complex shape – No.2 (b) and the three-layer one with the simple square metallic patch at the top and the bottom layer – No.3 (c). Top and
side view.
The objective function F is composed from two partial fitness functions F1 and F2. The first partial fitness function F1 is formulated as a two-criterion function with respect to both the band gap position and the maximum bandwidth. The second partial fitness function F2 considers the frequency of zero reflection phase

31
22
21 FFF += , (5.4)
cf
ffwf
ffwF
c
BGBGc
BGBG +
+⋅−
−
+⋅= min_max_
2
2
min_max_11 2
, (5.5)
and
( )cAMC ffabsF −=2 . (5.6)
In equations (5.5) and (5.6), w1, w2 are weighting coefficients, fBGmax and fBGmin is the upper and lower limit of the band gap, respectively, c is a constant and fAMC is the frequency at which the reflection phase equals to zero. The optimal values of weighting coefficients were found w1 = 1 Hz-2, w2 = 0.25, c = 1.
Tab. 5.5 Definition intervals of the state variables of the mushroom unit cells under consideration.
No. 1 No. 2 No. 3
D [mm] <3 ; 12> <3 ; 12> <3 ; 12>
P [mm] <0.50D ; 0.95D> <0.50D ; 0.95D> <0.50D ; 0.95D>
P2 [mm] – – <0.50D ; 0.95D>
d [mm] <0.3 ; 0.6> <0.3 ; 0.6> <0.3 ; 0.6>
h [mm], εr [ - ] [1.524 ; 3.38]
[1.575 ; 6.15]
[1.524 ; 3.38]
[1.575 ; 6.15]
[1.524 ; 3.38]
[1.575 ; 6.15]
h2 [mm], εr2 [ - ] – – [1.524 ; 3.38]
[1.575 ; 6.15]
In the case of the structure depicted in Fig. 5.8.b, the shape of the metallic patch is also generated by PSO. The patch is divided into 20 × 20 uniform cells. Due to the eight-fold symmetry (required for the same reflection phase response for both the TM and the TE polarized waves considering normal incidence), only 55 cells lying inside the irreducible Brillouin zone need to be defined by the algorithm as a metal or a vacuum (see Fig. 5.9). The rest of the unit cell is a mirrored and rotated copy of this first eighth. Due to the presence of the shorting via, the cells lying in the centre of the patch and covering the via are automatically set as a metal (for example if D = 3 mm, P = 1.5 mm and d = 0.3 mm, these cells are #9, #10 and #19).
Fig. 5.9 One quarter of the metallic patch of the mushroom structure from Fig. 5.8.b – the cells signed with numbers are lying inside of the irreducible Brillouin zone and should be defined by the PSO
algorithm as a metal or a vacuum.
Since the lowest surface wave band gap occurs between the first and the second dispersion curves, the dispersion relation of all the structures was calculated for the first two modes only. All the structures under consideration exhibit multiple AMC points, but the higher ones occur at significantly higher frequencies than the first one. Hence,

32
attention was turned to the design of a periodic structure with the first AMC point equal to the required frequency and lying in the middle of the lowest surface wave band gap. These requirements guarantee the minimum cell size. On the other hand, we should keep the structure as simple as possible due to fabrication cost and accuracy (material consumption and need of complex technology).
The computer model for calculating the reflection phase response of the investigated structures is shown in Fig. 5.10. The boundaries of the model are defined as a pair of PEC and PMC walls and a de-embedded waveguide port is placed on the top to record the reflection phase data directly at the surface.
a) b)
Fig. 5.10 Reflection phase computation in CST MWS and HFSS. The unit cell setup (a) and the applied boundary conditions (b).
The mushroom structures were optimized during 20 iterations. In each iteration, both the dispersion and reflection phase diagrams were computed 12 times (the number of individuals in the population). The setup of PSO is the same as in previous sections. The results are presented in Tab. 5.6, Fig. 5.13, Fig. 5.14 and Fig. 5.15
Considering results of computer simulations, following conclusions can be drawn.
Two-layer structures behave very similarly, and almost independently on the complexity of the shape of the metallic patch. Obtaining simultaneous EBG / AMC performance for the available substrates and given central frequency is impossible here: the AMC point lies outside of the band gap shifted towards to higher frequencies.
In the case of the stacked mushroom structure, the EBG behavior is influenced by the parameters of both the lower and the upper layer. The AMC property depends primarily on the parameters of the upper layer (on the size of the metallic patch, especially).
This fact is demonstrated on an example of a three-layer metallo-dielectric periodic structure in three variants with the same parameters (D = 12 mm, P = 9 mm, d = 0.3 mm, P2 = 10.50 mm, h = h2 = 1.524 mm, ε = ε2 = 3.38). First, the stacked mushroom surface depicted in Fig. 5.8.c is considered. Second, the structure contains only the lower patch with the via. Third, only the upper metallic patch is present in the structure. In Fig. 5.11, the reflection phase diagrams of the three above-mentioned structures are depicted. After removing the lower patch and the via, the reflection phase response of the stacked structure stills almost unchanged. This enables us to tune the EBG and the AMC properties separately. As shown in Fig. 5.15, the PSO optimized three-layer structure exhibits a band gap extending from 5.03 GHz to 5.96 GHz and the

33
AMC point at the frequency 5.54 GHz. The structure is of a simple geometry and can be easily fabricated. In all the cases, the HFSS indicates a larger AMC bandwidth than the CST MWS but the frequencies of the zero reflection phase predicted by these two solvers are in good agreement.
Fig. 5.11 Reflection phase response of three variants of stacked metallo-dielectric periodic structures (a), (b), and (c). Parameters of the structures in the text. CST MWS simulation.
Tab. 5.6 Optimization results – properties of the optimized two-layer and three-layer mushroom structures for simultaneous EBG / AMC operation.
No. 1 No. 2* No. 3
D [mm] 6.00 5.84 6.51
P [mm] 5.70 5.55 3.50
P2 [mm] – – 5.05
d [mm] 0.6 0.3 0.4
h [mm], εr [ - ] [1.575 ; 6.15] [1.575 ; 6.15] [1.575 ; 6.15]
h2 [mm], εr2 [ - ] – – [1.575 ; 6.15]
f'c [GHz] 5.39 5.26 5.50
BW1 [%] 26.0 24.4 16.9 CST MWS
fAMC [GHz] 5.93 6.15 5.54
f'c [GHz] 5.27 5.20 5.52
BW1 [%] 19.3 22.4 18.3 HFSS
fAMC [GHz] 6.03 6.34 5.58
* Numbers of the cells inside of the irreducible Brillouin zone defined as a metal (see Fig. 5.9 and Fig. 5.12): 2, 3, 5, 6, 7, 8, 9, 10, 11, 12, 13, 14, 18, 19, 22, 24, 25, 27, 29, 31, 34, 37, 40, 41, 43, 44, 45, 47, 51, 52, 53, 54, 55.
Fig. 5.12 The patch of the mushroom structure from Fig. 5.8.b optimized by PSO algorithm.

34
a) b)
c)
Fig. 5.13 The conventional two-layer mushroom structure with the simple square metallic patch: evaluation of the fitness function, the position of the band gap and the AMC point during 20 iterations (a),
dispersion diagram of the best individual (b), reflection phase diagram of the best individual (c).
a) b)
c)
Fig. 5.14 The two-layer mushroom structure with the metallic patch of a complex shape: evaluation of the fitness function, the position of the band gap and the AMC point during 20 iterations (a), dispersion
diagram of the best individual (b), reflection phase diagram of the best individual (c).

35
a) b)
c)
Fig. 5.15 The three-layer mushroom structure: evaluation of the fitness function, the position of the band gap and the AMC point during 20 iterations (a), dispersion diagram of the best individual (b), reflection
phase diagram of the best individual (c).
5.4 The EBG superstrate
Superstrates make a special class of periodic structures. In this work, a short overview of superstrates together with their design synthesis and optimization by the developed PSO algorithm is presented.
Superstrates are able to focus the electromagnetic energy, thus they can be used for gain improvement of antennas, e. g. The basic principle of superstrates corresponds to the principle of Fabry-Perot resonators: a radiation source is positioned between the ground plane (GP) and a partially reflective surface (PRS) forming together a resonant cavity, see Fig. 5.16 [43].
Fig. 5.16 Resonant cavity formed by ground plane and partially reflective surface.
The distance between the ground plane and the partially reflective sheet S can be easily derived using the ray optics model [43]. In this analysis, the PRS is assumed to be

36
a homogenous surface. The antenna function can be described by following the paths of the waves undergoing multiple reflections inside the cavity. Phase shifts are introduced by the path length, the GP and the phase of the reflection coefficient of the PRS. The transmitted power can be derived by considering the interference of waves partially transmitted through the PRS. The directivity of the cavity at boresight can be expressed as the ratio of the transmitted power PT to the power of the source PS
( )∆Φ−+
−==cos21
12
2
RR
R
P
PD
S
T , (5.7)
where RejФR is the complex reflection coefficient of the PRS and ∆Ф = Ф2 – Ф1 (see
Fig. 5.16). The resonance condition is satisfied if the phase difference of the transmitted waves is equal to zero
NSR πλππ 22
2 =−−Φ=∆Φ , N = 0, 1, 2 … (5.8)
and thus
NS R
241
λλπ
+
−Φ= . (5.9)
In Eq. (5.8) and Eq. (5.9), λ is the free-space wavelength. At the resonance, the maximum boresight directivity is obtained
R
RD
−+=
1
1max . (5.10)
Considering the above analysis, the directivity of the cavity is obviously determined by the reflection properties of the PRS. For a highly reflective surface used as PRS, with the reflection phase close to π, the height of the resonant cavity should to be close to λ/2. For this cavity, the directivity (5.10) will be very high, since R will be close to 1 [43].
Similarly to the above analysis, if the PEC ground plane is replaced by the PMC one, the height of the resonant cavity could be expressed as
NS R
24
λλπ
+Φ= , N = 0, 1, 2 … (5.11)
Therefore, a PMC surface with zero reflection phase and a highly reflective PRS (ФR ≈ π) would result in a resonant cavity of thickness approximately λ/4 [43].
Superstrates can be realized as purely dielectric, purely metallic or metallo-dielectric. The basic variant of superstrates is a 1D dielectric EBG containing a defect resonator, see Fig. 5.17. The defect causes an extremely sharp pass band lying inside the stop band (Fig. 5.18), [44].
The 1D EBG with the defect resonator from Fig. 5.17b can be implemented as a structure containing one-half of the EBG layers and of a ground plane generating the electric image of these layers as depicted in Fig. 5.19. Using the image theory, the frequency dependence of the transmission of the structure with the superstrate and the ground plane can be calculated using the computer model shown in Fig. 5.20. Fig. 5.21 presents the numerical model for obtaining the frequency dependence of the complex reflection phase of the superstrate. Both the models are valid for unit cells with eight-fold symmetry and for both the CST MWS and Ansoft HFSS software tools.

37
a) b)
Fig. 5.17 1D EBG material (a), 1D EBG material with defect resonator (b).
Fig. 5.18 Typical transmission properties of 1D EBG material with and without defect resonator.
a) b) c)
Fig. 5.19 1D EBG material with defect resonator (a), replacing one-half of the structure by putting an image plane (b) the realistic structure (c).

38
a) b)
Fig. 5.20 Transmission coefficient computation of superstrates in CST MWS and HFSS. The unit cell setup (a) and the applied boundary conditions (b).
a) b)
Fig. 5.21 Reflection coefficient computation of superstrates in CST MWS and HFSS. The unit cell setup (a) and the applied boundary conditions (b).
As discussed in many papers, e. g. [45], the higher the quality factor Q of the resonator, the higher the directivity of the antenna can be achieved. On the other hand, the higher quality factor means the narrower radiation bandwidth. The quality factor of the resonator can be evaluated as the ratio of the resonant frequency fr to the –3 dB bandwidth ∆f-3dB
dB
r
f
fQ
3−∆= . (5.12)
This chapter is aimed to demonstrate the exploitation of the PSO algorithm in the design of a single-layer metallo-dielectric superstrate structure with the metallic square

39
patch shown in Fig. 5.22 (notice that the structure is identical to the structure from Fig.4.1, but no ground plane is present here).
Fig. 5.22 The superstrate unit cell under consideration.
The superstrate has to be designed for the required central frequency fc = 5.5 GHz and optimized for the highest quality factor Q. The fitness function F is formulated as a two-criterion one and is going to be minimized
( ) ( )232
21 / rdBrc ffwffwF −∆⋅+−⋅= . (5.13)
In (5.13) w1 = 1 Hz-2 and w2 = 1 are weighting coefficients.
Definition intervals of state variables for optimization are listed in Tab. 5.7. The initial value of the period D was chosen to be close to half wavelength (λ/2 ≈ 27.27 mm) and the height of the resonant cavity 2S to be close to one wavelength (λ ≈ 54.55 mm). The dielectric substrate used is the Arlon AD 600 (εr = 6.15, h = 1.575 mm).
Tab. 5.7 Definition intervals of state variables for the superstrate.
D [mm] <24.5 ; 31.0>
P [mm] <0.75D ; 0.95D>
2S [mm] <51.8 ; 57.3>
The selected parameters of the single-layer superstrate were tuned during 30 iterations. Optimization results are summarized in Tab. 5.8 and in Fig. 5.23. Clearly, the length of the optimized resonant cavity is in very good agreement with the length obtained by the ray optics model (2S = 55.76 mm), considering the second resonant mode. Using (5.10), the achievable gain improvement of the antenna placed under the superstrate layer is about 21 dB.
Tab. 5.8 Optimization results – properties of the designed superstrate layer.
D [mm] 30.22
P [mm] 27.31
2S [mm] 55.63
fr [GHz] 5.50
Q [ - ] 262
R [dB] -0.13 CST MWS
arg(R) [deg] -172
fr [GHz] 5.52
Q [ - ] 143
R [dB] -0.14 HFSS
arg(R) [deg] -165

40
a) b)
c)
Fig. 5.23 The designed single-layer metallo-dielectric superstrate: evaluation of the fitness function during 30 iterations (a), evaluation of the resonant frequency and of the resonator quality factor (b),
transmission magnitude of the best individual (c).
5.5 Summary
The chapter was devoted to the practical application of the developed PSO algorithm in the design of periodic structures with the electromagnetic band gap. Four examples of EBG structures were introduced and optimized to fulfill the requirements. Manual tuning of these structures would be very difficult, and without the developed tool, the optimal configuration could be hardly found. Exploitation of the method in the design of another complex-shape, single- and multi-band periodic structures, is straightforward.
The original results presented above were published in [37], [39], [46].

41
6 Antenna experiments
This chapter is devoted to the practical exploitation of periodic structures in antenna technology: a conventional mushroom structure with simultaneous EBG and AMC performance at fc = 10.25 GHz was designed together with a single-layer metallo-dielectric superstrate operating at the same frequency. The theoretical considerations were confirmed by computer models and experiments: suppression of surface waves over EBG structure and in-phase reflection of electromagnetic waves impinging on AMC surface was measured and electromagnetic energy focusing by the superstrate was simulated in full-wave software tools.
6.1 Vertical monopole antenna on EBG surface
In the first experiment, a lambda-quarter monopole antenna was placed perpendicularly on the conventional metal ground plane. Then, the conventional ground was replaced by the EBG structure, see Fig. 6.1. The radiation characteristics of the antennas were measured to confirm the suppression of surface waves excited by the vertical monopole.
a)
b)
Fig. 6.1 Vertical monopole over conventional metal ground plane (a) versus vertical monopole surrounded by electromagnetic band gap surface (b).
The EBG structure under consideration is a mushroom one with the square unit cell. Using PSO, the EBG was designed to obtain the full band gap and in-phase reflection for normal wave incidence at 10.25 GHz. The period of the optimized unit cell is D = 2.22 mm, the patch size P = 2.04 mm and the diameter of via d = 0.40 mm. The substrate used is the Arlon AD 600 with the height h = 1.575 mm and the relative permittivity εr = 6.15. The calculated dispersion diagram (Fig. 6.3a) predicts the full band gap in the frequency interval 9.00 GHz to 11.45 GHz.

42
In the fabrication process, the printed circuit board technology was carried out. The computer model and the fabricated prototype dominantly differ in the realization of the vias. In practice, the vias are manufactured as drilled and metal-coated holes ensuring the vertical connections between the metallic patches and the ground plane. In computer models, metallic pins are considered. In order to thicken the metal coating, the whole structure is electroplated with copper and covered by a thin layer of gold. Due to that, the overall thickness of the metallic layers at the top and the bottom of the substrate is about 60 to 70 microns instead of the original 35 microns. Both of the above-mentioned facts influence the position of the band gap. Thus, the original design of the EBG unit cell had to be slightly modified to keep the position of the gap in the desired frequency interval: the diameter of the vias was changed from d = 0.40 mm to d = 0.50 mm. Photograph of the fabricated EBG board is included in appendix A.
The transmission of electromagnetic waves over the EBG was measured using two identical horn antennas communicating through the surface waves supported by the structure. The measurement setup is shown in Fig. 6.2 and the results are depicted in Fig. 6.3b. Four measurements were provided and transmission of TM and TE polarized waves over the EBG board and the conventional metal ground plane were investigated in the Γ-X direction (in this direction, the band gap has its narrowest limits). At lower frequencies (see chapter 2.3), the surface impedance of the EBG board is inductive, and therefore, the EBG supports the propagation of TM surface waves similarly to the metal ground plane and TE surface waves are in cutoff. With increasing frequency, the surface impedance becomes capacitive, the transmission magnitude of TM waves decreases and the transmission magnitude of TE waves increases. The band gap occurs between TM and TE surface wave pass-bands in the frequency interval from 9.0 GHz to 11.5 GHz which indicates a very good agreement between the computer simulation and the experiment.
In Fig. 6.4 and Fig. 6.5, the distribution of the normalized electric (TM waves) and magnetic (TE waves) field intensity over the EBG surface is depicted. In the case of these computer simulations, the EBG structure is considered as semi-infinite (finite in x direction and infinite in y direction) which is achieved applying the magnetic walls (TM waves) or the electric walls (TE waves) in y direction. The field distributions are shown for three frequencies, 8.00 GHz (TM waves in propagation, TE waves in cutoff), 10.25 GHz (both the TM and TE waves in cutoff) and 12.50 GHz (TM waves in cutoff, TE waves in propagation), and confirm the results of the dispersion analysis and the measurement.
Fig.6.2 Setup for measuring the transmission of electromagnetic waves over the EBG board.

43
a) b)
Fig. 6.3 Dispersion diagram of the optimized EBG structure (a), measured transmission curves for TM and TE surface waves on metal and EBG board (b).
a)
b)
c)
Fig. 6.4 TM surface wave propagation on mushroom EBG surface: distribution of the normalized electric field intensity (max(Ez) = 104 V/m) at 8.00 GHz (a), 10.25 GHz (b) and 12.50 GHz (c).
CST MWS simulation.

44
a)
b)
c)
Fig. 6.5 TE surface wave propagation on mushroom EBG surface: distribution of the normalized magnetic field intensity (max(Hz) = 50 A/m) at 8.00 GHz (a), 10.25 GHz (b) and 12.50 GHz (c).
CST MWS simulation.
In the next step, a monopole was placed into the centre of a conventional metal ground plane, and then, into the centre of the EBG board. Dimensions of the boards are 300 mm × 300 mm and the EBG structure consists of 100 ×100 unit cells. The length of the antenna la was chosen in both the cases the same la = 6.8 mm. The directivity patterns of the antennas were measured for two frequencies 8.00 GHz (outside the band gap) and 10.25 GHz (inside the band gap), see Fig. 6.6 and Fig. 6.7. The monopole over the conventional metal ground plane shows the typical radiation characteristics with a null at the axis of the antenna. The considerable back radiation is caused by the diffraction of surface waves at the edges of the plate. After replacing the metal ground plane with the EBG one, the radiation characteristics of the antenna significantly change. Outside the band gap, there are many deep nulls in the radiation pattern and the front-to-back ratio is very poor. Inside the band gap, the antenna shows the smooth radiation pattern. The null at 0° in x-z plane disappears and the antenna behaves more like a dipole. The back radiation is decreased due to the suppressed surface waves. The average difference between the measured signal level in x-y plane at 8.00 GHz and 10.25 GHz is about –22 dB. The above-mentioned facts indicate that the EBG structure focuses the electromagnetic energy emitted by the monopole into the upper hemisphere.

45
a) b)
Fig. 6.6 Measured radiation patterns of the vertical monopole over metal ground plane at 8.00 GHz and 10.25 GHz: x-z plane (a) and x-y plane (b).
a) b)
Fig. 6.7 Measured radiation patterns of the vertical monopole over EBG ground plane at 8.00 GHz and 10.25 GHz: x-z plane (a) and x-y plane (b).
In order to fully describe the performance of the antenna on EBG ground plane, difficulties with the impedance matching have to be mentioned. Outside the band gap, a good matching (S11 < –10 dB) can be achieved easily. Inside the band gap, the impedance matching is impossible due to the strong interaction between the radiator and the surrounding EBG. This drawback can be successfully solved by separating the antenna and the periodic pattern, see Fig. 6.8a. However, if there is another requirement on the in-phase reflection of electromagnetic waves impinging on the board, removing some of the EBG patches near to the antenna can lead to detuning or canceling the AMC behavior. A possible solution for this problem is shown in Fig. 6.8b. In this case, the metallic patches near to the antenna are without the vias, while the rest of the patches far from the antenna are connected to the ground plane. The reflection phase characteristic for both the unit cells with and without the via for the normal wave incidence is the same, but due to the removed vias, the surface wave band gap disappears for these unit cells.

46
a) b)
Fig. 6.8 Two possible solutions for improving the impedance matching of the antenna surrounded by a periodic structure with the electromagnetic band gap: spatial separation of the antenna
and the EBG (a), removing the vias (b).
6.2 Horizontal wire antenna over AMC surface
In the second experiment, a horizontal wire antenna was placed above the conventional metal ground plane. Then, the conventional ground plane was replaced by the mushroom structure introduced in the previous chapter. If the designed periodic surface operates correctly (reflects the impinging electromagnetic waves in-phase rather than out-of-phase at the resonant frequency of the antenna) the distance between the radiator and the surface can be significantly reduced, see Fig. 6.9. Considering computer simulations (Fig. 6.11a), the PSO-optimized mushroom structure should exhibit the zero reflection phase at the frequency 10.3 GHz, whereas the measurement results indicate the AMC point at about 10.8 GHz (Fig. 6.11b). This frequency shift could be caused by the differences between the computer model and the fabricated prototype and the inaccuracies at measurement (the setup is depicted in Fig. 6.10).
a)
b)
Fig. 6.9 Horizontal wire antenna over conventional metal ground plane (a) versus horizontal wire antenna over artificial magnetic conductor surface (b).

47
Fig.6.10 Setup for measuring the reflection phase of the periodic surface.
a) b)
Fig. 6.11 Reflection phase diagram of the optimized mushroom structure: computer simulation (a), measurement (b).
In Fig. 6.12, the normalized magnetic field distribution over the periodic surface is shown. Clearly, if the surface reflects the impinging electromagnetic waves out-of-phase (Fig. 6.12a, b, d, e), the periodic structure behaves as short-circuit and an anti-node of the magnetic field intensity at the level of the metallic patches occurs. If the waves are reflected in-phase (Fig. 6.12c), the periodic structure behaves as an open-circuit, and a node of the magnetic field intensity is present at the level of the metallic patches.
Similarly to the previous case, the horizontal wire antenna was placed above the metal ground plane. The best impedance matching at 10.25 GHz was found for the antenna length la = 18 mm and the distance from the reflector ha = 5 mm, see Fig. 6.13. The measured directivity patterns are depicted in Fig. 6.14. Obviously, deformations in radiation characteristic (asymmetry, deep null at –43°) are caused by the asymmetry of the antenna and the presence of surface waves.

48
a) b) c) d) e)
Fig. 6.12 Electromagnetic wave impinging on mushroom AMC surface: distribution of the normalized magnetic field intensity (max(Hy) = 50 A/m) at 6.00 GHz (a), 8.00 GHz (b), 10.25 GHz (c),
12.00 GHz (d), 14.00 GHz (e). CST MWS simulation.
Fig. 6.13 Measured impedance matching of the horizontal wire antenna over conventional metal ground plane.

49
a) b)
c)
Fig. 6.14 Measured radiation patterns of the horizontal wire antenna over conventional metal ground plane at 10.25 GHz: x-z plane (a), y-z plane (b), x-y plane (c).
Then, the horizontal wire antenna was placed above the periodic structure. For this case, the length of the antenna used was changed to la = 13 mm and the distance between the radiator and the periodic surface was reduced to ha = 1.5 mm (0.05 λ0 at 10.25 GHz). The measured impedance matching (Fig. 6.15) acknowledges the shift of the AMC point from the calculated value 10.3 GHz to 10.8 GHz obtained by the experiment: the antenna is matched (S11 < –10 dB) from 10.5 GHz up to 14.4 GHz.
Fig. 6.15 also includes the S11 curves for the case if the periodic surface is replaced by the conventional metal ground plane while the height of the antenna over the reflector remains. Without the periodic surface, the antenna is unmatched due to the phase opposition between the direct waves and the reflected waves.
Fig. 6.16 shows the measured radiation patterns. Similarly to the case of the vertical monopole antenna, the presence of the periodic structure results in smooth directivity patterns with higher directivity and suppressed back radiation. The measured average signal level in x-y plane is about 10 dB smaller than in the case of the antenna above the conventional metal ground plane.

50
Fig. 6.15 Measured impedance matching of the horizontal wire antenna over metal versus AMC ground plane.
a) b)
c)
Fig. 6.16 Measured radiation patterns of the horizontal wire antenna over AMC ground plane at 10.25 GHz: x-z plane (a), y-z plane (b), x-y plane (c).

51
6.3 Horizontal dipole antenna covered by superstrate layer
In the third antenna experiment (carried out via full-wave computer simulations only), a horizontal wire antenna above the metal ground plane was considered with and without the superstrate, see Fig. 6.17. The concept shown in Fig. 6.18.b is often referred to as “the EBG resonator antenna” in the open literature. The superstrate works on the principle of Fabry-Perot resonators and focuses the electromagnetic energy in the direction normal to its surface as described in chapter 5.4. The antenna gain improvement depends on the features of the superstrate (quality factor, reflection properties) but also on its overall size: the EBG resonator antenna behaves like a radiating aperture with a Gaussian distribution of the electromagnetic field magnitude [45].
a)
b)
Fig. 6.17 Horizontal wire antenna over ground plane (a) versus horizontal wire antenna over ground plane and covered by single-layer metallo-dielectric superstrate (b).
The designed superstrate is the single-layer structure with the square unit cell (Fig. 5.22). The superstrate is optimized by PSO to have the second transmission maximum with the highest quality factor at 10.25 GHz. Parameters of the unit cell are D = 14.03 mm, P = 11.43 mm, h = 1.575 mm, εr = 6.15 and the distance between the ground plane and the superstrate is S = 14.9 mm.
Fig. 6.18 explains why the second resonance of the superstrate is employed instead of the first one. Fig. 6.18 shows the normalized magnetic field distribution inside the resonant cavity, which is created by the superstrate and the metallic ground plane. At the position of the reflector, the first resonant mode shows a null while the second resonant mode exhibits a maximum there. Hence, only the second mode can exist in the resonant cavity.
The transmission and reflection properties of the designed superstrate are shown in Fig. 6.19. At the frequency of the first transmission maximum (f = 5.60 GHz), the reflection magnitude is R = -0.8 dB and the reflection phase equals arg(R) = -160°. At the second transmission maximum (f = 10.25 GHz), the reflection magnitude is

52
significantly higher R = -0.2 dB, and also the reflection phase is closer to the required value, arg(R) = -172°. The quality factor (5.12) for the second resonant mode is then Q = 156. Based on the above results, the maximum theoretically achievable gain improvement of the antenna with the superstrate calculated using (5.10) is about 19 dB.
a) b)
Fig.6.18 Normalized magnetic field distribution (max(Hy) = 20 A/m) of the first (a) and of the second (b) resonant mode in the cavity shown in Fig. 5.20.
a) b)
Fig. 6.19 Frequency dependence of the transmission coefficient (a) and of the complex reflection coefficient – calculated in CST MWS (b) of the designed superstrate layer.
Fig. 6.20 Calculated impedance matching of the horizontal wire antenna over ground plane without the superstrate.

53
a) b)
Fig. 6.21 Calculated radiation patterns of the horizontal wire antenna over ground plane without the superstrate at 10.25 GHz: x-z plane (a), y-z plane (b).
The computer models of the antenna with and without the superstrate have the same dimensions 300 mm × 300 mm while the periodic structure consists of 16 × 16 unit cells. The length of the horizontal wire antenna without the superstrate was chosen la = 15.7 mm and the distance between the radiator and the ground plane ha = 5.2 mm. Fig. 6.20 and Fig. 6.21 show the calculated impedance matching and radiation patterns, respectively. Please notice that the antenna is identical to the antenna measured in the previous chapter, i. e. the simulated results should correspond to the results depicted in Fig. 6.13 and Fig. 6.14.
Then, the antenna was covered by the superstrate layer. The antenna was re-dimensioned to achieve the required impedance matching while the height of the resonator cavity was strictly kept to be equal to the calculated value S = 14.9 mm. The height of the antenna above the ground plane remained ha = 5.2 mm and its length was reduced to la = 12.0 mm (the superstrate layer considerably lowers the resonant frequency of the radiator). In Fig. 6.22, the calculated impedance matching of the EBG resonator antenna is depicted. If the superstrate is present, the antenna is unmatched up to the resonant frequency at 10.25 GHz and stills matched (S11 about -10 dB) for higher frequencies.
Fig. 6.22 Calculated impedance matching of the horizontal wire antenna over ground plane and covered by superstrate layer.
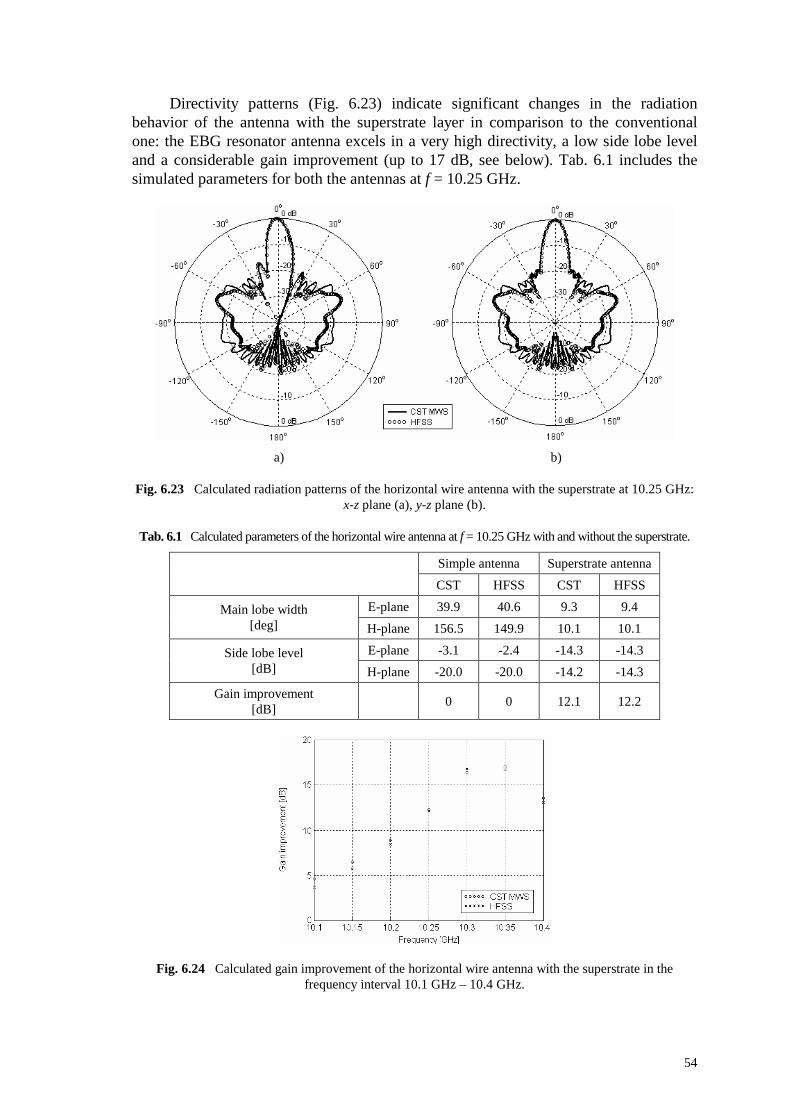
54
Directivity patterns (Fig. 6.23) indicate significant changes in the radiation behavior of the antenna with the superstrate layer in comparison to the conventional one: the EBG resonator antenna excels in a very high directivity, a low side lobe level and a considerable gain improvement (up to 17 dB, see below). Tab. 6.1 includes the simulated parameters for both the antennas at f = 10.25 GHz.
a) b)
Fig. 6.23 Calculated radiation patterns of the horizontal wire antenna with the superstrate at 10.25 GHz: x-z plane (a), y-z plane (b).
Tab. 6.1 Calculated parameters of the horizontal wire antenna at f = 10.25 GHz with and without the superstrate.
Simple antenna Superstrate antenna
CST HFSS CST HFSS
E-plane 39.9 40.6 9.3 9.4 Main lobe width [deg] H-plane 156.5 149.9 10.1 10.1
E-plane -3.1 -2.4 -14.3 -14.3 Side lobe level [dB] H-plane -20.0 -20.0 -14.2 -14.3
Gain improvement [dB]
0 0 12.1 12.2
Fig. 6.24 Calculated gain improvement of the horizontal wire antenna with the superstrate in the frequency interval 10.1 GHz – 10.4 GHz.

55
The frequency dependent gain (Fig. 6.24) is the main drawback of the antenna with the superstrate layer. While the gain of the simple antenna was found almost constant (variation up to 0.4 dB) in the considered frequency range 10.1 GHz to 10.4 GHz, in the case of the antenna with the superstrate the difference between the maximum and the minimum gain was established 12.8 dB.
Together with the varying gain, the radiation patterns of the EBG resonator antenna changes also (Fig. 6.25, Fig. 6.26). At the resonant frequency (f = 10.25 GHz), the antenna has a main lobe with high directivity and low side lobes; just under and just above the resonant frequency (f = 10.1 GHz and f = 10.4 GHz) the directivity decreases and side lobes occur.
a) b)
Fig. 6.25 Variation of radiation patterns of the horizontal wire antenna with the superstrate in dependence on frequency: x-z plane (a), y-z plane (b). CST MWS simulation.
a) b)
Fig. 6.26 Detail of radiation patterns from Fig. 6.25: x-z plane (a), y-z plane (b). CST MWS simulation.

56
6.4 Summary
In this chapter, examples of the practical application of periodic structures in antenna engineering were presented. Both the structures under consideration (the mushroom one with simultaneous EBG and AMC properties, and the single-layer superstrate) were designed using the PSO algorithm introduced in chapter 4.3. The studied phenomena (surface wave suppression, in-phase reflection and electromagnetic energy focusing) were demonstrated via computer simulations and measurements in practice.

57
7 Conclusion
The dissertation thesis was aimed to find the effective and accurate way of designing periodic structures with the electromagnetic band gap.
Since the periodic surfaces became widely used in antenna and microwave engineering, many design techniques were worked out during the last decade. The published methods are simple but inaccurate (e. g. the effective medium theory based on circuit representation) or accurate but rather complicate (e. g. analytical description). The most accurate and universal way of the design of periodic structures is based on the use of full-wave numerical models. In combination with optimization algorithms applicable both for rough initial design and final tuning, the design process becomes more consistent and the overall computational time can be significantly reduced. Global evolutionary algorithms were successfully implemented in the case of periodic surfaces acting as an artificial magnetic conductor and a superstrate. However, their exploitation in the design of structures with suppressed surface waves propagation has not been explored yet.
In the thesis, the main attention was turned to the correct implementation of the numerical model of the designed structure in the chosen commercial software tools CST Microwave Studio (CST MWS) and Ansoft High Frequency Structure Simulator (Ansoft HFSS). In both the cases, insufficient information is available in the open literature and these introductory texts are often confusing and incorrect. In this thesis, special attention was turned to the detailed and unambiguous description of the computer models used. The results obtained by different simulators were mutually compared and validated by experiments in the last chapter.
In the next step, the CST MWS was connected to the mathematical program Matlab via Visual BASIC for Application interface. Matlab performed the processing and evaluating of the results of the full-wave analysis using global evolutionary algorithms. In order to minimize the overall computational time, four types of optimization algorithms were implemented and tested: the binary-coded genetic algorithm with the single-point and the multi-point crossover, the differential evolution in the basic variant and the particle swarm optimization. All of these procedures were tested on the design example of a simple periodic structure, and the obtained results and consumed computational times were mutually compared. The particle swarm optimization exhibited the best convergence rate. However, the described problem needs a more detailed study and could be a part of future research.
Using the developed technique, some more complicated design examples (EBG with reduced unit cell size, EBG with dual-band properties, periodic structure with simultaneous EBG and AMC behavior, superstrate) were introduced. In all the cases, results from CST MWS were checked by Ansoft HFSS. Exploitation of the methodology in the design of other complex structures is straightforward.
The practical demonstration of the described phenomena and the experimental verification of the developed design technique is very important part of the work. In

58
order to experimentally verify results, two specimens of metallo-dielectric periodic structures were proposed. The first one was a mushroom-type periodic structure that exhibits simultaneous electromagnetic band gap and artificial magnetic conductor properties at the target frequency 10.25 GHz, while the second one was a single-layer superstrate working at the same frequency. The mushroom structure was fabricated and measured. Properties of the designed superstrate were investigated by computer simulations only, and the realization and experimental verification should be a part of future work.
The mushroom structure was fabricated by the printed circuit board technology using the microwave substrate Arlon AD600. Manufacturing vias was the main complication – they were drilled, and metallic pins were substituted by metal-coated holes. The overall thickness of metallic layers was the second fact which was necessary to be considered in the final design: the thickness increases from 35 microns up to 60 to 70 microns after the electroplating process. Both of the above-mentioned facts influenced the position of the band gap, and therefore, a minor modification of the computer model of the structure was needed – the diameter of the vias was slightly increased. The oncoming measurement of the surface wave propagation on the fabricated board acknowledged the accuracy of the design: a band gap in the frequency interval 9.0 GHz to 11.5 GHz (24.4 % of relative bandwidth) occurred. The position of the AMC point was stated 10.8 GHz whereas the frequency interval within which the impinging waves were reflected in-phase rather than out-of-phase was measured from 9.0 GHz up to 12.5 GHz (32.6 % of relative bandwidth).
The practical meaning of using periodic structures with EBG/AMC properties in antenna engineering was demonstrated by simple antenna experiments. Firstly, a vertical monopole was put into the centre of the periodic pattern, and secondly, a horizontal wire antenna was placed closely (ha << λ/4) above the surface. For both the cases, the presence of the periodic structure led to smooth radiation patterns with high directivity and low back radiation thanks to the suppressed propagation of surface waves.
The effect of the electromagnetic wave focusing by periodic patterns was investigated through a single-layer metallo-dielectric structure with square unit cell and metallic patches. As confirmed by computer simulations, the use of the superstrate can significantly enhance the antenna gain. Unfortunately, this property is highly frequency dependent. Moreover, the directivity decreases and side lobes occur just under and just above the resonant frequency (∆f / fr ≈ 0.01).
The future work could include more detailed research about the use of optimization algorithms in the design of different periodic structures. The developed methodology could be a very helpful tool in the case of complex periodic structures, such as the dual-band ones with the unit cell of eight-fold symmetry and simultaneous EBG and AMC properties (to the best of the author’s knowledge, this problem stills outstanding so far). The use of superstrates in antenna technology is another interesting and perspective task. Due to the highly frequency dependent gain of the superstrate, new alternatives should be explored to eliminate this drawback.
Obviously, the methodology based on full-wave simulations in connection with optimization algorithms can be an effective and powerful tool in the hand of a designer to find the required solution for any type of complex electromagnetic problem.

59
8 Bibliography
[1] RAYLEIGH, J. W. S. On waves propagating along the plane surface of an elastic solid. Proc. London Math. Soc. 17, 4-11, 1887.
[2] JOHNSON, S. G.; JOANNOPOULOUS, J. D. Introduction to Photonic Crystals: Bloch’s Theorem, Band Diagrams and Gaps. MIT, February 2003.
[3] VESELAGO, V. G. The electrodynamics of substances with simultaneously negative value of ε and µ. Soviet Physics Uspekhi, vol. 10, no. 4, 1968, pp. 509-214.
[4] YABLONOVITCH, E. Inhibited spontaneous emission in solid state physics and electronics. Physical Review Letters, vol. 58, p. 2059, 1987.
[5] JOHN, S. Strong localization of photons in certain disordered dielectric super lattices. Physical Review Letters, vol. 58, p. 2486, 1987.
[6] CHANG, C. C., QIAN, Y., ITOH, T. Analysis and application of uniplanar compact photonic bandgap structures. Progress In Electromagnetics Research, PIER 41, 211-235, 2003.
[7] PIRHADI, A., KESHMIRI, F., HAKKAK, M., TAYARANI , M. Analysis and design of dual band high directivity EBG resonator antenna using square loop FSS as superstrate layer. Progress In Electromagnetic Research, PIER 70, 1-20, 2007.
[8] BELL, J. M., ISKANDER, M. F., A low-profile Archimedean spiral antenna using an EBG ground plane. IEEE Antennas and Wireless Propagation Letters, vol. 3, issue 2004, p. 223-226, 2004.
[9] SIEVENPIPER, D., ZHANG, L., BROAS, R. F. J., ALEXOPOULOS, N. G., YABLONOVITCH, E. High-impedance electromagnetic surfaces with a forbidden frequency band. IEEE Transaction on Microwave Theory and Techniques, vol. 47, issue 11, p. 2059-2074, 1999.
[10] SIEVENPIPER, D. F. High-Impedance Electromagnetic Surfaces. Ph.D Thesis, University of California (UCLA) Los Angeles, CA, 1999.
[11] BALANIS, C. Antenna Theory, Analysis and Design (2nd edition). John Wiley and Sons, New York, 1997.
[12] COLLIN, R. Field Theory of Guided Waves (2nd edition). IEEE Press, New York, 1991.
[13] Ashtech Choke Ring Antenna – datasheet. [Online] Available at: http://www.magellan-gps.cz/images/gps/refer/chokering.pdf
[14] YANG, F.-R., MA, K.-P., QIAN, Y., ITOH, T. A uniplanar compact photonic-bandgap (UC-PBG) structure and its applications for microwave circuit. IEEE Transaction on Microwave Theory and Techniques, vol. 47, issue 8, p. 1509-1514, 1999.
[15] KERN, D. J., WERNER, D. H., MONORCHIO, A., LANUZZA, L., WILHELM, M. J. The Design Synthesis of Multiband Artificial Magnetic Conductors Using High Impedance Frequency Selective Surfaces. IEEE Transaction on Antennas and Propagation, vol. 53, issue 1, p. 8 – 17., 2005.
[16] GOUSETTIS, G., FERESEDES, A. P., VARDAXOGLOU, Y. C. Tailoring the AMC and EBG characteristics of periodic metallic arrays printed on grounded dielectric substrate. IEEE Transactions on Antennas and Propagation, vol. 54, issue 1, p. 82-89, 2005.
[17] KOVÁCS, P., RAIDA, Z., MARTÍNEZ-VÁZQUEZ, M. Parametric Study of Mushroom-like and Planar Periodic Structures in Terms of Simultaneous AMC and EBG Properties. Radioengineering, vol. 17, no. 4, p. 19-24, 2008.
[18] SIMOVSKI, C. R., DE MAAGT, P., MELCHAKOVA, I. V. High-Impedance Surfaces Having Stable Resonance With Respect to Polarization and Incidence Angle. IEEE Transactions on Antennas and Propagation, vol. 53, issue 3, p. 908-914, 2005.

60
[19] LUUKKONEN, O., SIMOVSKI, C. R., GRANET, G., GOUSETTIS, G., LIOUBTCHENKO, D., RAISANEN, A. V., TRETYAKOV, S. A. Simple and Accurate Analytical Model of Planar Grids and High-Impedance Surfaces Comprising Metal Strips or Patches. IEEE Transactions on Antennas and Propagation, vol. 56, issue 6, p. 1624-1632, 2008.
[20] MONORCHIO, A., GENOVESI, S., SERRA, U., MANARA, G., Optimal design of artificial magnetic conductors including angular response. IEEE Antennas and Propagation Society International Symposium, 2006.
[21] YUEHE, G., ESSELLE, K. P., BIRD, T. S. A High-Gain Low-Profile EBG Resonator Antenna. IEEE Antennas and Propagation Society International Symposium, 2007.
[22] STRATTON, J. A. Electromagnetic Theory. Wiley, 1941.
[23] SMITH, D. R., KROLL, N. Negative refractive index in left-handed materials. Physical Review Letters, vol. 85, no. 14, 2000.
[24] ENGHETA, N., ZIOLKOWKSI, R. W. Metamaterials: Physics and Engineering Explorations. Wiley – IEEE Press, 2006. ISBN: 978-0-471-76102-0.
[25] SANADA, A. Planar single- and double negative material implementations and applications. URSI, 2005.
[26] Personal consultations in October, 2009.
[27] BROWN, E. R.; PARKER, C. D. Radiation Properties of a Planar Antenna on a Photonic-Crystal Substrate. J Opt Soc Am B, vol. 10, 1993.
[28] ENOCH, S., TAYEB, G., MAYSTRE, D. Dispersion diagrams of Bloch modes applied to the design of directive sources. Progress In Electromagnetic Research, PIER 41, p. 61-81, 2003.
[29] BUCHAR, P. Disperzní charakteristiky kompozitního periodického prostředí. Diplomová práce. České vysoké učení technické, Praha, 2004.
[30] MACI, S., CAIAZZO, M. CUCINI, A., CASALETTI, M. A pole-zero matching method for EBG surfaces composed of a dipole FSS printed on a grounded dielectric slab. IEEE Transactions on Antennas and Propagation, vol. 53, issue 1, p. 70-81, 2005.
[31] KOVÁCS, P., RAIDA, Z. Dispersion Analysis of Planar Metallo-Dielectric EBG Structures in Ansoft HFSS. In MIKON 2008 - Conference Proceedings (volume 3). Warszawa: MDruk Ltd, 2008, p. 643-646.
[32] KOVÁCS, P. Design and analysis of planar artificial magnetic conductors and electromagnetic band gap structures in Ansoft HFSS and CST Microwave Studio. In ITSS 2008 - Summer School Proceedings. Brno: Department of Electromagnetic Field, FEE CTU, 2008, p. 482-487.
[33] JOHNSON, J. M., RAHMAT-SAMII, Y. Genetic algorithms in engineering electromagnetics. IEEE Antennas and Propagation Magazine, 1997, vol. 39, no. 4, p. 7–21.
[34] ZELINKA, I. Artificial intelligence – global optimization (in Czech), BEN – technická literatura, Praha 2002.
[35] Differential evolution by Rainer Storn. [Online] Available at http://www.icsi.berkeley.edu/storn/ code.html
[36] ROBINSON, J., RAHMAT-SAMII, Y. Particle swarm optimization in electromagnetics. IEEE Transactions on Antennas and Propagation, February, 2004, vol. 52, p. 397 – 407.
[37] KOVÁCS, P., RAIDA, Z. Automated design of single- and dual- band electromagnetic band gap surfaces by genetic algorithms. In 2009 International Conference on Electromagnetics in Advanced Applications. Torino, Italy: COREP, Torino, Italy, 2009. p. 31-34.
[38] KOVÁCS, P., JILKOVÁ, J., RAIDA, Z. Design and optimization of electromagnetic band gap surfaces by different global evolutionary algorithms. In Eight World Congress on Structural and Multidisciplinary Optimization. Lisboa, Portugal: International Society for Structural and Multidisciplionary Optimization, 2009. p. 90-94.
[39] KOVÁCS, P., RAIDA, Z. Global Evolutionary Algorithms in the Design of Electromagnetic Band Gap Structures with Suppressed Surface Waves Propagation. Radioengineering, vol. 19, no. 1, p. 122-128, 2010.

61
[40] TRETYAKOV, S. Analytical Modeling in Applied Electromagnetics. Artech House, 2003
[41] BAGGEN, R., MARTINEZ-VAZQUEZ, M. LEISS, J., HOLZWARTH, S., DRIOLI, L.S. de MAAGT, P. Low profile GALILEO antenna usány EBG technology. IEEE Transactions on Antennas and Propagation, March, 2008, vol. 56, p. 667 – 674.
[42] CLAVIJO, S., DIAZ, R. E., MCKINZIE, W. E. Design Methodology for Sievenpiper High-Impedance Surfaces: An Artificial Magnetic Conductor for Positive Gain Electrically Small Antennas. IEEE Transaction on Antennas and Propagation, vol. 51, p. 2678 – 2690, October 2003.
[43] FERESIDIS, A., P., GOUSETTIS, G., WANG, S., VARDAXOGLOU, C, J. Artificial Magnetic Conductor Surfaces and Their Application to Low-Profile High-Gain Planar Antennas. IEEE Transactions on Antennas and Propagation, January, 2005, vol. 53, p. 209 – 215.
[44] WEILY, A., R., ESSELLE, K., P., SANDERS, B., C., BIRD, T., S. High-gain 1D EBG Resonator Antenna. Microwave and Optical Technology Letters, vol. 47, no. 2, October 2005.
[45] DIBLANC, M., RODES, E., ARNAUD, E., THEVENOT, M., MONEDIERE, T., JECKO, B. Circularly Polarized Metaloid EBG Antenna. IEEE Microwave and Wireless Components Letters, vol. 15., no.10, October 2005.
[46] KOVÁCS, P., RAIDA, Z., LUKEŠ, Z. Design and Optimization of Periodic Structures for Simultaneous EBG and AMC Operation. In Proceedings of the 16th Conference on Microwave Techniques. Brno: Czechoslovakia Section IEEE, p. 195-198, April 2010.

62
Curriculum Vitae
Name: Peter KOVÁCS
Born: February 13th 1984 in Dunajská Streda, Slovakia
Contact: [email protected]
Education
2002 – 05 Technical University of Brno / Department of Radio Electronics Bachelor study of Radio Electronics State exam passed in June 2005 Bachelor’s thesis Input impedance measurement of short-wave antennas defended in June 2005
2005 – 07 Technical University of Brno / Department of Radio Electronics Master study of Radio Electronics State exam passed in June 2007 Master’s thesis Planar circularly symmetric electromagnetic band gap structures defended in June 2007
2007 – 10 Technical University of Brno / Department of Radio Electronics Doctoral study of Radio Electronics State exam passed in June 2009 Doctoral thesis Design and optimization of electromagnetic band gap structures finished in August 2010
Experience
3/08 – 4/08 IMST GmbH, Kamp-Lintfort, Germany Study stay: analysis and design of electromagnetic band gap structures.
Languages
Hungarian, Slovak, Czech, English
Other activities
Consulting and advisories in the area of antennas, metamaterials, softwares.

63
Appendix A – Photograph of the fabricated periodi c structure
Fig. A.1 The mushroom structure.
Fig. A.2 The mushroom structure – detail.