Design and Implementation of Portable Data Acquisition ...
10
Design and Implementation of Portable Data Acquisition Unit in Process Control and Supervision Applications PETR DOSTÁLEK, VLADIMÍR VAŠEK, JAN DOLINAY Department of Automation and Control Engineering Tomas Bata University in Zlín, Faculty of Applied Informatics Nad Stráněmi 4511, 760 05 Zlín CZECH REPUBLIC {dostalek; vasek; dolinay}@fai.utb.cz http://www.fai.utb.cz Abstract: Paper deals with design and implementation of portable data acquisition unit based on 8-bit microcontroller Freescale 68HC908GP32 in process control and supervision applications. Its hardware design is adopted to fulfill high reliability and immunity against industrial environment, high precision and compact dimensions. Communication with supervision system is performed via standard RS232 interface utilizing universal ASCII-based communication protocol which is supported by number of software environments. In order to improve development of new software applications with this device a support program libraries for Visual C++, Control Web and Matlab/Simulink was created. Correct function of the data acquisition device and support software libraries were tested on educational model of heating plant with time delay in Matlab 6.5 and Control Web environments. Key-Words: Data acquisition, process control, Control Web, Matlab, program libraries, 68HC908GP32 1 Introduction Process measurement is one of the most important tasks in the whole control system. It is determined by the fact that control accuracy is fully dependent on how preciously measuring chain works. Present- day there is available number of devices performing data acquisition tasks – standard cards for PCI or ISA bus which are suitable for standard personal computers and its industrial versions and modules for industrial automation usually equipped with RS485, CAN and other interfaces. Independent category is formed by smart sensors incorporating sensor, converter to unified signal and data acquisition device in one embedded system with very compact dimensions and low power consumption. They have number of advantageous features such as automatic diagnostic and calibration, high accuracy and immunity against electromagnetic interference due to short signal paths. On the other hand lower operating temperature range reduces their usage to laboratory applications, automotive and aircraft industry where compact dimensions and low weight are crucial. Quite often occurred situations when it is necessary to measure data in terrain where it is not possible to use standard computer equipped with DAQ card. In these cases laptop computer equipped with portable data acquisition device may be very advantageous. This contribution describes multi-channel portable data acquisition device based on low cost general-purpose 8-bit microcontroller Freescale 68HC908GP32, which was developed in our department mainly for control and monitoring educational laboratory models. In order to improve development of new software applications with this device it is very important to equip it with supporting program libraries and utilities for Visual C++, Control Web and Matlab/Simulink. 2 Data acquisition device 2.1 Hardware overview Hardware design of the DAQ device is fully adopted to support 16 analog inputs with 12-bit resolution, 8 digital inputs and outputs and one analog output with 12-bit resolution with stress on low power consumption enabling long operation when battery supply is used. The core of the DAQ device is 8-bit general purpose Motorola microcontroller 68HC908GP32 with Von-Neumann architecture which is fully up-ward compatible with the 68HC05 family. On the chip is integrated timer interface with input capture and output compare functions, 8- channel analog-to-digital converter with 8-bit resolution, up to 33 general-purpose I/O pins, clock generator module with PLL, serial communication interface and serial peripheral interface. M68HC908GP32 has implemented several protective and security functions such as low- voltage inhibit which monitors power supply WSEAS TRANSACTIONS on SYSTEMS and CONTROL PETR DOSTÁLEK, VLADIMÍR VAŠEK, JAN DOLINAY ISSN: 1991-8763 779 Issue 9, Volume 3, September 2008
Transcript of Design and Implementation of Portable Data Acquisition ...
Design and Implementation of Portable Data Acquisition Unit in Process Control and Supervision Applications
PETR DOSTÁLEK, VLADIMÍR VAŠEK, JAN DOLINAY
Department of Automation and Control Engineering Tomas Bata University in Zlín, Faculty of Applied Informatics
Nad Stráněmi 4511, 760 05 Zlín CZECH REPUBLIC
{dostalek; vasek; dolinay}@fai.utb.cz http://www.fai.utb.cz
Abstract: Paper deals with design and implementation of portable data acquisition unit based on 8-bit microcontroller Freescale 68HC908GP32 in process control and supervision applications. Its hardware design is adopted to fulfill high reliability and immunity against industrial environment, high precision and compact dimensions. Communication with supervision system is performed via standard RS232 interface utilizing universal ASCII-based communication protocol which is supported by number of software environments. In order to improve development of new software applications with this device a support program libraries for Visual C++, Control Web and Matlab/Simulink was created. Correct function of the data acquisition device and support software libraries were tested on educational model of heating plant with time delay in Matlab 6.5 and Control Web environments. Key-Words: Data acquisition, process control, Control Web, Matlab, program libraries, 68HC908GP32 1 Introduction Process measurement is one of the most important tasks in the whole control system. It is determined by the fact that control accuracy is fully dependent on how preciously measuring chain works. Present-day there is available number of devices performing data acquisition tasks – standard cards for PCI or ISA bus which are suitable for standard personal computers and its industrial versions and modules for industrial automation usually equipped with RS485, CAN and other interfaces. Independent category is formed by smart sensors incorporating sensor, converter to unified signal and data acquisition device in one embedded system with very compact dimensions and low power consumption. They have number of advantageous features such as automatic diagnostic and calibration, high accuracy and immunity against electromagnetic interference due to short signal paths. On the other hand lower operating temperature range reduces their usage to laboratory applications, automotive and aircraft industry where compact dimensions and low weight are crucial. Quite often occurred situations when it is necessary to measure data in terrain where it is not possible to use standard computer equipped with DAQ card. In these cases laptop computer equipped with portable data acquisition device may be very advantageous. This contribution describes multi-channel portable data acquisition device based on low cost
general-purpose 8-bit microcontroller Freescale 68HC908GP32, which was developed in our department mainly for control and monitoring educational laboratory models. In order to improve development of new software applications with this device it is very important to equip it with supporting program libraries and utilities for Visual C++, Control Web and Matlab/Simulink. 2 Data acquisition device 2.1 Hardware overview Hardware design of the DAQ device is fully adopted to support 16 analog inputs with 12-bit resolution, 8 digital inputs and outputs and one analog output with 12-bit resolution with stress on low power consumption enabling long operation when battery supply is used. The core of the DAQ device is 8-bit general purpose Motorola microcontroller 68HC908GP32 with Von-Neumann architecture which is fully up-ward compatible with the 68HC05 family. On the chip is integrated timer interface with input capture and output compare functions, 8-channel analog-to-digital converter with 8-bit resolution, up to 33 general-purpose I/O pins, clock generator module with PLL, serial communication interface and serial peripheral interface. M68HC908GP32 has implemented several protective and security functions such as low-voltage inhibit which monitors power supply
WSEAS TRANSACTIONS on SYSTEMS and CONTROL
PETR DOSTÁLEK, VLADIMÍR VAŠEK, JAN DOLINAY
ISSN: 1991-8763 779 Issue 9, Volume 3, September 2008

voltage, computer operates properly (COP) counter and FLASH memory protection mechanism preventing unauthorized reading of the user’s program. Internal RAM memory has capacity of 512B and FLASH memory 32KB. Internal clock frequency can be 8MHz at 5V operating voltage or 4MHz at 3V operating voltage. Microcontroller supports wait and stop low-power modes [1].
Analog-to-digital conversion is performed by the A/D converter Linear Technology LTC1298. It is micro power, 2-channel, 12-bit switched-capacitor successive approximation sampling A/D converter which can operate on 5V to 9V power supplies. Communication with microcontrollers is handled by 3-wire synchronous serial interface. It typically draws only 250μA of supply current during conversion and only 1nA in power down mode in which enters after each conversion [2].
Digital-to-analog circuit utilizes 12-bit D/A converter Burr-Brown DAC7611 with internal 2.435V reference and high speed rail-to-rail amplifier. It requires a single 5V supply. Power consumption is only 2.5mW at 5V. Build-in synchronous serial interface is compatible with variety of digital signal processors and microcontrollers. 2.2 Circuits design Electronic circuits of the data acquisition device can be divided into the seven functional blocks (Fig.1): analog-to-digital converter with analog multiplexer circuits, microcontroller circuits, digital-to-analog converter and amplifier circuits, digital I/O driver circuits, serial communication interface and finally power supply circuits.
Fig.1. Block diagram of the device
MCU circuits (Fig.2) incorporate all electronics circuits needed for correct function of the
microcontroller M68HC908. They consists of Pierce crystal oscillator with output frequency of 32.768 kHz connected to OSC1 and OSC2 pins of the MCU and filter network (parts R3, C3, C4) needed by internal PLL circuit. RST and IRQ pins are permanently connected to logic 1, because their function is not in data acquisition device used. Reset of the MCU is automatically generated after power on by internal circuits of the microcontroller. Output frequency of the Pierce oscillator is by internal MCU’s PLL circuit increased to 32MHz resulting in internal bus clock frequency of 8MHz. Ports PTA and PTB are completely dedicated for digital input and output functions except pin PTB0/AD0 which is used for monitoring of the battery voltage. Pin PTD3 is connected to the LED diode indicating status of the device. PTD0 to PTD2 pins provides selection of active analog channel, PTC0 to PTC4 pins perform synchronous serial communication with A/D and D/A converters.
Fig.2. Microcontroller circuits
Serial communications interface utilizes standard TTL to RS232 and RS232 to TTL converter MAX232 wired in manufacturer’s reference wiring (Fig. 3). It is connected to microcontroller via pins PTE0/TxD and PTE1/RxD.
Fig.3. Serial communication interface
Ana
log
mul
tiple
xer +
A/D
MCU circuits
I/O driver
D/A + amplifier
Serial communications
interface
Power supply circuits
.
.
.
.
.
.
16x AI
8x DO
8x DI
1x AO
RX
TX
WSEAS TRANSACTIONS on SYSTEMS and CONTROL PETR DOSTÁLEK, VLADIMÍR VAŠEK, JAN DOLINAY
ISSN: 1991-8763 780 Issue 9, Volume 3, September 2008

Digital input / output driver circuit (Fig.4) has two important functions. Firstly, it protects microcontroller inputs against electrostatic discharge which may occur during handling and connecting DAQ device to the measured object and secondly, it boosts output current from microcontroller pins and protects them against overload or short-circuits. It uses two non inverting 3-state high-speed octal bus buffers 74HC244 with 35mA maximum current output capability per pin.
Fig.6. Digital input/output driver circuits Multiplexer, A/D and D/A converter circuits (Fig.7) consist of two 8-channel multiplexers 74HC4051, analog-to-digital converter LT1298, input divider performing input signal conditioning to range of 0-5V, digital-to-analog converter DAC7611 and output operational amplifier TLC272 which amplifies output D/A voltage to the standard range 0-10V. Input channel selection is realized by MCU pins PTD0, PTD1 and PTD2, communication with D/A converter is provided by pins PTC0 (chip select), PTC1 (clock), PTC2 (serial data in), PTC3 (load/strobe), with A/D converter by pins PTC1 (clock), PTC2 (serial data in/out) and PTC4 (chip select).
Data acquisition device contains three independent power supplies. Digital parts (MCU circuits, input/output driver, serial communications interface and D/A converter) are supplied by circuit depicted in the Fig.8. It uses low-dropout 5V/1A regulator in manufacturer’s recommended wiring. Input of the supply is protected against overloading or polarity reversing by fuse. Analog-to-digital
converter is supplied from high-precision voltage reference LM336-Z5.0 which is supplied from adjustable current source LM334. Output voltage can be adjusted to the exact 5V value by variable resistor R18 (Fig.9). Analog output amplifier is supplied by DC-DC converter ICL7662, which provides positive and negative voltage for analog output 0-10V from single supply with voltage of 9V.
Fig.7. Multiplexer, A/D and D/A converter circuits
Fig.8. Power supply for digital circuits
Fig.9. Power supply for A/D converter
WSEAS TRANSACTIONS on SYSTEMS and CONTROL PETR DOSTÁLEK, VLADIMÍR VAŠEK, JAN DOLINAY
ISSN: 1991-8763 781 Issue 9, Volume 3, September 2008

Photograph of the prototype data acquisition unit is in Fig.10. Device features are summarized in Tab.1.
Fig.10. Photograph of the prototype DAQ unit
Digital inputs 8 channels, TTL compatible
Digital outputs 8 channels, TTL compatible
Analog inputs 16 channels, 12 bits resolution, unipolar input range 0-10V
Analog outputs 1 channel, 12 bits resolution, unipolar output range 0-10V
Supply voltage 6.5 to 9V DC
Communication RS232 interface, 57600Bd, 8bit, 1 start bit, 1 stop bit
Tab.1. Technical parameters of the DAQ device 2.3 Communication protocol Data acquisition device communicates with supervision system using standard serial interface RS232 which is fully platform independent. In order to achieve compatibility with many software platforms universal ASCII-based communication protocol was choose. Very advantageous is possibility to send all implemented commands using generic terminal program that is contained in most operating systems. Each command can be divided up to five parts depending on concrete function implementation.
Fig.11. Communication example
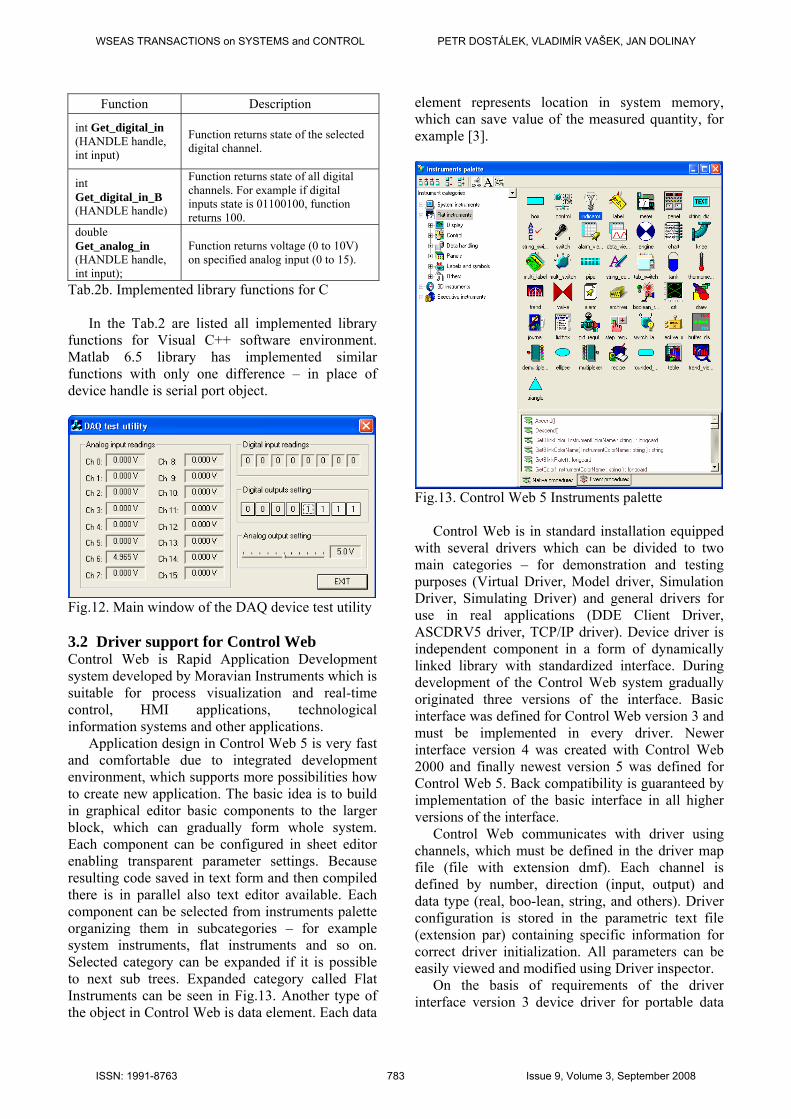
Communication starts with character “~” then must follow command name with fixed length to two characters (for example “AO” means set analog output). After it is first command parameter with length one character (channel index) next character is space followed by second parameter (value). Command must be terminated by CRLF sequence (Fig.11). 3 Software support Although communication protocol is very simple and easy to understand it is more comfortable in a control application to call functions which can automatically generate commands for the data acquisition device and consequently process its response. Application developer then does not need to know exact communication protocol and do not need to program it. This simplification is resulting in faster program development and reduction of debugging time. For portable data acquisition device were created supporting program libraries dedicated for Visual C++, Control Web 5 and Matlab 6.5 software environments [6]. 3.1 Support libraries for C and Matlab Created libraries incorporate all functions implemented in the device including error processing. In order to device testing and diagnosis DAQ test utility was created. This program can test all functions of the DAQ device and may be very helpful for testing wire connections to the monitored or controlled system. Main window of diagnostic utility is depicted in the Fig.12. Matlab 6.5 library has implemented same functions with only one difference – in place of device handle is serial port object. Each function is available in separate m-file, so it is very simple to modify them by user.
Function Description HANDLE Open_device (const char*)
Opens device connected to specified serial port (“COM1”, “COM2”,…) and returns device handle.
int Close_device (HANDLE h) Closes device with specified handle.
int Set_digital_out (HANDLE handle, int output, int value)
Sets specified digital channel (0 to 7) to desired logical value (0 or 1).
int Set_digital_out_B (HANDLE handle, int value)
Sets digital channels to value (0 to 255). For example value 100 sets digital outputs to state 01100100.
int Set_analog_out (HANDLE handle, int output, float value)
Sets analog output on specified channel to desired value in volts (0 to 10V). Function accepts values in floating-point format.
Tab.2a. Implemented library functions for C
~ A O 0 4 . 2 5 CR LFCommand:
Response: ~ A O 0 = 4 . 2 5 CR LF
- set analog output on channel 0 to
- notification that AO0 was successfully set to 4.25V
WSEAS TRANSACTIONS on SYSTEMS and CONTROL PETR DOSTÁLEK, VLADIMÍR VAŠEK, JAN DOLINAY
ISSN: 1991-8763 782 Issue 9, Volume 3, September 2008
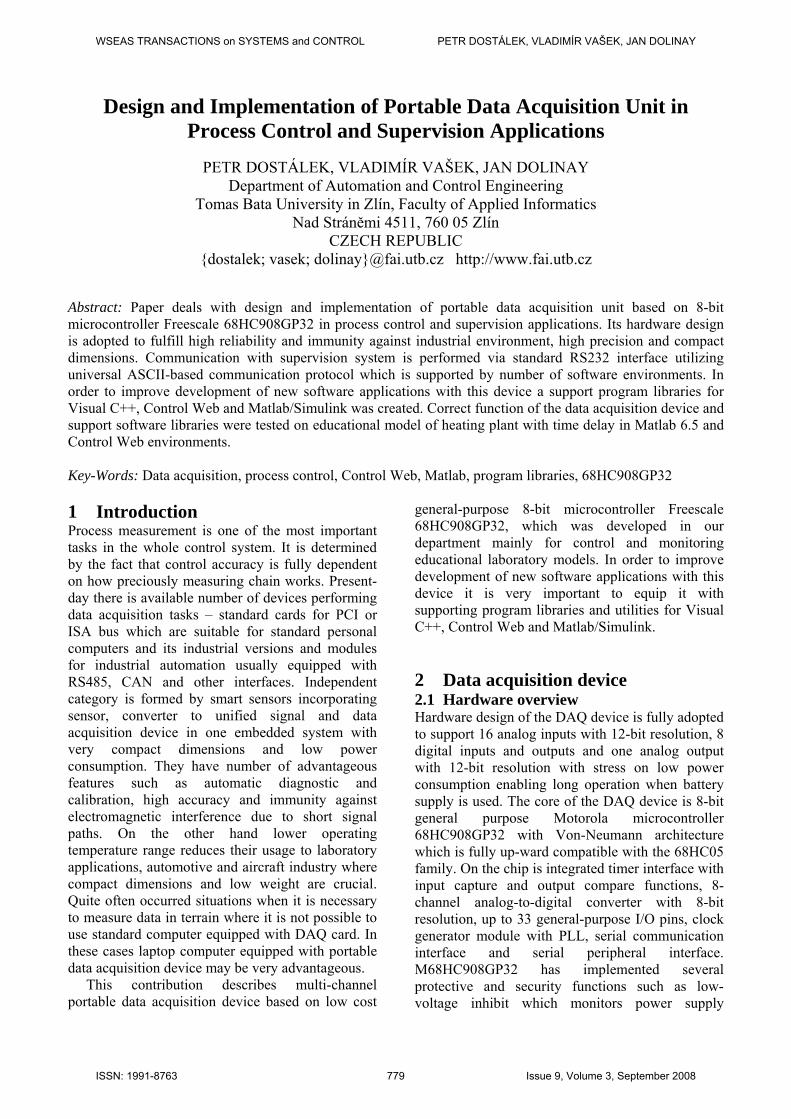
Function Description
int Get_digital_in (HANDLE handle, int input)
Function returns state of the selected digital channel.
int Get_digital_in_B (HANDLE handle)
Function returns state of all digital channels. For example if digital inputs state is 01100100, function returns 100.
double Get_analog_in (HANDLE handle, int input);
Function returns voltage (0 to 10V) on specified analog input (0 to 15).
Tab.2b. Implemented library functions for C
In the Tab.2 are listed all implemented library functions for Visual C++ software environment. Matlab 6.5 library has implemented similar functions with only one difference – in place of device handle is serial port object.
Fig.12. Main window of the DAQ device test utility 3.2 Driver support for Control Web Control Web is Rapid Application Development system developed by Moravian Instruments which is suitable for process visualization and real-time control, HMI applications, technological information systems and other applications.
Application design in Control Web 5 is very fast and comfortable due to integrated development environment, which supports more possibilities how to create new application. The basic idea is to build in graphical editor basic components to the larger block, which can gradually form whole system. Each component can be configured in sheet editor enabling transparent parameter settings. Because resulting code saved in text form and then compiled there is in parallel also text editor available. Each component can be selected from instruments palette organizing them in subcategories – for example system instruments, flat instruments and so on. Selected category can be expanded if it is possible to next sub trees. Expanded category called Flat Instruments can be seen in Fig.13. Another type of the object in Control Web is data element. Each data
element represents location in system memory, which can save value of the measured quantity, for example [3].
Fig.13. Control Web 5 Instruments palette Control Web is in standard installation equipped with several drivers which can be divided to two main categories – for demonstration and testing purposes (Virtual Driver, Model driver, Simulation Driver, Simulating Driver) and general drivers for use in real applications (DDE Client Driver, ASCDRV5 driver, TCP/IP driver). Device driver is independent component in a form of dynamically linked library with standardized interface. During development of the Control Web system gradually originated three versions of the interface. Basic interface was defined for Control Web version 3 and must be implemented in every driver. Newer interface version 4 was created with Control Web 2000 and finally newest version 5 was defined for Control Web 5. Back compatibility is guaranteed by implementation of the basic interface in all higher versions of the interface. Control Web communicates with driver using channels, which must be defined in the driver map file (file with extension dmf). Each channel is defined by number, direction (input, output) and data type (real, boo-lean, string, and others). Driver configuration is stored in the parametric text file (extension par) containing specific information for correct driver initialization. All parameters can be easily viewed and modified using Driver inspector. On the basis of requirements of the driver interface version 3 device driver for portable data
WSEAS TRANSACTIONS on SYSTEMS and CONTROL PETR DOSTÁLEK, VLADIMÍR VAŠEK, JAN DOLINAY
ISSN: 1991-8763 783 Issue 9, Volume 3, September 2008
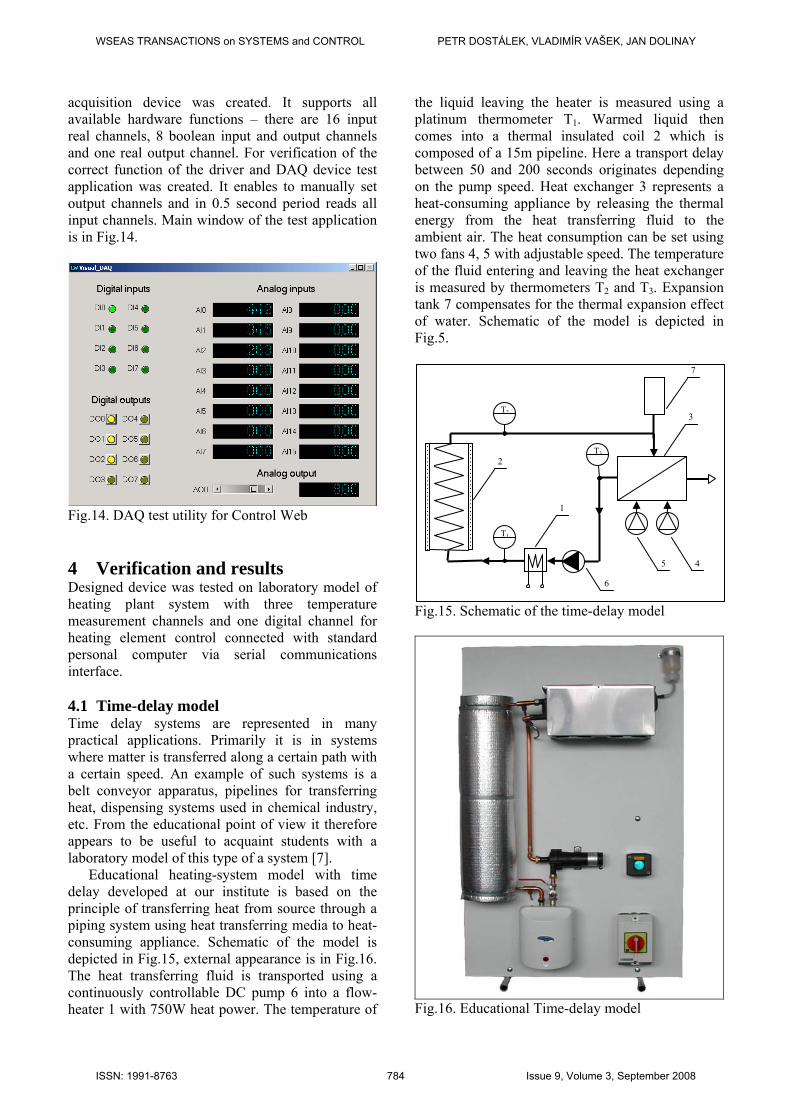
acquisition device was created. It supports all available hardware functions – there are 16 input real channels, 8 boolean input and output channels and one real output channel. For verification of the correct function of the driver and DAQ device test application was created. It enables to manually set output channels and in 0.5 second period reads all input channels. Main window of the test application is in Fig.14.
Fig.14. DAQ test utility for Control Web 4 Verification and results Designed device was tested on laboratory model of heating plant system with three temperature measurement channels and one digital channel for heating element control connected with standard personal computer via serial communications interface. 4.1 Time-delay model Time delay systems are represented in many practical applications. Primarily it is in systems where matter is transferred along a certain path with a certain speed. An example of such systems is a belt conveyor apparatus, pipelines for transferring heat, dispensing systems used in chemical industry, etc. From the educational point of view it therefore appears to be useful to acquaint students with a laboratory model of this type of a system [7].
Educational heating-system model with time delay developed at our institute is based on the principle of transferring heat from source through a piping system using heat transferring media to heat-consuming appliance. Schematic of the model is depicted in Fig.15, external appearance is in Fig.16. The heat transferring fluid is transported using a continuously controllable DC pump 6 into a flow-heater 1 with 750W heat power. The temperature of
the liquid leaving the heater is measured using a platinum thermometer T1. Warmed liquid then comes into a thermal insulated coil 2 which is composed of a 15m pipeline. Here a transport delay between 50 and 200 seconds originates depending on the pump speed. Heat exchanger 3 represents a heat-consuming appliance by releasing the thermal energy from the heat transferring fluid to the ambient air. The heat consumption can be set using two fans 4, 5 with adjustable speed. The temperature of the fluid entering and leaving the heat exchanger is measured by thermometers T2 and T3. Expansion tank 7 compensates for the thermal expansion effect of water. Schematic of the model is depicted in Fig.5.
Fig.15. Schematic of the time-delay model
Fig.16. Educational Time-delay model
T1
T3
T2
1
2
3
5 4
6
7
WSEAS TRANSACTIONS on SYSTEMS and CONTROL PETR DOSTÁLEK, VLADIMÍR VAŠEK, JAN DOLINAY
ISSN: 1991-8763 784 Issue 9, Volume 3, September 2008

Model is connected with standard personal computer through portable data acquisition unit utilizing RS232 interface (Fig.17). Its purpose is to convert analog signals originating in resistance thermometers to digital signals suitable for further process in computer. On the other hand it must convert digital signals to analog which control actuating devices such as pump, ventilators and flow heater.
Fig.17. – Model connection with personal computer 4.2 Model control application for CW Main window of the developed control application in Control Web 5 software environment is depicted in Fig.18 and Fig.19. The left part of the window contains simplified technology schematic with two control components for pump speed and demanded temperature setting.
Fig.18. Time-delay model control application – left part of the window
The right part of the window visualizes all monitored values – temperatures in 3 important parts of the model, controller actuating signal and demanded temperature value. All these values are stored in graph with history of 1000 values.
Fig.19. Time-delay model control application – right part of the window 4.3 Model control application for Matlab All the tasks related to control and monitoring of the time delay model are served by control software with graphical user interface running in Matlab 6.5 environment. The software supports step response measurement of the system, control of the selected controlled variable using PS, PSD and general linear controller with disturbance introduction possibility. To allow quick restoring of the time-delay model to initial conditions before next measurement, cooling function was implemented. All measured data are automatically saved to the workspace in the matrix form and to the user definable text file with format suitable for import to spreadsheet processor.
After the program is executed by writing command “tepmodel” in the command window of the Matlab 6.5 environment the main window depicted in the Fig.20 will appear. The window is divided into two parts – upper part is dedicated to displaying all measured system variables in the form of auto-scale graph.
Below the graph is situated block of buttons for selecting desired program action. These are divided into three categories depending on their function. Buttons with blue labels are used to startup program module which is performing each measurement –
DAQ
Unified analog and digital signals RS232
Time-delay model
PC
WSEAS TRANSACTIONS on SYSTEMS and CONTROL PETR DOSTÁLEK, VLADIMÍR VAŠEK, JAN DOLINAY
ISSN: 1991-8763 785 Issue 9, Volume 3, September 2008

for example button “STEP” will initiate measurement of the step response. Green labeled buttons are intended to setup each program module. Button “STOP” interrupts current measurement with saving all measured data to file and workspace as well. Reaction to the stop command is not instantaneous – it can take up to one sampling period of the current measurement. When ALT+F4 key combination or close button is pressed during measurement, all actuating signals are immediately reset and application is closed without data saving.
Pressing “EXIT” button will close the program with resetting all actuating signals to zero values. During measurement all buttons except “STOP” button are disabled in order to prevent unwanted interference to the running experiment.
Fig.20. Main window of the model control program Step response measurement Before starting the measurement by “STEP” function it is necessary to first set it up by button “Setup STEP”. After clicking this button dialog window depicted in Fig.21 will appear. In this window sampling period, actuating signal vector, actuating signal change time vector, overall measurement time, pump speed, fan speed and name of the file for data saving can be set. If the path to the file is not specified it will be saved to the current working directory. All data are automatically filled with default values which act as an example.
After entering desired values confirmed with “OK” button measurement can be started from the main window by clicking “STEP” button. After step function completion, the data are stored both to the specified file and to the workspace in matrix data_pch. Data in the matrix are stored in columns in the following order: time, y1, y2, y3 and u.
Fig.21. Setup of the step response measurement Model control with PS, PSD controller Setup window for parameter modifications is very similar to setup window of the step measurement but there are added regulator parameters q0, q1 (PS controller) and q2 (PSD controller), vector of set point values and vector of disturbance values. Very important is selection of the controlled value channel index as mentioned in Tab.3. In the workspace are measured data available in matrixes data_ps (PS controller) and data_psd (PSD controller). Data in the matrix are stored in columns in the following order: time, y1, y2, y3, u, w and v. Example of PS controller setup window is depicted in Fig.22.
Fig.22. Setup of the PS controller
Index Controlled value
1 y1 – temperature measured in the output of heater
2 y2 – temperature measured before heat exchanger
3 y3 – temperature measured after heat exchanger
Tab.3. Assignment of the channel indexes
WSEAS TRANSACTIONS on SYSTEMS and CONTROL PETR DOSTÁLEK, VLADIMÍR VAŠEK, JAN DOLINAY
ISSN: 1991-8763 786 Issue 9, Volume 3, September 2008
Model control with general linear controller Parameter modification options for the general linear controller are the same as in the previous PS and PSD controller except one – polynomials P and Q must be entered in vector form. Their degree can be maximally equal to six. Coefficients must be filled in the following order: p0, p1, …, p6 and q0, q1, …, q6. In the workspace data are available in the matrix data_olr. Transfer function of the general linear controller is in the form (1).
( ) ( )( ) 6
15
51
60
61
55
16
0
...
...pzpzpzpqzqzqzq
zPzQzGR ++++
++++== (1)
Program function verification The program equipment was verified in Matlab 6.5 software environment running on standard personal computer. It was connected via serial communication interface with time-delay model in normal hardware configuration. All measurements were passed in the following conditions: distilled water as heat transfer medium, pump speed at minimum (time delay is therefore maximal), fan 1 on, fan 2 at minimum speed (this fan is mainly used for disturbance generation during controller design testing) and channel index was set to 2 (temperature measured before heat exchanger). Step response of the time delay model is depicted in Fig.23. It was measured with actuating signal set to 50% of the maximum value (actuating signal of 100% is equal to heating power of 750W).
20
25
30
35
40
45
50
55
60
0 500 1000 1500 2000 2500 3000t [s]
y [°
C],
u [%
]
y2
u
Fig.23. Step response of the time-delay model
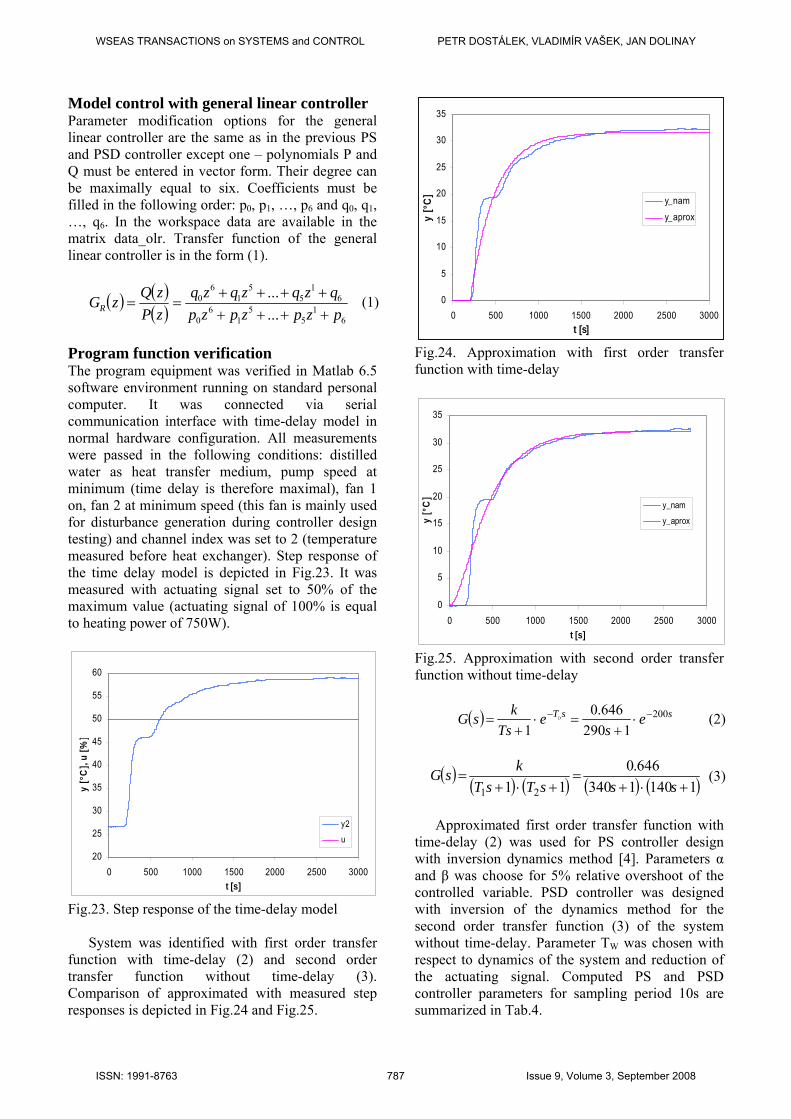
System was identified with first order transfer function with time-delay (2) and second order transfer function without time-delay (3). Comparison of approximated with measured step responses is depicted in Fig.24 and Fig.25.
0
5
10
15
20
25
30
35
0 500 1000 1500 2000 2500 3000t [s]
y [°
C] y_nam
y_aprox
Fig.24. Approximation with first order transfer function with time-delay
0
5
10
15
20
25
30
35
0 500 1000 1500 2000 2500 3000t [s]
y [°
C]
y_nam
y_aprox
Fig.25. Approximation with second order transfer function without time-delay
( ) ssT es
eTs
ksG D 200
1290646.0
1−− ⋅
+=⋅
+= (2)
( ) ( ) ( ) ( ) ( )11401340646.0
11 21 +⋅+=
+⋅+=
sssTsTksG (3)
Approximated first order transfer function with
time-delay (2) was used for PS controller design with inversion dynamics method [4]. Parameters α and β was choose for 5% relative overshoot of the controlled variable. PSD controller was designed with inversion of the dynamics method for the second order transfer function (3) of the system without time-delay. Parameter TW was chosen with respect to dynamics of the system and reduction of the actuating signal. Computed PS and PSD controller parameters for sampling period 10s are summarized in Tab.4.
WSEAS TRANSACTIONS on SYSTEMS and CONTROL PETR DOSTÁLEK, VLADIMÍR VAŠEK, JAN DOLINAY
ISSN: 1991-8763 787 Issue 9, Volume 3, September 2008

Controller type Parameter PS PSD
q0 1,15 9,66 q1 -1,11 -18,38 q2 ----- 8,74 TV 10s 10s
Tab.4. Computed PS and PSD controller parameters
Resulting control process achieved with PS controller with set point values set to 50°C at time 0s and 70°C at time 4000s is in Fig.26 and with PSD controller in Fig.27.
0
10
20
30
40
50
60
70
80
90
0 2000 4000 6000 8000 10000 12000
t [s]
y [°
C],
w [°
C],
u [%
], v[
%]
y2
u
w
v
Fig.26. PS controller control process
0
10
20
30
40
50
60
70
80
90
100
0 2500 5000 7500 10000 12500 15000t [s]
y [°
C],
w [°
C],
u [%
], v[
%]
y2
u
w
v
Fig.27. PSD controller control process 5 Conclusion The contribution deals with portable data acquisition unit which was developed at our department for control and monitoring related tasks. The device is designed with respect to possible battery operation enabling measurement in areas where power source is not available. Communication with supervision
system is realized by standard RS232 serial interface which makes DAQ device fully platform independent. In order to improve development of new software applications with this device a support program libraries for Matlab/Simulink, Visual C++ and Control Web 5 were created [5]. For research and educational purposes control software with graphical user interface running in Matlab 6.5 environment was developed. It supports step response measurement of the system, control of the selected controlled variable using PS, PSD and general linear controller with disturbance introduction possibility. The work was performed with financial support of research project MSM7088352102. This support is very gratefully acknowledged. References: [1] Freescale Semiconductor. M68HC908GP32
HCMOS Microcontroller Unit, 2000. Available from WWW: <www.freescale. com>, Accessed: 2008-04-12.
[2] Linear Technology. LTC1286/LTC1298 Micropower Sampling 12-Bit A/D Converters, 1994. Available from WWW: <www. linear.com>, Accessed: 2008-04-12.
[3] Moravian Instruments. Control Web 5 software documentation, Moravian Instruments, Inc., Zlín, 2005.
[4] Vítečková M., Controller tunning by method of inverse dynamics. Ostrava : VŠB – Technická univerzita Ostrava, 2000. 56s. ISBN 80-7078-628-0.
[5] Dolinay J.; Dostalek P.; Vasek V.; Kolomaznik K.; Janacova D., New Embedded Control System for Enzymatic Hydrolysis, In Proceedings of The 8th WSEAS International Conference on Applied Informatics and Communications, Rhodes Island, Greece, August 20-22 2008.
[6] Dostalek P.; Vasek V.; Dolinay J., Portable Data Acquisition Unit for Process Control and Monitoring Applications, In Proceedings of The 8th WSEAS International Conference on Applied Informatics and Communications, Rhodes Island, Greece, August 20-22 2008.
[7] Vasek V.; Dostalek P.; Janacova D.; Kolomaznik K.; Zalesak M., Applied Informatics in Automatic Control Education, In Proceedings of the 7th WSEAS International Conference on Applied Informatics and Communications, Athens, Greece, August 24-26, 2007.
WSEAS TRANSACTIONS on SYSTEMS and CONTROL PETR DOSTÁLEK, VLADIMÍR VAŠEK, JAN DOLINAY
ISSN: 1991-8763 788 Issue 9, Volume 3, September 2008