A Dual-Radio Framework for MAC Protocol Implementation in Wireless Sensor Networks
Design and Implementation of a Wireless Sensor Network Based Scalable Monitoring System (WiSe-SMS)
Emad Aboelela*, Raghied Atta, Khalid Aloufi
Taibah University, Computer Engineering Department, Madinah 41477, Saudi Arabia. * Corresponding author. Tel.: +966-569939475; email: [email protected] Manuscript submitted March 10, 2017; accepted June 24, 2017. doi: 10.17706/jcp.13.3.244-261
Abstract: Monitoring and tracking systems utilizing Wireless Sensor Networks (WSN) are in the core of
Ubiquitous Computing research. The evolving computing field of Internet of Things (IoT) incorporates
concepts from the ubiquitous computing paradigm. Many IoT potential applications involve monitoring and
tracking of these “things”. In this paper, we present the design and implementation of a scalable monitoring
system based on WSN. The utilized “sensors” in the proposed prototype are Radio-Frequency Identification
(RFID) and Global Positioning System (GPS) modules. We refer to the system as WiSe-SMS (Wireless Sensor
Network-based Scalable Monitoring System). The goal is to establish WiSe-SMS in the literature as a
framework to implement relevant scalable IoT systems. WiSe-SMS has the potential to be scaled to a large
number of monitored objects while tracking their historical locations. In this paper we present the details of
the WiSe-SMS design and implementation of its hardware and software components. The system prototype is
tested and experimental results are discussed and analyzed.
Key words: Wireless sensor networks (WSN), internet of things (IoT), smart cities, ubiquitous computing, RFID.
1. Introduction
Real-time ubiquitous monitoring systems help many organizations transfer to more proactive and
affordable role in managing their communities or assets. Such systems are part of the evolving computing
field of Internet of Things (IoT). The IoT incorporates concepts from the wider paradigm of ubiquitous
computing. In ubiquitous computing, computational devices are integrated in our daily used objects and they
are incorporated in most of our activities. Such computational devices have both networking and processing
capabilities. They need to be small and inexpensive. As Rogers indicated in [1], a motivation behind most
ubiquitous computing research has been to add convenience and comfort to our daily activities.
Monitoring and tracking systems utilizing WSNs integrated with identification sensors (e.g., RFID) and
tracking sensors (e.g., GPS) are in the core of Ubiquitous Computing research. Our proposed monitoring
system is designed and implemented based on these technologies. The system can solve many of the
challenges usually exist with traditional monitoring systems. We refer to our system as WiSe-SMS, which
stands for: Wireless Sensor Networks and RFID-based Scalable Monitoring System. The main goal of
WiSe-SMS is to be established in the literature as a framework to implement relevant IoT systems. The
following are the main features of the proposed WiSe-SMS:
1. The potential to be scaled to a large number of monitored objects.
2. No need for complex pre-organization and pre-planning deployment of the monitoring sensor nodes.
Journal of Computers
244 Volume 13, Number 3, March 2018

3. Reduction in the installation and deploying cost.
4. Promotion of self-organization and fault tolerance.
5. Easy to upgrade and reprogrammed even after deploying its sensor nodes in the application field.
6. Tracking the historical locations of the monitored objects by utilizing a cloud-based database.
7. Energy-efficient hardware, network protocols and algorithms. This results in minimization of human
interaction with the system as well as deployment of the system in hard-to-reach or harsh environments.
To realize the above features, WiSe-SMS is implemented with the following main specifications:
RFID readers are integrated with a ZigBee-based mesh network of WSN nodes [2]. Readings from the
RFID readers are collected and propagated through the WSN mesh networking. Mesh networking allows
for scalable, self-deployment, and self-organization of those readers.
Key WSN nodes are integrated with GPS modules for additional localization features.
A gateway is used to connect the WSN mesh network with the backbone network and hence with an
Internet server. The server hosts the system database that stores real-time and historical data about the
monitored objects.
A web-based map interface used by the administrator to monitor the objects on real time.
Traditional monitoring systems are based on sensors nodes (e.g., RFID readers, GPS, etc.) organized as
part of a traditional infrastructure network. The infrastructure network is usually connected to the backbone
network through switches (wired) or access points (wireless). The sensors nodes are usually powered by
traditional power sources; either wired (with limited deployment options) or batteries (with the need of
regular replacement). In the proposed WiSe-SMS the sensor nodes are organized as a mesh network using a
ZigBee-based WSN. The mesh network is connected to the backbone network using a WiFi-based gateway.
Such design has the advantage of scalable, self-deployment, less-power consumption, and self-organization of
the nodes in the network.
WiSe-SMS can be integrated in any information technology system that requires monitoring and/or
tracking of objects. The system can be utilized in many applications related to the evolving fields of the
Internet of Things (IoT) and smart cities. IoT refers to having everyday objects in our life identified, managed,
virtually represented, and integrated in the Internet. Tens of billions of objects are expected to be part of the
IoT by 2020 [3]. Smart cities solutions target the enhancement of urban quality of life through many
applications such as transportation planning, environmental monitoring, water management, energy
conservation, waste management, and public safety.
The paper is organized as follows: Section 2 covers the background of related work in the literature. In
Section 3, the design of the system components is described. Section 4 presents the implementation of
WiSe-SMS main hardware and software components. The experimental results and analysis are discussed in
Section 5. The paper is concluded in Section 6.
2. Background
Wireless sensor networks (WSN) integrated with identification sensors (e.g., RFID) and tracking sensors
(e.g., GPS) are most widely utilized technologies in research projects related to Ubiquitous Computing. WSN
have proved promise in applications that provide physical environment monitoring [4]-[6]. Applications of
RFID include asset identification in the supply chain [7]-[10]. Integrating WSN with RFID holds the potential
of introducing new ideas of applications in the Ubiquitous Computing paradigm in general and the evolving
field of Internet of Things (IoT) in particular. Some research projects have addressed integrating RFID and
WSN into one network [11]-[13]. The work done in these projects present frameworks and architecture of
systems that integrate WSN and RFID. Testing the applicability and scalability of such systems are under
research.
Journal of Computers
245 Volume 13, Number 3, March 2018
RFID allows for objects identification and localization within an area of tens of meters wide. There are
two types of elements in an RFID system: tags and readers. Each tag has data (mainly the unique identification
number) and an antenna. Readers have antennas and processing unit to receive and process data from the
tags. Tags can be active or passive. Active tags have their own power supply and they can initiate
communication with the readers. Readers are usually installed in fixed locations while tags are affixed to the
monitored objects, which are usually mobile. Active tags can reach readers up to 100 meters away. In
addition, of the identification number of an object, tags can store more information about the object such as
manufacturer, expiration date, product type, and environmental measurements such as temperature [7]-[10],
[14]. Localizations of objects using RFID readers and tags has been studied [15]. The results so far show that
using RFID for localization is a maintenance-free and effective way for tracking objects. However, some
problems with the accuracy of such tracking are still unresolved. Privacy and security of deploying RFID and
WSN for commercial applications are of central concern [15]. Even with encrypted data, attackers may
correlate collected data from items tagged with RFID and track their current and/or future states.
During the past decade, Wireless Sensor Network (WSN) technology and protocols have passed through
many developments. The wide range of potential applications of WSN promise to revolutionize the way we
live and interact with each other and with the surrounding environment. As WSNs are immediately
connected to the physical environment, they can provide information that is accurately localized in time and
space. WSN nodes are capable of sensing, deciding, acting, and communicating. The data processing
capability of the sensor node allows it to apply application-specific aggregation, filtering, encryption, and
compression algorithms. The networking capability of the sensor node allows it to be reprogrammed after
deployment in the field. The most common networking technique in WSN is mesh networking. With the
mesh networking architecture, a large number of WSN nodes are able to interact seamlessly across large area
[16]. The WSN nodes are getting smaller over the years with the benefit of less power consumption and
more robustness against malfunction. Such features open the doors for many applications especially in the
monitoring fields where WSNs allow for a continuous, reliable, and economical monitoring of large and
possibly hard-to-reach areas. Such features allow the administrators of the monitored areas to discover
anomalies promptly and study them thoroughly. The simulation option, or even deploying the sensors nodes
in a lab setting, will limit the potential gain of the research [17]. An example of simulating WSN in research
appears in [18] where Sun et al. introduced two methodologies to build an intrusion detection system for
mobile ad-hoc networks (MANETs).
Researchers have been studying utilizing WSN in monitoring applications. Researchers at University of
California at Berkeley studied the utilization of WSN for Structural Health Monitoring (SHM) [19]. They
tested a WSN of 64 nodes on the Golden Gate Bridge (GGB). WSN allowed them to measure the ambient
structural vibrations without interfering with the operation of the bridge. They collected reliable
measurements at a lower cost. The collected data match theoretical models as well as previous studies done
on the bridge. In [20], Xia and Vlajic proposed their Local Negotiated Clustering Algorithm (LNCA), which is
based on WSN. Their goal was to reduce the energy usage of individual sensor nodes through minimizing
in-network data-reporting traffic. Their simulation results show performance improvement of LNCA over two
well-known WSN clustering algorithms: LEACH and WCA. They showed how their approach could be helpful
for some applications like environment monitoring where a large number of WSN nodes are densely
deployed over a remote and/or inaccessible areas.
A WSN platform for instrumentation and predictive maintenance systems was presented in [21]. A variety
of sensors (position, accelerometers, temperature, shock, etc.) and actuators (motors) have been utilized in
the proposed platform. The results in the paper show that a continuous near-real-time system can be set up
with the proposed sensor nodes platform. Some of the systems, which utilized WSNs and RFID, require
Journal of Computers
246 Volume 13, Number 3, March 2018
communicating sensitive information. Therefore, securing such information to maintain a required level of
privacy is of a serious challenge on these systems. This challenge is more evident when WSNs and RFID
systems are integrated in one system. In [22], the authors presented the security concerns in systems where
WSNs and RFID are integrated. They proposed solutions for these concerns. They proposed a Linear
Congruential Generator (LCG) based lightweight block cipher that can resolve the security problems resulted
from the co-existence requirements of WSNs and RFID systems.
3. WiSe-SMS Design
In the core of our proposed WiSe-SMS is the integration of WSN and RFID modules. WSN and RFID have
their own positive and negative factors. WSN has the unique features of self-configuration, self-networking,
self-diagnosing, in-network data aggregation, and self-healing [13], [23]. Its main disadvantage is the lack of
feasibility for wearable system. RFID is great for wearable system as well as systems that are integrated with
Internet applications. On the other hand, RFID systems lack the networking features of the WSN. Our
WiSe-SMS integrates the WSN and RFID to achieve an optimal design of scalable-ubiquitous system. This
includes integrating RFID readers with WSN nodes. The physical integration includes connecting both
modules electronically in such a way to ensure a proper communication and time sequences between them.
3.1. The Network Design
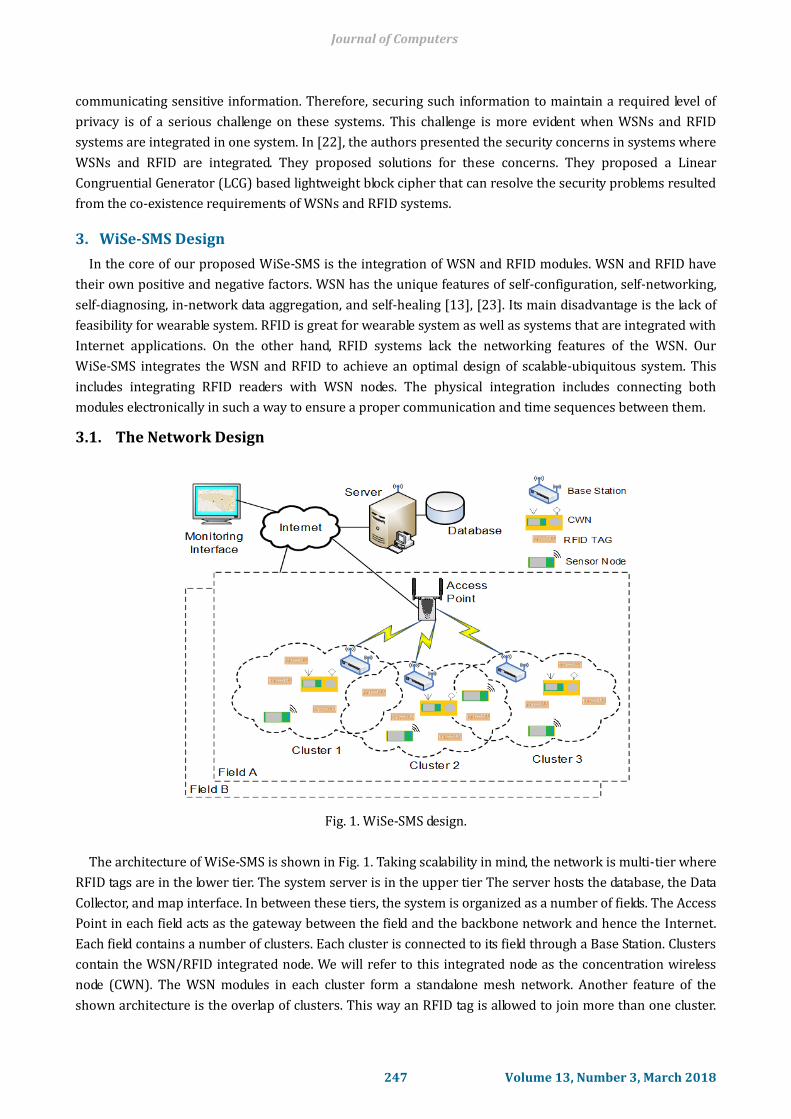
Fig. 1. WiSe-SMS design.
The architecture of WiSe-SMS is shown in Fig. 1. Taking scalability in mind, the network is multi-tier where
RFID tags are in the lower tier. The system server is in the upper tier The server hosts the database, the Data
Collector, and map interface. In between these tiers, the system is organized as a number of fields. The Access
Point in each field acts as the gateway between the field and the backbone network and hence the Internet.
Each field contains a number of clusters. Each cluster is connected to its field through a Base Station. Clusters
contain the WSN/RFID integrated node. We will refer to this integrated node as the concentration wireless
node (CWN). The WSN modules in each cluster form a standalone mesh network. Another feature of the
shown architecture is the overlap of clusters. This way an RFID tag is allowed to join more than one cluster.
Journal of Computers
247 Volume 13, Number 3, March 2018
This approach is expected to increase the robustness of the system even in case of node failure or
communication anomaly. Details about the implementation of the system components will be explained later.
3.2. The Database Design
The Data Collector in the server is a software program that collects the raw data from the system network
and stores them in the server database. The database stores the details of the monitored objects and their
current conditions. The monitoring user interface reflects the database contents on a map that is accessible
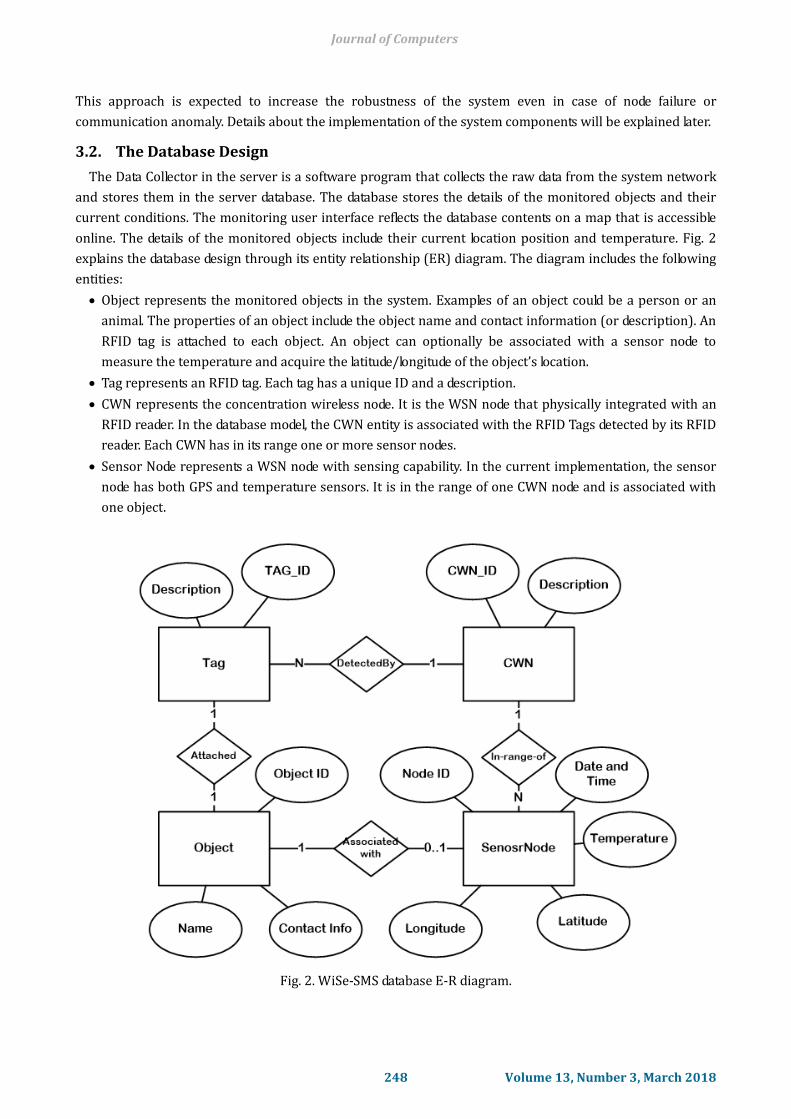
online. The details of the monitored objects include their current location position and temperature. Fig. 2
explains the database design through its entity relationship (ER) diagram. The diagram includes the following
entities:
Object represents the monitored objects in the system. Examples of an object could be a person or an
animal. The properties of an object include the object name and contact information (or description). An
RFID tag is attached to each object. An object can optionally be associated with a sensor node to
measure the temperature and acquire the latitude/longitude of the object’s location.
Tag represents an RFID tag. Each tag has a unique ID and a description.
CWN represents the concentration wireless node. It is the WSN node that physically integrated with an
RFID reader. In the database model, the CWN entity is associated with the RFID Tags detected by its RFID
reader. Each CWN has in its range one or more sensor nodes.
Sensor Node represents a WSN node with sensing capability. In the current implementation, the sensor
node has both GPS and temperature sensors. It is in the range of one CWN node and is associated with
one object.
Fig. 2. WiSe-SMS database E-R diagram.
Journal of Computers
248 Volume 13, Number 3, March 2018
4. WiSe-SMS Implementation
The WiSe-SMS implementation involves both hardware and software components:
1). Hardware Components: These include the sensor/RFID/Wi-Fi modules.
2). Software Components: These include the system server components: the Data Collector, the system
database, and the online map interface.
4.1. The Hardware Components
The hardware components include three modules. These modules are the base station, the CWN, and the
sensors module. The rest of this section explains the prototype implementation of these modules.
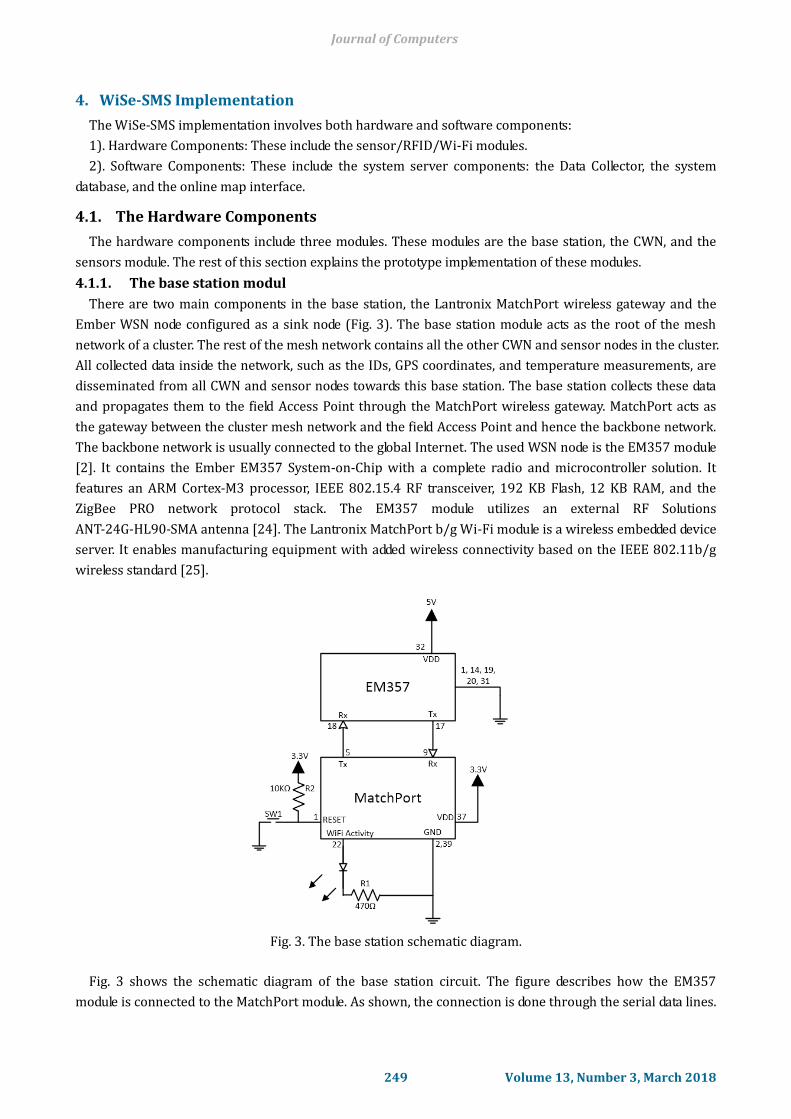
4.1.1. The base station modul
There are two main components in the base station, the Lantronix MatchPort wireless gateway and the
Ember WSN node configured as a sink node (Fig. 3). The base station module acts as the root of the mesh
network of a cluster. The rest of the mesh network contains all the other CWN and sensor nodes in the cluster.
All collected data inside the network, such as the IDs, GPS coordinates, and temperature measurements, are
disseminated from all CWN and sensor nodes towards this base station. The base station collects these data
and propagates them to the field Access Point through the MatchPort wireless gateway. MatchPort acts as
the gateway between the cluster mesh network and the field Access Point and hence the backbone network.
The backbone network is usually connected to the global Internet. The used WSN node is the EM357 module
[2]. It contains the Ember EM357 System-on-Chip with a complete radio and microcontroller solution. It
features an ARM Cortex-M3 processor, IEEE 802.15.4 RF transceiver, 192 KB Flash, 12 KB RAM, and the
ZigBee PRO network protocol stack. The EM357 module utilizes an external RF Solutions
ANT-24G-HL90-SMA antenna [24]. The Lantronix MatchPort b/g Wi-Fi module is a wireless embedded device
server. It enables manufacturing equipment with added wireless connectivity based on the IEEE 802.11b/g
wireless standard [25].
Fig. 3. The base station schematic diagram.
Fig. 3 shows the schematic diagram of the base station circuit. The figure describes how the EM357
module is connected to the MatchPort module. As shown, the connection is done through the serial data lines.
Journal of Computers
249 Volume 13, Number 3, March 2018
The output data line of the MatchPort module is connected to the input data line of the EM357 and vice versa.
Since the data signal level is the same for both modules, data lines are connected directly [24]-[25]. A switch
is used to reset the MatchPort module allowing it to re-establish connection with the wireless network access
point. An LED is utilized to indicate the activities of exchanging data between the MatchPort and the access
point.
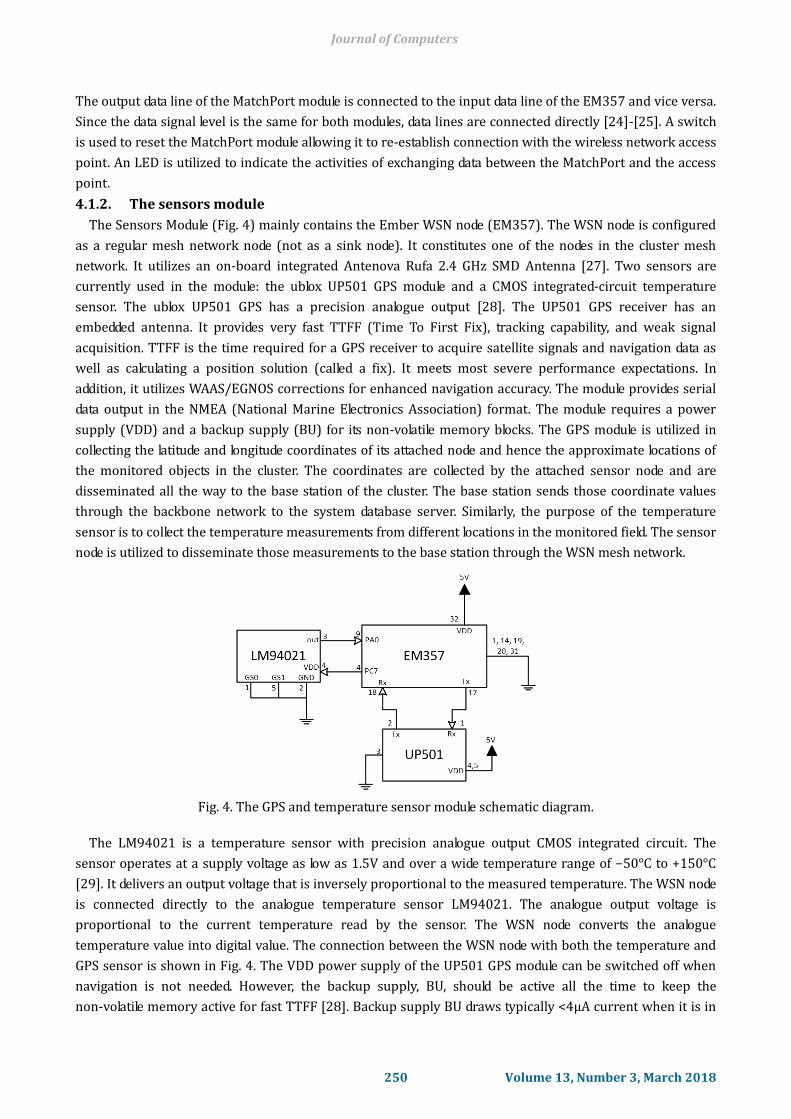
4.1.2. The sensors module
The Sensors Module (Fig. 4) mainly contains the Ember WSN node (EM357). The WSN node is configured
as a regular mesh network node (not as a sink node). It constitutes one of the nodes in the cluster mesh
network. It utilizes an on-board integrated Antenova Rufa 2.4 GHz SMD Antenna [27]. Two sensors are
currently used in the module: the ublox UP501 GPS module and a CMOS integrated-circuit temperature
sensor. The ublox UP501 GPS has a precision analogue output [28]. The UP501 GPS receiver has an
embedded antenna. It provides very fast TTFF (Time To First Fix), tracking capability, and weak signal
acquisition. TTFF is the time required for a GPS receiver to acquire satellite signals and navigation data as
well as calculating a position solution (called a fix). It meets most severe performance expectations. In
addition, it utilizes WAAS/EGNOS corrections for enhanced navigation accuracy. The module provides serial
data output in the NMEA (National Marine Electronics Association) format. The module requires a power
supply (VDD) and a backup supply (BU) for its non-volatile memory blocks. The GPS module is utilized in
collecting the latitude and longitude coordinates of its attached node and hence the approximate locations of
the monitored objects in the cluster. The coordinates are collected by the attached sensor node and are
disseminated all the way to the base station of the cluster. The base station sends those coordinate values
through the backbone network to the system database server. Similarly, the purpose of the temperature
sensor is to collect the temperature measurements from different locations in the monitored field. The sensor
node is utilized to disseminate those measurements to the base station through the WSN mesh network.
Fig. 4. The GPS and temperature sensor module schematic diagram.
The LM94021 is a temperature sensor with precision analogue output CMOS integrated circuit. The
sensor operates at a supply voltage as low as 1.5V and over a wide temperature range of −50°C to +150°C
[29]. It delivers an output voltage that is inversely proportional to the measured temperature. The WSN node
is connected directly to the analogue temperature sensor LM94021. The analogue output voltage is
proportional to the current temperature read by the sensor. The WSN node converts the analogue
temperature value into digital value. The connection between the WSN node with both the temperature and
GPS sensor is shown in Fig. 4. The VDD power supply of the UP501 GPS module can be switched off when
navigation is not needed. However, the backup supply, BU, should be active all the time to keep the
non-volatile memory active for fast TTFF [28]. Backup supply BU draws typically <4µA current when it is in
Journal of Computers
250 Volume 13, Number 3, March 2018
the back up state. While VDD is active (i.e., during navigation), BU current may peak up to 100µA with <20µA
average level. The GPS module interfaces to the WSN node via one serial port. The interface utilizes CMOS
voltage levels, as shown in Fig. 4.
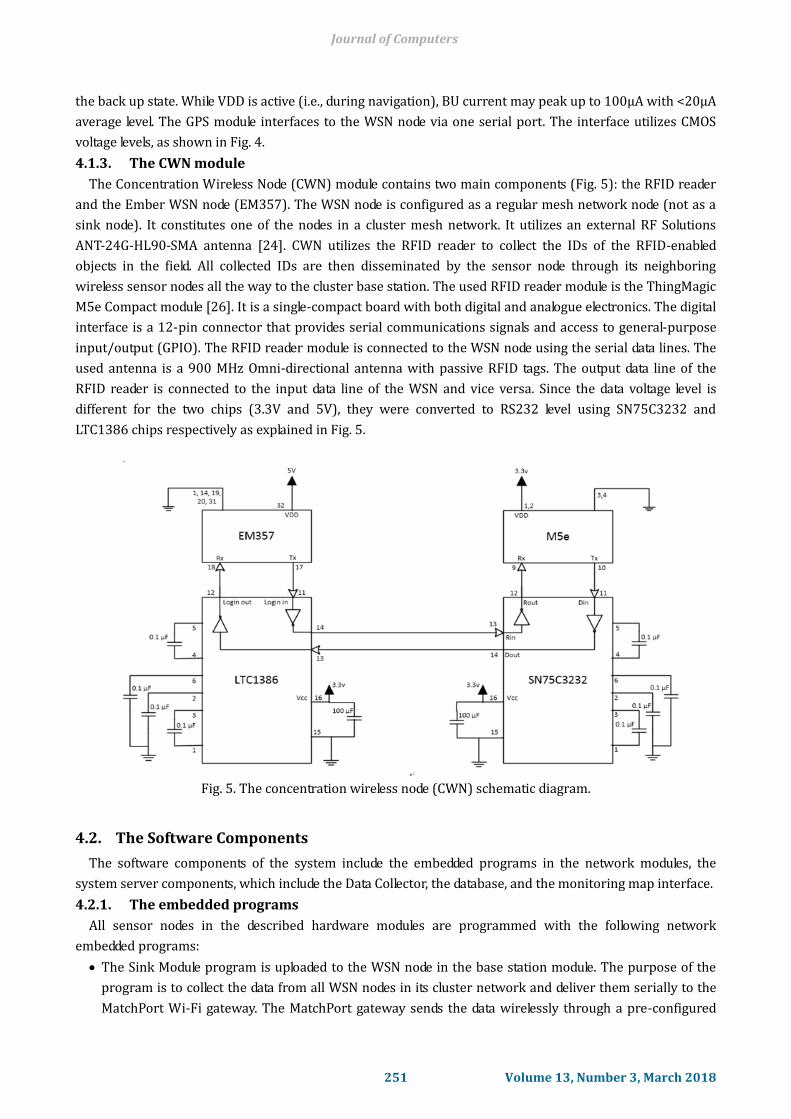
4.1.3. The CWN module
The Concentration Wireless Node (CWN) module contains two main components (Fig. 5): the RFID reader
and the Ember WSN node (EM357). The WSN node is configured as a regular mesh network node (not as a
sink node). It constitutes one of the nodes in a cluster mesh network. It utilizes an external RF Solutions
ANT-24G-HL90-SMA antenna [24]. CWN utilizes the RFID reader to collect the IDs of the RFID-enabled
objects in the field. All collected IDs are then disseminated by the sensor node through its neighboring
wireless sensor nodes all the way to the cluster base station. The used RFID reader module is the ThingMagic
M5e Compact module [26]. It is a single-compact board with both digital and analogue electronics. The digital
interface is a 12-pin connector that provides serial communications signals and access to general-purpose
input/output (GPIO). The RFID reader module is connected to the WSN node using the serial data lines. The
used antenna is a 900 MHz Omni-directional antenna with passive RFID tags. The output data line of the
RFID reader is connected to the input data line of the WSN and vice versa. Since the data voltage level is
different for the two chips (3.3V and 5V), they were converted to RS232 level using SN75C3232 and
LTC1386 chips respectively as explained in Fig. 5.
Fig. 5. The concentration wireless node (CWN) schematic diagram.
4.2. The Software Components
The software components of the system include the embedded programs in the network modules, the
system server components, which include the Data Collector, the database, and the monitoring map interface.
4.2.1. The embedded programs
All sensor nodes in the described hardware modules are programmed with the following network
embedded programs:
The Sink Module program is uploaded to the WSN node in the base station module. The purpose of the
program is to collect the data from all WSN nodes in its cluster network and deliver them serially to the
MatchPort Wi-Fi gateway. The MatchPort gateway sends the data wirelessly through a pre-configured
Journal of Computers
251 Volume 13, Number 3, March 2018
socket to the server.
The Sensor Module program is uploaded to the WSN node in the CWN module. The program collects the
RFIDs through the ThingMagic RFID reader and propagate these IDs periodically through the WSN
mesh network to the base station module.
The Sleepy Sensor Module program is uploaded to the WSN nodes in the GPS and temperature sensor
modules. The program reads the GPS and temperature data from the attached sensors. The data are
propagated through the WSN mesh network to the base station. This program is configured to allow the
sensor node to sleep in between readings. The sleepy mode is important to reduce the module’s power
consumption.
In this section we will explain the programming model used to implement the sensor embedded program
modules. The UML (Unified Modeling Language) activity diagrams are used to present the model [30]. An
activity diagram specifies a set of control and object nodes along with the flows carrying their tokens. A
summary of the UML activity nodes used in presenting WiSeR-SMS software components are summarized in
Appendix A.
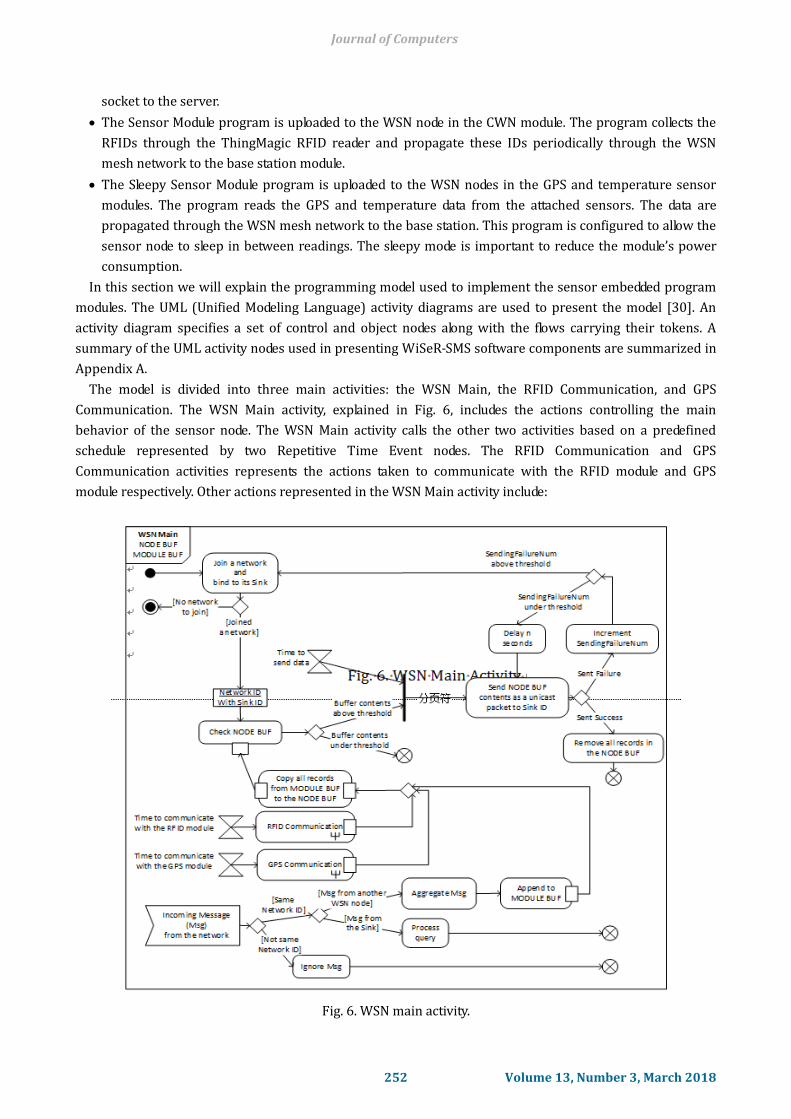
The model is divided into three main activities: the WSN Main, the RFID Communication, and GPS
Communication. The WSN Main activity, explained in Fig. 6, includes the actions controlling the main
behavior of the sensor node. The WSN Main activity calls the other two activities based on a predefined
schedule represented by two Repetitive Time Event nodes. The RFID Communication and GPS
Communication activities represents the actions taken to communicate with the RFID module and GPS
module respectively. Other actions represented in the WSN Main activity include:
Fig. 6. WSN main activity.
Journal of Computers
252 Volume 13, Number 3, March 2018
Joining the WSN network and binding to its sink node. The joining action is executed when the activity is
first invoked and when failure of sending packets reaches a pre-defined threshold.
The node buffer (NODE BUF) is filled by data records from other modules (RFID and GPS). Once the
records in the NODE BUF exceeds a predefined threshold and it is time to send data (represented by the
join node in the activity), the process of sending to the network sink starts. Successful sending of all
records triggers an action of removing all records in NODE BUF.
The Signal Acceptance Node in the activity represent the event of receiving an incoming message from
other nodes in the network. As part of the mesh networking aggregation feature, if the message contains
data from another WSN node, its valid records are inserted in MODULE BUF and forwarded to the regular
send process explained above. Otherwise, if the message is a request from the sink, then it is processed
accordingly.
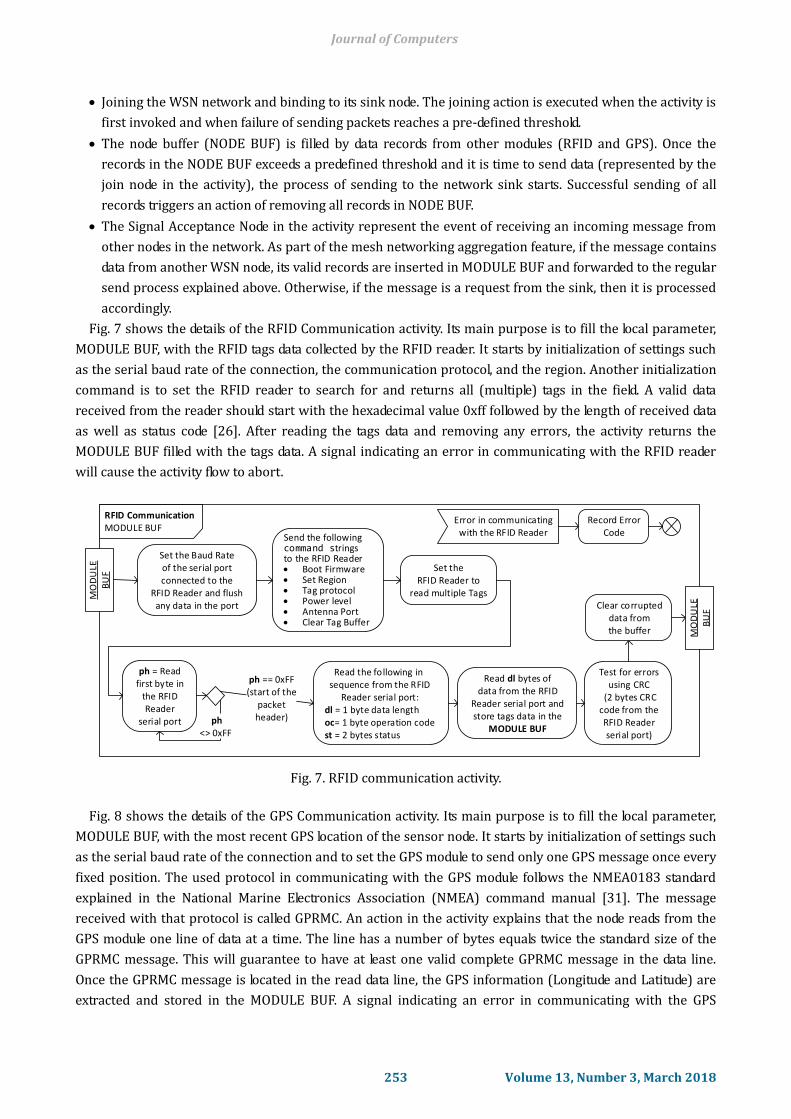
Fig. 7 shows the details of the RFID Communication activity. Its main purpose is to fill the local parameter,
MODULE BUF, with the RFID tags data collected by the RFID reader. It starts by initialization of settings such
as the serial baud rate of the connection, the communication protocol, and the region. Another initialization
command is to set the RFID reader to search for and returns all (multiple) tags in the field. A valid data
received from the reader should start with the hexadecimal value 0xff followed by the length of received data
as well as status code [26]. After reading the tags data and removing any errors, the activity returns the
MODULE BUF filled with the tags data. A signal indicating an error in communicating with the RFID reader
will cause the activity flow to abort.
Fig. 7. RFID communication activity.
Fig. 8 shows the details of the GPS Communication activity. Its main purpose is to fill the local parameter,
MODULE BUF, with the most recent GPS location of the sensor node. It starts by initialization of settings such
as the serial baud rate of the connection and to set the GPS module to send only one GPS message once every
fixed position. The used protocol in communicating with the GPS module follows the NMEA0183 standard
explained in the National Marine Electronics Association (NMEA) command manual [31]. The message
received with that protocol is called GPRMC. An action in the activity explains that the node reads from the
GPS module one line of data at a time. The line has a number of bytes equals twice the standard size of the
GPRMC message. This will guarantee to have at least one valid complete GPRMC message in the data line.
Once the GPRMC message is located in the read data line, the GPS information (Longitude and Latitude) are
extracted and stored in the MODULE BUF. A signal indicating an error in communicating with the GPS
RFID CommunicationMODULE BUF
Set the Baud Rate of the serial portconnected to the
RFID Reader and flush any data in the port
Send the following command strings to the RFID Reader Boot Firmware Set Region Tag protocol Power level Antenna Port Clear Tag Buffer
Error in communicating with the RFID Reader
Set the RFID Reader to
read multiple Tags
ph = Read first byte in
the RFID Reader
serial port ph<> 0xFF
Read the following in sequence from the RFID Reader serial port:dl = 1 byte data lengthoc= 1 byte operation codest = 2 bytes status
ph == 0xFF (start of the
packet header)
Record Error Code
Read dl bytes of data from the RFID
Reader serial port and store tags data in the
MODULE BUF
Test for errorsusing CRC
(2 bytes CRC code from the RFID Reader serial port)
Clear corrupted data from the buffer M
OD
ULE
BU
F
MO
DU
LEB
UF
Journal of Computers
253 Volume 13, Number 3, March 2018

module will cause the activity flow to abort.
Fig. 8. GPS communication activity.
The explained embedded programs are linked with the ZigBee stack library in the WSN nodes. ZigBee is an
alliance of companies working together to provide low cost, long battery life and simple mesh networks for
large network operation [32]. The utilized stack provides the basic security elements in IEEE 802.15.4 (e.g.,
AES encryption and CCM security modes). In addition, ZigBee expands upon those basic elements with other
stronger security measures such as 128-bit AES encryption algorithms and strong NIST-approved security.
The routing algorithm in the ZigBee stack avoids creating broken routes and optimizes the efficiency and
robustness of established routes in the network. The algorithm is especially important to provide fault
tolerance capability. Such fault tolerance is especially important for networks deployed in harsh
environments.
4.2.2. The Server data collector
Journal of Computers
254 Volume 13, Number 3, March 2018
Fig. 9. The data collector interface.

The WiSe-SMS Data Collector is a C# program running on a Windows 10 Core i7 computer. Its interface is
shown in Fig. 9. It opens a listening TCP socket to read data sent from the system base station. The data
include RFIDs, GPS locations, and temperature measurements. Each record of data is sent along with the ID of
the WSN module that originates the record. The server formats the data and uploads it to the appropriate
tables in the database server.
4.2.3. The database server
The database server is configured in the cloud to hold the tables and relations reflecting the E-R model
shown in Fig. 2. They are implemented using the MySQL version 5.5.x. The Data Collector updates these
tables with the real-time data collected from the WSN network. This real-time data are displayed graphically
on the monitoring map interface.
4.2.4. The monitoring map interface
The monitoring map allows the administrators of the monitored field to monitor the objects by displaying
their real-time information on a digital map Fig. 10. The information includes the location and identity of the
objects currently stored in the database. The map can be accessed using any Internet browser. The code of
the interface is programmed using PHP version 5.4.x. For outdoor areas, the code utilizes Google maps to
display the area’s map. Such area is defined by the Latitude and Longitude of its center. For indoors areas,
custom maps need to be developed and stored in the WiSe-SMS database server.
Fig. 10. The monitoring map interface.
5. Experiments and Analysis
The hardware and software components of WiSe-SMS prototype were tested. Fig. 9 shows the interface of
the system server Data Collector. It shows the collected data from one of the WSN base station. As shown, the
Data Collector can be configured as either a client or a server to the system base station. If it is configured as
a client, the IP address of the base station should be provided in the shown Sink IP field. If it is configured as a
server (i.,e. “Work as a Server” checkbox is checked), the base station should be configured with the Data
Collector IP address. That IP address is displayed automatically. If the “Save to SQL DB” checkbox is checked,
the Data Collector stores the collected data directly to the system SQL database. Otherwise, it just displays the
data locally for testing purposes. The Data Collector can also send a test/configuration commands to the
base station through the “Snk Cmnd” text field.
Journal of Computers
255 Volume 13, Number 3, March 2018

The left panel in Fig. 9 shows the collected raw data from the system WSN network. The right panel shows
the data after being processed and before being uploaded to the MySQL database in the cloud. The collected
data are mainly the RFIDs tags, the GPS locations, and the temperature.
Fig. 10 shows sample monitoring map interface where the monitored sensor nodes were placed outside
the research lab. It reflects the real-time data in the database. The details of the monitored objects are
displayed on the map. The map utilizes the Google mapping library where objects are displayed using their
latitude and longitude coordinates.
5.1. Scalability Analysis
Scalability of the proposed WiSe-SMS has two dimensions: (i) scalable covered areas; (ii) scalable number
of monitored objects. As explained in Fig. 1, the proposed system architecture can be extended to cover
multiple monitored fields. Each field contains multiple clusters. The scalability of each cluster is bounded by
the following factors:
1).The EM357 ZigBee modules maximum processing rate and covered area.
2).The RFID reader maximum tag read rate and read distance.
Table 1 shows the maximum coverage area and processing rate of each of the utilized modules in the
WiSe-SMS prototype.
Table 1. System Components Covered Area and Processing Limits
Component Maximum Covered Area Maximum Processing
Rate
ZigBee/802.15.4 EM357 Module [2].
Ranges from few meters to kilometers depending on the used antenna [24], [27].
12,000-33,000 messages per second [33]-[34].
ThingMagic RFID reader (M5e) [26].
9 meters (with 6 dBi antenna and passive RFID tags)
190 tags/second
Each cluster in WiSe-SMS, which corresponds to a standalone ZigBee mesh network, has a theoretical
maximum number of WSN nodes over 65,000. In practice, this number is limited by the nodes’ messages
transmission rate (data rate) and the network density (number of nodes per unit area). The number of nodes
also is limited by some parameters configured in the ZigBee modules such as the maximum number of
sleeping children nodes associated with a parent node (default 6), source routing table size, and sink address
table size.
The covered area by one ZigBee mesh network (cluster) depends on many factors related to the used
antenna as well as environmental conditions (e.g., indoor and outdoor obstacles) [24], [27]. The area also
depends on some parameters configured in the ZigBee modules such as the maximum depth (default 15) and
maximum number of hops to reach the sink (default 30).
ZigBee networks have been tested with up to 1,000 nodes [33]. For WiSe-SMS, the maximum number of
nodes in a cluster depends on the application at hand. If the goal is to maximize the number of RFID readers
per cluster, then we need to take into consideration the two processing rate limits of 12,000 and 190 of the
ZigBee module and RFID readers respectively (Table 2). Therefore, the number of RFID readers per cluster
should not exceed 12,000 ÷ 190 = 63 nodes.
The maximum number of clusters per a WiSe-SMS field depends on the capability of the field’s access point
as well as the throughput of its Internet connection. The scalability of the overall number of fields that can be
supported by the system has the same constraints as any real-time and highly available service provided in
the Internet nowadays. Such services usually support a number of clients that ranges from tens of clients
(e.g., a messaging server in a small company) to billions of clients (e.g., Facebook and WhatsApp). The
hardware architecture to provide these services ranges from a single computer to layers of distributed
Journal of Computers
256 Volume 13, Number 3, March 2018

clusters of computers. Therefore, the scalability of the WiSe-SMS fields depends on the design and
architecture of the system servers.
5.2. Power Analysis
Power consumption is a crucial factor in monitoring systems. The monitored objects might be distributed
over vast areas that are hard to cover or reach. Consequently, it might be a costly process to replace the
batteries that are used to power the components of these systems. In this section we study the power
needed by each of WiSe-SMS circuits. Table 2 lists the power consumption of each device used in these
circuits.
Table 2. Power Consumption of the System Components
Device Power consumption GPS module (UP501) 25 mA at 3.3V = 82.5mW in navigation Ember WSN node (EM357) RX Current: 26 mA at 5V = 113 mW
3 dBm TX Current: 31 mA at 5V = 151 mW Low deep sleep current: 400 nA at 5V = 2 μW
Lantronix Matchport 194mA at 3.3V at 48MHz, 100Mbps= 640 mW Temperature Sensor (LM94021)
9 μA at 5V = 45 μW
RS232 Level Converter (SN75C3232)
300 µA at 3.3V = 990 μW
RS232 Level Converter (LTC1386)
500 µA at 3.3V = 1.65 mW
ThingMagic RFID reader (M5e) Max 540 mA at 5 V = 2.7 W 1.7 W max if idle. Power management modes can be used to reduce this to as little as 0.1W
Based on the power consumptions by each component, the average power needed by the WiSe-SMS
circuits are calculated as follows:
1. The base station (Fig. 3), which contains the EM357 and Matchport:
• During reception mode: 194 + 113 = 307 mW.
• During transmission mode: 194 + 151 = 345 mW
2. The GPS and temperature sensor modules (Fig. 4), which contains the EM357, UP501 and LM94021:
• During reception mode: 82.5 + 113 + 0.045 = 195.545 mW
• During transmission mode: 82.5 + 151 + 0.045 = 233.545 mW
• During sleep mode: 82.5 + 0.002 + 0.045 = 82.547 mW
• The concentration wireless node (CWN) (Fig. 5), which contains the EM357, ME5, SN75C3232 and
LTC1386:
• During transmission mode: 151+ 2700 +0.99 + 1.65 + 0.045 =2853.685 mW.
• During sleep mode: 100+0.002+0.045 = 100.047 mW
In testing the prototype, the base station is powered by a continuous power supply. The other two circuits
are powered by Lithium-Ion rechargeable batteries. Each battery has a capacity of 7800mAh. The discharge
time of the battery is basically the Ah capacity of the battery divided by the current as shown in Table 2. The
working hours of the circuits can be calculated as follows:
1. The concentration wireless node (CWN):
• Average Transmission time = 7800/(31+540) = 13.7 hours
• Average Reception time = 7800/ (26+540) = 14 hours
2. The GPS and temperature sensor modules:
• Average Transmission time = 7800/(31+25) = 140 hours
• Average Reception time = 7800/ (26+25) = 153 hours.
Journal of Computers
257 Volume 13, Number 3, March 2018

A solar energy option has been tested to charge the above batteries and it allows a continuous operation of
the WiSe-SMS circuits for days without human intervention.
6. Conclusion
In this paper, the design and implementation details of a scalable monitoring system based on a wireless
sensor network were presented. We referred to the system as WiSe-SMS, which stands for Wireless Sensor
Network-based Scalable Monitoring System. In the core of our system is the wireless sensor mesh
networking based on the ZigBee standard. Such technology allows for scalable monitoring system where
hundreds of our concentration wireless nodes (CWN) can be utilized in one monitoring field. Using wireless
mesh networking in implementing a monitoring system decreases the cost and time while increases the
feasibility compared to those legacy systems that require wired or wireless infrastructure architecture. The
system integrates the RFID readers, GPS modules, and temperature sensors in the network nodes. RFID
readers allow for objects identity that is used as an index to the objects’ details. Such details are stored in the
system database server. The GPS modules allow for more accurate and automatic localizations of the
monitored objects. The temperature sensors, or any other relevant environmental sensors, allows for
monitoring the objects’ conditions. The system was tested and experimental results were presented. Its
scalability and power consumption were analyzed. The presented WiSe-SMS system has the potential of
improving operation of IoT networks and hence opening the door for innovative applications in the field. A
real-time online mapping of the monitored objects is an essential part of WiSe-SMS. It allows for a more
efficient decision-making by the monitoring administrators.
Appendix A UML Activity Nodes
Table A summarized the main UML activity nodes used in presenting the programming model of the
sensor embedded program modules implemented in WiSe-SMS.
Table A. Used UML Activity Nodes [30]
Activity Node Graphic Symbol Action: An action is a single step within the activity that represents occurrence of functions, sending of signals, or manipulation of objects.
Object Node: Object node represents objects (data) as they flow in an activity. It can act as a buffer of
the activity’s input and output parameters.
Control Flow: Control flow is an activity edge connecting two actions and have control tokens passing
along it. When the destination action begins execution, the tokens are removed from their original
sources. If multiple control tokens are available on the control flow, they are all consumed.
Object Flow: Object flow is an activity edge with object tokens passing along it. Object tokens
accepted on an object flow are placed on an object node or an input pin of an action, which consumes them during its execution.
or
Initial Node: An initial node represents the starting point of a flow. When an activity is invoked, each
one of its flows starts at its initial node. Activity Final Node: An activity might have more than one final node. Reaching any one of the final
nodes terminates the activity regardless if the other final nodes status.
Flow Final Node: Flow final node aborts only its flow while all other active flows in the activity
continue their execution.
Signal Acceptance Node: Once a designated signal is generated by any node in the activity, the
corresponding signal acceptance node receives it and starts a new flow.
Journal of Computers
258 Volume 13, Number 3, March 2018
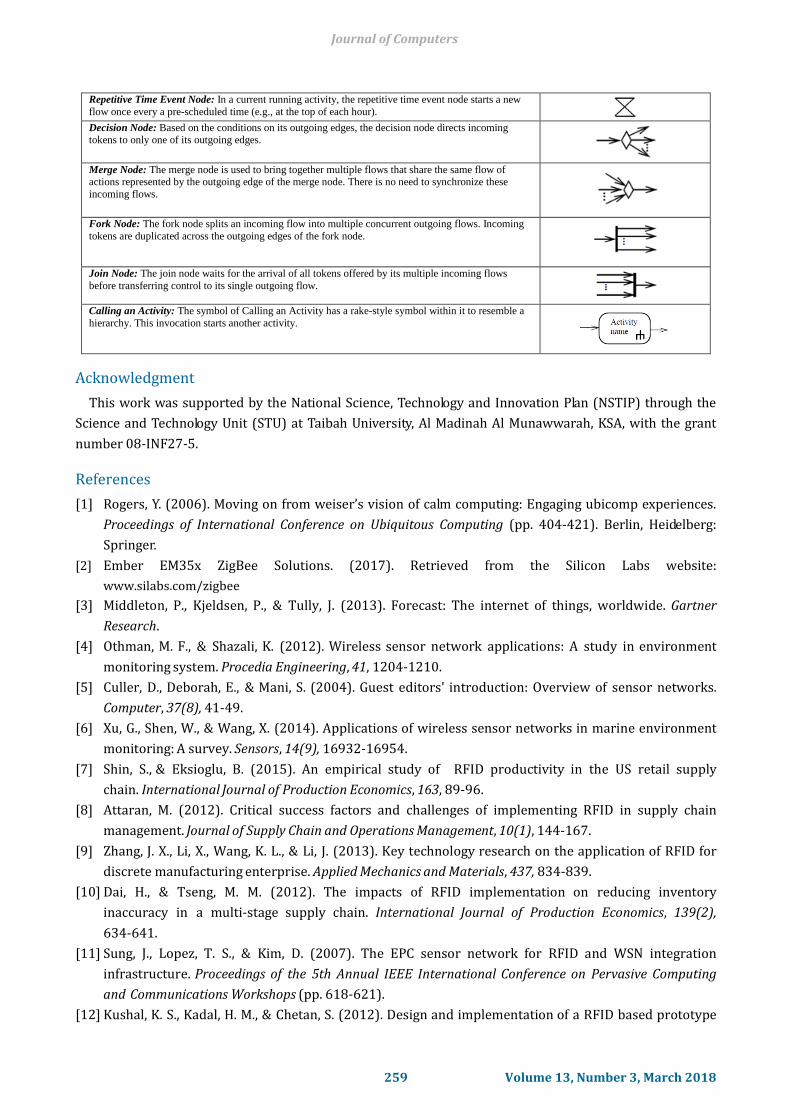
Repetitive Time Event Node: In a current running activity, the repetitive time event node starts a new
flow once every a pre-scheduled time (e.g., at the top of each hour).
Decision Node: Based on the conditions on its outgoing edges, the decision node directs incoming tokens to only one of its outgoing edges.
Merge Node: The merge node is used to bring together multiple flows that share the same flow of actions represented by the outgoing edge of the merge node. There is no need to synchronize these
incoming flows.
Fork Node: The fork node splits an incoming flow into multiple concurrent outgoing flows. Incoming
tokens are duplicated across the outgoing edges of the fork node.
Join Node: The join node waits for the arrival of all tokens offered by its multiple incoming flows
before transferring control to its single outgoing flow.
Calling an Activity: The symbol of Calling an Activity has a rake-style symbol within it to resemble a
hierarchy. This invocation starts another activity.
Acknowledgment
This work was supported by the National Science, Technology and Innovation Plan (NSTIP) through the
Science and Technology Unit (STU) at Taibah University, Al Madinah Al Munawwarah, KSA, with the grant
number 08-INF27-5.
References
[1] Rogers, Y. (2006). Moving on from weiser’s vision of calm computing: Engaging ubicomp experiences.
Proceedings of International Conference on Ubiquitous Computing (pp. 404-421). Berlin, Heidelberg:
Springer.
[2] Ember EM35x ZigBee Solutions. (2017). Retrieved from the Silicon Labs website:
www.silabs.com/zigbee
[3] Middleton, P., Kjeldsen, P., & Tully, J. (2013). Forecast: The internet of things, worldwide. Gartner
Research.
[4] Othman, M. F., & Shazali, K. (2012). Wireless sensor network applications: A study in environment
monitoring system. Procedia Engineering, 41, 1204-1210.
[5] Culler, D., Deborah, E., & Mani, S. (2004). Guest editors' introduction: Overview of sensor networks.
Computer, 37(8), 41-49.
[6] Xu, G., Shen, W., & Wang, X. (2014). Applications of wireless sensor networks in marine environment
monitoring: A survey. Sensors, 14(9), 16932-16954.
[7] Shin, S., & Eksioglu, B. (2015). An empirical study of RFID productivity in the US retail supply
chain. International Journal of Production Economics, 163, 89-96.
[8] Attaran, M. (2012). Critical success factors and challenges of implementing RFID in supply chain
management. Journal of Supply Chain and Operations Management, 10(1), 144-167.
[9] Zhang, J. X., Li, X., Wang, K. L., & Li, J. (2013). Key technology research on the application of RFID for
discrete manufacturing enterprise. Applied Mechanics and Materials, 437, 834-839.
[10] Dai, H., & Tseng, M. M. (2012). The impacts of RFID implementation on reducing inventory
inaccuracy in a multi-stage supply chain. International Journal of Production Economics, 139(2),
634-641.
[11] Sung, J., Lopez, T. S., & Kim, D. (2007). The EPC sensor network for RFID and WSN integration
infrastructure. Proceedings of the 5th Annual IEEE International Conference on Pervasive Computing
and Communications Workshops (pp. 618-621).
[12] Kushal, K. S., Kadal, H. M., & Chetan, S. (2012). Design and implementation of a RFID based prototype
Journal of Computers
259 Volume 13, Number 3, March 2018
SmArt LibrARY (SALARY) system using wireless sensor networks. Advances in Computer Science,
Engineering & Applications, 499-505. Berlin Heidelberg: Springer.
[13] Zhang, L., & Wang, Z. (2006). Integration of RFID into wireless sensor networks: Architectures,
opportunities and challenging problems. Proceedings of the 5th International Conference on Grid and
Cooperative Computing Workshops (pp. 463-469).
[14] Aggarwal, C., & Han, J. (2013). A survey of RFID data processing. Managing and Mining Sensor Data,
349-382. US: Springer.
[15] Michahelles, F., Thiesse, F., Schmidt, A., & Williams, J. R. (2007). Pervasive RFID and near field
communication technology. IEEE Pervasive Computing, 6(3), 94-96.
[16] Oliveira, L. M., & Rodrigues, J. (2011). Wireless sensor networks: A survey on environmental
monitoring. JCM, 6(2), 143-151.
[17] Murty, R. N., Mainland, G., Rose, I., Chowdhury, A. R., Gosain, A., Bers, J., & Welsh, M. (2008). Citysense:
An urban-scale wireless sensor network and testbed. Proceedings of IEEE Conference on Technologies
for Homeland Security (pp. 583-588).
[18] Sun, B., Wu, K., Xiao, Y., & Wang, R. (2007). Integration of mobility and intrusion detection for
wireless adhoc networks. International Journal of Communication Systems, 20(6), 695-721.
[19] Kim, S., Pakzad, S., Culler, D., Demmel, J., Fenves, G., Glaser, S., & Turon, M. (2007). Health monitoring of
civil infrastructures using wireless sensor networks. Proceedings of the 6th International Conference
on Information Processing in Sensor Networks (pp. 254-263).
[20] Xia, D., & Vlajic, N. (2007). Near-optimal node clustering in wireless sensor networks for
environment monitoring. Proceedings of the 21st International Conference on Advanced Information
Networking and Applications (pp. 632-641).
[21] Ramamurthy, H., Prabhu, B. S., Gadh, R., & Madni, A. M. (2007). Wireless industrial monitoring and
control using a smart sensor platform. IEEE Sensors Journal, 7(5), 611-618.
[22] Sun, B., Xiao, Y., Li, C., Chen, H., & Yang, T. A. (2008). Security co-existence of wireless sensor
networks and RFID for pervasive computing. Computer Communications, 31(18), 4294-4303.
[23] Rezvani, M., Ignjatovic, A., Bertino, E., & Jha, S. (2013). A robust iterative filtering technique for
wireless sensor networks in the presence of malicious attacks. Proceedings of the 11th ACM Conference
on Embedded Networked Sensor Systems (p. 30).
[24] RF solutions: ANT-24G-HL90-SMA antenna. (2013). Retrieved from
www.rfsolutions.co.uk/downloads/1456242291DS-ANT-24G-HL90.pdf
[25] Match Port b/g embedded wireless device server. (2013). Retrieved from
www.lantronix.com/pdf/MatchPort_PB.pdf
[26] Thing magic mercury5e (M5e) RFID reader. (2009). Retrieved from
www.thingmagic.com/index.php/embedded-rfid-readers/mercury5e
[27] Antenova Rufa 2.4 GHz SMD antenna. (2016). Retrieved from
www.antenova-m2m.com/wp-content/uploads/2016/01/Rufa-A5837-A5887-PS-1-2.pdf
[28] ublox UP501 GPS antenna module. (2013). Retrieved from www.u-blox.com
[29] Temperature sensor LM94021. (2016). Retrieved from www.ti.com/lit/ds/symlink/lm94021.pdf
[30] OMG unified modeling LanguageTM, OMG UML version 2.4.1. (2011). Retrieved from the
ObjectManagement Group (OMG) website: www.omg.org/spec/UML/2.4.1/Superstructure/PDF/
[31] National Marine Electronics Association (NMEA) Manual Based on MediaTek Chipset. (2013).
Retrieved from www.whitebream.nl/files/product/Fastrax_NMEA-CommandManual.pdf
[32] The ZigBee Alliance. (2017). Retrieved from www.zigbee.org
[33] Pinedo-Frausto, E. D., & Garcia-Macias, J. A. (2008). An experimental analysis of zigbee networks.
Journal of Computers
260 Volume 13, Number 3, March 2018

Proceedings of the 33rd IEEE Conference on Local Computer Networks (pp. 723-729).
[34] Mraz, L., Cervenka, V., Komosny, D., & Simek, M. (2013). Comprehensive performance analysis of
zigbee technology based on real measurements. Wireless Personal Communications, 71(4), 2783-2803.
Emad Aboelela is an associate professor in the Department of Computer Engineering,
Taibah University, Madinah, Saudi Arabia. He received his Ph.D. in computer engineering
from the University of Miami, Florida, USA in 1998. His M.Sc. and B.Sc. degrees in
computer systems engineering were received from Alexandria University, Egypt in 1990
and 1993 respectively. He has been an associate professor at the College of Computer
Science and Engineering, Taibah University since January 2007. He was a faculty member
with the Department of Computer and Information Science at the University of Massachusetts Dartmouth,
USA from September 2001 to January 2007. He was the principle investigator of many funded research
projects during his career in USA and Saudi universities. His work has been published in several journal
publications and presented in prestigious conferences. He is the author of the book: Network Simulation
Experiments Manual (Morgan Kaufmann Publishers, USA, 2011). The book has been chosen to accompany
the well-known computer-networking textbook: Computer Networks: A Systems Approach (Morgan
Kaufmann Publishers, USA 2003-2011).
Aboelela is a senior member of both the IEEE and ACM since 2005 and 2008 respectively. He is an active
ABET program evaluator since June 2013. Aboelela’s areas of research include wireless sensor networks,
internet of things, embedded systems, quality-of-service for multimedia networking, and computer networks
management and design.
Raghied Atta is an associate professor in the Department of Electrical Engineering,
Taibah University, Madinah, Saudi Arabia. He received his Ph.D. and MPhil degrees in
microelectronics engineering from Cambridge University, UK in 1994 and 1998
respectively. His B.Sc. degree in electrical engineering was received in 1989 from Cairo
University, Egypt. He was a faculty member in different universities in the UK including
manchester, southampton and birmingham. His research interests include microsensors
and wireless sensor networks. He has been an active member of multiple research projects in
microelectronics applications and renewable energy.
Khalid Aloufi is an associate professor in the Department of Computer Engineering,
Taibah University, Madinah, Saudi Arabia. He received his Ph.D. and M.Sc. degrees in
informatics from Bradford University, UK, in 2002 and in 2006 respectively. His B.Sc.
degree in computer engineering was received in 1999 from King Fahd University of
Petroleum and Minerals (KFUPM), Saudi Arabia. From 2002 to 2006, he was part of the
networks and performance engineering research group at Bradford University. Since
2013, Aloufi has been the dean of the College of Computer Science and Engineering at Taibah University,
Saudi Arabia.
Journal of Computers
261 Volume 13, Number 3, March 2018