Design and implementation of a fault-tolerant drive-by...
90
Design and implementation of a fault-tolerant drive-by-wire system Master of Science Thesis in Embedded Electronics System Design Alexander Altby Davor Majdandzic Department of Computer Science and Engineering Chalmers University of Technology Gothenburg, Sweden 2014
Transcript of Design and implementation of a fault-tolerant drive-by...

Design and implementation of a fault-tolerantdrive-by-wire system
Master of Science Thesis in Embedded Electronics System Design
Alexander Altby
Davor Majdandzic
Department of Computer Science and EngineeringChalmers University of TechnologyGothenburg, Sweden 2014
1

The Authors grants to Chalmers University of Technology the non-exclusive right to publishthe Work electronically in a non-commercial purpose making it accessible on the Internet. TheAuthor warrants that he/she is the author to the Work, and warrants that the Work does notcontain text, pictures or other material that violates copyright law.
The Author shall, when transferring the rights of the Work to a third party (for example apublisher or a company), acknowledge the third party about this agreement. If the Author hassigned a copyright agreement with a third party regarding the Work, the Author warrantshereby he/she has obtained any necessary permission from this third party to let ChalmersUniversity of Technology store the Work electronically and make it accessible on theInternet.
Alexander Altby, Davor Majdandzic.
c©Alexander Altby, June 2014.
c©Davor Majdandzic, June 2014.
Examiner: Johan Karlsson.
Chalmers University of TechnologyDepartment of Computer Science and EngineeringSE-412 96 GothenburgSwedenTelephone + 46(0)31-772 1000
Department of Computer Science and EngineeringGothenburg, Sweden June 2014

ABSTRACT
Abstract
This thesis presents the design and implementation of a prototype for a drive-by-wiresystem in road vehicles. The prototype extends an existing (non-fault-tolerant) prototypewith fault tolerance by implementing distributed brake system and dual modular redundancyfor a central control unit. The steering is made redundant by utilizing the distributedbrakes and using the braking capability on either side of the car. This will cause the car toturn in corresponding direction, i.e., steer-by-brakes. A hardware monitor is designed andimplemented in the redundant central control units. The purpose of the hardware monitoris to restart the control unit in case of a failure.
The non–fault-tolerant prototype is being used as a reference design when analysing thereliability and safety of the fault tolerant design. An analysis is made to verify the lowestfailure rate that the design must tolerate in order to meet a target reliability of 99.999%after 10 years. The thesis follows the guidelines of the standard for functional safety in roadvehicles, ISO 26262.
i

ABSTRACT
ii

ACKNOWLEDGMENTS
Acknowledgements
Special thanks to Behrooz Sangchoolie, PhD student in the fault tolerance area at ChalmersUniversity, for the technical support, helping with the report, giving continuous feedback andproviding his technical expertise in the fault tolerant area.
Also, thanks to Johan Karlsson, professor in dependable Real-Time Systems at Chalmers Uni-versity, for assisting with his technical expertise in the fault tolerant area and being the examinerfor this thesis.
We would also like to thanks the attendants of the reading group regarding the ISO 26262;Behrooz Sangchoolie, Pierre Kleberger, Fatemeh Ayatolahi and Aljoscha Lautenbach. The learn-ing and insight of your technical expertise has raised our interest in the area of fault tolerance.You have been an influence and large part of the outcome of this thesis.
Last but not least, thanks to David Rydén at Sigma technology for accepting the proposed thesisand providing the industrial expertise in the automotive area. Also, thanks to Alexandra Angerdat Sigma technology for giving us assistance and introduction of the previous developed system.
Alexander Altby & Davor Majdandzic, Gothenburg June 2014.
iii

ACKNOWLEDGMENTS
iv

ABBREVIATIONS
ABBREVIATIONS
ADC Analog to Digital Converter
ABS Anti-lock Brake System
ASIC Application-Specific Integrated Circuit
ASIL Automotive Safety Integrity Level
CAN Controller Area Network
CCU Central Control Unit
CPLD Complex Programmable Logic Device
CPU Central Processing Unit
GPIO General-Purpose Input/Output
E/E Electrical/Electronic
ECU Electrical Control Unit
EMI ElectroMagnetic Interference
ESP Electronic Stability Program
FFA Functional Failure Analysis
HARA Hazard Analysis and Risk Assessment
HW Hardware
JTAG Join Test Action Group
LED Light Emitting Diode
LCD Liquid Crystal Display
ODE Ordinary Differential Equation
SIL Safety Integrity Level
SPI Serial Peripheral Interface
SW Software
SWIFI Software Implemented Fault Injection
v

ABBREVIATIONS
vi

CONTENTS
Contents
1 Introduction 1
2 Existing prototype 3
3 Technical background 53.1 Dependability . . . . . . . . . . . . . . . . . . . . . . . . . . . . . . . . . . . . . . 53.2 Faults, errors and hazards . . . . . . . . . . . . . . . . . . . . . . . . . . . . . . . 53.3 Degree of operation . . . . . . . . . . . . . . . . . . . . . . . . . . . . . . . . . . 63.4 Integrity level . . . . . . . . . . . . . . . . . . . . . . . . . . . . . . . . . . . . . 73.5 High Reliability . . . . . . . . . . . . . . . . . . . . . . . . . . . . . . . . . . . . . 73.6 Single-point and multiple-point faults . . . . . . . . . . . . . . . . . . . . . . . . 73.7 Techniques for fault tolerance . . . . . . . . . . . . . . . . . . . . . . . . . . . . . 83.8 Fault injection . . . . . . . . . . . . . . . . . . . . . . . . . . . . . . . . . . . . . 93.9 Architecture designs . . . . . . . . . . . . . . . . . . . . . . . . . . . . . . . . . . 9
3.9.1 Local . . . . . . . . . . . . . . . . . . . . . . . . . . . . . . . . . . . . . . 93.9.2 Centralized . . . . . . . . . . . . . . . . . . . . . . . . . . . . . . . . . . . 103.9.3 Distributed . . . . . . . . . . . . . . . . . . . . . . . . . . . . . . . . . . . 11
4 Concept phase 134.1 Item definition . . . . . . . . . . . . . . . . . . . . . . . . . . . . . . . . . . . . . 13
4.1.1 Functional concept . . . . . . . . . . . . . . . . . . . . . . . . . . . . . . . 144.1.2 Usage in different environments . . . . . . . . . . . . . . . . . . . . . . . . 15
4.2 Hazard analysis and risk assessment . . . . . . . . . . . . . . . . . . . . . . . . . 164.2.1 Hazard identification and classification . . . . . . . . . . . . . . . . . . . 174.2.2 Safety goal . . . . . . . . . . . . . . . . . . . . . . . . . . . . . . . . . . . 18
4.3 Functional safety concept . . . . . . . . . . . . . . . . . . . . . . . . . . . . . . . 194.4 Modifications to the reference design . . . . . . . . . . . . . . . . . . . . . . . . . 20
4.4.1 Distributed brake system . . . . . . . . . . . . . . . . . . . . . . . . . . . 204.4.2 Steer-by-brakes . . . . . . . . . . . . . . . . . . . . . . . . . . . . . . . . . 204.4.3 Impact analysis . . . . . . . . . . . . . . . . . . . . . . . . . . . . . . . . . 20
5 Product development 235.1 System design . . . . . . . . . . . . . . . . . . . . . . . . . . . . . . . . . . . . . . 235.2 Hardware design . . . . . . . . . . . . . . . . . . . . . . . . . . . . . . . . . . . . 24
5.2.1 Duplex-modular redundancy for central control unit . . . . . . . . . . . . 245.2.2 Error detection . . . . . . . . . . . . . . . . . . . . . . . . . . . . . . . . . 255.2.3 Reset handling . . . . . . . . . . . . . . . . . . . . . . . . . . . . . . . . . 25
5.3 Software design . . . . . . . . . . . . . . . . . . . . . . . . . . . . . . . . . . . . . 26
6 Safety validation 296.1 Overview . . . . . . . . . . . . . . . . . . . . . . . . . . . . . . . . . . . . . . . . 296.2 System reliability . . . . . . . . . . . . . . . . . . . . . . . . . . . . . . . . . . . 30
6.2.1 Central control unit . . . . . . . . . . . . . . . . . . . . . . . . . . . . . . 316.2.2 Brake-and-steer system . . . . . . . . . . . . . . . . . . . . . . . . . . . . 37
6.3 System safety . . . . . . . . . . . . . . . . . . . . . . . . . . . . . . . . . . . . . . 43
7 Implementation 477.1 Software . . . . . . . . . . . . . . . . . . . . . . . . . . . . . . . . . . . . . . . . . 47
7.1.1 Tasks . . . . . . . . . . . . . . . . . . . . . . . . . . . . . . . . . . . . . . 477.1.2 Voting . . . . . . . . . . . . . . . . . . . . . . . . . . . . . . . . . . . . . 497.1.3 Recapture of steering value . . . . . . . . . . . . . . . . . . . . . . . . . . 50
vii

CONTENTS
7.1.4 Determination of a failed central control unit . . . . . . . . . . . . . . . . 517.2 Hardware . . . . . . . . . . . . . . . . . . . . . . . . . . . . . . . . . . . . . . . . 52
7.2.1 Primary and backup central control unit . . . . . . . . . . . . . . . . . . . 527.2.2 Hardware monitor . . . . . . . . . . . . . . . . . . . . . . . . . . . . . . . 537.2.3 Development platforms . . . . . . . . . . . . . . . . . . . . . . . . . . . . . 567.2.4 Electronic control unit for the distributed-brake . . . . . . . . . . . . . . . 56
8 Timing analysis 578.1 Existing prototype . . . . . . . . . . . . . . . . . . . . . . . . . . . . . . . . . . . 578.2 Fault-tolerant prototype . . . . . . . . . . . . . . . . . . . . . . . . . . . . . . . . 59
9 Test and verification 659.1 Software implemented fault injections . . . . . . . . . . . . . . . . . . . . . . . . 66
9.1.1 Testing the functionality of hardware monitor . . . . . . . . . . . . . . . . 669.1.2 Testing the functionality of majority voter . . . . . . . . . . . . . . . . . . 669.1.3 Testing the functionality of median voter . . . . . . . . . . . . . . . . . . . 67
9.2 Pin fault injection . . . . . . . . . . . . . . . . . . . . . . . . . . . . . . . . . . . 67
10 Discussion 69
11 Conclusion and future work 71
viii

LIST OF FIGURES
List of Figures
2.1 System overview of the non-fault-tolerant drive-by-wire system . . . . . . . . . . 32.2 Block diagram of the non-fault-tolerant drive-by-wire system . . . . . . . . . . . . 32.3 Block diagram of the reference drive-by-wire system . . . . . . . . . . . . . . . . 43.1 Flowchart showing how fault propagates . . . . . . . . . . . . . . . . . . . . . . . 63.2 Local architecture . . . . . . . . . . . . . . . . . . . . . . . . . . . . . . . . . . . . 103.3 Centralized architecture . . . . . . . . . . . . . . . . . . . . . . . . . . . . . . . . 113.4 Distributed architecture . . . . . . . . . . . . . . . . . . . . . . . . . . . . . . . . 124.1 Overview of the safety life cycle for the concept phase . . . . . . . . . . . . . . . 134.2 Use case of the items . . . . . . . . . . . . . . . . . . . . . . . . . . . . . . . . . . 144.3 The interaction between the elements of the items . . . . . . . . . . . . . . . . . . 154.4 Safety requirements . . . . . . . . . . . . . . . . . . . . . . . . . . . . . . . . . . . 194.5 Use case of the modified items . . . . . . . . . . . . . . . . . . . . . . . . . . . . . 214.6 The modified items’ interaction with the different subsystem . . . . . . . . . . . . 215.1 Overview of the safety life cycle for the product development . . . . . . . . . . . 235.2 Centralized architecture for the drive-by-wire used in the reference design . . . . 245.3 Distributed architecture used in the fault-tolerant design . . . . . . . . . . . . . . 245.4 Distributed-reset design for the central control unit . . . . . . . . . . . . . . . . . 265.5 Self-reset design for the central control unit using a hardware monitor . . . . . . 265.6 Software design of the safety mechanisms in the central control unit . . . . . . . . 276.1 Fault tree of the reference system . . . . . . . . . . . . . . . . . . . . . . . . . . . 306.2 Fault tree of the fault-tolerant system . . . . . . . . . . . . . . . . . . . . . . . . 306.3 Markov model of the central control unit for the reference system . . . . . . . . . 316.4 Markov model of the central control units for the fault-tolerant system . . . . . . 326.5 Reliability for the central control unit of the previous and fault-tolerant system . 346.6 Reliability for the fault-tolerant system’s central control unit using ideal coverage 356.7 Reliability for the fault-tolerant system’s central control unit using a coverage of
99% . . . . . . . . . . . . . . . . . . . . . . . . . . . . . . . . . . . . . . . . . . . 356.8 Reliability for the fault-tolerant system’s central control unit using a coverage of
98% . . . . . . . . . . . . . . . . . . . . . . . . . . . . . . . . . . . . . . . . . . . 366.9 Reliability for the fault-tolerant system’s central control unit using a coverage of
95% . . . . . . . . . . . . . . . . . . . . . . . . . . . . . . . . . . . . . . . . . . . 366.10 Markov model of the brake-and-steer system for the reference design . . . . . . . 376.11 Markov model of the brake-and-steer system for the fault-tolerant design . . . . . 386.12 Reliability for the brake-and-steer system of the reference and fault-tolerant system 406.13 Intersection points for of the systems . . . . . . . . . . . . . . . . . . . . . . . . . 416.14 Reliability of the brake-and-steer system for the fault-tolerant design using ideal
coverage . . . . . . . . . . . . . . . . . . . . . . . . . . . . . . . . . . . . . . . . . 426.15 Reliability of the brake-and-steer system for the fault-tolerant design using a cov-
erage of 99% . . . . . . . . . . . . . . . . . . . . . . . . . . . . . . . . . . . . . . 426.16 Reliability of the brake-and-steer system for the fault-tolerant design using a cov-
erage of 97% . . . . . . . . . . . . . . . . . . . . . . . . . . . . . . . . . . . . . . 436.17 Markov model with safe state for the throttle system . . . . . . . . . . . . . . . . 446.18 Markov model with safe state for the CCU system . . . . . . . . . . . . . . . . . 456.19 Markov model with safe state for the brake-and-steer system . . . . . . . . . . . . 467.1 Overview of the fault-tolerant prototype . . . . . . . . . . . . . . . . . . . . . . . 477.2 Flow chart of the tasks in the fault-tolerant prototype . . . . . . . . . . . . . . . 487.3 Overview of the functionality for throttle-by-wire and brake-by-wire . . . . . . . 487.4 Messages on CAN bus to recapture steering value. . . . . . . . . . . . . . . . . . 517.5 Messages on CAN bus to recapture steering value when both CCUs startup at the
same time . . . . . . . . . . . . . . . . . . . . . . . . . . . . . . . . . . . . . . . . 51
ix

LIST OF FIGURES
7.6 Hardware implementation of the fault-tolerant system . . . . . . . . . . . . . . . 527.7 Picture of the implemented main central control unit . . . . . . . . . . . . . . . . 537.8 Picture of the backup central control unit . . . . . . . . . . . . . . . . . . . . . . 537.9 Picture of the hardware monitor . . . . . . . . . . . . . . . . . . . . . . . . . . . 537.10 State diagram of the hardware monitor . . . . . . . . . . . . . . . . . . . . . . . . 547.11 State transition of the hardware monitor when a glitch occurs . . . . . . . . . . . 547.12 State transition of the hardware monitor when a transient fault occurs . . . . . . 547.13 State transition of the hardware monitor when a permanent fault occurs . . . . . 557.14 Function of the hardware monitor when time between failures in the central control
unit is 40 ms . . . . . . . . . . . . . . . . . . . . . . . . . . . . . . . . . . . . . . 557.15 Function of the hardware monitor when time between failures in the central control
unit is 60 ms . . . . . . . . . . . . . . . . . . . . . . . . . . . . . . . . . . . . . . 557.16 Function of the hardware monitor when time between failures in the central control
unit is 80 ms . . . . . . . . . . . . . . . . . . . . . . . . . . . . . . . . . . . . . . 567.17 Function of the hardware monitor when time between failures in the central control
unit is 100 ms . . . . . . . . . . . . . . . . . . . . . . . . . . . . . . . . . . . . . . 567.18 Picture showing the prototype of the brake ECU . . . . . . . . . . . . . . . . . . 568.1 Run time for the steering task in the existing prototype . . . . . . . . . . . . . . 588.2 Run time for the throttle task, brake task and CAN task, in the existing prototype 588.3 Overview of the run times for all periodic tasks in the existing prototype . . . . . 598.4 Overview of the run time for the Brake (or Thottle) task in the fault-tolerant
prototype . . . . . . . . . . . . . . . . . . . . . . . . . . . . . . . . . . . . . . . . 608.5 Detailed run time for one sensor reading for the brake and throttle tasks in the
fault-tolerant prototype . . . . . . . . . . . . . . . . . . . . . . . . . . . . . . . . 618.6 Run time for the CAN_RX (CAN receive) task in the fault-tolerant prototype . 628.7 Run time for the CAN_TX (CAN transmit) task in the fault-tolerant prototype 628.8 Run time for the watchdog task in the fault-tolerant prototype . . . . . . . . . . 638.9 Run time for all tasks, in the fault-tolerant prototype . . . . . . . . . . . . . . . . 649.1 Overview of the functional testing of the fault-tolerant prototype . . . . . . . . . 66
x

LIST OF TABLES
List of Tables
3.1 Required failure rate according to the Safety Integrity Level . . . . . . . . . . . . 74.1 The items of the drive-by-wire system and description of their functionality . . . 144.2 Environmental impact . . . . . . . . . . . . . . . . . . . . . . . . . . . . . . . . . 164.3 Description of the injury impact . . . . . . . . . . . . . . . . . . . . . . . . . . . . 164.4 Description of the probability of exposure . . . . . . . . . . . . . . . . . . . . . . 164.5 Description of the controllability . . . . . . . . . . . . . . . . . . . . . . . . . . . 174.6 Hazard identification and ASIL determination . . . . . . . . . . . . . . . . . . . . 174.7 ASIL determination . . . . . . . . . . . . . . . . . . . . . . . . . . . . . . . . . . 185.1 Mechanisms for error detection at software level . . . . . . . . . . . . . . . . . . . 266.1 Example values for transient failure rates for different ASIL . . . . . . . . . . . . 336.2 Example values for random hardware failures . . . . . . . . . . . . . . . . . . . . 337.1 Id for the different CAN messages . . . . . . . . . . . . . . . . . . . . . . . . . . . 498.1 An overview of the run time for the tasks in the existing prototype . . . . . . . . 598.2 Overview of the run time for the tasks in the fault-tolerant prototype . . . . . . . 64
xi

LIST OF TABLES
xii

1 INTRODUCTION
1 Introduction
One of the next big things in vehicle industry is self-driving cars or autonomous cars. Anautonomous car require that actuators that control the motion of the vehicle, can be interactedwith electronically. Therefore a drive-by-wire system is needed. A drive-by-wire system replacesthe mechanical systems in a traditional vehicle by using electrical/electronic (E/E) systems toperform fundamental vehicle functions.
The drive-by-wire system includes steer-by-wire, brake-by-wire and throttle-by-wire. The "by-wire" expression means that the information, from the sensor to the actuator of the differentsystems, is transferred electronically through wires and not by traditional hydraulic systems ormechanically through struts or shafts.
The advantage of using drive-by-wire rather than mechanical systems is that reduction of cost,moving parts and weight can be achieved. Since the steering rack can be removed, the car’sshock impact, in case of a collision, can be improved. Using an electrical based system will alsoincrease the information flow and ease up the interconnect between different components in thecar, facilitating the use of safety functions such as; ABS (anti-lock brake system), ESP (electronicstability programme), etc.
Electromagnetic interference (EMI) [1] and ionizing radiation [2][3] are two examples of errorsources that may introduce failure to an integrated circuit in an E/E system. The systemsthat constitute the functionality of the drive-by-wire system must be able to handle the failuresin a predictable way, since losing the control of a car in high velocity may notoriously end inlethal outcome. Therefore, the drive-by-wire system needs to be as fault tolerant as reasonablypossible.
Safety can be achieved by introducing safety mechanisms in vital components of the drive-by-wire system. The safety mechanisms will have to target faults that can put the drive-by-wiresystem in a state which may have lethal outcome for the driver or other road users. A standardfor functional safety in road vehicles, ISO 26262 [4], was released November 2011 to provide thevehicle industry with guidelines on how to developing safe-critical applications in a vehicle.
This thesis deals with the development of a fault-tolerant architectural design for a drive-by-wiresystem. By following the guidelines of the ISO 26262 standard, this thesis targets possible failsources and how to deal with them in the drive-by-wire system. A safety analysis is made toensure that the reliability and safety of the designed system is improved.
An implementation of a prototype for a fault-tolerant design is also made to demonstrate thefeasibility of the proposed architecture. The prototype was implemented by extending an existingnon-fault-tolerant prototype developed in the thesis made by Angerd and Johansson2. The designof the non-fault-tolerant prototype is used as a reference when comparing the reliability and safetyimprovements in the system where fault tolerant is designed.
This thesis makes the following contributions:
• Proposition of a fault-tolerant architectural design. The design consists of a distributedbrake system with steer-by-brake functionality and redundancy in vital units.
• Reliability analysis showing how a required reliability can be achieved for the fault-tolerantdesign. The analysis proposes a Markov model for the design and compares it to a non-fault-tolerant design. Further, a safety analysis is proposed showing the steady-state safetyof the fault-tolerant design.
• Realization of a prototype to show the feasibility of the proposed architecture. The pro-totype shows the key components contributing to the fault tolerance in the architecture.
1

1 INTRODUCTION
The key components are the hardware monitor, the fault detection mechanisms and thefailure avoidance mechanisms.
The content of this thesis is outlined as follows: Section 2 explains the non-fault-tolerant drive-by-wire system made by earlier thesis students. Section 3 describes the background and theoryof the different techniques used in this thesis. Section 4 is the concept phase in which the itemsof the drive-by-wire system are defined. Certain risks and hazards is also identified in section4. The methods which is to be applied to the items, in order to prevent the risks and hazardsfrom occurring, is presented in section 5. Section 6 shows that the safety strategies applied tothe fault-tolerant design increases the reliability and safety compared to the reference design.Section 7 presents how the safety mechanisms and methods is implemented. A timing analysis isrepresented in section 8 in order to show how the implemented methods and mechanisms effectsthe execution time of the software. In section 9, the safety mechanisms are tested and verified.Finally a discussion and conclusion is made in section 10 and 11.
2

2 EXISTING PROTOTYPE
2 Existing prototype
The fault-tolerant drive-by-wire prototype is based on an earlier master’s thesis project madeby Angerd and Johansson [5]. The existing prototype consists of a central control unit (CCU),ECUs for the steering, brake and throttle systems and sensors for the driver input. An overviewof the non-fault-tolerant design is shown in Figure 2.1.
������
���
���������
��
������������
�� ���
�� ���������
��
�������
�� �����������������
��
��
�����
�����
���������
��������
��������
�����
���������
��������
Figure 2.1: System overview of the non-fault-tolerant drive-by-wire system. The steering wheeland pedals for brake and throttle, consists of the system’s sensors.
A block diagram of the reference drive-by-wire system is shown in Figure 2.2. The three sensorsfor throttle, brake and the steering are connected to the central control unit (CCU). The CCU isconnected to two electronic control units (ECUs) via a controller area network (CAN) bus, oneECU for throttle and brake and another one for steering. The two ECUs are connected to theactuators controlling the rear-wheel drive and steering.
���
�������
�����
��������
�����
�����
�����
���
�������
���
��������
��������
�����
�������� ������
��������
���������
������������
Figure 2.2: Block diagram of the non-fault-tolerant drive-by-wire system made by previous thesisstudents.
3

2 EXISTING PROTOTYPE
The CCU is implemented on a Texas Instruments Hercules development board, TMS570LS3137[6]. It uses an operating system called FreeRTOS [7] which is an open-source real-time kernel.The sensors for brake and throttle are connected to two AD converters on the development boardof the CCU. The steering wheel is connected to two general-purpose–I/O pins on the developmentboard. The development board also has a CAN interface which enables for CAN communicationfrom the CCU to the ECUs.
The ECU for brake/throttle is implemented on an 8-bit Atmega [8]. Since the Atmega does nothave a CAN interface, a separate SPI to CAN circuit is used. A servo and an LED array is usedto represent the brake value. An LED array and an electric motor connected through a H-bridgeto the CPU represents the throttle value. An LCD display is also connected to the CPU whichdisplays the current brake and throttle values. A similar ECU used for brake/throttle is alsoused for steering without the LED arrays, H-bridge and electric motor [5].
To do a fair comparison between the fault-tolerant design and the design of the existing prototype,a reference drive-by-wire system is defined. The non-fault-tolerant system, hereinafter referredto as reference system, is shown in Figure 2.3
���
�������
�����
��������
�����
�����
�����
���
��������
��������
�����
��������
������
��������
�������
���
��������
���
������
���
Figure 2.3: Block diagram of the reference drive-by-wire system with no fault tolerance.
Compared to the previous system, shown in Figure 2.2, the reference system has separated brakeand throttle ECU.
4

3 TECHNICAL BACKGROUND
3 Technical background
This sections explains the concept of fault tolerance. Common attributes that are used to measurea system’s ability to avoid failures, are stated and explained. The concept of a hazardous eventand how a system can propagate to such a state is further explained. Different techniques offault injections in order to test the robustness of a system, are also explained. Definition of, anddifference between, single-point fault and multiple-point faults are described. Different techniquesin order to increase safety, such as; voting, redundancy and fault avoidance and forecasting areelaborated. Overview of local, central and distributed architecture designs are also elaboratedon and explained in this section.
3.1 Dependability
Dependability is the system’s ability to avoid failures. Dependability is described using fourdifferent attributes according to [9][10]. The following four attributes are:
• Availability - Readiness for usage. The probability that the system will work as intendedat any given time.
• Reliability - Continuity of service without failure. The probability that the system willwork as intended under a specific time.
• Safety - The probability of avoiding a catastrophic event.
• Maintainability - Ability to handle repairs, modifications and updates.
In a drive-by-wire system all of these can be of importance. Since a poor reliability and safetyin the drive-by-wire system can harm the driver, these are the highlighted attributes in thisthesis.
3.2 Faults, errors and hazards
A hazard is the occurrence of an event that puts people in risk of danger [9]. Example of ahazard is loosing a wheel of the vehicle when driving. This event puts the driver, pedestrians orother road users at risk of getting injured. A hazard occurs when a fault propagates to an errorthat is not covered by safety mechanisms in a system.
A fault is either a random event (e.g. a bit-flip or frozen memory bit) or a systematic event(e.g. bug in a code) in a system or subsystem. The duration of faults can be categorized intothree groups; transient faults, intermittent faults and permanent faults [9]. Transient faults arefaults that appear and disappears under a short period of time. Example of a transient fault is atemporary random bit-flip in the memory. Intermittent faults are faults that appears sporadically.The source of an intermittent fault is therefore usually hard to discover. Intermittent faults canbe caused by cold soldering or loose connectors. Permanent faults are the kind of faults thatwhen they occur, they remain indefinitely [9]. Electromigration [11] and design faults are twoexamples of permanent fault sources.
An error is when the fault propagates and changes the output of the system in such way that itbehaves in an unwanted manner [12]. An example could be when a bit flip occurs in a memorycell that stores the current steering value. If there is no safety mechanism to detect that fault,the fault will result in an error when the steering value is sent to the electronic control unit(ECU) for steering.
5

3 TECHNICAL BACKGROUND
A fault can either be latent or active [12]. When latent, the fault does not directly alter thesystems behaviour in such way that it causes an error. A latent fault may however, in combinationwith another fault, propagate to an error. See multiple-point faults, section 3.6. When a fault isactive, the system is altered from its correct behaviour and creates an error. If the system cannot handle the error, i.e., an un-covered fault, system failure will occur. The system failure caneither propagate to a fail-safe state or a critical failure which is interpreted as a hazard. In somecases the fail-safe state can be achieved by turning off the system. When a system failure occursin a subsystem, the failure may propagate to higher system levels and cause faults. This mayresult in failure of the whole system. [12]
Figure 3.1 shows a flowchart of how a system is exposed to a fault, how the fault can propagateto an error and how the result of this propagation can result in a system failure. The systemfailures; fail safe and critical failure, are further elaborated in section 3.3.
����������� ��� ������
���������
�� ����
����������
�� ���� ���������� �
���������
�������
���� �
�������
��
�������
��
Figure 3.1: Flowchart showing how a fault propagates to an error and leads to a failure in asystem.
3.3 Degree of operation
In fault tolerance there exists four types of degrees explaining a system’s current ability ofoperation after one fault [13]. These degrees are:
• Fail operational - System is still operational after a fault.
• Degraded operational - System is operational but at degraded functionality after a fault.Degraded operation refers to an acceptable operation that alters from the correct systembehaviour. An example of degraded operational is loosing control of one brake actuator ina car’s brake system. Since three out of four brake actuators still are functional, the brakesystem is at degraded mode.
• Fail safe - System at safe operation after a fault. Safe operation is when the system goes toa safe operational state in order to prevent critical failure. Safe operation may for examplebe fail silent. Fail silent is when the system does not send output data in case of failure,which is in some cases a better alternative than sending faulty data.
• Critical failure - System at critical operation after a fault. A critical operation is a faultthat propagates through the system and results in a failure. The failure makes the systemdiffer from its correct behaviour so that it may result in a catastrophic event. An exampleof a critical failure is loosing the steering functionality in a vehicle.
6

3 TECHNICAL BACKGROUND
3.4 Integrity level
Nuclear plants, airplanes, vehicles and toasters are all systems where safe operation is of impor-tance. The safety clearly involves the risk of potential hazardous events, usage of the system andthe severity if a hazard occurs. Since different requirements are needed for different safety sys-tems the concept of integrity level arises. Safety integrity level (SIL) is based on the probabilityof a system to perform its intended functions within a period of time [9].
The SIL determines the required failure rate of the given system. The international standardconcerning E/E and programmable electronic devices are known as IEC 1508 [14][9]. The failurerates for the continues mode of operation, according to the standard, is stated in table 3.1.
Table 3.1: Required failure rate according to the Safety Integrity Level (SIL) according to thestandard IEC 1508 [9].
SIL Failure per year4 ≥ 10−5 to < 10−4
3 ≥ 10−4 to < 10−3
2 ≥ 10−3 to < 10−2
1 ≥ 10−2 to < 10−1
With the arising of the standard ISO 26262 [4], safety integrity level for automotive vehicles hasbeen assessed. The Automotive Safety Integrity Level (ASIL) is assessed from the hazardousoutcome related to the failure of a system. Each hazardous event is assessed from the outcomebased on severity of the injuries, amount of time the system is exposed to the possibility ofthe hazardous event of occurring, and the controllability that the driver can act to prevent anyinjuries. The hazardous event is then assigned an ASIL according to the ISO 26262 standard.The ASILs are classified A, B, C, D and QM. ASIL D is classified for the most severe hazardsand A for least severe. Quality Managment (QM) is set to a system where there is no safetyrequired. The ASIL is further explained in section 6 of this thesis.
3.5 High Reliability
This section elaborates the term of high reliability of a system that is used in this thesis. Asystem’s failure rate is considered to be improbable if it has a failure rate lower than 10−9
failures/hour [13][9].
This thesis suggests a high reliability to be the same as the lowest reasonable failure rate fora simplex system. By calculating the system reliability for one year using an exponentiallydistributed model for a simplex system, a high reliability of 99.999% (five-nines) is reached. Thisis considered to be a reasonable value for a high reliability system.
3.6 Single-point and multiple-point faults
A single-point fault is the kind of fault that violates the safety goal of the system according topart 1 of ISO 26262 [4]. Therefore it is of importance to cover as many single-point faults aspossible with safety mechanisms in order to prevent them from propagating into a failure. Anexample of a single-point fault in Figure 2.2 is if the communication bus gets disconnected. Ifthe CCU cannot communicate with the ECUs, this will cause the whole system to fail.
7

3 TECHNICAL BACKGROUND
Amultiple-point fault is when the occurrence of multiple independent faults may violate the safetygoal, according to part 1 of ISO 26262 [4]. The safety goal is violated when the system entersthe state of critical failure. When there exists a safety mechanism that is designed to preventa certain failure to violate the safety goal, this certain failure will be classified as; detected,perceived or latent. If the failure mode is detected by the safety mechanism it is classified asdetected. If the failure is not detected by the safety mechanism but perceived by the user, itis classified as perceived. If the failure is neither detected or perceived, it is to be classified aslatent. A latent fault does not directly cause the system to fail. However, in combination withthe failure of another subsystem, the latent fault may become active and cause the whole systemto fail, i.e., a multiple-point fault. It is stated in ISO 26262 that only two independent faults areto be considered for multiple-point faults unless they are shown to be of relevance.
3.7 Techniques for fault tolerance
To make a system more safe and reliable, safety mechanisms have to be added for the system to beable to tolerate certain faults, and prevent the system from propagating to a critical failure. Thissection describes different techniques for increasing the reliability of a system. Fault tolerance canbe implemented in both hardware (HW) and software (SW). HW implemented fault tolerancecan be made by utilizing duplex-modular redundancy or a lock-step CPU to detect a fault [9]. Thecombination of triple-modular redundancy and a hardware voter can be used in order to preventa failure. Fault tolerance implemented in SW can be established by implementing temporalredundancy, information redundancy, voting and/or forecasting [9].
Temporal redundancy is when information is processed multiple times, in different aspects oftime, and use voting to ensure that the system has not been introduced to any effects causingincorrectness. This adds protection against transient faults such as bit flips in a register etc.
Information redundancy is to store several copies to ensure that the information is not beingaltered. A voting algorithm, e.g. majority voting, is used to decide which value is the correctone.
The use of duplex-modular redundancy in HW means to provide a backup system to increasesafety. The backup system can either work in hot-stand-by (backup system working in parallel),warm-stand-by (backup system getting check-points) and cold-stand-by (backup system startswhen primary unit fails). Using triple-module redundancy is to provide two backup systems.If one of the systems should fail, the other two can still work as a duplex-modular redundantsystem. By adding a redundant backup system, the overall safety is increased. However, byintroducing more components, the fail rate is also increased. An analysis has to be made toensure that the fail rate does not increase more than the overall safety of the system. In thatcase, there is no need to add a redundant system in the first place.
A lock-step CPU is a fault-detection technique used to increase the safety of a system. Lockstep uses several identical CPUs and compares the outcome of each CPU. If the outcome of oneCPU differs from the other CPUs, this CPU is to be treated as faulty. If the outcome differs ina lock-step system with only two CPUs, it is still possible to say that a failure is detected butnot which of the two CPUs that is incorrect. This technique can be used to prevent a fault frompropagating to a failure. For example, if a fault occurs in one of the CPUs such as a bit flip ina memory cell or register, fault detection is made by the lock-step technique. Since the fault isdetected, the system’s safety mechanism can prevent system failure.
Voting in software corresponds to reading information multiple times or from different sources(providing the same information). The information is then analyzed using a voting algorithmto ensure that the correct, or most probable, value is returned. When using majority voting to
8

3 TECHNICAL BACKGROUND
retrieve the correct value of an input, fault detection can be made if the majority of the valuesdiffer from each other. Fail prevention can be made only if a majority of the values are the same.For example, if two out of three values are the same, fail prevention is established.
In addition to the triple-modular redundant system, an external hardware voter can be used.The output from the three modules can be compared and the vote can occur instantly. Ahardware voter adds to the system cost and complexity which may increase the total fail rate ofthe system.
Forecasting refers to predicting an output when input information differs. This can especiallybe good when checking the correctness of the value for fault detection. Another way can be topredict a correct value to avoid critical failures. This could be better than potentially sendingbad information which can propagate to catastrophic events in the whole system.
3.8 Fault injection
Fault injection is a method for testing and verifying the robustness of a system, and to verify theeffectiveness of the fault tolerant mechanisms. By introducing faults such as bit flips in registersor memory, one can analyse whether the system detects the fault or not. If a fault is detected,the system should be able to either prevent it from propagating or continue to a safe state.There exist mainly four types of fault injection techniques to test and verify the robustness ofsystems. These are software-implemented fault injection, physical-implemented fault injection,radiation-implemented and simulation-based fault injection [15].
In physical-implemented fault injection, two common techniques are pin-level fault injection andtest port-based fault injection. Pin-level fault injection can be done by using a probe to forcedifferent signals to high or low on circuit level. In test port-based fault injection, test access portsare used to interact with the integrated circuit to inject bit flips into memory and registers.
Software-implemented fault injection can either be made on runtime or pre runtime. On preruntime the instructions or predefined values are altered. Runtime software-implemented faultinjections demands additional software which in its turn injects faults to the system.
Radiation-implemented fault injection can be done by exposing the system to electromagneticinterference or heavy-ion radiation.
Simulation-based fault injection is technique for making a model of the original system and testingit in a virtual environment. For example, when testing a power plant it is not wise to put thereactor in a potentially critical state when testing it. Instead simulation-based testing is used,where the system’s environment is simulated.
3.9 Architecture designs
This section explains different architectures for a drive-by-wire system described in "On dis-tributed control-by-wire system for critical applications" by Roger Johansson [13]. The threearchitectures explained are the local, centralized and distributed architectures.
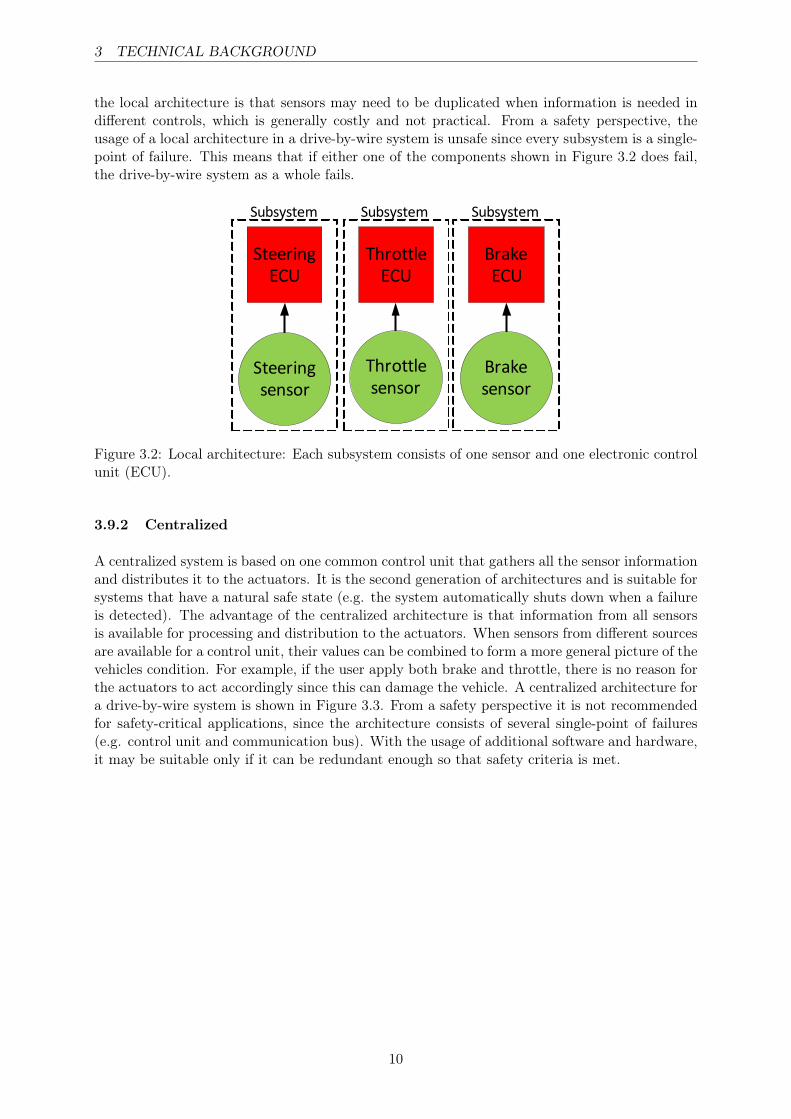
3.9.1 Local
A local architecture is shown in Figure 3.2. It is the first generation of architectures and issimple for understanding, designing and implementing. Each subsystem contains its own sensorand electronic control unit (ECU) which is connected to the actuator. The disadvantages with
9
3 TECHNICAL BACKGROUND
the local architecture is that sensors may need to be duplicated when information is needed indifferent controls, which is generally costly and not practical. From a safety perspective, theusage of a local architecture in a drive-by-wire system is unsafe since every subsystem is a single-point of failure. This means that if either one of the components shown in Figure 3.2 does fail,the drive-by-wire system as a whole fails.
���������
���
��������
��
�������
��
������
��
��������
���
������
���
��������� ��������� ���������
Figure 3.2: Local architecture: Each subsystem consists of one sensor and one electronic controlunit (ECU).
3.9.2 Centralized
A centralized system is based on one common control unit that gathers all the sensor informationand distributes it to the actuators. It is the second generation of architectures and is suitable forsystems that have a natural safe state (e.g. the system automatically shuts down when a failureis detected). The advantage of the centralized architecture is that information from all sensorsis available for processing and distribution to the actuators. When sensors from different sourcesare available for a control unit, their values can be combined to form a more general picture of thevehicles condition. For example, if the user apply both brake and throttle, there is no reason forthe actuators to act accordingly since this can damage the vehicle. A centralized architecture fora drive-by-wire system is shown in Figure 3.3. From a safety perspective it is not recommendedfor safety-critical applications, since the architecture consists of several single-point of failures(e.g. control unit and communication bus). With the usage of additional software and hardware,it may be suitable only if it can be redundant enough so that safety criteria is met.
10

3 TECHNICAL BACKGROUND
���������
���
����� ��
���
�����
���
���
��������
���
������
���
����� �
���
��
Figure 3.3: Centralized architecture: The system concists of one central control unit (CCU) forall the sensors and electronic control units (ECUs).
3.9.3 Distributed
The distributed architecture is the third generation of architectures and is shown in Figure3.4. It is the most highly recommended architecture for safe-critical systems according to "Ondistributed control-by-wire system for critical applications" by Roger Johansson [13].
Compared to the centralized architecture, the distributed architecture divides functions into subfunctions. This arises several redundancies and increases safety for a vehicle. One example is tohave distribution in the brake system. When distributing the brakes into two electronic controlunits (ECUs), one ECU controlling the brake actuators on the front right wheel and back leftwheel, brake system 1, and the other ECU controlling the brake actuators on the front left wheeland back right wheel, brake system 2. If brake system 1 fails, the vehicle still has degradedfunctionality in the brakes. When distributing brakes to all four wheels, degraded steering canbe obtained when main steering system has failed. This gives additional redundancy to thedrive-by-wire system in both the brakes and steering. The concept of steer-by-brakes is furtherelaborated in section 4.4.2.
11

3 TECHNICAL BACKGROUND
���
�������
�����
��������
�����
������
�����
�������
���
��������
���
���
�����
�����
�����
�����
Figure 3.4: Distributed architecture: The brake ECU is distributed to control the brakes on eachside of the vehicle.
12

4 CONCEPT PHASE
4 Concept phase
Before implementing a system, this thesis follows the guidelines of the concept phase describedin part 3 of the ISO 26262 standard [4]. Figure 4.1 shows the overview of the safety life cycle ofthe ISO 26262 standard. The dashed marked phases are not included in this report. This sectiondeals with the concept phase of the safety life cycle.
First, an item definition is made where the reference system is described at functional level.Then the initiation of the safety life cycle is analysed, to determine if a new development shouldbe initiated or a modification of the reference system will be made. A hazard analysis andrisk assessment is then made of the reference system to determine the hazardous events. Eachhazardous event is then classified to an ASIL according to the ISO 26262. Lastly, a functionalsafety concept is made to extract the safety goal of the developed system.
������������
��������������
����������������
����������� � �
����� ��
� � ���
��������
�����������
�����������
�����������
� ��������
�������
��������
��������
������
� � ���
����� �����
�������
�������� ��������
��������
����������������
���
���������������
���������
��� ��
����
��������
������
����� �����
�
Figure 4.1: Overview of the safety life cycle for the concept phase. Phases marked with a dashedframe are not included in the thesis.
4.1 Item definition
An item is one or several systems that implement a function at vehicle level. An element refersto electrical and electronic (E/E) components of the system or other technologies1. An item isbuilt of one or several elements. The items that constitutes the drive-by-wire system is: steer-by-wire, brake-by-wire and throttle-by-wire. These items and their functions are further describedin Table 4.1. The functionality of the drive-by-wire system is considered failed if either of theseitems fail.
1other technologies refers to technologies that are out of the scope of the ISO 26262 standard, such as hydraulicor mechanical technologies [4].
13

4 CONCEPT PHASE
Table 4.1: The items of the drive-by-wire system and description of their functionality.
Item Function Description of the intended functionSteer-by-wire Steer control Control the steering of the vehicleThrottle-by-wire Speed control Increase the speed of the vehicleBrake-by-wire Speed control Decrease the speed of the vehicle
4.1.1 Functional concept
This section provides information about the functional and non-functional requirements2 of thedifferent items. The purpose of the functionality is explained with a use case and the differentoperating modes are stated for the functions. The interaction between the elements of the itemsshown in Table 4.1 are explained, including the elements based on other technologies.
To understand the user’s interaction with the system, a use case is developed. Figure 4.2 showshow the user interacts with the different functions of the drive-by-wire system. Since the userneeds to be able to control the steering angle and speed regulation of the vehicle, the mainfunctions: steer control and speed control, are defined. The steer control needs to be able to steerthe vehicle right and left using the front wheels. The speed control needs to be able to increaseand decrease the speed of the vehicle. For speed interaction the vehicle consists of a throttle anda brake pedal and for steering-angle interaction the vehicle has a steering wheel.
����
������
���
��������
�����
��������
�����
�������������
���� �
������
���
������ ���
�����������
�
�
�
�
�
�
�
�
�
�
Figure 4.2: Use case of the items showing the different functions and how the user interacts withthe functions.
The drive-by-wire system have to consist of the following elements, to be able provide the func-tionality described in Figure 4.2.
• Central control unit (CCU).
• Brake and throttle electronic control unit (ECU).
• Steer ECU.
• Steering wheel and pedals including sensors.
• Communication bus.2non-functional requirement refers to criteria used to judge the operation of an item, rather than the behaviour
[4].
14

4 CONCEPT PHASE
• Brake, throttle and steering actuators.
The main purpose of the CCU is to convert the output values of the steering sensor, brakingsensor and the throttle sensor into recognizable values and transfer them using the communicationbus. Each ECU fetches the data from the communication bus of its interest. The ECU thenoutputs the value to its corresponding actuator which controls the functionality intended. Theinteraction between the different elements are shown in Figure 4.3.
������������
�� ���
�
�
�
�
�
�
�
�
�
�
���
���������
������� ������ ����
�������� ���
����������� ���������������
������������
�����������
������� �������
Figure 4.3: The interaction between the elements of the items; Steer-by-wire, Brake-by-wire andThrottle-by-wire.
The functional concept is only bounded to the functions of the drive-by-wire system. It shouldbe mentioned that the prototype of the drive-by-wire system does not include vital elements suchas power supply of the vehicle, real-sized actuators and a full sized engine or reasonable sensorsfor steering wheel and pedals. Considerations regarding these elements are to be made in realimplementation of the drive-by-wire system.
4.1.2 Usage in different environments
An analysis regarding how the environmental factors contributes to the occurrence of hazardousevents are to be established. In order to do so, different environments have to be specified andevaluated regarding the probability of exposure. Explanation of the environments the drive-by-wire system is considered to be frequently exposed to is shown in Table 4.2. The frequency isdescribed in the terms often or seldom according to part 3 of the ISO 26262 standard [4]. Oftenrefers to situation occurs during almost every drive on average. Seldom refers to the situationoccurs a few times a year for the great majority of drivers. The impact refers to the impact theenvironment has on the drive-by-wire system. Low refers to no or very small impact and highrefers to significant impact on the system. The impact on the drive-by-wire system is high onlyin manoeuvre situations. Manoeuvre situations is therefore the considered environment whenevaluating the risk in section 4.2.
15

4 CONCEPT PHASE
Table 4.2: Explanation of the environments the drive-by-wire system is considered to be exposedto.
Environment Examples of situation Frequency ImpactRoad layout Highway, secondary road, country road. Often Low
Highway exit ramp, intersection Seldom LowRoad surface Dry or wet road, asphalt. Often Low
Packed snow and ice, slippery leafs on road, gravel. Seldom LowManoeuvre Accelerating, decelerating, steering vehicle Often Highsituations Driving in reverse, parking. Seldom High
4.2 Hazard analysis and risk assessment
Based on the item definition, a hazard analysis and risk assessment (HARA) is made and safetygoals are established. The HARA determines the potential hazards of an item and safety goalscan be determined. First, the classification of the impact factors; severity, probability of exposureand controllability are elaborated for the item. From these factors an ASIL of the hazardousevents can be determined. Then a safety goal can be assigned for the item according to ISO26262 [4].
Severity is the classification of the injuries caused by the hazardous event on the driver, otherroad users or pedestrians. Severity has the classifications S0-S3 where class S0 refers to no injuriesand S3 refers to life-threatening injuries caused by the hazardous event. Table 4.3 explains howdifferent classifications are interpreted according to the ISO 26262 standard [4].
Table 4.3: Description of the injury impact for the different severity classification S0-S3.
Classification S0 S1 S2 S3Description None Light Severe Fatal
Exposure is the probability of exposure for the system or subsystem, i.e has a low exposurethat can cause the hazardous event. For example if a system is rarely used, i.e has a lowexposure, the probability of the hazardous event occurring in that system is low. Exposure hasthe classifications E0-E4, where E0 is a system that has an incredibly low exposure and E4 ahigh probability of exposure. E0 could for example be a system that is never used (e.g a systemconsidered to be used for future use), the exposure of that system is then defined as incredible.An exposure of E4 means that the system is used almost every drive on average, e.g systemsfor steering, throttle or brake. Table 4.4 shows how the different classifications are interpretedaccording to the ISO 26262 standard [4].
Table 4.4: Description of the probability of exposure of the systems that can cause the hazardousevent. The exposure is classified in E0-E4 and determination is based on operational situationof the target.
Classification E0 E1 E2 E3 E4Description Incredible Once a year Few times a year Once a month Every drive
Classification of the controllability is the plausibility that the driver, or other person at risk, cangain sufficient control to avoid the hazardous event from happening. Controllability is classifiedas C0-C3 according to Table 4.5. A controllability classification of C0 is for example when thesystem causing the potential hazardous event goes into a safe state, e.g some driver assistance
16

4 CONCEPT PHASE
systems can for instance just be turned off. A controllability classification of C3 is when drivercannot avoid the hazardous event from happening due to the system failure, e.g the brake systemstops working. Assumptions of the controllability are decided according to ISO 26262 part 3 [4].It is stated that the driver is considered to be in appropriate condition (e.g not influenced by drugsor tiredness), has proper driver training, normal physical health and reaction and complying withlegal regulations. Controllability also include the avoidance of pedestrians’ (or other road users’)actions to avoid the hazardous events.
Table 4.5: Description of the controllability of the drivers or other persons at risk to avoid thehazardous event. The controllability is classified in C0-C3.
Classification C0 C1 C2 C3Description Controllable in general Simply Normally Difficult or uncontrollable
4.2.1 Hazard identification and classification
This section identifies the hazardous events that can occur in case the item fails. To decide theASIL of different hazards that may occur in the functional level of a system, a function andfailure analysis (FFA) is made.
The FFA is shown in Table 4.6. The basic functions of the item with different class of failures,i.e., omission, commission and stuck-at value. Omission means that the function does not returna value, i.e., fail silent. Commission means that the function returns random values, sometimesreferred to as babbling idiot. Stuck-at value means that the functions returns a constant value.For each function a worst case environment and worst case failures are determine and the differentclassifications from the hazardous events are set. The worst case environments are either slowdriving in dense traffic area or high speed traffic such as a highway. The classification are: severity(S), probability of exposure (E) and controllability (C). From the classifications the ASIL areextracted using table 4.7.
Table 4.6: Hazard identification and ASIL determination based on the class of failures of theworst case environments and failures.
Function Class of failure Worst case environment/failure Classification ASILAccelerate Omission Railroad crossing / No acceleration S3,E1,C2 QM
Omission Highway / No acceleration S1,E4,C1 QMCommission City (traffic light) / Sudden acceleration S3,E4,C3 DStuck at value City / Constant acceleration S3,E4,C3 D
Brake Omission City / Loss of brake S3,E4,C3 DCommission Highway / Sudden brake S3,E4,C3 DStuck at value Highway /Constant retardation S2,E4,C2 B
Steering Omission Highway / Loss of steering S3,E4,C3 DCommission Highway /Sudden steering angle S3,E4,C3 DStuck at value Highway / constant steering angle S3,E4,C3 D
17

4 CONCEPT PHASE
Table 4.7: ASIL determination according to part 3 of the ISO 26262 standard [4].
C1 C2 C3S1 E1 QM QM QMS1 E2 QM QM QMS1 E3 QM QM AS1 E4 QM A B
S2 E1 QM QM QMS2 E2 QM QM AS2 E3 QM A BS2 E4 A B C
S3 E1 QM QM AS3 E2 QM A BS3 E3 A B CS3 E4 B C D
4.2.2 Safety goal
For each hazardous event with corresponding ASIL, a safety goal is defined in this section. Thehazardous events with their corresponding ASIL is shown in table 4.6. If information to theactuators cannot be provided correctly, the FFA presents which default message should be sentin case of system failure for the different functions. Accelerate has least severity when in omission.The least severity of brake and steering is when stuck at value. Brake function should be ableto override the throttle functions. When accelerate has a commission or stuck-at-value failure,the driver should be able to brake to avoid injury.
When the functionality is in degraded mode, i.e., one wheel unit has failed or steering hasfailed, the driver should be notified to stop the vehicle. This will sufficiently lower the riskof another failure occurring compared to having the driver driving around in a vehicle withdegraded functionality. The fault tolerant time interval should be sufficient time for the driverto slow down and pull to the side of the road. The fault tolerant time interval is the time inbetween the occurrence of a fault and a possible hazard [4].
The safety goal is to ensure that the system will not fail so that it causes a hazard. Thereforethese safety goals have been established for the item:
• The brake should be able to override throttle function.
• The brake functionality shall not fail.
• Driver should be warned when at degraded functionality.
• The throttle system needs to be fail silent in case of failure.
• The steer system needs to be stuck at value in case of failure, enabling steer-by-brakesfunctionality.
When stated functionality shall not fail, i.e., the system needs to fulfill the the highest possiblereliability in these cases.
18

4 CONCEPT PHASE
4.3 Functional safety concept
After the safety goal is determined for each item, detailed safety requirements are derived toachieve the safety goals. The safety requirements inherit the ASIL corresponding to the safetygoal. Safety goals can be achieved by combining different functions to put the driver in a safestate. For example a failure that causes full throttle can be overridden by brakes if brakes isgiven higher priority than the throttle. From the safety goals explained in section 4.2.2 and theASIL from Table 4.6 in section 4.2.1, the safety goal can be achieved by:
• Using a safe state (e.g switching off the system causing the hazardous event in case offailure).
• Consider the fault tolerant time interval (e.g a warning lamp stating to pull over to theside of the road). Reducing the exposure time in a critical event - where a hazard may ormay not occur.
• Including maximum values for unwanted changes in system. For example speed limit indegraded mode.
The safety requirements are determined for the different systems of the functions. The differ-ent systems are then connected to the different elements explained in Figure 4.4. The safetyrequirements that are supposed to be implemented in E/E are:
• Brake-overriding-throttle function in the central control unit (CCU).
• Distributed brake system in the CCU and distributed brake ECUs.
• Redundancies in both hardware and software for the CCU.
• Steer-by-brakes compatibility for the brake ECU.
• Setting steering at forward position in degraded mode to enable steer-by-brakes.
• Notification to the driver, in case of failure, to inform that the vehicle is in degraded mode.
����������� ��� �����
�����������������������
���������������������������
����
��������������������
��������������������
����������������
������������
� !"�#
#����� ���� �����
��������������������������
� !"�#
!���������������
������
������������
� !"�#
$��������������������������
������%�����������������
������
$������������������������
������������&����������
�������������'���� �����
�����% �% �����������������
(���������������
������������
� !"�#
����% �% ��������������
��������� ��������
� !"�#
������������������&������
��������� ��������
� !"�#
�����������
�������
���� �������
(����������)�(�
Figure 4.4: Safety requirements with their corresponding element, determined from the safetygoals.
The design decisions drawn from the safety goal is explained in section 5. The functional safetyis further elaborated in section 6.
19

4 CONCEPT PHASE
4.4 Modifications to the reference design
The reference drive-by-wire system with no fault-tolerance, explained in section 2, is modified fordeveloping a system that is suitable for fault-tolerance. This section explains the modificationsdone to the reference drive-by-wire system and the impacts of these modifications.
4.4.1 Distributed brake system
The reference system only contains one brake ECU. When implementing a distributed architec-ture the system can sustain a higher reliability since the distributed brakes are independent ofeach other. Therefore a modification has been made to use a distributed brake system for thedrive-by-wire system. The distributed brake system will use two ECUs to control two diagonalactuators each.
4.4.2 Steer-by-brakes
When distributing the brake system, a technology for emergency steering can be implemented.A steer-by-brake [16][17] functionality will enable the driver to, in a very limited way, turn thecar left and right using the steering wheel and the distributed brakes. This will be a criticalbackup system if the steering system suffers from a critical failure.
The distribution of the brake ECU into two ECUs that controls two actuators, makes it possibleto control the amount of brake impact on each side of the vehicle separately. By applying brakeforce to both wheels on one of the sides of the car, there will appear a difference in rotationalspeed between the both sides. This difference in rotational speed will generate a torque aroundthe center of the car, making the car slightly turn towards the side on which the brake force arebeing applied. In case of a failure in the ECU responsible for controlling the steer actuator, itis still possible to stop the car at the side of the road by utilizing the distribution of the brakes.This assumes that both brake ECUs are functional.
Another way of utilizing the distribution of the wheels to maintain steering capability, in case ofa failure in steer ECU, is to apply brake force on one of the front wheels. According to [18], thiswill generate a yaw moment on the front axis which will enable to control the steering angle ofthe front wheels. This does however assume feedback of the steering angle. It does also requirethat both brake ECUs and all brake actuators are functional.
4.4.3 Impact analysis
When modifying the reference system with a distributed brake system and steer-by-brake func-tionality, changes are made in the functionality of the system. The two modifications are impor-tant to increase the safety of the drive-by-wire system. Figure 4.5 shows the modifications tothe use case (compare with Figure 4.2) and Figure 4.6 shows the modification to the interactiondiagram (compare with Figure 4.3). The steer control is now able to control the vehicle viatraditional steering (i.e controlling the angle of the front wheels) and with distribution of thebrakes (i.e steer-by-brakes).
20

4 CONCEPT PHASE
����
������
���
��������
�����
��������
�����
�������������
���� �
������
���
��������� �
��������
���������
������
�
�
�
�
�
�
�
�
�
�
�����������
������ ���
�����������
������ ���
Figure 4.5: Use case of the modified items explaining how the user interact with the modifiedsystem. The dashed lines indicates that the steering functionality is a backup mode, only usedif the primary steering fails.
���������������
������������
�� ���
�
�
�
�
�
�
�
�
�
�
�
������ � �������������
������������������������� �
������������
����������� ��� ���������������
�������� �������
���������������
������ � ��������������
Figure 4.6: The modified items’ interaction with the different subsystems and its correspondingelements.
The modifications enables the steering and brake subsystem to be operational in degraded mode.The three different modes are explained below for the distributed brake system regarding brakefunctionality.
• Full functionality - Both distributed brakes are operational.
• Degraded functionality - One of the two distributed brakes are functional.
• System failure - Both distributed brakes have failed.
The three different modes for the steering functionality are explained below:
• Full functionality - Traditional steering unit is operational.
21

4 CONCEPT PHASE
• Degraded functionality - Both distributed brakes are operational.
• System failure - Primary unit and at least one of the distributed brakes has failed, steeringcapability can no longer be ensured.
The two operations complement each other. If the brakes are at degraded functionality, thesystem can warn the driver of degraded functionality of the vehicle. If the steering fails thesystem can warn the driver for the degraded mode.
22

5 PRODUCT DEVELOPMENT
5 Product development
This section explains the redundant strategies made for the development of the central controlunits (CCUs). It follows the product development phase of the ISO 26262, part 4, 5 and 6[4]. The safety life cycle of the product development is shown in Figure 5.1. The developmentfollows a top-down approach, starting from development at system level and branching down tothe implementation at hardware and software level.
������������
��������������
����������������
����������� � �
����� ��
� � ���
��������
�����������
������������ ��
�����������
� ��������
�������
��������
��������
������
� � ���
����� �����
�������
�������� ��������
��������
����������������
���
���������������
����
��������
������
����� �����
������������
Figure 5.1: Overview of the safety life cycle for the product development. Phases and subphasesmarked with a dashed frame are not included in the thesis.
5.1 System design
The reference system is using a centralized architecture, where the central control unit (CCU)controls the ECUs for brake, throttle and steering. The architecture design for the referencedesign is shown in Figure 5.2. Notice that the brake ECU controls all the actuators (markedwith A in the figure). Since the architecture of the reference design is not an efficient way tointroduce redundancy, a distributed architecture is developed in this thesis, explained in section 4.A system overview of the distributed architecture design is shown in Figure 5.3. The architectureuses separated brake ECUs to control one actuator on each side of the vehicle. Brake ECU 1control the actuators A1, and brake ECU 2 control the actuators A2 (seen in Figure 5.3).
The weakest link of the architecture is the central control unit (CCU) since it has the highestcomplexity and is therefore considered to have the highest fail rate in the system. The sensorsand CAN bus is out of range for this thesis and is therefore considered ideal in the sense thatthey are immune to faults.
23

5 PRODUCT DEVELOPMENT
���
���������
���
����� �
���
������
���
�������
���
� ������
���
�������
�
�����
���
�
� �
Figure 5.2: Centralized architecture for thedrive-by-wire used in the reference design.
������
���������
���
����� �
���
������
���
�������
���
� ������
���
�������
��
�����
����
�����
����
��
�� ��
Figure 5.3: Distributed architecture used inthe fault-tolerant design. Brake ECU 1 con-trols the actuators A1 and Brake ECU 2controls actuators A2.
5.2 Hardware design
This section gives an overview of the hardware (HW) design of the product development. Thehardware design deals with the implementation of hardware parts to increase the reliability ofthe fault-tolerant design.
5.2.1 Duplex-modular redundancy for central control unit
The hardware needs to be designed so that it has a failover system to ensure safety if the CCUhas a permanent error that results in a failure. The system will run in duplex mode where therewill be two CCUs having the same safe-critical functions for the drive-by-wire system. One ofthe CCUs will act as main (or primary) CCU while the other CCU will run as backup.
The two CCUs can either work in hot-standby, warm-standby or cold-standby. Since the pro-cessed sensor values for the ECUs are time critical, and resource utilization of the CPU is notan issue in the referenced design [5], decision is made to use hot-standby failover in the design.The backup CCU will work in hot-standby mode to take over the functions of the primary CCUif the primary CCU fails.
24

5 PRODUCT DEVELOPMENT
5.2.2 Error detection
The development boards chosen for implementation of the CCUs already have error detection bythe implementation of a lock-step CPU. The lock-step CPU can detect both permanent hardwarefaults and temporary faults occurring in the design which the software cannot handle. The lock-step technique can be used to prevent a fault from propagating to a failure. Lock-step and errordetection is elaborated in section 3.7.
5.2.3 Reset handling
When a temporary error is detected in a central control unit (CCU), it will have to be restarted inorder to guarantee further safe execution. If the primary CCU has a permanent error resulting ina failure, the secondary CCU will have to take over. The reset handling refers to the the design ofhow the active CCU will be restarted if an error is detected. Active CCU can be referred to bothprimary CCU and secondary CCU, depending on which CCU that is currently executing.
This section presents two designs for restarting a CCU; distributed-reset design, shown in Figure5.4 and self-reset design, shown in Figure 5.5. The CCUs have a monitoring function (hereinafterreferred to as monitor) to detect when an error occurs in the CCU. If an error is detected, themonitor will restart the erroneous CCU using a power switch located on the CCU. If the CCUhas a permanent failure, i.e., the error still appears after a restart, the secondary CCU will takeover and the primary CCU will be shut off.
In the distributed reset design, shown in Figure 5.4, the monitor is implemented in software (SW)of the other CCU. The SW implemented monitors enables the CCUs to reset each other whenan error occurs by controlling the reset signal of its neighbours. This can be implemented in twoways. Either each and every CCU gets the status of the error pin and the reset signal of all ofthe other CCUs. Or each CCU gets the status of the error pin and the reset signal of the twoclosest CCUs, shown in Figure 5.4. If this design is to be used in a system with several CCUs,this demands a huge number of interconnects to enable reset handling between all CCUs.
In the self-reset design shown in Figure 5.5, each CCU will have an external hardware (HW)monitor. This increases the cost and design complexity of the system when making a safeimplementation of the HW monitor. The self-reset design is suggested for systems where morethan two CCUs holds the safe-critical functions. The benefits of using this design is that it iseasy to further introduce more CCUs that runs the safe-critical functions.
Even though the distributed-reset design seems like the cheapest alternative for this projectwhere only two CCUs is to be used, the self-reset design is better from a safety perspective.Since the monitor have the functionality to permanently shut down the CCU, it might occurthat a failure in the distributed self-reset monitor implemented in one of the CCUs causes theother CCU to permanently shut down. This will result in a system failure since there will be nofunctional CCU. However, if the same error occur in the case of the self-reset design, the primaryCCU will not be affected if the monitor of the secondary CCU forces it to shut down, since theyare independent of each other.
The monitor elaborated in this section is not included in the CCU and will be implemented inthis thesis. The implementation of the self-reset monitor is further explained in section 7.
25

5 PRODUCT DEVELOPMENT
��������
�
�� ����
�
������������������
������� ���
����� ���
Figure 5.4: Distributed-reset design for thecentral control unit (CCU) where the monitoris implemented in software (SW).
���
������
���
������
��������
���
�����
���
������� ���
����������
������� ���
����������
�������
Figure 5.5: Self-reset design for the centralcontrol unit (CCU) using a hardware (HW)monitor for resets.
5.3 Software design
The next step is to design the software (SW) to ensure redundancy and safety in the CCU.The SW design will be implemented in the CCU to handle the specific drive-by-wire function toenable safety for the driver. The system needs to include both redundancy in time (temporal re-dundancy) and information redundancy. Table 5.1 presents different methods for error detectionat software level [4]. The recommendation for each method is graded dependently of the currentASIL of the item it is implemented in. "o" means that the method has no recommendation eitheragainst or for the usage for the current ASIL. "+" means that the method is recommended forthe current ASIL. "++" means that the method is highly recommended for the current ASIL.The ISO 26262 standard recommends that one or several of the methods in Table 5.1 are usedwhen developing the software design.
Table 5.1: Mechanisms for error detection at software level. [4]
Method A B C DRange checks of input and output data ++ ++ ++ ++Plausibility check + + + ++Detection of data errors + + + +External monitoring facility o + + ++Control flow monitoring o + ++ ++Diverse software design o o + ++
The methods for range checks of input and output data and plausibility check were chosen to bepart of the software design. An overview of the software design is shown in Figure 5.6.
26

5 PRODUCT DEVELOPMENT
���������
����
�� ���
������ ��
�� ���
������
����
�� �����������
��� � ���
���� �������
������ �����
��������������
� ���� ��
���� �
���� ��
���� �����
���� ��
�������� �
��� �����������
���� �����
� ���������
��������
�������
������� �
�
��� ���������
��������
���
���
! �������� �
��� � ���
������� ��
�����������
��������������
� ���� ��
������������ ��
� ��������
"����� ���
������#�$
���������
#�$
������ ��
#�$
� � � �
Figure 5.6: Software design of the safety mechanisms in the central control unit.
In block A the data is read from the sensors. A range check will be made for each reading toensure that the value is in range. By reading the values several times, temporal redundancy isaccomplished. By separating each read with a short time gap it is possible to detect whether thedata is continuous or not. For example if the sensor cable is broken, the data will most likelybe affected by high frequency noise. If the data varies to much in between each read, it will beseen as faulty. A plausibility check is made by comparing the values with each other using amedian voter. If the measured values differ too much from each other and no median value canbe decided, the system will restart or hand over to a backup system.
Block B processes the information from the correct sensor value provided by the reference block.It takes the sensor value, processes it several times and stores it in multiple places to ensureinformation redundancy. If a bit flip, caused by e.g. ionizing particles, occurs in one of thememory cells where the sensor values are stored, it will most likely affect other memory cellswhich is located physically close to it. Therefore it is a good idea to physically separate thememory location of each sensor value, to minimize the event of one bit flip altering the data ofseveral sensor values.
In block C the multiple values are retrieved from the memory. The multiple values stored inthe memory are read and majority voting is made to ensure their correctness. If majority ofthe values from the memory are the same, the majority voter will ensure fault prevention byproviding the correct value. If majority voting cannot be done due to majority of the values aredifferent, the majority voter will ensure fault detection to prevent a system failure.
Block D handles transfer of the values to the ECUs. A range check of the output values is madebefore sending them to the ECUs, to ensure that the values are in acceptable limit.
When adding the possibility to restart a CCU, considerations regarding state dependent infor-mation have to be taken into account. The decision of using a duplex CCU adds the possibilityof retaining such information after a restart since the other CCU will hold the correct values.If primary CCU have to be restarted, secondary CCU will continue execution and update even-tual state dependent information. In the startup phase of the CCU, there will have to be somefunctionality responsible of synchronizing such state dependent information.
27

5 PRODUCT DEVELOPMENT
In case of a system startup, both CCUs shall assume default values. However, some safetymechanism needs to be implemented to ensure that no CCU assumes default value when thesystem is actually running.
28

6 SAFETY VALIDATION
6 Safety validation
The safety validation is a part of the ISO 26262, shown in Figure 5.1 in section 5 of this thesis.This section aims to verify the reliability and safety of the developed design explained in section5 of this thesis. The developed design is hereinafter known as the fault-tolerant system.
Section 6.1 gives an overview of the reference design and the fault-tolerant design in a faulttree diagram. Each system is then analysed to show the single point of failures in the twosystems.
In section 6.2, a comparison between the reliability of the two systems is made. An analysis ismade to show how the reliability of the two systems changes in time. The systems are modelledusing Markov chains. The section also gives a detailed analysis of the reliability for the fault-tolerant system.
Section 6.3 makes an analysis of the safety for the fault-tolerant system. The steady-state safetyis calculated for each subsystem. Safety refers to the system’s ability to prevent failures that canlead to a catastrophic event [19]. The steady-state safety is the probability that a fail-safe stateis reached, i.e., catastrophic failure is prevented.
6.1 Overview
The fault tree for the reference system is shown in Figure 6.1. The fault tree is elaborated fromthe centralized architecture, shown in Figure 5.2. The fault tree shows all the single point offailures in the reference system. Engine and power failures are marked with a yellow trianglewhich indicates that there are underlying fault trees that needs to be further investigated. Thisis however, not included in this thesis.
The fault-tolerant system is shown in Figure 6.2. The fault tree is elaborated from the dis-tributed architecture, shown in Figure 5.3. The red triangle marked with steering/brake failureindicates that there is an underlying subsystem that may cause a failure. When introducing thefunctionality of steer-by-brakes, failure of the steering system becomes dependent of the brakesystem. For example if one of the brake ECU fails, steering functionality can not be in degradedmode. Therefore, failure of the steering ECU and one brake ECU will put the drive-by-wiresystem in critical failure. Since this occurrence can not be represented by the use of a fault tree,it will be further analysed using a Markov model in section 6.2. The red triangle of brake andsteer will be referred to as brake-and-steer system.
In addition to the steering and brake redundancy, the fault-tolerant design uses duplex CCUswhich adds to the fault tolerance of the system. For example, if one of the CCUs would fail, thesystem would still be functional as shown in the fault tree in Figure 6.2. Improvements have alsobeen made to ensure safety of the brake-and-steer system.
The subsystems regarding the engine, power and sensors failure, shown in figures 6.1 and 6.2,are not further analysed in this thesis. They are mentioned to make the reader aware of othercritical parts of the drive-by-wire system.
29

6 SAFETY VALIDATION
�������
��� �
����
��� �
�� ������
���
��
����� �
��� �
���� ���
��� �
� ���
��� �
���� ���
���
� ���
������������
���
��� ��
���
��������
���
��������
�����������
��� �
����
��� �
�� �����
��� �
��
�����
��� �
Figure 6.1: Fault tree of the reference system. The yellow triangles indicate that there areunderlying fault trees.
�������
��� �
���� ���
� ��
��� �
��
�� ������
���
�� �����
��� �
��
�����
��� �
����
��� �
����� �
��� �
���������
���
��� ��
���
��������
���
�����
�����������
��� �
����
��� �
�������
���
�
�� ����
���
Figure 6.2: Fault tree for the fault-tolerant system. The yellow triangles indicate that there areunderlying fault trees. The steering/brake failure is analysed in section 6.2.
6.2 System reliability
Reliability is the system’s ability to perform its intended function on demand without failure[19]. Since the reference system does not have any degraded state, both systems are consideredto be functional until failed.
This section gives a comparison between the reliability of the reference system and the fault-tolerant system and shows how the reliability decreases over time for both systems. The com-
30

6 SAFETY VALIDATION
parison is made for the central control unit (CCU) and the brake-and-steer system. Since theCCU and brake-and-steer system are independent of each other, a model can be extracted usingexponentially-distributed continuous-time Markov modelling [9]. A Q-matrix is extracted fromthe Markov model and the ordinary differential equations (ODE) are set. The ODE are thensolved using Laplace transforms and MATLAB for finding the solution of the ODE under a giventime.
The failure rates of the systems are estimated from the Safety Integrity Level (SIL) of thestandard IEC 1508 (see section 3.4) and the quantitative analysis from the ISO 26262 standard[4] (see section 3.4). The lifespan of a vehicle is estimated to be 10 years according to studiesmade by [20] and [21].
6.2.1 Central control unit
The design of the CCU in the reference system uses a simplex design. The Markov model isshown in Figure 6.3. A failure of the CCU will result in a system failure.
�������
��� �
���
�������
���
����
Figure 6.3: Markov model of the central control unit (CCU) for the reference system. λCCU isthe failure rate for the CCU.
The Q-matrix extracted from the Markov model is shown in Equation 1a. The extracted ODEfrom the Q-matrix is shown in Equation 1b. Equation 1c shows the Laplace transform to thes-domain of the ODE. The expression is then transformed back to the time domain using inverseLaplace transform and the probability of being in state A according to Figure 6.3, is expressed.The calculated reliability of the reference system’s CCU is shown in Equation 1d.
Q =
[−λCCU λCCU
0 0
](1a)
P ′A(t) = −λCCUPA(t) (1b)
L ⇒ PA(s) =1
s+ λCCU⇒ L−1 ⇒ PA(t) = e−λCCU t (1c)
RCCU = PA(t)⇔ RCCU = e−λCCU t (1d)
The current CCU design uses a duplex system, and the Markov model is shown in Figure 6.4.In each state, there is a number combination. The left number shows how many working CCUsare in the state, the middle number shows how many CCUs are under repair (under restart)and the rightmost number shows how many CCUs are in a non-reparable state (permanentlydamaged).
31

6 SAFETY VALIDATION
The initial state is state A shown in Figure 6.4. In state A both CCUs are functional. If atransient or intermittent fault occurs and is covered by the system, transition to state B willoccur. State B indicates that there is one working CCU and one under repair. The CCU underrepair is restarted by the hardware monitor and a transition back to A will occur in the repairratio, µr. The repair ratio is equal to the (restart_time)−1 of the CCU, the restart time isestimated to be approximately 1 ms. The system covers both transient and intermittent faults.Since the repair of a CCU uses power-off restart, an intermittent failure will continuously restartthe system until the fault disappears. The restart of the system is further elaborated in section7.
If another failure occurs to the working CCU under the time when the first CCU is restarting,transition from state B to state D will occur. Since both CCUs have failed, the whole systemis considered as failed. Both CCUs can also be exposed to a non-covered fault. This meansthat the system will transit from state A to state D, i.e system failure. A non-covered fault isnot detected by the system and will therefore not be restarted by its hardware monitor. Thehardware monitor can only restart the CCU when a failure is detected. If a fault that alters thesystem from its correct behaviour occurs, transition to state D will occur.
The CCUs can also be exposed to a permanent fault, i.e fault that is not repairable, e.g a brokentransistor in the CCU or fault in the hardware monitor. If the permanent fault is covered,transition from state A to C will occur. In state C one CCU is working and the other one isdetected as permanently damaged and shut of by the hardware monitor. In this state the systemhas no repair-rate since a restart of the CCU can not repair the permanent damage. If anotherfault occurs to the working CCU, transition to from state C to D occurs.
In Figure 6.4, λt is the transient failure rate and λp is the permanent failure rate for one CCU.The repair rate is referenced as µr for one CCU, ct is the coverage for transient and intermittentfaults and cp is the coverage for permanent failures.
�������
��� �
���
�����
���
�����
����
������
����
���
��
�����
���
�����
���
��
�����
� �
�
� �� �
��
���
Figure 6.4: Markov model of the central control units (CCU) for the fault-tolerant system.
Equation 2a shows the Q-matrix extracted from the Markov model for the CCU of the fault-tolerant system (shown in Figure 6.4). Equation 2b shows the ODEs extracted from the Q-matrix.Since the Markov model suffers from stiffness between state A and B due to the high repair ratecompared to the low failure rate of the transient failures (including intermittent faults) [22].Solution in MATLAB based on the the numerical differentiation formulas [23] is used to solve
32

6 SAFETY VALIDATION
the ODEs shown in Equation 2b and calculate the reliability shown in Equation 2c.
Q =
−2(λt + λp) 2ctλt 2cpλp (1− ct)2λt + (1− cp)2λp
µr −(µr + λt + λp) 0 λt + λp0 0 −(λt + λp) λt + λp0 0 0 0
(2a)
P ′A(t) = −2(λt + λp)PA(t) + µrP (B)P ′B(t) = 2ctλtPA(t)− (µr + λt + λp)PB(t)P ′C(t) = 2cpλpPA(t)− (λt + λp)PC(t)
(2b)
RCCU = PA(t) + PB(t) + PC(t) (2c)
Since the CCU is a E/E system, the failure rate is estimated from the SIL according to the IEC1508 standard [9][14] (see section 3.4 in this thesis). Table 6.1 shows example values for failurerates for one CCU with the different ASIL levels. The failure rates are extracted from Table3.1 and approximated to failures per hour. The estimated failure rates are for transient andintermittent failures.
Table 6.1: Example values for transient failure rates for different ASIL.
SIL (IEC 1508) Failures per year ASIL (ISO 26262) Failures per hour4 ≥ 10−5 to < 10−4 D ≥ 10−9 to < 10−8
3 ≥ 10−4 to < 10−3 C ≥ 10−8 to < 10−7
2 ≥ 10−3 to < 10−2 B ≥ 10−7 to < 10−6
1 ≥ 10−2 to < 10−1 A ≥ 10−6 to < 10−5
QM None required
Table 6.1 shows a possible source for derivation of random hardware failure, stated in the ISO26262 standard, part 5 [4]. It shows that the values from Table 6.1 follows a good estimationrelated to the ISO 26262.
Table 6.2: Example values for random hardware failures values according to the ISO 26262 [4].
ASIL (ISO 26262) Failures per hourD < 10−8
C < 10−7
B < 10−7
The factor between permanent and transient failures (including intermittent failures) are esti-mated from the quantitative analysis treated in part 10 of the ISO 26262 standard [4]. Thepermanent failure rate is estimated to be 10 times lower than the failure rate for the transientfailure rate. For example, if the transient failure rate is estimated to < 10−8, the permanentfailure rate is < 10−9. This is considered for both the previous and fault-tolerant system for theCCU. The coverage factor are assumed to be the same for both permanent and transient failuresfor the CCU.
The reliability extracted from Equation 2c, for the fault-tolerant system using duplex CCUs,is compared to the reliability from Equation 1d, for the reference system using a simplexCCU.
33

6 SAFETY VALIDATION
Figure 6.5 shows the comparison between the CCU for the reference system (dashed lines) andthe fault-tolerant system (continuous lines). The different failure rates are measured in failuresper hour and the coverage is considered ideal. The comparison shows that the reliability of thefault-tolerant system is always higher than the reference system in the vehicle lifespan.
0 2 4 6 8 10 12 14 16 18 20 2299.9
99.91
99.92
99.93
99.94
99.95
99.96
99.97
99.98
99.99
100
time (years)
Rel
iabi
lity
(%)
λt=5*10−7
λt=1*10−7
λt=5*10−8
λt=1*10−8
Figure 6.5: Reliability for the central control unit of the reference system (dashed line) andfault-tolerant system (continuous line). The different failure rates are measured in failures perhour and the coverage is considered ideal.
Figure 6.6 shows the reliability of the fault-tolerant system in the vehicle lifespan using an idealcoverage. The figure shows that failure rates lower than or equal to λt = 10−7 failures per hourmeets a high reliability of five-nines (i.e 99.999%) in 10 years.
To see how the coverage of the system effects the reliability, further analysis has been madewhere the coverage factor is decreased. Figure 6.7 shows the reliability of the systems using acoverage factor of 99%. Failure rates lower than or equal to λt = 5 ∗ 10−9 failures per hour fulfilsthe reliability of five-nines in 10 years.
Figure 6.8 shows the reliability of the systems using a coverage factor of 98%. The only tolerablefailure rate that meets the five-nine reliability in ten years is λt = 10−9 failures per hour.
Figure 6.9 shows the reliability of the system using a coverage factor of 95%. By further loweringthe coverage to 95%, the systems reaches its limit using a failure rate of λt = 10−9 failures perhour. Lowering the coverage even further the five-nine reliability cannot be achieved for 10 yearslifespan of a vehicle.
34

6 SAFETY VALIDATION
0 2 4 6 8 10 12 14 16 18 2099.999
99.9991
99.9992
99.9993
99.9994
99.9995
99.9996
99.9997
99.9998
99.9999
100
time (years)
Rel
iabi
lity
(%)
λt=5*10−7
λt=1*10−7
λt=5*10−8
λt=1*10−8
λt=5*10−9
λt=1*10−9
Figure 6.6: Reliability for the fault-tolerant system’s central control unit using ideal coverage.The different failure rates is measured in failures per hour.
0 2 4 6 8 10 12 14 16 18 2099.999
99.9991
99.9992
99.9993
99.9994
99.9995
99.9996
99.9997
99.9998
99.9999
100
time (years)
Rel
iabi
lity
(%)
λt=5*10−7
λt=1*10−7
λt=5*10−8
λt=1*10−8
λt=5*10−9
λt=1*10−9
Figure 6.7: Reliability for the fault-tolerant system’s central control unit using a coverage of99%. The different failure rates are measured in failure per hour.
35

6 SAFETY VALIDATION
0 2 4 6 8 10 12 14 16 18 2099.999
99.9991
99.9992
99.9993
99.9994
99.9995
99.9996
99.9997
99.9998
99.9999
100
time (years)
Rel
iabi
lity
(%)
λt=5*10−7
λt=1*10−7
λt=5*10−8
λt=1*10−8
λt=5*10−9
λt=1*10−9
Figure 6.8: Reliability for the fault-tolerant system’s central control unit using a coverage of98%. The different failure rates are measured in failure per hour.
0 2 4 6 8 10 12 14 16 18 2099.999
99.9991
99.9992
99.9993
99.9994
99.9995
99.9996
99.9997
99.9998
99.9999
100
time (years)
Rel
iabi
lity
(%)
λt=5*10−7
λt=1*10−7
λt=5*10−8
λt=1*10−8
λt=5*10−9
λt=1*10−9
Figure 6.9: Reliability for the fault-tolerant system’s central control unit using a coverage of95%. The different failure rates are measured in failure per hour.
36

6 SAFETY VALIDATION
6.2.2 Brake-and-steer system
The reference system has two independent systems for the brake and steering ECU, seen in thefault tree in Figure 6.1. The Markov model for the reference system is shown in Figure 6.10.System initially start from state A. A failure in the brake system will result in a brake failure(state B), where as a failure in the steer system will result in a steering failure (state C).
�����
������
��
� ������
������
��
��� �����
��
� �
��
Figure 6.10: Markov model of the brake-and-steer system for the reference design. λB is thefailure rate for one brake ECU and λS for the primary steering unit.
The Q-matrix of the Markov model in Figure 6.10 is represented in Equation 3a. The ODEextracted from the Q-matrix is shown in Equation 3b. The calculation of the Laplace transformfrom the ODE, inverse-Laplace transform and reliability of being in state A is represented inEquation 3c. The reliability of the previous brake system and steer system is represented inEquation 3d.
Q =
−(λB + λS) λB λS)0 0 00 0 0
(3a)
P ′A(t) = −(λB + λS)PA(t) (3b)
L ⇒ PA(s) =1
s+ (λB + λS)⇒ L−1 ⇒ PA(t) = e−(λB+λS)t (3c)
RBS = PA(t)⇔ RBS = e−(λB+λS)t (3d)
The fault-tolerant system for brake and steer uses a distributed brake architecture which increasessafety for both steering and brakes. The brake system is still operational after failure of onedistributed brake ECU. The steer system also has additional redundancy since the steer-by-brakes technology works as a backup if the steer ECU has failed using the distributed brakes(both brake ECUs needs to be functional).
The Markov model of the fault-tolerant brake-and-steer system is shown in Figure 6.11. Initiallythe system starts in state A, meaning that both brake and steering are at full functionality. Thefailure rate for the brakes are represented as λB and the coverage for the brake system is cB.
37

6 SAFETY VALIDATION
Since there are two brakes ECUs in the vehicle, the transition from state A to B is two timesthe failure rate for the brakes. The failure rate for the steer system is represented λs and thecoverage cs. When a failure of one brake ECU occurs, a transition from state A to B occurs.The system is then in the degraded functionality for brakes. This means that the system is stilloperational, but the brakes works in degraded mode. If another brake fails when in state B,the system can no longer provide brake functionality for the vehicle. Therefore, transition fromstate B to D occurs, i.e the brake system have failed. The functionality of the steer-by-brakesis dependent on both brake ECUs being functional. If not, the functionality of steer-by-brakescannot be guaranteed. Therefore, if a steering failure occurs when in state B, transition fromstate B to E will occur. State E implies that the steering has failed. When the vehicle is atfull functionality (state A), and suffers from a steering failure, transition from state A to C willoccur. State C implies that the steering is operational using the steer-by-brakes functionality forsteering. If one brake ECU fails, transition from state C to E will take place, i.e steering failure.The system may also be exposed to non-covered faults. This is showed in Figure 6.11 where atransition goes from state A to a failure state (D or E). A non-covered failure is for example anon-detected fault in the brake or steering ECU that propagates to a system failure.
�����
������
��
�������
������
��
��������
��
��������
�������������
���������
��
� � �� �
����
���������
�������������
�������
��
��
���
��
�� ����� ��
����� ��
�
Figure 6.11: Markov model of the brake-and-steer system for the fault-tolerant design.
The Q-matrix extracted from the Markov model is shown in Equation 4a. The extracted ODEfrom the Q-matrix is shown in Equation 4b. Equation 4c shows the Laplace transform to thes-domain of the ODEs, the inverse-Laplace transform and calculated probability of being in stateA, B and C according to Figure 6.11. Equation 4d shows the reliability for the brake-and-steersystem at functional mode (both full and degraded functionality).
Q =
−(2λB + λS) 2cBλB cSλS (1− cB)2λB (1− cS)λS
0 −(λB + λS) 0 λB λS0 0 −2λB 0 2λB0 0 0 0 00 0 0 0 0
(4a)
38

6 SAFETY VALIDATION
P ′A(t) = −(2λB + λS)PA(t)P ′B(t) = 2cBλBPA(t)− (λB + λS)PB(t)P ′C(t) = cSλSPA(t)− 2λBPB(t)
(4b)
L ⇒
PA(s) =1
s+2λB+λS
PB(s) =2cBλBPA(s)s+(λB+λS)
PC(s) =cSλSPA(s)−2λBPB(s)
s
L−1 ⇒PA(t) = e−(2λB+λS)t
PB(t) = 2cB(e−(λB+λS)t − e−(2λB+λS)t)
PC(t) = cS(e−2λBt − e−(2λB+λS)t)
(4c)
RBS = PA(t) + PB(t) + PC(t)⇔RBS = e−(2λB+λS)t + 2cB(e
−(λB+λS)t − e−(2λB+λS)t) + cS(e−2λBt − e−(2λB+λS)t)
(4d)
The example values for the failure rates are presented in Table 6.1 and Table 6.2 for the differentASILs. The failure rates are considered to be the same for the brake and steering ECUs and aremeasured in failures per hour.
The reliability of brake-and-steer system, shown in Equation 4c, is compared to the reliabilityof previous brake-and-steer system, shown in Equation 3c. The fault-tolerant system is consid-ered to be functional as long as control of steering and brakes can be achieved. This meansthat the degraded-mode operation is included as an operational functionality in the reliabilitycalculations.
Figure 6.12 shows the reliability for the brake-and-steer system for both the reference system(dashed lines) and for the fault-tolerant system (continuous lines). The failure rate for steeringand brake is considered to be the same and is represented as λBS , i.e λBS = λB = λS . Thecomparison shows that the reliability of the fault-tolerant system is higher than the referencesystem in the vehicle lifespan. Notice that failure rate of λBS = 3∗10−8 failures per hour for thereference system reaches higher reliability than the fault-tolerant system when having a failurerate of λBS = 5 ∗ 10−7 failure per hour after approximately 11 years. This is interesting from adesign perspective, where it could more efficient to use the reference design with a lower failurerate, instead of a fault-tolerant design with a higher failure rate, in cases where the reliabilitycan be 99.5% or lower.
39

6 SAFETY VALIDATION
0 5 10 15 20 25 3099
99.1
99.2
99.3
99.4
99.5
99.6
99.7
99.8
99.9
100
time (years)
Rel
iabi
lity
(%)
λBS
=5*10−7
λBS
=1*10−7
λBS
=5*10−8
λBS
=3*10−8
Figure 6.12: Comparison in reliability for the brake-and-steer system of the reference (dashedline) and fault-tolerant system (continuous line). The different failure rates are measured infailures per hour and the coverage is considered ideal.
Further analysis of the intersection points of the two systems were made. Figure 6.13 shows theintersection points for different failure rates. The dashed lines represents the reference system andthe continuous lines represents the fault-tolerant system. Notice how the reliability is improvedfor the fault-tolerant system compared to the reference system with the lowering of the failurerate.
40

6 SAFETY VALIDATION
0 10 20 30 40 500
10
20
30
40
50
60
70
80
90
100
time (years)
Rel
iabi
lity
(%)
λBS
=1*10−5
λBS
=5*10−6
λBS
=3*10−6
λBS
=2*10−6
Figure 6.13: Intersection points for the reference system (dashed lines) and fault-tolerant system(continuous line).
Figure 6.14 shows the reliability of the fault-tolerant system for different failure rates. The failurerates are measured in failures per hour. A failure rate lower than λt = 1 ∗ 10−8 failures per hourmeets the high reliability of five-nines (99.999%) for the vehicle lifespan of 10 years.
Figure 6.15 shows the reliability of the fault-tolerant system with a coverage of 99%. Noticethat a failure rate of 1 ∗ 10−9 failures per hour is needed to meet the five-nine reliability for 10years.
41

6 SAFETY VALIDATION
0 2 4 6 8 10 12 14 16 18 2099.999
99.9991
99.9992
99.9993
99.9994
99.9995
99.9996
99.9997
99.9998
99.9999
100
time (years)
Rel
iabi
lity
(%)
λBS
=5*10−8
λBS
=1*10−8
λBS
=5*10−9
λBS
=1*10−9
Figure 6.14: Reliability of the brake-and-steer system for the fault-tolerant design using idealcoverage. The different failure rates are measured in failures/hour.
0 2 4 6 8 10 12 14 16 18 2099.999
99.9991
99.9992
99.9993
99.9994
99.9995
99.9996
99.9997
99.9998
99.9999
100
time (years)
Rel
iabi
lity
(%)
λ
BS=5*10−8
λBS
=1*10−8
λBS
=5*10−9
λBS
=1*10−9
Figure 6.15: Reliability of the brake-and-steer system for the fault-tolerant design using a cov-erage of 99%. The different failure rates are measured in failures/hour.
42

6 SAFETY VALIDATION
By further lowering the coverage factor, the system cannot meet the five-nines in reliability for areasonable failure rate. Figure 6.16 shows the reliability of the fault-tolerant system when usinga coverage factor of 97%. The brake-and-steer system meets the five-nine reliability after tenyears, when using a failure rate of 1 ∗ 10−9 failures per hour.
0 2 4 6 8 10 12 14 16 18 2099.999
99.9991
99.9992
99.9993
99.9994
99.9995
99.9996
99.9997
99.9998
99.9999
100
time (years)
Rel
iabi
lity
(%)
λBS
=5*10−8
λBS
=1*10−8
λBS
=5*10−9
λBS
=1*10−9
Figure 6.16: Reliability of the brake-and-steer system for the fault-tolerant design using a cov-erage of 97%. The different failure rates are measured in failures per hour.
6.3 System safety
This section analyses the safety of the drive-by-wire system. The fail-safe state of the systemis considered to be when the vehicle has stopped at the side of the road. Analysis of the safetyfocuses on the steady-state safety of the system [9]. The steady-state safety is the probabilitythat the system reaches a fail-safe state compared to a critical-failure state over a continuesperiod of time.
Figure 6.17 shows the Markov model for the safety of the throttle subsystem. State A refersto that the subsystem is operational. The failure rate for the throttle system is λT and thecoverage for the throttle system is c. If a covered failure occurs, transition from state A to stateFS occurs. This implies that the throttle is shut off to avoid a hazardous event. If a non-coveredfault occurs, the system is forced into a critical failure, transition from state A to state CFoccurs. The critical failure could for example be stuck-at maximum value.
43

6 SAFETY VALIDATION
���������
��
��� ������������
��
��� �����
�
���
�� ���� �
Figure 6.17: Markov model with safe state and critical state for the throttle subsystem. λT isthe failure rate for the throttle ECU and c is the coverage.
The steady-state safety is calculated in equation 5. The equations provides the failure rate forthe throttle ECU ( λT ) and coverage factor for the throttle ECU (c).
SThrottle = PA→B = cλT (5)
Figure 6.18 shows the steady-state–safety model for the CCU system. The failure rate for thetransient and intermittent failure rate is λt and for the permanent failure rate λp. The coveragefactor for the transient and intermittent failures are ct and for the permanent failures cp. Theslow-down time for the vehicle is (µsd)−1. The slow-down time is a safety mechanism to ensurethe safety of the driver. The safety mechanism slows down the speed of the vehicle to lower theseverity of the hazardous event or prevents it from happening (driver stops the vehicle).
A more detailed description of the state transitions are explained in section 6.2. In state A allCCUs are working. When one CCU is exposed to a permanent failure, transition from state Ato C occurs. To ensure that the system goes into a safe failure state, the system will limit thespeed of the vehicle to ensure that the driver can pull to the side of the road. This lowers theprobability of the severity of the hazardous event and increasing the safety of the vehicle. Theslow-down time of the vehicle is (µsd)−1, i.e., the time it takes for the current speed to be loweredto a reasonable/non-hazardous speed. One example could be that the vehicle is on the high-wayand having a driving speed of 70 km/h. When reaching state C, the speed is forced (either bydecreasing throttle, engine brake or slight brake power) down to 20 km/h. The time it takes forthe vehicle to lower the speed from 70 km/h to 20 km/h is the slow-down time. This gives thedriver time to pull to the side of the road. If a transient or intermittent failure occurs, the CCUwill restart itself, the time for the restart is µ−1r .
44

6 SAFETY VALIDATION
���������
�����
�� �
�����
���
�����
����
������
����
���
��
�������
� ��
�����
���
�����
���
��
�����
���
� ��� �
�
��
���
Figure 6.18: Markov model with the safe state and critical state for the CCU system.
The equation for the steady-state safety of the CCU system is provided in Equations 6a and 6b.The failure rate for the steer and brake ECUs is represented as λs and λB and coverage for steerand brake ECUs is represented as cs and cB. The n is the number of restarts the CCU does. Forexample, if there are 10 covered transient failures where a restart of the CCU occurs and then acovered permanent failure occurs, the system will transit back and forth between state A and B10 times, and then transition from state from A to C will occur.
SCCU = (PA→C ∗ PC→FS) + (PA→B ∗ PB→A)n ∗ (PA→C ∗ PC→FS) (6a)
SCCU = (PA→C ∗ PC→FS)(1 + (PA→B ∗ PB→A)n) = 2cpλp(2(λt+λp)
∗ µsd(µsd+λt+λp)
(6b)
The Markov model suffers from stiffness between state A and B due to the fact that µr >> 2ctλt(see Figure 6.18). Since the restart time of the system is small and a low failure rate for theCCU is needed. This implies that for a high number of transient failures, the general equationshown in 6a can be simplified to equation 7.
SCCU = (PA→C ∗ PC→FS) = 2cpλp(2λt+2λp)
∗ µsd(µsd+λt+λp)
(7)
Figure 6.19 shows the Markov model for the brake-and-steer system. A more detailed descriptionof the state transitions for the brake-and-steer system is explained in section 6.2. When thesystem is in degraded functionality (state B or C), the driver will be warned to pull the vehicleto the side of the road. The pull-over time is estimated to be µB when in degraded mode forbrakes and µS when in degraded mode for steering.
45

6 SAFETY VALIDATION
��������������
��
��������
��
���������
��
� �� ��
����
���������
�������������
�������
��
�� ����
��
��
�� ����� ��
��� ������
��������
�������������
���������
��
�� �
Figure 6.19: Markov model with safe state and critical state for the brake-and-steer system. Thetime it takes for the driver to stop is estimated with µs in case of a steering failure and µB incase of a brake failure.
The equation for the stead-state safety of the brake-and-steer system is provided in equations8a and 8b. The equations provides the failure rate for the steering and brake ECUs (λs and λB)and coverage for steering and brake ECUs (cs and cB).
SBS = PA→B ∗ PB→FS + PA→C ∗ PC→FS (8a)
SBS = cs2λs(2λB+λS)
∗ µB(λB+λs+µB) +
cSλS(2λB+λS)
∗ µs(µs+2λB) (8b)
46

7 IMPLEMENTATION
7 Implementation
This section explains how the proposed methods in section 5 can be implemented in a fault-tolerant prototype. The implementations for the prototype are divided into software and hard-ware.
Figure 7.1 shows an overview of the fault-tolerant prototype. The implementations have beenimplemented on the existing prototype explained in section 2. An overview of the prototypecan be seen figure 2.1. In the existing prototype, major changes has been made for the brake-and-throttle ECU and the central control unit (CCU). The throttle and brake functionality hasbeen divided into two separated ECUs for the fault-tolerant prototype. An implementation of abrake ECU has been made to show the functionality of the distributed brake system and steer-by-brakes functionality. For the CCU the fault-tolerant prototype now operates in duplex mode.Further, safety mechanisms has been implemented in software and hardware to prevent, detectand recover from failures in the CCU.
�������
����� ��
���
���������
���
������ ���
���
������������
����������
���
������
���
�����
�����
�� ���
���
������
���� ��
�������
���� �
�� ��
���� ��
��������
���� ��
��������
���� ��
��������
���� ��
��������
Figure 7.1: Overview of the fault-tolerant prototype. The central control unit (CCU) runs induplex modular redundancy.
7.1 Software
In this section, the tasks in the CCU are described. Both new tasks and modifications made totasks in the existing prototype are mentioned. Two voting algorithms have been implementedand are further described in section Voting. The implementation of how a CCU handles loss ofsteering value when restarting is mentioned in Recapture of steering value. How a CCU detectswhen the other CCU has failed is described in Determination of a failed CCU.
7.1.1 Tasks
In the fault-tolerant prototype there have been major changes in all safe-critical tasks. Thesafe-critical tasks that are implemented in the CCUs are; throttle task, brake task, steer task,
47

7 IMPLEMENTATION
CAN_RX task, CAN_TX task and watchdog task. Figure 7.2 shows a flow chart of the tasks inthe fault-tolerant prototype. The task with rounded corners, i.e., LCD_task, is only executed inthe primary module and not implemented in the backup module. The tasks with dashed frameare tasks that are added to the fault-tolerant prototype.
The scheduling priority of the tasks has also been altered to better suite the priority of the tasks.For example, the task responsible for displaying data on the LCD should not have the samepriority as the task responsible for measuring the brake value.
��������������
�������������������������������
�����������������������������������
���������������������������
���������������������� �������� ��������� ���������!����������������������
��������"���"�������������
��������������������������
�����#���
$���%&
���������
'���������������������
Figure 7.2: Flow chart of the tasks in the fault-tolerant prototype. Added tasks are noted witha dashed box. Rounded box is task that are not safe critical.
The implementation of throttle and brake tasks (i.e throttle task and brake task) are quite similarto each other. Figure 7.3 shows an overview of the throttle/brake task. Both the throttle andbrake task read from one of the ADCs on the development board. They read the values five timesto ensure temporal redundancy of the sensors. The time in between each read is separated witha small time gap of one millisecond. The values are then voted using median voting (see section7.1.2) to receive a correct value. The value is then processed three times and stored in threedifferent memory spaces. Both tasks do also update a watchdog variable to notify the watchdogtask that they are still alive and working properly.
���
�������
�����
� ���
���� �
�������
� ��������
� ��
��� ��
������
���������
���������
���������
������
���� �
� ��� ���� ���
� ����������
�����������
�� ����
�������������� � �������� �
��
!"�����
Figure 7.3: Overview of the functionality for throttle-by-wire and brake-by-wire.
Watchdog task executes periodically every 60 ms. The main responsibility of the watchdog taskis to monitor the watchdog variables of every task. In every execution of the watchdog task,
48

7 IMPLEMENTATION
the watchdog variables are being checked and reset to 0. If any of the variables are still 1 thismeans that the task that corresponds to that variable have not executed properly and missed itsdeadline. For example, if the watchdog variable of throttle task is equal to 1, it means that ithave not been set to 0 in throttle task. This is a sign that throttle task have not been executedproperly. Another responsibility is to monitor an internal error variable. If the implementedmedian voter or majority voter cannot determine a correct value, the internal error variable willbe set high. If any of the watchdog variables have not been restored, or the internal error variableis set, it is to be seen as a failure and the error pin is set high.
In the existing prototype, the task responsible for sending messages on CAN was called CANtask. CAN task have now been renamed to CAN_TX task. The CAN_TX task uses majorityvoting to fetch the processed sensor values for throttle, brake and steering to ensure that datawas not corrupted by bit flips. The correct value is sent via the CAN bus to corresponding ECU.The CAN task is also responsible for sending an alive package on the CAN bus which notifiesthe other CCU that it is working properly.
The reference implementation of the CCU did not implement the ability to receive messageson CAN. This was basically because the CCU was the only node on the bus that did sendinformation on CAN, so there was no need for the CCU to receive messages on CAN. The fault-tolerant design does however include two CCUs which needs to communicate with each other.This requires a way for both CCUs to receive messages on CAN. A new task, CAN_RX task, wasadded to the CCU in order to handle the incoming CAN messages. When a new CAN messageis received by the CAN peripheral of the CPU, it will generate an interrupt that activates theinterrupt handler. The interrupt handler will in its turn wake up the CAN_RX task in casethat the received message was of any interest of the CCU. The CAN_RX task will then processthe received data and eventually respond with some information, depending on the message idof the received message.
Each CCU implements CAN communication by defining a number of message boxes. Eachmessage box can either be in receive mode or transmit mode, and is defined for a certain CANmessage id. The CAN message ids for each kind of message is presented in Table 7.1. Themessage boxes is internally defined in each unit, and do not have to be the same among theunits in a system. However, CAN message ids are globally defined, which means that the CANmessage id for a message in one unit is the same for another in the same system.
Table 7.1: Id for the different CAN messages.
ID Message0x1 Throttle value0x2 Brake values0x3 Steer request0x4 Alive signal0x12C Steering value
No changes has been made to the steering task since all the safety mechanism concerning thesteering is made in CAN_TX and CAN_RX. These safety mechanisms include recapturing ofthe steering value and steer-by-brakes.
7.1.2 Voting
Two voting algorithms have been developed in order to detect or prevent faults. A majority voterhave been developed to be able to specify a majority in a set of values. A median voter have
49

7 IMPLEMENTATION
been developed to verify the plausibility of a value.
The algorithm used for the majority voting is MJRTY by Boyer & Moore [24] which is a linear-time majority voter. The majority voter is used by the CAN_TX task to determine if there hasbeen any bit flips since the values was processed and stored. If a majority cannot be decided, alocal error flag is risen to inform the watchdog task. Otherwise the correct value is returned.
The median voter determines the median value of a number of values in a list. If the values differtoo much, the median voter will notify the watchdog task by raising the error flag. The medianvoter takes a list of values and the number of values in the list as argument. It compares thefirst value with the other values in the list by calculating the difference between the first valueand next value, one by one. If the difference between the first value and another value is belowa pre-defined constant, a counter is increased. The pre-defined constant sets the sensitivity ofthe median voter. When all values have been compared with the first value, the counter is beinginvestigated. If the counter is greater than the original number of values divided by two, thefirst value of the list is the median value. If the counter is less than the original number of valuesdivided by two, the median voting will be called with the same list but shifted once to the leftand the number of values decreased by one. If the number of values is equal to one and nomedian value have been established, the error flag will be risen.
7.1.3 Recapture of steering value
If one of the CCUs encounter an error and gets restarted by the hardware monitor, it loses alltemporary data that is stored in variables on ram memory, including sensor values. Most of thedata is independent of current state and can easily be fetched after a restart. This applies tothe sensor values of throttle and brake. Steering value however, is a little more complicated.Since the CCU counts the number of interrupts fetched from the steering sensor in order to keeptrack of the steering value, the CCU cannot continue after a restart since it has no informationregarding the angle of the wheels. To retain the wheel angle, the system utilizes the fact thatthe backup CCU runs hot standby and therefore holds the correct value of the steering value.A request will be sent on CAN in the startup sequence of the CCU, in order to retrieve thecurrent steering value from the other CCUs. If both CCUs starts up at the same time, none ofthem will get a response and both will, after 3x2 ms, assume that the steering sensor is in homeposition.
The timeout of 2 ms is based on the time it takes for one CCU to send a request and get theresponse. In the meantime, the other CCU have to get the request, process the data and sendthe response, which is illustrated in Figure 7.4. If the first request or response for some reasondoes not arrive, the CCU tries to send a request two times more before it assumes that thesteering sensor is in home position, hence after 3x2 ms. The time in between a request and aresponse can vary a bit from time to time, depending on current load on CAN bus and the timeit takes for the CCU to catch the interrupt from the CAN peripheral. Measurements were madeto estimate the time it takes in between a request and a response. The result showed that thetime varies from 0.2 ms to 1 ms. Therefore 1 ms plus an overhead of 1 ms was chosen as thetimeout.
To make sure that steering value is recaptured as early as possible, recapturing is made beforethe OS spawns the tasks that constitutes the drive-by-wire functionality of the CCU, includingthe CAN_RX task. This means that the interrupt handler must check if the CAN_RX taskis spawned before it can redirect any incoming CAN messages. Since this is not the case whenthe CCU waits for the response of the steer value, it has to frequently check for incoming CANmessages, i.e., polling.
50

7 IMPLEMENTATION
The case when both CCUs startup at the same time is illustrated in Figure 7.5.
request steer value
respond steer value
receive steer request
receive steer value
CCU 1 CCU 2
time (ms)
0
2
Figure 7.4: Messages on CAN bus to recapture steering value.
request steer value
CCU 1 CCU 2
time (ms)
0
6
request steer value
assume default value assume default value
Figure 7.5: Messages on CAN bus for recapturing the steering value when both CCUs startupat the same time.
7.1.4 Determination of a failed central control unit
When primary central control unit (CCU) encounter a failure, it will either get restarted or shutdown by its hardware monitor. When the primary CCU is either restarting or shut down, itwill temporarily or permanently stop sending data on the CAN bus and the backup CCU candetermine that it is time to take over. Though, when backup CCU encounters an error, thereis no way for primary CCU to get this information since the backup CCU is standby and doesnot send any information on CAN. To resolve this problem, it was decided to let backup CCUsend an alive signal periodically on CAN. If primary CCU does not get the alive signal withina certain time window, it will assume that the backup CCU is either shut down or temporarilyrestarting. With this information, both CCUs will have knowledge whether the other CCU ispresent or not. The active CCU can then prevent itself from restarting when the other CCU isbroken, even though a failure is detected. This feature is implemented to prevent both CCUsfrom restarting at the same time. If there would be some point in time when no CCU is active,
51

7 IMPLEMENTATION
information regarding current steering angle will be lost, which would lead to a critical failure ofthe drive-by-wire system.
7.2 Hardware
This section describes the implementations made in hardware. It involves the duplex CCU, theimplementation of the Hardware monitor and the Distributed-brake ECU. The platforms usedfor main CCU and backup CCU is described in Development platforms.
Figure 7.6 shows how the duplex system will look like. Both CCUs are connected to a hardwaremonitor, which monitors the error pin of corresponding CCU continuously. When an error isdetected, the hardware monitor will restart the CCU. Sensor values will be distributed to bothCCUs and the ECUs will get values from the active CCU sending the values via the CANbus.
�������
���������
��� ������
� ������
���������
���� ��� ���
���� ������
���
�������������� �����
���� �����
����������
����������
������������
�������
���� ��
�������
���� ��
Figure 7.6: Hardware implementation of the fault-tolerant system showing the main centralcontrol unit (CCU) and the backup CCU running in hot-standby mode.
7.2.1 Primary and backup central control unit
A picture of the primary central control unit (CCU) can be seen in Figure 7.7. On the left handside of the lid, there are four toggle switches. These switches are used for software implementedfault injections to force the CCU to set the error pin after various times. First switch sets theerror pin every 100 ms, second switch corresponds to 60 ms and third switch corresponds to 20ms. Fourth switch is reserved for future use. The error pin is connected to the hardware monitorwhich is mounted beneath the lid. The three diodes visible on the right hand side of the lidshows the current status of the hardware monitor. On the top-right corner of the lid, there isa switch which enables the functionality to turn the hardware monitor on or off. On the righthand side of the CCU (not visible in the picture), there is a connector to connect the CCU tothe CAN bus, the sensors and communication to a display.
A picture of the backup CCU can be seen in figure 7.8. The connector in the middle is corre-sponding to the connector of the primary CCU. The three diodes and the toggle switch at the
52

7 IMPLEMENTATION
top do also correspond with the functionality of diodes and the toggle switch at the top rightcorner of the primary CCU.
Figure 7.7: Picture of the main/primarycentral control unit.
Figure 7.8: Picture of the implementedbackup/secondary central control unit.
7.2.2 Hardware monitor
The hardware (HW) monitor, which can be seen in Figure 7.9, is a separate circuit boardresponsible for restarting the CCU if a failure is detected. The functionality is implementedin a Xilinx XC9572XL CPLD [25]. The CPLD runs at a clock speed of 10 MHz provided by anoscillator. A linear voltage regulator converts the voltage from 5 V to 3.3 V which is required bythe CPLD and the oscillator. Three diodes, green, yellow and red, is used to present the currentstatus of the hardware monitor. There is also a JTAG interface to enable reconfiguration anddebugging of the hardware in the CPLD. The signal ERROR (further referred to as nError) isthe signal going from the error pin on the CCU to the HW monitor, which indicates when anerror has occured. The RESET (further referred to as nReset) is the signal going from the HWmonitor and used to reset the CCU when an error has occurred.
Figure 7.9: Picture of the hardware monitor.
The state diagram for the implementation of the HW monitor used to monitor the primary andsecondary CCU is shown in Figure 7.10. When no error is detected by the CCU the HW monitor
53

7 IMPLEMENTATION
is in state S0, which is the initial state. When an error is detected and nError signal goes low,the transition to state S1 occurs. State S1 has two main functions. The first one is to preventa restart of the CCU if a glitch has occurred, showed in Figure 7.11, but also to ignore theinitiation of the nError (occurs after system reset) of the CCU when a reset has occurred, shownin Figure 7.12. The delay is 7 ms, which is the length of the initiation of the nError of the CCUafter reset.
After the delay in S1, the internal signal "Delay ok" goes high and transition to state S2 occurs.State S2 checks if the error was a glitch or if the reset initiation has been made of the nErrorsignal. If one of these has occurred, the nError signal will be 1 after the delay and transition toS0 will occur. However, if the nError signal is still 0 after the delay, transition to state S3 occurs.At state S3 a system restart will be initiated to the CCU by the HW monitor. When nError isset to 1 again, the CCU has successfully restarted and transition from state S3 to state S1 willoccur.
Another feature of the HW monitor is the internal max time signal, referred to as MT in Figure7.10. The signal MT keeps track of a counter in the CPLD which, when reaching a maximumvalue, will be set to 1 and transition to state "Lock" will occur. When in lock state, the HWmonitor will keep the reset signal at 0, which will shut down the CCU and preventing it fromcorrupting the rest of system. Example of the state transitions for reaching the lock state isshown in Figure 7.13.
�����
����
������
������
����
������
�����
������
����
����
����
����������
���������
���
������
���������
��
������
���������
���
������
�������
��
������� � �
� � �� �
�
� ����
Figure 7.10: State diagram of the hardware monitor.
������
�� � ������
�����
��
Figure 7.11: State transition of the hardwaremonitor when a glitch occurs on the nErrorsignal.
��
������
������������
�� � �� �� ��
����
�����
�����
�����
�
Figure 7.12: State transition of the hardwaremonitor when a transient fault occurs.
54

7 IMPLEMENTATION
��������������� �����
��� ��
������
������
����� �� ���
Figure 7.13: State transition of the hardware monitor when a permanent fault occurs and thestate is forced into the lock state.
The algorithm only increases the counter in the yellow states in Figure 7.10 (state S1,S2 and S3).When the HW monitor is not detecting an error (state S0), the counter counts down instead.This gives a balance to what is assumed as a permanent HW failure, intermittent failure andtransient failure. Behavioural simulation of the hardware functionality is shown in Figures 7.14,7.15, 7.16 and 7.17. The y-axis in the figures shows the count number of the counter and thered top line indicates the maximum tolerable value for the counter which sets the MT signal to1.
The system reaches a lock down when the time between start and failure is under 100 ms, shownin Figures 7.14, 7.15 and 7.16. A time over 100 ms, the system reaches relaxation, seen in Figure7.17. The highest time between start and failure is designed for the system to be able to sendat least one value to the ECUs before restarting. This time was estimated to be around 80 msafter start-up.
0 20 40 60 80 1000
2
4
6
8
10
12
14x 10
4
Time (ms)
Cou
nter
val
ue
Figure 7.14: Function of the hardware moni-tor when time between failures in the centralcontrol unit is 40 ms. Number of resets beforelocking the CCU is 1.
0 50 100 150 200 250 300 350 4000
2
4
6
8
10
12
14x 10
4
Time (ms)
Cou
nter
val
ue
Figure 7.15: Function of the hardware moni-tor when time between failures in the centralcontrol unit is 60 ms. Number of resets beforelocking the CCU is 2.
55

7 IMPLEMENTATION
0 200 400 600 800 10000
2
4
6
8
10
12
14x 10
4
Time (ms)
Cou
nter
val
ue
Figure 7.16: Function of the hardware moni-tor when time between failures in the centralcontrol unit is 80 ms. Number of resets beforelocking the CCU is 6.
0 200 400 600 800 10000
2
4
6
8
10
12
14x 10
4
Time (ms)
Cou
nter
val
ue
Figure 7.17: Function of the hardware moni-tor when time between failures in the centralcontrol unit is 100 ms. The CCU relaxes aftereach reset and is therefore not locked.
7.2.3 Development platforms
The platform that is used by the main CCU is the Texas Instruments Hercules development boardTMS570LS3137 [6] on which the reference system was implemented [5]. The backup system isimplemented on a Texas Instruments Hercules Launchpad TMS570LS04 [26]. The main reasonfor using the launchpad board is that it is compatible with the reference implementation, it isrecommended for the ISO 26262 standard and has all the requirements that is needed for thisthesis (supports CAN protocol, lock-step etc).
7.2.4 Electronic control unit for the distributed-brake
The distributed brake electronic control unit (ECU) is implemented to simulate the steer-by-brakes and distributed brake system for the drive-by-wire system. Figure 7.18 shows a pictureof the implemented distributed brake ECU. The ECU has four servos controlled by pulse widthmodulation (PWM) from a Texas Instruments Hercules Launchpad TMS570LS04. When thesteer-by-brakes functionality of the distributed brake ECU is activated in the CCU, the systemdistributes the brake power in accordance to the current steering angle. This simulates thevehicles control of using the brakes to turn.
Figure 7.18: Picture showing the prototype of the brake ECU that simulates the functionalityof the distributed brakes and steer-by-brake.
56

8 TIMING ANALYSIS
8 Timing analysis
Since implementation of fault tolerance decreases a systems timing performance, this sectiongives a analysis of the run time of each task in the CCU of the existing prototype and the fault-tolerant prototype. The run time in this section is defined as the time from start to finish of atask. The run time was measured by setting an I/O-pin, on the development board, high whena task starts executing and setting it low when the same task stops executing. Each task, exceptin Figure 8.2, executed exclusively to ensure that the presence of other tasks did not affect theresults.
The scheduler in FreeRTOS uses static priorities to decide which task to execute [7]. Every taskis then given a short time slot in which it may run. When two or more tasks with same priorityare competing for execution, round robin algorithm is used decide which one to choose.
8.1 Existing prototype
The brake and throttle tasks are similar in their functionality. Both of them reads the sensorvalue from the ADC and uses functions to convert the thottle/brake value to readable valuefor the ECUs. The task responsible for steering activates when the user changes the positionof the steering wheel. The steering sensor then sends two pulse trains on two I/O pins on thedevelopment board. The difference in phase between the two pulse trains tells whether thesteering wheel is moved to the left or to the right. The processed sensor values are read in theCAN task and handled for sending via CAN to the ECUs [5].
The LCD task reads the throttle, brake and steering data and presents the results onto a dis-play.
The steering task activates on interrupt from the steering sensor, i.e., the steering wheel. Asseen in Figure 8.1, the run time for the steering task is 0.3 µs.
Task for throttle, brake and CAN executes periodically every 10 ms, which can be seen in Figure8.3. As seen in Figure 8.2, the run time for throttle and brake tasks is 8.5 µs and CAN task is3 µs.
57

8 TIMING ANALYSIS
0 50 100 150 200 250 300 350 4000
0.5
1
1.5
2
2.5
3
3.5
Time (ns)
Vol
tage
(V
)
Figure 8.1: Run time for the steering task in the existing prototype.
0 5 10 15 20 25 30 35 400
0.5
1
1.5
2
2.5
3
3.5
Time (µs)
Vol
tage
(V
)
Figure 8.2: Run time for the throttle task(leftmost), brake task(middle) and CANtask(rightmost), in the existing prototype.
58

8 TIMING ANALYSIS
The LCD task is responsible for writing current sensor information to the LCD display. Sincethis is more time consuming, the LCD task only has to execute once every 250 ms. As seen inFigure 8.3, the run time for LCD task is approximately 52 ms.
0 10 20 30 40 50 60 70 800
0.5
1
1.5
2
2.5
3
3.5
Time (ms)
Vol
tage
(V
)
LCDAll other tasks
Figure 8.3: Overview of the run times for all periodic tasks in the existing prototype, i.e., throttletask, brake task and CAN task referred to as other tasks and the LCD task.
There is also some time in between each task since the operating system has to store and load thestack for each task. The overhead time for switching from one task to another is approximately7 µs. An overview of the timing for the different tasks are shown in table 8.1.
Table 8.1: An overview of the run time for the tasks in the existing prototype.
Task name Priority Measured run timeSteering_task Interrupt 0.3 µsBrake_task 1 8.5 µs
Throttle_task 1 8.5 µsCAN_task 1 3 µsLCD_task 1 52 ms
8.2 Fault-tolerant prototype
This section provides the timing analysis of the tasks in the fault-tolerant prototype. Thefault-tolerant prototype has divided the CAN task into a receiver task (interrupt based) andtransmitter task (CAN_TX and CAN_RX). The watchdog task is also implemented to detectany faults in the system. The different tasks are explained in detail in section 7. The steeringtask is not altered and no further analysis is made. The run time for the steering task can beseen in Figure 8.1.
59

8 TIMING ANALYSIS
Figure 8.4 shows the run time for the brake and throttle tasks of the fault-tolerant prototype.The brake and throttle task reads and processes the sensor value five times to ensure temporalredundancy between the sensor reads. Between each read, the task is preempted, enabling othertasks to be executed in the meantime.
−2 −1 0 1 2 3 4 5 60
0.5
1
1.5
2
2.5
3
3.5
Time (ms)
Vol
tage
(V
)
Figure 8.4: Overview of the run time for the Brake (or Thottle) task in the fault-tolerant proto-type. The sensor is reading the values 5 times for the median voter with a delay of 1 ms betweeneach read.
Figure 8.5 shows the run time of one sensor value reading for the throttle and brake task. Bothtasks are similar in structure and therefore the run time is practically the same. The timebetween the two tasks is overhead time within the FREERTOS kernel.
60

8 TIMING ANALYSIS
0 5 10 15 20 25 300
0.5
1
1.5
2
2.5
3
3.5
4
Time (µs)
Vol
tage
(V
)
BrakeThrottle
Figure 8.5: Detailed run time for one sensor reading for the brake and throttle tasks in thefault-tolerant prototype.
The CAN task has been divided into two tasks in the fault-tolerant prototype, CAN_RX andCAN_TX. The CAN_RX task is executed when a valid CAN message is received. An interruptbased function activates when CAN messages are being received and checks if the CAN messageis of interest. The run time of the CAN_RX task can be seen in Figure 8.6. The CAN_TX taskis executed periodically and sends values for brake, throttle and steering to the different ECUs viathe CAN bus. Figure 8.7 shows the run time for the CAN_TX task. The run time for CAN_TXdiffers somewhat depending on if the primary steering or steer-by-brakes functionality is active.From the figure it can be seen that the run time is 1 µs longer for when the steer-by-brakesfunctionality is active compared to the primary steering.
61

8 TIMING ANALYSIS
0 50 100 150 200 250 300 350 4000
0.5
1
1.5
2
2.5
3
3.5
4
Time (ns)
Vol
tage
(V
)
Figure 8.6: Run time for the CAN_RX (CAN receive) task in the fault-tolerant prototype.
0 1 2 3 4 5 6 7 80
0.5
1
1.5
2
2.5
3
3.5
4
Time (µs)
Vol
tage
(V
)
Primary steeringSteer−by−brakes
Figure 8.7: Run time for the CAN_TX (CAN transmit) task in the fault-tolerant prototype,with the primary steering and with the primary steering failed and steer-by-brakes active.
62

8 TIMING ANALYSIS
The run time for the watchdog task can be seen in Figure 8.8. The run time for the watchdog is0.7 µs.
0 100 200 300 400 500 600 700 8000
0.5
1
1.5
2
2.5
3
3.5
4
Time (ns)
Vol
tage
(V
)
Figure 8.8: Run time for the watchdog task in the fault-tolerant prototype.
The run time of all tasks including the LCD task (only executed on the main CCU) is shownin Figure 8.9. Notice that all tasks are periodic and the LCD task finishes before its intendeddeadline of 250 ms. The figure shows that all tasks meet their deadlines and the system is stable.The LCD task is finished executing around 52 ms and the other tasks continue their executionat a rate of 10 ms. The LCD task is executing again at time 250 ms. It should be mentionedthat the LCD task is not utilizing the CPU for 52 ms. The LCD_task consists mainly of waitingtime when communicating with the LCD display [5]. Other tasks can execute in the meantimeas the LCD_task waits for response from the display.
63

8 TIMING ANALYSIS
0 10 20 30 40 50 60 70 800
0.5
1
1.5
2
2.5
3
3.5
Time (ms)
Vol
tage
(V
)
LCDAll other tasks
Figure 8.9: Run time for all tasks, in the fault-tolerant prototype. Blue line indicates the LCDtask, green line indicates all other tasks.
Table 8.2 shows an overview of the run time for the different tasks. The task holding the longestrun time is the LCD task, followed by the brake and throttle task and last the CAN_TX task.The other task are shown to be negligibly small. It should be noted that neither the LCD task,throttle task or the brake task are fully occupying the CPU load when executing. Large partsof the tasks are only wait statements ordering the task to wait a number of milliseconds. Forexample, the brake and throttle tasks processes the read value and then waits for 1 ms beforereading again. Other tasks can run during the time it is waiting for the next value read.
Table 8.2: Overview of the run time for the tasks in the fault-tolerant prototype.
Task name Priority Measured run timeSteering_task Interrupt 0.3 µsBrake_task 1 4 ms
Throttle_task 1 4 msCAN_RX Interrupt 0.35 µsCAN_TX 1 6.8 µs to 7.8 µs
Watchdog_task 1 0.7 µsLCD_task 2 52 ms
64

9 TEST AND VERIFICATION
9 Test and verification
This section explains the methods used to test and verify the functional safety mechanisms of thefault-tolerant prototype. The tests includes Software Implemented Fault Injections (SWIFI) andpin-level fault injection. Figure 9.1 shows where the faults were injected. The fault injectionswere the following:
1. Corrupting the sensors value for brake and throttle. By disconnecting the brake andthrottle sensors, the ADC will no longer be provided with stable signals. The input to theADC will therefore be affected by high-frequency noise from rest of the electronics. TheADC will still output a signal, though with a frequently varying voltage level. Since themultiple reading of values is separated by 1 ms, the discontinuities in the sensor value willbe detected by the median voter.
2. Corrupting sensitive memory banks. The processed data are stored in multiple memorylocations. By manually, in software, changing the values of one of these, the functionalityof the majority voter is tested. Since two correct values out of three still makes a majority,no error is raised. By changing two out of three values, the majority voter can not establisha majority and it will notify the watchdog task that an error have been encountered.
3. SWIFI of the read sensor values. By changing the sensor values of throttle and brake,during the time they are being read, the functionality of median voter can be tested andverified. To enable this test, software have to be added to the function that reads thesensor values for throttle and brake. By introducing faults so that 3 out of 5 sensor readsdiffer more than 300 between each other, the median voter should detect this fault andnotify the watchdog task.
4. Fault injection at system level. To enable steer-by-brakes, there has to be some wayto detect that the steering ECU or the steering actuator have failed. This functionality issupposed to be implemented in the steering ECU itself. Since it is not covered by the scopeof this thesis to implement functional safety for the ECUs, there is a button connected toboth CCUs. When this button is pushed down, the CCUs will assume that steering ECUhave detected an error. The active CCU will then enable steer-by-brakes.
Fault injection to test the duplex redundancy is made by disconnecting one of the CCUsfrom the CAN bus. This will be detected by the other CCU which will take over execution.This can be accomplished since both CCUs are monitoring the CAN bus. For example, ifmain CCU is disconnected from the CAN bus, it can not send any data on the CAN bus.The watchdog task of the backup CCU will notice this when the timer, corresponding tolatest received message, of the primary CCU runs out. The backup CCU will then assumethat main CCU has malfunctioned and take over the execution.
65

9 TEST AND VERIFICATION
�������
���������
���� ����
����
��������
��������
�������
���
������
�����
�����
��������
���
���
�������
�������� ���
�����!�����
!������
�����
�����
��������
��������
����������������
���
�
�
�
�
����
�����
��������
�����
��"�#�
��� �
$���
������
���
"%���#�
����
���
Figure 9.1: Overview of the functional testing of the fault-tolerant prototype. The fault injectionsare marked with a yellow circle with a number.
9.1 Software implemented fault injections
Fault injections are emulated in the software code and at the input of the system. Code fortesting is made to ensure the verification of units in the system.
9.1.1 Testing the functionality of hardware monitor
By connecting three different buttons to three general purpose input/output (GPIO) pins onthe main CCU representing 100 ms, 60 ms and 20 ms of fail rate respectively, one could analysethe functionality of the hardware monitor. A new task was created in order to simulate thisbehaviour. The task was named error_task, and when the button representing 100 ms fail rateis held down, the error_task will activate the error pin after 100 ms. Since 100 ms is abovethe accepted limit of the hardware monitor this will result in a continuous restart loop until thebutton is released. When the button of 60 ms is held down the hardware monitor will restart theCCU a couple of times until the hardware monitors counter reaches maximum value and locksthe CCU. When the button of 20 ms is held down the hardware monitor will restart the CCUonce and then lock the CCU. An important assumption is that the error_task starts executingas soon as possible. If for example, the error_task starts executing 10 ms after restart, thiswould add to the time period of the fail rate. These tests confirms that the functionality of thehardware monitor works as intended.
9.1.2 Testing the functionality of majority voter
Majority voter protects the values of throttle and brake from being altered during the time afterthey have been processed and before they are sent to the ECUs. By changing one of the values,
66
9 TEST AND VERIFICATION
which are being voted, during this time slot one can see that the system remains unchanged. Iftwo values are changed, no majority can be established and the watchdog task will be informedto activate the error pin. As an effect of this the system will be restarted by the hardwaremonitor.
9.1.3 Testing the functionality of median voter
The functionality of the median voter was tested and verified by changing the sensor values ofthrottle and/or brake in the meantime as they were read. The changes made to the reading ofthe sensor values involved increasing or decreasing the values. If 3, or more, out of 5 readingsdiffer with more than 300, the median voter will notify the watchdog task that an error hasoccurred. If 2, or less, out of 5 readings differ with more than 300, a fault is detected but canbe prevented from propagating to an error (right value is provided). This fault injection wasimplemented by changing the software of the function responsible for reading the sensor valuesfor brake and throttle.
9.2 Pin fault injection
By disconnecting the sensor for throttle and brake, the input to the CCU will get affected byhigh frequency noise. This will result in that the values of the sensors will look discontinues overtime.
By disconnecting one of the CCUs from the CAN bus, it is possible to test how the otherCCU responds. If the backup CCU gets disconnected, the main CCU acts as normal, butprevents the watchdog task from reporting any errors to the hardware monitor. If the mainCCU gets disconnected, the backup CCU takes over execution and prevents the watchdog taskfrom reporting any errors to the hardware monitor. The prevention of reporting errors to thehardware monitor is active when there is only one functioning CCU left in the system. This isdue to that the steering value will be lost if the last functioning CCU gets restarted.
67

9 TEST AND VERIFICATION
68

10 DISCUSSION
10 Discussion
In this thesis, we have suggested an architecture for a fault-tolerant drive-by-wire design andcompared it to a non-fault-tolerant reference design. The architecture for the fault-tolerantdesign implements a distributed brake system with steer-by-brakes functionality (brake-and-steersystem) and dual modular redundancy for a central control unit (CCU).
We can clearly see that by introducing dual modular redundancy for the CCU, the reliabilityincreases significantly. With the failure rate for the CCU being 5 ∗ 10−7 failures per hour, areliability of approximately 99.99% lies within the lifespan of a car for the fault-tolerant designwhilst the non–fault-tolerant design does not achieve a reliability of 99.9% for the same failurerate after one year. This observation is represented in Figure 6.5.
Reliability for the brake-and-steer system achieves a 99% reliability after approximately 14 yearswith a failure rate of 5∗10−7 failures per hour. The reference design achieves a reliability of 99%after approximately 1 year with the same failure rate, as can be seen in Figure 6.12.
We can conclude that the suggested fault-tolerant design achieves a significantly higher relia-bility compared to the non-fault-tolerant reference design. The fault-tolerant design achieves areliability of 99.99% within the lifespan of a car, concidering a failure rate of 5 ∗ 10−7 failuresper hour.
An analysis was made to show the intersection points of the steer and brake system for thereference design and fault-tolerant design. The analysis is shown in Figure 6.13. When loweringthe failure rate, the fault-tolerant design gets a larger reliability improvement compared to thereference design. This is important from a designer perspective, where the reliability increase forthe fault-tolerant design compared to the reference design is shown to improve for smaller failurerates.
A sensitivity analysis was established with respect to the coverage factor for the fault-tolerantdesign. The analysis shows that the duplex CCU needs to fulfill a coverage factor of at least 95%and a failure rate of 10−9 failures per hour to meet the target reliability of five-nines (99.999%) ina vehicle lifespan of 10 years. For the brake-and-steer system a coverage factor of 97% is neededto reach the target reliability in the vehicle lifespan for the same failure rate.
Since the reference design cannot guarantee a predicted behaviour in case of failure, there wasno mechanism to guarantee safety. The fault-tolerant design has safety mechanisms to ensuretransition to a safe state if the system suffers from a failure. In section 6.3, we describe howsafety can be implemented in the fault-tolerant design according to the ISO 26262. Figure 6.17shows how the safety of the throttle system in the fault-tolerant design was developed to ensuresafety. We suggest that when the CCU system or brake-and-steer system is in degraded mode,a warning lamp should be lit to notify the driver. The driver is then assumed to stop the vehicleor drive to the closest workshop. Figure 6.18 and 6.19 shows the probability of the CCU andbrake-and-steer system, respectivley, to ensure safety. The calculation of the safety can either beestimated using two random variables for transition from the degraded state to the critical-failurestate and fail-safe state. One can also estimate the maximum slow-down time for the driver orthe system to put the vehicle to a stop.
The purpose of making the prototype of the fault-tolerant design was to demonstrate how asystem can be implemented when considering fault tolerance by following the guidelines of theISO 26262. The contributions covered in this thesis, to make the previous prototype moretolerant to faults, is the implementation of a hardware monitor, distributed brake system withsteer-by-brakes functionality and safety mechanisms in the CCU to handle fault detection forsensor values.
69

10 DISCUSSION
Two different designs for the hardware monitor is suggested; distributed-reset design and self-reset design. The one which was implemented in the prototype was the self-reset design. Oneimportant aspect which advocates the self-reset design is that the occurrence of a non-coveredfault will not affect the execution of the other CCU.
We do consider the hardware monitor as ideal. This means that the failure rate is not taken intoaccount when making the analysis for safety and reliability of the whole drive-by-wire system.The design of the hardware monitor in this thesis gives a good layout of how a monitor can bedesigned to detect different kind of faults and prevent them for further causing damage to thesystem.
The distributed brake system was implemented to demonstrate the functionality of the steer-by-brakes and distributed brake system. The system receives the brake values of all four brakesfrom the CCU, were the CCU makes the decisions regarding how each brake will be affected bythe steer-by-brakes functionality.
70

11 CONCLUSION AND FUTURE WORK
11 Conclusion and future work
Design of a fault-tolerant drive-by-wire system was developed and compared to a non-faulttolerant design to show the significant increase in reliability and safety when fault tolerance isintroduced. This thesis proposes a cost effective fault-tolerant design consisting of a distributedbrake system with steer-by-brakes functionality and dual modular redundancy for the centralcontrol unit.
We have also provided contributions to an existing non-fault tolerant prototype. Considering thedesign choices of the fault-tolerant design, we have implemented a hardware monitor, distributedbrake system with steer-by-brake functionality and safety mechanisms in the central controlunit. We have further shown how testing of the functional correctness for both prototypes wasperformed.
Development of the system architecture was influenced by the consideration that the systemwould be implemented in a more realistic future design. With this consideration, the fault-tolerant prototype has a good layout for further development, such as implementation of realactuators and sensors for a full-sized vehicle. For future development it would also be of interestto develop real ECUs for throttle, brake and steering to be used for the CCU in the fault-tolerantprototype.
All communication works through one CAN bus. Since the CAN bus is a single point of failurein the system, we suggest that this part should be made redundant. One solution for this isto have a redundant CAN bus working as a duplex system. Failure in one of the CAN buseswill still provide communication between the different subsystems. Another solution is to use astar-net between the modules in the system. When a failing CAN-line is detected (due to cablebrake or babbling idiot phenomena), the CAN communication can be redirected to take anotherpath in the network of the ECUs and CCUs. The second solution is also more cost and weighteffective.
71

11 CONCLUSION AND FUTURE WORK
72

REFERENCES
References
[1] N. Estep, J. Petrosky, J. McClory, Y. Kim, and A. Terzuoli, “Electromagnetic interferenceand ionizing radiation effects on cmos devices,” Plasma Science, IEEE Transactions on,vol. 40, no. 6, pp. 1495–1501, June 2012.
[2] T. D. o. E. E. Ma and P. S. N. L. Dressendorfer, Ionizing radiation effects in MOS devices andcircuits, Jan 1989. [Online]. Available: http://www.osti.gov/scitech/servlets/purl/6945296
[3] E. Snow, A. Grove, and D. Fitzgerald, “Effects of ionizing radiation on oxidized siliconsurfaces and planar devices,” Proceedings of the IEEE, vol. 55, no. 7, pp. 1168–1185, July1967.
[4] “Road vehicles - functional safety (iso 26262),” Geneva, Switzerland, 2011.
[5] A. Angerd and A. Johansson, “Design and implementation of a central control unit in anautomotive drive-by-wire system.”
[6] Tms570ls31x hercules development kit @ONLINE. Texas Instruments. Accessed: 2014-02-01. [Online]. Available: http://www.ti.com/tool/tmds570ls31hdk
[7] Freertos - a free rtos for small real time embedded systems @ONLINE. Accessed: 2014-03-11.[Online]. Available: http://thetoolchain.com/datasheets/FreeRTOS_manual.pdf
[8] 8-bit atmel microcontroller with 128kbytes in-system programmable flash @ONLINE. Atmel.Accessed: 2014-02-01. [Online]. Available: http://www.atmel.com/Images/doc2467.pdf
[9] N. R. Storey, Safety Critical Computer Systems. Boston, MA, USA: Addison-Wesley Long-man Publishing Co., Inc., 1996.
[10] A. Avizienis, J. . Laprie, B. Randell, and C. Landwehr, “Basic concepts and taxonomy of de-pendable and secure computing,” IEEE Transactions on Dependable and Secure Computing,vol. 1, no. 1, pp. 11–33, 2004.
[11] A. W. Strong and I. X. (e-book collection), Reliability wearout mechanisms in advancedCMOS technologies. Piscataway, NJ; Hoboken, NJ: Wiley-IEEE Press, 2009. [Online].Available: www.summon.com
[12] P. Johannessen, “On the design of electrical architectures for safety-critical automotive sys-tems,” Ph.D. dissertation, Chalmers University uf technology, department of Computerscience and Engineering, 2004.
[13] R. Johansson, “On distributed control-by-wire system for critical applications,” Ph.D. disser-tation, Chalmers University of technology, department of Computer science and Engineering,2005.
[14] J. Brazendale, “Iec 1508: Functional safety: Safety-related systems,” in Software EngineeringStandards Symposium, 1995. (ISESS’95) ’Experience and Practice’, Proceedings., SecondIEEE International, Aug 1995, pp. 8–17.
[15] D. Skarin, “On fault injection-based assessment of safety-critical systems,” Ph.D. disserta-tion, Chalmers University uf technology, department of Computer science and Engineering,2010.
[16] T. Pilutti, “Vehicle steering intervention through differential braking effects on cmos de-vices,” Journal of dynamic systems, measurement, and control, vol. 120, no. 3, pp. 314–,1998.
73

REFERENCES
[17] ——, “Vehicle lateral control and yaw stability control through differential braking,” Indus-trial Electronics, IEEE International Symposium, vol. 1, pp. 384 – 389, July 2006.
[18] J. Demerly, “Method and system for providing secondary vehicle directional controlthrough braking,” Oct. 2004, uS Patent 6,808,041. [Online]. Available: https://www.google.com/patents/US6808041
[19] T. A. Peter Alan Lee, Fault Tolerance - Principles and Practice, 1990, vol. 3.
[20] “Average vehicle age,” 2010, statistics. [Online]. Available: http://www.acea.be/statistics/tag/category/average-vehicle-age
[21] “Polk finds average age of light vehicles continues to rise,” August 2013. [On-line]. Available: https://www.polk.com/company/news/polk_finds_average_age_of_light_vehicles_continues_to_rise
[22] A. Bobbio and K. Trivedi, “An aggregation technique for the transient analysis of stiff markovchains,” Computers, IEEE Transactions on, vol. C-35, no. 9, pp. 803–814, Sept 1986.
[23] Ordinary differential equation @ONLINE. Accessed: 2014-05-12. [Online]. Available:http://www.mathworks.se/help/matlab/ordinary-differential-equations.html
[24] R. S. Boyer and J. S. Moore, “Mjrty: A fast majority vote algorithm,” in ComputationalLogic - Essays in Honor of Alan Robinson, 1991, pp. 105–118.
[25] Xc9572xl high performance cpld @ONLINE. XILINX. Accessed: 2014-05-26. [Online].Available: http://www.ti.com/tool/launchxl-tms57004
[26] Hercules tms570ls04x/03x launchpad evaluation kit @ONLINE. Texas Instruments.Accessed: 2014-02-01. [Online]. Available: http://www.xilinx.com/support/documentation/data_sheets/ds057.pdf
74