DESIGN AND IMPLEMENTATION OF A COLLABORATIVE FREELANCERS ...
Upload
duonghuongCategory
view
219download
2
DESIGN AND IMPLEMENTATION OF A
COASTAL COLLABORATIVE GIS TO SUPPORT SEA LEVEL
RISE AND STORM SURGE ADAPTATION STRATEGIES
TITUS TIENAAH
March 2011
TECHNICAL REPORT NO. 276

DESIGN AND IMPLEMENTATION OF A COASTAL COLLABORATIVE GIS TO
SUPPORT SEA LEVEL RISE AND STORM SURGE ADAPTATION STRATEGIES
Titus Tienaah
Department of Geodesy and Geomatics Engineering University of New Brunswick
P.O. Box 4400 Fredericton, N.B.
Canada E3B 5A3
March, 2011
© Tienaah Titus, 2011
PREFACE
This technical report is a reproduction of a thesis submitted in partial fulfillment of
the requirements for the degree of Master of Science in Engineering in the Department of
Geodesy and Geomatics Engineering, March 2011. The research was supervised by Dr.
Sue Nichols, and support was provided by International Community University Research
Alliance.
As with any copyrighted material, permission to reprint or quote extensively from this
report must be received from the author. The citation to this work should appear as
follows:
Tienaah, Titus (2011). Design and Implementation of a Costal Collaborative GIS to
Support Sea Level Rise and Storm Surge Adaptation Strategies. M.Sc.E. thesis, Department of Geodesy and Geomatics Engineering Technical Report No. 276, University of New Brunswick, Fredericton, New Brunswick, Canada, 187 pp.

ii
DEDICATION
I dedicate this research to my parents Mr. and Mrs. Tienaah, for their encouragements
and interest in my education.
iii
ABSTRACT
The ICURA C-Change is a collaboration of universities and eight communities in
Canada and the Caribbean to develop adaptation strategies for the effects of sea level rise
and storm surges. These vulnerable communities have topographic and sea level data,
ranging from high to low precision for developing scientific scenarios of coastal threats.
Scientific scenarios without precise data lead to gaps in quantifying the extent of threats
in coastal communities, which is vital in developing adaptation strategies. This research
develops an online Coastal Collaborative GIS (CCGIS) using local knowledge as input in
threat mapping to supplement existing data.
The CCGIS developed using the Zend Framework, OpenLayers and ExtJS provide
both server-side and client-side programming to embed Google and Bing Maps as base
layers to capture spatial input described with multimedia. The purpose was to develop a
low cost, user-friendly system, which could be used in any community. Local knowledge
acquired in a coastal community is digitized as point, line, and polygons representing a
location, linear and area features respectively. Descriptions of spatial objects with rich
attributes such as video, audio, pictures, and text captured in a local environment
compliment the CCGIS spatial abstraction. A prototype review mechanism and a peer
review process to maintain a degree of trust in contributors and their contributions was
implemented.
This research evaluated the developed CCGIS prototype based on user and system
requirements. User tests indicated functional requirements were achieved with more
improvements required in some areas.

iv
ACKNOWLEDGEMENTS
The feat achieved by this research could not have been possible without the help and
support of the following:
• My special thanks Dr. Susan E. Nichols my thesis advisor for her feedback, and
unflinching support throughout the period of study at the University of New
Brunswick. I am also very grateful to Dr. David J. Coleman for his constructive
feedback on this research and write-up.
• Many thanks to the C-Change research team for their feedback and support
throughout various stages of software development and testing. I am very grateful
to the Don Poole and Hope Gunn at the Planning and Development, City of
Charlottetown for their suggestions on this thesis.
• I am highly indebted to all the open source tools used in this research, if I can see
far it is because I am standing on these shoulders. Thanks to Timothy Astle from
CARIS for his intro into the open source geospatial web. My special thanks to all
my friends that responded to test the CCGIS, gave corrections, feedback, and
ideas to assist in finishing this dissertation.
• Last but not the least, I am very grateful to NSERC, and the International
Community University Research Alliance (supported by SSHRC and IDRC) for
funding my studies at the University of New Brunswick.
v
Table of Contents
DEDICATION................................................................................................................... ii
ABSTRACT ...................................................................................................................... iii
ACKNOWLEDGEMENTS ............................................................................................ iv
Table of Contents .............................................................................................................. v
List of Tables .................................................................................................................... ix
List of Figures .................................................................................................................... x
List of Abbreviations ....................................................................................................... xi
Chapter One: Introduction .............................................................................................. 1
1.1 Research Problem ...................................................................................................... 3
1.2 Research Goal ............................................................................................................ 6
1.2.1 Research Objectives ......................................................................................... 7
1.2.2 Research Scope ................................................................................................ 7
1.3 Proposed Methodology .............................................................................................. 8
1.4 Research Contribution ............................................................................................. 10
1.5 Thesis Organization ................................................................................................. 10
1.6 Summary .................................................................................................................. 12
Chapter Two: Climate Change, Collaborative Processes, GIS and Requirements .. 13
2.1 Climate Change ........................................................................................................ 13
2.2 Adaptation and Stakeholder Involvement ................................................................ 15
2.3 Local Knowledge and Science ................................................................................. 17
2.4 GIS: Link between Local Knowledge and Science ................................................. 18
2.4.1 Selected Case Studies ..................................................................................... 19
2.4.2 Lessons from Existing Research .................................................................... 22
2.5 Coastal Collaborative GIS (CCGIS) ........................................................................ 23
2.5.1 Uniqueness of the CCGIS .............................................................................. 25
vi
2.6 Geographic Information Systems (GIS) .................................................................. 26
2.6.1 Web GIS ......................................................................................................... 28
2.6.1.2 OGC and Web Services ...................................................................... 29
2.6.2 Web GIS Tools ............................................................................................... 30
2.6.2.1 Web Client Technologies ................................................................... 31
2.6.2.2 Server Technologies ........................................................................... 34
2.6.2.3 Database Technologies ....................................................................... 35
2.7 CCGIS Requirements............................................................................................... 36
2.7.1 User Requirements ......................................................................................... 36
2.7.2 System Requirements ..................................................................................... 37
2.8 Summary .................................................................................................................. 39
Chapter Three: Local Knowledge and Conceptual Framework Design ................... 40
3.1 Knowledge ............................................................................................................... 41
3.1.1 Local and Scientific Knowledge .................................................................... 44
3.1.2 Data, Information, Models, and Knowledge .................................................. 45
3.2 Spatial Abstraction of Knowledge ........................................................................... 48
3.3 System Architecture ................................................................................................. 48
3.3.1 Client Architecture ......................................................................................... 50
3.3.2 Spatial Server and Web Server Framework ................................................... 51
3.3.3 Database Model .............................................................................................. 52
3.4 System Architecture Pattern .................................................................................... 54
3.5 Summary .................................................................................................................. 56
Chapter Four: CCGIS Implementation........................................................................ 58
4.1 Choice of Framework .............................................................................................. 59
4.2 Zend MVC Project Structure ................................................................................... 60
4.3 Client Layout Structure ............................................................................................ 62
4.4 Views, Controller and Model Relationships ............................................................ 64
4.5 Client Side Implementation ..................................................................................... 67
4.5.1 Interface Implementation ............................................................................... 69
vii
4.5.1.1 Index View ......................................................................................... 71
4.5.1.2 Profile View........................................................................................ 71
4.5.1.3 Forum View ........................................................................................ 73
4.5.1.4 Map Creation and Updates Page ........................................................ 74
4.5.1.5 Content Management System ............................................................. 74
4.6 Visualizing Spatial Attributes .................................................................................. 76
4.7 Visualizing Overlapping and Clustered Map Features ............................................ 77
4.7 Spatial Data Format ................................................................................................. 79
4.7.1 Geometry Objects Representation .................................................................. 81
4.8 Spatial Data Flow ..................................................................................................... 83
4.9 GeoJSON on other platforms ................................................................................... 84
4.10 Summary ................................................................................................................ 85
Chapter Five: Evaluation of and Issues with the CCGIS ........................................... 86
5.1 Collaborative Design and Implementations Issues .................................................. 86
5.2 System Evaluation ................................................................................................... 89
5.2.1 Research Objectives ....................................................................................... 89
5.2.2 User Requirements ......................................................................................... 91
5.2.3 Functional Requirements ................................................................................ 92
5.2.4 Non-functional Requirements ........................................................................ 96
5.2.5 CCGIS Initial Usability Feedback Results ..................................................... 97
5.3 System Limitations and Lessons Learned.............................................................. 100
5.4 Role of CCGIS in an Adaptation Process .............................................................. 101
5.5 Summary ................................................................................................................ 102
Chapter Six: Conclusions and Recommendation ...................................................... 103
6.1 Conclusions ............................................................................................................ 103
6.2 Recommendations for Future Research ................................................................. 105
References ...................................................................................................................... 108
Appendix I: Open Source Tools................................................................................... 117

viii
Appendix II: Acknowledged Open Source Libraries ................................................ 125
Appendix III: CCGIS Documentation ........................................................................ 130
Appendix IV: Reviewer Comments ............................................................................. 183
Curriculum Vitae

ix
List of Tables
Table 5.1 CCGIS Evaluation Results................................................................................ 99
x
List of Figures
Figure 1.1 Research Method. .............................................................................................. 9
Figure 2.1 Adaptation Policy Framework (after [Burton et al., 2005]). ........................... 16
Figure 2.2 Types of Software Licences. ........................................................................... 31
Figure 2.3 Web GIS Client Dependencies. ....................................................................... 33
Figure 3.1 The Process of Acquiring Knowledge (after Brazhnik [2005]). ..................... 43
Figure 3.2 Local Knowledge Across Communities. ......................................................... 44
Figure 3.3 Models in a Coastal Adaptation Process. ........................................................ 47
Figure 3.4 CCGIS System Tiers. ...................................................................................... 49
Figure 3.5 Client-side Tier. ............................................................................................... 50
Figure 3.6 Web and Spatial Services Tier ........................................................................ 51
Figure 3.7 Database Model Diagram. ............................................................................... 53
Figure 3.8 The Zend MVC Architecture. .......................................................................... 55
Figure 4.1 Zend MVC Project Structure for the CCGIS. ................................................. 61
Figure 4.2 Generic CCGIS Layout. .................................................................................. 63
Figure 4.3 Relationship Between Various Layouts and Views in the CCGIS. ................ 63
Figure 4.4 Views and Their Actions in IndexController.php ........................................... 64
Figure 4.5 CCGIS Data Model. ........................................................................................ 66
Figure 4.6 Controller Access to the Model Interface ........................................................ 66
Figure 4.7 Views and Their Utility. .................................................................................. 67
Figure 4.8 Index View. ..................................................................................................... 70
Figure 4.9 Profile View..................................................................................................... 72
Figure 4.10 Forum View. .................................................................................................. 73
Figure 4.11 Map Creation and Updates View. ................................................................. 75
Figure 4.12 CMS View. .................................................................................................... 76
Figure 4.13 Feature Attribute Popup Window. ................................................................. 77
Figure 4.14 Bound Selection (SHIFT-KEY + Mouse Drag). ........................................... 78
Figure 4.16 Spatial Data Flow Through the CCGIS ......................................................... 83
Figure 5.1 CCGIS Evaluation Questionnaire.................................................................... 98
xi
List of Abbreviations
Ajax Asynchronous JavaScript and XML APF Adaptation Policy Frameworks API Application Programming Interface CAGIS Community Action Geographic Information System CCGIS Coastal Collaborative GIS CDED1 Canadian Digital Elevation Data (1: 50,000) Level 1 CERN European Laboratory for Particle Physics CGIS Collaborative GIS CMS Content Management System CR Collaborative Reputation CRUD Create, Read, Update, and Delete CSS Cascading Style Sheets DEM Digital Elevation Model DOM Document Object Model ExtJS JavaScript Library FDL Free Documentation License FLV Flash Video (movie file format) GDAL/OGR Geospatial Data Abstraction Library GeoJSON Geographic JavaScript Object Notation (encoding format) GIF Graphics Interchange Format (image file format) GIS Geographic Information Systems GML Geography Markup Language GPL General Public License GSDSS Group Spatial Decision Support Systems HTTP Hypertext Transfer Protocol ICURA International Community University Research Alliance IIS Internet Information Services (web server) IP Internet Protocol (address) IPCC Intergovernmental Panel on Climate Change ISO International Organization for Standardization JPEG/JPG Joint Photographic Experts Group (image file format) JS JavaScript JSON JavaScript Object Notation KML Keyhole Markup Language LEK Local Ecological Knowledge LiDAR Light Detection and Ranging LMAS Linear Map Accuracy Standards for National Topographic Data Base) MP3 Moving Picture Expert Group Audio Layer 3 (audio file format) MP4 Moving Picture Expert Group Layer 4 (movie file format) MPAs Marine Protected Areas MVC Model View Controller OGC Open Geospatial Consortium OSGeo Open Source Geospatial Foundation

xii
OSM Open Street Map OWS OGC Web Services PAR Participatory Action Research PGIS Participatory GIS PHP Hypertext Preprocessor PNG Portable Network Graphics (image file format) PPGIS Public Participatory GIS PRA Participatory Rural Appraisal SOA Service Oriented Architecture SOAP Simple Object Access Protocol SVG Scalable Vector Graphics TEK Traditional Ecological Knowledge UI User Interface UML Unified Model Language WCS Web Coverage Service WFS Web Feature Service WGI First Working Group of the IPCC WKT Well-Known Text format WMS Web Map Service WSDL Web Services Description Language XHTML eXtensible HyperText Markup Language XML Extensible Markup Language
1
Chapter One: Introduction
Climate change poses clear, catastrophic threats.
We may not agree on the extent, but we certainly can't afford the risk of inaction ~ Rupert Murdoch, 2007.
Most low-lying coastal communities around the globe experience the effects of
climate change, translated as sea level rise and other storm events. These effects lead
directly or indirectly to flooding, damage to infrastructure, socio-economic impacts,
water pollution, and health hazards. It is natural for a coastal region, a community, a
household, an economic sector or a population group to respond to these external forces
by developing an approach or method to cope with these consequences. “Adaption” to
these events refers to the ongoing process by which strategies to moderate, cope with, and
take advantage of the consequences of climate events are developed, enhanced, and
implemented to reduce their negative impacts [Ebi et al., 2005].
Universities, governments, and organisations mostly conduct and publish research on
climate change in the scientific domain. However, to implement scientific knowledge in
an adaptation process requires local interaction and co-operation with the people, groups,
or local governments experiencing the effects. It is agreed by many authors that
implementing a sustainable plan requires involvement of all stakeholders to address
diverse interests before a crucial decision is made to reflect the community interest
[Rantanen and Kahila, 2009, Aswani and Lauer, 2006; Tang, 2006; Sieber, 2006;
Cinderby and Forrester, 2005; Al-Kodmany, 1999; etc.].

2
The participation of local people in a geographic context usually involves the use of
maps, physical models, forums, and interviews to exchange implicit or explicit spatial
knowledge. In many sea level rise adaptation projects, relatively precise scientific maps
and scenarios have been used to identify and predict threats to engage the public in
discussion forums. Less attention has been paid to the area where people can express
their views and opinions to threat mapping digitally with local knowledge and experience
of their own environment. This leads to missing rich details captured at the time of
historic events in the form of spatial objects described by pictures, audio, video, or text.
In addition, collection of local experiential knowledge at large public meetings is usually
limited since only one person or a group can articulate their views at a time. It is also
important to keep the stakeholders engaged in a dialogue that has a geographic context
after an interview or public meeting to keep monitoring and modifying adaptation
strategies to changing local issues due to sea level rise and storms. This research will
provide a means to overcome the above limitations in a coastal sea level rise and storms
surge adaptation process.
This chapter sets the stage with the research problem: how can local knowledge be
spatially captured to supplement communities with the best available data in developing
coastal adaption strategies to the effects of sea level rise and storm surges? The chapter
sets out the research objectives, scope, concludes with research contributions and the
overall organisation of this thesis.

3
1.1 Research Problem
Four Canadian coastal communities (Charlottetown, Prince Edward Island; Gibsons,
British Columbia; Isle Madame, Nova Scotia; and Iqaluit, Nunavut) and four in the
Caribbean (Georgetown, Guyana; Grand’ Riviere, Trinidad and Tobago; Belize Barrier
Reef, Belize; and Island of Bequia, Grenadines) are in a collaborative process with
universities in developing adaptation strategies to overcome the effects of sea level rise
and storm surges. Funding to develop adaptation strategies is being provided by two
Canadian agencies: Social Science and Humanities Research Council (SSHRC) and the
International Development Research Centre (IDRC) through their joint International
Community University Research Alliance (ICURA) program. This project, known as C-
Change, will run from 2009 through to 2014 [C-Change, 2010]. The research reported
here is one part of that project.
With growing migration of populations to coastal areas for economic and aesthetic
reasons, human society is becoming increasingly vulnerable to rising mean sea level,
increased frequency of storm-surge flooding, and changing rates of coastal erosion
[McCulloch et al., 2002]. Inherent in the cultural fabric of North Americans is the desire
for owners and developers to have waterfront properties (scenic view of the sea, river,
beach, etc.). These coastal developments, acquisitions and settlements in low-lying areas
are prone to flooding due to sea level rise coupled with storm surges.
The effects of climate change have drawn the attention of world organizations and the
Intergovernmental Panel on Climate Change (IPCC) was formed in 1988 [IPCC, 2007].
The estimated budget for the global mean sea level rise calculated by the first working
4
group (WG I) of the IPCC [2007] showed that sea level rise observed from tide gauges
from 1961 to 2003 was 1.8 ± 0.5mm per year. With advancements in satellite altimetry,
the observed global mean of sea level rise between 1993 and 2003 was estimated to be
3.1 ± 0.7mm per year. This global mean varies from local and regional values due to
local ground subsidence or uplift (described further in Chapter 2). Local sea level rise
coupled with storms can raise water levels by a few metres.
Why are these estimates important to the C-Change project? Storms and floods
because of climate change have direct and indirect impacts on property (residential,
commercial public properties), historical and heritage resources (tourism, heritage,
recreational values), coastal infrastructure (urban and rural infrastructure), health, ground
and surface water pollution, habitat destruction, education, and employment. To avoid the
"...risk of inaction" as stated by Murdock [2007], it is very important to identify
vulnerable coastal areas using the best available data (information) and technologies to
help communities adapt to or mitigate these effects.
Predicting flood zones requires quantification of small changes in water level
(vertical) with respect to coastal topography; usually, vertical estimates range from
decimetres to a few metres. Precise modelling of these small height differences requires a
Digital Elevation Model (DEM). Today, this is often achieved with precise Light
Detection and Ranging (LiDAR). Most LiDAR platforms can provide height, with
uncertainties of ±30 cm or better. For example, the “first and most comprehensive”
economic impacts assessment of storms and sea level rise in Canada conducted in
Charlottetown used LiDAR [McCulloch et al., 2002]. In this study, a Digital Elevation
Model (DEM) covering Charlottetown determined that seawater begins to flood
5
waterfronts at a level of 3.6 metres above chart datum. Presently, this water level is
reached every seven (7) years, and the frequency of this happening will increase with
increasing sea level rise [McCulloch et al., 2002; Environment Canada, 2006].
While very accurate, LiDAR data usually have an initial high cost to acquire. Many
communities have less precise or unavailable data and will have to use other data sources
to determine impacts. Alternative elevation data from most national topographic maps are
much less precise and therefore not as useful. For example, Canadian Digital Elevation
Data (1: 50,000) Level 1 (CDED1) for the City of Charlottetown has a vertical accuracy
of ±10m for the region 011L06 and ±20m for region 011L03 (Linear Map Accuracy
Standards (LMAS) for National Topographic Data Base) [CDED1, 1987]. This amount
of vertical height uncertainty is greater than historic storm events in the City of
Charlottetown. Uncertainties from most national elevation maps make them unreliable
when used for predicting flood zones caused by sea level rise and storm events, which
must account for decimetres to a few metres. Other data sources (e.g. provincial
mapping) also may not have sufficient precision.
In summary, many communities may not be able to afford the benefits of LiDAR to
improve the accuracy of flood mapping and prediction; therefore, coastal communities
are faced with the cost of collecting new data in places where available data is inadequate
or non-existent. The C-Change project includes a variety of conditions from data rich
(e.g., Charlottetown) to “data-poor” (e.g., Isle Madame). The challenge for this research
is to design and implement a platform where the best available data can be augmented by
local knowledge in assessing the effects of sea level rise and storm surges.
6
1.2 Research Goal
The aim of this research is to improve local participation in a coastal collaborative
process. To improve collaboration, this research designs an on-line collaborative system
to capture local knowledge as a means of assessing the effects of sea level rise and storm
surges. The system includes a digital interface for map content creation and visualization,
multiple interfaces for participant interactions, and a digital database to provide and store
new information. The system brings together scientific maps, spatial local knowledge,
comments and participatory forums to facilitate the process of threat mapping [Bodorkós
and Pataki, 2009]. Outputs of this research will help bridge the information gap that
exists in many communities to threat identification using local knowledge and to provide
a means of feedback on scientific scenarios of threats generated with existing topographic
data.
This thesis reviewed a wide range of local, indigenous, public participation and
collaborative research to establish a collaborative process of local knowledge acquisition
(see Chapter 2). The relative term “local” will refer to all forms of coastal settlements
(urban, peri-urban, and rural) or a local decision making group (local government, city
planners, etc.). This helps fulfil a key mandate of the C-Change project, which is to
establish a coastal collaboration between researchers, policy makers and the various local
communities.
7
1.2.1 Research Objectives
To achieve the goal of this research, the following objectives are defined to:
• identify and classify commonly used and supported publicly available web
mapping tools and to identify at least three (3) web tools useful for project
design based on classification,
• design a local knowledge platform for spatial identification of coastal
threats as a result sea level rise and storm surges,
• link the designed web GIS platform and local knowledge in a
collaborative process that can be applied in the eight (8) communities of
the C-Change project, and
• test and evaluate the designed system based on requirements and project
objectives.
1.2.2 Research Scope
A prototype for demonstration was developed based on the following assumptions:
• this research will not create a template for a general purpose adaption
strategy for various communities, since each community issues are
uniquely different and must be studied, planned, and implemented
differently;

8
• the prototype will not attempt to replace physical interaction with coastal
communities; it will only serve as a facilitating tool to enhance such
collaborations;
• this research assumes local users have basic knowledge of computers and
have access to the internet; and
• all tools used in this research design are publicly available with free right
to use, modify, redistribute and redistribute modified copies at no cost.
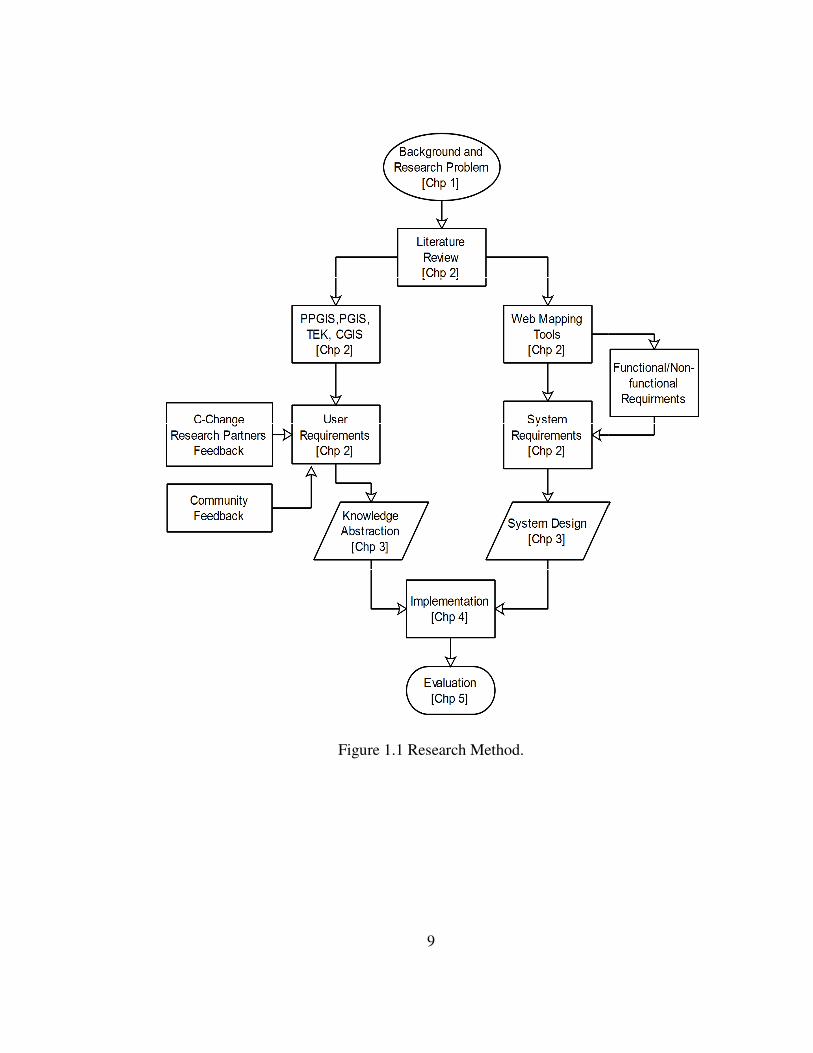
1.3 Proposed Methodology
Generic user requirements obtained and cited are from published literature in
Participatory GIS (PGIS), Participatory Action Research (PAR), Collaborative GIS
(CGIS), Public Participatory GIS (PPGIS), Local Ecological Knowledge (LEK), and
Traditional Ecological Knowledge (TEK). System requirements (functional and non-
functional) derived from a review of online mapping tools provided a generic functional
requirement base. Spatial cognitive knowledge abstracted and captured by digitizing
simple vector objects on a mapping platform are used to indentify threats. Threats
described by adding attribute information such as text, video, audio and images
complimented details lost in spatial abstraction. A prototype forum discussion then
facilitates collaboration towards developing adaptation strategies. A generic flow of
various tasks is as shown in Figure 1.1.
9
Figure 1.1 Research Method.
10
1.4 Research Contribution
The main contribution to the body of knowledge is the design, development and
testing of a low cost Coastal Collaborative Web GIS tool to facilitate collaboration
between scientific researchers, vulnerable coastal communities, and policy makers in
identifying coastal threats related to sea level rise across varied community profiles. This
significant contribution provides spatial local knowledge as a supplement to the best
available scientific data in a coastal collaborative process. In the C-Change project, the
designed system will serve as a feedback mechanism to scientific outputs while also
helping to close the loop in community-university communications in a coastal
adaptation process.
1.5 Thesis Organization
This research is organised into five chapters. Chapter One sets the stage with a
research problem with set objectives within a research scope. A proposed methodology is
presented as an alternative to precise mapping. The chapter ends with research
contributions to the body of knowledge and an overall organisation of this thesis.
Chapter Two contains a literature review on participatory and collaborative
knowledge and its relation to science. The chapter presents a review of relevant case
studies with lessons learned from local knowledge research. User and system

11
requirements are derived from the literature on local knowledge processes and publicly
available web mapping platforms.
Chapter Three constitutes knowledge and knowledge abstraction. The chapter presents
a system design created with user requirements, functional requirements, and non-
functional requirements from Chapter 2. The use of publicly available mapping platforms
is discussed to illustrate its strengths and limitations. Details on data storage, how data is
accessed from the client interface is discussed through Model View Controller (MVC)
pattern. The functions of each MVC pattern conclude this chapter.
Chapter Four in this research involves system implementation based on functional and
non-functional requirements and thesis objectives. The Zend Model View Controller
pattern discussed in Chapter 3, serves as the overall architecture for laying out the
CCGIS. Implementation of components and communication between the client, server,
and database are discussed. The chapter also discusses output formats of this research and
its possible conversion formats to be used on other interoperable GIS platforms.
Chapter Five concludes this research by discussing issues associated with a coastal
collaborative system design and implementation. The chapter concludes with the role of
the platform in an adaptation process, system evaluation, and lessons learned.
Chapter Six concludes this research. The chapter presents concluding remarks and
recommendations for future research.
12
1.6 Summary
This chapter presented a brief overview of this research as a platform to support threat
identification in coastal environments pursuant to sea level rise and storm surges. This
research design and implementation is to help the C-Change project engage stakeholders
in the process of developing adaptation strategies. The research problem is identified with
research objectives and scope to achieve a research goal. A proposed methodology
extracts user requirements from participatory processes and system requirements from
mapping platforms to design a Coastal Collaborative GIS. The chapter lays out the
research contribution and the organisation of this write-up. The next chapter discusses
climate change, GIS participatory processes as a means to derive functional and non-
functional requirement for the CCGIS.
13
Chapter Two: Climate Change, Collaborative Processes, GIS and
Requirements
In the long history of humankind (and animal kind, too) those who learned to collaborate and improvise most effectively
have prevailed ~ Charles Darwin (1809-1882).
This chapter discusses climate change and its associative impacts as a precursor to
how local knowledge can play a role in a sea level rise and storm surge adaption
planning. The chapter goes on to review various collaborative and participatory GIS
processes and web mapping platforms as a means of deriving functional and non-
functional requirements. The chapter concludes with derived requirements for the coastal
collaborative GIS.
2.1 Climate Change
Climate change, as defined by the IPCC, refers to any change in climate over time,
whether due to natural variability or because of human activity [IPCC, 2007]. Changes in
climate are considered to persist over an extended time period, typically decades or
longer. Decadal climate changes are associated with the systematic variations in global
patterns of atmospheric pressure, temperature, and sea surface temperature that persist
from a year or two to multiple decades [Inman and Jenkins, 2005]. This research will
14
focus on specific effects of climate change: coastal flooding caused by sea level rise and
storm surges.
Sea level rise, as well as sea level fall, and storm surges are being experienced and
recorded in all coastal countries. Irrespective of the primary causes of sea-level rise (for
example, climate change, natural or human-induced, subsidence, dynamic ocean effects),
natural coastal systems can be affected in a variety of ways. The effects include,
displacement of ecosystems, alteration of geomorphologic forms, and the vulnerability of
social and physical infrastructure [Chappell, 1990; IPCC, 1996; Crooks and Turner,
1999; Inman and Jenkins, 2005]. From a societal perspective, some of the most important
geophysical effects are: increasing flood frequency probabilities, erosion, inundation,
rising water tables, saltwater intrusion, and habitat changes [Klein and Nicholls, 1999].
Sea level change cannot be translated to a single global measurement. Changes in
regional relative sea level can be large or small based on coastal geomorphologic
configuration, which may be affected by local subsidence, tectonic uplift or changes in
ocean currents, such as the El Niño-Southern Oscillation event [Bijlsma, 1997; Vellinga
and Klein, 1993]. Taking a broad perspective, coastal landform morphology responds to
external forces, such as those imposed by sea level rise and storm events [Bijlsma, 1997;
Bird, 1993].
Sea level rise and storm events occur in a geographic context. Understanding broader
ramifications of sea level rise requires maps of lands that could be inundated or eroded
[Titus and Richman, 2001]. As part of the steps in developing adaptation strategies, one
must answer questions such as where are the impacts, who or what is being affected? To
be able to answer these questions, people require geographic information. Creation of
15
scientific maps includes, but is not limited to, the use of: elevation data, models of
shoreline erosion and wetland accretion, topographic maps, tidal records, bathymetry and
other coastal processes to provide a scientific basis for where these impacts may occur,
who or what may be affected. Public geographic knowledge (acquired through
observation and experience) in coastal communities also serves as a great resource in
identifying threats related to storm events and flooding. Therefore, local inhabitants can
also provide answers to where the impacts may occur, who or what are affected during
historic coastal storm events.
2.2 Adaptation and Stakeholder Involvement
Adaptation is a process by which strategies to moderate, cope with and take advantage
of the consequences of climatic events are enhanced, developed and implemented [Conde
and Lonsdale, 2005]. Conde and Lonsdale [2005] recognized that relevant stakeholders
need to be brought together to identify the most appropriate forms of adaptation. It is also
recognized that adaptation strategies generally address current challenges, rather than
future impacts and opportunities [Field et al., 2007]. The participation of stakeholders in
the decision-making process assists in the implementation of adaptation policies. In
effect, it is important to develop strategies with the local people and not for the local
people, stakeholders are central to the adaptation process.
The Adaptation Policy Frameworks
United Nations Development Programme
outline strategies, policies and
and implementing adaptation
shown in Figure 2.1. The diagram
stakeholders are vital components to an adaptation process.
requires a long term, interdisciplinary dialogue
Supporting this dialog can also serve as a link
Since these adaptations occur in a local geographic
System (GIS) can be an important
and future risks. Specific
knowledge as a means of complementing science; local knowledge and science and how
local knowledge can play a key role are discussed in the next section.
Figure 2.1 Adaptation Policy Framework (after [
16
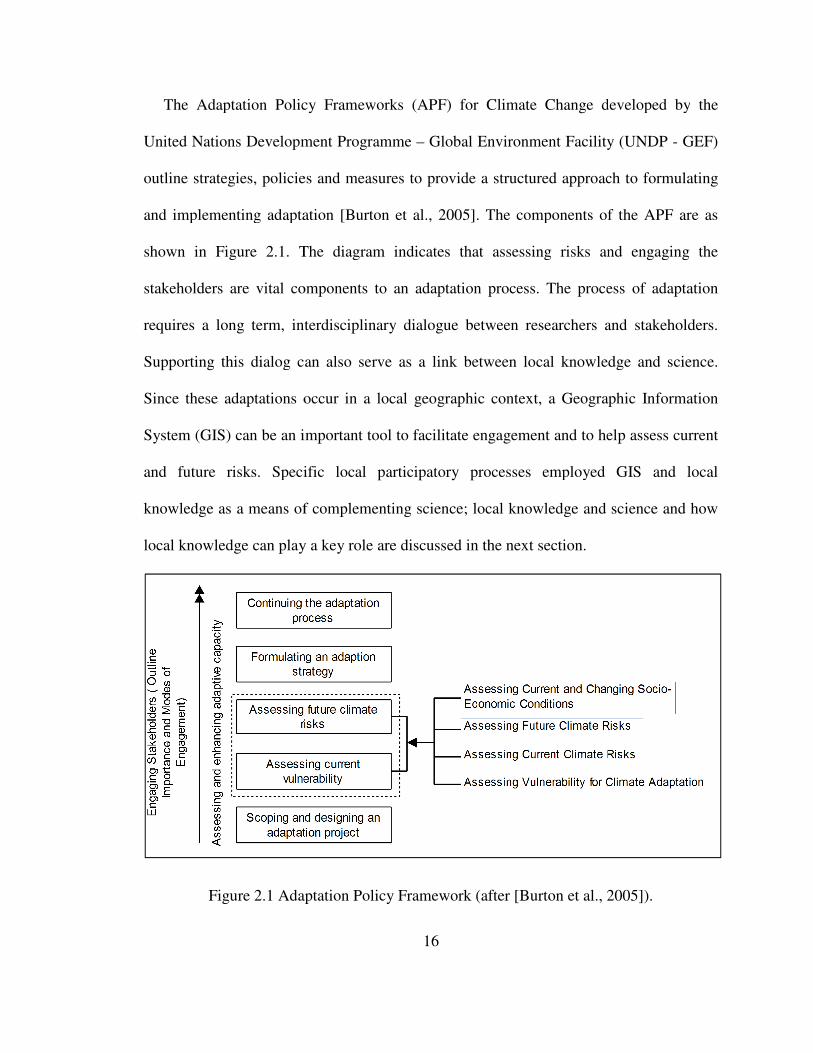
The Adaptation Policy Frameworks (APF) for Climate Change developed by
United Nations Development Programme – Global Environment Facility
olicies and measures to provide a structured approach to formulatin
and implementing adaptation [Burton et al., 2005]. The components of the APF are as
The diagram indicates that assessing risks and engaging the
are vital components to an adaptation process. The process of
erm, interdisciplinary dialogue between researchers and stakeholders.
dialog can also serve as a link between local knowledge and science.
ons occur in a local geographic context, a Geographic Information
can be an important tool to facilitate engagement and to help assess current
Specific local participatory processes employed GIS and local
knowledge as a means of complementing science; local knowledge and science and how
l knowledge can play a key role are discussed in the next section.
Adaptation Policy Framework (after [Burton et al., 2005])
developed by the
Global Environment Facility (UNDP - GEF)
a structured approach to formulating
The components of the APF are as
that assessing risks and engaging the
The process of adaptation
between researchers and stakeholders.
between local knowledge and science.
eographic Information
engagement and to help assess current
employed GIS and local
knowledge as a means of complementing science; local knowledge and science and how
, 2005]).
17
2.3 Local Knowledge and Science
Local knowledge in management plans is often not considered due to the belief by
some researchers that it is fragmented, subjective, and thus lacks scientific merit. This
view is currently undergoing re-evaluation and the importance of local knowledge is
being increasingly recognized, especially in light of the failures of management policies
derived solely from scientific knowledge [Close and Hall, 2006; Sieber, 2006]. Local
ecological knowledge is fallible and does have certain limitations. Its fine-grained
perspective, while adding value to coarse-grained studies, can also be a disadvantage as
local knowledge is often only locally relevant [Gadgil et al., 2003]. Therefore, local
inhabitants often have a weaker understanding of processes taking place at greater spatial
and temporal scales that are not obvious to them.
In addition, other authors raise the caution that local knowledge has rationality and
origins different from that of formal science [Chalmers et al., 2007]. Certain local
customs such "fire" or the "sea" considered sacred in some communities do not fall in the
“rational” context of modern science. Chalmers et al., [2007] advices scientists should be
cautious and sensitive to differences in worldviews when attempting to bridge the gap
between local knowledge and science.
Some researchers have argued that public or stakeholder involvement will assist
effective design, implementation, and monitoring because stakeholder views were
involved in the process [Aswani and Lauer, 2006]. Others also claim that, in democratic
societies, people simply have a right to participate. Finally, across disciplines, cultures,
and varied communities local people may have access to knowledge that is unknown to
18
experts; local people may themselves count as experts about their own localities
[Cinderby and Forrester, 2005].
2.4 GIS: Link between Local Knowledge and Science
Geographic Information Systems for local participation started as a process of using
locally acquired knowledge to map an area for planning purposes [Cinderby and
Forrester, 2005]. The benefit of capturing information using local participation in GIS
helps in the comparison of local knowledge about land use against other forms of spatial
data to assist in answering questions posed by the locals themselves and by other local
policy stakeholders [Cinderby, 1999]. The term Participatory GIS (PGIS) developed in
the mid-1990s in conjunction with a shift in focus from GIS technology and applications
towards a critical evaluation of the uses of GIS [Harris, 1995]. PGIS originated from
Public Participatory GIS (PPGIS) (to indicate grassroots involvement) with its
methodologies originally developed in the United States [Cinderby and Forrester, 2005].
Cinderby and Forrester [2005] also suggest that PGIS had its roots in Participatory Rural
Appraisal (PRA) and rural livelihoods development.
A literature review shows that at least six terms are used to indicate local participation
in a geographic context: Participatory GIS (PGIS) [Tang, 2006], Participatory Action
Research [PAR], Collaborative GIS (CGIS) [Balram et al., 2009; Bodorkós and Pataki,
2009], Public Participatory GIS (PPGIS), Local Ecological Knowledge (LEK),
19
Traditional Ecological Knowledge (TEK) [Huntington 2000; Inglis 1993; Johnson 1992].
These concepts of local knowledge are qualitative or value-based and acquired as a result
constant observation and interaction in a local environment. Researchers are making
efforts to quantify and spatially represent local knowledge in a computer environment for
easy access and querying. The next section discusses case studies undertaken in these
fields of research.
2.4.1 Selected Case Studies
GIS was used to engage community members in developing alternative design
solutions in the Pilsen neighbourhood of Chicago, United States [Al-Kodmany, 1999].
Al-Kodmany [1999] found that freehand sketching in conjunction with GIS and
photomontage was the most effective way of identifying problems and expressing ideas
with a non-technical participatory group during a town planning design exercise. In other
planning case studies in the United Kingdom (UK), Kingston et al [2000] discuss the use
of traditional methods of public participation and web-based GIS. In this article, the
authors argue that new Internet-based technologies have the potential to widen
participation in the UK planning system.
In another urban planning project, a demonstration prototype called SoftGIS was
developed to support urban planning processes and decision-making. SoftGIS enabled
mapping local knowledge and integrating it into urban planning practices [Rantanen and
20
Kahila, 2009]. Rantanen and Kahila[2009] utilized internet based map applications in
collecting local knowledge from local actors about their living environment. The authors
concluded that when the residents are involved in the urban planning process, they are
more committed to its outcome.
Online map-based discussion forums enable internet users to submit place-based
comments, threaded discussions, annotations, and respond to contributions from other
participants [Tang, 2006]. Tang [2006] implemented a GIS-enabled online discussion
forum for participatory planning. Her thesis added a spatial GIS context in a structured
forum discussion. The application was based on ArcIMS, Java applets, MySQL and other
scripting languages such as JavaScript (JS) and Hypertext Preprocessor (PHP). The
internet is an efficient medium for a two-way communication between the public,
planners and decision makers [Rinner et al., 2008]. Rinner et al. [2008] also developed a
Web 2 online argumentation map using Java, ArgooMap (open source), and Google Maps
API.
The integration of GIS and multi-media gives new possibilities for public participation
[Hansen and Prosperi, 2005]. Zeiner et al. [2005] developed a geo-multimedia service
infrastructure enabling users to store, retrieve, and share geo-referenced video. The GIS
based multimedia content can provide its users with the advantage of getting additional
audio-visual information for areas of interest. Barton et al. [2005] developed a public
participatory system for the New South Wales Department of Housing. The authors
implemented non-proprietary international standards using XML, SVG, GML, and X3D.
The system did not support advanced urban design functionality, but rather simple user
21
interface for input of points, lines and polygons as well as comments [Hansen and
Prosperi, 2005].
In tourism, Stewart et al. [2008] explored responses to current and future local tourism
development offered by a sample of residents using a modified Public Participatory GIS
approach called “Community Action Geographic Information System” (CAGIS). Wu et
al. [2010] developed a Web-2 virtual globe 3D visualization (like Google Earth) for
publicizing urban planning information, using Web Services and Service Oriented
Architecture (SOA) to support visual planning, model sharing, and interoperability. The
authors implemented a standard descriptive language for 3D city models based on
CityGML, open and standardised technologies such as XML, HTTP, SOAP, and WSDL
(Web Service Definition Language). End users of this system can select any available
urban planning solution for visual investigation and comparison in a virtual 3D
visualization environment [Wu et al., 2010].
In marine research, Aswani and Lauer [2006] explored how a GIS database can used
to incorporate indigenous ecological knowledge, artisanal fishing data, biophysical data
and other information to assist in the design of marine protected areas (MPAs) [Hinkel
and Klein, 2009]. In fisheries management, Close and Hall [2006] present a GIS-based
protocol for the collection of local knowledge. In this research, the authors examined
local knowledge in resource management and issues associated with the incorporation of
qualitative data into a quantitative environment.
To keep to the scope of this thesis, readers can find other local knowledge and science
research case studies that include but is not limited to: fishing, marine governance and
marine resource management by Anuchiracheeva et al. [2003], Steyaert et al. [2007],
22
Gerhardinger et al. [2009], and Evans [2010]. Soil science, forest resource management,
environmental health and agriculture examples include works by Blaikie et al.[1997],
Birmingham [2003], Davis and Wagner [2003], Oudwater and Martin [2003], Payton et
al. [2003], Robertson and McGee [2003], Ryder [2003], Barrios et al. [2006], Lambert et
al. [2006], Corburn [2007], Failing et al. [2007], Parrotta and Agnoletti [2007],
Mulyoutami et al., [2009],Giordano et al. [2010], Raymond et al. [2010], and Reyes-
García et al. [2010].
2.4.2 Lessons from Existing Research
From the reviewed literature, participatory platforms concentrate on enhancing public
forum discussion, image visualization, audio, audio-visual, video, email and text support
in an online environment. Using the World Wide Web as a means of increasing public
participation has great potential in these fields. However, in communities where internet
access is an issue, participatory web based platforms become unusable. Furthermore,
large file sizes are not favourable for web application users with low internet bandwidth;
this reduces user interactivity with mapping interfaces.
Possibly the most important challenge in Public Participatory GIS (PPGIS) is the
ability to derive and represent the following on a map: soft, user-defined, fuzzy, and
possibly non-spatial information that exist in the mind provided by the public [Kingston
et al., 2000; Angelides and Xenidis, 2007]. Most often, people talk about everyday issues
23
in vague terms [Kingston et al., 2000]. These may include imprecise qualitative data as
well as processes that require the incorporation of subjective opinion and intuition to
assess risks and plan for adaptation or mitigation measures [Angelides and Xenidis,
2007]. Developing an appropriate integrated approach for coastal risk assessment
requires confronting these limitations with concurrent use of probability and fuzzy
techniques. One lesson that emerges is that, PPGIS must first overcome a considerable
amount of anti-technology prejudice and misconceptions on the part of local/traditional
people before it is accepted [Ball, 2002].
2.5 Coastal Collaborative GIS (CCGIS)
This research will refer to all forms of local, indigenous, or public participation in a
spatial context as Coastal Collaborative GIS (or CCGIS). The term “Coastal” attached to
CGIS highlights this research as a derived entity sharing all the characteristics of the base
parent collaborative GIS. “Coastal” in CCGIS indicates the collaborative process for
settlements and developments bordering water bodies susceptible to the effects of climate
change. In this dynamic environment, the collaborative process should be active in
engaging stakeholder views captured in time as local knowledge. Therefore, CCGIS
consists of tools and practices to directly support multiple stakeholder participation in the
identification and mapping of current and future risks in a coastal adaptation process. It is
in a broader disciplinary area of Group Spatial Decision Support Systems (GSDSS) and
24
can be defined as an integration of spatially enabled tools, and technologies for
structuring human participation and articulating issues of concern in local and distributed
spatial planning process [Balram and Dragicevic, 2006; Bodorkós and Pataki, 2009].
The CCGIS, such as that developed by this research will include a digital workspace
for map-based content generation and visualization, multiple interfaces for participant
interactions, and digital databases to provide and store new information. The literature
review of local ecological knowledge also suggested a need to spatially represent
qualitative (local knowledge) and quantitative information through the use of fuzzy soft
computing methods [Kingston et al., 2000; Ball, 2002; Angelides and Xenidis,2007].
A detailed treatment of fuzzy computing requires in-depth research into fuzzy spatial
systems using fuzzy logic of which are beyond the scope of this research. Nevertheless,
the CCGIS attempts to quantify local knowledge in simple vector objects in the form of
points, lines, and polygons as a precursor to future fuzzy computing. In order to preserve
the richness of cognitive local knowledge without losing detail in processes of
abstraction, these simple vector objects are extended to add rich media content such as
audio, video, pictures and text. Furthermore, it is important to address user interface
complexity (user friendliness) to serve the scientist or researcher and the coastal
stakeholder with little computer or GIS knowledge. Based on these propositions, this
research seeks to answer the following questions:
• What publicly available tools can be customised for developing a user-
friendly internet based participatory GIS?
• How can a scalable platform be established without licensing cost to
vulnerable communities, scientific researchers, and policy makers?
25
• How can fuzzy and subjective local knowledge be spatially abstracted for
coastal communities with or without precise scientific geographic data?
• What are the technical, policy issues in implementing such a coastal
collaborative GIS?
• What are the specific user, and system requirements?
To answer the questions raised above, a review of GIS, its components, and services are
discussed in Section 2.6. Differentiations of the CCGIS from other public available
platforms are highlighted in the next section.
2.5.1 Uniqueness of the CCGIS
The CCGIS uses a purely open source and free software design to web collaborative
GIS. This approach enables the C-Change project to adapt the CCGIS to each community
issues being addressed in an adaptation process. For example, a software adaptation
interface and queries for flooding will be different from that of habitat protection, or
erosion. Therefore, to customize software to meet each community needs require either
the source code or a programmable interface for extensions. An open source design gives
the free right to modify, redistribute, and redistribute modified copies.
A non-proprietary and light spatial data format GeoJSON was used to communicate
between the client and server. GeoJSON is a geospatial data interchange format based on
26
JavaScript Object Notation (JSON). This lightweight format improves transferring
messages from the client to the server as compared to verbose xml formats.
The CCGIS uses a Model View Controller (MVC) pattern in its implementation. This
approach allows the implementation of different views (clients) in each C-Change
community to suite community needs with little or no change in the software backend
implementation (Model and Controller).
Ease of use through public mapping and navigational tools shortens the learning curve
for non-GIS users due to familiarity. The CCGIS uses Bing and Google Maps as base
layers to serve as visual aids when capturing local knowledge in these environments.
Finally, the CCIGS incorporates moderators and peer review mechanisms to help
structure or monitor what type of contributions as local knowledge become part of the
system. This approach as opposed to wide-open public participation channels local
knowledge towards achieving community goals to an adaptation process.
2.6 Geographic Information Systems (GIS)
The first documented geographic information system was the Canada Geographic
Information System, designed by Roger Tomlinson in the mid-1960s as a computerized
natural resource inventory system [Longley, 2008]. GIS are fundamentally concerned
with building shared understandings of the world in ways that are robust, transparent,
and, above all, usable in a range of real-world settings. There are many definitions of
27
GIS, most of which are in relation to a number of component elements: hardware,
software, people, data, and procedures.
The term geographic information system incorporates all of the following [Longley
2008]:
• a software product, acquired to perform a set of well-defined functions
(GIS software),
• digital representations of aspects of the world (GIS data),
• a community of people who use these tools for various purposes (the GIS
community),
• the activity of using GIS to solve problems or advance science
(geographic information science).
GIS is defined as a “system for capturing, storing, checking, integrating, manipulating,
analyzing, and displaying data which are spatially referenced to the Earth” [Fazal, 2008].
A Geographic Information System goes beyond computer-based software; it involves
organized activities that reflect institutions and cultures. The World Wide Web offers an
opportunity to overcome challenges in map services, software distribution, and cost
across multiple clients, and non-interoperability issues due to lack of standardised data
exchange formats among traditional GIS users. It provides a universal platform for
distributed computing with service architectures that designed for integration of diverse
information systems [McKee, 2004].
28
2.6.1 Web GIS
Today millions of people around the world make daily use of the World Wide Web
and its facilities. In 1991, the World Wide Web was born through the implementation of
a large online hypertext database through the works of Tim Berners-Lee, based at the
European Laboratory for Particle Physics (CERN 1), today, the World Wide Web is often
referred to as the Internet [Lawrence et al., 2002; Sklar, 2009]. The internet now consists
of billions of links and a plethora of web content is been generated daily on the World
Wide Web. This has also lead to a many literature on the Internet, its concepts,
technologies, design tools, and applications about the internet. For the purposes of this
chapter, this research will consider the study of Web-based systems and Web
technologies as consisting of three areas: technology, applications, and people [Tatnall,
2010].
Web GIS is the implementation of geographic information functionality through a web
browser or other client programs, thus allowing a broader usage and analysis of a
particular geographic database. Also referred to as Internet GIS, distributed GIS, and
even Internet mapping; the implementation of online GIS systems has dominated the
work of GIS professionals since the late 1990s [Peterson, 2008]. With increasing demand
for web based GIS platforms, there comes the possibility of varied and fragmented
formats and standards. As a result, the Open Geospatial Consortium (OGC) was formed
to facilitate standardization of formats, products, and GIS services.
29
2.6.1.2 OGC and Web Services
The Open Geospatial Consortium (OGC) is a member-driven, non-profit,
international, voluntary, consensus standards organization. The mission of the OGC is to
serve as a global forum for the collaboration of developers and users of geospatial data,
products (content), and services and to advance the development of common standards
that enable geospatial interoperability, the geospatial Web, and the integration of
geospatial content and services into enterprise applications [Reed, 2008].
A service in a web context is a collection of operations (independent, well-defined,
self-contained functions) that is accessible through an interface, and allows a user to
invoke behaviour of value to the user (definition from ISO 19119) [Barry, 2003]. Web
services therefore refer to a set of software applications or components developed using a
specific set of application programming interface (API) standards and internet
communication protocols. The objective is to enable these applications or components to
invoke function calls and exchange data among themselves over the standard internet
infrastructure [Ratnasingam, 2010].
OGC Web Services (OWS) represent an evolutionary, standards-based framework that
enables seamless integration of a variety of online geoprocessing and location services.
OWS allows distributed geoprocessing systems to communicate with each other across
the Web using familiar technologies such as XML and HTTP. OGC Web Services
provide a vendor-neutral, interoperable framework for web-based discovery, access,
integration, analysis, exploitation, and visualization of multiple online geo data sources,
sensor-derived information, and geoprocessing capabilities [Harrison and Reichardt,
30
2001]. The standard provides a web of geoprocessing services that are connectible in
dynamic, open interoperable chains to create dynamic applications.
2.6.2 Web GIS Tools
To answer the second question in section 2.4, this research will focus on free and open
source GIS Web tools to accommodate wide coastal community collaboration. The term
free refers to free rights to use, modify, redistribute or redistribute modified copies. There
are many web GIS tools for varied purposes; the Open Source Geospatial Foundation
(OSGeo) supports some of these applications. OSGeo is a not-for-profit organization
whose mission is to support and promote the collaborative development of open
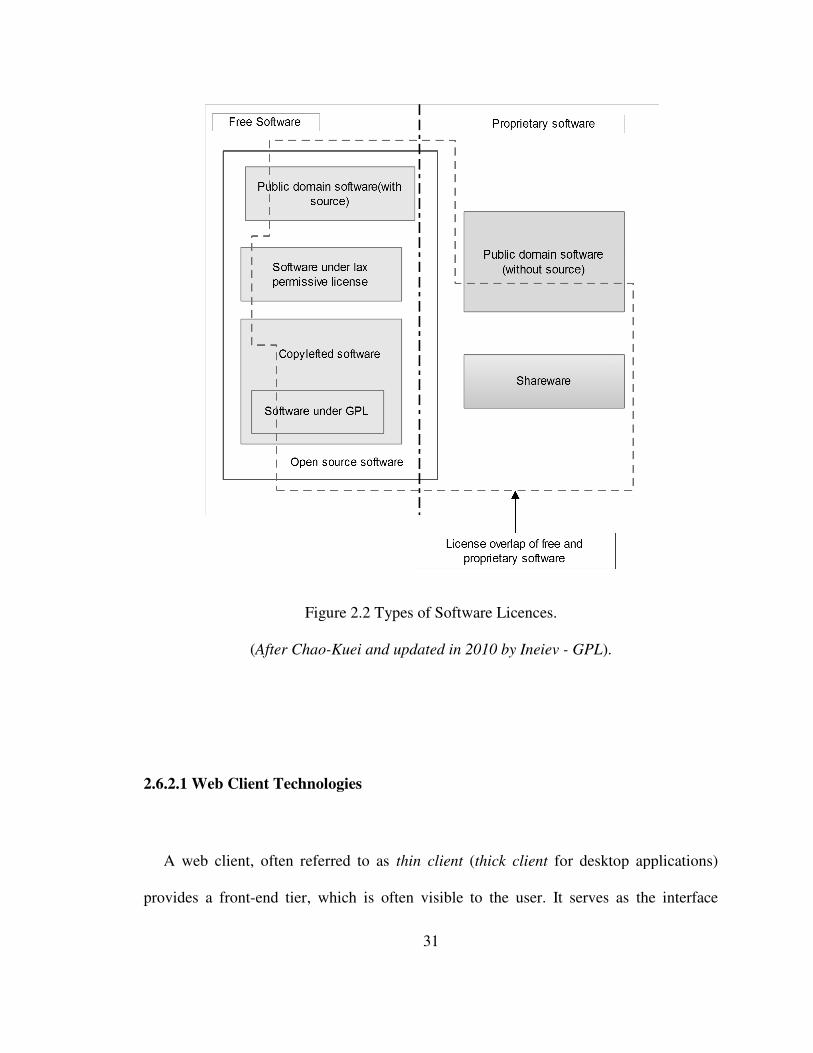
geospatial technologies and data [OSGeo, 2010]. The use of free or open source software
as compared to proprietary software comes under the following categorizations of
licences as shown in Figure 2.2.
A web GIS framework usually involves three application tiers: the data source,
application servers, and the map client. The data source tier may involve spatial database
server or a direct data source stored on disk. Application servers in the middle tier for
communication between the client and the data source. This section involves spatial data
servers and web application servers. The front-end or the client serves as the output and
input interface to users. Discussed below is a review of selected applications in each tier.
(After Chao
2.6.2.1 Web Client Technologies
A web client, often referred to as
provides a front-end tier, which
31
Figure 2.2 Types of Software Licences.
After Chao-Kuei and updated in 2010 by Ineiev - GPL).
Client Technologies
A web client, often referred to as thin client (thick client for desktop applications)
tier, which is often visible to the user. It serves as the interface
).
for desktop applications)
is often visible to the user. It serves as the interface
32
through which users can interact with the map and all other provided services. Myriad
open source software or free mapping tools are available in the public domain. Lists of
some of the public available tools are available in Appendix I. To select a useful tool
from the lot, one has to consider its Application Programming Interface (API),
community support, data, or support services, standards (interoperability), functionality,
flexibility, and licensing agreement.
A careful examination of each mapping platform shows that most are either dependent
or independent on other mapping platforms. A general trend gives an indication of what
could be the best client to use for the coastal collaborative GIS. In Figure 2.3, web-
mapping client dependency relationships are established in relation to other clients and
servers. The trend in Figure 2.3 shows an increased adoption of OpenLayers as a base
platform for developing other web-mapping platforms or some mapping clients joined the
OpenLayers project [Adams, 2009]. For example, the Mapbuilder team ends their
mapping client platform at version 1.5. The team suggested theirs users and developers
should join the OpenLayers project
(http://communitymapbuilder.osgeo.org/display/MAP/EndOfLife).
Another key advantage of OpenLayers is that, it provides a means of imbedding
publicly available map clients such as Google, Bing, and Yahoo maps. These map clients
provide a wide public familiarity to map navigation and usage. A customised interface
using OpenLayers and these tools will provide a means of shortening the learning curve
for non-GIS users.
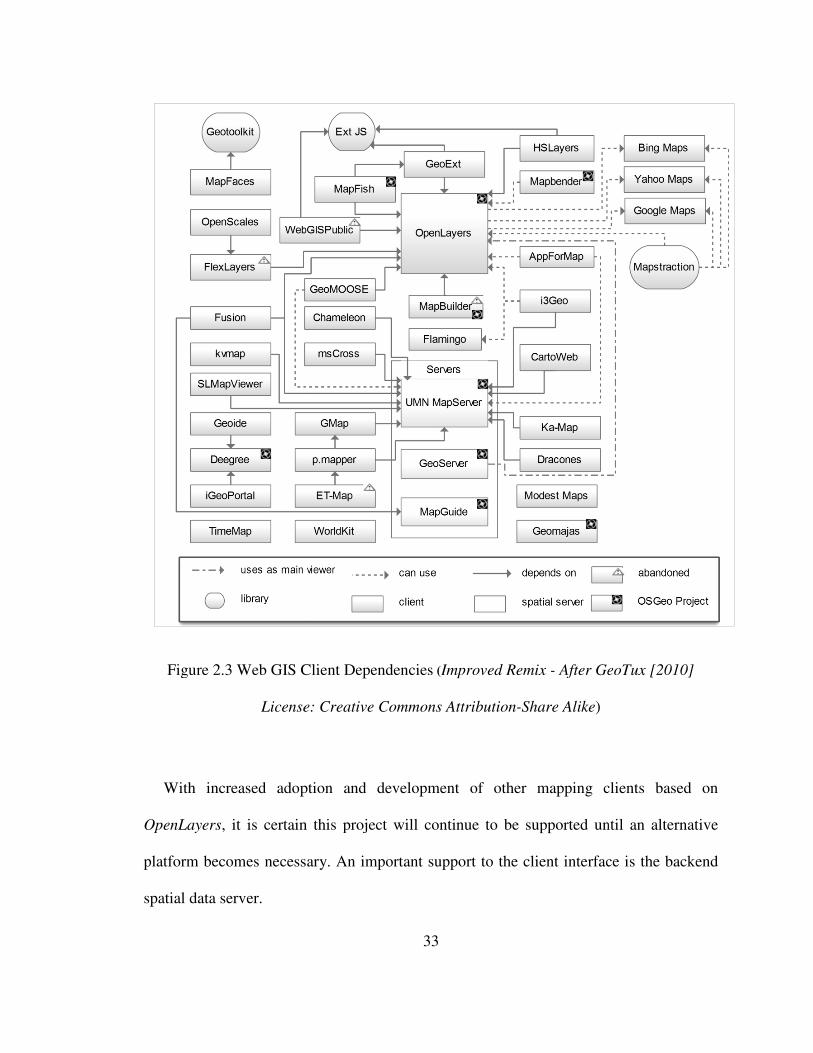
Figure 2.3 Web GIS Client
License
With increased adoption and development
OpenLayers, it is certain this project will
platform becomes necessary.
spatial data server.
33
Figure 2.3 Web GIS Client Dependencies (Improved Remix - After GeoTux [2010]
License: Creative Commons Attribution-Share Alike)
adoption and development of other mapping clients based on
, it is certain this project will continue to be supported until an alternative
platform becomes necessary. An important support to the client interface is the backend
After GeoTux [2010]
ng clients based on
until an alternative
client interface is the backend
34
2.6.2.2 Server Technologies
MapServer and MapGuide are not very favourable compared to GeoServer in
selecting a long-term client. The lifetime of spatial data, servers are not erratic as web
mapping clients. Client-side projects easily get abandoned as users and developers
migrate to a better platform. MapServer is a widely used spatial data server on the web.
As an Open Source platform, it provides an engine for publishing spatial data and
interactive mapping applications. MapServer requires additional configurations to work
with OpenLayers’ Ajax framework hence not very favourable compared to GeoServer.
MapGuide on the other hand features other rich interactive viewers other than
OpenLayers, hence not an idle candidate.
GeoServer is Java-based software that allows users to view and edit geospatial data.
Using open standards set forth by the Open Geospatial Consortium (OGC), GeoServer
allows for great flexibility in map creation and data sharing. GeoServer is the reference
implementation of the Open Geospatial Consortium (OGC) Web Feature Service (WFS)
and Web Coverage Service (WCS) standards, as well as Web Map Service (WMS)
[GeoServer 2010]. From Figure 2.3, GeoServer uses OpenLayers as its main Ajax map
viewer. This creates a quick process of publishing maps on internet. With support for
GeoServer and OpenLayers (both being OSGeo Projects) and their conformance to OGC
standards, makes them good candidates for the CCGIS.
35
2.6.2.3 Database Technologies
Relational database management applications dominate the field of data storage and
retrieval. In this research open source spatial databases are of interest to store spatial
datasets. The following description is not an attempt to discuss all available free or open
source spatial databases available, but gives a brief intro to a selected few that are widely
used.
PostgreSQL is an open source object-relational database system [PostgreSQL, 2010].
It has more than 15 years of active development and a proven architecture that has earned
it a strong reputation for reliability, data integrity, and correctness. The power of
PostgreSQL is extended by PostGIS which “spatially enables” the PostgreSQL server,
allowing it to be used as a backend spatial database for geographic information systems
(GIS), much like ESRI’s ArcSDE or Oracle’s Spatial extension [Refractions Research,
2008]. PostGIS dominates in the open source spatial database extensions and currently in
incubation as an OSGeo project. The CCGIS will take advantage PostgreSQL plus
PostGIS as the spatial database tier given its wide user support base and functionality.
Other spatial extensions (not yet OSGeo projects) include:
• SpatiaLite extension enables SQLite to support spatial data
[GEOMETRY], in a way conformant to OpenGIS specifications
(http://www.gaia-gis.it/spatialite/).
• MySQL spatial extensions enable the generation, storage, and analysis of
geographic features
(http://dev.mysql.com/doc/refman/5.0/en/spatial-extensions.html).
36
• Ingres Database Object Model Extension (OME) supports Geospatial Data
Abstraction Library (GDAL/OGR)
(http://www.ingres.com/kb/article/416990).
2.7 CCGIS Requirements
Requirements are high-level, abstract statement of a service that the system should
provide or a constraint on a system [Sommerville, 2001]. Requirements for the Coastal
Collaborative Web GIS will include two major components: user requirements and
system requirements. User requirements are statements, in a natural language plus
diagrams, system services and the constraints under which it must operate. System
requirements set out the system’s functions, services, and operational constraints in
detail.
2.7.1 User Requirements
In this research, requirement elicitations are accomplished using generic needs from
published collaborative and participatory GIS research and feedback from project
partners. An abstract high-level list of requirements includes the following:
37
• The system should allow local communities to identify coastal threats as a
result of sea level rise and storm surges at a particular location, an area
(residential, business etc.) and a linear event.
• The system should provide a means of describing and communicating
threats with pictures, video, audio and text.
• The application should be user-friendly and cost effective.
• The system should provide a means of validating user contributions.
• The system should provide a means of commenting on scientific scenarios
and local contributions.
2.7.2 System Requirements
The online collaborative GIS application herein called CCGIS should have the
following system requirement:
Functional requirements
• The CCGIS should be an online collaborative application with
a) client (public and administrator) interfaces,
b) server (spatial application and web server) component, and
c) database (relational and spatial database) server.
38
• The client interface should be user-friendly (using public mapping tools)
that can be extended or customised using their Application Programming
Interface (API).
• The client should provide digitizing and editing function for the creation
of spatial content.
• Content generated should be simple vector objects such as:
a) Points (to abstract a location or landmark)
b) Lines (to abstract road, path, shoreline, etc.)
c) Polygons ( to abstract and area or region)
• Client technologies should implement OGC compatible standards and
should consume:
a) Web Mapping Services (WMS),
b) Web Coverage Services (WCS), and
c) Web Feature Services (WFS).
• The system should provide administrative privileges of accepting or
rejecting user contributions before it becomes public.
• Contributions should be stored in database that can provide object
relational and spatial capabilities.
• Contributions made by users should be stored in a non-proprietary format.
• The system should provide administrator rights to restrict the area (extent)
of contributions and contributors geographic location at the time of
contribution.
39
• The system should provide a forum discussion with reference to spatial
objects on the map.
Non-functional Requirements
• The CCGIS application should not provide services without internet
connection.
• Only registered members can make spatial contributions to the system.
2.8 Summary
This chapter reviewed climate change and the importance of stakeholder involvement
in the overall process of developing adaption strategies (policy framework). The chapter
also identified the importance of tapping into community local knowledge in places with
limited or imprecise data adequate for scientific scenarios. A review of selected case
studies showed how local knowledge could compliment science in a participatory
process. Lessons learned from existing case studies and a review of modern web GIS
technologies were used as a basis for user and system requirements. In the end, the
chapter identifies OpenLayers as the main client platform of which Google and Bing
Maps can serve as base layers. Server-side tools such as GeoServer and Apache web
server provides server-side services, including data stored in PostgreSQL database. The
next chapter discusses how the web GIS tools identified in this chapter can be used to
capture local knowledge through a platform design.
40
Chapter Three: Local Knowledge and Conceptual Framework Design
To us, science, art, ideology, law, religion, technology, mathematics, even nowadays ethics and epistemology, seem genuine enough genres of cultural expression to lead us to ask (and ask and ask) to what degree other peoples possess
them and to the degree they do possess them, what form do they take, and given the form they take, what light has
that to shed on our own versions of them. ~ Clifford Geertz 1983.
In the first chapter, this research identified the need for coastal communities to
develop a proactive adaptive approach to sea level rise and storm surges. A prerequisite
for adaptation is to identify the spatial extent of this threat in a geographical context. In
the field of science, datasets are required, which may include but are not limited to:
elevation data, models of shoreline erosion, wetland accretion, topographic maps, tidal
records, bathymetry and other coastal processes.
The availability of elevation data confronts anyone attempting to estimate the amount
of land (horizontal) affected within a metre of sea level (vertical) with two unpleasant
realities:
• the available vertical data are imprecise, and
• they do not necessarily tell us how far the land is above sea level.
These problems are commonly known as “poor vertical resolution” and “inconsistent
benchmarks” [Titus and Richman, 2001]. Titus and Richman, [2001] showed that poor
41
elevation data is not only limited to the United States, but also the United Kingdom and
Canada. It is therefore expected to be worse in most developing coastal countries.
This research quantifies local knowledge as a supplement to scientific flood zone
mapping. Local inhabitants interact with their environment and hence serve as human
sensors in flood prone mapping. This runs across all levels of development: rural, peri-
urban, and urban coastal communities. Tapping into this resource will not only provide a
means of identifying risk areas but also provide an all-inclusive process of developing
adaptation strategies. In view of this, this chapter will explore the meaning of knowledge
in general, then local and scientific knowledge as specifics. The chapter will go on to
identify how knowledge can be treated as data, information, and its spatial abstraction. A
conceptual framework developed from the components of knowledge presents how local
knowledge plays a role in an adaptation process. The chapter concludes with system
designs using the requirements from Chapter 2 in each major system tier.
3.1 Knowledge
The Oxford Dictionary [2010a] defines knowledge as:
1. Facts, information, and skills acquired through experience or
education; the theoretical or practical understanding of a subject.
2. Awareness or familiarity gained by experience of a fact or situation.
Epistemologists have distinguished some species of knowledge, including [Moser, 2005]:
42
• propositional knowledge (that something is so or declarative),
• nonpropositional knowledge of something (for instance, knowledge by
acquaintance, or by direct awareness),
• empirical (a posteriori) propositional knowledge,
• nonempirical (a priori) propositional knowledge, and
• knowledge of how to do something (imperative or procedural)
To keep to the scope of this research, readers can refer to the Oxford Handbook of
Epistemology [Moser, 2005]. To establish the means by which local knowledge is
acquired, it is important to identify the sources knowledge. Moser [2005] identified the
best candidates for the classical sources of knowledge as perception, memory,
consciousness (sometimes called introspection), and reason (sometimes called intuition).
Moser [2005] also suggests some writers have shortened the list under the heading,
“experience, and reason.”
Furthermore, how can one acquire knowledge from these acclaimed sources?
Brazhnik, [2007] discusses in her paper that the process of acquiring knowledge is
universal in nature. The way children explore the world and the steps of scientific method
represent the same process, Figure 3.1 schematically depicts this claim. It starts with
observations and experiences that stimulate us to generate hypotheses about various
phenomena and the relationships between them. These observations and experiences
constitute data. We interpret these data based on existing concepts to produce hypotheses
and to predict outcomes, which we then test in experiments or further observations. If the
outcome contradicts the predictions, the hypothesis needs to be revised. If the outcome is
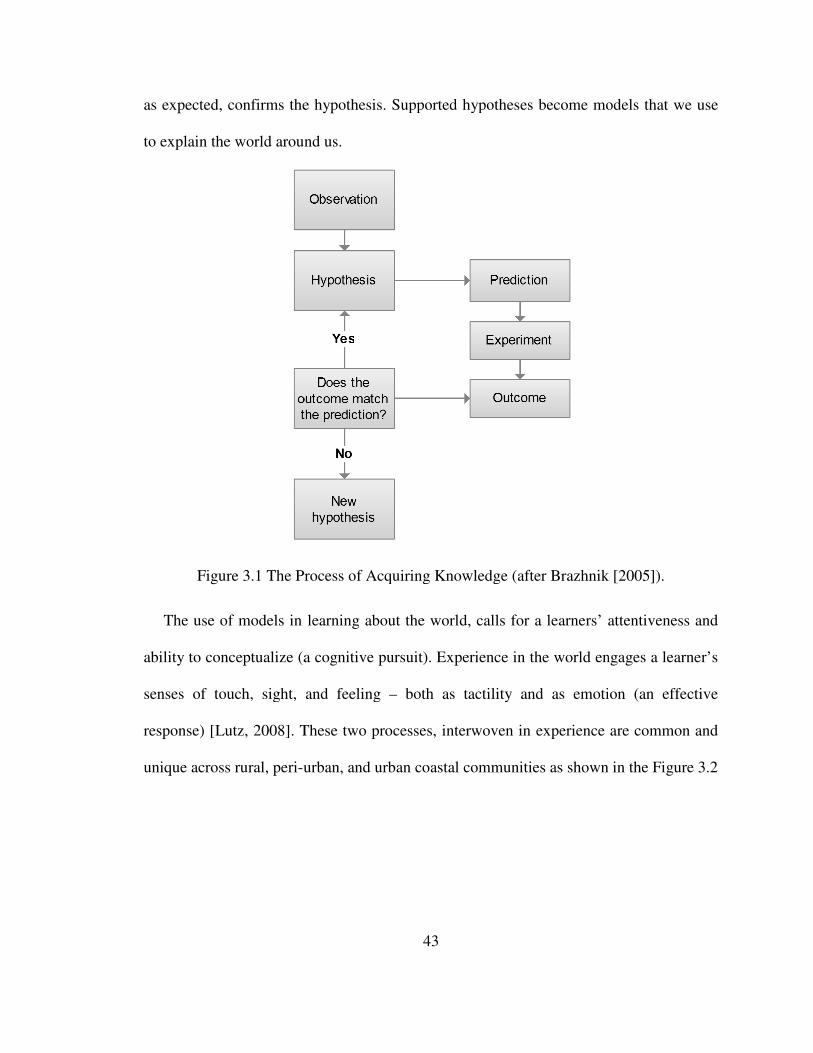
as expected, confirms the
to explain the world around us.
Figure 3.1 The Process of Acquiring Knowledge (a
The use of models in
ability to conceptualize (a cognitive pursuit). E
senses of touch, sight, and feeling
response) [Lutz, 2008]. These two pr
unique across rural, peri-urban,
43
, confirms the hypothesis. Supported hypotheses become models that we
explain the world around us.
Process of Acquiring Knowledge (after Brazhnik [2005]
The use of models in learning about the world, calls for a learners’ attentiveness and
eptualize (a cognitive pursuit). Experience in the world engages
senses of touch, sight, and feeling – both as tactility and as emotion (an effective
. These two processes, interwoven in experience are common and
urban, and urban coastal communities as shown in the Figure 3.2
. Supported hypotheses become models that we use
fter Brazhnik [2005]).
learners’ attentiveness and
xperience in the world engages a learner’s
both as tactility and as emotion (an effective
interwoven in experience are common and
and urban coastal communities as shown in the Figure 3.2
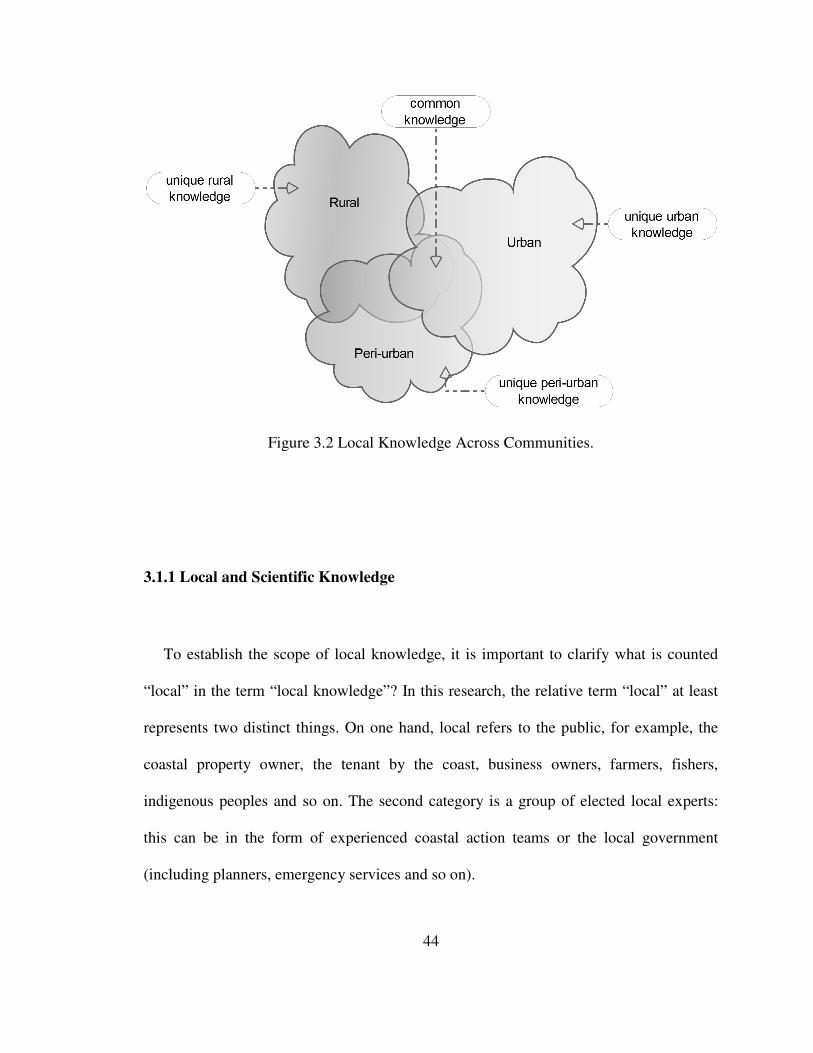
Figure 3.2 Local Knowledge Across
3.1.1 Local and Scientific
To establish the scope of local knowledge, it is important to clarify what
“local” in the term “local knowledge
represents two distinct things. On one hand
coastal property owner, the tenant by the coast, business owners,
indigenous peoples and so on
this can be in the form of experienced coastal action teams or the local gov
(including planners, emergency services and so on).
44
Figure 3.2 Local Knowledge Across Communities.
and Scientific Knowledge
establish the scope of local knowledge, it is important to clarify what
“local knowledge”? In this research, the relative term “local
two distinct things. On one hand, local refers to the public, for exam
coastal property owner, the tenant by the coast, business owners,
indigenous peoples and so on. The second category is a group of elected local experts:
this can be in the form of experienced coastal action teams or the local gov
(including planners, emergency services and so on).
establish the scope of local knowledge, it is important to clarify what is counted
In this research, the relative term “local” at least
, for example, the
coastal property owner, the tenant by the coast, business owners, farmers, fishers,
The second category is a group of elected local experts:
this can be in the form of experienced coastal action teams or the local government
45
The anthropologist Clifford Geertz, defines local knowledge as “practical, collective
and strongly rooted in a particular place” that forms an “organized body of thought based
on immediacy of experience” [Geertz 1973; Geertz 1983; Corburn 2005]. Geertz [1983]
suggests that local knowledge can be described as simply as “to know a city is to know
its streets.” This goes to strengthen the view that local knowledge often has a geographic
context.
In the field of science, scientific knowledge is an intellectual and practical activity
encompassing the systematic study of the structure and behaviour of the physical and
natural world through observation and experimentation [Oxford Dictionary, 2010].
Knowledge acquired through the scientific process is also local and geographic in
context. Although local in nature, scientific knowledge has the ability to move and apply
the knowledge it produces beyond the site of its production (local environment)
[Turnbull, 2000]. Scientific knowledge allows for comparison and testing in different
environment from which it originated. This heterogeneous application of scientific
knowledge is a buttress to its universal power.
3.1.2 Data, Information, Models, and Knowledge
The process of acquiring knowledge originates in data and undergoes steps of
collection, organization, storing and processing. Integrating findings into a functioning
unified whole produces knowledge [Brazhnik, 2007]. To gain knowledge is to acquire
46
data: datum from Latin means “what is given or admitted as bases of reasoning or
inference or a reference for measurement” [Merriam Webster Dictionary, 2010]. It is
what we can perceive, experience or register with our senses, for example: windy
weather, flooded lands, high fever, bad mood; a measurement or a reading of a device
such as: tape measure, thermometer or tidal gauge. Data therefore, can be quantitative or
qualitative and can be expressed as [Fazal, 2008]:
• linguistic expressions (e.g., name, age, address, date, ownership),
• symbolic expressions (e.g., traffic signs),
• mathematical expressions (e.g., E = mc2 ), and
• signals (e.g., electromagnetic waves).
Data usually in its raw form require processing into information.
Information serves as value added data or the outcome of processed data from which
decisions can be made. It is important to note that, information can also be data in a
different domain. For example, take projections of sea level rise for the next three
decades by the IPCC: to the coastal planner, it is information to help develop coastal
policies while to the coastal geographic engineer it is data to help identify potential flood
zones through geographic processing. Information collected about a phenomenon that
supports observation and prediction can be consolidated into a model.
A model is an abstraction of reality. It can be developed from data or information and
serves as the collection of interrelated concepts in describing entities. In this research, the
spatial local experiences, or intuition sensed in the coastal environment are expressed in
simple spatial data models. This thesis assumes that since information can be data and
data can be information, depending on the universe of discourse, a model can be derived
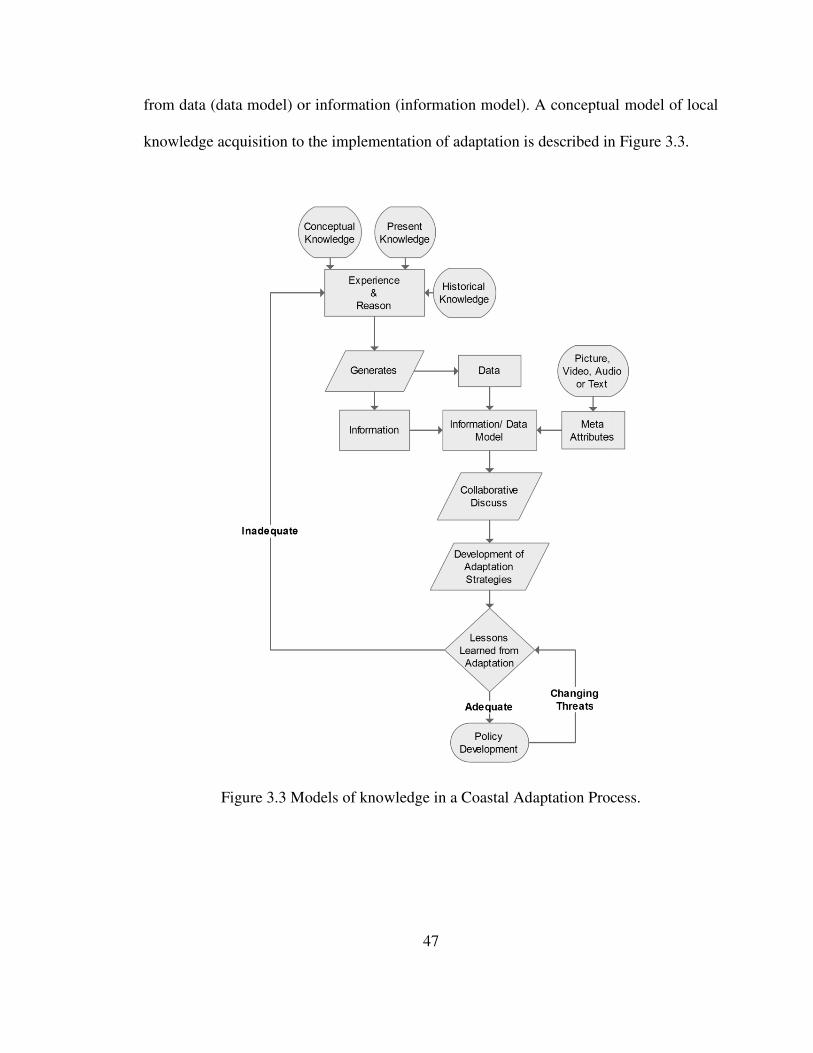
from data (data model) or information (information model). A conceptual model of local
knowledge acquisition to the implementation of adaptation is described in Figure 3.3.
Figure 3.3 Models
47
from data (data model) or information (information model). A conceptual model of local
knowledge acquisition to the implementation of adaptation is described in Figure 3.3.
Figure 3.3 Models of knowledge in a Coastal Adaptation Process.
from data (data model) or information (information model). A conceptual model of local
knowledge acquisition to the implementation of adaptation is described in Figure 3.3.
Process.
48
3.2 Spatial Abstraction of Knowledge
Spatially sensed phenomena in the environment usually occur in the form of a
landmark, road, path, coastline, region, space, or an area. Experiences and observations
discussed in the preceding sections leads to the development of mental models that exist
in a spatial framework. Data abstraction is important to help quantify or graphically
represent coastal events and their extents. To be consistent with spatial data abstraction in
scientific spatial representation, this research adopts local knowledge as simple geometric
vector objects: points, lines, and polygons. These spatial objects describe real world
features such as a point to represent a spatial location or landmark, a line to describe a
linear feature, and a polygon to quantify an area.
Abstraction leads to simplification of the knowledge recorded which is good for easy
graphical representation but comes with loss of detail, expression, and values. To make
up for the loss, this research includes rich attribute information (such multimedia:
pictures, video, audio and text) as metadata to describe the spatial geometric objects. This
process of geo referenced data collection, storage, processing, retrieval and visualisation
for various spatial analyses is part of a GIS.
3.3 System Architecture
In Section 2.6.2, web-mapping tools for each system tier were indentified. The
following subsections expand the description of the server, client, and database
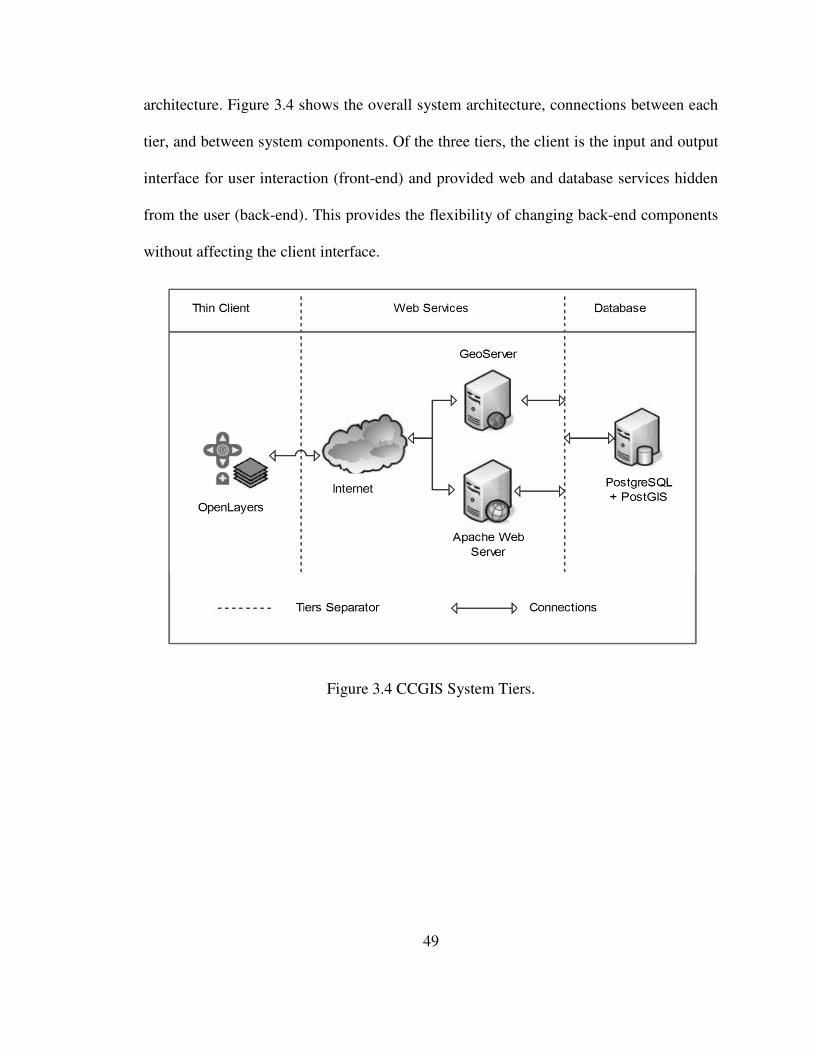
architecture. Figure 3.4 shows the overall system architecture,
tier, and between system components. Of the three tiers, the client is the input and output
interface for user interaction (front
from the user (back-end). This provides the flexi
without affecting the client interface.
49
architecture. Figure 3.4 shows the overall system architecture, connections between each
tier, and between system components. Of the three tiers, the client is the input and output
interface for user interaction (front-end) and provided web and database services hidden
end). This provides the flexibility of changing back-
without affecting the client interface.
Figure 3.4 CCGIS System Tiers.
connections between each
tier, and between system components. Of the three tiers, the client is the input and output
end) and provided web and database services hidden
-end components
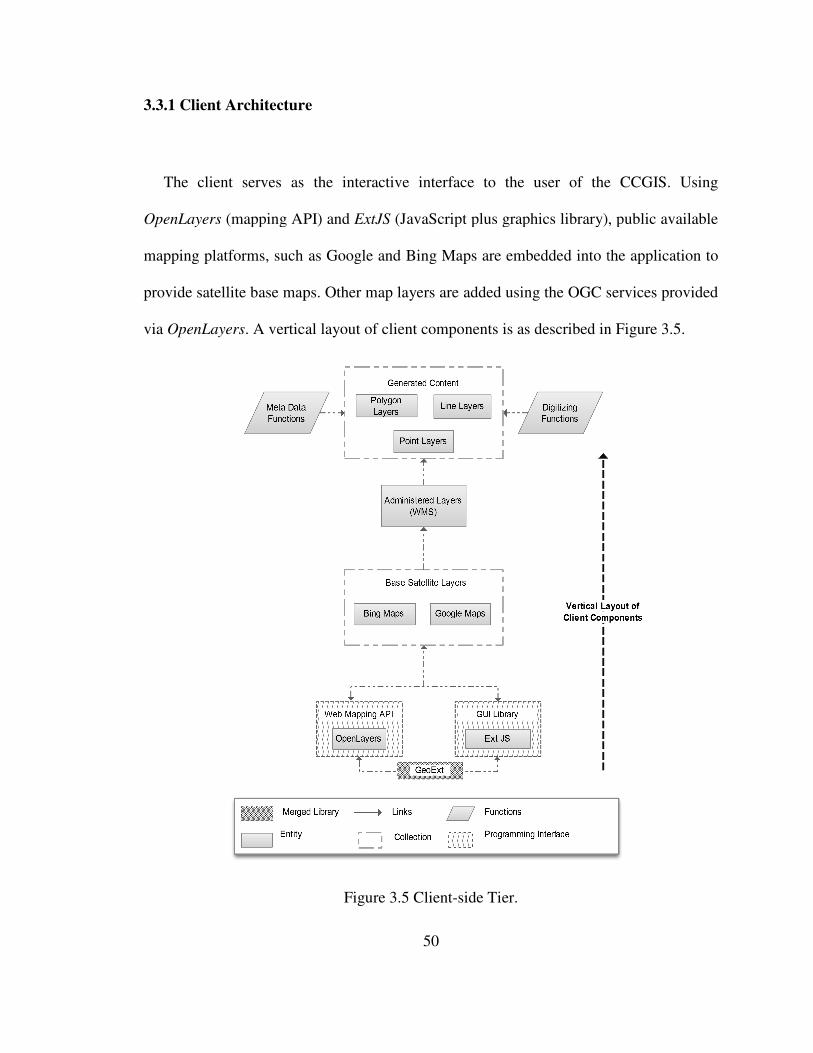
3.3.1 Client Architecture
The client serves as the interactive interface to the user of the CCGIS
OpenLayers (mapping API) and
mapping platforms, such as Google and Bing Maps are embedded into the application to
provide satellite base maps
via OpenLayers. A vertic
50
3.3.1 Client Architecture
The client serves as the interactive interface to the user of the CCGIS
(mapping API) and ExtJS (JavaScript plus graphics library), public available
mapping platforms, such as Google and Bing Maps are embedded into the application to
provide satellite base maps. Other map layers are added using the OGC services provided
. A vertical layout of client components is as described in Figure 3.5.
Figure 3.5 Client-side Tier.
The client serves as the interactive interface to the user of the CCGIS. Using
(JavaScript plus graphics library), public available
mapping platforms, such as Google and Bing Maps are embedded into the application to
Other map layers are added using the OGC services provided
described in Figure 3.5.
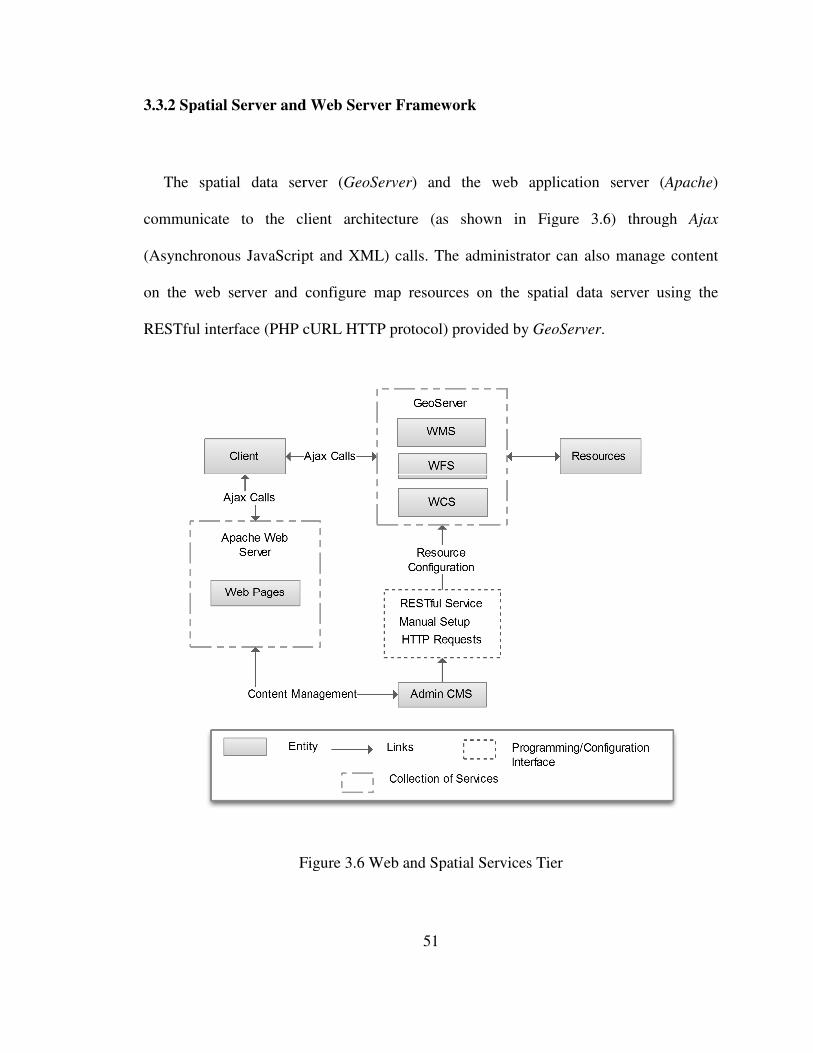
3.3.2 Spatial Server and Web Server Framework
The spatial data server (
communicate to the client architect
(Asynchronous JavaScript and XML
on the web server and configure map resources on the spatial data server using the
RESTful interface (PHP cURL HTTP protocol) provi
Figure 3.6 Web and Spatial Services Tier
51
3.3.2 Spatial Server and Web Server Framework
The spatial data server (GeoServer) and the web application server (
communicate to the client architecture (as shown in Figure 3.6) through
Asynchronous JavaScript and XML) calls. The administrator can also manage content
on the web server and configure map resources on the spatial data server using the
RESTful interface (PHP cURL HTTP protocol) provided by GeoServer.
Figure 3.6 Web and Spatial Services Tier
) and the web application server (Apache)
ure (as shown in Figure 3.6) through Ajax
calls. The administrator can also manage content
on the web server and configure map resources on the spatial data server using the

52
3.3.3 Database Model
The CCGIS database model consists of five main inter related tables (cc_user,
cc_user_address, temp_spatial_contribution, spatial_contribution and spatial_forum).
cc_user table shares a one to one cardinality with cc_user_address. Relationship between
cc_user, temp_spatial_contribution, spatial_contribution and spatial_forum tables may
have a one to zero or more cardinality (may be one to zero or more). A UML (Unified
Model Language) diagram expressing these relationships is as shown in the database
model in Figure 3.7.
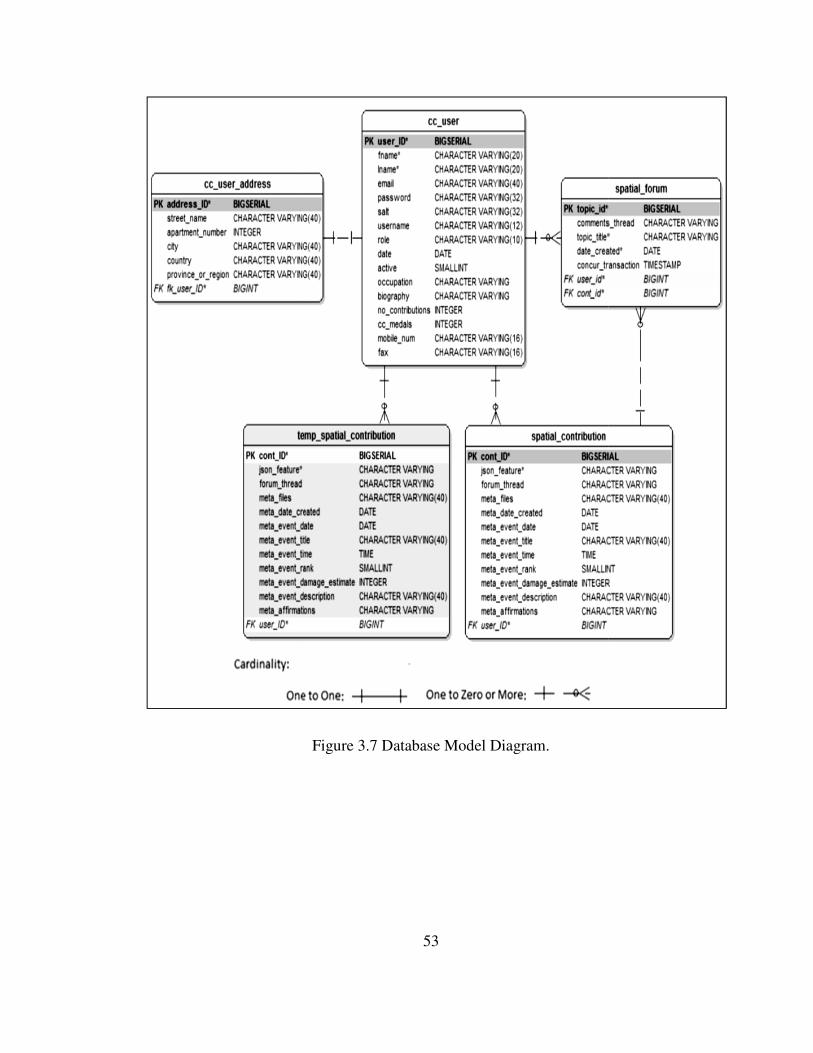
53
Figure 3.7 Database Model Diagram.
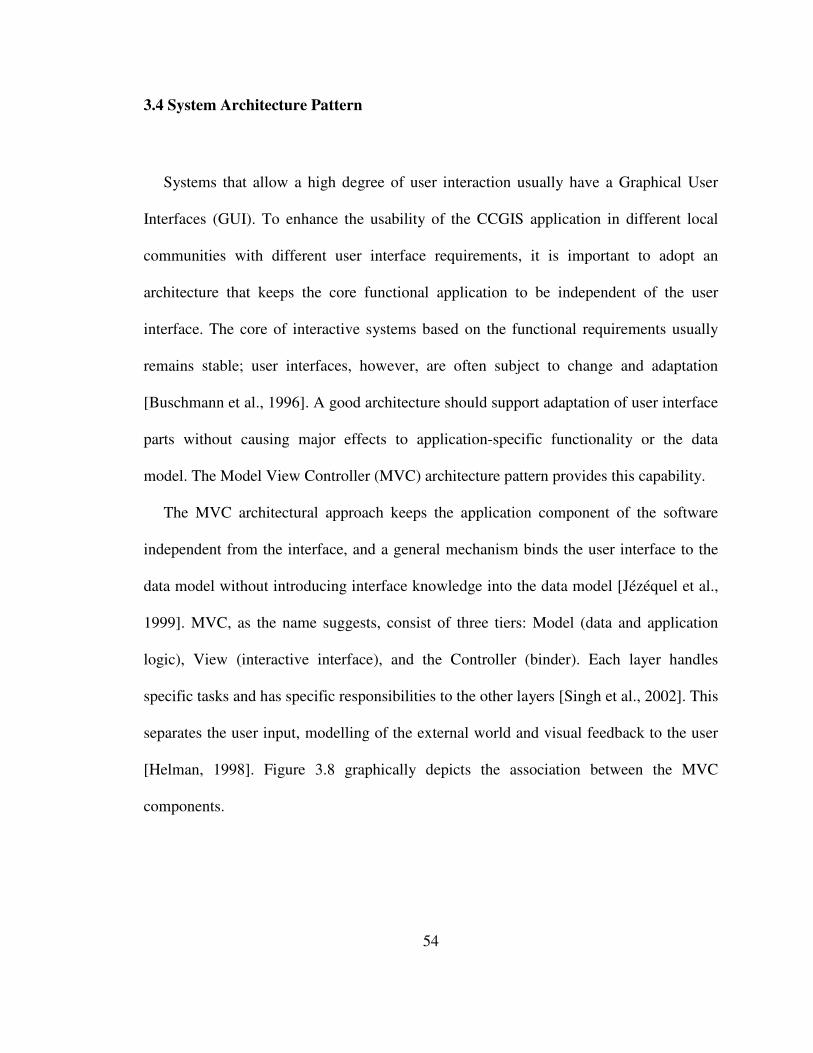
54
3.4 System Architecture Pattern
Systems that allow a high degree of user interaction usually have a Graphical User
Interfaces (GUI). To enhance the usability of the CCGIS application in different local
communities with different user interface requirements, it is important to adopt an
architecture that keeps the core functional application to be independent of the user
interface. The core of interactive systems based on the functional requirements usually
remains stable; user interfaces, however, are often subject to change and adaptation
[Buschmann et al., 1996]. A good architecture should support adaptation of user interface
parts without causing major effects to application-specific functionality or the data
model. The Model View Controller (MVC) architecture pattern provides this capability.
The MVC architectural approach keeps the application component of the software
independent from the interface, and a general mechanism binds the user interface to the
data model without introducing interface knowledge into the data model [Jézéquel et al.,
1999]. MVC, as the name suggests, consist of three tiers: Model (data and application
logic), View (interactive interface), and the Controller (binder). Each layer handles
specific tasks and has specific responsibilities to the other layers [Singh et al., 2002]. This
separates the user input, modelling of the external world and visual feedback to the user
[Helman, 1998]. Figure 3.8 graphically depicts the association between the MVC
components.
Figure 3.8
The Controller binds the model and view. Using the observer pattern, the model
communicates with the
controller, which then directs it to the model or view. The model abstracts the data
resource and contains the application specific functions. This approach to decoupling
allows for changes to the view with little effect to the application logic.
According to Buschmann
described as follows:
• the Model
55
Figure 3.8 The Zend MVC Architecture.
binds the model and view. Using the observer pattern, the model
mmunicates with the View (main output window). Input requests are
then directs it to the model or view. The model abstracts the data
resource and contains the application specific functions. This approach to decoupling
s for changes to the view with little effect to the application logic.
Buschmann et al. [1996] responsibilities of each MVC component
odel (data abstraction and application logic):
binds the model and view. Using the observer pattern, the model
are routed to the
then directs it to the model or view. The model abstracts the data
resource and contains the application specific functions. This approach to decoupling
MVC component are

56
a) provides the functional core of the application,
b) registers dependent view and controllers, and
c) notifies dependent components about data changes;
• the View (graphical component of the interface):
a) creates and initializes its controllers,
b) displays information to the user,
c) implements the model update produced to keep itself accurate, and
d) retrieves data from the model; and
• the Controller (the decision-making part of the application):
a) accepts user inputs as events,
b) translates events to service requests for the model or display
requests for the view, and
c) implements indirect graphical update procedures if required.
3.5 Summary
This chapter defined the meaning of local and scientific knowledge and how they are
acquired. The chapter then discussed how data, information, models and knowledge are
linked into a conceptual policy framework towards developing coastal adaptation
policies. Data and information represented as spatial models in the minds of people exist
57
as local knowledge and can be abstracted into simple vector objects such as points, lines,
and polygons to represent a location, linear and area features respectively.
System components designs consisting of the client, server, and database model were
developed as components of the Zend Model View Controller (MVC) architectural
pattern. This approach separates data, application, and rendering logic into three
components (model, view, and controller) that can be modified independently. The
controller ties the model and view together. The chapter concludes with the roles of each
component in the MVC architecture. The next chapter puts the system design into a
functioning system that can be applied in each C-Change community to supplement best
available data.
58
Chapter Four: CCGIS Implementation
Design is not just what it looks like and feels like. Design is how it works
~ Steve Jobs - [Walker,2003]
In Chapters 1 and 2, this research articulated some of the problems facing most coastal
communities due to sea level rise and storm surge events. Since many coastal
communities lack precise scientific data for flood mapping, this research identified the
use of local knowledge as a supplement to the best available data when assessing threats
or vulnerabilities in a coastal adaptation process. Local knowledge is a common resource
in coastal communities acquired through experience and intuition in their own
environment. To help quantify local knowledge, the author identified web-mapping tools
to be used in developing a Coastal Collaborative GIS based on initial user and system
requirements.
This chapter discusses design execution using publicly available web mapping tools
for a Coastal Collaborative GIS. The MVC pattern discussed in Chapter 3 serves as the
overall architecture for laying out the CCGIS. Implementation of components and
communication between the client, server, and database are discussed. The chapter
concludes with how to use outputs of this research on other interoperable GIS formats.

59
4.1 Choice of Framework
The MVC design in Section 3.5 can be rolled out using most server-side scripting
languages with varied frameworks libraries. Popular server-side scripting languages
(framework) include, but are not limited to:
• ASP.NET (ASP.NET MVC, Vici MVC, MonoRail etc.),
• Perl (Catalyst, Mason, Maypole etc.),
• PHP (CakePHP, CodeIgniter, Qcodo, Symphony, Zend Framework etc.),
• Java (Spring Framework, Java Server Pages, Google Web Toolkit etc.),
• Python (Pylons, Django, TurboGears etc.),
• Ruby (Rails, Ramaze, Sinatra, Camping etc.),
• ColdFusion (ColdFusion on Wheels, ColdSpring, Model-Glue etc.) etc.
To choose from this list, it is important to consider the architecture implementation of the
framework (flexibility), licensing, and community support. From the list of server-side
scripting languages itemized above, PHP (Hypertext Preprocessor) is the most widely
used server-side scripting language on the World Wide Web. Given the popularity of
PHP and its community support, it is a good start. PHP as a language has varied
framework flavours (CakePHP, CodeIgniter, Qcodo, Symphony, Zend Framework etc.).
One of the most promising technologies is the Zend Framework. The Zend Company
is the main leader in support of the most widely used open source server-side scripting
language on the web (PHP). The Zend MVC provides a plethora of loosely coupled
libraries for dynamic web programming. This research implements PHP using the Zend

60
Framework MVC architecture given the fact that it is loosely coupled (fragments of the
framework can be used without using the whole bulk) and there is a high degree of long-
term support by its community of developers to changing web technologies.
4.2 Zend MVC Project Structure
The MVC pattern implemented by the Zend Framework consists of three main
components:
• the model, (Zend_Db_Table or any data source),
• the view (Zend_View), and
• the controller(Zend_Controller).
At its simplest, Zend_Controller processes the request, fetches data from Zend_Db, and
then passes this data to Zend_View to render dynamic XHTML (eXtensible HyperText
Markup Language). The Zend MVC project layout consist architecture of directories and
file hierarchies. This hierarchy allows for a well-organised project as shown in Figure
4.1. The Application directory contains the CCGIS application and houses the MVC
system, as well as configurations, and the bootstrap file. The subdirectories: Controllers,
Models, and Views provide and serve as the default controller, model and view directories
respectively. These three directories inside the application directory provide the best
layout for starting a simple Zend MVC project. One important file in the application
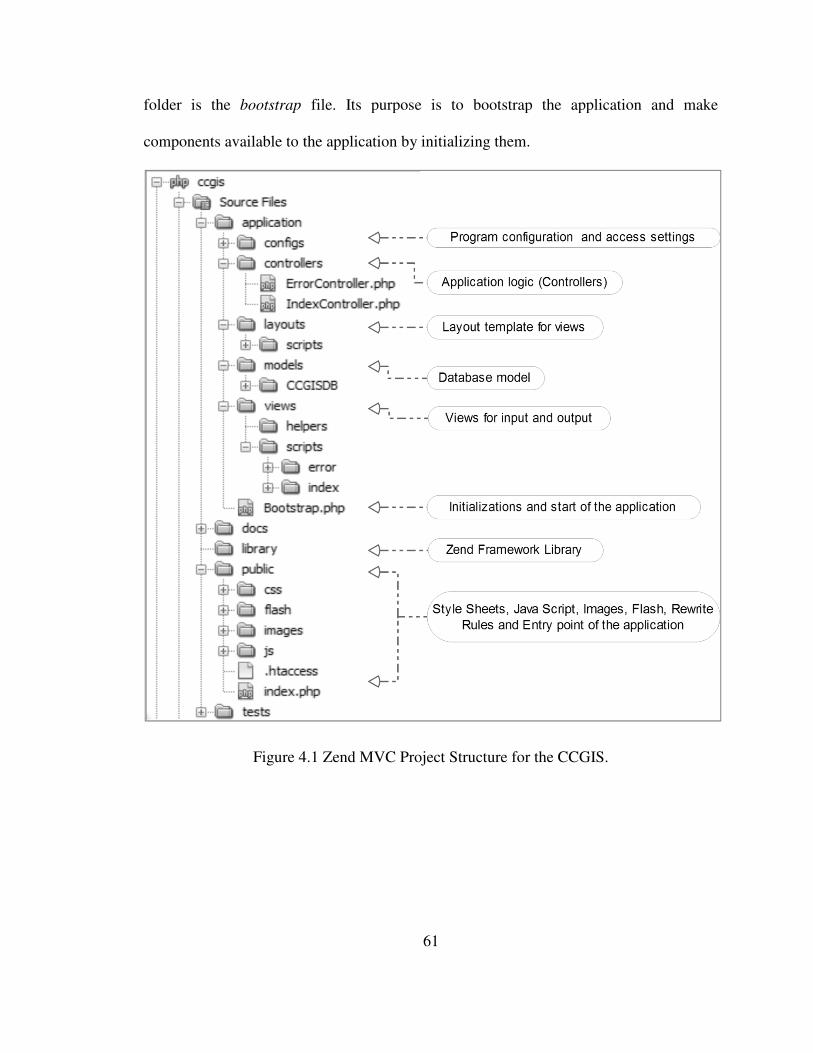
folder is the bootstrap
components available to the application by initializing them
Figure 4.1 Zend MVC P
61
file. Its purpose is to bootstrap the application and make
components available to the application by initializing them.
Figure 4.1 Zend MVC Project Structure for the CCGIS.
purpose is to bootstrap the application and make
.
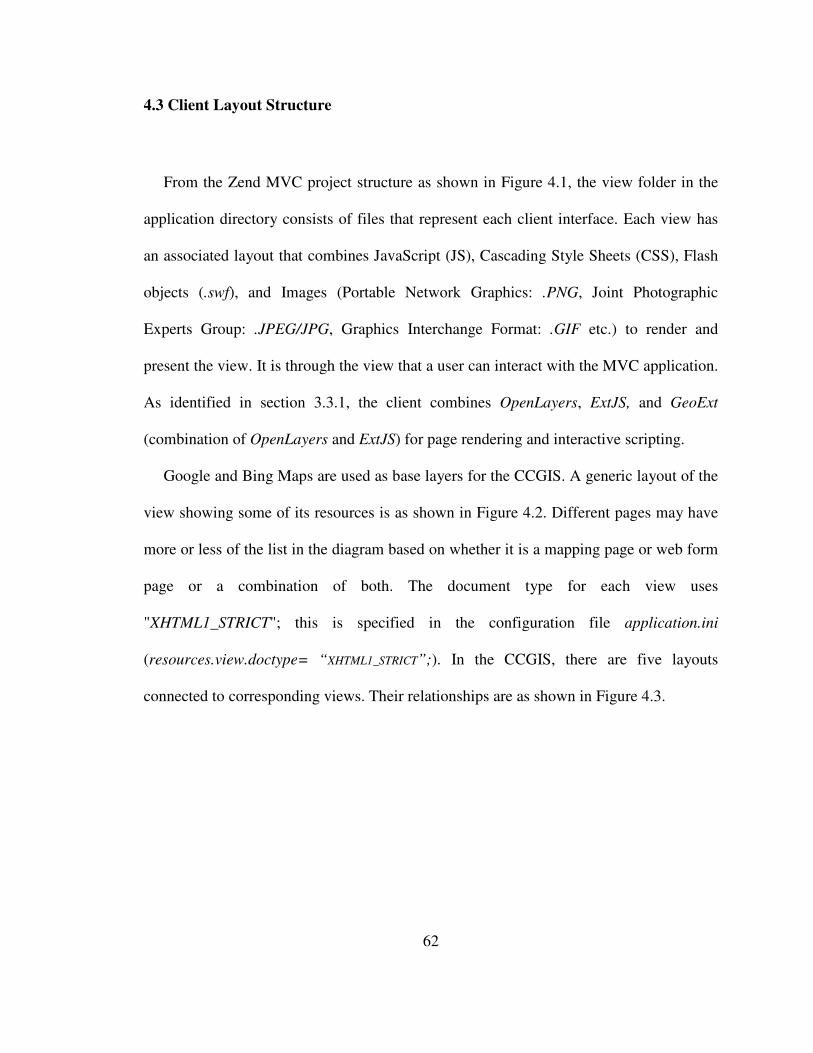
62
4.3 Client Layout Structure
From the Zend MVC project structure as shown in Figure 4.1, the view folder in the
application directory consists of files that represent each client interface. Each view has
an associated layout that combines JavaScript (JS), Cascading Style Sheets (CSS), Flash
objects (.swf), and Images (Portable Network Graphics: .PNG, Joint Photographic
Experts Group: .JPEG/JPG, Graphics Interchange Format: .GIF etc.) to render and
present the view. It is through the view that a user can interact with the MVC application.
As identified in section 3.3.1, the client combines OpenLayers, ExtJS, and GeoExt
(combination of OpenLayers and ExtJS) for page rendering and interactive scripting.
Google and Bing Maps are used as base layers for the CCGIS. A generic layout of the
view showing some of its resources is as shown in Figure 4.2. Different pages may have
more or less of the list in the diagram based on whether it is a mapping page or web form
page or a combination of both. The document type for each view uses
"XHTML1_STRICT"; this is specified in the configuration file application.ini
(resources.view.doctype= “XHTML1_STRICT”;). In the CCGIS, there are five layouts
connected to corresponding views. Their relationships are as shown in Figure 4.3.
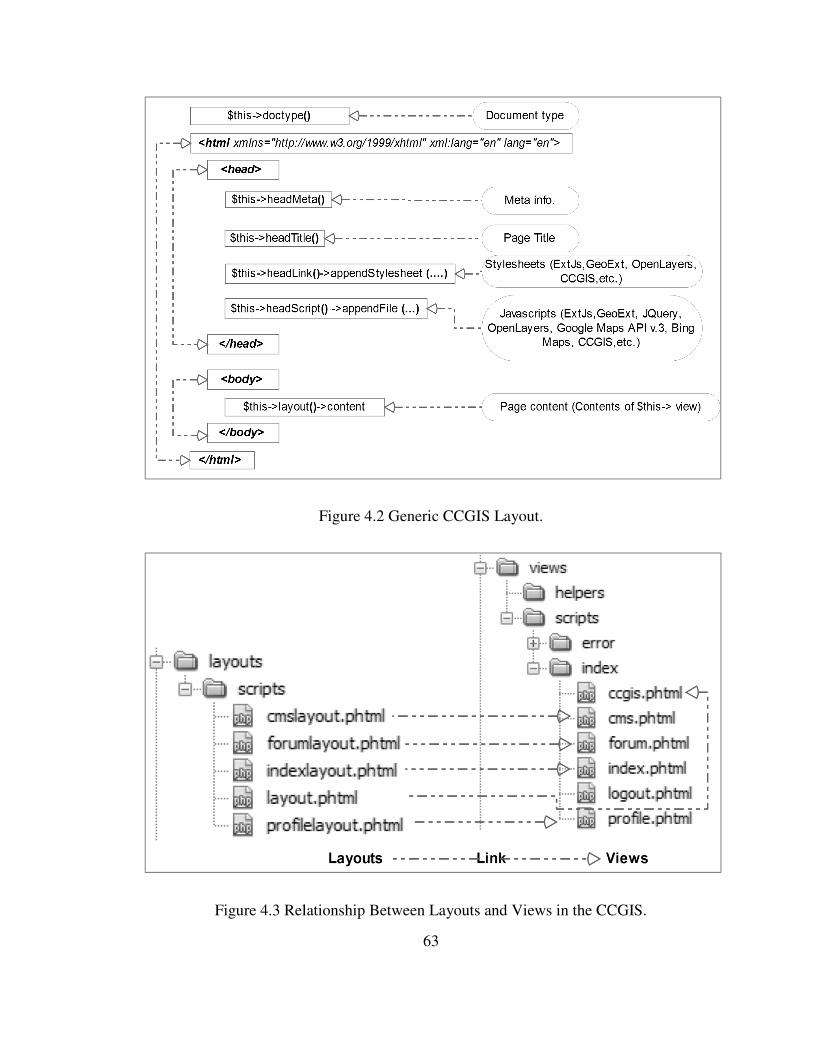
Figure 4.3 Relationship Between Layouts and V
63
Figure 4.2 Generic CCGIS Layout.
Figure 4.3 Relationship Between Layouts and Views in the CCGIS
iews in the CCGIS.
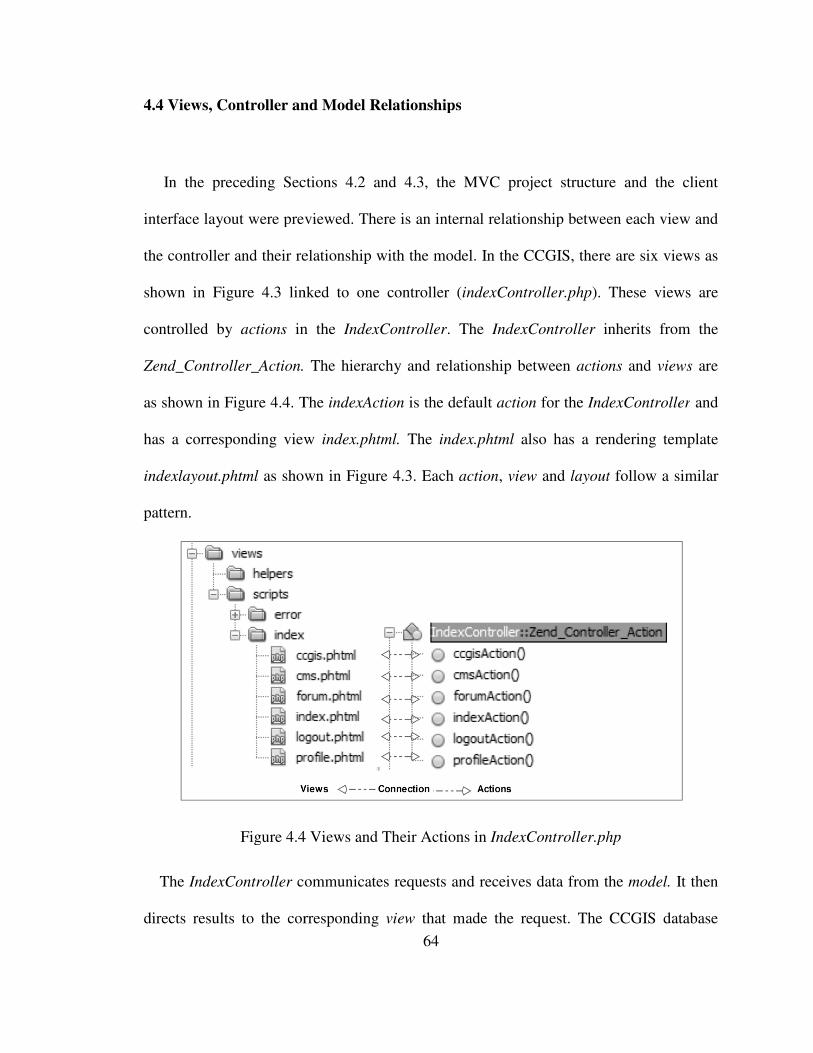
4.4 Views, Controller and Model Relationships
In the preceding Sections 4.2 and 4.3, the MVC project stru
interface layout were previewed. There is an internal relationship between each view and
the controller and their relationship with the model. In the CCGIS, there are six views as
shown in Figure 4.3 linked to one controller (
controlled by actions in the
Zend_Controller_Action.
as shown in Figure 4.4. The
has a corresponding view
indexlayout.phtml as shown in Figure 4.3.
pattern.
Figure 4.4 Views
The IndexController communicates requests and receives data from the
directs results to the corresponding
64
4 Views, Controller and Model Relationships
the preceding Sections 4.2 and 4.3, the MVC project structure and the client
previewed. There is an internal relationship between each view and
the controller and their relationship with the model. In the CCGIS, there are six views as
shown in Figure 4.3 linked to one controller (indexController.php). These views are
in the IndexController. The IndexController inherits from the
. The hierarchy and relationship between actions
as shown in Figure 4.4. The indexAction is the default action for the IndexController
has a corresponding view index.phtml. The index.phtml also has a rendering template
as shown in Figure 4.3. Each action, view and layout
Figure 4.4 Views and Their Actions in IndexController.php
communicates requests and receives data from the
directs results to the corresponding view that made the request. The CCGIS database
cture and the client
previewed. There is an internal relationship between each view and
the controller and their relationship with the model. In the CCGIS, there are six views as
). These views are
inherits from the
actions and views are
IndexController and
rendering template
layout follow a similar
exController.php
communicates requests and receives data from the model. It then
that made the request. The CCGIS database
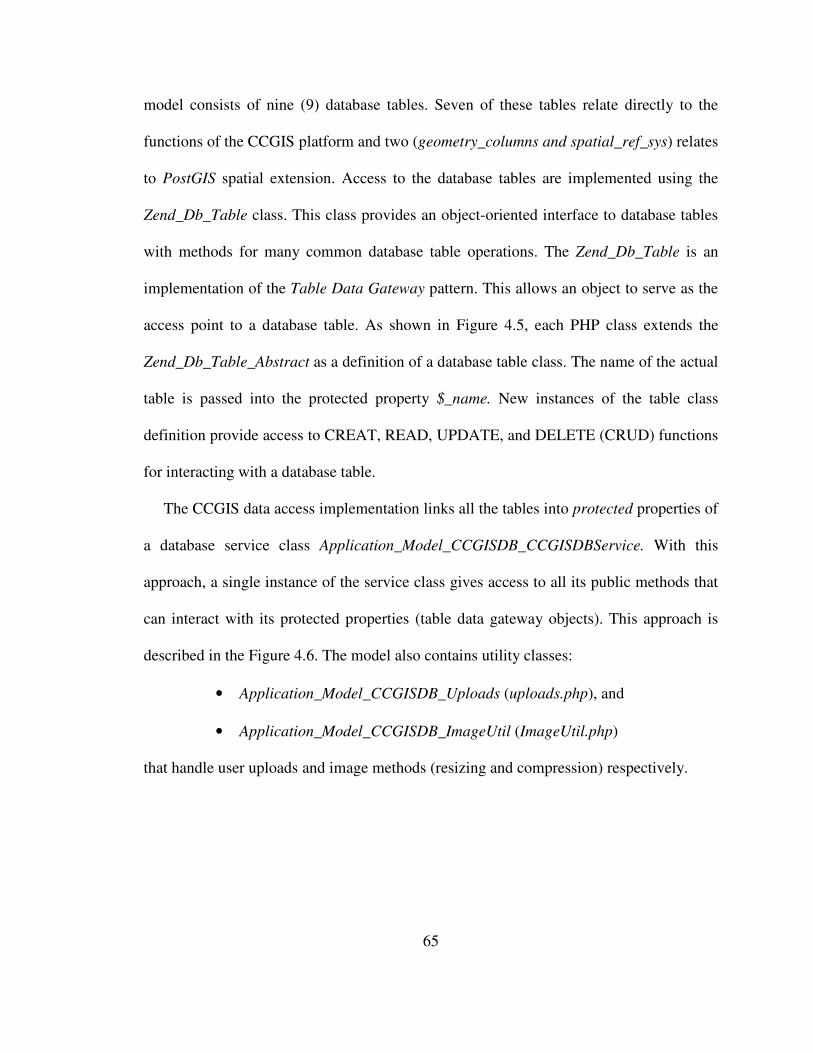
65
model consists of nine (9) database tables. Seven of these tables relate directly to the
functions of the CCGIS platform and two (geometry_columns and spatial_ref_sys) relates
to PostGIS spatial extension. Access to the database tables are implemented using the
Zend_Db_Table class. This class provides an object-oriented interface to database tables
with methods for many common database table operations. The Zend_Db_Table is an
implementation of the Table Data Gateway pattern. This allows an object to serve as the
access point to a database table. As shown in Figure 4.5, each PHP class extends the
Zend_Db_Table_Abstract as a definition of a database table class. The name of the actual
table is passed into the protected property $_name. New instances of the table class
definition provide access to CREAT, READ, UPDATE, and DELETE (CRUD) functions
for interacting with a database table.
The CCGIS data access implementation links all the tables into protected properties of
a database service class Application_Model_CCGISDB_CCGISDBService. With this
approach, a single instance of the service class gives access to all its public methods that
can interact with its protected properties (table data gateway objects). This approach is
described in the Figure 4.6. The model also contains utility classes:
• Application_Model_CCGISDB_Uploads (uploads.php), and
• Application_Model_CCGISDB_ImageUtil (ImageUtil.php)
that handle user uploads and image methods (resizing and compression) respectively.
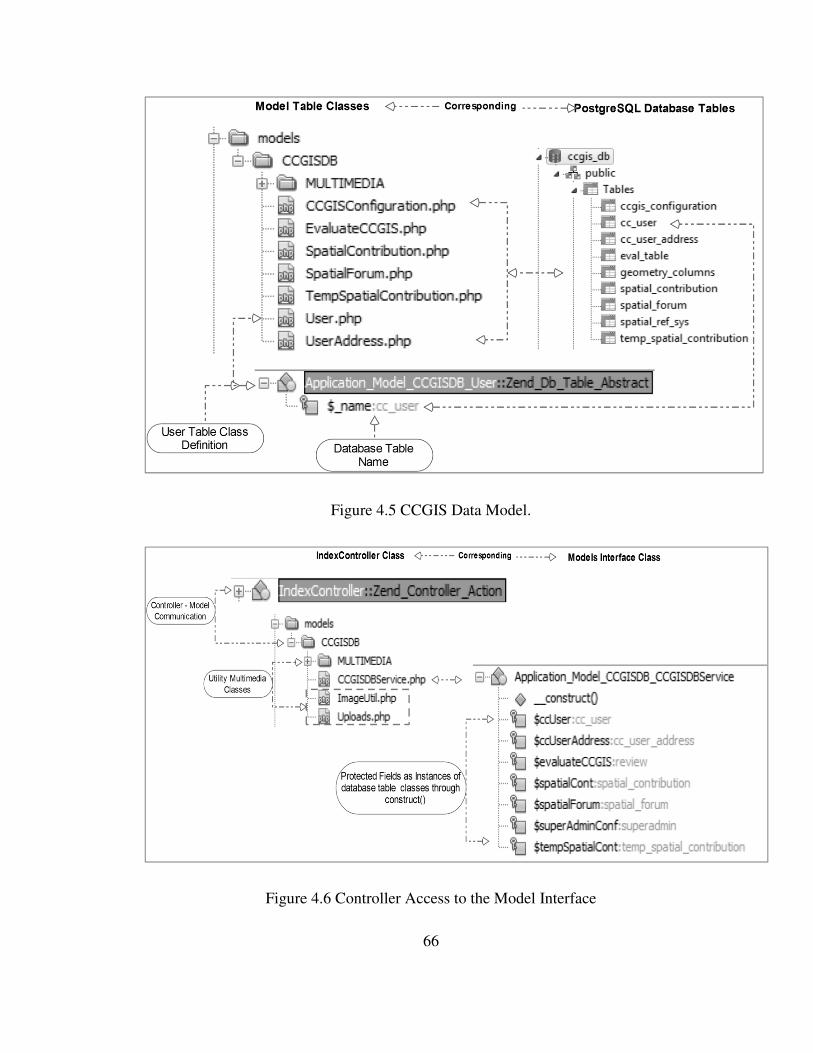
Figure 4.6 Controller Access to the Model Interface
66
Figure 4.5 CCGIS Data Model.
Figure 4.6 Controller Access to the Model Interface
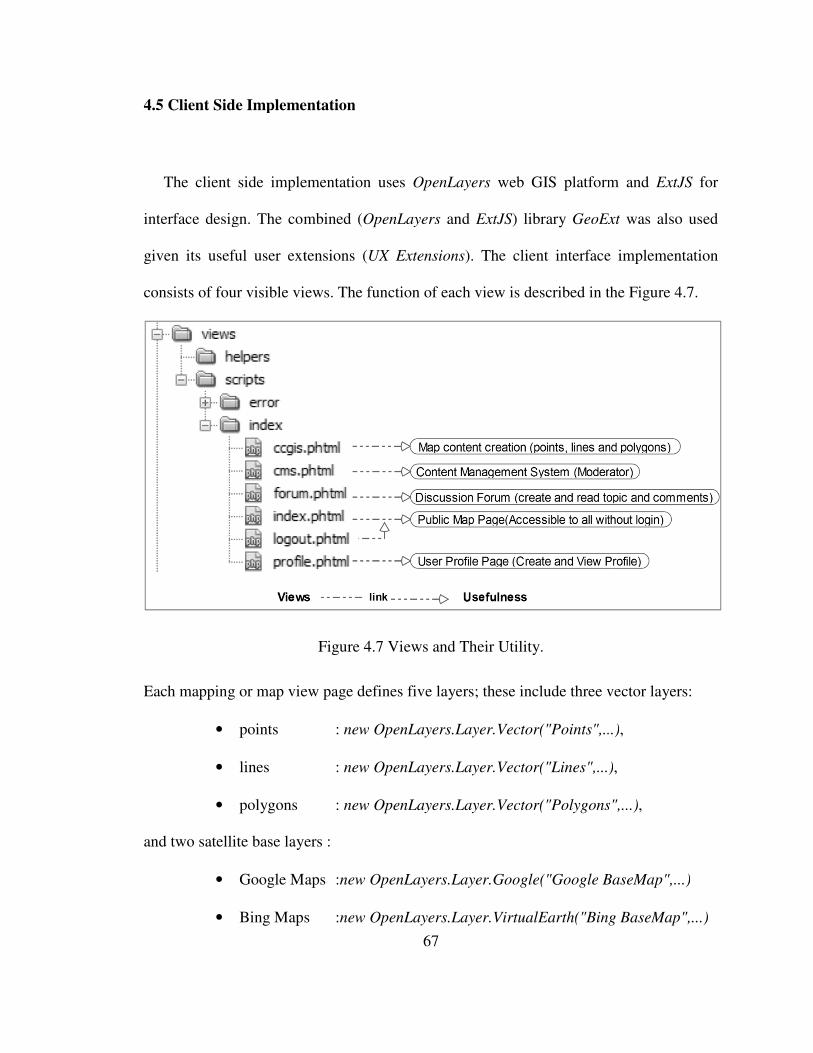
4.5 Client Side Implementation
The client side implementation uses
interface design. The combined (
given its useful user extensions (
consists of four visible views.
Each mapping or map view page defines five layers; these include three vector layers:
• points
• lines
• polygons
and two satellite base layers
• Google Maps
• Bing Maps
67
nt Side Implementation
The client side implementation uses OpenLayers web GIS platform and
interface design. The combined (OpenLayers and ExtJS) library GeoExt
user extensions (UX Extensions). The client interface implementation
onsists of four visible views. The function of each view is described in the Figure 4.7.
Figure 4.7 Views and Their Utility.
Each mapping or map view page defines five layers; these include three vector layers:
: new OpenLayers.Layer.Vector("Points",...)
: new OpenLayers.Layer.Vector("Lines",...)
: new OpenLayers.Layer.Vector("Polygons",...)
and two satellite base layers :
Google Maps :new OpenLayers.Layer.Google("Google BaseMap",...)
Bing Maps :new OpenLayers.Layer.VirtualEarth("Bing BaseMap",...)
web GIS platform and ExtJS for
GeoExt was also used
face implementation
The function of each view is described in the Figure 4.7.
Each mapping or map view page defines five layers; these include three vector layers:
ers.Layer.Vector("Points",...),
new OpenLayers.Layer.Vector("Lines",...),
new OpenLayers.Layer.Vector("Polygons",...),
new OpenLayers.Layer.Google("Google BaseMap",...)
Layers.Layer.VirtualEarth("Bing BaseMap",...)
68
The satellite base layers serve as a background for which users can draw or sketch simple
vector objects that are editable in the layers: points, lines, and polygons. The drawing of a
vector object can be initiated using OpenLayers controls with specific handlers. Code
snippets of how to draw in the three vector layers are:
Points : new OpenLayers.Control.DrawFeature(layerName,OpenLayers.Handler.Point,...),
Lines :new OpenLayers.Control.DrawFeature(layerName, OpenLayers.Handler.Path,...),and
Polygon: new OpenLayers.Control.DrawFeature (layerName, OpenLayers.Handler.Polygon,...).
Additional controls include:
• Snapping (for snapping the mouse cursor to features and vertices),
• ModifyFeature (when active, a clicked line or polygon vertices can be
modified by adding more vertices to change shape),
• DragFeature (used for dragging features: points, lines or polygons from
one position to another),
• Split (for splitting lines, when active a line drawn across any given line
splits the line at the point of intersect),
• LayerSwitcher (for switching between layers. A non base layer can be
switched on or off irrespective of the state of other overlays whiles only
one base layer can be on at a time),
• Permalink (permalink provides additional URL parameters that describe
the map state: location coordinates and zoom level),
• ScaleLine (scale of the map at a given zoom level displayed on a line bar),
• SelectFeature (when active, a clicked feature is selected, CCGIS uses
select to display object attributes),
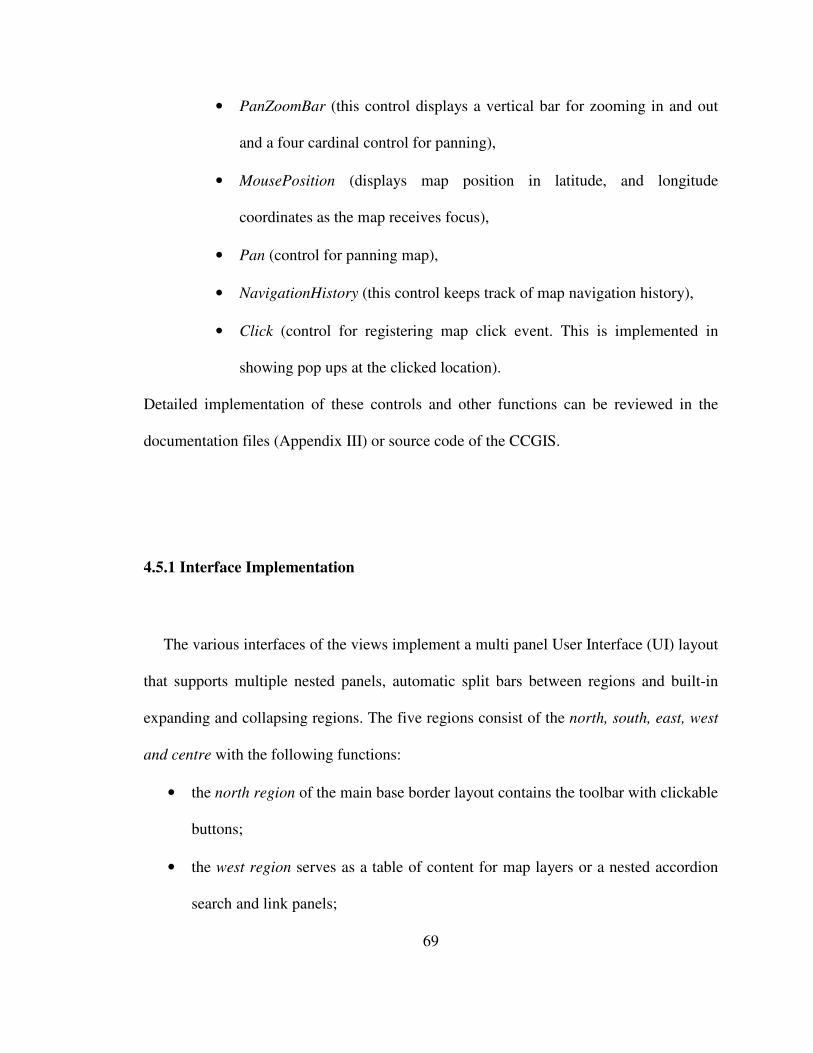
69
• PanZoomBar (this control displays a vertical bar for zooming in and out
and a four cardinal control for panning),
• MousePosition (displays map position in latitude, and longitude
coordinates as the map receives focus),
• Pan (control for panning map),
• NavigationHistory (this control keeps track of map navigation history),
• Click (control for registering map click event. This is implemented in
showing pop ups at the clicked location).
Detailed implementation of these controls and other functions can be reviewed in the
documentation files (Appendix III) or source code of the CCGIS.
4.5.1 Interface Implementation
The various interfaces of the views implement a multi panel User Interface (UI) layout
that supports multiple nested panels, automatic split bars between regions and built-in
expanding and collapsing regions. The five regions consist of the north, south, east, west
and centre with the following functions:
• the north region of the main base border layout contains the toolbar with clickable
buttons;
• the west region serves as a table of content for map layers or a nested accordion
search and link panels;

• the east region contains accordions for spatial object properties or map search
fields;
• the south region for users geo
• the centre region
In instances where there are nested border layouts, the
plus any of the other four regions. Sample implement
nested components is as shown in Figure 4.8.
70
contains accordions for spatial object properties or map search
for users geo-location and copyright notice; and
is used for imbedding other panels or used as the map panel.
In instances where there are nested border layouts, the centre region is always required
plus any of the other four regions. Sample implementation of a single border layout with
nested components is as shown in Figure 4.8.
Figure 4.8 Index View.
contains accordions for spatial object properties or map search
ocation and copyright notice; and
is used for imbedding other panels or used as the map panel.
is always required
ation of a single border layout with
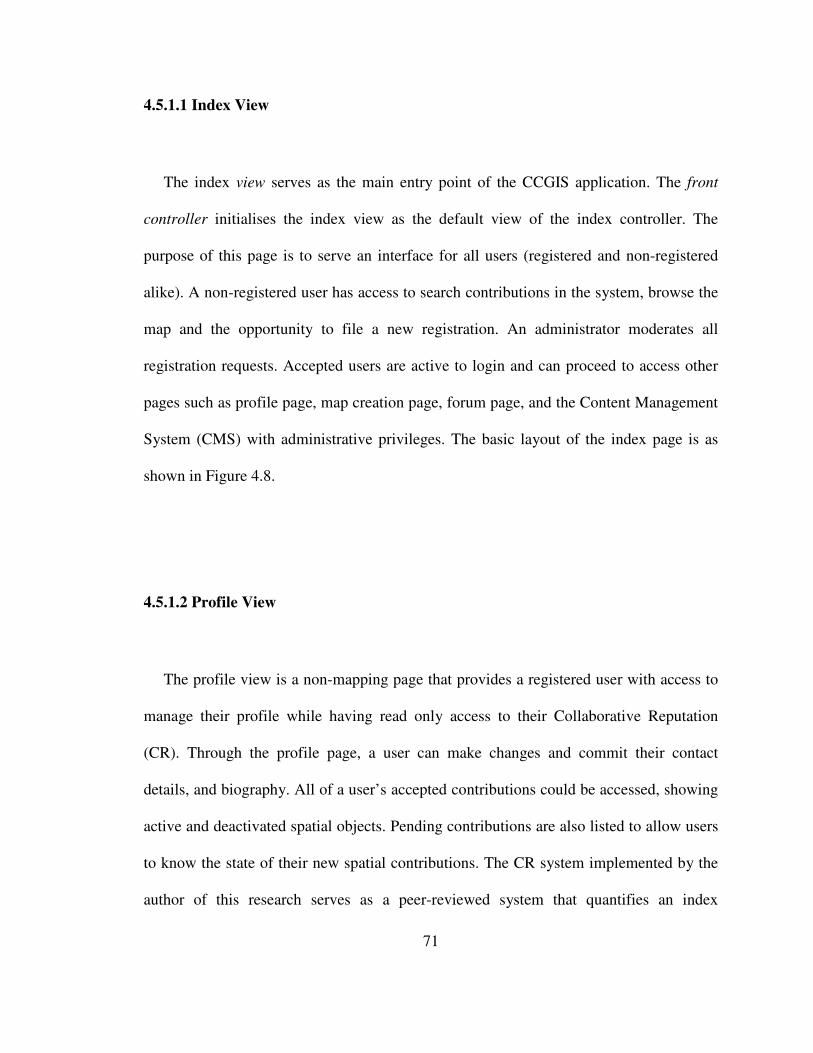
71
4.5.1.1 Index View
The index view serves as the main entry point of the CCGIS application. The front
controller initialises the index view as the default view of the index controller. The
purpose of this page is to serve an interface for all users (registered and non-registered
alike). A non-registered user has access to search contributions in the system, browse the
map and the opportunity to file a new registration. An administrator moderates all
registration requests. Accepted users are active to login and can proceed to access other
pages such as profile page, map creation page, forum page, and the Content Management
System (CMS) with administrative privileges. The basic layout of the index page is as
shown in Figure 4.8.
4.5.1.2 Profile View
The profile view is a non-mapping page that provides a registered user with access to
manage their profile while having read only access to their Collaborative Reputation
(CR). Through the profile page, a user can make changes and commit their contact
details, and biography. All of a user’s accepted contributions could be accessed, showing
active and deactivated spatial objects. Pending contributions are also listed to allow users
to know the state of their new spatial contributions. The CR system implemented by the
author of this research serves as a peer-reviewed system that quantifies an index
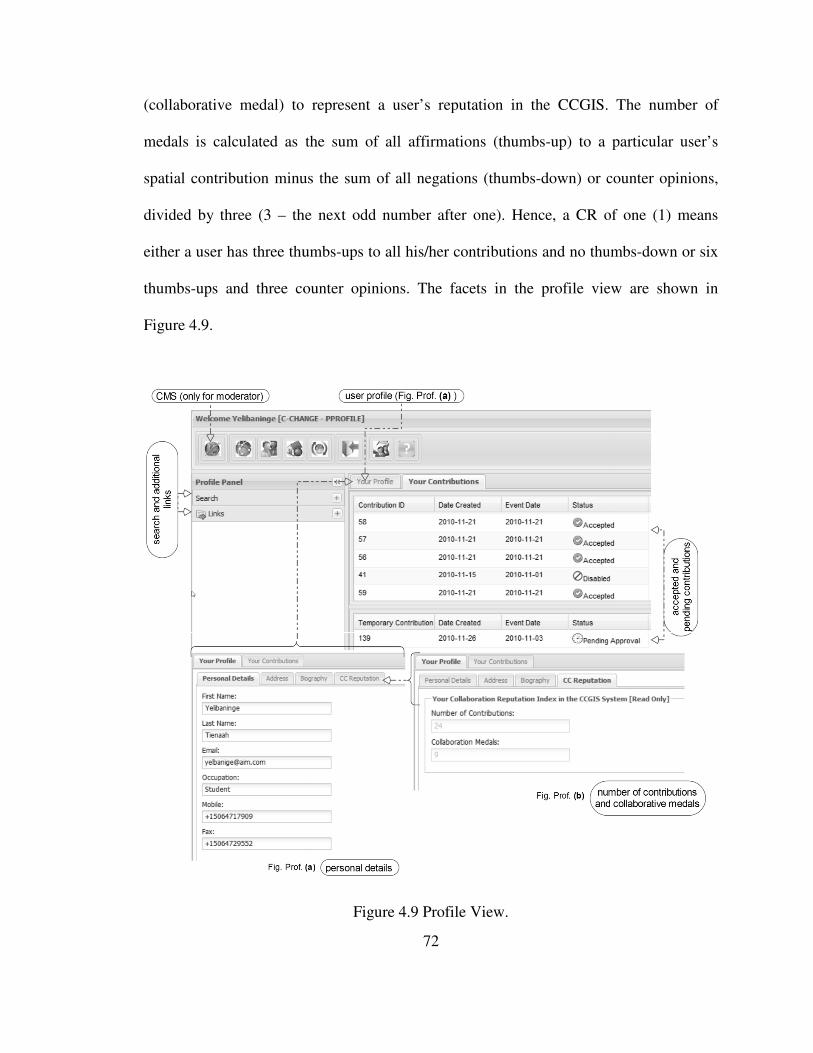
(collaborative medal) to represent a user’s reputati
medals is calculated as the sum of all affirmations
spatial contribution minus the sum of all negations
divided by three (3 – the next odd number after one
either a user has three thumbs
thumbs-ups and three counter opinions. The
Figure 4.9.
72
(collaborative medal) to represent a user’s reputation in the CCGIS. The number of
medals is calculated as the sum of all affirmations (thumbs-up) to a particular user’s
spatial contribution minus the sum of all negations (thumbs-down) or counter opinions,
he next odd number after one). Hence, a CR of one (1) means
thumbs-ups to all his/her contributions and no thumbs
and three counter opinions. The facets in the profile view are shown in
Figure 4.9 Profile View.
on in the CCGIS. The number of
to a particular user’s
or counter opinions,
Hence, a CR of one (1) means
thumbs-down or six
in the profile view are shown in
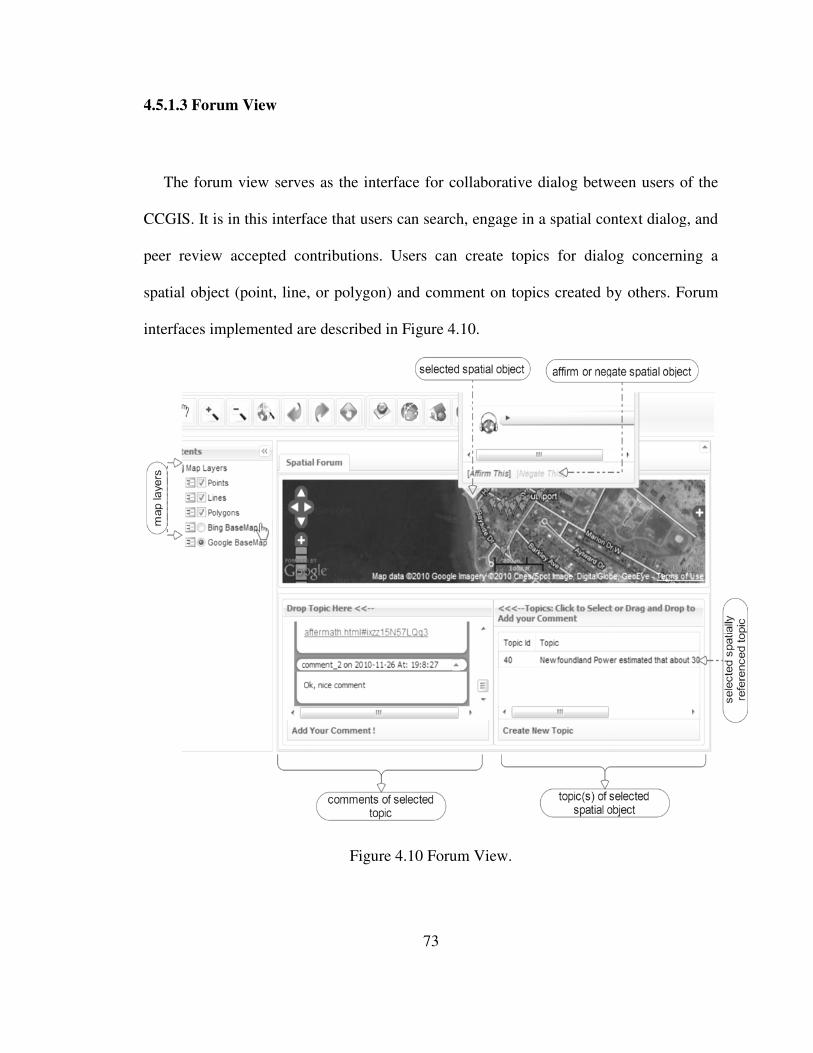
4.5.1.3 Forum View
The forum view serves as the interface for collaborative dialog between users of the
CCGIS. It is in this interface that users can search, engage in a spatial context dialog, and
peer review accepted contributions. Users can create topics for
spatial object (point, line,
interfaces implemented are described in Figure 4.10.
73
The forum view serves as the interface for collaborative dialog between users of the
CCGIS. It is in this interface that users can search, engage in a spatial context dialog, and
peer review accepted contributions. Users can create topics for dialog concerning a
line, or polygon) and comment on topics created by others. Forum
interfaces implemented are described in Figure 4.10.
Figure 4.10 Forum View.
The forum view serves as the interface for collaborative dialog between users of the
CCGIS. It is in this interface that users can search, engage in a spatial context dialog, and
dialog concerning a
comment on topics created by others. Forum
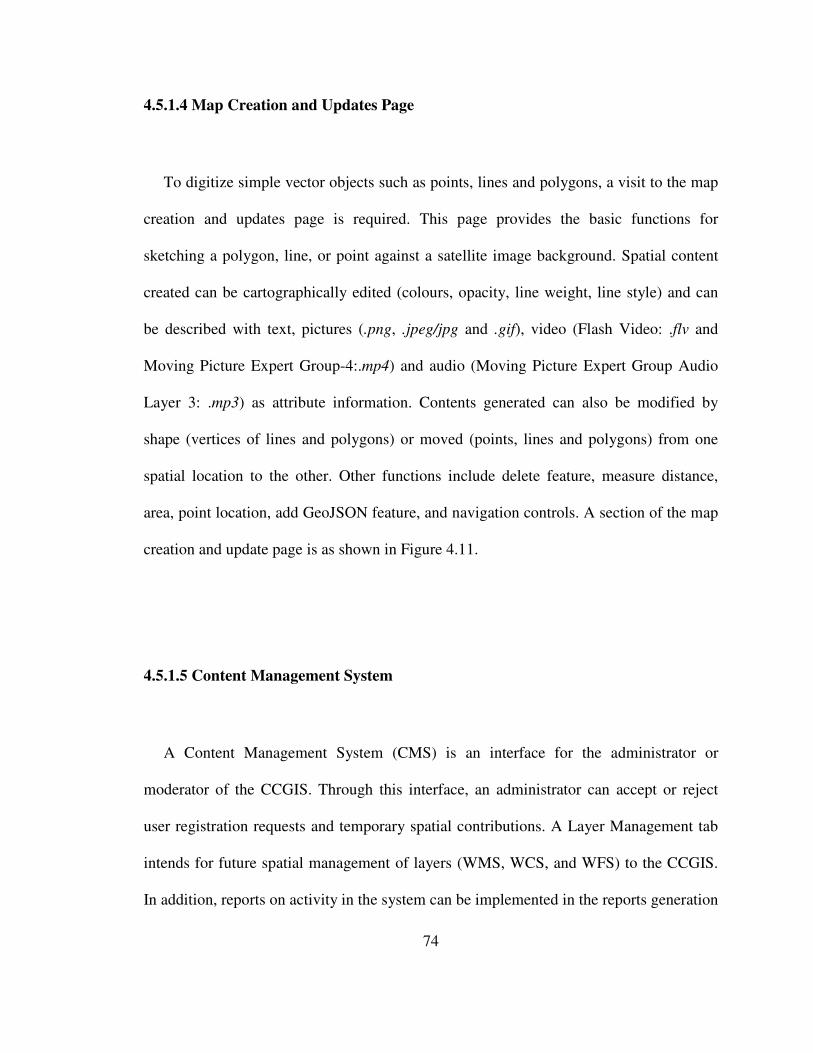
74
4.5.1.4 Map Creation and Updates Page
To digitize simple vector objects such as points, lines and polygons, a visit to the map
creation and updates page is required. This page provides the basic functions for
sketching a polygon, line, or point against a satellite image background. Spatial content
created can be cartographically edited (colours, opacity, line weight, line style) and can
be described with text, pictures (.png, .jpeg/jpg and .gif), video (Flash Video: .flv and
Moving Picture Expert Group-4:.mp4) and audio (Moving Picture Expert Group Audio
Layer 3: .mp3) as attribute information. Contents generated can also be modified by
shape (vertices of lines and polygons) or moved (points, lines and polygons) from one
spatial location to the other. Other functions include delete feature, measure distance,
area, point location, add GeoJSON feature, and navigation controls. A section of the map
creation and update page is as shown in Figure 4.11.
4.5.1.5 Content Management System
A Content Management System (CMS) is an interface for the administrator or
moderator of the CCGIS. Through this interface, an administrator can accept or reject
user registration requests and temporary spatial contributions. A Layer Management tab
intends for future spatial management of layers (WMS, WCS, and WFS) to the CCGIS.
In addition, reports on activity in the system can be implemented in the reports generation
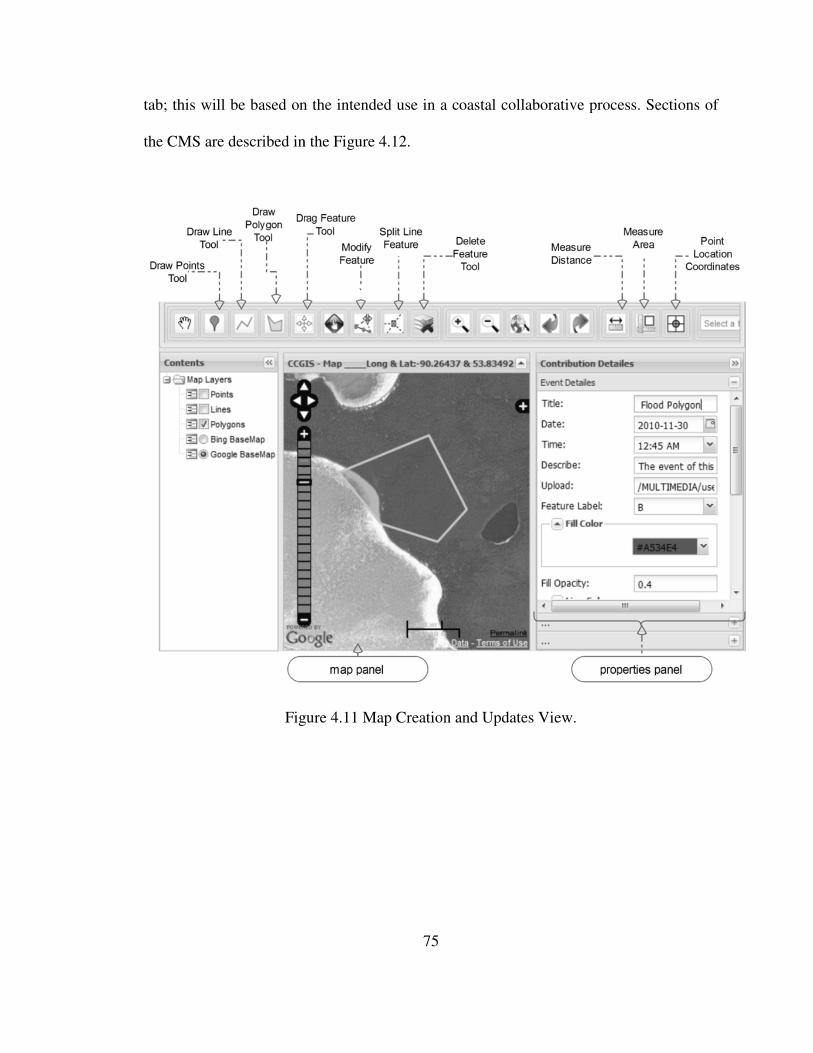
tab; this will be based on the intended use in a coastal collaborative process. Sections of
the CMS are described in the Figure 4.12.
Figure 4.11 Map Creation and Upda
75
tab; this will be based on the intended use in a coastal collaborative process. Sections of
the CMS are described in the Figure 4.12.
Figure 4.11 Map Creation and Updates View.
tab; this will be based on the intended use in a coastal collaborative process. Sections of
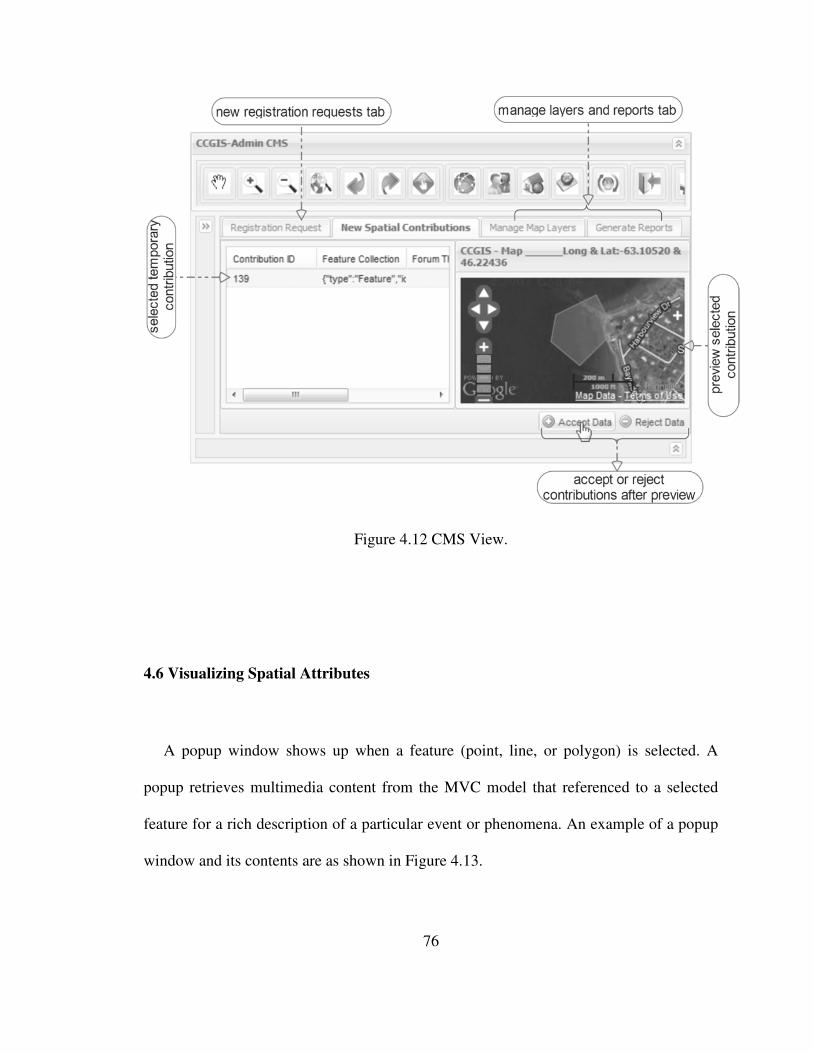
4.6 Visualizing Spatial A
A popup window shows up when a feature (point,
popup retrieves multimedia content from the MVC model that referenced to a selected
feature for a rich description of a particular event or phenomena. An example of a popup
window and its contents are as shown in Figure 4.13.
76
Figure 4.12 CMS View.
Attributes
A popup window shows up when a feature (point, line, or polygon)
popup retrieves multimedia content from the MVC model that referenced to a selected
a rich description of a particular event or phenomena. An example of a popup
window and its contents are as shown in Figure 4.13.
or polygon) is selected. A
popup retrieves multimedia content from the MVC model that referenced to a selected
a rich description of a particular event or phenomena. An example of a popup
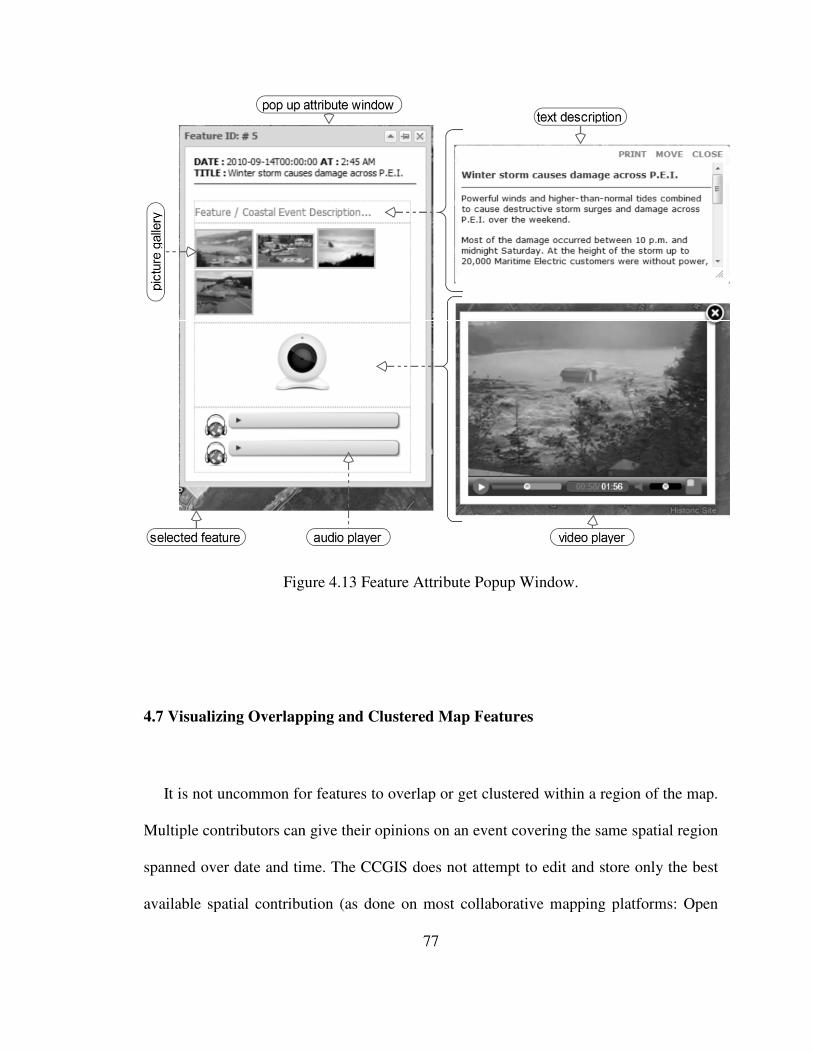
Figure 4.13 Feature Attribute Popup Window
4.7 Visualizing Overlapping and Clustered Map F
It is not uncommon for features to overlap or get clustered within a region of the map.
Multiple contributors can give their opinions on an event covering the same spatial region
spanned over date and time. The CCGIS does not attempt to edit and store only the best
available spatial contribution (as done on most collaborative mapping platforms: Open
77
Figure 4.13 Feature Attribute Popup Window.
Overlapping and Clustered Map Features
n for features to overlap or get clustered within a region of the map.
Multiple contributors can give their opinions on an event covering the same spatial region
spanned over date and time. The CCGIS does not attempt to edit and store only the best
le spatial contribution (as done on most collaborative mapping platforms: Open
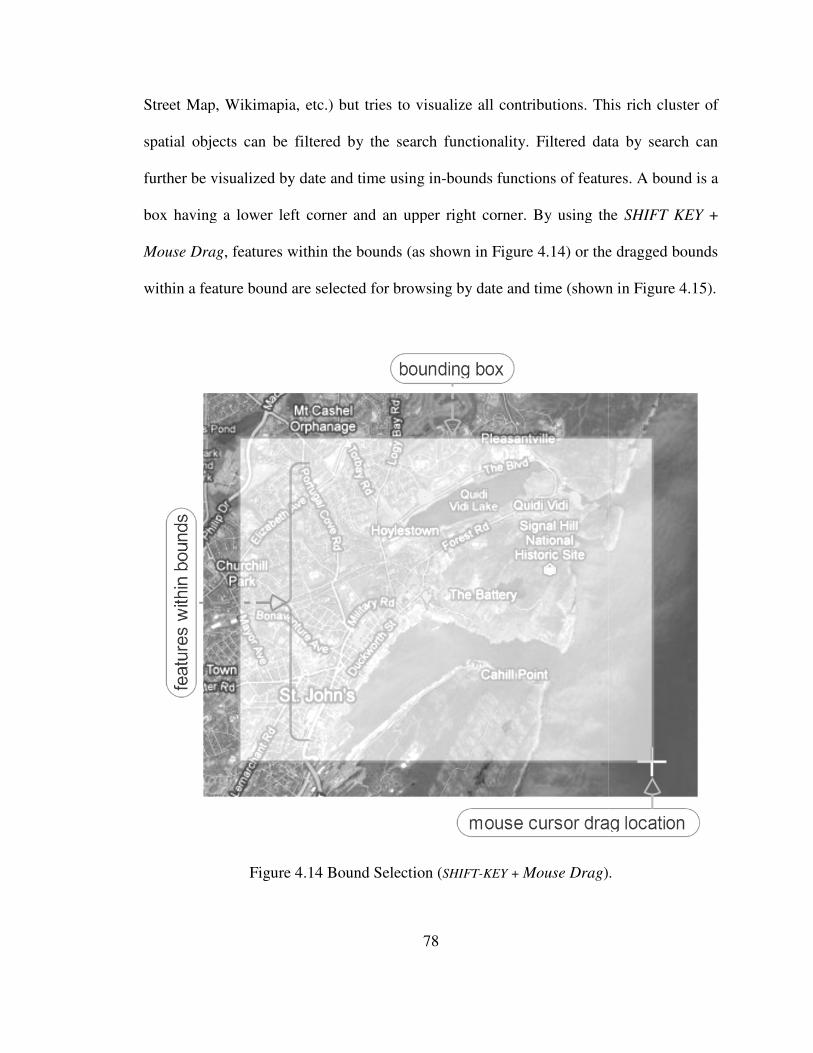
Street Map, Wikimapia, etc.) but tries to visualize all contributions. This rich cluster of
spatial objects can be filtered by the search functionality. Filtered data by search
further be visualized by date and time using in
box having a lower left corner and an upper right corner. By using the
Mouse Drag, features within the bounds (
within a feature bound are selected for browsing by date and time (shown in Figure 4.15).
Figure 4.14 Bound Selection (
78
Street Map, Wikimapia, etc.) but tries to visualize all contributions. This rich cluster of
spatial objects can be filtered by the search functionality. Filtered data by search
further be visualized by date and time using in-bounds functions of features. A bound is a
box having a lower left corner and an upper right corner. By using the
features within the bounds (as shown in Figure 4.14) or the dragge
within a feature bound are selected for browsing by date and time (shown in Figure 4.15).
Figure 4.14 Bound Selection (SHIFT-KEY + Mouse Drag)
Street Map, Wikimapia, etc.) but tries to visualize all contributions. This rich cluster of
spatial objects can be filtered by the search functionality. Filtered data by search can
bounds functions of features. A bound is a
box having a lower left corner and an upper right corner. By using the SHIFT KEY +
4) or the dragged bounds
within a feature bound are selected for browsing by date and time (shown in Figure 4.15).
.

Figure 4.15
4.7 Spatial Data Format
A non-proprietary spatial data
storing spatial content.
(JavaScript Object Notation). JSON
is easy for humans to read and write
79
Figure 4.15 Bound Selection Browser (Date and Time)
Format
spatial data format GeoJSON serves as the default format for
storing spatial content. GeoJSON is a new interchange format derived from JSON
(JavaScript Object Notation). JSON provides a lightweight data-interchange format
ad and write; it is also easy for machines to parse and generate
as the default format for
is a new interchange format derived from JSON
interchange format that
easy for machines to parse and generate
80
[JSON, 2010]. The format is completely independent and has been implemented in C,
C++, C#, Python, Java, Pearl, PHP, and so on. This format is built on two structures:
• a collection of name/value pairs (also called members: object, record,
struct, dictionary, hash table, keyed list, or associative array); and
• an ordered list of values (array, vector, list, or sequence).
The simplest representation of a JSON object is:
ObjectName = {string: value};
where a pair is equivalent to string: value. Each name/value pair is separated by commas
(,) and the name (string) from the value (value) by a colon (:).
GeoJSON is a new geographic format (now at version 1.0 since June 2008) for
encoding a variety of geographic data structures. A GeoJSON object may represent
geometry, a feature, or a collection of features. In GeoJSON, a geometry object is that
which supports the following geometry types: Point, LineString, Polygon, MultiPoint,
MultiLineString, MultiPolygon, and GeometryCollection. Geometry objects support
additional properties, and a feature collection represents a list of features [Butler et al.,
2008]. According to the format specification, a GeoJSON geometry object of any type
other than “GeometryCollection” must have a member with the name “coordinates.” A
coordinate reference system (crs) and bounding box (bbox) members are optional.

81
4.7.1 Geometry Objects Representation
A position is the fundamental geometry object (must be x, y, z or easting, northing,
altitude, or longitude, latitude, altitude). The "coordinates" member of a geometry object
is made up of one position (in the case of a Point geometry), an array of positions
(LineString or MultiPoint geometries), an array of arrays of positions (Polygons,
MultiLineString), or a multidimensional array of positions (MultiPolygon). An example
from the specification v1.0 of GeoJSON further explains as follows:
Point => must be a single position
{"type": "Point", "coordinates": [100.0, 0.0]}
MultiPoint => must be an array of positions
{"type": "MultiPoint", "coordinates": [ [100.0, 0.0], [101.0, 1.0] ] }
LineString => must be two or more positions
{"type": "LineString", "coordinates": [[100.0, 0.0], [101.0, 1.0]]}
LinearRing => is closed LineString with 4 or more positions
MultiLineString => must be an array of LineString coordinate arrays
{ "type": "MultiLineString", "coordinates": [ [ [100.0, 0.0], [101.0, 1.0] ], [ [102.0, 2.0], [103.0, 3.0] ] ]}
Polygon => must be an array of LinearRing coordinate arrays
{"type": "Polygon”, “coordinates": [ [ [100.0, 0.0], [101.0, 0.0], [101.0, 1.0], [100.0, 1.0], [100.0, 0.0] ] ] }
MultiPolygon => must be an array of polygon coordinate arrays

82
{"type": "MultiPolygon","coordinates": [ [[[102.0, 2.0], [103.0, 2.0], [103.0, 3.0], [102.0, 3.0], [102.0, 2.0]]], [[[100.0, 0.0], [101.0, 0.0], [101.0, 1.0], [100.0, 1.0], [100.0, 0.0]], [[100.2, 0.2], [100.8, 0.2], [100.8, 0.8], [100.2, 0.8], [100.2, 0.2]]] ]}
GeometryCollection => collection of geometry objects. It must have member name
“geometries” with a value array with each member in the array GeoJSON geometry
object.
The CCGIS implemented MultiPoint, MultiLineString, and MultiPolygon for storing
spatial objects. Additional information such as attributes is stored in a feature (A
GeoJSON object with type: “Feature”). A feature must have a member with name
“geometry” and value of JSON or null, a member with name “properties” with value
JSON object or null, and if a feature has an identity, the identity should be included with
member name "id". Further details on the GeoJSON specification for more details can be
accessed at: http://geojson.org/geojson-spec.html.
OpenLayers support a parser: OpenLayers.Format.GeoJSON. This allows read/write
functions to features created on a vector layer in the Document Object Model (DOM) of a
web browser. On submission to the web server, all features on the map are bundled into a
feature collection and then transferred to the server via Ajax. At the server, the feature
collection is converted to a PHP JSON object and then saved as individual features. Any
data transmitted to the server in the form of a spatial contribution goes through a review
by the administrator or moderator before it becomes public. Data flow in the CCGIS is
described in the Section 4.8.
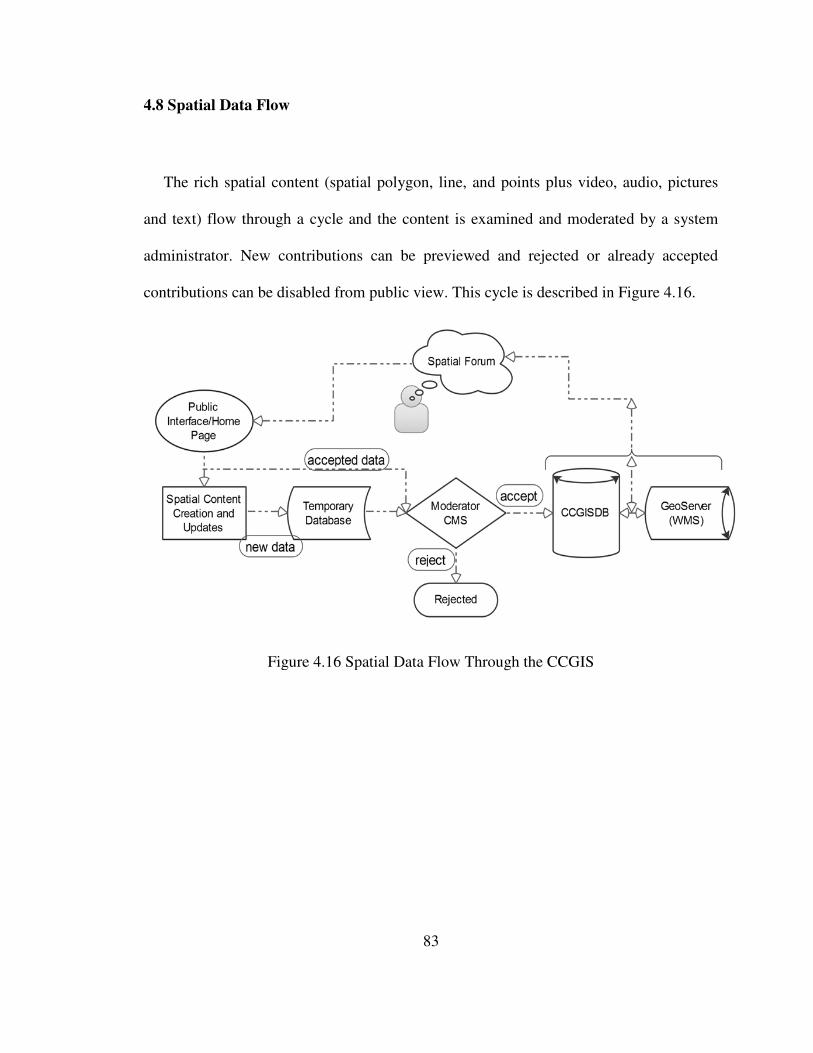
4.8 Spatial Data Flow
The rich spatial content (spatial polygon, line, and points plus video, audio, pictures
and text) flow through a cy
administrator. New contributions can be previewed and rejected or already accepted
contributions can be disabled from public view. This cy
Figure 4.16 Spatial Data Flow T
83
The rich spatial content (spatial polygon, line, and points plus video, audio, pictures
a cycle and the content is examined and moderated by a system
administrator. New contributions can be previewed and rejected or already accepted
sabled from public view. This cycle is described in Figure 4.16.
Figure 4.16 Spatial Data Flow Through the CCGIS
The rich spatial content (spatial polygon, line, and points plus video, audio, pictures
examined and moderated by a system
administrator. New contributions can be previewed and rejected or already accepted
cle is described in Figure 4.16.
84
4.9 GeoJSON on other platforms
Now, most platforms (GDAL/OGR GeoJSON driver, GeoServer) can output other
spatial data formats in GeoJSON as a lightweight medium of communication and not the
reverse. However, OpenLayers support conversion from GeoJSON to other formats:
• GeoRSS (a lightweight, format for extending existing feeds with
geographic information. It supports basic geometries: point, line, box, and
polygon),
• GML (Geography Markup Language (v2. and v3.) is an XML grammar
for expressing geographical features),
• WKT (Well-Known Text format. The format stores objects that can be
transmitted between interoperating computer programs),
• KML (Keyhole Markup Language commonly used on Google Map,
Google Earth etc.),
• Atom (XML format used for web feeds),
• OSM ( Open Street Map format),
• ArcXML (ArcXML is the protocol for communicating with the ArcIMS
Spatial Server),
• GPX (GPS Exchange Format: format for exchanging GPS Data), and so
on.
85
At this point, further development is required to convert CCGIS GeoJSON to specific
formats. This will be a future implementation based on demonstrated needs to change
GeoJSON into a different format or formats that may be used on other platforms.
4.10 Summary
This chapter detailed the implementation of the designed CCGIS using the Zend MVC
architectural pattern. The client (view) and database (model) are linked using one index
controller. The view consists of five views: index, forum, profile, map creation, and
content management. Each view has a corresponding action in the index controller while
rendered by its XHTML layout. The various actions communicate with the model service
interface, which has access to all the data gateway objects that can access each
corresponding database table. The Zend data gateway allows access to table records using
objects to represent tables in a database.
The model stores data in a non-proprietary GeoJSON format. This format provides a
lightweight spatial object notation than can be converted into objects at the client and
server. GeoJSON also provides a simple human readable data format that is supported by
OpenLayers and GeoServer. The chapter concluded with conversions from GeoJSON to
other data formats. The next chapter discusses system evaluation based requirements,
lessons learned and other issues when implementing the CCGIS in a community setting.

86
Chapter Five: Evaluation of and Issues with the CCGIS
Everything that can be counted does not necessarily count;
everything that counts cannot necessarily be counted. Albert Einstein ~ (1879-1955).
From the preceding chapters, this research formulated a design and implementation of
a Coastal Collaborative GIS to help identify the coastal threats of sea level rise and storm
surges. The implementation of the CCGIS platform aimed at wide public involvement in
the adaptation process. The research also highlighted the importance community
engagement using a web GIS application (CCGIS) to record and present their local
knowledge as part of the participatory process of developing adaptations. The CCGIS
provides a means through which stakeholders can participate in a spatial context from
their community experience (local knowledge).
This chapter discusses system evaluation and issues associated with the CCGIS. The
chapter highlights user-friendliness, the role of the CCGIS in a collaborative process,
system limitations, and satisfaction of user requirements.
5.1 Collaborative Design and Implementations Issues
The CCGIS at this stage of development accepts reviewed contributions from only
registered users. Registered users have their profile details linked to their contribution(s).
87
This means a contribution can be traced to the user’s name, address and other details
provided. There are issues to the extent of stakeholder involvement and restrictions as to
what and where contributions can be accepted. The following issues have been identified:
• Validating Contributions – Public vs. Focus Groups: Stakeholder
involvement at wide public involvement can provide a wide user base but
comes with the responsibility of checking each contribution before
acceptance. An alternative is automatically accepting all contributions and
letting the public act in a peer review context. The public can report
damaging or irrelevant contributions that are not geared towards the
collaborative adaptation goals. In the public review scenario, there are
instances where content may be damaging to people’s reputation or
sensitive information may be made public. In these instances, the
collaborative process should be ready deal with legal and privacy issues.
Participation can also be limited to focus groups (experienced individuals)
in the community. In this instance, the level of trust may allow all
contributions without validation or moderation by an administrator.
• Validating Users’ Location: It is unavoidable in an online system to have
spatial contributions from users in different geographic locations. The
question that surfaces quickly is the following: should users outside a
coastal community share their knowledge on the effects of storms and sea
level rise in a community they do not live in (or live in anymore)? If this is
answered in the affirmative, then it goes to negate the concept that local
knowledge is local and unique or limited in a geographic context. The
88
CCGIS has been based on the fact that individuals experience and best
know their environments, hence they should be the only participants.
However, it is possible to miss historic data collected by someone who
lived in the community some time past but has now relocated to a different
city or country. The CCGIS has implemented but not enforced a geo-
location tool that identifies the user’s city at the time of usage. Its
enforcement is open to future requirements.
• Validation of Geographic Extent: Another issue is the geographic extent
of contributions. If the system administrator sets a geographic boundary
within which the system should accept contributions, contributions outside
the region, which may be useful or may have an indirect impact on the
study area may be automatically rejected or flagged for rejection. This
type of implementation depends on the intended strict adherence to the
geographic region for adaptation. A containment test for all contributions
could be implemented to know which features are outside the accepted
geographic region.
• Accepted contributions: In a moderated collaborative process, a system
administrator is always required to review contributions before they are
made public. This approach is to make sure contributions satisfy some
basic requirements such as title or theme of contribution, date of the event,
time of the event, description, and any additional supported multimedia
data attached to the spatial object. Contributions that do not support the
goals of a collaborative process may be rejected; this decision is entirely

89
based on the discretion of the moderator(s). As contributions pile up due
to a coastal storm event, extra effort is needed by the moderator(s) to
review each single contribution before it can be made public.
5.2 System Evaluation
At the beginning of this research, a set of objectives where defined within a scope to
meet user and system (functional and non-functional) requirements. These sections
discuss how sufficient these requirements have been met by the CCGIS and other
possible alternatives of implementation.
5.2.1 Research Objectives
The following objectives were achieved by the CCGIS in varying degrees:
• To identify and classify commonly used and supported publicly available
web mapping tools and to identify at least three (3) web tools useful for
project design based on classification: Section 2.6.2.1 and Appendix I
summarize a review of 32 different web client and server technology
platforms. The review included factors such as Open Geospatial
Consortium standards, platform customization, platform dependency,
community of users and flexible licensing. These thirty two (32) platforms
90
do not constitute the entire range of technology, but the list is
representative of most of the public available web mapping platforms.
• To design a local knowledge platform for spatial identification of coastal
threats as a result sea level rise and storm surges: This research discussed
the process of knowledge acquisition and how it relates to threat
identification through a platform design (Chapter 3) and implementation
(Chapter 4) of the Coastal Collaborative GIS. The research also identified
how it could be implemented using varied platforms for the server-side
scripting. Model View Controller architecture was implemented to
separate the viewer from the application and business logic of the CCGIS.
• To link a designed web GIS platform and local knowledge in a
collaborative process that can be applied in the eight (8) communities of
the C-Change project: The implemented CCGIS serves as a platform for
local knowledge abstraction using vector objects plus rich multimedia
content. Online access to the CCGIS is replicable in eight C-Change
communities.
• To test and evaluate the designed system based on requirements and
project objectives: The system provides the functionalities detailed in the
user requirements and system requirements (functional and
nonfunctional). These functionalities have been tested by users, with
different degrees of success. User test and feedback are discussed in
Section 5.2.5. The evaluation details of how user and system requirements
are satisfied by the CCGIS are discussed in the next sections.

91
5.2.2 User Requirements
User requirements obtained from published literature and the C-Change research team
itemized high-level requirements of what the CCGIS should fulfil:
• The system should allow local communities to identify coastal threats as a
result of sea level rise and storm surges at a particular location, an area
(residential, business, etc.) and a linear event: The CCGIS met this
requirement by providing digitizing functions that can be used to identify
threats represented in a spatial context. A location is digitized as a point,
an area is digitized as a polygon, and a line digitized as a linear event.
• The system should provide a means of describing and communicating
threats with pictures, video, audio and text: Spatial objects digitized from
the first requirement can be described by text using an html text editor.
Images (.png, .jpg/jpeg and .gif), video (.flv and .mp4), audio (.mp3) can
also be uploaded as attribute information to describe the spatial
representation of a coastal event.
• The application should be user-friendly and cost effective: Familiar user-
friendly mapping and navigation tools are used (Google and Bing Maps).
Map navigation and system functionality are accessed with simple icons
and tool tips to describe how to use them. The CCGIS implemented tools
that are free (at no cost and free rights to redistribute) for public non-
commercial use. There may be cost of management and site hosting,

92
which may depend how the system is implemented at the local
community.
• The system should provide a means of validating user contributions: The
CCGIS uses a peer review mechanism on accepted contributions. Users
can affirm or negate a public spatial contribution in a forum session. With
time, the moderator can turn some spatial objects off based on public
review responses. Added validation restriction include the geo-location
function, which may be used to filter who can contribute and where.
• The system should provide a means of commenting on scientific scenarios
and local contributions: Now, the CCGIS cannot support other formats of
spatial data – it can only save data in the GeoJSON format. To satisfy this
requirement, scientific scenarios can serve as base layers on which user
comments and feedback can be overlaid. This approached preserves
scenario layers as a separate entity and community comments as another
layer.
5.2.3 Functional Requirements
The following functional requirements satisfy what the system is supposed to support
and do at a low system level:
93
• The CCGIS should be an online collaborative application with a. client
(public and administrator) interfaces, b. server (spatial application and
web server) component, c. database (relational and spatial database)
server. The CCGIS satisfies this requirement based on:
a) Interfaces: A Content Management System is used by the
administrator to moderate collaborations. In addition, a home page
(accessible to non registered users), profile page, forum page and
map creation page serve as interfaces where users can interact with
the CCGIS;
b) The CCGIS implements a spatial data server called GeoServer that
supports Open Geospatial Consortium standards such as Web
Mapping Service (WMS), Web Feature Service (WFS) and Web
Coverage Service (WCS). These services allow serving spatial data
to clients who can be online (web) or on a local host (offline). In
addition, web pages are served using Apache web server, which
supports Hypertext Preprocessor (PHP) for server-side scripting;
and
c) All data flow in the CCGIS are persisted and retrieved from an
object relational database called PostgreSQL (version 8.4). The
database is further extended using PostGIS (version 1.5) to provide
spatial extensions.
• The client interface should be user-friendly (using public mapping tools)
that can be extended or customised using their Application Programming
94
Interface (API): OpenLayers web mapping platform with embedded public
user-friendly maps (Google and Bing Maps) provides a user friendly client
mapping interface for the CCGIS. The OpenLayers API is further
customized with a rich graphical user interface called ExtJS;
• The client should provide digitizing and editing function for the creation
of spatial content: The CCGIS provides functions for digitizing simple
vector objects such as points, lines, and polygons with a single click of a
button. These vector objects represented as JavaScript objects can be
moved, modified (lines and polygons), split (lines) and deleted;
• Content generated should be simple vector objects such as: a. Points (to
abstract a location or landmark) b. Lines (to abstract road, path, shore
line etc.) and c. Polygons (to abstract and area or region): Map creation
page supports drawing simple vector objects: points, lines, and polygons
that are stored as GeoJSON objects. This format allows a lightweight
representation of spatial objects that can be converted into objects at
runtime both at the client and server;
• Client technologies should implement OGC compatible standards and
should consume: a. Web Mapping Services (WMS), b. Web Coverage
Services (WCS), and c. Web Feature Services (WFS): OpenLayers
supports industry-standard Web Mapping Service (WMS), and Web
Feature Service (WFS) protocols. GeoServer also implements Web
Feature Service (WFS), Web Coverage Service (WCS), and Web Map

95
Service (WMS) in OGC standards. These services can be implemented as
and when needed to support any collaborative processes in the future;
• The system should provide administrative privileges of accepting or
rejecting user contributions before it becomes public: The CCGIS Content
Management (CMS) gives the administrator access to preview
contributions. The administrator can accept or reject contributions based
on content to support collaborative goals;
• Contributions should be stored in a database that can provide object
relational and spatial capabilities: PostgreSQL (version 8.4) is an object
relational database extended with PostGIS (version 1.5) to work as a
spatial database (these are bundled installation from PostgreSQL and
Refractions Research). The CCGIS uses PostgreSQL as a relational
database of which based on future requirements, PostGIS spatial data
formats can be implemented as when needed;
• Contributions made by users should be stored in a non proprietary
format: Data created with CCGIS are stored in a light weight GeoJSON
(JavaScript Object Notion) spatial format, which can be converted into an
object both on the server and client in a human readable format;
• The system should provide the administrator rights to restrict the area
(extent) of contributions and contributors geographic location at the time
of contribution: CCGIS implements a geo-location service provided by
GeoPlugin (see Appendix II) to locate a user’s city at the time of
contribution. A further investigation is required at this stage since IP
96
address geo-location can only give a rough estimate of user’s location. A
good alternative will be the upcoming W3C geolocation API standard
(http://dev.w3.org/geo/api/spec-source.html) as part of HTML5 standards
now supported in some new web browsers (Firefox 3.5+, Google Chrome
5+, Safari 5+,Internet explorer 9+); and
• The system should provide a forum discussion with reference to spatial
objects on the map: CCGIS implements a forum discussion page, which
gives the opportunity for users to search, create topics, and add comments
to a spatial object. The forum discussion engages collaborators to discuss
other spatially represented contributions whiles having access to attributes
of the spatial object.
5.2.4 Non-functional Requirements
This is a generalised requirement, which spells out system constraints:
• The CCGIS application should not provide services without internet
connection: CCGIS can only work with access to the internet. As an
online application it provides access to multiple users at the same time.
• Only registered members can make spatial contributions to the system: A
user is required to login to access the map creation page. This is protected
by an encrypted password and user name to allow unique user accounts.
97
5.2.5 CCGIS Initial Usability Feedback Results
The period for this research did not provide the opportunity to perform an in-depth
treatment of a usability test. However, a simple questionnaire was used to obtain initial
usability feedback of this prototype. The questionnaire consisted of seven questions that
required a reviewer to provide “Yes,” “Yes with Difficulty,” and “No” as answers to
basic functionalities of the system. The reviewer also had the opportunity to add any
general comments after the questionnaire and submit results online. Figure 5.1 shows
details of the questionnaire.
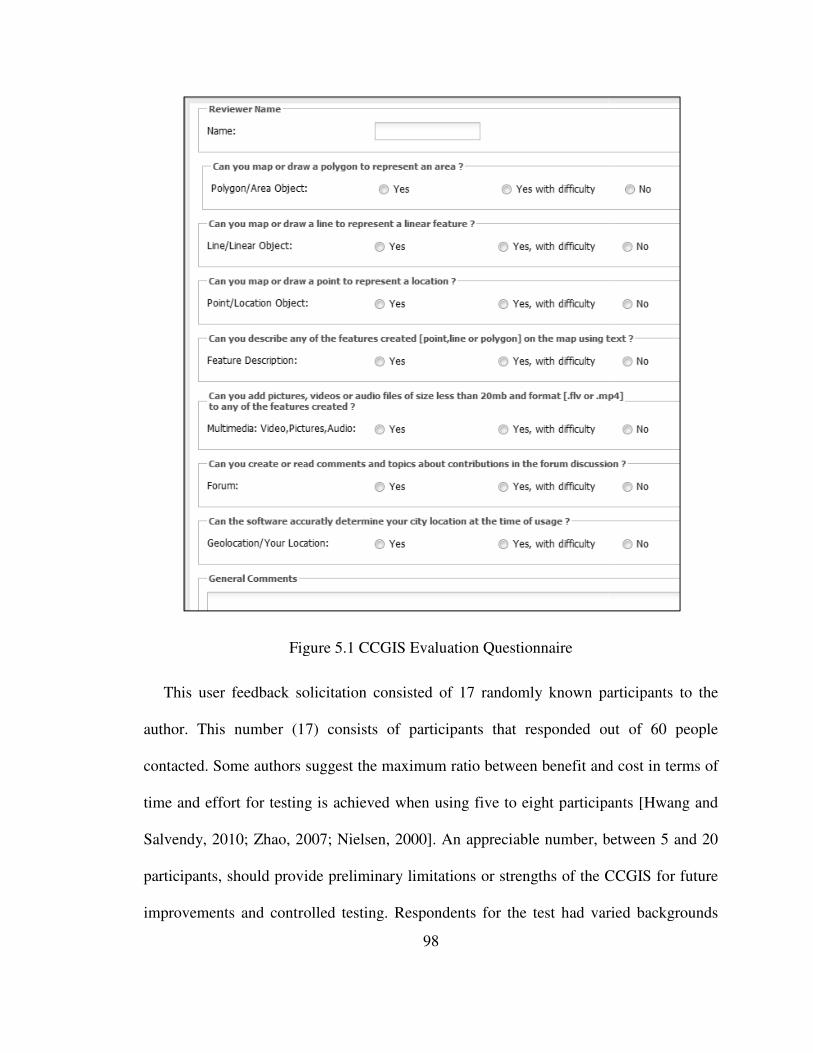
Figure 5.1 CCGIS E
This user feedback solicitation
author. This number (17) consists of participants that responded out of 60 people
contacted. Some authors
time and effort for testing is achieved when using five to eight participants
Salvendy, 2010; Zhao, 2007; Nielsen, 2000]
participants, should provide
improvements and controlled testing
98
Figure 5.1 CCGIS Evaluation Questionnaire
feedback solicitation consisted of 17 randomly known participants
This number (17) consists of participants that responded out of 60 people
ome authors suggest the maximum ratio between benefit and cost in terms of
time and effort for testing is achieved when using five to eight participants
, 2007; Nielsen, 2000]. An appreciable number, between
provide preliminary limitations or strengths of the CCGIS for future
and controlled testing. Respondents for the test had varied backgrounds
participants to the
This number (17) consists of participants that responded out of 60 people
fit and cost in terms of
time and effort for testing is achieved when using five to eight participants [Hwang and
between 5 and 20
rengths of the CCGIS for future
for the test had varied backgrounds
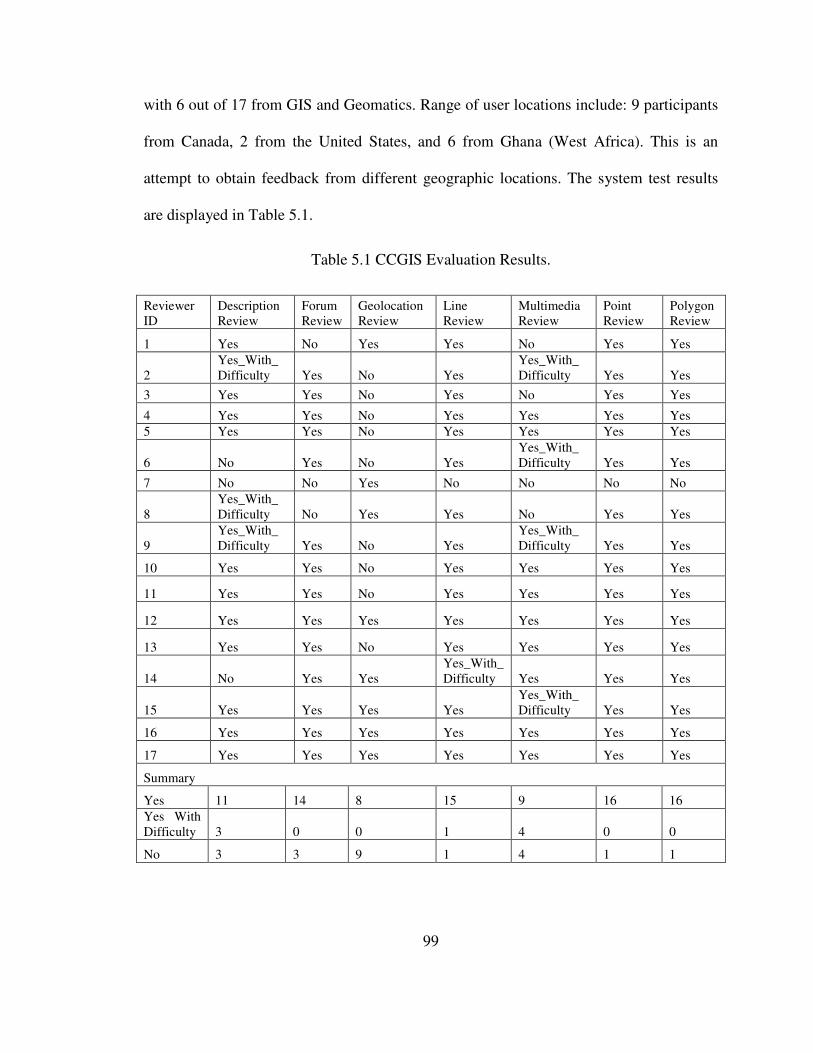
99
with 6 out of 17 from GIS and Geomatics. Range of user locations include: 9 participants
from Canada, 2 from the United States, and 6 from Ghana (West Africa). This is an
attempt to obtain feedback from different geographic locations. The system test results
are displayed in Table 5.1.
Table 5.1 CCGIS Evaluation Results.
Reviewer ID
Description Review
Forum Review
Geolocation Review
Line Review
Multimedia Review
Point Review
Polygon Review
1 Yes No Yes Yes No Yes Yes
2 Yes_With_Difficulty Yes No Yes
Yes_With_ Difficulty Yes Yes
3 Yes Yes No Yes No Yes Yes
4 Yes Yes No Yes Yes Yes Yes 5 Yes Yes No Yes Yes Yes Yes
6 No Yes No Yes Yes_With_ Difficulty Yes Yes
7 No No Yes No No No No
8 Yes_With_Difficulty No Yes Yes No Yes Yes
9 Yes_With_Difficulty Yes No Yes
Yes_With_ Difficulty Yes Yes
10 Yes Yes No Yes Yes Yes Yes
11 Yes Yes No Yes Yes Yes Yes
12 Yes Yes Yes Yes Yes Yes Yes
13 Yes Yes No Yes Yes Yes Yes
14 No Yes Yes Yes_With_Difficulty Yes Yes Yes
15 Yes Yes Yes Yes Yes_With_ Difficulty Yes Yes
16 Yes Yes Yes Yes Yes Yes Yes
17 Yes Yes Yes Yes Yes Yes Yes
Summary
Yes 11 14 8 15 9 16 16 Yes With Difficulty 3 0 0 1 4 0 0
No 3 3 9 1 4 1 1
100
The summary of results from Table 5.1 shows a rough preliminary CCGIS functional
ease of use. Functionality wise, work is required in the Geolocation and Multimedia
upload implementation. Geolocation performed poorly with more numbers of “No” than
“Yes”. Also, the multimedia upload showed that of those able to use the functionality of
the system, approximately half were able to use it with difficulty or could not use it at all.
However, other functionalities tested showed higher “Yes” compared to “Yes with
Difficulty” and “No”. Participant comments are available at Appendix IV.
5.3 System Limitations and Lessons Learned
One of the strengths of the CCGIS is an online web mapping application, which is
also its highest limitation. Communities with no access to the internet cannot have access
to the CCGIS. Furthermore, users with poor internet access will have a long application
response time when streaming multimedia content (pictures, video, and audio) which
serves as attribute information to spatial objects.
The design and implementation did not take into consideration smaller computer
screens less than 15 inches. Computers and cell phones with screens smaller than this will
not have a full view of some of the page controls.
It is also important to define a user base and test the system for user friendliness in
each community to be implemented. The term “user-friendly” meaning easy to use is
ambiguous without a test group. The CCGIS adopted a public familiar platform and
101
functions in its implementation. Since ease of use is relative to a user group, it is
important to continue to improve interface interaction functions based on the community
user’s level of online application interaction and computer knowledge.
5.4 Role of CCGIS in an Adaptation Process
Spatial mapping based on local knowledge using the CCGIS will provide the ability to
assess current and possible future vulnerability from a stakeholder perspective. The
CCGIS online forum discussion will provide a means of engaging the public in a spatial
context dialog long after any interview session, public community workshop, or forum.
Web Mapping Service (WMS) of flood scenarios can provide overlays to identify
community interest and feedback using community spatial mapping, comments, and
opinions.
A very important role of the CCGIS is to facilitate threat and risk mapping in
communities without precise spatial data. Local knowledge threat mapping will not only
help identify risks but involve the people being affected by sea level rise and storm
surges.
102
5.5 Summary
This chapter discussed issues associated with the implementation of the CCGIS,
limitations and evaluation based on objectives, functional and non-functional
requirements. The chapter goes further to discuss evaluation of the CCGIS based on
objectives, user, and system requirements. The evaluation shows that most requirements
were satisfied but further improvements require future user requirements. These include a
full use of object relational spatial database representation using PostGIS and
improvements in geolocation using W3C standards. Furthermore, future spatial data
formats (Shapefile, etc.) can be published using the services of GeoServer.
The system is limited to users with internet access possessing a basic level of
computer knowledge and can navigate on public mapping platforms such as Google and
Bing maps. Functions added with OpenLayers are activated with a single click. In
summary, the author recognises that varied community implementation will require a test
to make it suitable to their use and to support a specific (issue based) collaborative
process. The next chapter summarizes this research with conclusions and
recommendations.
103
Chapter Six: Conclusions and Recommendation
This is not the end. It is not even the beginning of the end. But it is, perhaps, the end of the beginning
~ Winston Churchill ~ (1874-1965).
This chapter concludes the preliminary prototype of the CCGIS design and
implementation. The chapter hightlights conclusions and recommendations based on
system evaluation and testing.
6.1 Conclusions
This research designed a platform as means to supplement existing data in threat or
risk mapping caused by sea level rise and storm-surges using local community
knowledge. This functioning system called the Coastal Collaborative GIS (CCGIS) is to
help eight coastal communities engage with the C-Change research team in developing
adaptation strategies. The CCGIS allows coastal communities to participate spatially by
creating vector objects (with multimedia attributes) based on their local environmental
knowledge. The platform also allows a spatial context forum discussion based on map
features as a way of engaging stakeholders in the adaptation process.
104
Despite the implementation of a web-based collaborative platform, the author agrees
with Tang [2006] that the best designed collaborative process intended to be fully
inclusive cannot guarantee everyone is willing to take part in the process. The CCGIS is
not a solution but a tool to facilitate engagement in the collaborative process.
Furthermore, online implementation of the CCGIS aimed at a wide public
involvement in the process of adaptation. In communities without internet service, the
platform cannot be used. Communities that have access to the World Wide Web should
in the future implement the CCGIS to support varied input devices and technologies.
These include location-based devices such as mobile phones, PDAs and GPS enabled
devices to extend the range of participants.
Issues raised with respect to system implementation, can be solved on a local basis to
address unique local community concerns and adaptation issues. The generic
requirements used in developing the CCGIS serve as a template for local customization
to meet local needs. This prototype and its future improvements will go a long way to
support the C-Change research team in community spatial context engagement during the
process of developing adaptation strategies to the effects of sea level rise and storm
surges.
105
6.2 Recommendations for Future Research
The CCGIS was developed without requirements for mobile devices (mobile phones,
smart phones, PDAs, GPS, etc.). Most mobile devices now have location-based services
with multipurpose functions such as an audio recorder, a camera for both pictures and
videos. Future implementation should consider the support for mobile platforms instant
uploads as users are exposed to coastal events. A mobile support will also help adopt a
different design, which will accommodate limited screen space less than 15 inches.
Internet based mapping provides a good opportunity for multiple user interactions.
This also presents a limitation where users with limited internet bandwidth or no internet
access cannot use the service or may have poor application response time in the case of
low bandwidth. A future research into hybrid (desktop and internet) mapping is
recommended where some layers can be made available to allow a user to create and
view some datasets without internet connection whiles having access to other datasets
when online. A hybrid platform will help users to create data using application functions
without being online and share their local knowledge when they have internet access.
Further research to support W3C geolocation now implemented in new browsers
(Firefox 3.5+, Google Chrome 5+, Safari 5+,Internet explorer 9+ etc.) supporting
HTML5 is recommended. The CCGIS implemented an IP address geolocation to identify
a user’s city location at the time of a page request. IP geolocation databases are known to
have a few wrong city identifications, but they do work most of the time. Accurately
knowing the user's location at the time of contribution will provide a way of filtering
contributors from a local region if need be. In addition, in-bounds validation tests should
106
be implemented on the side server to identify if a contribution is within a specific region
delineated by the moderator as a way of further filtering inputs outside a local domain.
Further software implementation is also required for automation of data resources on
GeoServer to its eventual publishing. This functionality will allow research teams to
quickly test their scenarios against community provided spatial objects in other supported
formats such as a compressed Shapefile archive. This will provide an easy to use
interface for the C-Change research team to publish scenario outputs without having
knowledge of GeoServer. This automation process is possible through cURL scripting or
any other http/ftp protocol language.
In addition, further investigation of future user and system requirements are required
to customise the CMS. Based on local issues, the administrator may want to do different
queries in one community compared to the other. For example, database and content
management of spatial datasets relating to the protection of sea turtle habitat will be
different from flood mapping. Future improvements on the CCGIS should include coastal
themes based on specific issues (e.g. flood, habitat, erosion, water pollution, etc.) that can
serve as customised templates to address unique local conditions rather than being
generic.
Finally, the implementation of the CCGIS employed already familiar public mapping
tools to reduce the learning curve for users. A user-friendly approach is used by
registering events such as click, double-click, drag, hover, and focus to interact with
users. As the term user friendly may be ambiguous without a specific user group, it is
recommended to test the platform in the community to assess their level of user
friendliness. This was not possible in the scope of this project now. Creation of video

107
demonstrations may provide further help to shorten the learning curve of using the
CCGIS.
108
References
Adams, T. (2009), “There is no alternative to OpenLayers…?” Presentation at FOSS4G 2009 Conference, Sydney, Australia. Al-Kodmany, K. (1999). "Using visualization techniques for enhancing public participation in planning and design: process, implementation, and evaluation." Landscape and Urban Planning,Vol. 45,No. 1, pp. 37-45. Angelides, D., and Y. Xenidis (2007). “Fuzzy vs. Probabilistic Methods for Risk Assessment of Coastal Areas.” In Environmental Security in Harbors and Coastal Areas. Eds. Linkov I., G. Kiker and R. Wenning, Springer Netherlands, Vol. 22, pp. 251-266. Anuchiracheeva, S., H. Demaine, G. P. Shivakoti, and K. Ruddle (2003). "Systematizing local knowledge using GIS: fisheries management in Bang Saphan Bay, Thailand." Ocean and Coastal Management, Vol. 46, No. 11-12, pp. 1049-1068. Aswani, S. and M. Lauer (2006). "Incorporating Fishermen’s Local Knowledge and Behavior into Geographical Information Systems (GIS) for Designing marine Protected areas in Oceania." Human Organization, Vol. 65, No. 1, pp. 81-102. Ball, J. (2002). "Towards a methodology for mapping regions for sustainability using PPGIS." Progress in Planning, Vol. 58, No. 2, pp. 81-140. Balram, S., S. Dragicevic (2005). “Attitudes toward urban green spaces: integrating questionnaire survey and collaborative GIS techniques to improve attitude measurements.” Landscape and Urban Planning, Vol. 71, No. 2-4, pp. 147–162. Balram, S., S. Dragicevic, and R. Feick. (2009). "Collaborative GIS for spatial decision support and visualization." Journal of Environmental Management Vol. 90, No. 6, pp. 1963-1965. Barrios, E., R. J. Delve, M. Bekunda, J. Mowo, J. Agunda, J. Ramisch, M. T.Trejo, and R. J.Thomas (2006). "Indicators of soil quality: A South-South development of a methodological guide for linking local and technical knowledge." Geoderma,Vol. 135, pp. 248-259. Barry, D. K. (2003), Web Services and Service-Oriented Architectures. Morgan Kaufmann Publishers, San Francisco, CA. Barton, J., J. Plume, and B. Parolin. (2005). "Public participation in a spatial decision support system for public housing." Computers, Environment and Urban Systems, Vol. 29, No. 6, pp. 630-652.
109
Bijlsma, L. (1997). “Climate change and the management of coastal resources.” Climate Resources, Vol. 8, pp. 47–56. Bird, E.C.F. (1993). Submerging Coasts: The Effect of Rising Sea-Level on Coastal Environments. Wiley,Chichester, UK. Birmingham, D. M. (2003). "Local knowledge of soils: the case of contrast in Côte d'Ivoire." Geoderma. Vol. 111, No. 3-4, pp. 481-502. Blaikie, P., K. Brown, M. Stocking, L. Tang, P. Dixon, P. Sillitoe. (1997). "Knowledge in action: Local knowledge as a development resource and barriers to its incorporation in natural resource research and development." Agricultural Systems Vol. 55, No. 2, pp. 217-237. Bodorkós, B. and G. Pataki (2009). "Linking academic and local knowledge: community- based research and service learning for sustainable rural development in Hungary." Journal of Cleaner Production Vol. 17, No. 12, pp. 1123-1131. Brazhnik, O. (2007). "Databases and the geometry of knowledge." Data and Knowledge Engineering Vol. 61, No. 2, pp. 207-227. Burton, I., E. Malone, and S. Huq. (2005). Adaptation Policy Framework for Climate Change: Developing Strategies, Policies and Measures. Eds. B. Lim and E. Spanger-Siegfried. New York, US, Cambridge University Press. Buschmann, F., R. Meunier, H. Rohnert, P. Sommerlad, and M. Stal (1996). Pattern- Oriented Software Architecture, Volume 1: A System of Patterns, Wiley. Butler H., M. Daly, A. Doyle, S. Gillies, T. Schaub, and C. Schmidt (2008). The GeoJSON Format Specification. [Online] 5 July 2010. http://geojson.org/geojson-spec.html. Chalmers, N., and C. Fabricius (2007). “Expert and generalist local knowledge about land-cover change on South Africa’s Wild Coast: can local ecological knowledge add value to science?” Ecology and Society, Vol. 12, No.1, pp. 10. [On-line] 5 July 2010. http://www.ecologyandsociety.org/vol12/iss1/art10/ Chappell, J. (1990). “Some effects of sea level rise in marine and coastal.” Geological Society of Australia, Special Publication. Vol.1, pp. 37–45. Cinderby, S. and J. Forrester (2005). “Facilitating the local governance of air pollution using GIS for participation.” Applied Geography, Vol. 25, No. 2, pp. 143-158.
110
Cinderby, S. (1999). "Geographic information systems (GIS) for participation: The future of environmental GIS?" International Journal of Environment and Pollution. Vol. 11, No.3, pp. 304-315. Close, C. H., and G. B. Hall (2006). “A GIS-based protocol for the collection and use of local knowledge in fisheries management planning.” Journal of Environmental Management, Vol. 78, No. 4, pp. 341-352. Conde, C. and K. Lonsdale (2005). “Engaging Stakeholders in the Adaptation Process. Adaptation Policy Frameworks for Climate Change.” In Adaptation Policy Framework for Climate Change: Developing Strategies, Policies and Measures, Eds. B. Lim and E. Spanger-Siegfried. New York, US, Cambridge University Press, pp. 207-223. Corburn, J. (2007). “Community knowledge in environmental health science: co-producing policy expertise.” Environmental Science and Policy, Vol. 10, No.2, pp. 150-161. Corburn, J. (2005). Street Science : Community Knowledge and Environmental Health Justice. Cambridge, MA, USA, MIT Press. Crooks, S., and R. K. Turner (1999). “Integrated coastal management: sustaining estuarine natural resources.” Advances in Ecological Research, Vol. 29, pp. 241–289. Davis, A., and J. Wagner (2003). “Who Knows? On the Importance of Identifying ‘Experts’ When Researching Local Ecological Knowledge.” Human Ecology Vol. 31, No. 3, pp. 463-489. Environment Canada (2006). Impacts of Sea Level Rise and Climate Change on the Coastal Zone of South-eastern New Brunswick. Evans, L. S. (2010). “Ecological knowledge interactions in marine governance in Kenya.” Ocean and Coastal Management, Vol. 53, No.4, pp. 180-191. Failing, L., R. Gregory, and M. Harstone (2007). “Integrating science and local knowledge in environmental risk management: A decision-focused approach.” Ecological Economics 64(1): 47-60. Fazal, S. (2008). GIS Basics. Daryaganj, Delhi, IND, New Age International. Field, C. B., L. D. Mortsch, M. Brklacich, D. L. Forbes, P. Kovacs, J. A. Patz, S.W. Running and M.J. Scott (2007). North America. Climate Change 2007: Impacts, Adaptation and Vulnerability. Contribution of Working Group II to the Fourth Assessment Report of the Intergovernmental Panel on Climate Change. Eds.
111
Canziani O. F., C. M. L. Parry, J. P. Palutikof, P.J. van der Linden and C.E. Hanson. Cambridge, UK, Cambridge University Press, pp. 617-652. Geertz, C. (1973). The interpretation of cultures, New York: Basic Books. Geertz, C. (1983). Local knowledge: Further essays in interpretive anthropology, New York: Basic Books. GeoServer (2010), URL: http://geoserver.org/display/GEOS/Welcome. [On-line] 19 February 2010. GeoTux (2010). “Web mapping client comparison v.4.” [On-line] 4 August 2010.
http://geotux.tuxfamily.org/index.php? option=com_myblog&task=view&id=257&Itemid=59&lang=en Gerhardinger, L. C., E. A. S. Godoy, and P. J. S. Jones (2009). "Local ecological knowledge and the management of marine protected areas in Brazil." Ocean and Coastal Management. Vol. 52, No. 3-4, pp. 154-165. Giordano, R., S. Liersch, and M. Vurro, D. Hirsch (2010). “Integrating local and technical knowledge to support soil salinity monitoring in the Amudarya river basin.” Journal of Environmental Management.Vol. 91, No. 8, pp. 1718-1729. Hansen, H. S. and D. C. Prosperi (2005). “Citizen participation and Internet GIS-Some recent advances.” Computers, Environment and Urban Systems. Vol. 29, No. 6, pp.: 617-629 Harris, T. M., D. Weiner, T. A. Warner, and R. Levin (1995). Pursuing social goals through participatory geographic information systems. Redressing South Africa’s historical political ecology. In Ground truth: The Social Implications of Geographic Information Systems, Ed. J. Pickles, New York: Guilford Press. pp. 196–222 Harrison, J., and M. Reichardt (2001), “Introduction to OGC Web Services, An OGC White Paper”.[On-line] 19 February 2010. http://www.opengeospatial.org/pressroom/papers. Helman D. (1998). “Model-View-Controller.” OOTips.org [On-line] 3 June 2010. http://ootips.org/mvc-pattern.html Hinkel, J., and R. J. T. Klein (2009). “Integrating knowledge to assess coastal vulnerability to sea-level rise: The development of the DIVA tool.” Global Environmental Change Vol.19, No. 3, pp. 384-395.
112
Huntington, H. P. (2000). “Using Traditional Ecological Knowledge in Science: Methods and Applications.” Ecological Applications. Vol. 10, No. 5, pp. 1270-1274. Hwang, W. and G. Salvendy (2010). “Number of people required for usability evaluation: the The 10±2 Rule rule.” Communications of the ACM. Vol.53, No.5, pp. 130- 133. Inglis, J. T. (1993). Traditional Ecological Knowledge: Concepts and Cases, IDRC Books/Les Éditions du CRDI. ICURA(2009). “International Community-University Research Alliance program” [On-line] 19 February 2010. http://www.idrc.ca/icura/. IPCC WGII (2007). Impacts, Adaptation and Vulnerability. Contribution of Working Group II to the Fourth Assessment Report of the Intergovernmental Panel on Climate Change. Contribution of Working Group II to the Fourth Assessment Report of the Intergovernmental Panel on Climate Change. Eds. Canziani O. F., C. M. L. Parry, J. P. Palutikof, P.J. van der Linden and C.E. Hanson. Cambridge University Press, UK, pp. 76. Inman, D., and S. Jenkins (2005). “Climate Patterns in the Coastal Zone.” In Encyclopedia of Coastal Science. Ed. M. L. Schwartz, Springer Netherlands, pp. 243-246. Jézéquel, J., M. Train, and C. Mingins (1999). Design Patterns and Contracts, Addison- Wesley. Johnson, M. S. (1992). Lore: Capturing Traditional Environmental Knowledge. International Development Research Centre, Ottawa. JSON (2010). Introducing JSON. [On-line] 5 July 2010. http://www.json.org/. Kingston, R., S. Carver, A. Evans, I. Turton (2000). “Web-based public participation geographical information systems: an aid to local environmental decision- making.” Computers, Environment and Urban Systems. Vol. 24, No.2, pp. 109-125. Klein, R. J. T., and R. J. Nicholls (1999). “Assessment of Coastal Vulnerability to Climate Change.” Ambio. Vol. 28, No. 2, pp. 182-187. Lambert, T. W., L. Guyn, S. E. Lane (2006). “Development of local knowledge of environmental contamination in Sydney, Nova Scotia: Environmental health practice from an environmental justice perspective.” Science of the Total Environment. Vol. 368, No. 2-3, pp. 471-484.
113
Lebensold, J. (2010). “ZendCasts: free Zend Framework screen casts.” [On-line] June-July 2010. http://www.zendcasts.com/category/screencasts/ Lyman F. (2009). Pro Zend Framework Techniques: Build a Full CMS Project. Springer- Verlag New York, Inc.,USA. Longley, P.A. (2008), “Geographic Information Systems”, In Encyclopedia of GIS. Ed. Kemp K. K., SAGE Publications, Inc.,California,USA. pp. 190-94. Lutz, J. (2008). Making and Moving Knowledge: Interdisciplinary and Community-based Research in a World on the Edge. Montreal, QC, Canada, McGill-Queen's University Press. Merriam Webster Dictionary (2010).Datum.[On-line] 30 August 2010. http://www.merriam-webster.com/dictionary/datum McCulloch, M. M., D. L. Forbes, and R. D Shaw (2002). “Coastal Impacts of Climate Change and Sea-Level Rise on Prince Edward Island Prince Edward Island”. Geological Survey of Canada, Open File 4261, pp.5. McKee, L. (2004), 'The Spatial Web', An Open GIS Consortium (OGC) White Paper Peterson, Michael P. (2008), 'Geographic Information Systems', in Karen K. Kemp (ed.), Encyclopedia of GIS (SAGE Publications, Inc,California,USA.), 511-13. Moser, P. K. (2005). Oxford Handbook of Epistemology. Oxford University Press, Cary, NC, USA. Mulyoutami, E., R. Rismawan, et al. (2009). “Local knowledge and management of simpukng (forest gardens) among the Dayak people in East Kalimantan, Indonesia.” Forest Ecology and Management 257(10): 2054-2061. Murdoch R. (2007). Speech by Rupert Murdoch, Chairman and Chief Executive Officer of News Corporation, to his employees, New York, United States (9 May 2007), [On-line] 3 August 2010. http://www.wbcsd.org/plugins/DocSearch/details.asp? type=DocDet&ObjectId=MjQ2MTg Nielsen J. (2000). "Why You Only Need to Test with 5 Users." useit.com, [On-line] 8 February 2011.http://www.useit.com/alertbox/20000319.html Oudwater, N., and A. Martin (2003). “Methods and issues in exploring local knowledge of soils.” Geoderma.Vol. 111, No. 3-4, pp. 387-401. Oxford Dictionary (2010). a. “Knowledge.” [On-line] 10 August 2010.http://www.oxforddictionaries.com/
114
definition/knowledge. b. “Science.” [On-line] 30 August 2010. http://oxforddictionaries.com/view/entry/ m_en_gb0741060#m_en_gb0741060. Parrotta, J. A., and M. Agnoletti (2007). “Traditional forest knowledge: Challenges and opportunities.” Forest Ecology and Management. Vol. 249, No 1-2, pp. 1-4. Payton, R. W., J. J. F. Barr, A. Martin, P. Sillitoe, J. F. Deckers, J. W. Gowing, N. Hatibu, S. B. Naseem, M. Tenywa, M. I. Zuberi (2003). “Contrasting approaches to integrating indigenous knowledge about soils and scientific soil survey in East Africa and Bangladesh.” Geoderma. Vol. 111, No. 3-4, pp.355-386. PostgreSQL (2010). “About.” PostgreSQL Global Development Group, [On-line] 23 February 2010.http://www.postgresql.org/about/. Rantanen, H., and M. Kahila (2009). “The SoftGIS approach to local knowledge.” Journal of Environmental Management. Vol. 90, No. 6, pp. 1981-1990. Ratnasingam, P.(2010), “The Role of Web Services: A Balance Scorecard Perspective.” In Web Technologies: Concepts, Methodologies, Tools, and Applications. Information Science Reference, Hershey, New York, pp. 865-73. Raymond, C. M., I. Fazey, M. S. Reed, L. C. Stringer, G. M. Robinson, A. C. Evely, (2010). “Integrating local and scientific knowledge for environmental management.” Journal of Environmental Management. Vol.91, No.8, pp.1766-1777. Reed, C. (2008), “Geographic Information Systems.” In Encyclopedia of GIS. Ed. Kemp K. K., SAGE Publications, Inc., California, USA., pp. 329-30. Refractions Research (2008). “PostGIS.” Refractions Research. [On-line] 23 February 2010. http://www.refractions.net/products/postgis/. Reyes-García, V., E. Kightley, I. Ruiz-Mallén, N. Fuentes-Peláez, K. Demps, T. Huanca, and M. R. Martínez-Rodríguez (2010). “Schooling and local environmental knowledge: Do they complement or substitute each other?” International Journal of Educational Development.Vol. 30, No. 3, pp. 305-313. Rinner, C., C. Keßler, and S. Andrulis (2008). “The use of Web 2.0 concepts to support deliberation in spatial decision-making.” Computers, Environment and Urban Systems Vol. 32, No. 5, pp. 386-395.
115
Robertson, H. A., and T. K. McGee (2003). “Applying local knowledge: the contribution of oral history to wetland rehabilitation at Kanyapella Basin, Australia.” Journal of Environmental Management. Vol. 69, No. 3, pp. 275-287. Ryder, R. (2003). “Local soil knowledge and site suitability evaluation in the Dominican Republic.” Geoderma. Vol. 111, No. 3-4, pp. 289-305. Sieber, R. (2006). “Public Participation Geographic Information Systems: A Literature Review and Framework.” Annals of the Association of American Geographers. Vol. 96, No. 3, pp. 491-507. Singh, I., B. Stearns, and M. Johnson (2002). “Designing Enterprise Applications with the J2EETM Platform.” Sun Microsystems, Inc. Stewart, E. J., D. Jacobson, and D. Draper (2008). “Public participation geographic information systems (PPGIS): challenges of implementation in Churchill, Manitoba.” Canadian Geographer / Le Géographe canadien. Vol. 52, No. 3, pp. 351-366. Sommerville, I. (2001), Software Engineering. 6th ed., Addison Wesley Publishers, England. Steyaert, P., M. Barzman, J. Billaud, H. Brives, B. Hubert, G. Ollivier, and B. Roche (2007). “The role of knowledge and research in facilitating social learning among stakeholders in natural resources management in the French Atlantic coastal wetlands.” Environmental Science and Policy. Vol. 10, No.6, pp. 537-550. Tang, M. Y. T. (2006). Design and Implementation of a GIS-Enabled Online Discussion Forum for Participatory Planning. MScE thesis, Department of Geodesy and Geomatics Engineering. Fredericton, Canada, University of New Brunswick, 151 pp. Tatnall, A. (2010), “Web Technologies: Concepts, Applications, Trends and Research Issues.” In Web Technologies: Concepts, Methodologies, Tools, and Applications. Information Science Reference, Hershey, New York. Titus, J. G. and C. Richman (2001). "Maps of lands vulnerable to sea level rise: modeled elevations along the US Atlantic and Gulf coasts." Climate Research. Vol. 18, No. 3, pp. 205-228. Turnbull, D. (2000). Masons, Tricksters and Cartographers: Makers of Knowledge and Space, Florence, KY, USA: Gordon and Breach Publishing Group.

116
Vellinga, P. and R. J. T. Klein (1993). “Climate change, sea level rise and integrated coastal zone management: An IPCC approach.” Ocean and Coastal Management Vol. 21, No. 1-3, pp. 245-268. Walker, R. (2003). “The Guts of a New Machine”. The New York Times Magazine (November 30,2003).[On-line] 3 December 2010. http://query.nytimes.com/gst/ fullpage.html?res=9C02E7D8113BF933A05752C1A9659C8B63. Wu, H., Z. He, et al. (2010). “A virtual globe-based 3D visualization and interactive framework for public participation in urban planning processes.” Computers, Environment and Urban Systems. In Press, Corrected Proof. UNDP (2001). “Workshop for Developing and Adaptation Policy Framework for Climate Change.” June 2001, United Nations Development Program, Montreal, Canada. Zeiner, H., G. Kienast, C. Derler, and W. Haas (2005). “Video documentation of urban areas.” Computers, Environment and Urban Systems. Vol. 29, No. 6, pp. 653-668. Zend Framework (2010). “Programmer's Reference Guide”, Version 1.11. [On-line] 10 December 2010. http://framework.zend.com/manual/en/ Zhao, J. (2007). An Empirical Usability Evaluation of a Web-based Public Participation Geographic Information System and Discussion Forum. M.Sc.E. thesis, Department of Geodesy and Geomatics Engineering, Technical Report No. 250, University of New Brunswick, Fredericton, New Brunswick, Canada, 155
pp.
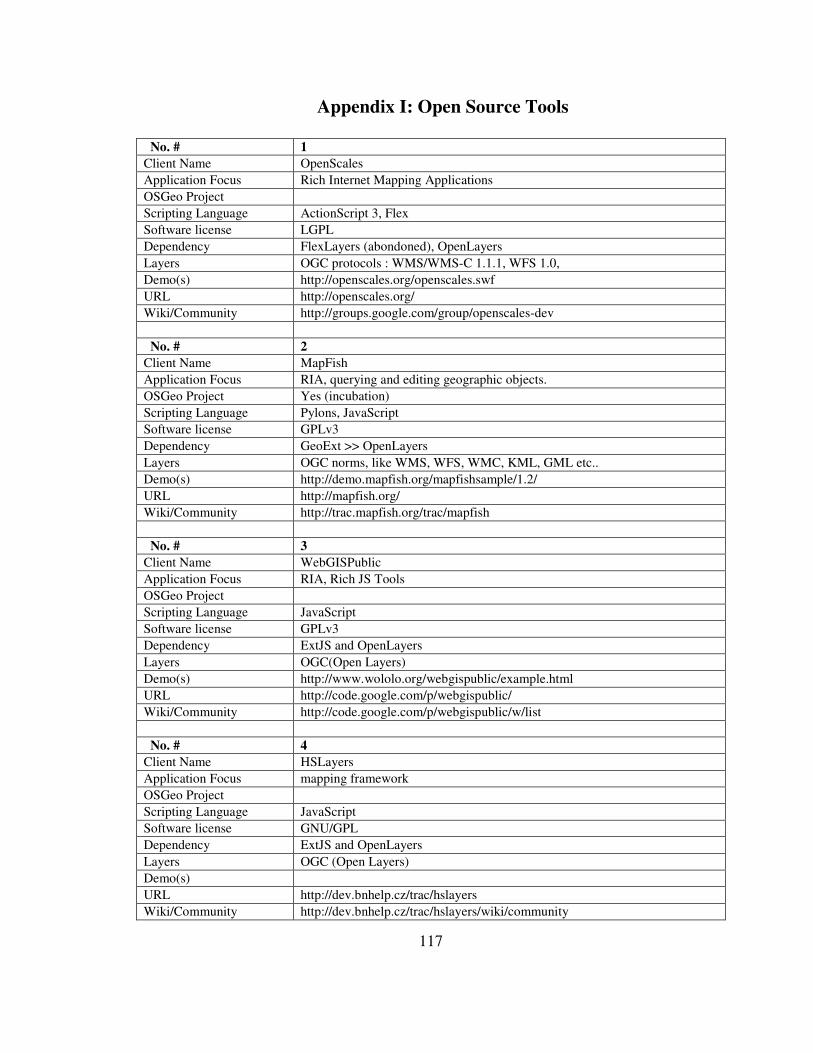
117
Appendix I: Open Source Tools
No. # 1
Client Name OpenScales Application Focus Rich Internet Mapping Applications OSGeo Project Scripting Language ActionScript 3, Flex Software license LGPL Dependency FlexLayers (abondoned), OpenLayers Layers OGC protocols : WMS/WMS-C 1.1.1, WFS 1.0, Demo(s) http://openscales.org/openscales.swf URL http://openscales.org/ Wiki/Community http://groups.google.com/group/openscales-dev No. # 2
Client Name MapFish Application Focus RIA, querying and editing geographic objects. OSGeo Project Yes (incubation) Scripting Language Pylons, JavaScript Software license GPLv3 Dependency GeoExt >> OpenLayers Layers OGC norms, like WMS, WFS, WMC, KML, GML etc.. Demo(s) http://demo.mapfish.org/mapfishsample/1.2/ URL http://mapfish.org/ Wiki/Community http://trac.mapfish.org/trac/mapfish No. # 3
Client Name WebGISPublic Application Focus RIA, Rich JS Tools OSGeo Project Scripting Language JavaScript Software license GPLv3 Dependency ExtJS and OpenLayers Layers OGC(Open Layers) Demo(s) http://www.wololo.org/webgispublic/example.html URL http://code.google.com/p/webgispublic/ Wiki/Community http://code.google.com/p/webgispublic/w/list No. # 4
Client Name HSLayers Application Focus mapping framework OSGeo Project Scripting Language JavaScript Software license GNU/GPL Dependency ExtJS and OpenLayers Layers OGC (Open Layers) Demo(s) URL http://dev.bnhelp.cz/trac/hslayers Wiki/Community http://dev.bnhelp.cz/trac/hslayers/wiki/community
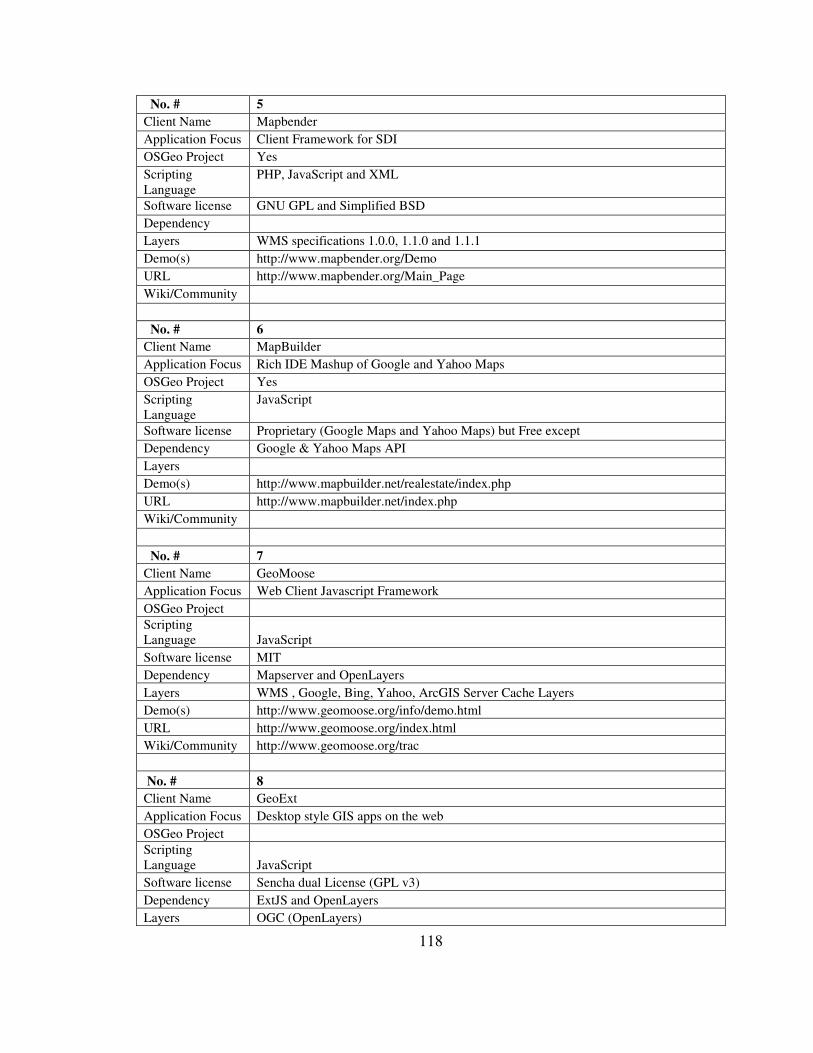
118
No. # 5
Client Name Mapbender Application Focus Client Framework for SDI OSGeo Project Yes Scripting Language
PHP, JavaScript and XML
Software license GNU GPL and Simplified BSD Dependency Layers WMS specifications 1.0.0, 1.1.0 and 1.1.1 Demo(s) http://www.mapbender.org/Demo URL http://www.mapbender.org/Main_Page Wiki/Community No. # 6
Client Name MapBuilder Application Focus Rich IDE Mashup of Google and Yahoo Maps OSGeo Project Yes Scripting Language
JavaScript
Software license Proprietary (Google Maps and Yahoo Maps) but Free except Dependency Google & Yahoo Maps API Layers Demo(s) http://www.mapbuilder.net/realestate/index.php URL http://www.mapbuilder.net/index.php Wiki/Community
No. # 7
Client Name GeoMoose Application Focus Web Client Javascript Framework OSGeo Project Scripting Language JavaScript Software license MIT Dependency Mapserver and OpenLayers Layers WMS , Google, Bing, Yahoo, ArcGIS Server Cache Layers Demo(s) http://www.geomoose.org/info/demo.html URL http://www.geomoose.org/index.html Wiki/Community http://www.geomoose.org/trac No. # 8
Client Name GeoExt Application Focus Desktop style GIS apps on the web OSGeo Project Scripting Language JavaScript Software license Sencha dual License (GPL v3) Dependency ExtJS and OpenLayers Layers OGC (OpenLayers)
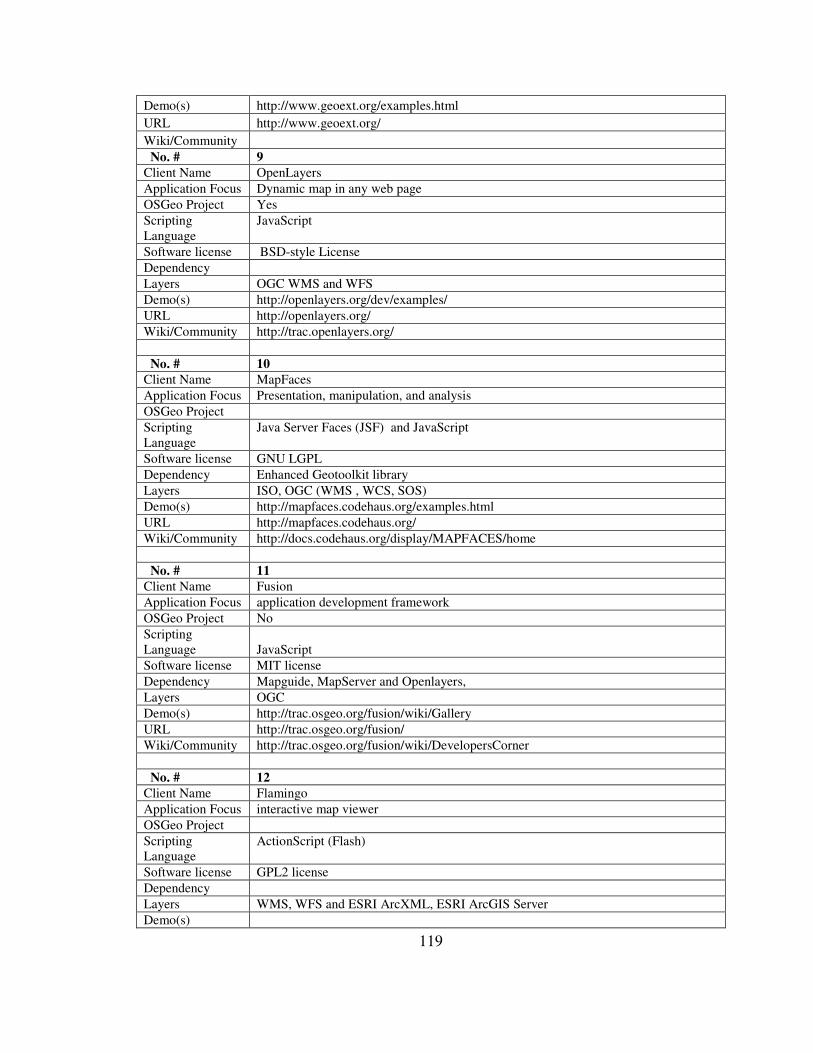
119
Demo(s) http://www.geoext.org/examples.html URL http://www.geoext.org/ Wiki/Community No. # 9
Client Name OpenLayers Application Focus Dynamic map in any web page OSGeo Project Yes Scripting Language
JavaScript
Software license BSD-style License Dependency Layers OGC WMS and WFS Demo(s) http://openlayers.org/dev/examples/ URL http://openlayers.org/ Wiki/Community http://trac.openlayers.org/ No. # 10
Client Name MapFaces Application Focus Presentation, manipulation, and analysis OSGeo Project Scripting Language
Java Server Faces (JSF) and JavaScript
Software license GNU LGPL Dependency Enhanced Geotoolkit library Layers ISO, OGC (WMS , WCS, SOS) Demo(s) http://mapfaces.codehaus.org/examples.html URL http://mapfaces.codehaus.org/ Wiki/Community http://docs.codehaus.org/display/MAPFACES/home No. # 11
Client Name Fusion Application Focus application development framework OSGeo Project No Scripting Language JavaScript Software license MIT license Dependency Mapguide, MapServer and Openlayers, Layers OGC Demo(s) http://trac.osgeo.org/fusion/wiki/Gallery URL http://trac.osgeo.org/fusion/ Wiki/Community http://trac.osgeo.org/fusion/wiki/DevelopersCorner No. # 12
Client Name Flamingo Application Focus interactive map viewer OSGeo Project Scripting Language
ActionScript (Flash)
Software license GPL2 license Dependency Layers WMS, WFS and ESRI ArcXML, ESRI ArcGIS Server Demo(s)
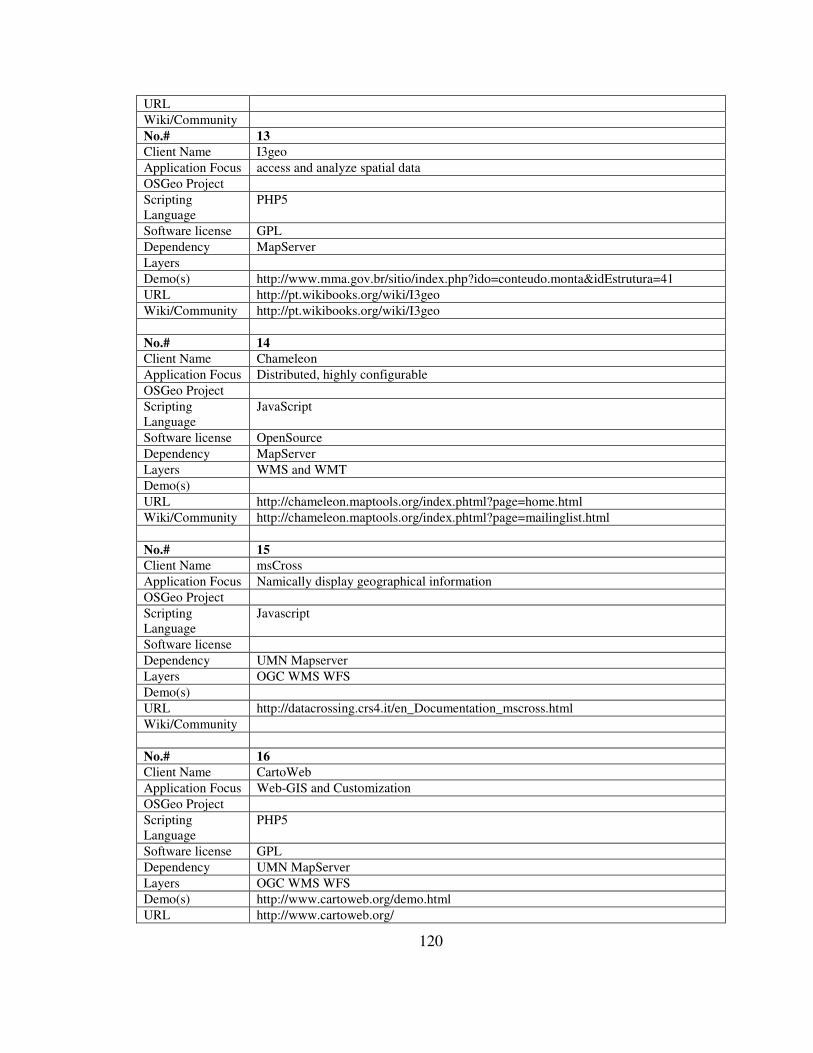
120
URL Wiki/Community No.# 13
Client Name I3geo Application Focus access and analyze spatial data OSGeo Project Scripting Language
PHP5
Software license GPL Dependency MapServer Layers Demo(s) http://www.mma.gov.br/sitio/index.php?ido=conteudo.monta&idEstrutura=41 URL http://pt.wikibooks.org/wiki/I3geo Wiki/Community http://pt.wikibooks.org/wiki/I3geo No.# 14
Client Name Chameleon Application Focus Distributed, highly configurable OSGeo Project Scripting Language
JavaScript
Software license OpenSource Dependency MapServer Layers WMS and WMT Demo(s) URL http://chameleon.maptools.org/index.phtml?page=home.html Wiki/Community http://chameleon.maptools.org/index.phtml?page=mailinglist.html No.# 15
Client Name msCross Application Focus Namically display geographical information OSGeo Project Scripting Language
Javascript
Software license Dependency UMN Mapserver Layers OGC WMS WFS Demo(s) URL http://datacrossing.crs4.it/en_Documentation_mscross.html Wiki/Community No.# 16
Client Name CartoWeb Application Focus Web-GIS and Customization OSGeo Project Scripting Language
PHP5
Software license GPL Dependency UMN MapServer Layers OGC WMS WFS Demo(s) http://www.cartoweb.org/demo.html URL http://www.cartoweb.org/
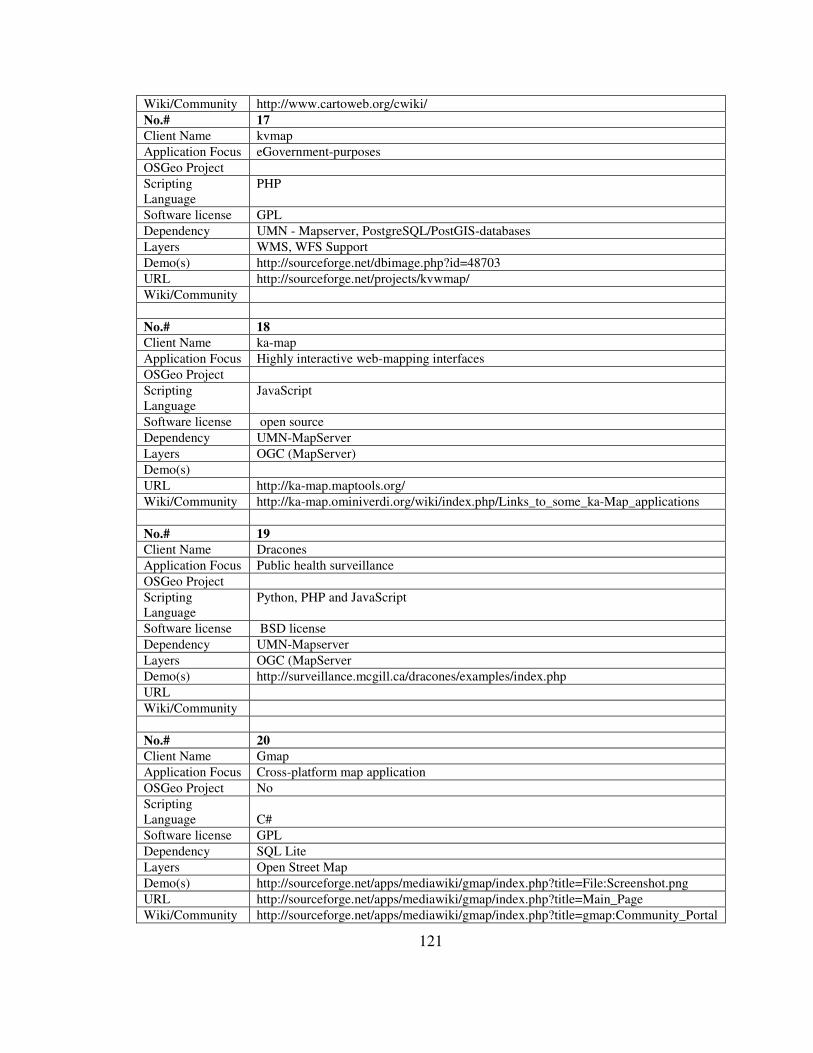
121
Wiki/Community http://www.cartoweb.org/cwiki/ No.# 17
Client Name kvmap Application Focus eGovernment-purposes OSGeo Project Scripting Language
PHP
Software license GPL Dependency UMN - Mapserver, PostgreSQL/PostGIS-databases Layers WMS, WFS Support Demo(s) http://sourceforge.net/dbimage.php?id=48703 URL http://sourceforge.net/projects/kvwmap/ Wiki/Community No.# 18
Client Name ka-map Application Focus Highly interactive web-mapping interfaces OSGeo Project Scripting Language
JavaScript
Software license open source Dependency UMN-MapServer Layers OGC (MapServer) Demo(s) URL http://ka-map.maptools.org/ Wiki/Community http://ka-map.ominiverdi.org/wiki/index.php/Links_to_some_ka-Map_applications No.# 19
Client Name Dracones Application Focus Public health surveillance OSGeo Project Scripting Language
Python, PHP and JavaScript
Software license BSD license Dependency UMN-Mapserver Layers OGC (MapServer Demo(s) http://surveillance.mcgill.ca/dracones/examples/index.php URL Wiki/Community No.# 20
Client Name Gmap Application Focus Cross-platform map application OSGeo Project No Scripting Language C# Software license GPL Dependency SQL Lite Layers Open Street Map Demo(s) http://sourceforge.net/apps/mediawiki/gmap/index.php?title=File:Screenshot.png URL http://sourceforge.net/apps/mediawiki/gmap/index.php?title=Main_Page Wiki/Community http://sourceforge.net/apps/mediawiki/gmap/index.php?title=gmap:Community_Portal
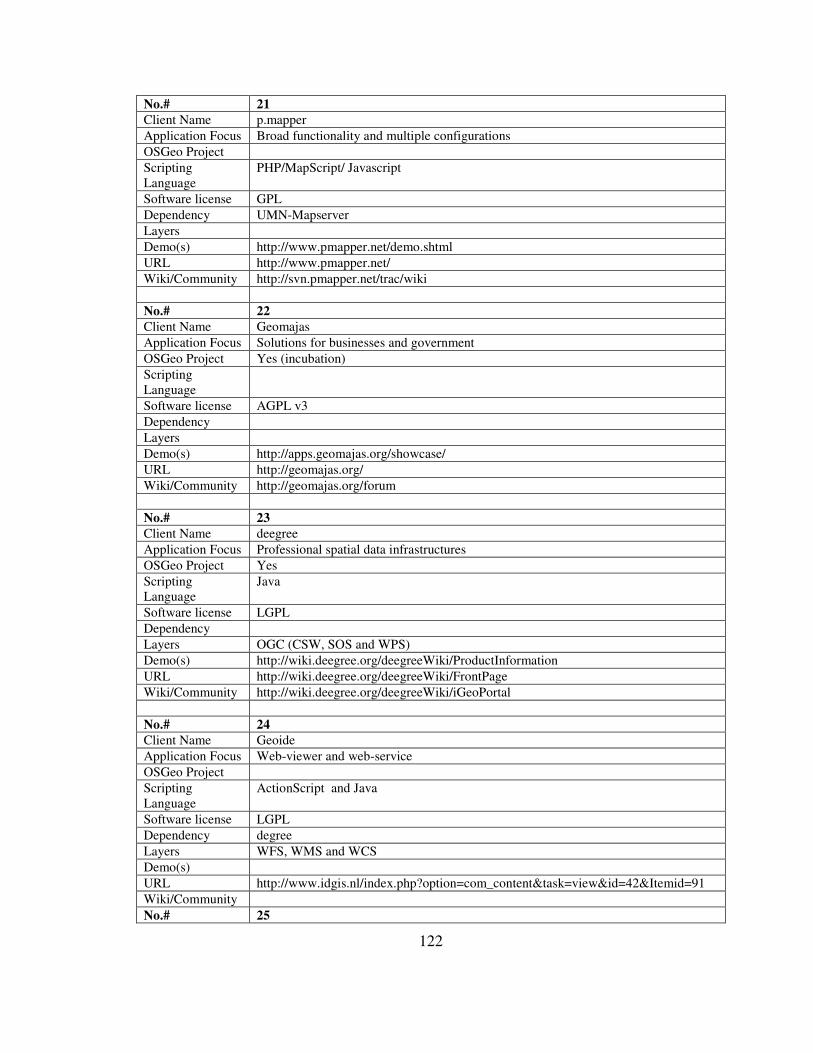
122
No.# 21
Client Name p.mapper Application Focus Broad functionality and multiple configurations OSGeo Project Scripting Language
PHP/MapScript/ Javascript
Software license GPL Dependency UMN-Mapserver Layers Demo(s) http://www.pmapper.net/demo.shtml URL http://www.pmapper.net/ Wiki/Community http://svn.pmapper.net/trac/wiki No.# 22
Client Name Geomajas Application Focus Solutions for businesses and government OSGeo Project Yes (incubation) Scripting Language
Software license AGPL v3 Dependency Layers Demo(s) http://apps.geomajas.org/showcase/ URL http://geomajas.org/ Wiki/Community http://geomajas.org/forum No.# 23
Client Name deegree Application Focus Professional spatial data infrastructures OSGeo Project Yes Scripting Language
Java
Software license LGPL Dependency Layers OGC (CSW, SOS and WPS) Demo(s) http://wiki.deegree.org/deegreeWiki/ProductInformation URL http://wiki.deegree.org/deegreeWiki/FrontPage Wiki/Community http://wiki.deegree.org/deegreeWiki/iGeoPortal No.# 24
Client Name Geoide Application Focus Web-viewer and web-service OSGeo Project Scripting Language
ActionScript and Java
Software license LGPL Dependency degree Layers WFS, WMS and WCS Demo(s) URL http://www.idgis.nl/index.php?option=com_content&task=view&id=42&Itemid=91 Wiki/Community No.# 25
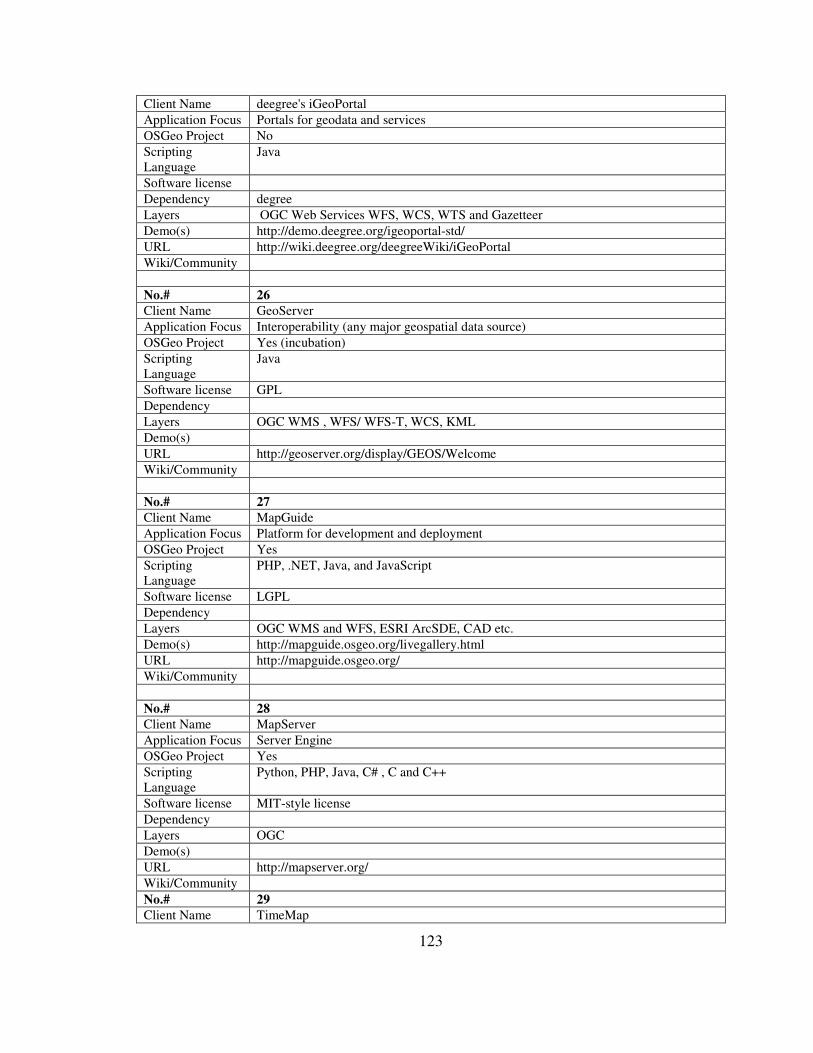
123
Client Name deegree's iGeoPortal Application Focus Portals for geodata and services OSGeo Project No Scripting Language
Java
Software license Dependency degree Layers OGC Web Services WFS, WCS, WTS and Gazetteer Demo(s) http://demo.deegree.org/igeoportal-std/ URL http://wiki.deegree.org/deegreeWiki/iGeoPortal Wiki/Community No.# 26
Client Name GeoServer Application Focus Interoperability (any major geospatial data source) OSGeo Project Yes (incubation) Scripting Language
Java
Software license GPL Dependency Layers OGC WMS , WFS/ WFS-T, WCS, KML Demo(s) URL http://geoserver.org/display/GEOS/Welcome Wiki/Community No.# 27
Client Name MapGuide Application Focus Platform for development and deployment OSGeo Project Yes Scripting Language
PHP, .NET, Java, and JavaScript
Software license LGPL Dependency Layers OGC WMS and WFS, ESRI ArcSDE, CAD etc. Demo(s) http://mapguide.osgeo.org/livegallery.html URL http://mapguide.osgeo.org/ Wiki/Community No.# 28
Client Name MapServer Application Focus Server Engine OSGeo Project Yes Scripting Language
Python, PHP, Java, C# , C and C++
Software license MIT-style license Dependency Layers OGC Demo(s) URL http://mapserver.org/ Wiki/Community No.# 29
Client Name TimeMap
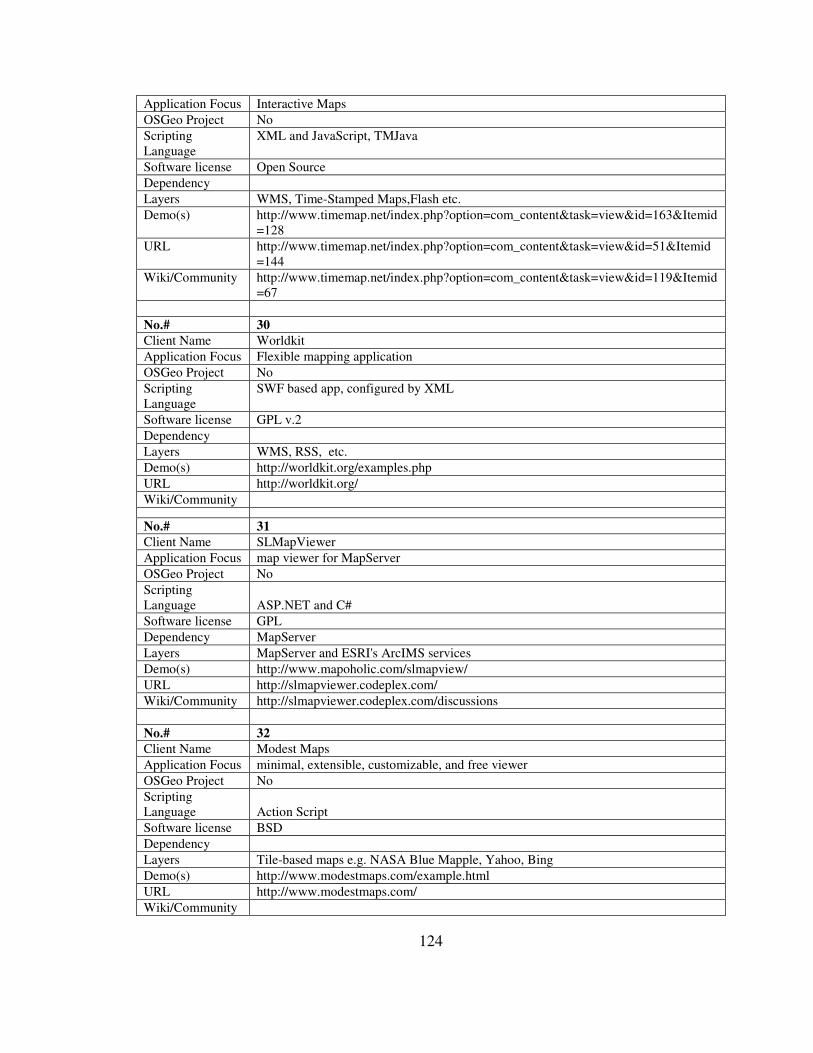
124
Application Focus Interactive Maps OSGeo Project No Scripting Language
XML and JavaScript, TMJava
Software license Open Source Dependency Layers WMS, Time-Stamped Maps,Flash etc. Demo(s) http://www.timemap.net/index.php?option=com_content&task=view&id=163&Itemid
=128 URL http://www.timemap.net/index.php?option=com_content&task=view&id=51&Itemid
=144 Wiki/Community http://www.timemap.net/index.php?option=com_content&task=view&id=119&Itemid
=67 No.# 30
Client Name Worldkit Application Focus Flexible mapping application OSGeo Project No Scripting Language
SWF based app, configured by XML
Software license GPL v.2 Dependency Layers WMS, RSS, etc. Demo(s) http://worldkit.org/examples.php URL http://worldkit.org/ Wiki/Community No.# 31
Client Name SLMapViewer Application Focus map viewer for MapServer OSGeo Project No Scripting Language ASP.NET and C# Software license GPL Dependency MapServer Layers MapServer and ESRI's ArcIMS services Demo(s) http://www.mapoholic.com/slmapview/ URL http://slmapviewer.codeplex.com/ Wiki/Community http://slmapviewer.codeplex.com/discussions No.# 32
Client Name Modest Maps Application Focus minimal, extensible, customizable, and free viewer OSGeo Project No Scripting Language Action Script Software license BSD Dependency Layers Tile-based maps e.g. NASA Blue Mapple, Yahoo, Bing Demo(s) http://www.modestmaps.com/example.html URL http://www.modestmaps.com/ Wiki/Community
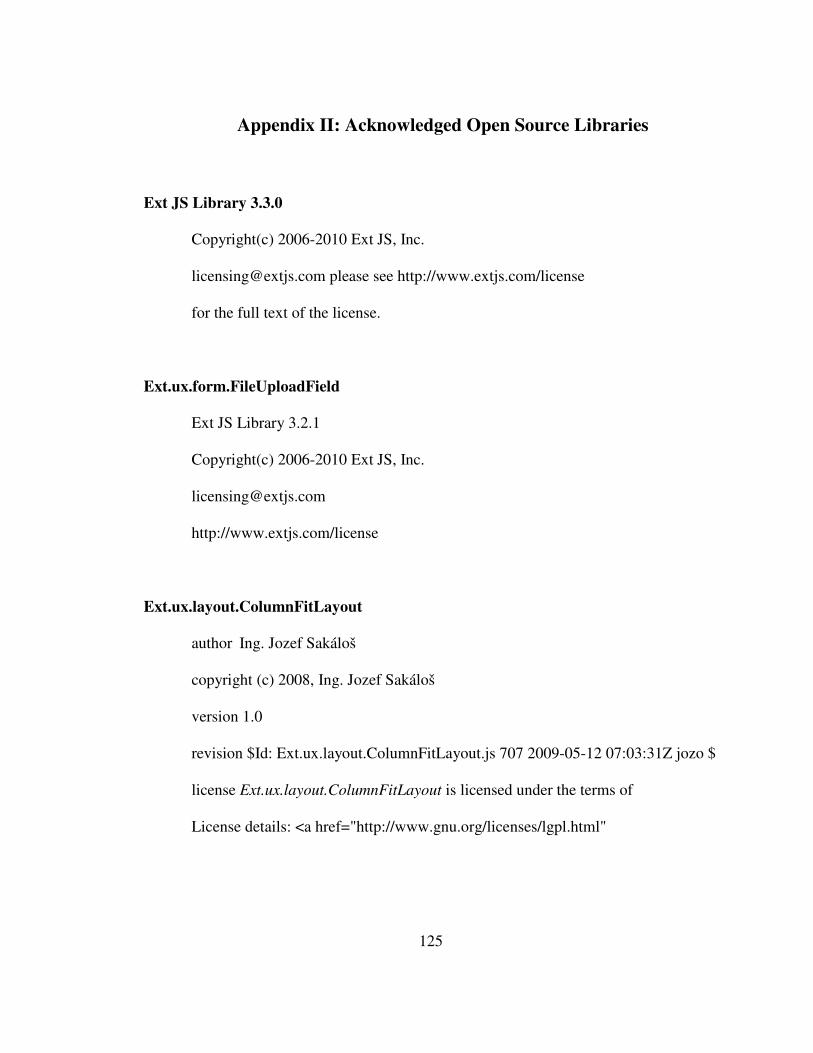
125
Appendix II: Acknowledged Open Source Libraries
Ext JS Library 3.3.0
Copyright(c) 2006-2010 Ext JS, Inc.
[email protected] please see http://www.extjs.com/license
for the full text of the license.
Ext.ux.form.FileUploadField
Ext JS Library 3.2.1
Copyright(c) 2006-2010 Ext JS, Inc.
http://www.extjs.com/license
Ext.ux.layout.ColumnFitLayout
author Ing. Jozef Sakáloš
copyright (c) 2008, Ing. Jozef Sakáloš
version 1.0
revision $Id: Ext.ux.layout.ColumnFitLayout.js 707 2009-05-12 07:03:31Z jozo $
license Ext.ux.layout.ColumnFitLayout is licensed under the terms of
License details: <a href="http://www.gnu.org/licenses/lgpl.html"
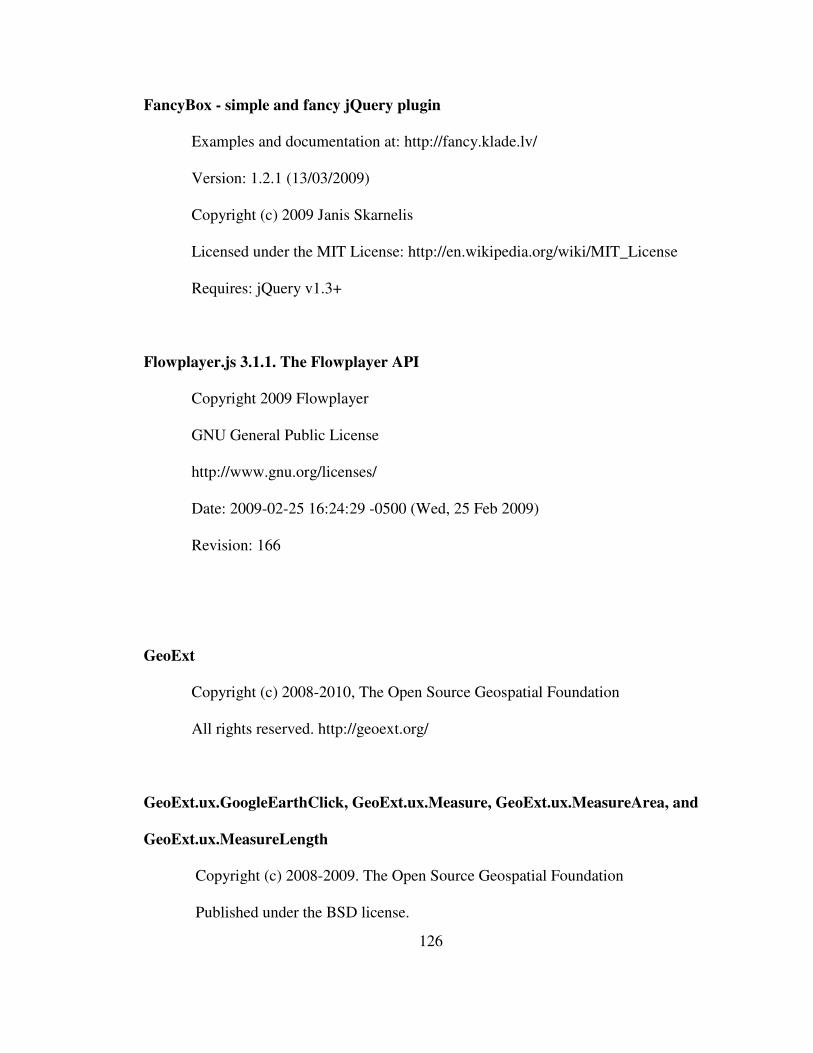
126
FancyBox - simple and fancy jQuery plugin
Examples and documentation at: http://fancy.klade.lv/
Version: 1.2.1 (13/03/2009)
Copyright (c) 2009 Janis Skarnelis
Licensed under the MIT License: http://en.wikipedia.org/wiki/MIT_License
Requires: jQuery v1.3+
Flowplayer.js 3.1.1. The Flowplayer API
Copyright 2009 Flowplayer
GNU General Public License
http://www.gnu.org/licenses/
Date: 2009-02-25 16:24:29 -0500 (Wed, 25 Feb 2009)
Revision: 166
GeoExt
Copyright (c) 2008-2010, The Open Source Geospatial Foundation
All rights reserved. http://geoext.org/
GeoExt.ux.GoogleEarthClick, GeoExt.ux.Measure, GeoExt.ux.MeasureArea, and
GeoExt.ux.MeasureLength
Copyright (c) 2008-2009. The Open Source Geospatial Foundation
Published under the BSD license.
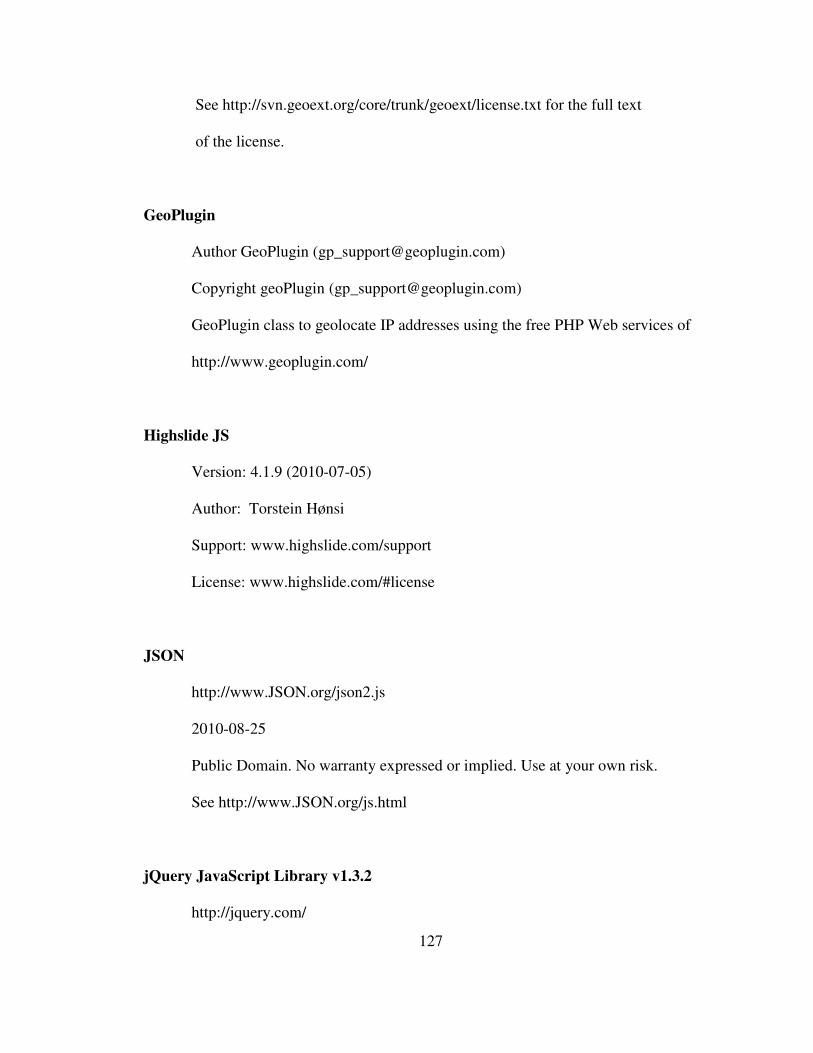
127
See http://svn.geoext.org/core/trunk/geoext/license.txt for the full text
of the license.
GeoPlugin
Author GeoPlugin ([email protected])
Copyright geoPlugin ([email protected])
GeoPlugin class to geolocate IP addresses using the free PHP Web services of
http://www.geoplugin.com/
Highslide JS
Version: 4.1.9 (2010-07-05)
Author: Torstein Hønsi
Support: www.highslide.com/support
License: www.highslide.com/#license
JSON
http://www.JSON.org/json2.js
2010-08-25
Public Domain. No warranty expressed or implied. Use at your own risk.
See http://www.JSON.org/js.html
jQuery JavaScript Library v1.3.2
http://jquery.com/
128
Copyright (c) 2009 John Resig
Dual licensed under the MIT and GPL licenses.
http://docs.jquery.com/License
Date: 2009-02-19 17:34:21 -0500 (Thu, 19 Feb 2009)
Revision: 6246
jQuery Easing v1.3
http://gsgd.co.uk/sandbox/jquery/easing/
Uses the built in easing capabilities added In jQuery 1.1
to offer multiple easing options
TERMS OF USE - jQuery Easing
Open source under the BSD License.
Copyright © 2008 George McGinley Smith
All rights reserved.
MP3 Player
Creative Commons License.
http://creativecommons.org/licenses/by-nc-sa/2.5/
For commercial use, script at a fee of 15 Euros.
UPDATES 2.0
www.jeroenwijering.com
129
OpenLayers Map Viewer Library
Copyright 2005-2010 OpenLayers Contributors, released under the Clear BSD
license. Please see http://svn.openlayers.org/trunk/openlayers/license.txt
for the full text of the license.
Zend Framework
LICENSE : http://framework.zend.com/license/new-bsd
Email :[email protected]
Copyright (c) 2005-2010 Zend Technologies USA Inc. (http://www.zend.com)
130
Appendix III: CCGIS Documentation
Package CCGIS Server-Side Classes
Class Application_Model_CCGISDB_CCGISConfiguration
Super Admin CCGIS Configuration Class: Zend_Db Table Data Gateway
Class Application_Model_CCGISDB_CCGISDBService
Coastal Collaborative GIS: DataBase Table Gateway Service Class C-CHANGE Project
Constructor:
void function Application_Model_CCGISDB_CCGISDBService::__construct()
Initialises all CCGISDB Tables, each instance of the Zend table data gateway is stored in
the corresponding table class
acceptTempContribution:
Accepts temporary contribution [Admin privilege required]
boolean function Application_Model_CCGISDB_CCGISDBService:: acceptTempContribution ($tempContId, $fkUserId)
Function Parameters:
integer $tempContId integer $fkUserId
activateUser:
Activate a user (admin privilege required)
131
boolean function Application_Model_CCGISDB_CCGISDBService:: activateUser ($regId, $regSig)
Function Parameters:
integer $regId integer $regSig
createNewForumTopic
Create new forum topic
boolean function Application_Model_CCGISDB_CCGISDBService:: createNewForumTopic ($newTopicData,$fk_user_id)
Function Parameters:
array $newTopicData integer $fk_user_id
deactivateUser:
Deactivate a user (admin privilege required)
boolean function Application_Model_CCGISDB_CCGISDBService:: deactivateUser ($regId, $regSig)
Function Parameters:
integer $regId string $regSig
deleteCCUser:
Delete ccUser [Administrator privilege required]
integer function Application_Model_CCGISDB_CCGISDBService:: deleteCCUser ($user_id)
Function Parameters:
integer $user_id
132
deleteCCUserAddress:
Delete ccUser Profile
integer function Application_Model_CCGISDB_CCGISDBService:: deleteCCUserAddress ($address_id)
Function Parameters:
integer $address_id
deleteSpatialContribution:
Delete spatial contribution
integer function Application_Model_CCGISDB_CCGISDBService:: deleteSpatialContribution ($cont_id)
Function Parameters:
integer $cont_id
deleteTempSpatialContribution:
Delete temporary spatial contribution
boolean function Application_Model_CCGISDB_CCGISDBService:: deleteTempSpatialContribution ($temp_cont_id)
Function Parameters:
integer $temp_cont_id
evaluateCCGIS:
Evaluate CCGIS
boolean function Application_Model_CCGISDB_CCGISDBService:: evaluateCCGIS ($data)
Function Parameters:
array $data
133
getAllCCUsers:
Fetch all users order by first name
array function Application_Model_CCGISDB_CCGISDBService:: getAllCCUsers ($condition)
Function Parameters:
string $condition
getAllCCUsersAddress:
Fetch all user addresses order by city
array function Application_Model_CCGISDB_CCGISDBService:: getAllCCUsersAddress ()
getAllSpatialContributions:
Get all public available spatial data
array function Application_Model_CCGISDB_CCGISDBService:: getAllSpatialContributions ($columnNames)
Function Parameters:
string $columnNames
getAllTempSpatialContributions:
Fetch all temporary spatial contributions order by temp contribution id
array function Application_Model_CCGISDB_CCGISDBService:: getAllTempSpatialContributions ()
getCCUser:
Find a user by id
array function Application_Model_CCGISDB_CCGISDBService::
134
getCCUser ($user_id) Function Parameters:
integer $user_id
getCCUserAddress:
Find record by user id
array function Application_Model_CCGISDB_CCGISDBService:: getCCUserAddress ($fk_user_id)
Function Parameters:
integer $fk_user_id
getCCUserByName:
Find ccUser by firstName
array function Application_Model_CCGISDB_CCGISDBService:: getCCUserByName ($fname)
Function Parameters:
string $fname
getCMSSpatialQuery:
Get Spatial Query [CMS - Admin] Throws Exception date range not set
array function Application_Model_CCGISDB_CCGISDBService:: getCMSSpatialQuery ($columnNames,$queryParams)
Function Parameters:
string $columnNames array $queryParams
135
getFeatureReputation:
Get feature reputation
string function Application_Model_CCGISDB_CCGISDBService:: getFeatureReputation ($rep_data, $columnNames)
Function Parameters:
array $rep_data string $columnNames
getForumRecord:
Get forum data by id
array function Application_Model_CCGISDB_CCGISDBService:: getForumRecord ($forum_id)
Function Parameters:
Integer $forum_id
getForumRecordsQuery:
Get forum data by query
array function Application_Model_CCGISDB_CCGISDBService:: getForumRecordsQuery ($columnNames, $queryParams)
Function Parameters:
string $columnNames array $queryParams
getIndexSpatialQuery:
Get Spatial Query [Index - Main Page] Throws Exception date range not set
array function Application_Model_CCGISDB_CCGISDBService:: getIndexSpatialQuery ($columnNames, $queryParams)
136
Function Parameters:
string $columnNames array $queryParams
getProfileSpatialContributionByUserID:
Get user spatial contribution profile by id
array function Application_Model_CCGISDB_CCGISDBService:: getProfileSpatialContributionByUserID ($fk_user_id)
Function Parameters:
integer $fk_user_id
getSpatialContribution:
Find record by contribution id and column names
array function Application_Model_CCGISDB_CCGISDBService:: getSpatialContribution ($cont_id, [$columnNames = 'notset'] )
Function Parameters:
integer $cont_id string $columnNames
getTempSpatialContribution:
Find record by temporary contribution id
array function Application_Model_CCGISDB_CCGISDBService:: getTempSpatialContribution ($temp_cont_id)
Function Parameters:
integer $temp_cont_id
137
getWhereForumFieldIsEqualTo:
Quote into SQL id value for where clause
string function Application_Model_CCGISDB_CCGISDBService:: getWhereForumFieldIsEqualTo ($forumField, $filedValue)
Function Parameters:
string $forumField dynamic $filedValue
getWhereIdIsEqualto:
Quote into SQL id value for where clause function (user table)
string function Application_Model_CCGISDB_CCGISDBService:: getWhereIdIsEqualto ($idField, $idValue
Function Parameters:
string $idField integer $idValue
getWhereSpatialFieldIsEqualTo:
Quote into SQL query string: id value for where clause
void function Application_Model_CCGISDB_CCGISDBService:: getWhereSpatialFieldIsEqualTo ($spatialField,$filedValue)
Function Parameters:
integer $spatialField string $filedValue
newCCUser:
Create new ccUser (admin privilege is required to Commit Registration)
integer function Application_Model_CCGISDB_CCGISDBService::

138
newCCUser ($fname, $lname, $username, $password, $salt, $role, $date, $active, $email)
Function Parameters:
string $fname string $lname string $username string $password string $salt string $role date $date integer $active string $email
newccUserAddress:
Create new user address (foreign key constraint - user id)
integer function Application_Model_CCGISDB_CCGISDBService:: newccUserAddress ($street_name, $apartment_number, $city, $province_or_region, $country, $fk_user_id)
Function Parameters:
string $street_name integer $apartment_number string $city string $province_or_region string $country integer $fk_user_id
newSpatialContribution:
Create a new spatial contribution
boolean function Application_Model_CCGISDB_CCGISDBService:: newSpatialContribution ($json_feature, $forum_thread, $fk_user_id, $meta_files, $meta_date_created, $meta_time_created, $meta_event_date, $meta_event_title, $meta_event_time, $meta_event_rank, $meta_event_damage_estimate, $meta_event_description, $meta_affirmations, $meta_rep_concur , $meta_rep_concur)
139
Function Parameters:
json $json_feature string string $forum_thread integer $fk_user_id string $meta_files date $meta_date_created time $meta_time_created date $meta_event_date string $meta_event_title time $meta_event_time integer $meta_event_rank integer $meta_event_damage_estimate string $meta_event_description string $meta_affirmations timestamp $meta_rep_concur
newTempSpatialContribution:
Create new temporary spatial contribution
boolean function Application_Model_CCGISDB_CCGISDBService:: newTempSpatialContribution ($json_feature, $forum_thread, $fk_user_id)
Function Parameters:
string $json_feature string $forum_thread integer $fk_user_id
rejectTempContribution:
Reject temporary contributions. Throws Exception id is not set
boolean function Application_Model_CCGISDB_CCGISDBService:: rejectTempContribution ($tempContId, $fkUserId)
Function Parameters:
integer $tempContId integer $fkUserId
140
saveCCUserAddress:
Update or Save ccUser Address
integer function Application_Model_CCGISDB_CCGISDBService:: saveCCUserAddress ($address_id, $street_name, $apartment_number, $city, $province_or_region, $country, $fk_user_id)
Function Parameters:
integer $address_id string $street_name integer $apartment_number string $city string $province_or_region string $country integer $fk_user_id
saveProfileCCUser:
Update or save user profile details
boolean function Application_Model_CCGISDB_CCGISDBService:: saveProfileCCUser ($user_id, $fname, $lname, $email, $occupation, $mobile, $fax, $biography, $ProfAddress)
Function Parameters:
integer $user_id string $fname string $lname string $email string $occupation string $mobile string $fax string $biography string $ProfAddress
141
saveSpatialContribution:
Save or Update spatial contribution [Administrator privilege required]
integer function Application_Model_CCGISDB_CCGISDBService:: saveSpatialContribution ($cont_id, $json_feature, $forum_thread, $fk_user_id)
Function Parameters:
integer $cont_id string $json_feature string $forum_thread integer $fk_user_id
saveTempSpatialContribution:
Save or Update temporary spatial contribution
integer function Application_Model_CCGISDB_CCGISDBService:: saveTempSpatialContribution ($temp_cont_id, $json_feature, $forum_thread, $fk_user_id)
Function Parameters:
integer $temp_cont_id string $json_feature string $forum_thread integer $fk_user_id
setFeatureReputation:
Set feature reputation
boolean function Application_Model_CCGISDB_CCGISDBService:: setFeatureReputation ($rep_data, $columnNames)
Function Parameters:
array $rep_data string $columnNames
142
updateNewForumComment:
Update forum comment
boolean function Application_Model_CCGISDB_CCGISDBService:: updateNewForumComment ($newCommentData, $forum_topic_id)
Function Parameters:
array $newCommentData integer $forum_topic_id
updateUserContProfile
Update the number of contribution of users
array function Application_Model_CCGISDB_CCGISDBService:: updateUserContProfile ($user_id, $cont_id)
Function Parameters:
integer $cont_id integer $user_id
updateUserMedalsProfile:
Update the medals for a user (reputation index)
integer function Application_Model_CCGISDB_CCGISDBService:: updateUserMedalsProfile ($user_id, $cont_id)
Function Parameters:
integer $cont_id integer $user_id
Class Application_Model_CCGISDB_EvaluateCCGIS
ReviewCCGIS Table Class: Zend Table Data Gateway C-CHANGE Project [ICURA]
143
Class Application_Model_CCGISDB_ImageUtil
Image Utility Functions. Author: Titus Tienaah [2010] after Simon Jarvis [2006] GPL
String image property
Application_Model_CCGISDB_ImageUtil::$image
String const Image Type Constant
Application_Model_CCGISDB_ImageUtil::$image_type
getHeight:
Get Image Height
integer function Application_Model_CCGISDB_ImageUtil:: getHeight ()
getWidth:
Get Image Width
integer function Application_Model_CCGISDB_ImageUtil:: getWidth ()
load:
Load image
void function Application_Model_CCGISDB_ImageUtil:: load ($filename)
Function Parameters:

144
string $filename
output:
Image Output function
void function Application_Model_CCGISDB_ImageUtil:: output ([$image_type = IMAGETYPE_JPEG])
Function Parameters:
const string $image_type
resize:
Resize image to a specified width and height
void function Application_Model_CCGISDB_ImageUtil::resize ($width, $height)
Function Parameters:
integer $width integer $height
resizeToHeight:
Resize to a Height value keeping aspect ratio
void function Application_Model_CCGISDB_ImageUtil:: resizeToHeight ($height)
Function Parameters:
integer $height
resizeToWidth:
145
Resize to a Width value keeping aspect ratio
void function Application_Model_CCGISDB_ImageUtil:: resizeToWidth ($width)
Function Parameters:
integer $width
save:
Save image
void function Application_Model_CCGISDB_ImageUtil:: save ($filename, [$image_type = IMAGETYPE_JPEG],[$compression = 75], [$permissions = null] )
Function Parameters:
string $filename const $image_type string integer $compression object/string $permissions
scale:
Scale image
void function Application_Model_CCGISDB_ImageUtil::scale ($scale)
Function Parameters:
integer/float $scale
Class Application_Model_CCGISDB_SpatialContribution
Spatial_Contribution Table Class: Zend_Db Table Data Gateway C-CHANGE Project
[ICURA] 2010. Package CCGIS Author. Titus Tienaah
146
Class Application_Model_CCGISDB_SpatialForum
Spatial_Forum Table Class: Zend_Db Table Data Gateway C-CHANGE Project
[ICURA]. Package CCGIS.Author Titus Tienaah
Class Application_Model_CCGISDB_TempSpatialContribution
Temp_Spatial_Contribution Table Class: Zend_Db Table Data Gateway C-CHANGE
Project [ICURA] 2010.Package CCGIS. Author Titus Tienaah
Class Application_Model_CCGISDB_Uploads
Upload Utility Class and Functions ICURA - C-Change Project [2010].Package CCGIS
Author Titus Tienaah
__construct:
Constructor:[no arguments] creates resources and initializes root directories
Constructor void function Application_Model_CCGISDB_Uploads: : __construct ()
147
copyFile:
Copy file from target to destination
boolean function Application_Model_CCGISDB_Uploads:: copyFile ($targetPath, $destinationPath)
Function Parameters:
string $targetPath string $destinationPath
create_storage_space:
Creation of resource directories for file management
void function Application_Model_CCGISDB_Uploads:: create_storage_space ()
fileUpload:
Upload function. Used after resource directories are created
array function Application_Model_CCGISDB_Uploads:: fileUpload ()
mkdir_recursive:
Make directory recursive function
boolean function Application_Model_CCGISDB_Uploads:: mkdir_recursive ($pathname, $mode)
Function Parameters:
string $pathname integer $mode
148
Class Application_Model_CCGISDB_User
CCUser Table Class : Zend_Db Table Data Gateway. C-CHANGE Project [ICURA]
2010. Package CCGIS. Author Titus Tienaah
Class Application_Model_CCGISDB_UserAddress
CCUser Address Table Class : Zend_Db Table Data Gateway. C-CHANGE Project
[ICURA].Package CCGIS. Author Titus Tienaah
Class Bootstrap
Coastal Collaborative GIS BootStrap :: Zend_Application_Bootstrap_Bootstrap C-
CHANGE Project [ICURA] 2010. Package CCGIS. Author Titus Tienaah
_initRoutes:
Routes manager
void function Bootstrap::_initRoutes ()
149
Class ccGeoLocation
Package CCGIS. Author Titus Tienaah after GeoPlugin ([email protected])
Version 1.01. Copyright GeoPlugin ([email protected])
Area code
ccGeoLocation::$areaCode mixed = null
City name
ccGeoLocation::$city mixed = null
Continent code
ccGeoLocation::$continentCode mixed = null
Country code
ccGeoLocation::$countryCode mixed = null
Country name
ccGeoLocation::$countryName mixed = null
Default base currency
ccGeoLocation::$currency string = CAD
Currencey Code
ccGeoLocation::$currencyCode mixed = null
Currency converter
ccGeoLocation::$currencyConverter mixed = null
Currency symbol
ccGeoLocation::$currencySymbol mixed = null [line 1452]
150
DMA code
ccGeoLocation::$dmaCode mixed = null
GeoPlugin Server
ccGeoLocation::$host string = http://www.geoplugin.net/php.gp? ip={IP}&base_currency={CURRENCY}
IP address
ccGeoLocation::$ip mixed = null
Latitide coordinates
ccGeoLocation::$latitute mixed = null
Longitude coordinates
ccGeoLocation::$longitude mixed = null
Region name
ccGeoLocation::$region mixed = null
convert:
Currency converter
number function ccGeoLocation::convert ($amount, [$float = 2] , [$symbol = true] )
Function Parameters:
number $amount integer $float boolean $symbol
fetch:
Fetch host
151
mixed function ccGeoLocation::fetch ($host)
Function Parameters:
string $host
locate:
Locate geographic location by IP address
void function ccGeoLocation::locate ([$ip = null] )
Function Parameters:
mixed $ip
nearby:
Nearby places
array function ccGeoLocation::nearby ([$radius = 10] , [$limit = null] )
Function Parameters:
integer $radius number $limit
Class ErrorController
Error Controller : Zend_Controller_Action . C-CHANGE Project [ICURA] 2010.
Package CCGIS. Author Titus Tienaah.
errorAction:

152
Error Action
void function ErrorController::errorAction ()
getLog:
Get error Log
log function ErrorController::getLog ()
Class IndexController
Package CCGIS.
ccgisAction:
CCGIS Action (Spatial Content Creation and Editing Action)
json function IndexController::ccgisAction ()
cmsAction:
Content Management Action [Used by only Administrator]
json function IndexController::cmsAction ()
forumAction:
Entrance into public interface of CCGIS forum page
json function IndexController::forumAction ()
indexAction:
153
Entrance into public interface of CCGIS Index Action controls public/home requests
json function IndexController::indexAction ()
init:
See Zend_Controller_Action::init()
void function IndexController::init ()
logoutAction:
User Logout Action (Clears user preferences)
void function IndexController::logoutAction ()
preDispatch:
See Zend_Zend_Controller_Action::preDispatch();
void function IndexController::preDispatch ()
profileAction:
User Profile Action (User Details)
json function IndexController::profileAction ()
_acceptUserContribution
Utility Function: Accept user contribution
boolean function IndexController::_acceptUserContribution ($contId, $contSig)
Function Parameters:
integer $contId integer $contSig

154
_activateRegisteredUser:
Utility Function: Activate registered user
array function IndexController::_activateRegisteredUser ($regId, $regSig)
Function Parameters:
integer $regId integer $regSig
_addUser:
Utility Function: Add New User
boolean function IndexController::_addUser ($regData)
Function Parameters:
array $regData
_ccContributionUpload:
Utility Function: Upload user contribution
array function IndexController:: _ccContributionUpload ($ccUploadSpatialData)
Function Parameters:
array $ccUploadSpatialData
_checkRegistration:
Utility Function: Validate registration entries
boolean function IndexController::_checkRegistration ($regvalue)
Function Parameters:
array $regvalue
155
_createNewForumComment:
Utility Function: Create new forum comment
boolean function IndexController:: _createNewForumComment ($commentData, $topicData)
Function Parameters:
string $topicData string $commentData
_createNewForumTopic:
Utility Function: Create new forum topic
boolean function IndexController:: _createNewForumTopic ($topicData)
Function Parameters:
string $topicData
_deactivateRegisteredUser:
Utility Function: Deactivate registered user
array function IndexController::_deactivateRegisteredUser($regId, $regSig)
Function Parameters:
integer $regId integer $regSig
_deleteUser:
Utility Function: Delete user
integer function IndexController::_deleteUser ()
156
_getAuthAdapter:
Utility Function: Get authentication adapter
auth function IndexController::_getAuthAdapter()
_getCmsSpatialQuery:
Utility Function: Get CMS spatial query
array function IndexController::_getCmsSpatialQuery ($queryParams, $columnNames)
Function Parameters:
array $queryParams string $columnNames
_getFeatureReputation:
Utility Function: Get Feature Reputation
boolean function IndexController::_getFeatureReputation ($getReputeData)
Function Parameters:
string $getReputeData
_getForumTopicsByContId:
Utility Function: Get forum topic by contribution id
boolean function IndexController::_getForumTopicsByContId ($queryData)
Function Parameters:
157
string $queryData
_getIndexSpatialData:
Utility Function: Get spatial data given list of columns
array function IndexController::_getIndexSpatialData ($columnNames)
Function Parameters:
string $columnNames
_getIndexSpatialQuery:
Utility Function: Get spatial data : Get spatial data given list of columns
array function IndexController:: _getIndexSpatialQuery ($queryParams, $columnNames)
Function Parameters:
array $queryParams string $columnNames
_getNewSpatialContributions:
Utility Function: Get New all new spatial contributions
array function IndexController::_getNewSpatialContributions ()
_getNewUserRequests():
Utility Function: Admin CMS: get new user requests
boolean function IndexController::_getNewUserRequests ()
_getProfileContributionsData:
158
Utility Function: Get all contributions of the user (temp and accepted)
array function IndexController::_getProfileContributionsData ()
_getProfileData:
Utility Function: Get user profile data
array function IndexController::_getProfileData()
_postReview:
Utility Function : Post CCGIS Evaluation
boolean function IndexController::_postReview($postReview)
Function Parameters:
array $postReview
_processLogin:
Utility Function: Process login
boolean function IndexController::_processLogin($values)
Function Parameters:
array $values
_rejectUserContribution:
Utility Function: Reject user contribution
boolean function IndexController::_rejectUserContribution ($contId, $contSig)
Function Parameters:
159
integer $contId integer $contSig
_saltgen:
Utility Function: Salt generator
random function IndexController::_saltgen()
_setFeatureReputation
Utility Function: Set feature reputation
boolean function IndexController::_setFeatureReputation ($setReputeData)
Function Parameters:
string $setReputeData
_updateProfile:
Utility Function: Update Profile Information
boolean function IndexController::_updateProfile ($postData, $authId)
Function Parameters:
array $postData integer $authId
Class Logging
Package CCGIS.

160
Lopen:
Open Log File
void function Logging::lopen ()
lwrite:
Write to log file
void function Logging::lwrite ($message)
Function Parameters:
string $message
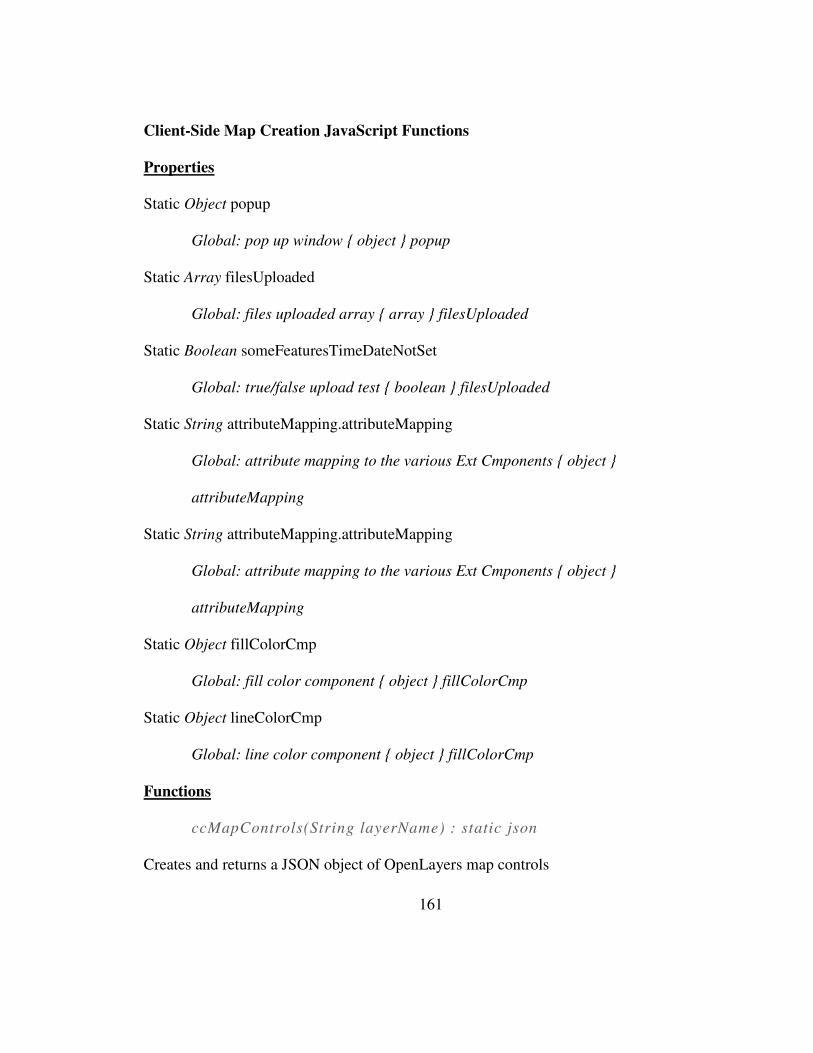
161
Client-Side Map Creation JavaScript Functions
Properties
Static Object popup
Global: pop up window { object } popup
Static Array filesUploaded
Global: files uploaded array { array } filesUploaded
Static Boolean someFeaturesTimeDateNotSet
Global: true/false upload test { boolean } filesUploaded
Static String attributeMapping.attributeMapping
Global: attribute mapping to the various Ext Cmponents { object }
attributeMapping
Static String attributeMapping.attributeMapping
Global: attribute mapping to the various Ext Cmponents { object }
attributeMapping
Static Object fillColorCmp
Global: fill color component { object } fillColorCmp
Static Object lineColorCmp
Global: line color component { object } fillColorCmp
Functions
ccMapControls(String layerName) : static json
Creates and returns a JSON object of OpenLayers map controls
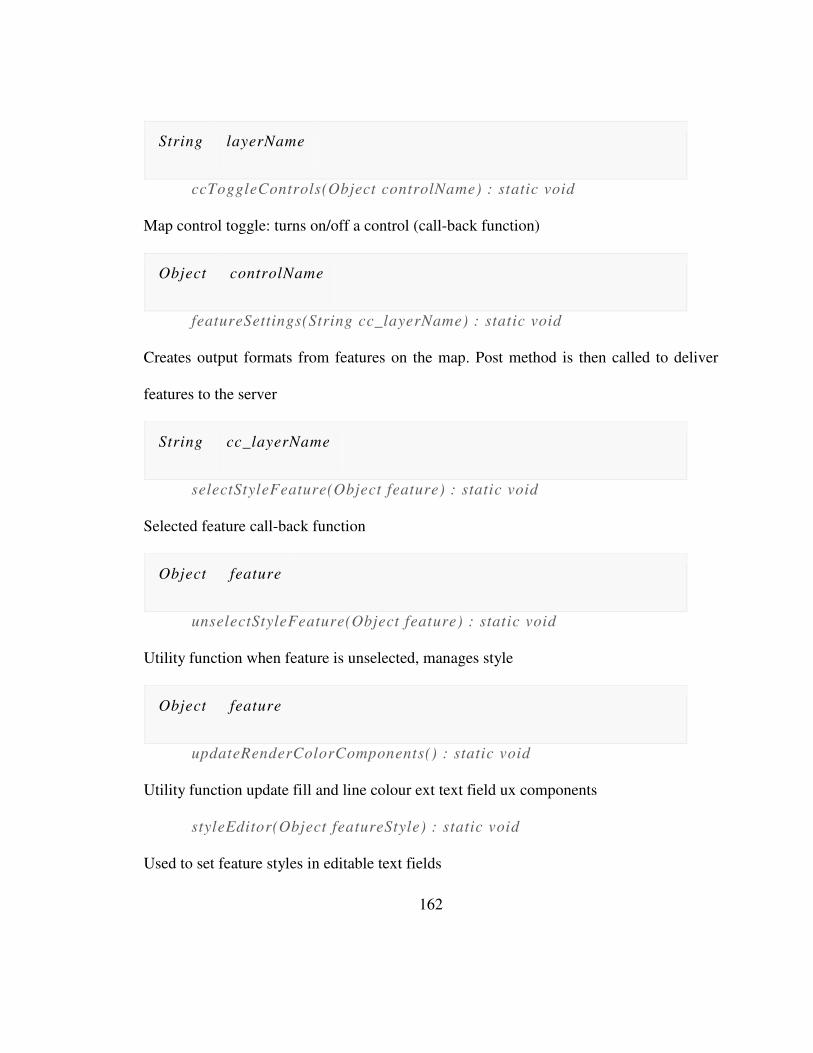
162
String layerName
ccToggleControls(Object controlName) : static void
Map control toggle: turns on/off a control (call-back function)
Object controlName
featureSettings(String cc_layerName) : static void
Creates output formats from features on the map. Post method is then called to deliver
features to the server
String cc_layerName
selectStyleFeature(Object feature) : static void
Selected feature call-back function
Object feature
unselectStyleFeature(Object feature) : static void
Utility function when feature is unselected, manages style
Object feature
updateRenderColorComponents() : static void
Utility function update fill and line colour ext text field ux components
styleEditor(Object featureStyle) : static void
Used to set feature styles in editable text fields
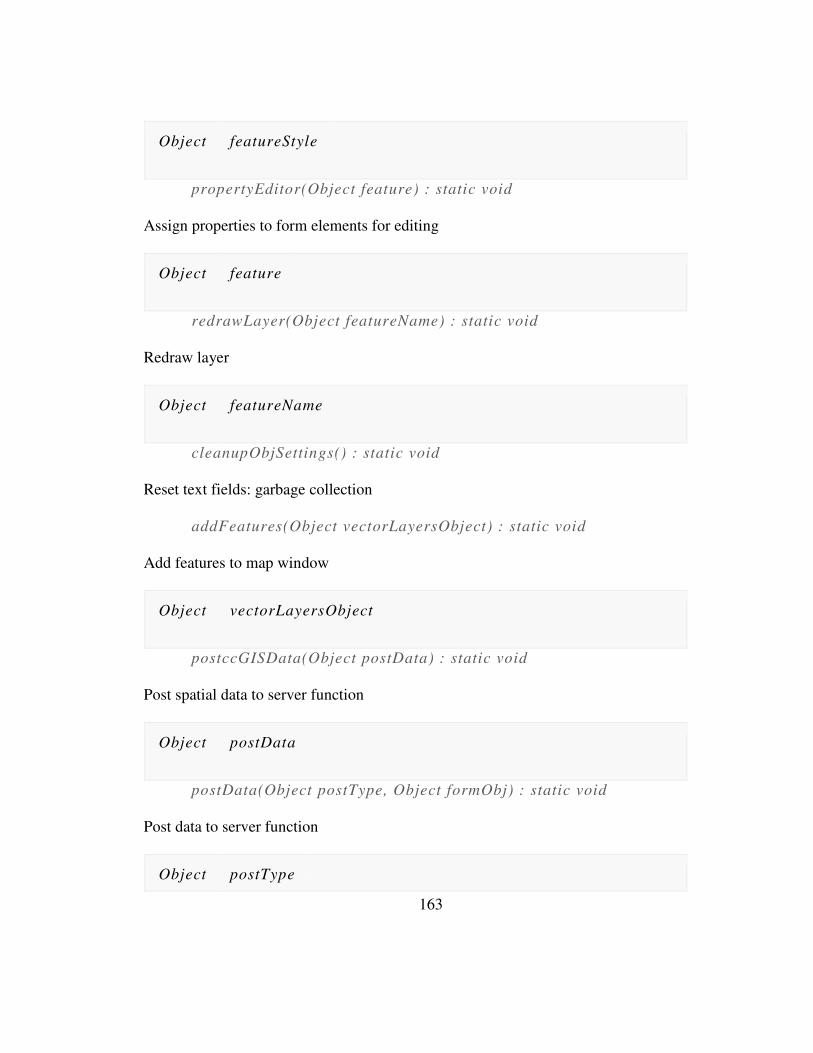
163
Object featureStyle
propertyEditor(Object feature) : static void
Assign properties to form elements for editing
Object feature
redrawLayer(Object featureName) : static void
Redraw layer
Object featureName
cleanupObjSettings() : static void
Reset text fields: garbage collection
addFeatures(Object vectorLayersObject) : static void
Add features to map window
Object vectorLayersObject
postccGISData(Object postData) : static void
Post spatial data to server function
Object postData
postData(Object postType, Object formObj) : static void
Post data to server function
Object postType
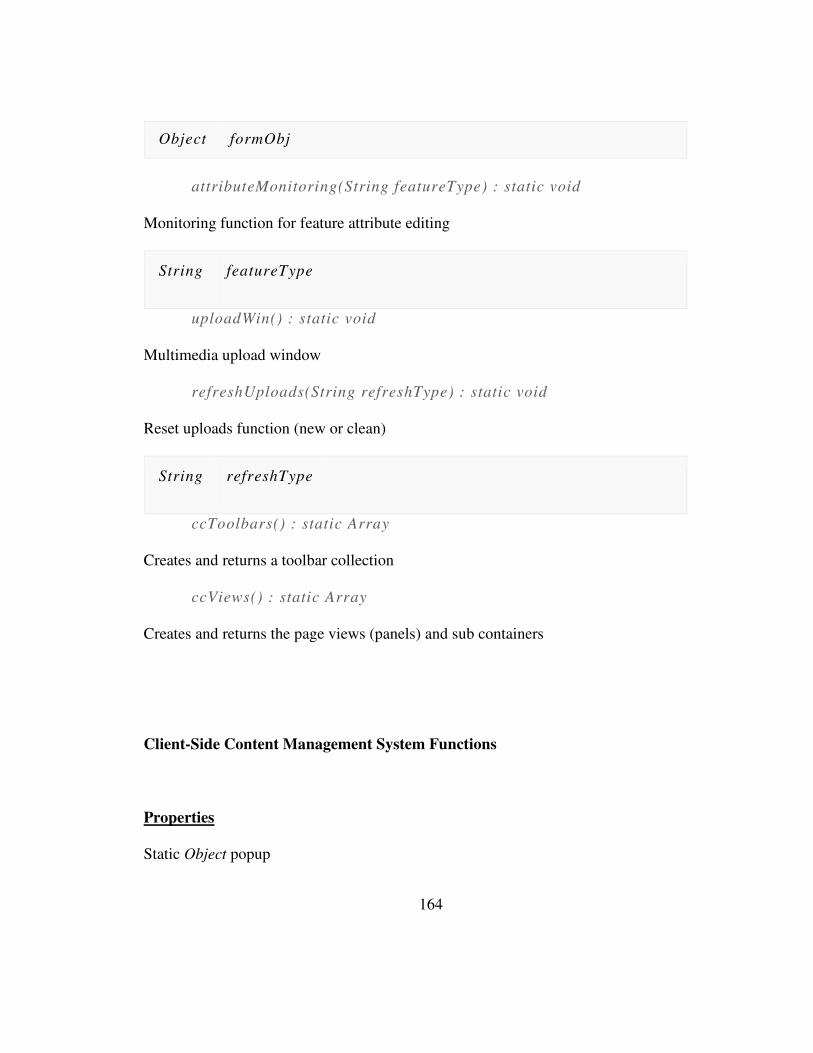
164
Object formObj
attributeMonitoring(String featureType) : static void
Monitoring function for feature attribute editing
String featureType
uploadWin() : static void
Multimedia upload window
refreshUploads(String refreshType) : static void
Reset uploads function (new or clean)
String refreshType
ccToolbars() : static Array
Creates and returns a toolbar collection
ccViews() : static Array
Creates and returns the page views (panels) and sub containers
Client-Side Content Management System Functions
Properties
Static Object popup
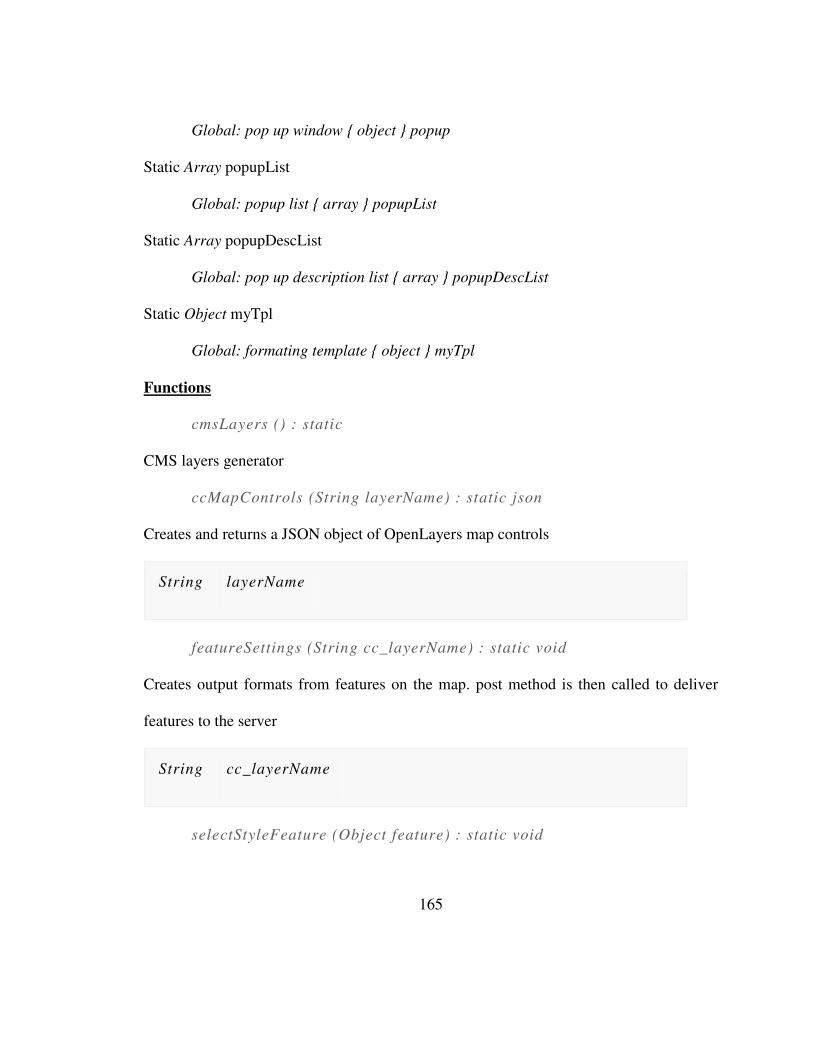
165
Global: pop up window { object } popup
Static Array popupList
Global: popup list { array } popupList
Static Array popupDescList
Global: pop up description list { array } popupDescList
Static Object myTpl
Global: formating template { object } myTpl
Functions
cmsLayers () : static
CMS layers generator
ccMapControls (String layerName) : static json
Creates and returns a JSON object of OpenLayers map controls
String layerName
featureSettings (String cc_layerName) : static void
Creates output formats from features on the map. post method is then called to deliver
features to the server
String cc_layerName
selectStyleFeature (Object feature) : static void
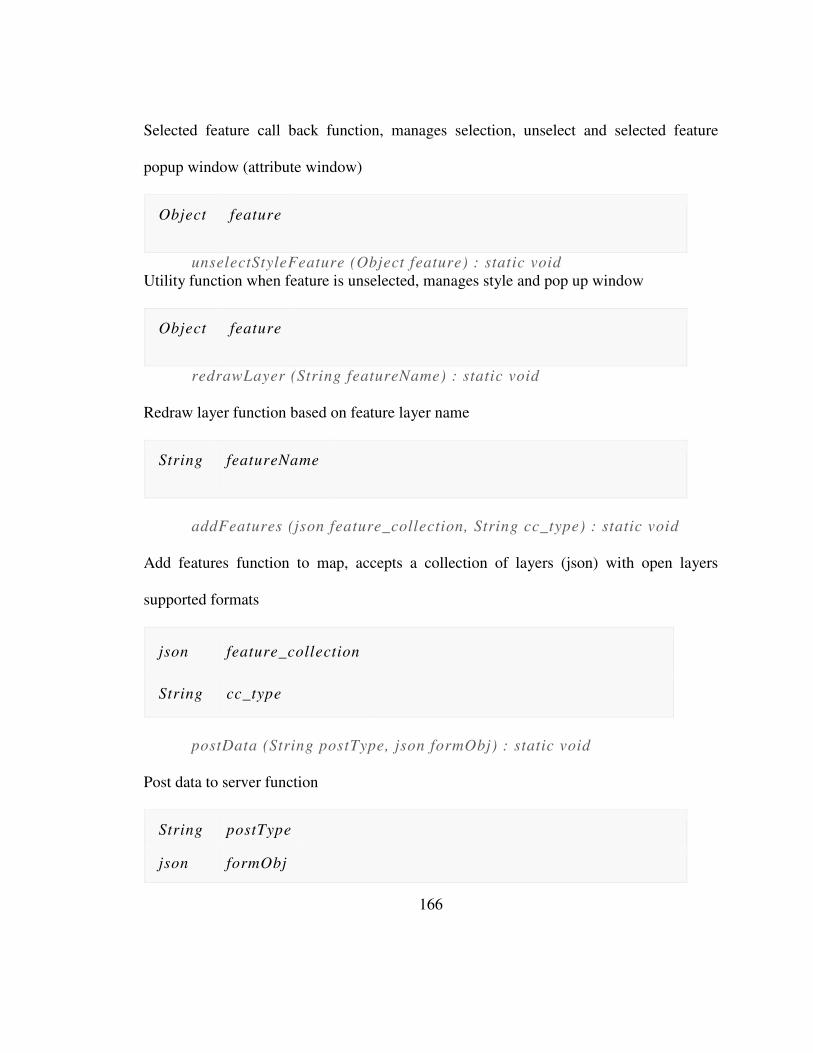
166
Selected feature call back function, manages selection, unselect and selected feature
popup window (attribute window)
Object feature
unselectStyleFeature (Object feature) : static void Utility function when feature is unselected, manages style and pop up window
Object feature
redrawLayer (String featureName) : static void
Redraw layer function based on feature layer name
String featureName
addFeatures (json feature_collection, String cc_type) : static void
Add features function to map, accepts a collection of layers (json) with open layers
supported formats
json feature_collection
String cc_type
postData (String postType, json formObj) : static void
Post data to server function
String postType
json formObj
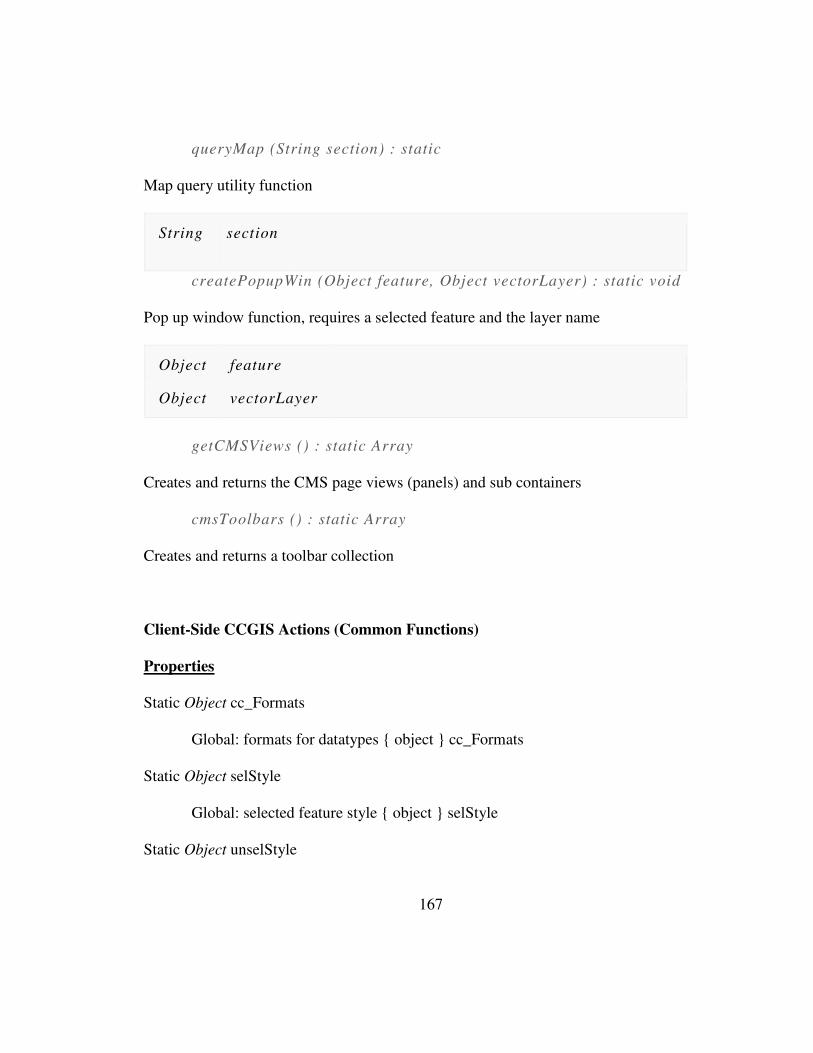
167
queryMap (String section) : static
Map query utility function
String section
createPopupWin (Object feature, Object vectorLayer) : static void
Pop up window function, requires a selected feature and the layer name
Object feature
Object vectorLayer
getCMSViews () : static Array
Creates and returns the CMS page views (panels) and sub containers
cmsToolbars () : static Array
Creates and returns a toolbar collection
Client-Side CCGIS Actions (Common Functions)
Properties
Static Object cc_Formats
Global: formats for datatypes { object } cc_Formats
Static Object selStyle
Global: selected feature style { object } selStyle
Static Object unselStyle
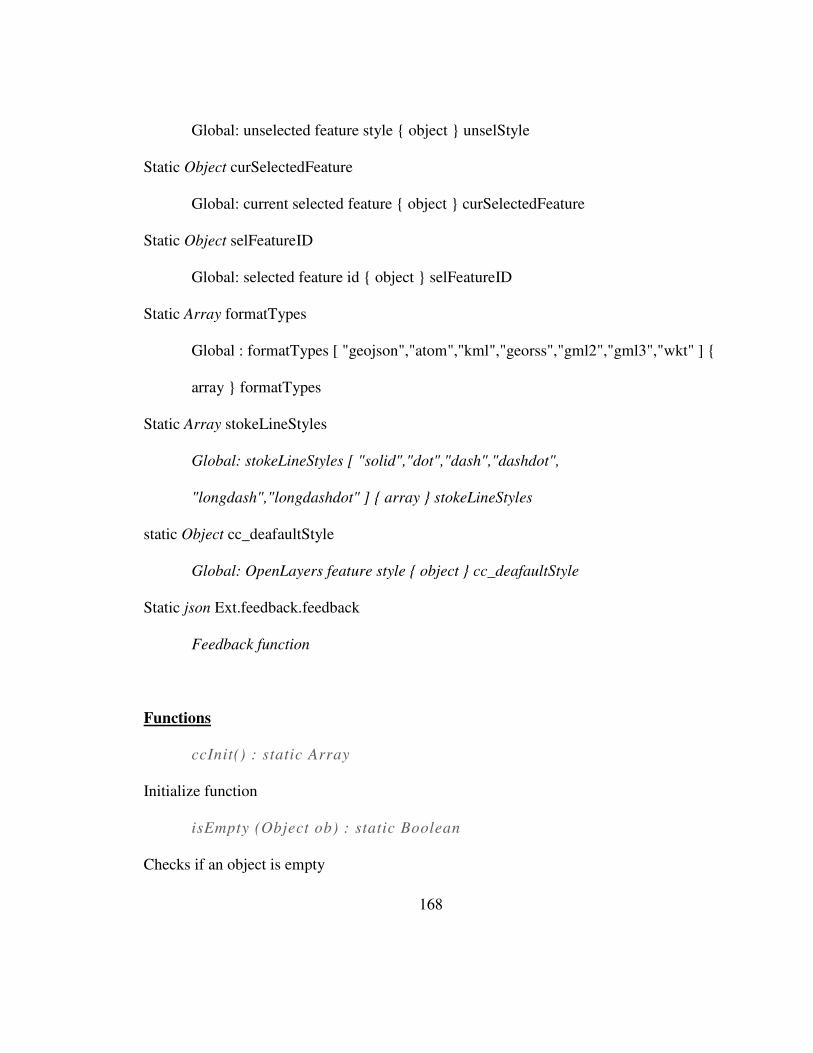
168
Global: unselected feature style { object } unselStyle
Static Object curSelectedFeature
Global: current selected feature { object } curSelectedFeature
Static Object selFeatureID
Global: selected feature id { object } selFeatureID
Static Array formatTypes
Global : formatTypes [ "geojson","atom","kml","georss","gml2","gml3","wkt" ] {
array } formatTypes
Static Array stokeLineStyles
Global: stokeLineStyles [ "solid","dot","dash","dashdot",
"longdash","longdashdot" ] { array } stokeLineStyles
static Object cc_deafaultStyle
Global: OpenLayers feature style { object } cc_deafaultStyle
Static json Ext.feedback.feedback
Feedback function
Functions
ccInit() : static Array
Initialize function
isEmpty (Object ob) : static Boolean
Checks if an object is empty
169
Object ob
getTimeStamp (Object xDate) : static Date
Get the time stamp of a given date
Object xDate
isArray (Object obj) : static Boolean
Check if a feature is an array or object
Object obj
trim (String stringToTrim) : static String
Trim string of white space (left and right)
String stringToTrim
ltrim (String stringToTrim) : static String
Trim string of white space (left)
String stringToTrim
rtrim (String stringToTrim) : static String
Trim string of white space (right)
String stringToTrim
timeStampToDate (Number unix_timestamp) : static Date
Converts UNIX timestamp to date
170
Number unix_timestamp
convertFormat2Object (Object pre_ccOutput, Object cc_type) : static jsonxml
Converts a data (string output and type ) format (JSON and xml) to JavaScript object
Object pre_ccOutput
Object cc_type
getFeatureStyle (Object feature) : static Object
Get selected feature style
Object feature
setFeatureStyle (Object setStyle) : static void
Set selected feature style
Object setStyle
ccLayers (String layerName) : static json
Map Layers generating function
String layerName
waitFeedback (Object msg, Object title) : static
Progress bar animation window
Object msg
Object title
171
cleanFeaturePreviewGlobals () : static void
Clean Global Variables
sliderNavigator () : static void
Slider Navigator
featureAddRemoveNavigation (Number curThumbValue) : static void
Feature cluster navigation add/remove given current index value
Number curThumbValue
removeTrailingFeatures () : static void
Feature cluster remove trailing features add/remove given current index value
featuresInBounds () : static void
Feature cluster: features within the a given bounds
addFeaturesToMap (String layerNames, Array featureArray) : static void
Feature cluster: add features to map
String layerNames
Array featureArray
removeFeaturesFromMap (String layerNames, Array featureArray) : static void
Feature cluster: remove features from map
String layerNames
172
Array featureArray
sliderIndex () : static void
Feature cluster: slider index
_12to24 (Object _12var) : static Number
Feature cluster: converts 12hour time to 24 hour time
Object _12var
sortIndexOfObj (Object o) : static Array
Feature cluster: sort the index of JavaScript object
Object o
quickSortedObjAccess (Array b) : static Object
Feature cluster: quick object sort (input array to object) with additional info
Array b
ccToggleControls (String controlName) : static void
Map control activator (on/off function)
String controlName
zoomToolbar (String arg, Object controlObj) : static void Zoom toolbar callback function
String arg
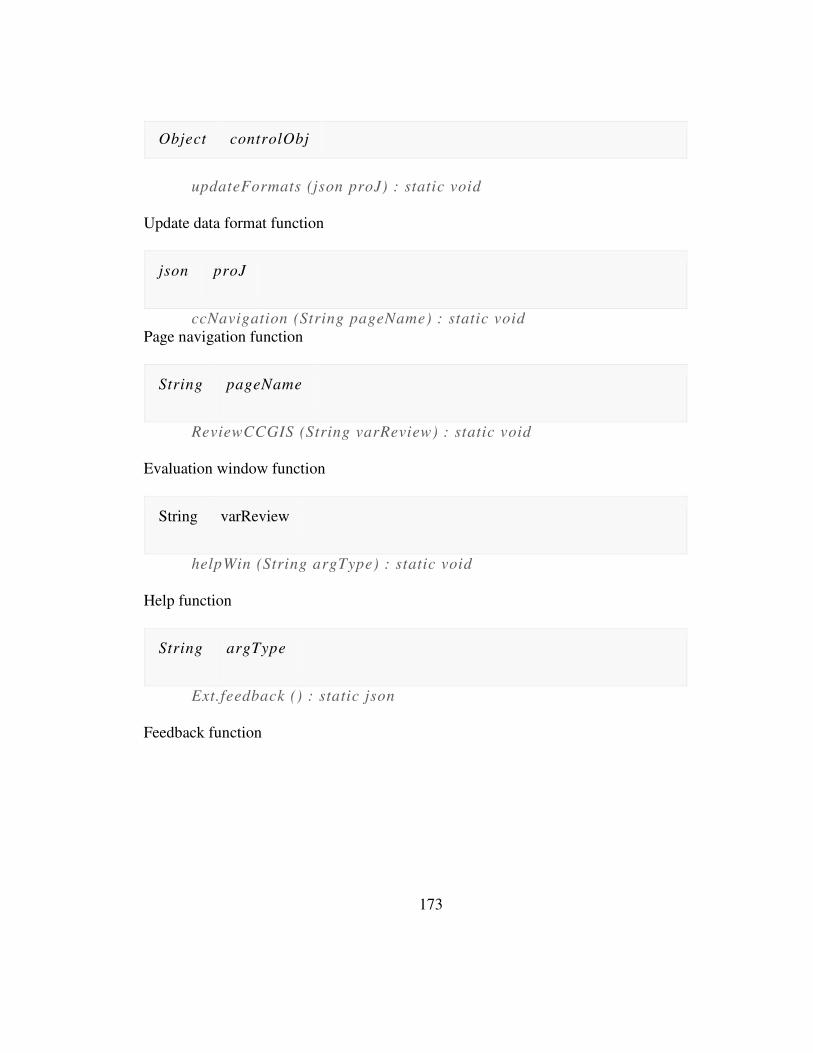
173
Object controlObj
updateFormats (json proJ) : static void
Update data format function
json proJ
ccNavigation (String pageName) : static void Page navigation function
String pageName
ReviewCCGIS (String varReview) : static void
Evaluation window function
String varReview
helpWin (String argType) : static void
Help function
String argType
Ext.feedback () : static json
Feedback function
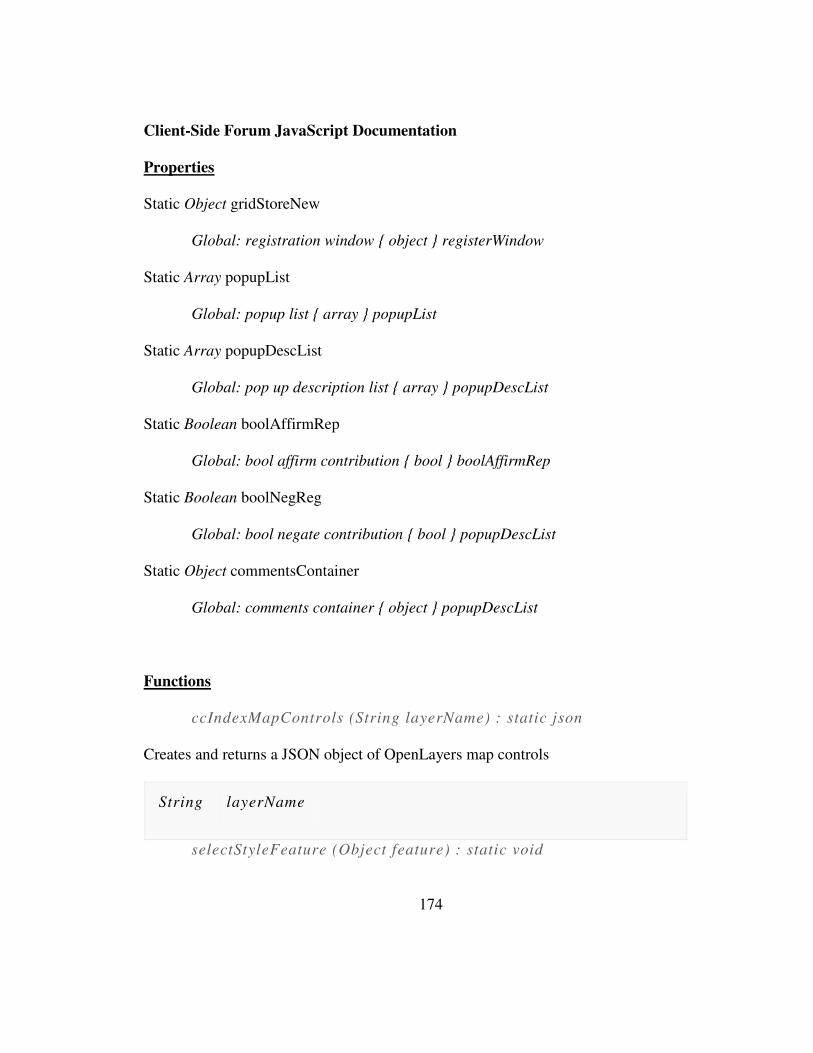
174
Client-Side Forum JavaScript Documentation
Properties
Static Object gridStoreNew
Global: registration window { object } registerWindow
Static Array popupList
Global: popup list { array } popupList
Static Array popupDescList
Global: pop up description list { array } popupDescList
Static Boolean boolAffirmRep
Global: bool affirm contribution { bool } boolAffirmRep
Static Boolean boolNegReg
Global: bool negate contribution { bool } popupDescList
Static Object commentsContainer
Global: comments container { object } popupDescList
Functions
ccIndexMapControls (String layerName) : static json
Creates and returns a JSON object of OpenLayers map controls
String layerName
selectStyleFeature (Object feature) : static void
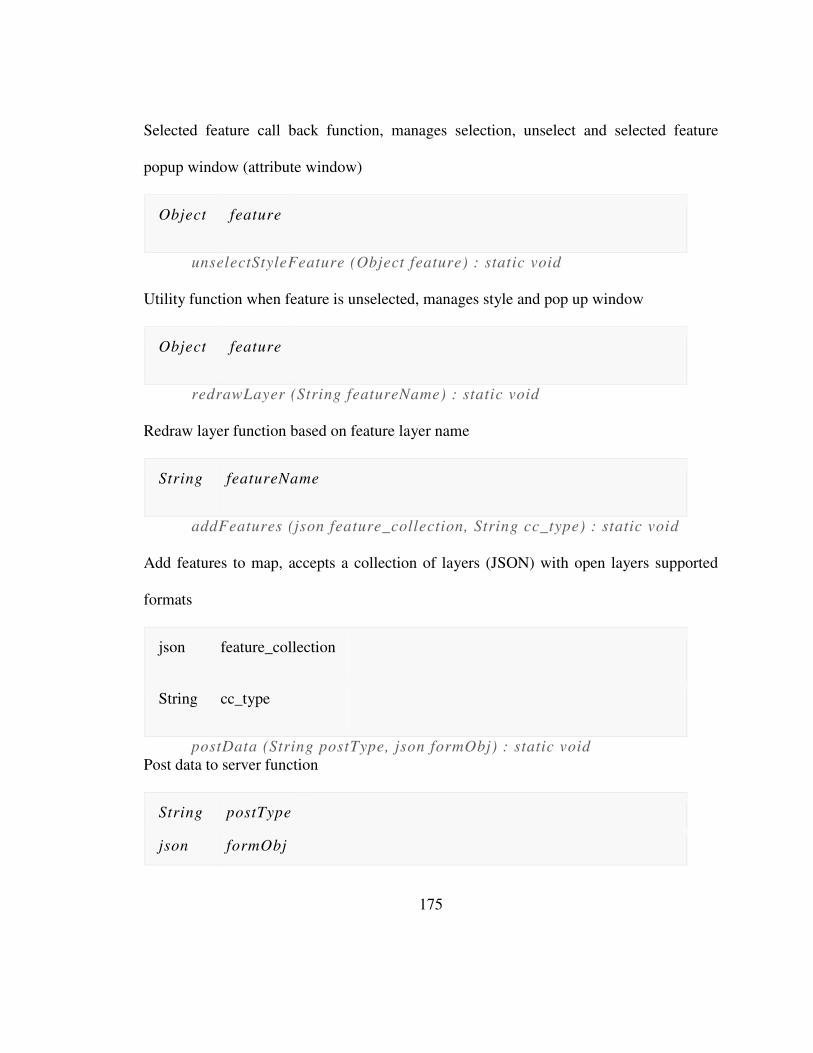
175
Selected feature call back function, manages selection, unselect and selected feature
popup window (attribute window)
Object feature
unselectStyleFeature (Object feature) : static void
Utility function when feature is unselected, manages style and pop up window
Object feature
redrawLayer (String featureName) : static void
Redraw layer function based on feature layer name
String featureName
addFeatures (json feature_collection, String cc_type) : static void
Add features to map, accepts a collection of layers (JSON) with open layers supported
formats
json feature_collection
String cc_type
postData (String postType, json formObj) : static void Post data to server function
String postType
json formObj
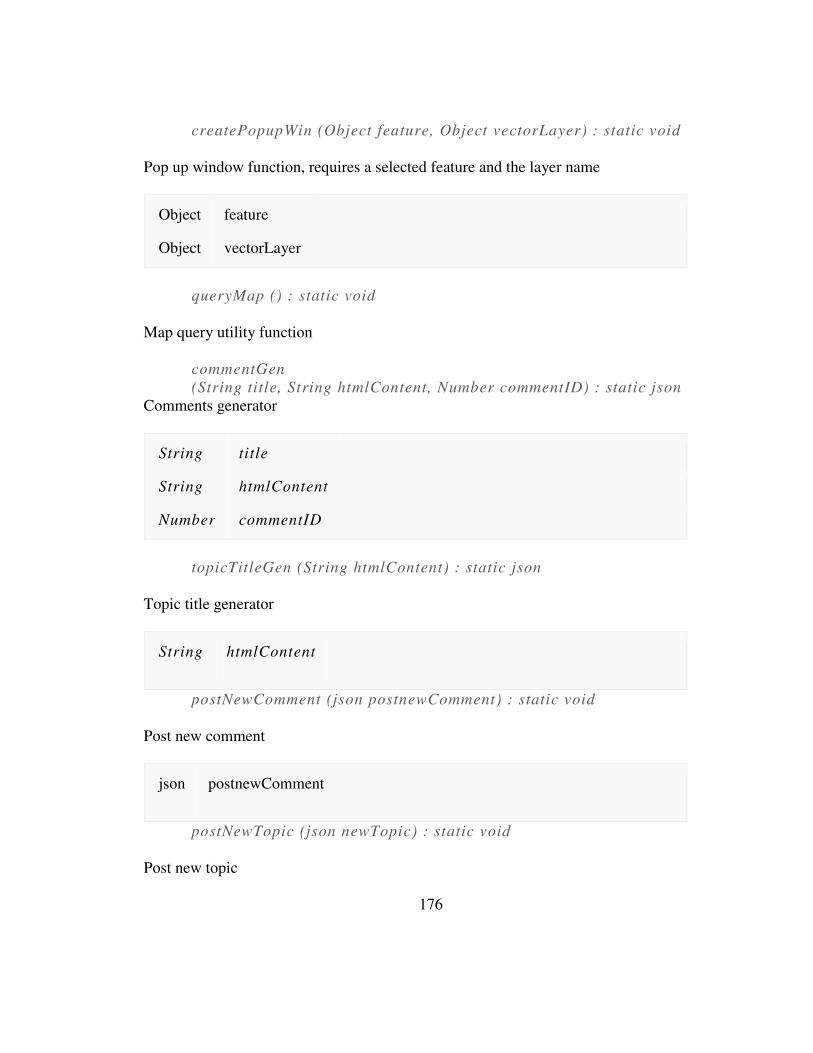
176
createPopupWin (Object feature, Object vectorLayer) : static void
Pop up window function, requires a selected feature and the layer name
Object feature
Object vectorLayer
queryMap () : static void
Map query utility function
commentGen (String title, String htmlContent, Number commentID) : static json
Comments generator
String title
String htmlContent
Number commentID
topicTitleGen (String htmlContent) : static json
Topic title generator
String htmlContent
postNewComment (json postnewComment) : static void
Post new comment
json postnewComment
postNewTopic (json newTopic) : static void
Post new topic
177
json newTopic
reconfigureForumGrid (json local_queryResult) : static
Reconfigure forum grid
json local_queryResult return { void }
utilRepHadles (Object data) : static void
Utility function (enable or disable affirm/negation)
Object data
topic_comment_Gen (Object topicSelectedObject, Object commentsThreadObject): static void
Topic comment generator function
Object topicSelectedObject
Object commentsThreadObject
ccIndexToolbars () : static Array
Creates and returns a toolbar collection
ccViews () : static Array
Creates and returns the forum page views (panels) and sub containers
178
Client Side Homepage JavaScript Documentation
Properties
Static Object loginWindow
Global : login window { object } loginWindow
Static Object registerWindow
Global: registration window { object } registerWindow
static Array popupList
Global : popup list { array } popupList
Static Array popupDescList
Global: pop up description list { array } popupDescList
Functions
ccIndexMapControls (String layerName) : static json
Creates and returns a JSON object of OpenLayers map controls
String layerName
selectStyleFeature (Object feature) : static void
Selected feature call back function, manages selection, unselect and selected feature
popup window (attribute window)
Object feature
unselectStyleFeature (Object feature) : static void
Utility function when feature is unselected, manages style and pop up window
179
Object feature
dialogFunc (String action) : static void
Utility call back function for user login and registration window
String action
userLogin (Object logIn) : static void
Login window function
Object logIn
userRegistration () : static
Registration window function
register: string
returns void
redrawLayer (String featureName) : static void
Redraw layer function based on feature layer name
String featureName
addFeatures (json feature_collection, String cc_type) : static void
Add features to map, accepts a collection of layers (JSON) with open layers supported
formats
json feature_collection
180
String cc_type
postData (String postType, json formObj) : static void
Post data to server function
String postType
json formObj
createPopupWin (Object feature, Object vectorLayer) : static void
Pop up window function, requires a selected feature and the layer name
Object feature
Object vectorLayer
queryMap () : static void
Map query utility function
ccIndexToolbars () : static Array
Creates and returns a toolbar collection
ccViews () : static Array
Creates and returns the index page views (panels) and sub containers
Client-Side Profile Page JavaScript Documentation
Functions
181
ccIndexMapControls (String layerName) : static json
Creates and returns a JSON object of OpenLayers map controls
String layerName
ccIndexMapControls.ccIndexMapControls (String layerName) : static json
Creates and returns a JSON object of OpenLayers map controls
String layerName
postData (String postType, json formObj) : static void
Post data to server function
String postType
json formObj
profileToolBar () : static void
Creates CMS icon if administrator
utilRepHadles (String handleType, Object util_data) : static void
User profile fields handler
String handleType
Object util_data
reconfigureSpatialProfileGrid(String fieldName, Object rootName, Object local_data) : static void
Reconfigure spatial contributions profile grid
182
String fieldName
Object rootName
Object local_data
profileToolbars () : static Array
Creates and returns a toolbar collection
getProfileViews () : static Array
Creates and returns the index page views (panels) and sub containers
183
Appendix IV: Reviewer Comments
Reviewer ID 1
I think this is great application and has a greater potential; what I could do easily is:
Create a vector (polygon, line, point) and input all the required information and change
colour without problem. What I could not do is:
1. I could not upload pictures with different format (jpg, png,bmp) with size less than
20mb. I haven't tested videos though.
2. I could not post a new topic on the forum because to post a topic, I had to choose a
created feature. as soon as navigate out of the" content generation page" to go to the
forum page, i lose the drawn feature. Therefore, I had difficulty to figure that out. i could
not see any posted topic to read. One time, when I submitted the created feature through
"submit map data", the features was gone from the map. That is my notices to the test
results. I hope that is helpful. Thanks,
Reviewer ID 2
I think the application has a nice collection of tools, especially measure area tool which
is very nice. However, I think the application should be more user friendly, some of the
buttons I think are rather difficult to work with such as "add features" button.
I also think the contents tab has a room for improvement. If I draw a feature on the map I
do not see it as sublayer in the contents tab.
184
Reviewer ID 3
Good one there! I think we need a help file to understand the menus. It not so straight
forward what each menu does :) OK, I found out that the "?" is the help :)
Reviewer ID 4
This is awesome, but I guess you can do something about the start up loading of the page.
It is a bit slow.
Reviewer ID 5
It seems to work as expected except that it gets my location wrong. In addition, from a
user interface design point of view, there should not be a logout button if a user has not
logged in yet.
Reviewer ID 6
1. Tooltips of top icons a little difficult to understand: needs some time and practice to
understand what tooltip means and what it does.
2. All contribution details fields are mandatory - too many. Fields don't bear explanation
of what information to give. Tooltip could be used to give extra detail/explanation
3. Couldn't delete a feature
185
4. If clicking on Select feature changes the Cursor icon it will help create a better visual
effect in terms of navigation
Reviewer ID 7
No Comment
Reviewer ID 8
No Comment
Reviewer ID 9
I find it quite innovative and dynamic and user friendly. An amateur user like me finds it
easy to use. I commend the genius behind this creation.
Reviewer ID 10
Pretty good:) Just one comment, is there any way to search a certain place to add a
feature? I cannot find the option. For example if I took some pics in a rural area, but that
place does not have internet, so I have to upload the information once I come back to the
city. Even the software can determine the city; it is not the place where I want to add the
feature.

186
Reviewer ID 11
Perfect idea. However, the files uploads, should the cumulative file size be less than 20 or
less than 20 per upload. I had an error of too big a file size......greater than 2mb when
uploading a second file.
Reviewer ID 12
No Comment
Reviewer ID 13
Nice interface created with tools well incorporated. My only issue was the identification
of location at the time I was interacting with the software. It did not really identify my
location as expected. Hope it helps.
Reviewer ID 14
I add a line as a road in Isle Madame but I tried to give a colour in the contribution
details on right of the page but I could not select the feature to do that. Overall, you did a
great job, thanks
Reviewer ID 15

187
For the Multimedia/video, pictures, Audio question, maybe it’s not fast because of my
computer
Reviewer ID 16
Yey, you did it :) Nice work
Reviewer ID 17
Nice! work. Have some browser issues though
Curriculum Vitae
Candidate’s full name: Titus Tienaah
Universities attended: Kwame Nkrumah University of Science and
Technology, Bachelor of Science, Geomatics
Engineering, June 2007.
Publications: Ayer, J., and Tiennah [sic], T. (2007). “Datum Transformations by Iterative Solution of the Abridging Inverse Molodensky Formulae.” Journal of The Ghana Institution of Engineers Vol. 5, No.1-2, pp. 21-24
Conference Presentations: NIL