Design and Development of Fiber Optic Sensors for Quality Evaluation … · Design and Development...
169
Design and Development of Fiber Optic Sensors for Quality Evaluation of various Liquid and Gaseous Media Thesis submitted to Cochin University of Science and Technology in partial fulfillment of the requirements for the degree of Doctor of Philosophy by LINESH J. INTERNATIONAL SCHOOL OF PHOTONICS COCHIN UNIVERSITY OF SCIENCE AND TECHNOLOGY COCHIN 682022 May 2014
-
Upload
nguyendieu -
Category
Documents
-
view
219 -
download
6
Transcript of Design and Development of Fiber Optic Sensors for Quality Evaluation … · Design and Development...

Design and Development of Fiber Optic Sensors for Quality Evaluation of various Liquid and Gaseous Media
Thesis submitted to
Cochin University of Science and Technology
in partial fulfillment of the requirements
for the degree of
Doctor of Philosophy
by
LINESH J.
INTERNATIONAL SCHOOL OF PHOTONICS
COCHIN UNIVERSITY OF SCIENCE AND TECHNOLOGY
COCHIN 682022
May 2014

DDeessiiggnn aanndd DDeevveellooppmmeenntt ooff FFiibbeerr OOppttiicc SSeennssoorrss ffoorr QQuuaalliittyy EEvvaalluuaattiioonn ooff vvaarriioouuss LLiiqquuiidd aanndd GGaasseeoouuss MMeeddiiaa
Ph.D. Thesis in the field of Photonics
Author
Linesh J. Research Scholar International School of Phonics Cochin University of Science and Technology Kochi - 682022 Email: [email protected]
Research Advisor:
Dr. V P N Nampoori Emeritus Professor, International School of Phonics, Cochin University of Science and Technology, Cochin-682 022, Kerala, India Email: [email protected]
International School of Phonics Cochin University of Science and Technology Kochi - 682022
May 2014

DDeeddiiccaatteedd ttoo MMyy PPaarreennttss,,
aanndd TTeeaacchheerrss


This is to certify that the thesis entitled “Design and Development of
Fiber Optic Sensors for Quality Evaluation of various Liquid and
Gaseous Media” submitted by Mr. Linesh J., is an authentic record of
research work carried out by him under my guidance and supervision in
partial fulfillment of the requirement of the degree of Doctor of Philosophy
of Cochin University of Science and Technology, under the Faculty of
Technology and has not been included in any other thesis submitted
previously for the award of any degree.
Kochi – 682022 Prof. (Dr.) V P N Nampoori 05th May- 2014 (Supervising Guide)


DDeeccllaarraattiioonn
I, Linesh J., do hereby declare that the thesis entitled “Design and
Development of Fiber Optic Sensors for Quality Evaluation of various
Liquid and Gaseous Media” is a genuine record of research work done by me
under the supervision of Prof. V. P. N. Nampoori, Emeritus Professor,
International School of Photonics, Cochin University of Science and
Technology, Kochi–22, India and it has not been included in any other thesis
submitted previously for the award of any degree.
Cochin 682022 05th May- 2014 Linesh J.

List of publications
International Journals:
1. J Linesh, K Sudeesh, P Radhakrishnan V P N Nampoori, “Liquid Level SensorUsing Etched Silica Fiber”, Microwave. Opt. Technol. Lett. 52 (4), 883-885 (2010).
2. J. Linesh, T. M. Libish, M. C. Bobby, P. Radhakrishnan and V. P. N. Nampoori, “Periodically Tapered LPFG for Ethanol Concentration Detection in Ethanol-Gasoline Blend”, Sensors & Transducers Journal, 125 ( 2), 205-212 (2011).
3. J Linesh, K Sudeesh, T M Libish, P Radhakrishnan and V P N Nampoori, “Optical fiber sensor to determine critical mole fractions of alcohol-water binary mixtures”, Proc. of SPIE, 8173, 81731U1-7 (2011)
4. J Linesh, T M Libish, M C Bobby, P Radhakrishnan and V P N Nampoori, “Comparison of Thermal and Refractive index Sensitivity of Symmetric and Antisymmetric modes of Long Period Fiber Gratings, AIP Conf. Proc., 1391, 397-399 (2011)
5. T. M. Libish, J. Linesh, P. Biswas, S. Bandyopadhyay, K. Dasgupta and P. Radhakrishnan, “Fiber Optic Long Period Grating Based Sensor for Coconut Oil Adulteration Detection”, Sensors & Transducers Journal, 114 (3), 102-111 (2010).
6. T. M. Libish, J. Linesh, P. Biswas, S. Bandyopadhyay, K. Dasgupta and P. Radhakrishnan, “Detection and analysis of paraffin oil adulteration in coconut oil using fiber optic long period grating sensor”, Optik, 122, 1939– 1942 (2011).
7. T. M. Libish, J. Linesh, M. C. Bobby, P. Biswas, S. Bandyopadhyay, K. Dasgupta, P. Radhakrishnan, “Fiber optic sensor for the adulteration detection of edible oils”, Optoelectron. Adv. Mater. Rapid Commun., 5 (1), 68-72(2011).
8. T. M. Libish, M. C. Bobby, J.Linesh, P. Biswas, S. Bandyopadhyay, K. Dasgupta, P. Radhakrishnan, “The effect of grating period on refractive index sensitivity of long period gratings written in hydrogen loaded SMF-28 fiber”, J. Optoelectron. Adv. Mater., 13 (5), 491-496 (2011).
9. T. M. Libish, J. Linesh, M. C. Bobby, B. Nithyaja, S. Mathew, C. Pradeep and P. Radhakrishnan, “Glucose Concentration Sensor Based on Long Period Grating Fabricated from Hydrogen Loaded Photosensitive Fiber”, Sensors & Transducers Journal, 129 (6), 142-148 (2011).
10. P.P.Anish, J.Linesh ,T.M.Libish ,S.Mathew ,P.Radhakrishnan, “Design and development of diaphragm based EFPI pressure sensor”, Proc. of SPIE, 8173, 81731V1-6 (2011).
11. Dibin Mary George, J Linesh and P Radhakrishnan, “Design and Simulation of a Polymer Planar-Lightwave- Circuit Type 1X 32 Optical Power Splitter”, AIP Conf. Proc., 1391, 467-469 (2011).

12. Libish T. M., Bobby M. C., Linesh, J., Nampoori, V. P. N., Radhakrishnan P, “Experimental analysis on the response of long period grating to refractive indices higher and lower than that of fiber cladding”, Microwave. Opt. Technol. Lett, 54 (10), 2356-2360 (2012).
13. T M Libish, M C Bobby, J Linesh, S Mathew, C Pradeep, V P N Nampoori, P Biswas, S Bandyopadhyay, K Dasguptaand P Radhakrishnan, “Detection of adulteration in virgin olive oil using a fiber optic long period grating based sensor”, Laser Phys. 23, 045112 (2013).
International Conference:
1. J Linesh, K Sudeesh, A V Arun Babu, P K Shabeeb, V P N Nampoori, “Imaging Of Corrugated Surface Using Tapered Optical Fiber”, International Conference on Fiber Optics and Photonics (PHOTONICS-2008), Dec 2008, IIT Delhi.
2. J Linesh, K Sudeesh, T M Libish, P Radhakrishnan and V P N Nampoori, “Optical Fiber Sensor to Determine Critical Mole Fractions Of Alcohol-Water Binary Mixtures”, International Conference on Fiber Optics and Photonics (PHOTONICS-2010), Dec 2010, IIT Guwahati..
3. J Linesh, T M Libish, P Radhakrishnan and V P N Nampoori, “LPFG Based Sensor to Monitor Ethanol Concentration in Ethanol Petrol Blend”, International Conference on Fiber Optics and Photonics (PHOTONICS-2010), Dec 2010, IIT Guwahati..
4. J Linesh, T M Libish, P. Biswas, S. Bandyopadhyay, K. Dasgupta, P. Radhakrishnan and V P N Nampoori, “Effect Of Etching on the Refractive Index and Temperature Sensitivity of a Fiber Bragg Grating”, International Conference on Fiber Optics and Photonics (PHOTONICS-2010), Dec 2010, IIT Guwahati.
5. J Linesh, Dibin M G, T M Libish, Bobby M, P Radhakrishnan and V P N Nampoori, “Optical Fiber Sensor to Determine Critical Micelle Concentration of Binary Mixtures of tert -Butyl Alcohol and Water”, International Conference on Contemporary Trends in Optics and Optoelectronics, Jan 2011, IIST Thiruvananthapuram.
6. J Linesh, T M Libish, Bobby Mathews, P Radhakrishnan and V P N Nampoori, “Comparison of CO2 and UV Inscribed LPFG for Ethanol Concentration Detection in Ethanol Blended Petrol”, International Conference on Contemporary Trends in Optics and Optoelectronics, Jan 2011, IIST Thiruvananthapuram.
7. J Linesh, T M Libish, M C Bobby, P Radhakrishnan and V P N Nampoori, “Comparison of Thermal and Refractive index Sensitivity of Symmetric and Antisymmetric modes of Long Period Fiber Gratings”, Proceedings of International Conference on Light (optics'11), NIT Calicut, India, May 23-25, 2011.

8. A.V. Suresh Kumar, J. Linesh, P.P. Anish, K.M. Shafi and P. Radhakrishnan, All Silica EFPI Fiber Sensor for Temperature Measurement”, International Conference on Sensors and Related Networks (SENNET'09), Dec 2009, VIT University, Vellore.
9. Anish P P, J Linesh, T M Libish, S Mathew and P Radhakrishnan , “Design andDevelopment of Diaphragm-Based EFPI Pressure Sensor”, International Conference on Fiber Optics and Photonics (PHOTONICS-2010).
10. T.M.Libish, J.Linesh, P.P.Anish, P.Biswas, S.Bandyopadhyay, K.Dasgupta
and P.Radhakrishnan, “Adulteration Detection Of Coconut Oil Using Long Period Fiber Grating”, International Conference on Fiber Optics and Photonics (PHOTONICS-2010), Dec 2010, IIT Guwahati.
11. T M Libish, J Linesh, Bobby Mathews, C.Pradeep and P Radhakrishnan, “Fiber optic sensor for the adulteration detection of edible oils”, International Conference on Contemporary Trends in Optics and Optoelectronics, Jan 2011, IIST Thiruvananthapuram.
12. Dibin Mary George, J Linesh and P Radhakrishnan, “Design and simulation of a Polymer Planar-Lightwave-Circuit Type 1× 32 Optical power splitter”, Proceedings of International Conference on Light (optics'11), NIT Calicut, India, May 23-25, 2011.
13. Bobby Mathews C, T. M. Libish, J. Linesh, P. Biswas, S. Bandyopadhyay, K. Dasgupta, P.Radhakrishnan, “A Long Period Grating based Biosensor for the Detection and Estimation of Cholesterol”, International Conference on Fiber Optics and Photonics (Photonics 2012), IIT Madras, India, 2012
National Conference:
1. J.Linesh, V.K.Jayasree, K.S.Beena, V.P.N.Nampoori, “Optic Fiber based Sensor to study Clay Consolidation” DAE- BRNS National Laser Symposium (NLS)-2007, Dec 2007, MS University Baroda.
2. J Linesh, K Sudeesh, S. Mathew, V P N Nampoori, “A Fiber optic probe to studyproperties of binary liquid mixtures”, DAE- BRNS National Laser Symposium (NLS)-2009, Jan 2010, BARC, Mumbai.
3. J Linesh, K J Thomas, K Sudeesh, V P N Nampoori, “Fiber Optic Temperature sensor based on Periodically tapered long period grating”, DAE- BRNS National Laser Symposium (NLS)-2009, Jan 2010, BARC, Mumbai.
4. J Linesh, T M Libish, P Radhakrishnan and V P N Nampoori, “Comparative Study of Long-Period Gratings Written Using an Electric Arc and CO2 Irradiation for Ethanol Concentration Detection in Petrol”, DAE- BRNS National Laser Symposium (NLS)-2010, Dec 2010, RRCAT, Indore.
5. J Linesh, T M Libish, Bobby Mathews, P Radhakrishnan and V P N Nampoori, “Fiber Optic Sensor for Adulteration Detection in Ethanol

Blended Petrol”, 20th Swadeshi Science Congress, Nov 6-8, 2010, Central Marine Fisheries Research Institute (CMFRI), Kochi.
6. J Linesh, M C Bobby, T M Libish, P Radhakrishnan and V P N Nampoori, “Fiber Optic Alcometer Using Pva/Chitosan Polymer Blend”, XXXVI OSI Symposium on Frontiers in Optics and Photonics (FOP11), December 3-5, 2011, IIT Delhi
7. J Linesh, Bejoy Varghese, T M Libish, M C Bobby, P Radhakrishnan and V P N Nampoori, “Fiber optic humidity sensor based on TiO2 blended PVA coating”, DAE-BRNS National Laser Symposium (NLS-21)-2012, February 6-9, 2013, BARC Mumbai.
8. J Linesh, T M Libish, M C Bobby, P Radhakrishnan and V P N Nampoori, “Fiber Optic Alcometer using TiO2 blended Chitosan/PVA polymer composite”, XXXVII National Symposium of Optical Society of India, 23-25 Jan 2013, Pondicherry University, Puducherry
9. J Linesh, T M Libish, M C Bobby, P Radhakrishnan and V P N Nampoori, “Fiber Optic Alcometer using TiO2 blended Chitosan/PVA polymer composite” 22 nd Swadeshi Science Congress, Nov 6-8 2012, Central Plantation Corps Research Institute (CPCRI), Kasargod
10. S P Sithara, Lyjo K Joseph, J Linesh, B Nithyaja, P Radhakrishnan, V P N Nampoori, “Thermal Characterization Of Ba3dyta3o12 Ceramic By Photoacoustic Technique”, DAE- BRNS National Laser Symposium (NLS)-2008, Jan 2009, Laser Science and Technology Center (LASTEC), Delhi.
11. Mathew S, Linesh. J, Arif P. Ahamed,V P N Nampoori , C P Girijavallabhan, “Effect of doping of Manganese on spectral properties of ZnS nanoparticles”, DAE- BRNS National Laser Symposium (NLS)-2009, Jan 2010, BARC, Mumbai.
12. Lyjo K. Joseph, K. R. Dayas, J. Linesh, V. P. N. Nampoori ,P. Radhakrishnan, “Thermal diffusivity measurement using photothermal technique- Fractal approach”, DAE- BRNS National Laser Symposium (NLS)-2009, Jan 2010, BARC, Mumbai.
13. Lyjo K. Joseph, K. Sudeesh, M. N. Muralidharan, J. Linesh, V. P. N. Nampoori, P. Radhakrishnan, “Thermal characterization of rare earth doped sol gel glasses using photoacoustic method”, DAE- BRNS National Laser Symposium (NLS)-2009, Jan 2010, BARC, Mumbai.
14. P P Anish, J Linesh, T M Libish, Bejoy Varghese and P Radhakrishnan, “A Metal Diaphragm Based Fiber Optic EFPI Temperature Sensor”, DAE- BRNS National Laser Symposium (NLS)-2010, Dec 2010, RRCAT, Indore.
15. T.M.Libish, J.Linesh, P.P.Anish, S Mathew, V P Nampoori and P.Radhakrishnan, “ Fiber Optic Sensor for Detection of Adulteration in Sunflower Oil”, DAE- BRNS National Laser Symposium (NLS)-2010, Dec 2010, RRCAT, Indore.

I wish to place on record my sincere and heartfelt thanks to my supervising guide
Prof. V P N Nampoori, Professor Emeritus, International School of Photonics,
CUSAT, Cochin-22, for his invaluable guidance, precious suggestions, critical
assessment and constant encouragement which culminated in this thesis. His
unwavering support throughout the research period as well as his pain-staking effort in
reviewing the thesis is greatly appreciated.
I would like to express my sincere gratitude to Prof. P Radhakrishnan, Professor,
International School of Photonics, CUSAT, Cochin-22, for his suggestions,
encouragement and moral support during the years of my PhD.
My sincere thanks goes to Prof. C P G Vallabhan, Prof. V M Nandakumaran,
Dr. Kailasnath, Dr. Sheenu Thomas and all other teachers of both ISP and CELOS for
the support provided during the tenure of the research programme.
I would like to place on record my immense gratitude and appreciation to Mr.
Libish T M, Mr. Sudeesh K, Mr. Bejoy Varghese, Mr. Mathew S, Dr. Lyjo K Joseph,
Dr. Manu P. John, Dr. Rajesh S, Mr. Thomas K J, Dr. Sony T George, Mr. Bobby
Mathews, Mr. Pradeep Chandran, Ms Dibin Mary George and other colleagues for
infusing their constant motivation and support during the entire period of this work.
The helpful suggestions and assistance extended by all the office staff, librarian
and my fellow researchers at the International School of Photonics are gratefully
acknowledged.
I would like to mention that this thesis would not have been possible without the
continuous support and love of my father Sri. Janardanan M K and Mother Smt.
Thankamani K N. I profusely thank my sister for all her kindness, and encouragement.
Finally I wish to offer my regards to all the unmentioned people, who supported
me in any respect during the completion of my thesis.
Linesh J

Preface
Adulteration refers to mixing other matter of an inferior and
sometimes harmful quality with a superior one of the same kind.
Adulteration can be categorized into two separate groups namely, incidental
and intentional adulteration. Incidental adulteration occurs when foreign
substances are added due to ignorance, negligence or improper facilities.
Intentional adulteration, better known as economic adulteration, involves the
deliberate addition of inferior materials to enhance appearance qualities and
value for economical gain. Incidental and intentional adulteration of air, food
and fuel are common in every society and to check the adulteration
effectively, it is necessary to monitor the quality at the distribution point
itself. The equipment for this purpose should be inexpensive, portable and
easy to use while the measurement method should be quick and capable of
providing test result within a very short time. Fiber optic sensors are an ideal
choice for quality evaluation due to their well-known characteristics such as
compactness, high sensitivity, in situ measurements, and immunity to
external electromagnetic interference.
Fiber optic sensors of various configurations like intrinsic, extrinsic,
intensity modulated, grating based, Fabry Perot cavity based etc were
successfully developed by various authors for quality evaluation of different
substances. This work aims at the design and fabrication of fiber optic
sensors for checking the quality of liquid media like alcohol water mixture
and ethanol blended petrol. The amount of humidity in ambient air is an
important parameter to be measured and the development of fiber optic
sensor for measuring the quality of air is reported. The thesis is divided into
six chapters as follows
Chapter 1 gives a brief introduction to fiber optic sensors. Various
techniques used for the fabrication of fiber optic sensors, a brief review of
their applications and latest developments in the field are discussed.
Chapter 2 is devoted to the design and development of an extrinsic
fiber optic sensor for determining quality of alcohol water mixtures. The
fabrication and principle of operation of the etched silica fiber probe is
explained. The sensor works on the principle of formation of Hydrogen
bonding network created between alcohol and water molecules in the
mixture. Different binary mixtures of alcohols like methanol-water, ethanol-
water, 2-propanol-water and tert-butyl alcohol-water mixtures were studied
and analyzed. The critical alcohol mole fractions obtained using the fiber
optic probe for methanol, ethanol, 2-propanol and tert-butanol agrees well
with literature values. Aqueous solutions of alcohols have found widespread
use in several sectors like beverage industries, personal care products, food
additives and chemical industries. The designed sensor can be effectively
used to detect concentration of alcohols in their binary mixture with water.
Since extrinsic modulation is used, the fiber sensor has its own
disadvantages and such problems can be improved by using a wavelength
modulated sensor like long period fiber gratings. The next chapter describes
the fabrication of long period fiber gratings.
Chapter 3 discusses the basic theory related to long-period fiber
gratings and the different mechanisms involved in the formation of thermal
induced gratings. The fabrication of asymmetric long period fiber gratings
(LPFG) in SMF 28 using fusion splicer and CO2 laser is then elaborated
along with the possible mechanisms of grating formation. The refractive
index and temperature sensitivities of the fabricated LPFG’s is shown in the
chapter and are compared with that of a standard UV fabricated LPFG. The
temperature response shown by the arc induced periodically tapered LPFG’s

indicates that it can be used as temperature insensitive refractive index
sensor. Moreover for many telecommunications applications spectral
stability is of prime importance, and an LPFG with temperature insensitive
attenuation band is an attractive feature.
Chapter 4 is devoted to the application of fabricated LPFG’s in
determining the quality of ethanol blended petrol. The basic theory related to
the refractive index sensitivity of long-period fiber gratings is presented
along with the response of the fabricated LPFG’s namely UV, electric arc
and CO2 induced long period fiber gratings towards ambient refractive
indices. Besides being insensitive to temperature, the arc induced LPFG
shows better sensitivity among the three LPFG’s in determining purity of
ethanol blended petrol. The bare LPFG has limitations in sensing different
parameters and the use of suitable coating materials can further diversify its
application area.
Chapter 5 discusses the development of suitable polymer coatings
for fiber optic hygrometer. The design and fabrication of fiber optic humidity
sensors using polymers like poly vinyl alcohol and chitosan blended poly
vinyl alcohol as hygrosensitive coatings are explained. The hygroscopic
properties of PVA, chitosan and TiO2 are discussed and the preparation
polymer coatings are explained. Blending of chitosan in PVA helps to
improve its mechanical strength and the available hydrophilic head groups
per unit volume. Blending of titanium dioxide too increases hydrophilic
heads and the humidity sensitivity of TiO2 blended chitosan/PVA coating
and TiO2 blended pure PVA coating is discussed.
Finally the general conclusions and future work is presented in
Chapter 6


CONTENTS Chapter I
Introduction to fiber Optic Sensors .......................................................... 1
1.1 Introduction ....................................................................................... 1
1.2. Optical Fiber ..................................................................................... 3
1.2.1 Mechanism of Light Guidance and Fiber Modes ......................... 4
1.2.2 Weakly guiding approximation and Linearly Polarized (LP) modes .................................................................................................11
1.2.3. Single mode fiber and Normalized frequency ............................12
1.3. Fiber Optic Sensors ..........................................................................13
1.3.1 Intensity modulated Fiber Optic Sensors ....................................14
1.3.2. Wavelength Modulated Fiber Optic Sensors ..............................16
1.3.2.1. Fluorescence sensors ..........................................................16
1.3.2.2. Fiber Gratings ....................................................................16
1.3.3. Phase Modulated Fiber Optic Sensors .......................................20
1.3.4. Polarization Modulated Fiber Optic Sensors ..............................21
1.4 Fiber Optic Sensors in Quality evaluation .........................................21
Conclusions ............................................................................................24
References ..............................................................................................24
Chapter II
Fiber optic sensor for determining the quality of
alcohol-water mixtures .............................................................................36
2.1 Introduction ......................................................................................36
2.2 Fabrication of fiber probe..................................................................39
2.3 Theory ..............................................................................................40
2.4 Simulation studies .............................................................................41
2.5 Experimental ....................................................................................46
2.6 Results and Discussions ....................................................................47
Conclusions ............................................................................................57

References ..............................................................................................57
Chapter III
Fabrication of asymmetric LPFGs using electrical arc and CO2 laser...64
3.1 Introduction ......................................................................................64
3.2 Mechanism of LPFG formation.........................................................66
3.2.1 UV LPFG...................................................................................66
3.2.2 Thermal induced Gratings ..........................................................67
3.2.2.1 Residual stress relaxation ....................................................67
3.2.2.2 Glass structure changes .......................................................68
3.2.2.3 Physical deformation ...........................................................69
3.2.2.4 Dopant diffusion..................................................................70
3.3 Theory of long period fiber gratings ..................................................70
3.4 Fabrication of Periodically tapered LPFG using fusion splicer ..........74
3.4.1 Origin of Asymmetry .................................................................77
3.5 Fabrication of LPFG using CO2 laser ................................................78
3.5.1 Origin of Asymmetry .................................................................81
3.6 Temperature sensitivity of LPFG ......................................................81
Conclusions ............................................................................................88
References ..............................................................................................89
Chapter IV
Fiber optic sensor for the quality evaluation of ethanol blended petrol .97
4.1 Introduction ......................................................................................97
4.2 Refractive index sensitivity ............................................................. 100
4.3 Determination of refractive index sensitivity ................................... 103
4.4 Ethanol concentration in petrol ....................................................... 109
Conclusions .......................................................................................... 112
References ............................................................................................ 113
Chapter V
Fiber optic sensor for determining relative
humidity of the environment .................................................................. 116

5.1 Introduction .................................................................................... 116
5.2 Chitosan and PVA .......................................................................... 122
5.3 Experimental .................................................................................. 124
5.3 Theory ............................................................................................ 129
5.4 Results and Discussion ................................................................... 131
Conclusions .......................................................................................... 141
References ............................................................................................ 141
Chapter VI
Conclusions and Future Prospects ......................................................... 146

Chapter I
Introduction to Fiber Optic Sensors
1.1 Introduction
An optical fiber is defined as a flexible optically transparent
fiber, usually made of glass or plastic, through which light can be transmitted
by successive internal reflections. The history of light guidance starts with
the experiment by Daniel Colladon and Jacques Babinet in 1841 [1]. In their
experiment they demonstrated that a jet of water can guide light waves
through it. John Tyndall included a demonstration of it in his public lectures
and also wrote about the property of total internal reflection in an
introductory book about the nature of light in 1870. During the early half of
20th century, experiments were carried out using bent glass rod to guide light
but leakage of optical power was the hurdle. The solution to this problem
was solved by Brian O’Brien, Haay Hopkins and Narinder Kapany in 1950
by proposing a lower refractive index coating termed as cladding to the
waveguide [1]. The serious problem faced during that period was related to
the absorption of light by glass and the attenuation in glass fibers was around
1000 dB/Km.
In 1965 Charles K Kao and George Hockham concluded that the loss
in optical fibers is merely due to absorption by impurities and the
fundamental limitation for glass light attenuation is below 20 dB/km, which
is a key threshold value for optical communications [2]. This conclusion
opened an intense race to find low-loss materials and suitable fibers for
reaching such criteria which laid the groundwork for high-speed data
communication in the Information Age. In 2009 The Royal Swedish
Academy of Sciences awarded the Nobel Prize in Physics to Charles K Kao
"for groundbreaking achievements concerning the transmission of light in
fibers for optical communication"[3]. The fiber loss gradually got reduced
and in 1970 Corning introduced the 20 dB/Km loss fiber making the optical
fibers usable for communication purpose. The first generation optical
communication used 850 nm light with a loss of 22dB/Km which then
migrated to second generation where 1310 nm was used with 0.5dB/Km loss.
Now we are in the third generation fiber optic communication where 1550

Introduction to Fiber Optic Sensors
2
nm wavelength is used with loss in the range of 0.2 dB/Km, which is close to
the theoretical limit based on Rayleigh scattering in an amorphous glass
material [4]. Optical fibers provide unmatched transmission bandwidth, but
light propagates 31% slower in a silica glass fiber than in vacuum. Wide-
bandwidth signal transmission with low latency is emerging as a key
requirement in a number of applications, including the development of future
exascale supercomputers, financial algorithmic trading and cloud computing.
The research today is focused on the development of hollow-core photonic-
bandgap fibers which can significantly reduce fiber latency due to air
guidance. Recently a fundamentally improved hollow-core photonic-
bandgap fiber that provides a loss of 3.5 dB km−1 with a wide bandwidth of
160 nm was reported to transmit 37 × 40 Gbit s−1 channels at a 1.54 µs
km−1 faster speed than a conventional fiber [5].
The field of fiber optic technologies has undergone tremendous
growth and advancement and has revolutionized the telecommunications
industry by providing high performance and reliable telecommunication
links. The costs of laser diodes and optical fibers have drastically reduced
along with the evolution of the technology. In parallel with these
developments, fiber optic sensor [6-10] technology has undergone
tremendous growth using the technologies associated with the optoelectronic
and fiber optic communications industry. Over the past decades fiber optic
sensors for the measurement of strain [11], temperature [12], pressure [13],
velocity [14,15], magnetic field [16], electric current [17], acoustic signal
[18] chemical and biological parameters[19-22]etc. have been reported.
Though fiber optic sensors excel in performance, they face the problem of
competing with the well-established conventional sensor technologies which
provide adequate and reliable performance at low cost. However they have
found excellent applications in harsh environment defined by high
temperature, high pressure, corrosive/erosive, and strong electromagnetic
interference, where conventional electronic sensors do not have a chance to
survive. In some applications the ability to efficiently multiplex fiber sensors
may be the criterion used to select fiber sensors over other technologies.
Fiber Optic sensors have inherent advantages such as immunity to
electromagnetic interference (EMI), lightweight, small size, high sensitivity,
multiplexing capability and large bandwidth over other technologies. Due to
these inherent advantages fiber optic sensors have an edge over electronic

Introduction to Fiber Optic Sensors
3
sensors and various ideas have been proposed and various techniques have
been developed for various measurands and applications. A vide variety of
sensors were reported during the past decades for sensing various physical
and chemical parameters. Though some types of optical fiber sensors have
been commercialized, only a limited number of techniques and applications
have been commercially successful.
This chapter describes the structure and light guiding mechanism of
optical fibers. The general principle of operation of fiber optic sensors is
discussed. Various schemes used in fiber optic sensing technology to convert
the measuring parameter into corresponding variation of optical properties
are presented along with their merits and demerits. This chapter also presents
a brief review about fiber optic sensors reported during the past decades in
the area of quality evaluation.
1.2. Optical Fiber
A typical communication optical fiber is a cylindrical optical
waveguide as shown in figure 1.1(a), consisting of a number of layers
namely core, cladding, buffer and jacket. The outer layers, typically made of
polymer or plastic materials, are the buffer and jacket and are for the purpose
of reinforcing the mechanical strength. The center layer is made of doped
glass and is the core of the fiber where most of the light energy is confined.
The cladding layer is made of fused silica glass and has a refractive index
(ncl) less than that of the core (nco). Thus light is guided inside the core as a
result of total internal reflection (TIR) at the core-cladding interface [23,24].
Figure 1.1 a) Structure of Optical Fiber b) Ray-optics representation of light propagation mechanisms in an ideal step-index optical fiber

Introduction to Fiber Optic Sensors
4
If a beam of light is incident on the end face of a fiber within the
angular cone specified by an entrance (or acceptance) angle θ0, the light is
confined to the core material by virtue of total internal reflection from the
core-cladding interface [24], as shown in Figure 1.1(b). From elementary
optics, total internal reflection is only supported in the fiber if the angle that
the ray makes with the core-cladding interface is greater than the critical
angle θc. By applying Snell’s law to the air-fiber face boundary, the
maximum entrance angle θ0 can be deduced as
220sin clco nnn (1.1)
where n is the refractive index of air.
The value on the left hand side of equation 1.1 is defined as the
numerical aperture (NA) of the fiber. Since it is related to the maximum
acceptance angle, numerical aperture defines the light gathering capability of
the fiber.
Thus 22clco nnNA (1.2)
1.2.1 Mechanism of Light Guidance and Fiber Modes
The basic mechanism by which light is transmitted through an optical
fiber is total internal reflection (TIR). The simplest approach in analyzing
light confinement is using geometrical optics. When a light ray incidents on
the boundary of an optically denser medium (refractive index nco) that
separates it from a rarer medium (refractive index ncl, nco>ncl) at an angle
greater than the critical angle (θc) it will be totally internally reflected back to
the denser medium itself. Thus light coupled to the core gets confined in it
due to total internal reflection at the core cladding boundary.
Although it would seem possible for all light rays to propagate along
the fiber if they are incident at an angle θ1 (π/2-angle of incidence θ) from
the core-cladding interface, where θ1< θc , this is not the case because the
phase of the light wave also needs to be considered [24]. The phase that
results after the wave has undergone two reflections from the core-cladding
interface must be an integer multiple of the incident phase. If this condition
is not satisfied, the wave will interfere destructively with itself and ultimately
cease to propagate, thus restricting the light to certain discrete ray paths
within the core. The total phase shift consists of two components namely the

Introduction to Fiber Optic Sensors
5
shift in phase due to the distance traversed by the light wave and the Goos-
Hanchen shift due to reflection from the dielectric (core-cladding) interface
[23,24].
The phase change due to the former effect can be formulated from
Skco (1.3)
where kco is the propogation constant in the medium of refractive index nco
and S is the distance the wave travels in the material.
Since the free space propagation constant k=kco/nco=2π/λ
/2 SnkSn coco (1.4)
The Goos-Hanchen shift arising from a single reflection is calculated using
the following expression [24]
sin
costan2
22
1
cl
clco
HGn
nn
(1.5)
As shown in figure 1.2, consider two rays, ray1 and ray2, associated with the
same wave that is incident on the material interface at an angle θ < π/2-
θc.The condition required for wave propagation is that all points on the same
wave front must be in phase. This means that the phase change occurring for
ray1 when traveling from point A to point B minus the phase change
occurring for ray2 while traveling from point C to D must be an integer
multiple of 2π. If S1 is the distance between A and B and S2 that between C
and D, then from figure 1.2
S1= d/sinθ (1.6)
where d is the radius of the fiber
S2= ADcosθ =(AE-AS)cosθ (1.7)
S2=(d tan(90-θ)-dtan θ)cos θ= (cos2θ-sin2 θ) d/sin θ (1.8)

Introduction to Fiber Optic Sensors
6
Also ray1 undergoes two reflections and hence Goose-Hanchen shift
occurs two times. Hence the requirement for wave propogation can be
written as
mssn
HGco
22
221 (1.9)
where m=0,1,2,3,…
Substituting for S1, S2 and ΔG-H from equations 1.6, 1.8 and 1.5 into 1.9,
equation can be reduced as
sin
cos
2
sintan
222
co
clcoco
n
nnmdn
(1.10)
where the integer m denotes a discrete ray at an angle θ that is allowed for
wave propagation. Thus only waves that have those angles θ which satisfy
the condition in equation 1.10 will propagate in the waveguide.
Thus only light rays with discrete angles of incidence are allowed to
propagate in the core region, each of which is associated with a specific fiber
mode. An optical field distribution, or mode, corresponding to the minimum
allowed ray angle (i.e. m=0) is called the fundamental mode, while all other
guided modes (for which m ≥1) are higher-order modes. The larger the
inclination angle θ at the core-cladding interface, the higher the order of the
mode [24].
Guided modes obey electromagnetic wave theory and typically
consist of a set of electromagnetic field configurations that form a standing-
Figure 1.2 Light wave propagating along a fiber waveguide

Introduction to Fiber Optic Sensors
7
wave pattern in a direction transverse to that of the fiber axis. Maxwell’s
equations in a linear, isotropic dielectric material having no currents and free
charges are given below.
0. D (1.11)
0. B (1.12)
t
BE
(1.13)
t
DH
(1.14)
where ε is the permittivity and μ is the permeability of the medium. The
electric flux and magnetic flux are given by D=εE and B=μH
By taking the curl of these equations, the wave equations for the
electromagnetic fields are obtained as
2
22
t
EE
(1.15)
2
22
t
HH
(1.16)
Here 2 is called the scalar Laplacian and the choice of coordinate system is
critical in solving the wave equation. If a cylindrical coordinate system
{r,ф,z} with the z axis lying on the axis of the wave guide is defined for a
cylindrical fiber, then the solutions of the wave equations take the form
ztjerEE ,0 (1.17)
ztjerHH ,0 (1.18)
which are harmonic in time t and coordinate z. The parameter β is the z
component of the propagating mode while E and H gives the electric and
magnetic filed distributions of the mode.
As discussed using ray theory, the electric field distribution has a
peak value corresponding to points where two positive wave fronts interfere
constructively, and a trough is formed for constructive interference between
negative phase fronts [23]. Destructive interference occurs when positive and
negative phase fronts cause total field cancellation at a certain point. Thus a
standing wave is formed in the transverse direction that varies periodically
along the fiber’s axis. This standing wave has a period corresponding to the
wavelength given by [23]

Introduction to Fiber Optic Sensors
8
2
cos0
con (1.19)
Fiber modes traveling in the positive z-direction, composed of light of a
single angular frequency ω (and wavelengthλ), have a spatial and time
dependence proportional to ej(ωt-βz) . The fiber optic axial propagation
constant β– the component of k in the z direction is given by [24]
coscokn (1.20)
Due to the restriction on the inclination angle θ, the propagation constant β
also has a discrete set of solutions, and is denoted as an eigenvalue. This
constant is thus an indication of whether or not the mode propagates in the
core of the fiber or not. A mode remains guided if [24]
cocl knkn (1.21)
The wave equations in cylindrical coordinates are obtained by substituting
the general solution in the wave equations. The equations thus obtained are
011 2
2
2
22
2
z
zzz EqE
rr
E
rr
E
(1.22)
011 2
2
2
22
2
z
zzz HqH
rr
H
rr
H
(1.23)
where 22222 kq
These two equations contain either Ez or Hz. This implies that the
longitudinal components of E and H are uncoupled and can be chosen
arbitrarily provided that they satisfy equations 1.22 and 1.23. However,
coupling of Ez and Hz is required by the boundary conditions of the
electromagnetic field components. If there is no coupling then mode
solutions can be obtained in which either Ez or Hz = 0.When Ez = 0 modes
are called transverse electric or TE modes and when Hz = 0, they are called
transverse magnetic or TM modes. Hybrid modes exist if both Ez and Hz are
non zeros and are designated as HE or EH modes depending whether Hz or
Ez makes a larger contribution to the transverse field. The two lowest order
modes are designated by HE11 and TE01.
The wave equations can be solved using the variable separable method. The
solution of the equation is of the form [24]
tFzFFrAFEz 4321 (1.24)

Introduction to Fiber Optic Sensors
9
Since the wave is sinusoidal in time and propogates along the z direction,
time and z - dependant factors are given by
zwtjetFzF 43 (1.25)
Because of the circular symmetry of the waveguide, each field component
must not change when the co-ordinate ф is increased by 2π. Thus we assume
jveF 2 (1.26)
where the constant 'v' is an integer and can be positive or negative.
Substituting these in wave equation for Ez we will get
01
12
221
21
2
F
r
vq
r
F
rr
F (1.27)
This is a differential equation for Bessel function. An exactly identical
equation can be derived for Hz as well. Equation 1.27 is solved for the
regions inside the core and outside the core. For the inside region the
solutions for the guided modes must remain finite as r→0, whereas outside,
the solutions must decay to zero as r → ∞.
Thus for r < a (radius of the fiber), the solutions are Bessel functions of first
kind of order v.
zwtjjvvz eeurAJarE (1.28)
zwtjjvvz eeurBJarH (1.29)
where 222 coku and /2 coco nk and A and B are arbitrary constants.
Outside the core, the solutions are given by modified Bessel functions of the
second kind, Kv(wr), where 222clkw and /2 clcl nk . The
expression for Ez and Hz outside the core are given by [24]
zwtjjvvz eewrCKarE (1.30)
zwtjjvvz eewrDKarH (1.31)
where C and D are arbitrary constants.
From the definition of modified Bessel function, it is seen that Kv(wr)→e-wr
as wr→∞. The modified Bessel function decays exponentially with respect
to r. Hence Kv(wr) must go to zero as r→∞.
The field distributions in the core and cladding regions have the same form
and the electric field pattern corresponds to a non-uniform wave travelling
along the z-direction. It is a standing-wave pattern in the fiber core and a

Introduction to Fiber Optic Sensors
10
decaying field in the cladding region. This decaying field in the cladding is
called evanescent wave.
Figure 1.3 shows the field patterns of several of the lower order transverse
electric (TE) modes in a dielectric slab waveguide, and their evanescent field
tail in the cladding. The order of a mode is equal to the number of field
zeroes across the guide.
Thus along with the guided modes, evanescent radiation modes or leaky
modes also propagate along the optical fiber. One situation in which these
modes occur is the case where a cladding mode no longer undergoes total
internal reflection at the cladding-external boundary as a result of the index
of refraction of the surrounding medium being greater than that of the
cladding material. Leaky modes cause continuous power diffusion from the
core to the cladding but are usually attenuated after propagating for short
distances only [24], thus they do not diminish the optical power in the
waveguide as a whole to a great extent.
Apart from these modes, there exists a continuum of (unguided) radiation
modes as a result of light waves that no longer adhere to the critical angle
condition for total internal reflection at the core-cladding boundary. Such
modes undergo refraction from the core to the cladding, where they are often
Figure 1.3 Transverse electric (TE) modes in a dielectric slab waveguide

Introduction to Fiber Optic Sensors
11
trapped as a result of the abrupt cladding-ambient interface to form cladding
modes. Once generated, cladding modes travel alongside the guided core
modes in the optical fiber. Subsequently, mode coupling occurs because the
electric field distributions of both types of modes penetrate the material on
either side of the core-cladding interface. This mainly results in power being
lost from the guided core modes into the cladding. A lossy coating around
the cladding serves to attenuate cladding modes, thus limiting the amount of
optical power leaking out of the core.
1.2.2 Weakly guiding approximation and Linearly Polarized (LP) modes
The electromagnetic field expressions for the guided modes are rather
complicated to derive and hence a simpler method for obtaining the fiber
modes is required. An assumption is made that will simplify analysis to a
great extent – the weakly guiding fiber approximation [24], first introduced
by Gloge in 1971 [25]. This approximation technique assumes that the
difference in refractive index between the core of the fiber and cladding
material is very small, typically of the order of one percent (nco-ncl <<1) .
Technically speaking, the weakly guiding approximation neglects the
longitudinal components of the electric and magnetic fields , resulting in
linearly polarised (LP) ‘pseudo-modes’ [24]. This terminology has been
applied because the waves described by these simplified solutions propagate
at small angles to the fiber axis and are essentially polarised in a single
direction, transverse to the fiber axis. In this scheme for the lowest order
modes, each LP0m mode is derived from an HE1m mode and each LP1m mode
comes from TE0m, TM0m, and HE0m modes. Thus the fundamental LP01 mode
corresponds to an HE11 mode. Figure 1.4 shows the electric field amplitude
profiles for all the guided modes (LPlm) of a fiber with a step index profile.
The two colors indicate different signs of electric field values. The
fundamental or lowest-order mode (LP01) has an intensity profile which is
similar to that of a Gaussian beam. In general, light launched into a
multimode fiber will excite a superposition of different modes, which can
have a complicated shape.

Introduction to Fiber Optic Sensors
12
1.2.3. Single mode fiber and Normalized frequency
A core mode remains guided as long as β satisfies the condition given
in equation 1.21. The boundary between truly guided modes and leaky
modes is defined by the cutoff condition β=nclk. Another parameter
connected with the cutoff condition is called the normalized frequency or V
parameter/number defined by [24]
NAa
nna
V clco
22 22 (1.32)
where a is the radius of the fiber core
This is a dimensionless number that determines how many modes a fiber can
support. Except for the fundamental or lowest order mode (LP01) each mode
can exist only for values of V that exceed a certain limiting value. The
modes are cutoff when β=nclk, and this occurs when V≤2.405. The
fundamental mode has no cutoff and ceases to exist only when the core
diameter is zero. This is the principle on which single mode fibers are
Figure 1.4 Electric field amplitude profiles for the guided modes (LPlm) of a step index fiber

Introduction to Fiber Optic Sensors
13
constructed, which guides only the fundamental mode. As per equation 1.32,
V parameter can be reduced by reducing numerical aperture (NA) and/or
radius of the core ‘a’. Single mode fibers are fabricated by letting the core
diameter to be a few wavelengths (usually 8-12 μm) and by having small
index differences between the core and the cladding.
The V number can also be used to calculate the number of modes M in a
multimode fiber and is given by [24]
M=V2/2 (1.33)
1.3. Fiber Optic Sensors
The general structure of an optical fiber sensor system is shown in
Figure 1.5. It consists of an optical source, optical fiber, sensing or
modulator element, an optical detector and processing electronics. Optical
sources used for fiber optic sensing are light emitting diodes (LED) and
lasers while photodiodes are mainly used as detectors. The sensing area
converts the measurands into corresponding optical signals and the detected
variation is processed using instruments like oscilloscope, Optical Spectrum
Analyzers (OSA), Optical Time Domain Reflectometer (OTDR) etc.
In terms of the parameters like sensing location, the operating principle and
the application, fiber optic sensors can be classified into various groups.
Based on the sensing location, a fiber optic sensor can be classified as
extrinsic or intrinsic. In an extrinsic fiber optic sensor [26-28], the fiber
simply acts as a means of getting the light to the sensing location and then to
Figure 1.5 Fiber Optic Sensor system

Introduction to Fiber Optic Sensors
14
the detector. In the sensing zone the properties of light is changed using
various physical and chemical techniques. Chemical agents like dyes can be
used to change of the properties of the light in the presence of measurands or
a physical deformation proportional to the measurands can change the
coupled light intensity.
In the case of intrinsic fiber optic sensors, the internal property of optical
fiber itself converts the environmental changes into a modulated light signal.
This modulation of light signal can be in the form of intensity, phase,
frequency or polarization [6-10, 26].
Based on the operating principle or the light modulation process, a fiber
optic sensor can be classified as intensity, phase, frequency, or polarization
modulated sensor [6-10]. All these parameters can be transformed as
functions of external perturbations. The external perturbations can be sensed
by measuring these parameters and their changes.
1.3.1 Intensity modulated Fiber Optic Sensors
Intensity-based fiber optic sensors rely on generating a loss or gain to
the transmitted optical power proportional to the measurands. They are made
by using a transducer to convert the measurand into a factor which causes
attenuation of the signal. There are a variety of mechanisms like
microbending loss, attenuation and evanescent fields to produce a change in
the optical intensity guided by an optical fiber proportional to the
measurand[6- 10]. These types of fiber optic sensors possess inherent
advantages like simplicity of implementation, low cost, multiplexing
capability, and ability to perform as real distributed sensors. There are also
some limitations like unwanted power variation in the system due to
connections at joints, splices, micro bending loss, macro bending loss,
mechanical creep and many other factors.
Evanescent field is the exponentially decaying field in the lower
index region of a waveguide and Evanescent wave sensor is the one that
utilizes the light energy which leaks from the core into the cladding. They
are probably the most studied and developed intrinsic sensor subfamily [29-
60]. The sensing region is made by stripping the cladding from a section of
the fiber. A light source having a wavelength that can be absorbed by the
measurands is transmitted through the fiber and detected at the other end.

Introduction to Fiber Optic Sensors
15
The resulting change in light intensity is a measure of the measurand
concentration [39]. The cladding can also be made sensitive to specific
organic vapors [35] or the cladding of the optical fiber can be replaced along
a small section by a sensitive material [30,31,33]. Any change in the optical
or structural characteristic of the coating material due to the presence of the
measurands generates a change in the effective index of the optical fiber.
Generally fibers have a cladding made of silica, which is difficult to
remove or modify. A remedy is to polish the fiber to eliminate the cladding
[40-42] or using chemical etching where the optical fiber is soaked in
hydrofluoric acid solution [31,43,44]. Plastic cladded fibers (PCS) are an
easy alternative where the cladding can be easily removed either
mechanically or with non hazardous solvents such as acetone [45-48].
Once the cladding is removed or modified the sensing material has to
be fixed onto the fiber core surface. To achieve this analyte is dissolved in a
chemical solution and the fiber is dipped into it several times, known as dip
coating [49,50]. Another method of coating sensitive material is using sol-gel
solutions. Since the sol-gel solution is in liquid phase, the sensing material is
added to it and then the fiber is dipped into the mixture. After drying the
deposition, an optically uniform porous matrix doped with the analyte fixed
onto the fiber is achieved [35,43, 51-57]. Langmuir-Blodgett technique is
another available deposition procedure. The process is based on the
Figure 1.6 Evanescent wave Fiber Optic Sensor System

Introduction to Fiber Optic Sensors
16
deposition of layers with hydrophobic and hydrophilic behavior, yielding a
homogeneous structure formed by bilayers [58,59].
1.3.2. Wavelength Modulated Fiber Optic Sensors
Wavelength modulated sensors use changes in the wavelength of
light for detection. Fluorescence sensors and fiber grating sensors are
examples of wavelength-modulated sensors. The most widely used
wavelength based sensor is the fiber grating sensor and are generally of two
types namely Fiber Bragg Grating (FBG) and Long Period Fiber Grating
(LPFG) based sensors. In the case of Bragg gratings (FBG) the change is in
the reflection and transmission spectrum, while the variation occurs in the
transmission wavelength in the case of long period fiber a grating (LPFG)
1.3.2.1. Fluorescence sensors
These sensors are based on the spontaneous light emission of a
fluorophore when it is excited with light at a wavelength located in the
absorption spectral region of such fluorophore. The change in the emission
of the dye when it interacts with the measurands is used as the sensing
response. Different schemes have been proposed for fluorescent based fiber
optic sensors and the most popular schemes are fluorescence intensity
sensors, fluorescence lifetime sensors and fluorescence phase-modulation
sensors [61-65].
1.3.2.2. Fiber Gratings
Fiber grating was first reported by Hill et al [66] in 1978 at the
Canadian Communications Research Centre (CRC) and was an outgrowth of
research investigating in nonlinear properties of germania-doped silica fiber.
It is a submicron periodical modulation of the refractive index of the fiber
core coupling light from the forward-propagating mode to a counter
propagating mode of the optical fiber [67-71] and is known as Fiber Bragg
Grating (FBG). In the original experiments an intense Argon-ion laser
(488nm) was launched into a germania-doped fiber and an increase in the
reflected light intensity was noticed with the advancement of time. This light
reflection was due to the formation of periodic refractive index modulation
occurring in the fiber core due to the standing wave pattern formed by the
laser reflected from the fiber end [68]. The technique of grating fabrication
by side illumination was demonstrated by Meltz et al. [72] while a more

Introduction to Fiber Optic Sensors
17
efficient and user-friendly method of grating fabrication using a phase mask
has been demonstrated [73] in 1993. This enabled the fabrication of FBGs
with high reproducibility and at a relatively low cost without affecting the
physical characteristics of the host fiber.
Fiber gratings quickly transformed to a technology that currently
plays a significant role in optical communications and sensor systems [74-
80]. Structure of the grating can vary in terms of the refractive index, or the
grating period and based on these features fiber gratings are divided into
many namely Fiber Bragg Grating (FBG), Long Period Fiber Grating
(LPFG), Chirped Fiber Grating, Tilted Fiber Bragg Grating (TFBG),
Superstructure Bragg gratings (SBG) etc.
A Fiber Bragg Grating (FBG) has a short period on the scale of the
optical wavelength (less than 1 μm ) and under phase matching conditions, a
fiber Bragg grating (FBG) couples the forward propagating core mode to the
backward propagating core mode (Figure 1.7 a). FBG’s are now
commercially available and they have found key applications in many
domains, such as optical add/drop multiplexers, wavelength-stabilized pump
lasers, fiber lasers, WDM multiplexers, dispersion compensators, etc. In the
area of fiber optic sensors FBGs are used as sensing heads for a large range
of measurands like strain, temperature, vibration, pressure, acceleration, etc.
The reasons for the impact of fiber Bragg gratings in sensing are multiple,
and the most important one is the fact that the measurand information is
encoded in the resonance wavelength of the structure. This brings up the
properties of immunity to optical power fluctuations, avoids the need of
recalibration procedures and provides natural identification of a particular
sensor in a multiplexed sensing array [74-80].
If the grating period is much longer than the wavelength of light (100
μm to 1 mm), then it is called a long-period fiber grating (LPFG) and it
can couple the forward propagating core mode to one or a few of the forward
propagating cladding modes (figure 1.7b). After initials by Vengsarkar et al
in 1996 [81], LPFGs have increasingly been applied in both
telecommunications and sensing applications. In the communication field
LPFGs are being used as band-rejection filters, source-noise suppressors and
gain-equalising or gain-flattening filters for erbium-doped fiber amplifiers
(EDFAs) [82-85]. Other communication applications include LPFGs
employed as comb filters [86], wavelength-selective optical fiber polarizers

Introduction to Fiber Optic Sensors
18
[87-90], add-drop couplers [91], components in wavelength division
multiplexing (WDM) systems [92-94], or in all-optical switching [95], and
for chromatic dispersion compensation [96]. Though long period fiber
gratings (LPFG) lacks the ability of multiplexing, its high sensitivity to
refractive index gives them an edge over fiber bragg gratings (FBG) in
chemical and biochemical applications.
In a chirped fiber grating (figure 1.7c) the grating period is not
uniform along the length and is achieved by varying the grating period, the
average index, or both along the length of the grating. Chirp in gratings may
take many different forms. The period may vary symmetrically, either
increasing or decreasing in period around a pitch in the middle of a grating
[97-98]. The reflection spectrum of a chirped fiber grating is wider compared
to FBG and each wavelength component is reflected at different positions.
This causes a delay time difference for different reflected wavelengths.
Several techniques to impart chirp was reported namely, exposure to UV
beams of non uniform intensity of the fringe pattern, varying the refractive
index along the length of a uniform period grating, altering the coupling
constant of the grating as a function of position, incorporating a chirp in the
inscribed grating, fabricating gratings in a tapered fiber, applying a non
uniform strain [99-101] etc. All these gratings have special characteristics,
which are like signatures and may be recognized as special features of the
type of grating. Chirped gratings have many applications and have found a
special place in optics as a dispersion-correcting and compensating device.
Ultralong, broad-bandwidth chirped gratings of high quality is used for high-
bit-rate transmission in excess of 40 Gb/sec over 100 km [102]. Some of the
other applications include chirped pulse amplification [103], chirp
compensation of gain-switched semiconductor lasers [104], sensing [68,105],
higher-order fiber dispersion compensation [106], ASE suppression [107],
amplifier gain flattening [108], and band blocking and band-pass filters [109].
In standard FBGs, the grading or variation of the refractive index is
along the length of the fiber (the optical axis) and perpendicular to the
optical axis. In a tilted FBG (TFBG), the variation of the refractive index is
at an angle to the optical axis leading to the occurrence of more complex
mode coupling, as shown in Figure 1.7d. A tilted fiber grating can thus
couple the forward propagating core mode to the backward propagating core
mode and a backward propagating cladding mode and the angle of tilt has an

Introduction to Fiber Optic Sensors
19
effect on the reflected wavelength, and bandwidth. TFBGs have found
applications in the field of optical fiber communications and fiber sensing
technology. In optical fiber communication TGBgs are used a gain flattening
filters for erbium-doped fiber amplifiers (EDFAs) and wavelength division
multiplexing (WDM) channel monitor. In sensing tilted fiber Bragg grating
(TFBG) has been implemented as temperature-independent strain sensor
[110-112], temperature independent external refractive index sensor [113-
114] and bend sensor [115].
Figure 1.7 Different types of fiber gratings a) FBG b) LPFG c) Chirped Fiber Bragg Grating d) TFBG e) SFBG
Introduction to Fiber Optic Sensors
20
A sampled fiber Bragg grating (SFBG) or superstructure Bragg
grating (SBG’s) are structures for which parameters vary periodically along
the length of the grating on a scale much larger than the wavelength of light.
They are contra-directional coupling gratings foe which effective refractive
index amplitude and/or phase is modulated through a long periodic structure
(figure 1.7e). The special reflection characteristics of SFBGs make them very
useful and attractive devices for optical communications and fiber sensors
[116-117]. A sampled fiber grating can reflect several wavelength
components with equal wavelength spacing.
1.3.3. Phase Modulated Fiber Optic Sensors
Phase modulated sensors use changes in the phase of light for
detection. The measurands modulate the phase of the light wave passing
through the fiber and this phase modulation is then detected
interferometrically [6-10,118-127]. Mach-Zehnder and Michelson [118-119],
Fabry-Perot [120-126], Sagnac [127] and grating interferometers [123, 126]
are the most commonly used intereferometers. Fiber Fabry-Perot
interferometric sensor (FFPI) is the commonly used interferometer based
sensor and is classified into two categories namely Intrinsic Fabry-Perot
interferometer (IFPI) sensor [121-122] and Extrinsic Fabry-Perot
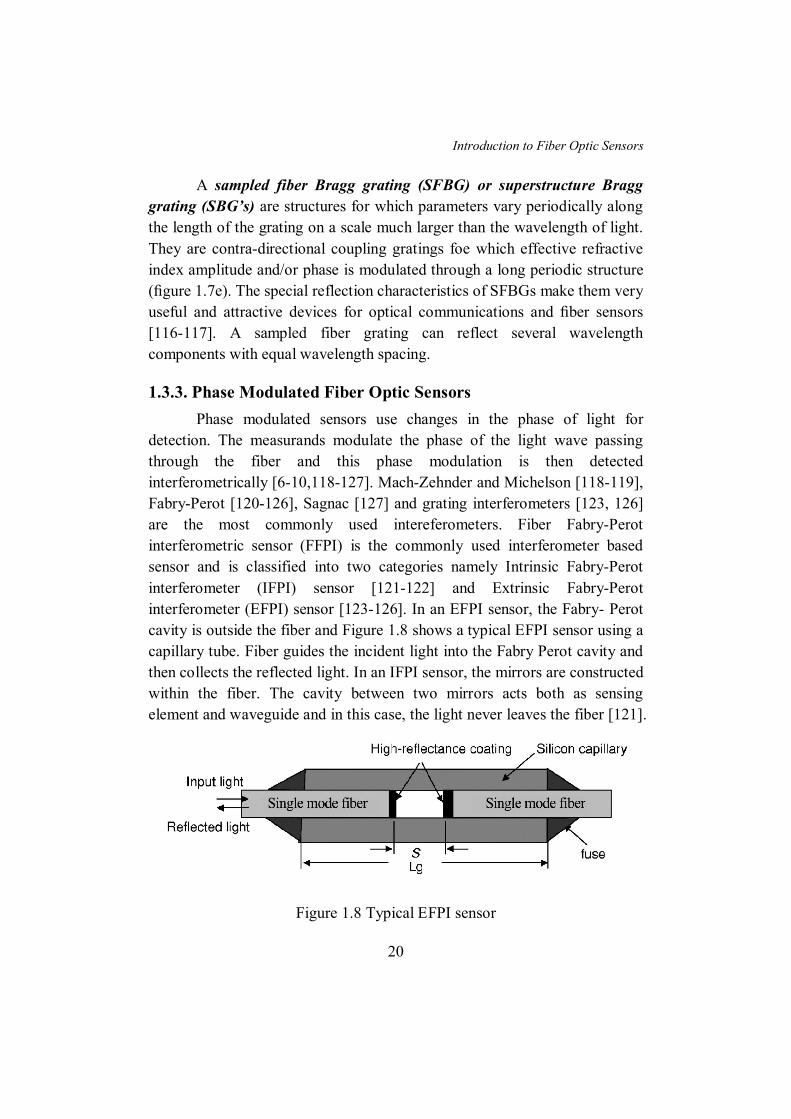
interferometer (EFPI) sensor [123-126]. In an EFPI sensor, the Fabry- Perot
cavity is outside the fiber and Figure 1.8 shows a typical EFPI sensor using a
capillary tube. Fiber guides the incident light into the Fabry Perot cavity and
then collects the reflected light. In an IFPI sensor, the mirrors are constructed
within the fiber. The cavity between two mirrors acts both as sensing
element and waveguide and in this case, the light never leaves the fiber [121].
Figure 1.8 Typical EFPI sensor

Introduction to Fiber Optic Sensors
21
1.3.4. Polarization Modulated Fiber Optic Sensors
The direction of the electric field portion of the light field is defined
as its polarization state and the fiber optic sensors based on detection of
change in induced phase difference between different polarization directions
are termed as Polarization Modulated Fiber Optic Sensors. The refractive
index of a fiber varies when it undergoes stress or strain and the induced
refractive index change occurs in the direction of applied stress or strain.
Thus an induced phase difference is created between different polarization
directions and this phenomenon is called photoelastic effect. Therefore, by
detecting the change in the output polarization state, the external perturbation
can be sensed [9].
1.4 Fiber Optic Sensors in Quality evaluation
Quality is defined as the standard of something as measured against
other things of a similar kind or in other words the degree of excellence of
something. The definition of quality depends on the role of the people
defining it and on the material on which it is defined. Some people view
quality as “performance to standards” while some view it as “meeting the
customer’s needs” or “satisfying the customer.” The difficulty in defining
quality exists regardless of product, and this is true for both manufacturing
and quality control organizations.
The evaluation of quality of a product is thus important in both the
production side and consumer side. It can be either done manually or
automatically and both methods have its own merits and demerits.
Traditionally quality evaluation is done manually and it requires skilled
operators and the process is time consuming. Moreover, the chances for
human error are more in this process. On contrary automatic quality
evaluation is fast, cost effective and accurate.
Sensors are the vital elements of such automatic quality evaluation
systems where appropriate sensors with high sensitivity and resolution are a
necessity and sensors based on various technologies have carved their niches
in their areas. One of the major application area of fiber optic sensors is in
monitoring the physical health of structures like buildings, bridges, tunnels,
dams and heritage structures in real time. Concrete monitoring during setting,
crack (length, propagation speed) monitoring, pre stressing monitoring,

Introduction to Fiber Optic Sensors
22
spatial displacement measurement, neutral axis evolution, long-term
deformation (creep and shrinkage) monitoring, concrete-steel interaction,
and post-seismic damage evaluation are some of the civil engineering
parameters measured using fiber optic sensors [128-131]. Twenty-six FBG
strain sensors have been reported to be monitoring the Horsetail Falls Bridge
in Oregom successfully for 2 years [132]. The bridge was originally built in
1914 and in 1998 it was strengthened by placing composite wraps over the
concrete beams. Bragg grating strain sensors have been employed for
monitoring the prestressing tendons of the Beddington Trail Bridge, Canada
[133] and Tsing Ma Bridge in China [134]. Gebremichael et al. in 2005 have
reported the use of 40 FBG sensors to remotely monitor the real-time strain
on Europe’s first all-fiber reinforced composite bridge, The West Mill
Bridge [135]. In situ monitoring of strain data from the bridge and to analyze
this data for assessment of its structural integrity, maintenance scheduling
and validation of design codes are the main objective behind this study.
Quality measurement of reinforced concrete beams instrumented with FBG
sensors have been reported in literatures [136-140]. Bragg grating sensors
have been used successfully to monitor the strain in concrete piles [141-144]
and are essential since piles carry the weight of the foundation and transmit
the load of the structure to the subsoil. Another area where quality
monitoring is essential is the cement curing process which is affected by the
water to cement ratio, the curing temperature, humidity and type of cement
used. FBG strain sensors have been used to study early-age cement paste
shrinkage [145] and the shrinkage and temperature change behavior of
reactive powder concrete (RPC) in the early age was studied by Wong et al.
[146]. M. Rajesh et. al [147] did studies on the setting characteristics of
various grades of cement while plastic optical fibers were successfully used
for cement setting studies by Andrea et.al [148].
Adulteration in food is a major area of concern and a fiber optic
sensor for determining quality of coconut oil was reported by Sheeba et al
[149]. An evanescent type fiber optic sensor using a side polished plastic
clad silica fiber was used in their work. Altering the quality of fuels is
another major problem faced world wide and fiber optic sensors were
successfully developed to test the purity of petrol and diesel. [150-153].
While Mishra et.al [153] developed long period based sensor for identifying
kerosene adulteration in petrol, a similar technique was utilized by Falate

Introduction to Fiber Optic Sensors
23
et.al [151] for Biodiesel Quality Control. Fiber optic sensors supervised by
artificial neural networks were demonstrated as integrate systems for smart
sensing in fuel industry by Possetti et.al [152].
Another important area is contamination of water where authors have
reported works on pH detection using optical methods [154-160]. Ganesh
et.al [154] used a membrane made of cellulose acetate for reagent
immobilization and congo red (pKa 3.7) and neutral red (pKa 7.2) as pH
indicators while a sol–gel derived film doped with a pH indicator
bromocresol purple (BCP) was reported by Burke et.al [160]. Long Period
Fiber Gratings (LPFG) based in-fiber Mach–Zehnder interferometer for
salinity measurement in a water solution was reported by Possetti et. al [161]
and Samer et.al [162]. Ethanol concentration detection in alcohol beverages
is another area where adulteration is common and an optical-fiber sensor
using the fluorescence induced by a laser-diode-pumped Tm3+:YAG for
determining water concentrations in ethanol–water and methanol–water
mixtures was reported by Yokota et.al [163]. A fiber-optic sensor with a
chitosan/poly(vinyl alcohol) blended membrane as the cladding was
fabricated to determine ethanol in alcoholic beverages by Kurauchi et. al
[164]
Quality of air depends on the concentration of many parameters and
their measurement in various environments is a necessity. Humidity is one
such parameter and its precise measurement is inevitable in various industrial
and domestic environments and various authors have presented fiber optic
sensors for humidity detection [165-171]. Long Period Fiber Grating based
humidity sensor with PVA coating was reported by Venugopalan et. al [165-
167] while Liwei Wang et. al [166] and Arregui et. al [169] used hydro gel
as the sensitive material. An Optical fiber based humidity sensor using
cobalt-polyaniline as sensitive cladding material was reported by Anu
Vijayan et. al [171]. Measurement of ammonia concentration is important in
industrial environments and Wenqing Cao et. al. [172] have developed an
optical fiber based sensor system using sol-gel immobilized bromocresol
purple (BCP). An ammonia sensor using a pH Indicator dye p-nitrophenol
was reported by Arnold et.al. [173]. Fiber optic gas sensors were reported for
the detection of Oxygen [174], carbon dioxide [175-177], hydrogen [178]
and nitrogen dioxide [179-181]. Mahesh et.al.[175] have developed a carbon
dioxide sensor for fermentation monitoring while Shelly et.al.[181] reported

Introduction to Fiber Optic Sensors
24
a sensor with nanoporous structure for the selective detection of NO2 in air
samples.
Conclusions
In this chapter we discussed the basics of optical fiber and
fiber optic sensor technology. The theory of light guiding in an optical fiber
was explained along with various types of fiber sensor configurations, their
advantages and disadvantages. Fiber sensors are being investigated for the
past forty years and some of the findings related to their applications in
quality evaluation of civil structures, liquids and air are discussed in this
chapter.
References
1. V. P. N. Nampoori, “Dream Merchants-The Evolution of Fiber Optics”, http://photonics.cusat.edu/Article1.html
2. K. C. Kao and G. A. Hockham, “Dielectric-fiber surface waveguides for optical frequencies”, Proc. IEE 113, 1151-1158 (1966)
3. Charles K. Kao, “Nobel Lecture: Sand from centuries past: Send future voices fast”, Rev. Mod. Phys. 82, 2299-2303 (2010)
4. K. Saito, M. Yamaguchi, H. Kakiuchida, A. J. Ikushima, K. Ohsono and Y. Kurosawa, “Limit of the Rayleigh scattering loss in silica fiber”, Appl. Phys. Lett. 83, 5175-5177 (2003)
5. F. Poletti, N. V. Wheeler,M. N. Petrovich,N. Baddela, E. Numkam Fokoua, J. R. Hayes, D. R. Gray, Z. Li, R. Slavík and D. J. Richardson, “Towards high-capacity fiber-optic communications at the speed of light in vacuum”, Nature Photonics 7, 279–284 (2013)
6. B Culshaw and J Dakin, Optical Fiber Sensors: Systems and Applications, (Artech House, Boston, 1989)
7. D A Krohn, Fiber Optic Sensors: Fundamental and Applications, (Instrument Society of America, Research Triangle Park, North Carolina, 1988).
8. E Udd, Fiber Optic Sensors: An Introduction for Engineers and Scientists, (Wiley, New York, 1991).
9. Francis To So Yu and Shizhuo Yin, Fiber Optic Sensors, (Marcel Dekker, Inc. New York, 2002).
10. B.D.Gupta, Gupta and Banshi Das, Fiber Optic Sensors: Principles and Applications (New India Publishing, New Delhi,2006)
11. Daru Chen, Weisheng Liu, Meng Jiang, and Sailing He, “High-Resolution Strain/Temperature Sensing System Based on a High-Finesse Fiber Cavity and Time-Domain Wavelength Demodulation”, J. Lightwave Technol. 27, 2477-2481 (2009)
Introduction to Fiber Optic Sensors
25
12. N. Lagakos, J. A. Bucaro, and J. Jarzynski, "Temperature-Induced Optical Phase Shifts in Fibers," Appl. Opt. 20, 2305-2308 (1981).
13. H. Y. Fu, H. Y. Tam, L. Y. Shao, X. Dong, P. K. A. Wai, C. Lu, and S. K. Khijwania, "Pressure sensor realized with polarization-maintaining photonic crystal fiber-based Sagnac interferometer," Appl. Opt. 47, 2835-2839 (2008).
14. A. B. Tveten, A. Dandridge, C. M. Davis, and T. G. Giallorenzi, "Fiber Optic Accelerometer" Electron. Lett.16, 854-856 (1980).
15. V. Vali, R.W. Shorthill, “Fiber ring interferometer”, Appl. Opt. 15, 1099–1100 (1976).
16. Sven Kuehn, Fin Bomholt and Niels Kuste, “Miniature Electro-Optical Probe for Magnitude, Phase and Time-Domain Measurements of Radio-Frequency Magnetic Fields”, (Asia-Pacific International Symposium on Electromagnetic Compatibility, Institute of Electrical and Electronics Engineers, New York, 2010)
17. A.H. Rose, Z.B. Ren, G.W. Day, “Twisting and annealing optical fiber for current sensors”, J. Lightwave Technol. 14, 2492–2498 (1996).
18. G.D. Peng, P.L. Chu, “Optical fiber hydrophone systems”, in: F.T.S. Yu, S. Yin (Eds.), Fiber Optic Sensors (Dekker, New York, 2002).
19. Colette McDonagh, Conor S. Burke and Brian D. MacCraith, “Optical Chemical Sensors”, Chem. Rev. 108, 400-422 (2008).
20. Otto S. Wolfbeis, “Fiber-Optic Chemical Sensors and Biosensors”, Anal. Chem.78, 3859-3874 (2006).
21. Otto S. Wolfbeis, “Fiber-Optic Chemical Sensors and Biosensors”, Anal. Chem. 80, 4269–4283 (2008).
22. M.D. Marazuela, M.C. Moreno-Bondi, “Fiber-optic biosensors—an overview”, Anal. Bioanal. Chem. 372, 664–682 (2002).
23. K Okamoto, Fundamentals of optical waveguides, (Academic Press. San Diego 2000).
24. G Keiser, Optical fiber communications. (3rd ed.). (McGraw-Hill, Singapore, 2000)
25. D Gloge, “Weakly guiding fibers”, Appl.Opt. 10, 2252-2258 (1971).
26. Culshaw B,Stewart G, Dong F, Tandy C, Moodie D, “Fiber optic techniques for remote spectroscopic methane detection-from concept to system realization”. Sensor. Actuat. B-Chem. 51, 25-37 (1998).
27. Stewart G, Tandy C, Moodie, D, Morante, M.A, Dong F, “Design of a fiber optic multi-point sensor for gas detection”, Sensor. Actuat. B-Chem. 51, 227-232 (1998).
28. Ho H.L, Jin W, Yu H.B, Chan K.C, Chan C.C, Demokan M.S, “Experimental demonstration of a Fiber-Optic Gas Sensor Network Addressed by FMCW”, IEEE Photon. Tech. Lett. 12, 1546-1548 (2000).
29. Tracey, P. M., “Intrinsic Fiber-Optic Sensors”, IEEE Trans. Ind. Appl. 27, 96-98 (1991)
30. Khijwania S.K, Gupta B.D, “Fiber optic evanescent field absorption sensor with high sensitivity and linear dynamic range”, Opt. Commun.152, 259-262 (1998)
31. Khalil S, Bansal L, El-Sherif M, “Intrinsic fiber optic chemical sensor for the detection of dimethyl methylphosphonate”, Opt. Eng. 43, 2683-2688 (2004).

Introduction to Fiber Optic Sensors
26
32. Dickinson T.A, Michael K.L, Kauer J.S, Walt D.R, “Convergent, Self-Encoded Bead Sensor Arrays in the design of an Artificial Nose”, Anal. Chem. 71, 2192-2198 (1999).
33. Yuan J, El-Sherif A, “Fiber-Optic Chemical Sensor Using Polyaniline as Modified Cladding Material”, IEEE Sensor. J. 3, 5-12 (2003).
34. Messica A, Greenstein A, Katzir A, “Theory of fiber-optic, evanescent-wave spectroscopy and sensors”, Appl. Opt. 35, 2274-2284 (1996).
35. Schwotzer G, Latka I, Lehmann H.,Willsch R, “Optical sensing of hydrocarbons in air or in water using UV absorption in the evanescent field of fibers”, Sensor. Actuat. B-Chem. 38-39, 150-153 (1997).
36. Shadaram M, Espada L, Garcoa F, “Modeling and performance evaluation of ferrocene-based polymer clad tapered optical fiber gas sensors”, Opt. Eng. 37, 1124-1129 (1998)
37. Barmenkov Y.O, “Time-domain fiber laser hydrogen sensor”, Opt. Lett. 29, 2461-2463 (2004).
38. Lacroix S, Bourbonnais R, Gonthier F, Bures J, “Tapered monomode optical fibers: understanding large power transfer” Appl. Opt. 25, 4421-4425 (1986).
39. Willer U, Scheel D, Kostjucenko I, Bohling C, Schade W, Faber E, “Fiber-optic evanescent-field laser sensor for in-situ gas diagnostics”, Spectrochim. Acta A 58, 2427-2432 (2002).
40. Senosiain J, Díaz I, Gastón A, Sevilla J, “High Sensitivity Temperature Sensor Based on Side-Polished Optical Fiber”, IEEE Trans. Instrum. Meas. 50, 1656-1660 (2001).
41. Gastón A, Pérez F, Sevilla J, “Optical fiber relative-humidity sensor with polyvinyl alcohol film”, Appl. Opt. 43, 4127-4132 (2004)
42. Gastón A, Lozano I, Pérez F, Auza F, Sevilla J, “Evanescent Wave Optical-Fiber Sensing (Temperature, Relative Humidity and pH Sensors)”, IEEE Sensor. J. 3, 806-811 (2003).
43. Sumdia S, Okazaki S, Asakura S, Nakagawa H, Murayama H, Hasegawa T, “Distributed hydrogen determination with fiber-optic sensor”, Sensor. Actuat. B-Chem. 108, 508-514 (2005).
44. Segawa H, Ohnishi E, Arai Y, Yoshida K, “Sensitivity of fiber-optic carbon dioxide sensors utilizing indicator dye”, Sensor. Actuat. B-Chem. 94, 276-281 (2003).
45. Cherif K, Mrazek J, Hleli S, Matejec, V, Abdelghani, A Chomat M, Jaffrezic-Renault N, Kasik I, “Detection of aromatic hydrocarbons in air and water by using xerogel layers coated on PCS fibers excited by an inclined collimated beam”, Sensor. Actuat. B-Chem. 95, 97-106 (2003).
46. Malis C, Landl M, Simon P, MacCraith B.D, “Fiber optic ammonia sensing employing novel near infrared dyes” Sensor. Actuat. B-Chem. 51, 359-367 (1998).
47. Potyrailo R.A, Hieftje G.M, “Oxygen detection by fluorescence quenching of tetraphenylporphyrin immobilized in the original cladding of an optical fiber”, Anal. Chim. Acta. 370, 1-8 (1998).
48. Okazaki S, Nakagawa H, Asakura S, Tomiuchi Y,Tsuji N, Murayama H, Washiya M, “Sensing Characteristics of an optical fiber sensor for hydrogen leak” Sensor. Actuat. B-Chem. 93, 142-147 (2003).

Introduction to Fiber Optic Sensors
27
49. Ho H.L, Jin W, Yu H.B, Chan K.C, Chan C.C, Demokan M.S, “Experimental demonstration of a Fiber-Optic Gas Sensor Network Addressed by FMCW”, IEEE Photon. Tech. Lett. 12, 1546-1548 (2000).
50. Scorsone E, Christie S, Persaud K.C, Simon P, Kvasnik F, “Fiber-optic evanescent sensing of gaseous ammonia with two forms of a new near-infrared dye in comparison to phenol red”, Sensor. Actuat. B-Chem. 90, 37-45 (2003).
51. Sekimoto S, Nakagawa H, Okazaki S, Fukuda K, Asakura S, Shigemori T, Takahashi S, “A Fiber-optic evanescent-wave hydrogen gas sensor using palladium-supported tungsten oxide”, Sensor. Actuat. B-Chem. 66, 142-145 (2000).
52. Jorge P.A.S, Caldas P, Rosa C.C, Oliva A.G, Santos J.L, “Optical fiber probes for fluorescente based oxygen sensing”, Sensor. Actuat. B-Chem. 130, 290-299 (2004).
53. Grant S.A, Satcher J.H. Jr, Bettencourt K, “Development of sol-gel-based fiber nitrogen dioxide gas sensors”, Sensor. Actuat. B-Chem. 69, 132-137 (2000).
54. Abdelghani A, Chovelon J.M, Jaffrezic-Renault N, Lacroix M, Gagnaire H, Veillas C, Berkova B, Chomat M, Matejec V, “Optical fiber sensor coated with porous silica layers for gas and chemical vapour detection”, Sensor. Actuat. B-Chem. 44, 495-498 (1997).
55. Abdelmalek F, Chovelon J.M, Lacroix M, Jaffrezic-Renault N, Matajec V, “Optical fiber sensors sensitized by phenyl-modified porous silica prepared by sol-gel”, Sensor. Actuat. B-Chem. 56, 234-242 (1999)
56. Bariain C, Matias I.R, Romeo I, Garrido J, Laguna M, “Detection of volatile organic compund vapors by using a vapochromic material on a tapered optical fiber”, Appl. Phys. Lett. 77, 2274-2276 (2000).
57. Bariain C, Matias I.R, Romeo I, Garrido J, Laguna M, “Behavioral experimental studies of a novel vapochromic material towards development of optical fiber organic compounds sensor”, Sensor. Actuat. B-Chem. 76, 25-31 (2001).
58. Hu W, Liu Y, Xu Y, Liu S, Zhou S, Zeng P, Zhu D.B, “The gas sensitivity of Langmuir-Blodgett films of a new asymmetrically substituted phthalocyanine”, Sensor. Actuat. B-Chem. 56, 228-233 (1999).
59. Bariain C, Matias I.R, Fernandez-Valdivielso C, Arregui F.J, Rodríguez-Méndez M.L, De Saja J.A, “Optical fiber sensor based on lutetium bisphthalocyanine for the detection of gases using standard telecommunication wavelengths”, Sensor. Actuat. B-Chem. 93, 153-158 (2003).
60. Gutierrez N, Rodríguez-Méndez M.L, De Saja J.A, “Array of sensors based on lanthanide bisphthalocyanine Langmuir-Blodgett films for the detection of olive oil aroma”, Sensor. Actuat. B-Chem. 77, 437-442 (2001).
61. Mitsubayashi K, Minamide T, Otsuka K, Kudo H, Saito H, “Optical bio-sniffer for methyl mercaptan in halitosis”, Anal. Chim. Acta, 573, 75-80.( 2006).
62. Wolfbeis O.S, Kovacs B, Goswami K, Klainer S.M, “Fiber-Optic Fluorescence Carbon Dioxide Sensor for Environmental Monitoring”, Mikrochim. Acta. 129, 181-188 (1998).
63. Kim Y.C, Peng W, Banerji S, Booksh K.S, “Tapered fiber optic surface plasmon resonance sensor for analyses of vapor and liquid phases”, Opt. Lett. 30, 2218-2220 (2005)

Introduction to Fiber Optic Sensors
28
64. O’Neal P.D, Meledeo A, Davis J.R, Ibey B.L, Gant V.A, Pishko M.V, Cote G.L, “Oxygen Sensor Based on the Fluorescence Quenching of a Ruthenium Complex Immobilized in a Biocompatible Poly(Ethylene Glycol) Hydrogel”, IEEE Sensor. J. 4, 728-734 (2004).
65. Grattan K.T.V, Zhang Z.Y, “Fiber Optic Fluorescence Thermometry”, (Chapman & Hall: London, 1995).
66. K.O. Hill, Y. Fujii, D.C. Johnson, B.S. Kawasaki “Photosensitivity in optical fiber waveguides: application to reflection filter fabrication”, Appl. Phys. Lett. 32 647–649 (1978).
67. Raman Kashyap, “Fiber Bragg Gratings”, (Academic Press, San Diego, USA 1999).
68. K.O. Hill and Gerald Meltz, “Fiber Bragg Grating Technology Fundamentals and Overview”, J. Lightwave Technol. 15 ,1263-1276 (1997)
69. K.O. Hill, “Photosensitivity in Optical Fiber Waveguides: From Discovery to Commercialization”, IEEE J. Sel. Top. Quantum Electron. 6, 1186-1189 (2000)
70. Andreas Othonos, “Fiber Bragg gratings”, Rev. Sci. Instrum. 68 ,4309-4341 (1997)
71. Turan Erdogan, “Fiber Grating Spectra”, J. Lightwave Technol. 15, 1277-1294 (1997)
72. G. Meltz, W.W. Morey, W.H. Glenn, Formation of Bragg gratings in optical fibers by a transverse holographic method”, Opt. Lett. 14, 823–825 (1989).
73. K. O. Hill, B Malo, F. Bilodeau, D. C. Johnson, and J. Albert, “Bragg gratings fabricated in monomode photosensitive optical fiber by UV exposure through a phase mask”, Appl. Phys. Lett. 62, 1035-1037(1993).
74. O. Frazao,L. A. Ferreira, F. M. Araujo, J. L. Santos, “Applications of Fiber Optic Grating Technology to Multi-Parameter Measurement”, Fiber Integr. Opt. 24, 227–244 (2005).
75. Giles, C. R. “Lightwave applications of fiber Bragg gratings”, J. Lightwave Technol. 15, 1391-1395 (1997)
76. Yun-Jiang Rao, “In-fiber Bragg grating sensors”, Meas. Sci. Technol. 8 , 355–375 (1997)
77. A. D. Kersey, M. A. Davis, H. J. Patrick, M. LeBlanc, K. P. Koo, C. G. Askins, M. A. Putnam, and E. J. Friebele, "Fiber grating sensors," J. Lightwave Technol. 15, 1442-1462 (1997).
78. Alan D. Kersey, Michael A. Davis, Heather J. Patrick, Michel LeBlanc, K. P. Koo, C. G. Askins, M. A. Putnam, and E. Joseph Friebele, “Fiber Grating Sensors”, J. Lightwave Technol. 15, 1442-1463 (1997)
79. Y.J. Rao, “Recent progress in applications of in-fiber Bragg grating sensors”, Opt. Lasers Eng. 31, 297-324 (1999)
80. Byoungho Lee, “Review of the present status of optical fiber sensors”, Opt. Fiber Technol. 9, 57-79 (2003)
81. Vengsarkar A.N., Lemaire P.J., Judkins J.B., Bhatia V., Erdogan T. and Sipe J.E, “Long-period fiber gratings as band-rejection filters”. J. Lightwave Technol. 14,58-65 (1996).
82. James S.W. and Tatam R.P., “Optical fiber long-period grating sensors: characteristics and applications”, Meas. Sci. Technol. 14, R49-R61 (2003).

Introduction to Fiber Optic Sensors
29
83. Vengsarkar A.N., Pedrazzani J.R., Judkins J.B. and Lemaire P.J., “Longperiod fiber-grating-based gain equalizers”, Opt. Lett. 21,336-338 (1996).
84. Wysocki P.F., Judkins J.B., Espindola R.P., Andrejco M. and Vengsarkar A.M., “Broad-band erbium-doped fiber amplifier flattened beyond 40 nm using long-period grating filter”, IEEE Photonics Technol. Lett. 9, 1343-1345 (1997).
85. Frazão O., Rego G., Lima M., Teixeira A., Araújo F.M., André P., Da Rocha J.F.and Salgado H.M., “EDFA gain flattening using long-period fibergratings based on the electric arc technique”, (Proceedings of the London Communications Symposium-LCS2001, 2001)
86. Gu X.J., “Wavelength-division multiplexing isolation fiber filter and light source using cascaded long-period fiber gratings”, Opt. Lett. 23, 509-510 (1998).
87. Ortega B., Dong L., Liu W.F., De Sandro J.P., Reekie L., Tsypina S.I., Bagratashvili V.N. and Laming R.I., “High-performance optical fiber polarizers based on long-period gratings in birefringent optical fibers”, IEEE Photonics Technol. Lett. 9,1370-1372 (1997).
88. Kurkov A.S., Douay M., Duhem O., Leleu B., Henninot J.F., Bayon J.F. and Rivoallan L., “Long-period fiber grating as a wavelength selective polarisation element”, Electron. Lett. 33, 616-617 (1997).
89. Kurkov A.S., Vasil’ev S.A., Korolev I.G., Medvedkov O.I. and Dianov E.M., “Fiber laser with an intracavity polariser based on a long-period fiber grating”, Quantum Electron. 31, 421-423 (2001).
90. Zhang L., Liu Y., Everall L., Williams J.A.R. and Bennion I., “Design and realization of long-period grating devices in conventional and high birefringence fibers and their novel applications as fiber-optic load sensors”, IEEE J. Sel. Top. Quantum Electron. 5, 1373-1378 (1999).
91. Chiang K.S., Liu Y., Ng M.N. and Li S., “Coupling between two parallel long-period fiber gratings”, Electron. Lett. 36, 1408-1409 (2000).
92. Laffont G. and Ferdinand P., “Fiber Bragg grating-induced coupling to cladding modes for refractive index measurements”, Proc. SPIE 4185, 326-329 (2000).
93. Lam P.K., Stevenson A.J. and Love J.D., “Bandpass spectra of evanescent couplers with long period gratings”, Electron. Lett. 36, 967-969 (2000).
94. Zhu Y., Lu C., Lacquet B.M., Swart P.L. and Spammer S.J., “Wavelength tunable add/drop multiplexer for dense wavelength division multiplexing using long-period gratings and fiber stretchers:, Opt. Commun. 208, 337-344 (2002).
95. Eggleton B.J., Slusher R.E., Judkins J.B., Stark J.B. and Vengsarkar A.M., “All-optical switching in long-period fiber gratings”, Opt. Lett. 22, 883-885 (1997).
96. Das M. and Thyagarajan K. , “Dispersion compensation in transmission using uniform long period fiber gratings”, Opt. Commun. 190, 159-163 (2001).
97. Byron K. C., Sugden K, Bircheno T. and Bennion I., "Fabrication of chirped Bragg gratings in photosensitive fiber," Electron. Lett. 29, 1659 (1993).
98. Parries M. C., Sugden K., Reid D. C. J., Bennion L, Molony A. and Goodwin M. J., "Very broad reflection bandwidth (44 nm) chirped fiber gratings and narrow-bandpass filters produced by the use of an amplitude mask," Electron. Lett. 30, 891-892 (1994).
99. Stephens T, Krug P. A., Brodzeli Z., Doshi G., Ouellette R and Poladin L., "257 km transmission at 10 Gb/s in non dispersion shifted fiber using an unchirped

Introduction to Fiber Optic Sensors
30
fiber Bragg grating dispersion compensator," Electron. Lett. 32, 1559-1561 (1996).
100. Kashyap R., McKee P. R, Campbell R. J. and Williams D. L., "A novel method of writing photo-induced chirped Bragg gratings in optical fibers," Electron. Lett. 30, 996-997 (1994).
101. Putnam M. A., Williams G. M. and Friebele E. J., " 'Fabrication of tapered, strain-gradient chirped fiber Bragg gratings," Electron. Lett. 31, 309-310 (1995).
102. Loh W. H., Laming R. I., Robinson N., Cavaciuti A., Vaninetti, Anderson C. J., Zervas M. N. and Cole M. J., "Dispersion compensation over distances in excess of 500 km for 10 Gb/s systems using chirped fiber gratings," IEEE Photon. Technol. Lett. 8, 944 (1996).
103. Boskovic A., Guy M. J., Chernikov S. V., Taylor J. R. and Kashyap R., "All fiber diode pumped, femtosecond chirped pulse amplification system," Electron.Lett. 31, 877-879 (1995).
104. Gunning P., Kashyap R., Siddiqui A. S. and Smith K., "Picosecond pulse generation of <5 ps from gain-switched DFB semiconductor laser diode using linearly step-chirped fiber grating," Electron. Lett. 31, 1066-1067 (1995).
105. M.G. Xu, L. Dong, L. Reekie, J.A. Tucknott and J.L. Cruz, “Temperature-independent strain sensor using a chirped Bragg grating in a tapered optical fiber”, Electron.Lett. 31, 823 – 825 (1995).
106. Williams J. A. R., Bennion I. and Doran N. J. "The design of in-fiber Bragg grating systems for cubic and quadratic dispersion compensation," Opt. Commun.,116, 62-66 (1995).
107. Fairies M. C., Ragdale G. M. and Reid D. C. J., "Broadband chirped fiber Bragg grating filters for pump rejection and recycling in erbium doped fiber amplifiers," Electron. Lett. 28, 487-489 (1992).
108. Kashyap R., Wyatt R. and McKee P. F, "Wavelength flattened saturated erbium amplifier using multiple side-tap Bragg gratings," Electron. Lett. 29, 1025-1027 (1993).
109. Zhang I., Sugden K, Williams J. A. R. and Bennion I., "Postfabrication exposure of gap-type bandpass filters in broadly chirped fiber gratings," Opt. Lett. 20, 1927-1929 (1995).
110. Kang S C, Kim S Y, Lee S B, Kwon S W, Choi S S and Lee B, “Temperature-independent strain sensor system using a tilted fiber Bragg grating demodulator”, IEEE Photon. Technol. Lett. 10, 1461–1463 (1998).
111. Chen C, Xiong L, Jafari A and Albert J, “Differential sensitivity characteristics of tilted fiber Bragg grating sensors”, Proc. SPIE. 6004, 6004–6013 (2005).
112. Chen X, Zhou K, Zhang L and Bennion I, “ In-fiber twist sensor based on a fiber Bragg grating with 81 degrees tilted structure”, IEEE Photon. Technol. Lett. 18, 2596–2604 (2006).
113. Laffont G and Ferdinand P, “Tilted short-period fiber-Bragg-grating-induced coupling to cladding modes for accurate refractometer”, Meas. Sci. Technol. 12, 765–770 (2001)
114. Chan C F, Chen C, Jafari A, Laronche A, Thomson D J and Albert J, “Optical fiber refractometer using narrowband cladding mode resonance shifts”, Appl. Opt. 46, 1142–1149 (2007)

Introduction to Fiber Optic Sensors
31
115. Baek S, Jeong Y and Lee B, “Characteristics of short-period blazed fiber Bragg gratings for use as macro-bending sensors”, Appl. Opt. 41, 631–636 (2002)
116. Frazao O, Romero R, Rego G, Marques P V S, Salgado H M and Santos J L, “Sampled fiber Bragg grating sensors for simultaneous strain and temperature measurement”, Electron. Lett. 38 693–695 (2002)
117. Neil J. Baker, Ho W. Lee, Ian C. M. Littler, C. Martijn de Sterke, Benjamin J. Eggleton, Duk-Yong Choi, Steve Madden and Barry Luther-Davies, “Sampled Bragg gratings in chalcogenide (As2S3) rib-waveguides”, Opt. Express 14, 9451-9459 (2006)
118. Zhaobing Tian, Scott S-H. Yam and Hans-Peter Loock, “Single-Mode Fiber Refractive Index Sensor Based on Core-Offset Attenuators”, IEEE Photon. Tech. Lett. 20, 1387-1389 (2008).
119. T. Allsop, R. Reeves, D. J. Webb, and I. Bennion, “A high sensitivity refractometer based upon a long period grating Mach–Zehnder interferometer”, Rev. Sci. Instrum. 73, 1702-1705 (2002)
120. Yuan-Tai Tseng, Yun-Ju Chuang, Yi-ChienWu, Chung-Shi Yang, Mu-ChunWang and Fan-Gang Tseng, “A gold-nanoparticle-enhanced immune sensor based on fiber optic interferometry”, Nanotechnology 19, 345501(1-9) (2008)
121. Christopher J Tuck, Richard Hague and Crispin Doyle, “Low cost optical fiber based Fabry–Perot strain sensor production”, Meas. Sci. Technol. 17 ,2206–2212 (2006)
122. Tao Wei, Yukun Han, Yanjun Li, Hai-Lung Tsai, and Hai Xiao, “Temperature-insensitive miniaturized fiber inline Fabry-Perot interferometer for highly sensitive refractive index measurement”, Opt. Express 16, 5764-5769 (2008).
123. Yun-Jiang Rao, “Recent progress in fiber-optic extrinsic Fabry–Perot interferometric sensors”, Opt. Fiber Technol. 12, 227–237 (2006
124. Vikram Bhatia, Kent A Murphy, Richard 0 Claus, Mark E Jones, Jennifer L Grace, Tuan A Tran and Jonathan A Greene, “Multiple strain state measurements using conventional and absolute optical fiber-based extrinsic Fabry-Perot interferometric strain sensors”, Smart Mater. Struct. 4, 240-245 (1995)
125. Vikram Bhatia, Kent A Murphy, Richard 0 Claus, Mark E Jones, Jennifer L Grace, Tuan A Tran and Jonathan A Greene, “Optical fiber based absolute extrinsic Fabry–P´erot interferometric sensing system”, Meas. Sci. Technol. 7 ,58–61 (1996).
126. Yun-Jiang Rao, Zeng-Ling Ran, Xian Liao, and Hong-You Deng, “Hybrid LPFG/MEFPI sensor for simultaneous measurement of high-temperature and strain”, Opt. Express 15, 14936-14941(2007).
127. A. N. Starodumov, L. A. Zenteno, D. Monzon and E. De La Rosa, “Fiber Sagnac interferometer temperature sensor”, Appl. Phys. Lett. 70 ,19-21 (1997).
128. F. Ansari, “State-of-the-art in the applications of fiber-optic sensors to cementitious composites”, Cem. Concr. Compos. 19, 3–19 (1997).
129. R.C. Tennyson, A.A. Mufti, S. Rizkalla, G. Tadros, B. Benmokrane, “Structural health monitoring of innovative bridges in Canada with fiber optic sensors”, Smart Mater. Struct. 10, 560–573 (2001).
130. Y.B. Lin, C.L. Pan, Y.H. Kuo, K.C. Chang, “Online monitoring of highway bridge construction using fiber Bragg grating sensors”, Smart Mater. Struct. 14, 1075–1082 (2005).

Introduction to Fiber Optic Sensors
32
131. Y.B. Lin, J.S. Lai, K.C. Chang, L.S. Li, “Flood scour monitoring system using fiber Bragg grating sensors”, Smart Mater. Struct. 15, 1950–1959 (2006).
132. W.L. Schulz, J.P. Conte, E. Udd, J.M. Seim, “Static and dynamic testing of bridges and highways using long-gage fibre Bragg grating based strain sensors”, Proc. SPIE 4202, 79 (2000).
133. R. Maaskant, A.T. Alavie, R.M. Measures, G. Tadroos, S.H. Rizkalla, A. Guha- Thakurta, “Fiber optic Bragg grating sensors for bridge monitoring”, Cem. Concr. Compos. 19, 21–33 (1997).
134. T.H.T. Chan, L. Yu, H.Y. Tam, Y.Q. Ni, S.Y. Liu, W.H. Chung, L.K. Cheng, “Fiber Bragg grating sensors for structural health monitoring of Tsing Ma bridge: background and experimental observation”, Eng. Struct. 28, 648– 659 (2006).
135. Y.M. Gebremichael, W. Li, W.J.O. Boyle, B.T. Meggit, K.T.V. Grattan, B. McKin- ley, G.F. Fernando, G. Kister, D. Winter, L. Canning, S. Luke, “Integration and assessment of fibre Bragg grating sensors in an all-fibre reinforced polymer composite road bridge”, Sens. Actuators A 118, 78–85 (2005).
136. Y.B. Lin, K.C. Chang, J.C. Chern, L.A. Wang, “The health monitoring of a pre-stressed concrete beam by using fiber Bragg grating sensors”, Smart Mater.Struct. 13, 712–718 (2004).
137. M.H. Maher, E.G. Nawy, “Evaluation of fiber optic Bragg grating strain sen-sors in high strength concrete beams”, in: F. Ansari (Ed.), Applications of FiberOptic Sensors in Engineering Mechanics, (ASCE-EMD, ASCE, New York, 1993)
138. M.A. Davis, D.G. Bellemore, A.D. Kersey, “Distributed fiber Bragg grating strainsensing in reinforced concrete structural components”, Cem. Concr. Comp. 19, 45–57 (1997).
139. J.S. Leng, G.C. Mays, G.F. Fernando, “Structural NDE of concrete structures using protected EFPI and FBG sensors”, Sens. Actuators A 126, 340–347 (2006).
140. W. Chung, D. Kang, “Full-scale test of a concrete box girder using FBG sensing system”, Eng. Struct. 30, 643–652 (2008).
141. G. Kister, D. Winter, R.A. Badcock, Y.M. Gebremichael, W.J.O. Boyle, B.T. Meg-gitt, K.T.V. Grattan, G.F. Fernando, “Structural health monitoring of a composite bridge using Bragg grating sensors. Part 1. Evaluation of adhesives and pro- tection systems for the optical sensors”, Eng. Struct. 29, 440–448 (2007).
142. H.N. Li, D.S. Li, G.B. Song, “Recent applications of fiber optic sensors to health monitoring in civil engineering”, Eng. Struct. 26, 1647–1657(2004).
143. G. Kister, D. Winter, J. Leighton, R.A. Badcock, P.D. Tester, S. Krishnamurthy, W.J.O. Boyle, K.T.V. Grattan, G.F. Fernando, “Methodology and integrity moni-toring of foundation concrete piles using Bragg grating optical fibre sensors”, Eng. Struct. 29 2048–2055 (2007).
144. W. Lee, W.J. Lee, S.B. Lee, R. Salgado, “Measurement of pile load transfer using the fiber Bragg grating sensor system”, Can. Geotech. J. 41, 1222–1232 (2004).
145. V. Slowik, E. Schlattner, T. Klink, “Experimental investigation into early age shrinkage of cement paste by using fibre Bragg gratings”, Cem. Concr. Comp. 26, 473–479 (2004)
146. A.C. Wong, P.A. Childs, R. Berndt, T. Macken, G.D. Peng, N. Gowripalan, “Simul-taneous measurement of shrinkage and temperature of reactive powderconcrete at early age using fibre Bragg grating sensors”, Cem. Concr. Comp.29, 490–497. (2007).
Introduction to Fiber Optic Sensors
33
147. M. Rajesh, K. Geetha, M. Sheeba, P. Radhakrishnan, C.P.G. Vallabhan and V.P.N. Nampoori, “A fiber optic smart sensor for studying the setting characteristics of various grades of cement”, Opt. Lasers Eng. 44, 486–493 (2006)
148. P.S. Andréa, Humberto Varum, Paulo Antunes, Licínio Ferreira and M.G. Sousa, “Monitoring of the concrete curing process using plastic optical fibers”, Measurement 45, 556–560 (2012).
149. M Sheeba, M Rajesh, C P G Vallabhan, V P N Nampoori and P Radhakrishnan, “Fiber optic sensor for the detection of adulterant traces in coconut oil”, Meas. Sci. Technol. 16, 2247-2250 (2005)
150. R. Falate, R.C. Kamikawachi, M. M¨uller, H.J. Kalinowski, J.L. Fabris, “Fiber optic sensors for hydrocarbon detection”, Sens. Actuators, B 105, 430–436 (2005)
151. R Falate, K Nike,Pedro Ramos da Costa Neto, Eduardo Caçao Jr., Marcia Muller, Hypolito Jose Kalinowski and Jose Luis Fabris, “Alternative Technique For Biodiesel Quality Control Using An Optical Fiber Long period Grating Sensor”, Quim. Nova 30, 1677-1680 (2007)
152. G R C Possetti, L C Cocco, C I Yamamoto, L V R de Arruda, R Falate, M Muller and J L Fabris, “Application of a long-period fiber grating-based transducer in the fuel industry”, Meas. Sci. Technol. 20, 034012(1-9) (2009)
153. V Mishra, S C Jain, N Singh, G C Poddar and P Kapur,” Fuel Adulteration Detection using Long Period Fiber Grating Sensor Technology”, Indian J. Pure Ap. Phy. 46, 106-110 (2008)
154. A. Balaji Ganesh, T. K. Radhakrishnan, “Fiber-Optic pH Sensor Fiber Integrated Opt. 25, 403–409 ( 2006)
155. Wolthuis, R., D. McCrae, E. Saaski, J. Hartl, and G. Mitchell. “Development of medical fiber-optic pH sensor based on optical absorption”, IEEE Trans. Biomed. Eng. 39, 531-535 (1992).
156. Lin, J., and D. Liu. “An optical pH sensor with a linear response over a broad range”, Anal. Chim. Acta. 408, 49-54 (2000).
157. Delana, A. N., M. V. Schiza, and S. M. Angel, “Multilayer sol-gel membranes for optical sensing applications: Single layer pH and dual layer CO2 and NH3 sensors”, Talanta 58, 543-551 (2002).
158. Jin, J., and Z. Rosenzweig. “Fiber optic pH/Ca2+ fluorescence microsensor based on spectral processing of sensing signals”, Anal. Chim. Acta. 397, 93-98 (1999).
159. John, E. L., and S. S. Saavedra. “Evanescent sensing in doped sol-gel glass films”, Anal.Chim. Acta 285, 265-269 (1994).
160. C S Burke, L Polerecky and B D MacCraith, “Design and fabrication of enhanced polymer waveguide platforms for absorption-based optical chemical sensors”, Meas. Sci. Technol. 15, 1140–1145 (2004)
161. G R C Possetti, R C Kamikawachi, C L Prevedello, M Muller, and J L Fabris, “Salinity measurement in water environment with a long period grating based interferometer”, Meas. Sci. Technol. 20, 034003 (1-6) (2009)
162. Samer K. Abi Kaed Bey , Cathy Chung Chun Lam, Tong Sun, Kenneth T.V. Grattan, “Chloride ion optical sensing using a long period grating pair”, Sens. Actuators, A 141, 390–395(2008)
163. Masayuki Yokota and Toshihiko Yoshino, “An optical-fiber water-concentration sensor using Tm3+:YAG fluorescent light”, Meas. Sci. Technol. 11, 152–156 (2000)

Introduction to Fiber Optic Sensors
34
164. Yoshiaki Kurauchi , Takayuki Yanai, Naoyoshi Egashira and Kazuya Ohga, “Fiber-Optic Sensor with a Chitosan/Poly(vinyl alcohol) Cladding for the Determination of Ethanol in Alcoholic Beverages”, Anal. Sci. 10, 213-217 (1994)
165. T. Venugopalan, Teck L. Yeo, Tong Sun, and Kenneth T. V. Grattan, “LPG-Based PVA Coated Sensor for Relative Humidity Measurement”, IEEE Sens. J. 8,1093-1098 (2008)
166. LiweiWang, Yang Liu, Min Zhang, Dongsheng Tu, Xianhui Mao and Yanbiao Liao, “A relative humidity sensor using a hydrogel-coated long period grating”, Meas. Sci. Technol. 18, 3131–3134 (2007)
167. T. Venugopalan, T. Sun, K.T.V. Grattan, “Long period grating-based humidity sensor for potential structural health monitoring”, Sens. Actuators, A 148, 57–62 (2008)
168. Ainhoa Gaston, Fatima Perez, and Joaquın Sevilla, “Optical fiber relative-humidity sensor with polyvinyl alcohol film”, Appl. Opt. 43, 4127-4132 (2004)
169. Francisco J. Arregui, Zuri Ciaurriz, Maria Oneca, Ignacio R. Matıas, “An experimental study about hydrogels for the fabrication of optical fiber humidity sensors”, Sens. Actuators, B 96, 165–172 (2003)
170. Jinesh Mathew, Yuliya Semenova,Ginu Rajan,Pengfei Wang and Gerald Farrell, “Improving the sensitivity of a humidity sensor based on fiber bend coated with a hygroscopic coating”, Opt. Laser Technol. 43, 1301–1305 (2011)
171. Anu Vijayan , Madhavi Fuke , Ranjit Hawaldar, Milind Kulkarni , D. Amalnerkar , R.C. Aiyer, “Optical fiber based humidity sensor using Co-polyaniline clad”, Sens. Actuators, B 129, 106–112 (2008)
172. Wenqing Cao, Yixiang Duan, “Optical fiber-based evanescent ammonia sensor”, Sens. Actuators, B 110, 252–259 (2005)
173. Mark A. Arnold and Tiffany J. Ostler, “Fiber Optic Ammonia Gas Sensing Probe”, Anal. Chem. 58, 1137-1140 (1986)
174. Otto S. Wolfbeis, Leonie J. Weis, Marc J. P. Leiner and Werner E. Ziegler “Fiber-optic Fluorosensor for Oxygen and Carbon Dioxide”, Anal. Chem. 60, 2028-2030 (1988).
175. Mahesh Uttamlal and David R. Wal, “A Fiber-Optic Carbon Dioxide Sensor for Fermentation Monitoring”, Nat. Biotechnol. 13, 597 - 601 (1995)
176. Otto S. Wolfbeis, Barna Kovdcs, Kisholoy Goswami and Stanley M. Klainer, “Fiber-Optic Fluorescence Carbon Dioxide Sensor for Environmental Monitoring”, Mikrochim. Acta 129, 181-188 (1998)
177. Christjanem Unkholm, David R. Walt and Fred P. Milanovich, “A Fiber-Optic Sensor for CO2 Measurement”, Talanta 35, 109-112 (1988).
178. S. Sekimoto, H. Nakagawa , S. Okazaki, K. Fukuda, S. Asakura, T Shigemori and S. Takahashi, “A fiber-optic evanescent-wave hydrogen gas sensor using palladium-supported tungsten oxide”, Sens. Actuators, B 66, 142–145 (2000).
179. Susan L. R. Barker, Raoul Kopelman, Terrance E. Meyer and Michael A. Cusanovich, “Fiber-Optic Nitric Oxide-Selective Biosensors and Nanosensors”, Anal. Chem. 70, 971-976 (1998).
180. Sheila A. Grant, Joe H. Satcher Jr. and Kerry Bettencourt, “Development of sol–gel-based fiber optic nitrogen dioxide gas sensors”, Sens. Actuators, B 69, 132–137 (2000).

Introduction to Fiber Optic Sensors
35
181. Shelly John Mechery and Jagdish P. Singh, “Fiber optic based gas sensor with nanoporous structure for the selective detection of NO2 in air samples”, Anal. Chim. Acta. 557, 123–129 (2006)

Chapter II
Fiber optic sensor for determining the quality of alcohol-water mixtures
2.1 Introduction
Water is an almost universal solvent and aqueous solutions of
alcohols have found widespread use in several sectors such as beverage
industries, personal care products, pharmaceutical and chemical industry,
chromatography solvents to food additives, supercritical water technology
etc [1]. They have also found use in bio science as solvents assisting protein
denaturation due to the promotion of the R-helix structure of peptides and
proteins [1]. Hence in-situ detection and quantification of alcohol with high
sensitivity and selectivity is a critical factor in many industrial as well as
biotechnical applications. Moreover accurate measurement of ethanol is
unavoidable in clinical and forensic analysis in order to analyze human body
fluids like blood, serum, urine and breath. In order to manage fermentation
process and thus to control the quality of products, detection of ethanol is
important in food [2,3] and beverage industries [4,5].
This wide application range is due to the fact that a lot of physical
and chemical properties of alcohol-water mixtures exhibit nonlinear
dependence on solvent composition and shows peaks at certain critical
concentrations depending on the nature of alcohol [6-9]. With increasing
chain length, the solubility of alcohols in water decreases and among
monohydroxyl alcohols that are miscible with water in any proportion, tert-
butyl alcohol (TBA) possesses the biggest alkyl group. The TBA-water
mixture is characterized by anomalies like a sharp minimum of the Excess
molal volume and a maximum of the molal heat capacity at TBA molar
fraction 0.04 [10]. Sato et al. have shown in a series of publications that the
thermodynamics of mixing of short alcohols such as ethanol [11], methanol
[12], 1-propanol [13] and 2-propanol [14] with water are complex functions
of the liquid composition.
While much is known about the macroscopic chemical behavior of
these solutions, the solvation structure is poorly understood for many

Fiber optic sensor for determining the quality of alcohol-water mixtures
37
aqueous alcohols. Since alcohol molecules possess alkyl and hydroxyl
groups, the way of dissolution in water is highly complicated due to the
hydrophilic and hydrophobic interactions of alcohol and water molecules in
solution, which in turn cause the anomalies [15]. Binary mixtures of alcohol
and water were studied extensively using various techniques like X-ray
absorption and X-ray emission(XA and XE) [16], ultrafast spectroscopy [17],
Infrared (IR) absorption spectroscopy [18], neutron diffraction[19,20,21],
Small-angle X-ray Scattering (SAXS) [22,23], light scattering [24-26],
microwave analysis [27], time resolved spectroscopy [28], computer
simulations[29-34] etc., in the light of hydrogen-bond network, aggregation,
hydrophobic interaction, ‘clathrate’ formation, and ‘hydrophobic hydration’
for several years to correlate solution structure with the observed anomalies.
Even after being investigated for decades, the structure and topology of the
hydrogen-bonded network in aqueous solutions of alcohols is an area where
open questions still remain and the conclusions drawn from experimental
studies are conflicting [16,19]. The observed anomalies with alcohol-water
mixtures were first attributed to the ice-like or clathrate-like structures
created in surrounding water due to the hydrophobic head groups present in
alcohol [21,25,26,35-38]. The results shown by neutron diffraction
experiments [19] and x-ray emission spectroscopy [16] clearly challenge the
“iceberg” model and suggest that rather than being enhanced or depleted, the
structure of water in the mixture is close to that of the pure liquid. However,
there are obvious inconsistencies between these experimental studies. The
small fraction (~0.13) of water molecules predicted by Dixit et al. [19] to
exist singly with no hydrogen-bonds to other water molecules is suggested to
be incompatible with the simulated XE spectra of Guo et al.[16]. According
to theoretical studies based on the RISM (Reference Interaction Site Model)
approach, alcohol molecule resides in the cavity of the H-bonding network
created by the surrounding water molecules which, in turn, lowers the
compressibility of the medium [34]. However, with further addition of
alcohol, the tetrahedral network structure gradually converts to the zigzag
chain structure of alcohol increasing the compressibility of the water–alcohol
mixtures [34]. Recently Naiping et.al. have reported the influence of
structure formation with ethanol and water on the taste or brand preference
of the otherwise colorless and tasteless water-ethanol solution called vodka
[39].

Fiber optic sensor for determining the quality of alcohol-water mixtures
38
Thus understanding the structure of molecules in alcohol-water
solutions and the evaluation of alcohol concentration in alcohol-water
mixture is currently a considerable challenge. During the last decades many
analytical methods have been developed for the measurement of ethanol and
other alcohols [40,41] and can be classified into three major categories
namely chromatographic[42-44], resistive[45-60], capacitive [61] and
optical[62,63]. Among these techniques, the chromatographic method is the
most accurate and sensitive with a lower limit of ethanol detection on the
order of 0.005% v/v reported by Zimbo et.al. [44]. Drawbacks of this method
include high cost, as well as the necessity for sample pretreatment and long
operation times. Somewhat less precise but more rapid measurements are
achieved by the use of resistive methods where enzymes [46- 49], metal
oxides [50-53] nanoparticles [54-59] and polymers [60] are used as sensing
materials. Enzyme based ethanol concentration detection is based on either
of two enzymes, alcohol oxidase or alcohol dehydrogenase, by monitoring
O2 consumption or H2O2 formation [46-48]. The specificity of the enzyme
binding sites provides highly selective and accurate sensors. The
disadvantage of the sensors lies in their instability due to protein denaturing
when exposed to high temperature, pressure, or pH extremes. Regarding
nanoparticle based detection, Hsueh et.al. reported a highly sensitive ethanol
vapor sensor based on ZnO nanowire [54]. A zinc oxide based ceramic semi-
conductor ethanol gas sensor was reported by Bhooloka Rao [55] while Tan
et.al. [56,58,59] presented different sensors based on nano-sized α -Fe2O3
with SnO2, ZrO2, TiO2 solid solutions. A polymer based sensor was designed
by Lee et.al [60] while Dubas et.al [64] developed an absorbance based
ethanol sensor using dye–Chitosan polyelectrolyte multilayers.
Among various sensing techniques, the simplest approach in the
determination of alcohols is an optical sensor based method. Optical sensors
generally have the advantages of low-cost manufacturability, safety, and
miniaturization and are intended for use in real-time, in situ monitoring.
Several authors have reported optical ethanol sensors based on fluorescence
[65-72], Raman spectroscopy [73], Fabry Perot cavity [74] and optical fibers
[75-80].
Due to their inherent advantages, fiber optic sensors are an ideal choice and
have been implemented for the detection of ethanol [81-83]. Passive

Fiber optic sensor for determining the quality of alcohol-water mixtures
39
nonselective fiber-optic sensors based on determination of refractive index
changes as a function of the alcohol content using surface plasmon resonance
[84] have been reported by Matsubara et. al. Recently fiber optic sensors
incorporating an active sensitive terminal have been developed for
monitoring lower alcohols in gas or liquid mixtures. An optical fiber long-
period grating with solgel derived SnO2 coating was successfully
implemented by Gu et.al. [85,86] while Penza et.al. [87,88] have reported the
sensitivity of Langmuir–Blodgett (LB) films with single-walled carbon
nanotubes (SWCNTs) for ethanol vapour detection.
This chapter describes the fabrication of an extrinsic fiber optic
sensor probe by using etched plastic clad silica (PCS) fiber. Also we discuss
the theory and principle of operation of the designed fiber optic probe and
the successful utilization of the probe for quantifying alcohol concentration
in their binary mixtures with water. The designed sensor works on the
principle of hydrophilic adhesion of molecules on to the silica fiber and can
be effectively utilized for determining the concentration of ethanol, methanol
and 2-propanol in their binary mixtures with water.
2.2 Fabrication of fiber probe
The designed sensor probe consists of two fibers, one of which
transmits light into the medium to be investigated and the second fiber
directs the modulated light back into the photo detector. We have used
plastic clad, step index silica fiber with a core diameter of 400 µm (Newport
F-MBC, 0.37 NA) having a length of 50 cm for the probe preparation. After
removing the sheath from the tip of both the fibers (around 1mm), the tip is
dipped in acetone for removing the cladding. The prepared tip of each of the
fiber is then dipped in hydro fluoric acid (48%) for about 30 minutes for
etching. Etching produces a tapered region with a core of reduced diameter
and both the fibers are then aligned parallel and glued together at one end as
shown in figure 2.1 to form the sensor probe.

Fiber optic sensor for determining the quality of alcohol-water mixtures
40
2.3 Theory
The principle underlying the working of the sensor probe is explained
by Kumar et.al [89]. Consider the fiber structure shown in figure 2.2. Light
from a multimode fiber of core diameter d, is coupled into the decladded
fiber region of smaller diameter de through an intermediate taper which is
also decladded. The core refractive indices of all these three regions are same
(ni)
Figure 2.1 Structure of fiber probe

Fiber optic sensor for determining the quality of alcohol-water mixtures
41
222
22
0
cli
li
nnR
nnPP
When light propagates from a fiber of diameter d to a region of diameter
de through a tapered region, the fraction of optical power coupled is given by
Kumar et al. [89] as
(2.1)
where P0 is the input power, ni is the core refractive index, ncl the cladding
refractive index and nl the refractive index of the medium surrounding the
taper and R=d/ de. From (1) it is clear that the coupled power P decreases
with the increase in nl2. Thus power lost to the surrounding medium through
the tapered region P0-P is proportional to the refractive index of the
surrounding medium, nl.
2.4 Simulation studies
In order to study the working of the sensor probe a planar structure
with parameters similar to that of the fiber is simulated using BeamPROP
software package of RSoft.
Figure 2.2 Fiber structure

Fiber optic sensor for determining the quality of alcohol-water mixtures
42
A structure as shown in figure 2.3 is simulated where there is a core
at the center having a width of 400 μm and refractive index 1.45. Laterally,
the core extends to cladding of thickness 10 μm on either side with a
refractive index of 1.4. Then on either side there is a layer analogous to
sheath with a thickness of 105 μm making the total lateral width 630 μm.
Axially, the core extends to a tapered region without the cladding and sheath
layer. Then there is a layer corresponding to etched layer having width less
than 400 μm . Two such structures are aligned exactly parallel like the fiber
probe. Light of wavelength 532nm is coupled to one of the fibers and light
propagation was simulated using the software. The field patterns thus
Figure 2.3 Structure of the fiber probe for simulation
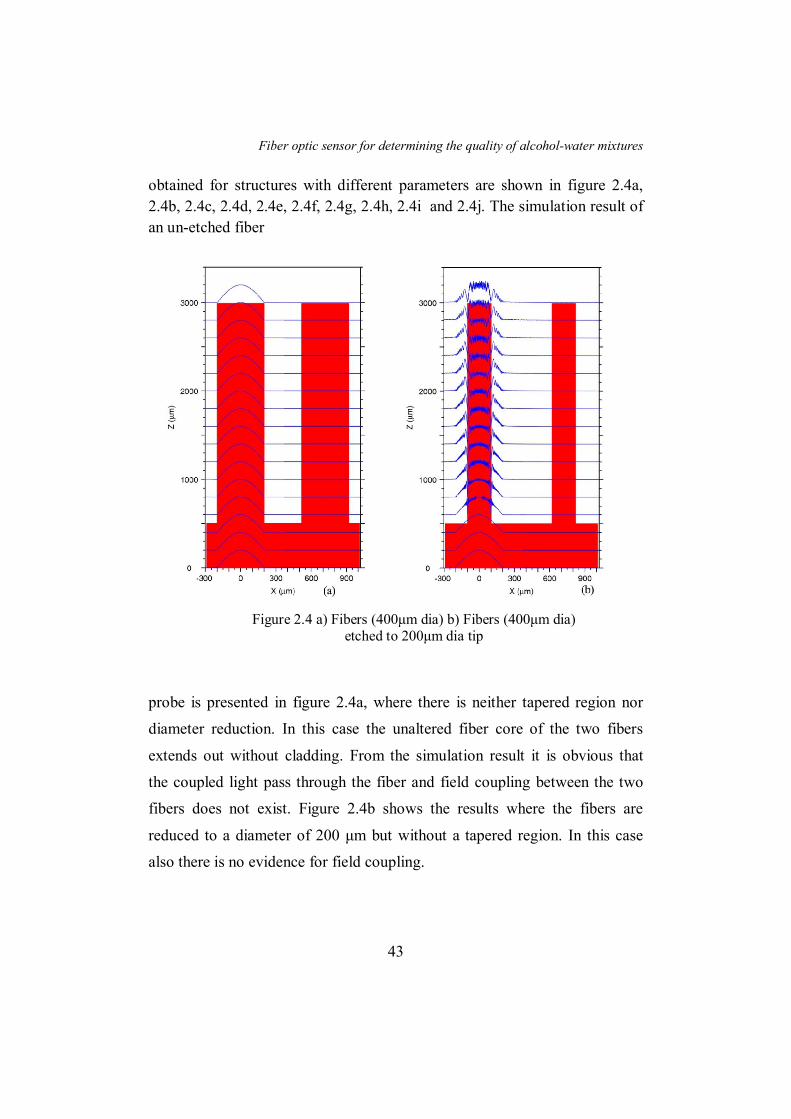
Fiber optic sensor for determining the quality of alcohol-water mixtures
43
obtained for structures with different parameters are shown in figure 2.4a,
2.4b, 2.4c, 2.4d, 2.4e, 2.4f, 2.4g, 2.4h, 2.4i and 2.4j. The simulation result of
an un-etched fiber
probe is presented in figure 2.4a, where there is neither tapered region nor
diameter reduction. In this case the unaltered fiber core of the two fibers
extends out without cladding. From the simulation result it is obvious that
the coupled light pass through the fiber and field coupling between the two
fibers does not exist. Figure 2.4b shows the results where the fibers are
reduced to a diameter of 200 μm but without a tapered region. In this case
also there is no evidence for field coupling.
Figure 2.4 a) Fibers (400μm dia) b) Fibers (400μm dia) etched to 200μm dia tip
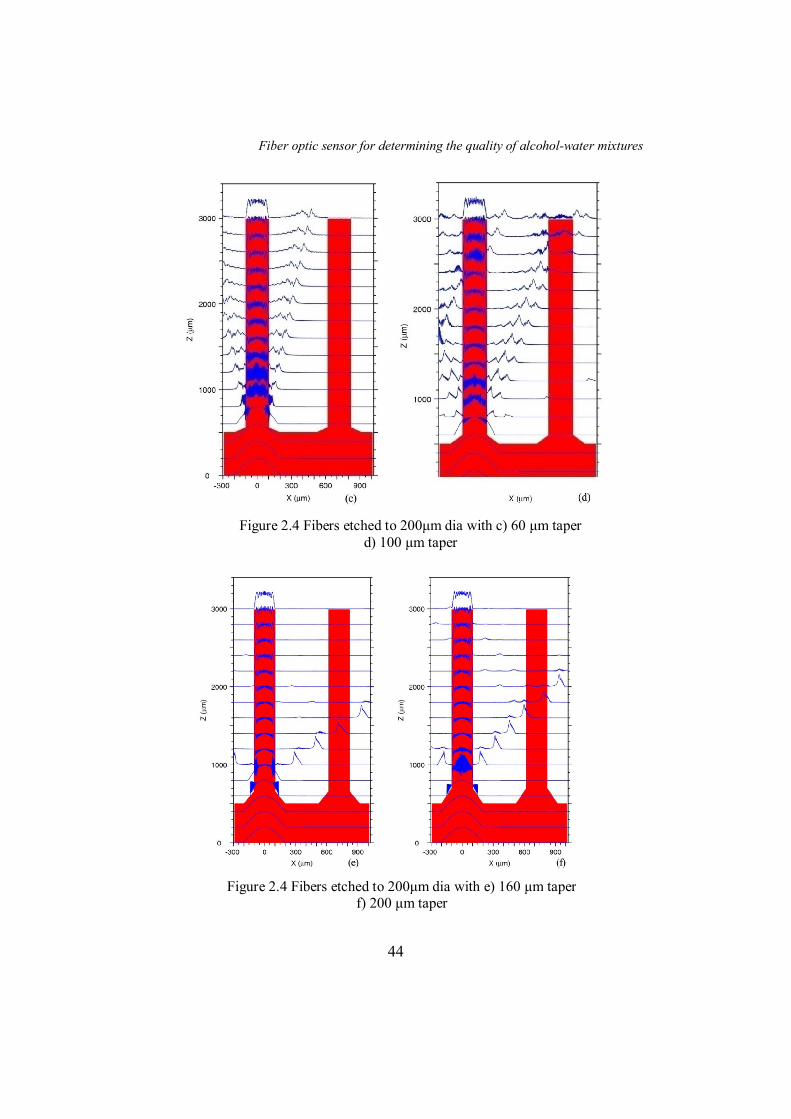
Fiber optic sensor for determining the quality of alcohol-water mixtures
44
Figure 2.4 Fibers etched to 200μm dia with c) 60 μm taper d) 100 μm taper
Figure 2.4 Fibers etched to 200μm dia with e) 160 μm taper f) 200 μm taper

Fiber optic sensor for determining the quality of alcohol-water mixtures
45
Figure 2.4 Fibers etched to 200μm dia with g) 260 μm taper h) 300 μm taper
Figure 2.4 i)Fiber etched to 100μm dia with 200 μm taper j) Fiber etched to 300μm dia with 300 μm taper

Fiber optic sensor for determining the quality of alcohol-water mixtures
46
Figures 2.4c, 2.4d, 2.4e, 2.4f, 2.4g and 2.4h shows the results for probes with
tapered regions of different lengths and a narrowed core of width 200 μm.
The height of the tapered region is 60 μm in the case of figure 2.4c while it is
100 μm , 160 μm , 200 μm , 260 μm and 300 μm respectively for figures
2.4d, 2.4e, 2.4f, 2.4g and 2.4h. Figure 2.4i shows the result for the probe
where the tapered region has a height of 200 μm and the etched core has a
width of 100 μm. From the graphs it is evident that there exists field
coupling from the input fiber to the other and its strength varies with the
dimension of the tapered region.
2.5 Experimental
The experimental setup used for the study is presented in figure
2.5.The emission from a 20mW diode pumped solid state laser source
(λ=532 nm) is launched into one of the fiber arms of the sensor. The
modulated optical signal is collected by the second arm, which is coupled to
the detector head (Newport 818-SL) of a power meter (Newport 1815-C). To
move the fiber probe in and out of liquid, the liquid carrying beaker is kept
on a translation stage which can be moved with a resolution of 10μm.
Figure 2.5 Schematic diagram of the experimental setup

Fiber optic sensor for determining the quality of alcohol-water mixtures
47
2.6 Results and Discussions
We used pure water as the test medium to investigate the response of
the fiber probe to liquid medium. Water was taken in the beaker and the
probe was immersed in and then pulled out from water using the translation
stage. The output power is plotted as a function of the liquid level
displacement from the tip of the fiber probe and is shown in figure 2.7. The
curve ABCD is the response obtained while moving the probe into water
from air and DEFG represents the response obtained for the probe
displacement in the opposite direction. The point ‘A’ represents the output
power when the probe was in air while ‘B’ indicates the point where the tip
touched water surface. The point ‘C’ represents the intersection point of
water surface and the tapered region. When the fiber probe is in air, a part of
light intensity leaks through the etched region of the input fiber and gets
coupled into the output fiber as shown in the simulation results. The coupled
light then reflects back from the tip of the second fiber and is collected back
Figure 2.6 Photograph of the experimental setup for sensing

Fiber optic sensor for determining the quality of alcohol-water mixtures
48
at the receiver. This power remains constant, and can be termed as the
reference value. The detector output reduces from the reference value when
the probe is immersed in water. A sharp increase in output is obtained when
the probe tip is pulled out of water surface as shown by the curve FG in
figure 2.7. The marking ‘F’ corresponds to the point where the probe tip is
just out of water surface. The marking ‘B’ corresponds to the point at which
the probe tip touch water surface while moving in and ‘F’ the point at which
the tip leaves the water surface while moving out. A separation of around
750μm is observed between ‘B’ and ‘F’ and this is due to the surface tension
effect of water.
To explain this phenomenon of sharp increase in output, another
experiment was conducted. Light was allowed to pass through a silica fiber
which has a decladded region and the output was recorded. Then a medium
of higher refractive index was added around the decladded region and the
varying intensity as a function of time was recorded. The experiment was
Figure 2.7 Response of the probe when dipped and pulled out of water

Fiber optic sensor for determining the quality of alcohol-water mixtures
49
done with liquids like ethanol (RI 1.36), 2-propanol (RI 1.375) and water (RI
1.33). Another medium with a higher refractive index was made by mixing
ethyleneglycol and water having a measures refractive index 1.43. The
experiment was repeated for this liquid too. The result thus obtained is
shown in figure 2.8. From the basic theories of decladded optical fiber, it is
clear that the output should decrease when a medium with refractive index
higher than 1 is added around the decladded region. From the result it is
observed that for water the output increases while for all other liquids it
decreases. Silica is hydrophilic in nature and hence water molecules adsorb
on to the fiber [90]. This enhances back reflection of light into the core at the
core medium interface and hence causes the increase in output. Adsorption
does not happen in the case of alcohols and the medium with refractive index
1.43. An entirely opposite response was obtained when the silica fiber was
replaced with a polymer optical fiber and the result is shown in figure 2.9. In
this case the output power reduced when water was the ambient medium
while it increased when ethanol was introduced.
Figure 2.8 Response of decladded PCS fiber towards various ambient liquids
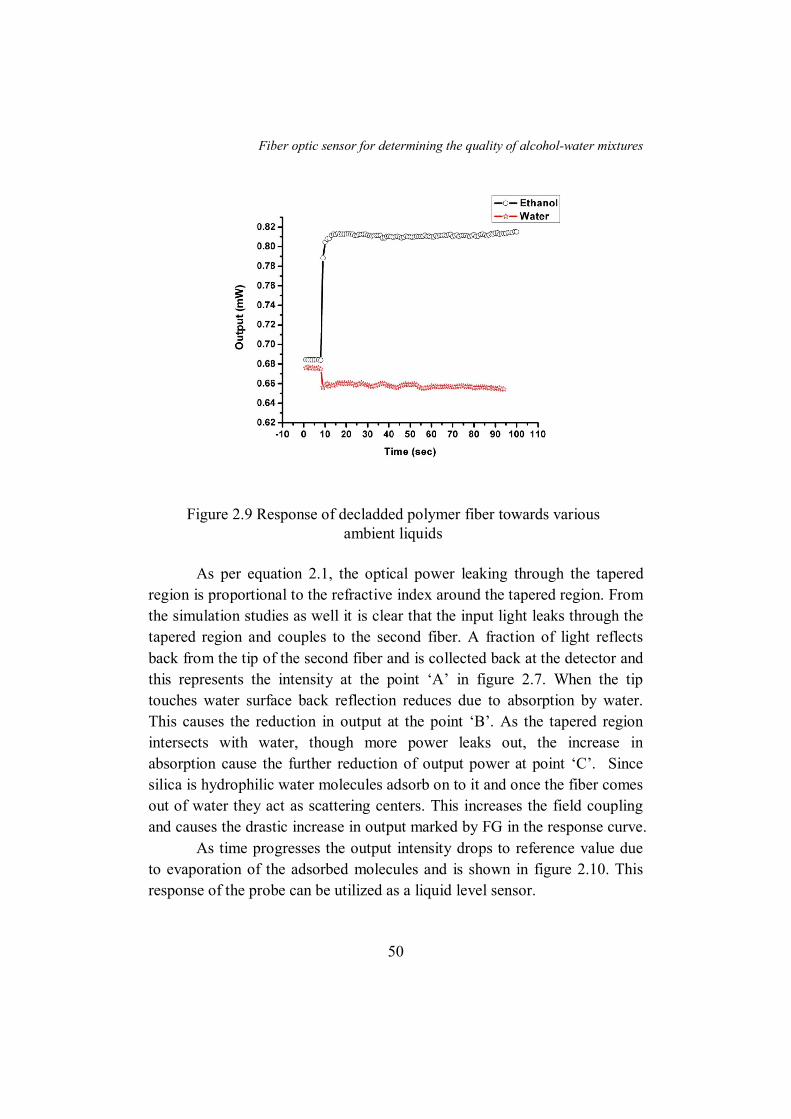
Fiber optic sensor for determining the quality of alcohol-water mixtures
50
As per equation 2.1, the optical power leaking through the tapered
region is proportional to the refractive index around the tapered region. From
the simulation studies as well it is clear that the input light leaks through the
tapered region and couples to the second fiber. A fraction of light reflects
back from the tip of the second fiber and is collected back at the detector and
this represents the intensity at the point ‘A’ in figure 2.7. When the tip
touches water surface back reflection reduces due to absorption by water.
This causes the reduction in output at the point ‘B’. As the tapered region
intersects with water, though more power leaks out, the increase in
absorption cause the further reduction of output power at point ‘C’. Since
silica is hydrophilic water molecules adsorb on to it and once the fiber comes
out of water they act as scattering centers. This increases the field coupling
and causes the drastic increase in output marked by FG in the response curve.
As time progresses the output intensity drops to reference value due
to evaporation of the adsorbed molecules and is shown in figure 2.10. This
response of the probe can be utilized as a liquid level sensor.
Figure 2.9 Response of decladded polymer fiber towards various ambient liquids

Fiber optic sensor for determining the quality of alcohol-water mixtures
51
To further verify these conclusions, the experiment was repeated
using ethanol water mixtures. Ethanol was mixed with de ionized water at
various volumetric ratios using ultrasonicator to prepare the test solutions at
required concentrations. Efforts were taken to conduct experiments at
constant temperature of 250C. The beaker filled with the test solution was
kept on the translational stage (figure 2.5) and after immersing in it, the
probe was pulled out. The initial intensity maximum and the time taken by
the intensity to drop to the reference value were recorded for each ethanol
concentration. The evaporation rate of ethanol is higher than that of water
and it is obvious that in this mixture with water the evaporation rate increase
with the increase in ethanol concentration. The time taken by the response to
reach reference as a function of ethanol volumetric concentration is given in
figure 2.11. From the response given in figure 2.11, it is evident that the
output drops to reference value at a faster rate when the ethanol
Figure 2.10 Detector output decreasing with time

Fiber optic sensor for determining the quality of alcohol-water mixtures
52
concentration is higher. As the ethanol concentration in the solution became
high (more than 80%) the sudden rise in the intensity was not observed. This
proves the assumption of molecular adsorption on to the fiber. These
adsorbed molecules cause the sudden increase in output and eventually on
evaporation the output drops to reference value. Since ethanol does not have
hydrophilic head groups adsorption does not occur.
Another interesting observation from the experiment with ethanol
water solution is that the initial intensity maximum varies with ethanol
concentration. The plot in figure 2.12 gives the output intensity as a function
of ethanol concentration where the X axis gives the volumetric percentage of
ethanol in the solution and Y axis gives the ratio of the maximum output to
that of the reference value. Even though the maximum output and the ratio of
maximum output to the reference value gives the same trend, the method of
taking the ratio helps in reducing noise due to the ambient light. We repeated
Figure 2.11 Time required for the intensity to drop to reference value

Fiber optic sensor for determining the quality of alcohol-water mixtures
53
the experiment several times by varying the input power, wavelength of the
laser etc but the curve peaks around 60% V/V concentration and when
converted to mole fraction of ethanol it is around 0.3. The experiment was repeated with aqueous mixtures of methanol and
2-propanol and the results obtained are shown in figure 2.13 and figure 2.14
respectively.
From the results obtained using the probe for ethanol, methanol and
2-propanol it is obvious that the probe can be used as a sensor for
determining the volumetric concentration of alcohol-water binary mixture. In
the case of ethanol it is evident from figure 2.12 that the response is almost
linear in the ethanol volumetric concentration range 0% to 60% and 60% to
90%. In the case of methanol the response is linear (figure 2.13) in the
volumetric concentration range 50% to100% while for 2-propanol (figure
2.14) the linear range for volumetric concentration is in between 0% to 40%
and 40% to 100%.
Figure 2.12 Sensor output as a function of ethanol concentration

Fiber optic sensor for determining the quality of alcohol-water mixtures
54
Figure 2.13 Sensor output as a function of methanol concentration
Figure 2.14 Sensor output as a function of 2-propanol concentration

Fiber optic sensor for determining the quality of alcohol-water mixtures
55
The results reveal that the phenomenon is related to molecular level
and hence rather than volumetric ratio mole fraction gives a better insight. In
order to compare the results the sensor parameter was normalized and plotted
as a function of alcohol mole fraction. The results thus obtained for methanol,
ethanol and 2-propanol are shown in figure 2.15 while that for tert-butanol is
shown in figure 2.16. The plots give the variation of the sensor parameter as
a function of alcohol mole fraction. The X axis gives the mole fraction of
alcohol in the solution while the Y axis gives the normalized ratio of the
initial maximum output (detector output just after pulling out the probe from
liquid) to that of the reference value (detector output just before immersing
the probe into the liquid).
Figure 2.15 Normalized sensor parameter as a function of alcohol
mole fraction.

Fiber optic sensor for determining the quality of alcohol-water mixtures
56
It is evident from figure 2.15 that methanol and ethanol shows
maximum output intensity at the alcohol mole fraction of 0.3 and 2-propanol
at 0.15. Tert-butanol shows a different type of response in which the output
intensity starts to decrease at the mole fraction of 0.05 and shows a dip at
0.1(figure 2.16). These critical mole fractions obtained using the fiber probe
is similar to the values available in the literature and hence the response can
be explained only in terms of cluster formation in the alcohol water mixture.
Butanol and higher alcohols are more hydrophobic in nature and the alcohol
molecules take part directly in the micellization process and become unique
components of the micelle aggregate whereas the less hydrophobic alcohols,
methanol to propanol, are mainly soluble in aqueous solution [91].
In its pure form water molecules form cluster of around 30 molecules
and on addition of alcohol molecules these clusters start to break due to
hydrophobic interaction between water and alcohol molecules [91]. In the
case of methanol, ethanol and 2-propanol, the large structure of water break
down completely at the critical concentration causing a drastic reduction in
the cluster size of water. This reduction in size of the water cluster eventually
Figure 2.16 Sensor parameter as a function of tert-butanol mole fraction.

Fiber optic sensor for determining the quality of alcohol-water mixtures
57
reduces scattering which in turn causes a decrease in light coupling. Further
addition of alcohol reduces the hydrophilic head groups per unit volume and
hence the output power reduces continuously.
In the case of tert-butanol, the decrease in intensity after first critical
point at 0.05 can be attributed to the breakdown of water structure. Unlike in
the case of other alcohols, micellization occurs in tert-butanol-water mixtures.
The tert-btanol molecules encapsulate water molecules and this causes a
drought in hydrophilic head groups in the solution. This can be the cause of
the sharp dip at mole fraction of 0.1.
Conclusions
In this chapter we discussed the design and fabrication of an intensity
modulated extrinsic optical fiber sensor probe. The probe was fabricated by
chemically etching a plastic clad silica fiber using hydro fluoric acid. The
theory of working was explained and the simulation results using RSoft was
presented. The effective use of the probe as a water level detector was
explained. The probe was used for the measurement of critical concentration
of binary mixtures of alcohol and water. The critical mole fractions obtained
using the robust and inexpensive probe are 0.3 for methanol and ethanol,
0.15 for 2-propanol and 0.05 and 0.1 for tert-butanol, which agrees well with
the values found using methods like neutron diffraction studies and
microwave analysis. The results also give an evidence for micellization in
tert-butanol water mixtures. The probe can be effectively used for quality
evaluation of alcohol-water mixtures which has applications in food and
beverage industries.
References
1. F Franks, Water Science Reviews, vol. 1, (Cambridge University Press, Cambridge, UK, 1985)
2. Stanislav Miertu, Jaroslav Katrlik, Andrea Pizzariello , Miroslav Stredansky, Juraj S vitel , Jozef S Vorc, “Amperometric biosensors based on solid binding matrices applied in food quality monitoring”. Biosens. Bioelectron. 13,911–923 (1998)
3. M. Boujtita, M. Chapleau, N. El. Murr, “Biosensors for analysis of ethanol in food: effect of the pasting liquid”. Anal. Chim. Acta 319,91-96 (1996)
4. Mohammed Boujtita , John P. Hart , Robin Pittson, “Development of a disposable ethanol biosensor based on a chemically modified screen-printed electrode coated with alcohol oxidase for the analysis of beer”, Biosens. Bioelectron. 15,257–263 (2000)
Fiber optic sensor for determining the quality of alcohol-water mixtures
58
5. Mihaela Niculescu, Thomas Erichsen , Valentin Sukharev, Zoltan Kerenyi , Elisabeth Csöregi, and Wolfgang Schuhmann, “Quinohemoprotein alcohol dehydrogenase-based reagentless amperometric biosensor for ethanol monitoring during wine fermentation”, Anal. Chim. Acta 463,39–51 (2002)
6. William D . T. Dale, Peter A Flavelle and Peeter Kruus, “Concentration fluctuations in water-methanol mixtures as studied by ultrasonic absorption”, Can. J. Chem. 54, 355-366 (1976)
7. Y. Nagasawa, Y. Nakagawa, A. Nagafuji, T. Okada and H. Miyasaka, “The microscopic viscosity of water–alcohol binary solvents studied by ultrafast spectroscopy utilizing diffusive phenyl ring rotation of malachite green as a probe”, J. Mol. Struct. 217, 735-736 (2005).
8. Shaoxian Song and Changsheng Peng, “Viscosities of Binary and Ternary Mixtures of Water, Alcohol, Acetone and Hexane”, J. Dispersion Sci. Technol. 29, 1367-1372 (2008).
9. Y. Tanaka, Y. Matsuda, H. Fujiwara, H. Kubota, and T. Makita, “Viscosity of (Water + Alcohol) Mixtures Under High Pressure”, Int. J. Thermophys. 8, 147-163 (1987).
10. Cees De Visser, Gerald Perron. and Jacques E. Desnoyes, “The heat capacities, vslumes, and expansibilities of tert-butyl alcohol - water mixtures from 6 to 65 0C”, Can. J. Chem. 55, 856-862 (1977)
11. T. Sato, A. Chiba, and R. Nozaki, “Dynamical aspects of mixing schemes in ethanol–water mixtures in terms of the excess partial molar activation free energy, enthalpy, and entropy of the dielectric relaxation process”, J. Chem. Phys. 110, 2508-2521 (1999)
12. T. Sato, A. Chiba, and R. Nozaki, “Hydrophobic hydration and molecular association in methanol–water mixtures studied by microwave dielectric analysis”, J. Chem. Phys. 112, 2924-2932 (2000).
13. T. Sato, A. Chiba, and R. Nozaki, “Composition-dependent dynamical structures of 1-propanol–water mixtures determined by dynamical dielectric properties”, J. Chem. Phys. 113, 9748-9758 (2000)
14. T Sato and R Buchner, “Dielectric relaxation spectroscopy of 2-propanol–water mixtures”, J. Chem. Phys. 118, 4606-4613 (2003).
15. G. Onori and A. Santucci, “Dynamical and structural properties of water/alcohol mixtures”, J. Mol. Liq, 69, 161-181 (1996).
16. J.-H. Guo, Y. Luo, A. Augustsson, S. Kashtanov, J.-E. Rubensson, D. K. Shuh, H. Agren and J. Nordgren, “Molecular Structure of Alcohol-Water Mixtures”, Phys. Rev. Lett. 91, 157401(1-4) (2003).
17. Y. Nagasawa, Y. Nakagawa, A. Nagafuji, T. Okada and H. Miyasaka, “The microscopic viscosity of water–alcohol binary solvents studied by ultrafast spectroscopy utilizing diffusive phenyl ring rotation of malachite green as a probe”, J. Mol. Struct. 735-736, 217-223 (2005).
18. N. Nishi, S. Takahashi, M. Matsumoto, A. Tanaka, K. Muraya, T. Takamuku and T. Yamaguchi, “Hydrogen Bonding Cluster Formation and Hydrophobic Solute Association in Aqueous Solution of Ethanol”, J. Phys. Chem. 99, 462-468 (1995).
19. S. Dixit, J. Crain, W. C. K. Poon, J. L. Finney and A. K. Soper, “Molecular segregation observed in a concentrated alcohol–water solution”, Nature 416, 829-832( 2002).
20. D. T. Bowron and J. L. Finney, “Association and Dissociation of an Aqueous Amphiphile at Elevated Temperatures”, J. Phys. Chem. B, 111, 9838-9852 (2007).

Fiber optic sensor for determining the quality of alcohol-water mixtures
59
21. A.K.Soper and J. L. Finney “ Hydration of Methanol in Aqueous Solution”, Phys.Rev.Lett. 71, 4346-4349 (1993)
22. K. Nishikawa, Y. Kodera, and T. Iijima, “Fluctuations in the Particle Number and Concentration and the Kirkwood-Buff Parameters of tert -Butyl Alcohol and Water Mixtures Studied by Small-Angle X-ray Scattering”, J. Phys. Chem., 91, 3694-3699 (1987).
23. Y. Koga, “A saxs study of concentration fluctuations in t-butanol—water system”, Chem.Phys.Lett 111, 176–180 (1984)
24. G.W.Euliss and C.M.Sorensen, “Dynamic light scattering studies of concentration fluctuations in aqueous t-butyl alchohol solutions”, J.Chem.Phys., 80, 4767-4773 (1984).
25. K Iwasaki and T Fujiyama, “Light-Scattering Study of Clathrate Hydrate Formation in Binary Mixtures of tert-Butyl Alcohol and Water”, J. Phys. Chem. 81, 1908-1912 (1977)
26. K Iwasaki and T Fujiyama, “Light-Scattering Study of Clathrate Hydrate Formation in Binary Mixtures of tert-Butyl Alcohol and Water. 2. Temperature Effect”, J. Phys. Chem. 83, 463-468 (1979)
27. T.Sato, A.Chiba and R.Nozaki, “Hydrophobic hydration and molecular association in methanol–water mixtures studied by microwave dielectric analysis”, J.Chem.Phys.,112, 2924-2932 (2000).
28. Tuhin Pradhan, Piue Ghoshal and Ranjit Biswas, “Structural transition in alcohol–water binary mixtures: A spectroscopic study”, J. Chem. Sci., 120, 275–287 (2008)
29. S. K. Allison, J. P. Fox, R. Hargreaves, and S. P. Bates, “Clustering and microimmiscibility in alcohol-water mixtures: Evidence from molecular-dynamics simulations”, Phys. Rev.B, 71, 024201(1-5) (2005).
30. K Yoshida, T Yamaguchi, A Kovalenko and F Hirata, “Structure of tert-Butyl Alcohol-Water Mixtures Studied by the RISM Theory”, J. Phys. Chem. B, 106, 5042-5049 (2002)
31. A. Laaksonen, P. G. Kusalik and I. M. Svishchev, “Three-Dimensional Structure in Water-Methanol Mixtures”, J. Phys. Chem. A 101, 5910-5918 (1997)
32. P G Kusalik, A P Lyubertsev, D L Bergman and A Laaksonen, “Computer Simulation Study of tert-Butyl Alcohol. 2. Structure in Aqueous Solution”, J. Phys. Chem. B104 ,9533-9539 (2000)
33. K Nakanishi, K Ikari, S Okazaki and H Touhara, “Computer experiments on aqueous solutions. III. Monte Carlo calculation on the hydration of tertiary butyl alcohol in an infinitely dilute aqueous solution with a new water–butanol pair potential”, J. Chem. Phys. 80, 1656-1670 (1984)
34. I Omelyan, A Kovalenko and F Hirata, “Compressibility of tert-Butyl Alcohol-Water Mixtures: The Rism Theory” J. Theor.Comput. Chem. 2 ,193-203 (2003)
35. Frank, H. S. and Evans, M. W,” Free volume and entropy in condensed systems. III. Entropy in binary liquid mixtures; partial molal entropy in dilute solutions; structure and thermodynamics in aqueous electrolytes”, J. Chem. Phys. 13, 507–532 (1945).
36. Tsai, J., Gerstein, M. and Levitt, M. “Keeping the shape but changing the charges: A simulation study of urea and its iso-steric analogs”, J. Chem. Phys. 104, 9417–9430 (1996).
37. Dixit, S., Poon, W. C. K. and Crain, J. “Hydration of methanol in aqueous solutions: a Raman spectroscopic study”, J. Phys. Condens. Matter 12, L323–L328 (1999).
Fiber optic sensor for determining the quality of alcohol-water mixtures
60
38. Wakisaka, A., Komatsu, S. and Usui, Y. “Solute–solvent and solvent–solvent interactions evaluated through clusters isolated from solutions: preferential solvation in water–alcohol mixtures”. J. Mol. Liq. 90, 175–184 (2001).
39. Naiping Hu, Dan Wu, Kelly Cross, Sergey Burikov, Tatiana Dolenko, Svetlana Patsaeva, and Dale W. Schaefer, “Structurability: A Collective Measure of the Structural Differences in Vodkas”, J. Agric. Food Chem., 58, 7394-7401 (2010).
40. D. N. Simon, R. Czolk, and H. J. Ache, “Doped sol-gel films for the development of optochemical ethanol sensors”, Thin Solid Films 260,107-110 (1995)
41. Yuan Gee Lee and Tse-Chuan Chou, “Ionic liquid ethanol sensor”. Biosens. Bioelectron. 20,33–40 (2004)
42. T Buttler, K.A.J.Johansson, L.G.O.Gorton, and G.A. Marko-Varga, “On-line fermentation process monitoring of carbohydrates and ethanol using tangentialflow filtration and column liquid chromatography”. Anal. Chem. 65, 2628–2636 (1993)
43. K.Johansson, G. Jonsson-Petterson, L. Gorton, G. Marko-Varga, and E. Csoregi, “A reagentless amperometric biosensor for alcohol detection in column liquid chromatography based on co-immobilized peroxidase and alcohol oxidase in carbon paste” J. Biotech. 31, 301–316 (1993)
44. M Zinbo, “Determination of one carbon to three-carbon alcohols and water in gasoline/alcohol blends by liquid chromatography”, Anal. Chem., 56, 244–247 (1994)
45. Henriette Jensenius, Jacob Thaysen, Anette A. Rasmussen, Lars H. Veje, Ole Hansen, and Anja Boisen, “A microcantilever-based alcohol vapor sensor-application and response model”, Appl.Phy.Lett. 76 , 2615-2617 (2000)
46. A.M Azevedo, D.M.F.Prazeres, J.M.S.Cabral, and L.P. Fonseca, “Ethanol biosensors based on alcohol oxidase” Biosens. Bioelectron. 21, 235–247 (2005)
47. M Boujitita, J.P. Hart, and R. Pittson, “Development of a disposable ethanol biosensor based on a chemically modified screen-printed electrode coated with alcohol oxidase for the analysis of beer”. Biosens. Bioelectron., 15, 257–263 (2000)
48. M. Boujtita, M. Chapleau and N. El Murr, “Biosensors for analysis of ethanol in food: effect of the pasting liquid”, Anal. Chim. Acta 319, 91-96 (1996)
49. Mihaela Niculescu, Thomas Erichsen , Valentin Sukharev , Zoltan Kerenyi , Elisabeth Csöregi , Wolfgang Schuhmann, “Quinohemoprotein alcohol dehydrogenase-based reagentless amperometric biosensor for ethanol monitoring during wine fermentation”, Anal. Chim. Acta 463, 39–51 (2002)
50. K K Makhija, Arabinda Ray, R M Patel, U B Trivedi and H N Kapse, “Indium oxide thin film based ammonia gas and ethanol vapour sensor”, Bull. Mater. Sci. 28 , 9–17 (2005)
51. G. Sberveglieri, E. Comini, G. Faglia, M.Z. Atashbar and W. Wlodarski, “Titanium dioxide thin films prepared for alcohol microsensor applications”, Sens. Actuators, B 66, 139–141 (2000)
52. Mohammed Mabrook and Peter Hawkins, “A rapidly-responding sensor for benzene, methanol and ethanol vapours based on films of titanium dioxide dispersed in a polymer operating at room temperature”, Sens. Actuators, B 75,197-202 (2001)
53. C. G. Dighavkar, A. V. Patil, S. J. Patil and R. Y. Borse, “Effect on Ethanol Gas Sensing Performance of Cu Addition to TiO2 Thick Films”, Sensors & Transducers Journal 116 , 28-37 (2010)

Fiber optic sensor for determining the quality of alcohol-water mixtures
61
54. Ting-Jen Hsueh, Shoou-Jinn Chang, Cheng-Liang Hsu, Yan-Ru Lin and I.-Cherng Chen, “Highly sensitive ZnO nanowire ethanol sensor with Pd adsorption”, Appl.Phs.Lett . 91, 053111(1-3) (2007)
55. B. Bhooloka Rao, “Zinc oxide ceramic semi-conductor gas sensor for ethanol vapour”, Mater. Chem. Phys. 64, 62–65 (2000)
56. O.K. Tan, W. Cao and W. Zhu, “Alcohol sensor based on a non-equilibrium nanostructured χ ZrO2 – (1- χ)α –Fe2O3 solid solution system”, Sens. Actuators, B 63, 129–134 (2000)
57. Chaikarn Liewhiran and Sukon Phanichphant, “Influence of Thickness on Ethanol Sensing Characteristics of Doctor-bladed Thick Film from Flame-made ZnO Nanoparticles”, Sensors 7, 185-201(2007)
58. O.K. Tan, W. Cao, W. Zhu, J.W. Chai, J.S. Pan, “Ethanol sensors based on nano-sized α -Fe2O3 with SnO2, ZrO2, TiO2 solid solutions”, Sens. Actuators, B 93, 396–401(2003)
59. O.K. Tan, W. Zhu, Q. Yan, L.B. Kong,” Size effect and gas sensing characteristics of nanocrystalline xSnO2 -(1-x) α –Fe2O3 ethanol sensors” Sens. Actuators, B 65, 361–365 (2000)
60. Y G Lee and Tse-Chuan Chou, “Ionic liquid ethanol sensor”, Biosens. Bioelectron. 20, 33–40 (2004)
61. Seong-Jeen Kim, Byung-Hyun Jeon, Kyu-Seong Choi and Nam-Ki Min, “Capacitive porous silicon sensors for measurement of low alcohol gas concentration at room temperature”, J Solid State Electrochem. 4, 363-366 (2000)
62. Silviya Petrova, Yordan Kostov, Kim Jeffris, and Govind Rao, “Optical Ratiometric Sensor for Alcohol Measurements”, Anal. Lett. 40, 715–727 (2007)
63. R. Nagarajan, A. Gupta, R. Mehrotra, andM.M. Bajaj, “Quantitative Analysis of Alcohol, Sugar, and Tartaric Acid in Alcoholic Beverages Using Attenuated Total Reflectance Spectroscopy”, J. Autom. Methods Manage. Chem. 2006, 1-5 (2006)
64. Stephan T. Dubas, Chularat Iamsamai and Pranut Potiyaraj, “Optical alcohol sensor based on dye–Chitosan polyelectrolyte multilayers” Sens. Actuators, B 113 ,370–375 (2006)
65. Q. Chang, J.R. Lakowicz, and G. Rao, “Fluorescence lifetime-based sensing of methanol”, Analyst 122, 173–177 (1997)
66. G. J.Mohr, F. Lehmann, U. W.Grummt, and U. E. Spichiger-Keller, “Fluorescent ligands for optical sensing of alcohols: Synthesis and characterization of p-N,N-dialkylamino- trifluoroacetylstilbenes”. Anal. Chim. Acta 344, 215–225 (1997)
67. G. J. Mohr, and U. E. Spichiger-Keller, “Novel fluorescent sensor membranes for alcohol based on p-N,N-dioctylamino-4’-trifluoroacetylstilben”. Anal. Chim. Acta 351, 189–196 (1997)
68. P. Blum, G. J. Mohr, K. Matern, J. Reichert, and U. E. Spichiger-Keller, “Optical alcohol sensor using lipophilic Reichardt’s dyes in polymer membranes” Anal. Chim. Acta 432, 269–275 (2001)
69. G. Orellana, A. M. Gomez-Carneros, C. de Dios, A.A. Garcia-Mertinez, and M. C. Moreno- Bondi, “Reversible fiber-optic fluorescing of lower alcohols” Anal. Chem. 67, 2231–2238 (1995)
70. Silviya Petrova, Yordan Kostov, Kim Jeffris, and Govind Rao, “Optical Ratiometric Sensor for Alcohol Measurements”, Anal. Lett. 40, 715–727 (2007)
71. D. N. Simon, R. Czolk, H. J. Ache, “Doped sol-gel films for the development of optochemical ethanol sensors” , Thin Solid Films 260, 107 -110 (1995)

Fiber optic sensor for determining the quality of alcohol-water mixtures
62
72. Huarong Tang , Yaming Li, Chengbin Zheng, Jun Ye, Xiandeng Houa and Yi Lv, “An ethanol sensor based on cataluminescence on ZnO nanoparticles”, Talanta 72, 1593–1597 (2007)
73. Danielle Cleveland, Matthew Carlson, Evan D. Hudspeth, Lauren E. Quattrochi, Kathleen L. Batchler, Shrimati A. Balram, Seongun Hong, Robert G. Michel “Raman Spectroscopy for the Undergraduate Teaching Laboratory: Quantification of Ethanol Concentration in Consumer Alcoholic Beverages and Qualitative Identification of Marine Diesels Using a Miniature Raman Spectrometer”, Spectrosc. Lett. 40, 903–924, 2007
74. Jun Gao, Ting Gao, and Michael J. Sailor, “Porous-silicon vapor sensor based on laser interferometry”, Appl. Phys. Lett. 77, 901-903 (2000)
75. Yoshiaki Kurauchi , Takayuki Yanai, Naoyoshi Egashira and Kazuya Ohga, “Fiber-Optic Sensor with a Chitosan/Poly(Vinyl Alcohol Cladding) for the Determination of Ethanol in Alcoholic Beverages”, Anal. Sci. 10, 213-217 (1994)
76. M. Penza, G. Cassano, P. Aversa, F. Antolini, A. Cusano A. Cutolo, M. Giordano L. Nicolais, “Alcohol detection using carbon nanotubes acoustic and optical sensors”, Appl. Phys. Lett. 85, 2379-2381 (2004)
77. M Penza, G Cassano, PAversa, A Cusano, A Cutolo, MGiordano and L Nicolais, “Carbon nanotube acoustic and optical sensors for volatile organic compound detection”, Nanotechnology 16, 2536–2547 (2005)
78. Zhengtian Gu and Yanping Xu, “Design optimization of a long-period fiber grating with sol–gel coating for a gas sensor” Meas. Sci. Technol. 18, 3530–3536 (2007)
79. Zhengtian Gu, Yanping Xu and Kan Gao , “Optical fiber long-period grating with solgel coating for gas sensor”, Opt. Lett. 31(16) 2405-2407 2006
80. Guillenno Orellana, Ana M. Gomez Cameros, Cesar de Dios, Ana A. Garcia-Martinez, and Maria C. MorenoBondi, “Reversible Fiber-optic Fluorosensing of Lower Alcohols”, Anal. Chem. 67,2231 -2238 (1995)
81. Yoshiaki Kurauchi, Takayuki Yanai, Naoyoshi Egashira and Kazuya Ohga, “Fiber-Optic Sensor with a Chitosan /Poly(vinyl alcohol) Cladding for the Determination of Ethanol in Alcoholic Beverages”, Anal. Sci. 10,213-217 (1994)
82. G R C Possetti, L C Cocco, C I Yamamoto, L V R de Arruda, R Falate, M Muller and J L Fabris, “Application of a long-period fiber grating-based transducer in the fuel industry” Meas. Sci. Technol. 20, 034012(1-9) (2009.)
83. Cesar Elosuaa, Candido Bariaina, Ignacio R. Matiasa, Francisco J. Arreguia, Elena Vergarab and Mariano Lagunab, “Optical fiber sensing devices based on organic vapor indicators towards sensor array implementation”, Sens. Act. B 137 ,139–146 (2009)
84. Y G Lee and Tse-Chuan Chou, “Ionic liquid ethanol sensor”, Biosens. Bioelectron. 20, 33–40 (2004)
85. Zhengtian Gu and Yanping Xu, “Design optimization of a long-period fiber grating with sol–gel coating for a gas sensor” Meas. Sci. Technol. 18, 3530–3536 (2007)
86. Zhengtian Gu, Yanping Xu and Kan Gao , “Optical fiber long-period grating with solgel coating for gas sensor”, Opt. Lett. 31, 2405-2407 (2006)
87. M. Penza, G. Cassano, P. Aversa, F. Antolini, A. Cusano A. Cutolo, M. Giordano L. Nicolais, “Alcohol detection using carbon nanotubes acoustic and optical sensors”, Appl. Phys. Lett. 85, 2379-2381 (2004)
88. M Penza, G Cassano, PAversa, A Cusano, A Cutolo, MGiordano and L Nicolais, “Carbon nanotube acoustic and optical sensors for volatile organic compound detection”, Nanotechnology 16, 2536–2547 (2005)

Fiber optic sensor for determining the quality of alcohol-water mixtures
63
89. A. Kumar, T. V. B. Subrahmanyam, A. D. Sharma, K. Thyagarajan, B. P. Pal and I. C. Goyal, “Novel refractometer using a tapered optical fiber”, Electron. Lett. 20, 534-535( 1984)
90. M. Ogita, Y. Nagai, M.A. Mehta and T. Fujinami, “Application of the adsorption effect of optical fibers for the determination of critical micelle concentration”, Sens. Actuators, B , 64,147–151 (2000)
91. S. S. N. Murthy, “Detailed Study of Ice Clathrate Relaxation:Evidence for the Existence of Clathrate Structures in Some Water-Alcohol mixtures”, J. Phys. Chem. A 103, 7927-7937 (1999).
Chapter III
Fabrication of asymmetric LPFGs using electrical arc and CO2 laser
3.1 Introduction
A long period fiber grating (LPFG) is a periodic modulation of the
optical characteristics of an optical fiber, obtained by either inducing a
physical deformation in the fiber material or by modifying the refractive
index of the core of the fiber [1,2], where the period is greater than 100 μm.
Long Period Fiber Gratings or LPFG’s are classically realized by exposing
the photo sensitive optical fiber to ultra-violet light (either through an
amplitude mask or by using point by point technique) [2]. But with the
advancement of technology over two decades since the first report[1],
LPFGs have been virtually written in all kind of fibers, namely, in standard
singlemode telecommunications fibers [1], in two-mode (or few-mode)
fibers [3,4], polarization maintaining fibers [5], D-fibers [6], non-
photosensitive fibers [7,8,9] and multimode fibers [10]. LPFGs were also
fabricated in specially designed fibers like dispersion shifted [1], dispersion
compensating [11], depressed inner cladding [12], dual core [13], twin core
[14] and progressive three layered [15] with specific properties for optical
communications and sensing. Abramov et.al. [16] reported LPFG in hybrid
fibers containing silica and polymers [] while LPFG in a metal coated fiber
was reported by Costantini et.al. [17]. LPFG were also fabricated in
microstructured polymer fiber [18] and in photonic crystal fibers [19-22].
Regarding writing techniques, Vengsarkar et.al [1] exposed hydrogen
loaded germanosilicate fibers to a 248 nm KrF laser through an amplitude
mask made of chrome-plated silica. Ultra violet radiation from a frequency-
doubled argon-ion continuous-wave laser (λ=244 nm) was used by Vikram
Bhatia et.al [23] for fabricating the LPFG. Gratings inscription was also
achieved through the radiation delivered by CW Ar ion laser [24-26].
Nanosecond pulses from an ArF excimer laser (193 nm) was used to inscribe
gratings in a hydrogen loaded boron co doped germanosilicate fiber using
point by point technique [27,28] . Frequency quadrupled Nd:YAG laser
(266 nm) was used by several authors [29-31] of which Shu et.al. [30]

Fabrication of asymmetric LPFGs using electrical arc and CO2 laser
65
employed amplitude mask on non hydrogenated B–Ge codoped fiber while
Visneck Costa et.al.[31] adopted point-by-point technique on hydrogen-
loaded photosensitive fibers. Gratings were written in hydrogenated
photosensitive fiber with the tripled output of high repetition-rate diode
pumped Q-switched Nd:YAG laser (355nm) by Blows et.al.[32].
Femtosecond laser radiation at several wavelengths like 211 nm [33], 264
nm [34] 352 nm [35,36] and 400 nm [37,38] were also used for inscribing
long period fiber gratings. Broadband UV sources were also used for
fabrication of LPFGs in hydrogenated photo sensitive fibers [39-41]. Though
different laser intensities and wavelengths were used, in all cases gratings
were written in photosensitive fibers and/or in hydrogenated ones.
Although the UV-based fabrication method is a well-established
technology, it has problems. It requires complex and time-consuming
processes, including hydrogen loading, UV writing, and annealing.
Furthermore, UV-induced gratings decay and, in general, cannot stand high
temperatures. Moreover it requires photosensitive fibers and the lasers used
for fabrication are costly.
There are, however, several alternative techniques for grating
fabrication that does not require the fiber to be photosensitive. Such methods
include physical deformation of the fiber [42], core-index variation produced
by thermal effects using 800 nm femtosecond laser radiation [43], 10.6 μm
CO2 lasers [44-53] or electric arcs [7-9,54-64], periodic corrugation of the
silica cladding of fiber through chemical etching [65-67] etc. LPFGs were
reported to be written in hydrogenated Corning SMF-28 fiber using
nanosecond pulses from a 157 nm F2 laser [68,69]. Among other techniques,
LPFGs were fabricated by heating a heavily twisted standard fiber at high
temperatures [52,70]. Gratings can also be produced by exposure of a fiber,
through an amplitude mask, to a beam of He ions [71]. This method requires
that the fiber cladding be reduced to ~53 μm by etching. Later, the etching
process was overcome by exposure of the fiber to a focused beam of protons,
which have a longer stopping distance [72]. It is known that gamma radiation
can lead to considerable changes in the refractive index of optical fibers [73]
and, therefore, it may be an alternative to produce long-period gratings.
LPFGs produced through exposure to CO2 laser radiation and to arc
discharges share most of their properties and have been catching an
increasing attention from the fiber gratings community. Comparatively, the

Fabrication of asymmetric LPFGs using electrical arc and CO2 laser
66
major disadvantage of the electric arc technique is the limitation in the
minimum period that can be written due to the dimensions of the arc [74].
On the other hand, it is simpler, harmless and one of the most cost effective
techniques.
3.2 Mechanism of LPFG formation
3.2.1 UV LPFG
The basis of this type of grating inscription is connected with the
induction of permanent refractive index changes in fiber core by UV
irradiation. The radiation has wavelength coinciding with the 5.12 eV
absorption band of germanium oxygen-deficient centers which has a
maximum at 242 nm. Currently there are two models which describe the
mechanism for fiber photosensitivity namely the colour-centre model [75]
and the densification model [76].
The colour-centre model, considers that the UV exposure of the 5.12
eV band brings about the release of photoelectrons, which become trapped in
neighbouring sites, thus creating new colour centres. The following
modification of the UV absorption spectrum of the germanosilicate glass
leads to refractive index modification at longer wavelengths. However this
model failed in the correct estimation of the induced index changes and the
search for another model paved way for the densification model. In 1995
Fonjallaz et.al [77] noticed a strong increase in tension in a germanosilicate
fiber core by UV laser light, which was linearly proportional to the refractive
index modulation. Although it is known that an increase in tension lowers
the refractive index through the photoelastic effect, an overall positive index
change was only observed in the experiment. The densification model
considers structural changes to more compact configurations as an important
component of fiber photosensitivity. The UV-induced increase of the
refractive index in fiber core, due to both colour-centre and compaction
effects, is believed to exceed the decrease caused by the photoelastic effect.
The amount of each contribution might vary strongly as a function of fiber
content, pre-irradiation treatment and irradiation wavelength.

Fabrication of asymmetric LPFGs using electrical arc and CO2 laser
67
3.2.2 Thermal induced Gratings
Unlike in the case of UV induced LPFGs, the mechanism of grating
formation is still not well understood in the case of thermal induced long
period fiber gratings. Depending on the types of the employed fibers and on
the fabrication techniques, possible mechanisms suggested for refractive
index modulation in the thermal-induced LPFGs are residual stress
relaxation [78-81], glass densification [82-84], physical deformation
[9,42,85] and dopant diffusion [86].
3.2.2.1 Residual stress relaxation
A standard single mode fiber consists typically of a germanium-
doped silica core and a pure silica cladding. As a result of the doping, the
properties of the core, in particular, its thermal expansion coefficient
increases and its viscosity decreases compared to the properties of the
cladding. The elastic stress associated with the difference in thermal
expansion coefficient is known as thermal stress and is present in the fiber
preform itself. Another type of stress is known as draw induced, which
occurs during drawing and is associated with the different viscosities of core
and cladding materials. During fiber drawing the higher viscosity material, in
this case the cladding, cools more rapidly than the core and bears the brunt of
the drawing tension. The melted core, in turn, is surrounded by the solid
cladding and cannot expand being under compressive stress during cooling.
Simultaneously, due to a higher thermal expansion coefficient, the core also
exerts a hydrostatic pressure on the cladding. Thus residual stress is formed
in optical fibers during the drawing process, resulting mainly from a
superposition of thermal stress caused by a difference in thermal expansion
coefficients between core and cladding and mechanical stress caused by a
difference in the viscoelastic properties of the two regions [80,81, 87]. Such
residual stress can change refractive index in the fibers through the stress-
optic effect and thus affect the optical properties of the fibers. Residual
stresses can be released during fiber annealing, that is, the fiber is heated to a
high temperature (>1000 ºC) and is held for some time, followed by slow
cooling to room temperature.
Residual stress relaxation usually results in a decrease in refractive
index in the fibers. The efficiency of refractive-index decrease depends
strongly on the types of fiber and can be enhanced linearly with the drawing

Fabrication of asymmetric LPFGs using electrical arc and CO2 laser
68
force during the drawing process of the fiber. In a Ge–B-codoped fiber the
refractive-index change due to residual stress relaxation was measured as
−2.1X10⁻⁴ [80] while in a Corning SMF-28 fiber it was −7.2X10⁻⁴ [81]. It
has been proposed that the periodic stress relaxation caused by arc
discharges or CO2 laser radiation is an important mechanism of gratings
formation [88,89]. In addition to residual elastic stresses and strains,
conventional silica optical fibers can also exhibit inelastic, or even “stress-
free,” strains. Relaxation of inelastic stress is also a possible mechanism for
LPFGs formation [88].
3.2.2.2 Glass structure changes
Densification arises from modifications of ring structures in the silica
network and is the mechanism proposed to explain the changes observed in
fibers having moderate and high germanium content in the core upon
exposure to UV-laser radiation [90-92].
If glass is maintained at constant temperature, the volume changes
with time due to structural relaxation until it reaches certain equilibrium
glass structure. The temperature that corresponds to the equilibrium glass
structure is called the fictive temperature or the structural temperature. Thus
the fictive temperature of a glass is defined as the temperature at which the
glass is formed after melting and the glass structure at this temperature and at
room temperature is the same [93]. The fictive temperature of glass depends
on the cooling rate and it increases with the increase in cooling rate.
Therefore, different cooling rates lead to fibers with different fictive
temperatures which, in turn, results in fibers with different intrinsic
properties such as viscosity, thermal expansion coefficient and refractive
index [93,94].
In the case of slow cooling, the glass can follow changes in
temperature. As the temperature decreases, the viscosity of the glass
increases, and it takes a longer time for the glass structure to reach an
equilibrium state. Thus the density of the glass cooled slowly becomes larger
than that of the glass cooled quickly. The refractive index is given by the
Lorentz–Lorenz formula given by
(����)
(����)=
��∝
���� 3.1

Fabrication of asymmetric LPFGs using electrical arc and CO2 laser
69
where ρm is the mass density, α is the mean molecular polarizability, NA the Avogadro number and M is the molecular weight
Thus refractive index increases with the density and hence the rapidly
cooled glass has a lower refractive index than the slow cooled one.
In the case of arc discharges and CO2 laser irradiation, the fiber is
rapidly heated to a temperature which is more than that employed during the
drawing process and is cooled rapidly and frozen. Because of the faster
cooling rate, the fictive temperature of the quickly resoldified glass becomes
higher. The viscosity and density of the molten glass thus decreases and
these contribute to the reduction in the refractive index.
The change of glass structure is found to be the dominant
mechanisms in the thermal-induced LPFGs written in a commercial boron-
doped single-mode fiber [82-84]. Residual stress relaxation in the fiber core,
which is the dominant mechanism in a conventional Ge-doped or Ge–B-
codoped fiber, plays only a minor role in the boron-doped fiber that has a
core with a small residual stress and a low fictive temperature. For the CO2-
laser-induced LPFGs in the Ge-doped or Ge–B-codoped fibers, e.g., Corning
SMF-28 fiber, with large residual stress, the resonance wavelength shifts
toward the shorter wavelength with the increase in the laser exposure dose
due to the negative index modulation resulting from residual stress
relaxation[78-80,95]. For the CO2-laser-induced LPFGs in the boron-doped
fibers with small residual stress, on the contrary, the resonance wavelength
shifts toward the longer wavelength with the increase in the laser exposure
dose due to the positive index modulation resulting from glass
densification.[81-84]
3.2.2.3 Physical deformation
In the case of thermal induced LPFGs two types of geometric deformations
can occur in a fiber namely microbending [42] and tapering [9,85]. The
former, occurs when the fiber is submitted intentionally to lateral strain
during heating while the latter occurs when the fiber is submitted to axial
strain. The extent of the change in the fiber cross-section depends not only
on the pulling tension but also on the temperature established on the fiber.
During CO2 laser irradiation, the fiber usually elongates or tapers based on
the so-called “self-regulating” mechanism,[87] resulting from constant axial
tension and the CO2-laser-induced local high temperature in the fiber. Thus
the fiber diameter decreases and eventually reaches a critical point at which

Fabrication of asymmetric LPFGs using electrical arc and CO2 laser
70
the fiber elongation stops because no sufficient energy is absorbed to keep
the softening temperature. Moreover, the CO2-laser-induced high
temperature in the fiber causes, not only the fiber elongation and the
diameter decrease but also the ablation of glass on the fiber surface. Such
physical deformation induces a change in effective refractive index in the
fiber, and thus LPFGs are created in the periodically tapered optical fibers
[49,96-98].
3.2.2.4 Dopant diffusion
One of the first mechanisms proposed for the formation of arc-induced
LPFGs was the diffusion of core dopants [86,99].This is a phenomenon in
which the core dopant diffuses to cladding due to heating and Dianov etal
[99] have fabricated LPFG in nitrogen doped fiber by utilizing this
phenomenon. As the electric arc heats the fiber, owing to its small atomic
weight, nitrogen diffuses to cladding and hence the core refractive index
reduces. However for Ge-doped fibers, the desired modifications caused by
dopant diffusions were achieved by keeping the fibers at temperatures above
1200 ºC for few hours. But during LPFGs fabrication the duration of the arc
discharge is only a few seconds and, therefore, the diffusion coefficients of
the dopants must be high in order to have a significant influence of diffusion
on the grating formation.
3.3 Theory of long period fiber gratings
Consider an optical fiber, as depicted in Figure 3.1, having a core
radius r1, cladding radius r2 and different refractive indices in each layer: n1,
n2 and n3.
Figure 3.1. The structure of optical fiber

Fabrication of asymmetric LPFGs using electrical arc and CO2 laser
71
Generally the cylindrical waveguide supports many modes of
propagation and by adjusting the core radius and the refractive index
difference between the core and the cladding (Δn) the fiber can be made to
support only one mode (single mode fiber). In the case of a single mode
fiber most of the energy is guided by the core, but a certain amount is also
guided by the cladding. The core mode thus “sees” an effective refractive
index that lies between the core and the cladding refractive indices. The
other modes available in an optical fiber may be classified, according to the
value of the third layer, as: cladding modes, radiation modes and leaky
modes. The first occurs when the refractive index of the third layer is lower
than that of the cladding, such as the case of a stripped fiber (n3 = 1 air). In
this case, several discrete cladding modes are guided by total internal
reflection at the cladding-air interface. The effective refractive indices of
those modes range between n2 and n3. If the cladding is infinite, ie n2 = n3,
total internal reflection is not possible and, therefore, light is lost through a
continuum of radiation modes. When n2 < n3, light can propagate a certain
distance due to hollow waveguide and these discrete modes are called leaky-
modes.
The field equations of the core and cladding modes are solutions of
the wave equation that satisfy continuity conditions at the boundary. In
general, the modes are TE, TM and hybrid HE/EH modes. If Δn is small, the
weakly guide approximation can be used and the modes can be treated as
linearly polarized, LP. The LP modes are a superposition of TE, TM and
hybrid modes. For a single mode fiber, the core mode is HE11 or LP01 and the
field equation can be obtained considering two layers: core and cladding. For
the cladding modes, a three layer geometry is required, even when Δn is
small. As far as LPFGs are concerned, the type of modes of interest depends
on the symmetry of the perturbation that enables coupling from the core
mode to the cladding modes. If the perturbation is axis symmetric the
coupling is made to LP0j (or HE1j) cladding modes (j>1). On the other hand,

Fabrication of asymmetric LPFGs using electrical arc and CO2 laser
72
if the perturbation is asymmetric coupling is made to LP1j (or HE2j + TE0j +
TM0j) cladding modes (j>0) [100-103].
An LPFG can be represented by a sinusoidal Z dependent periodic
index variation given by Δn2(z)= Δn2 sin(Kz), where K=2π/Λ and Λ is the
grating period. The LPFG couples incident light guided by the core to the
forward-propagating cladding modes of the optical fiber, which decay
rapidly through radiation. The fiber supports many cladding modes and thus
the LPFG induces a corresponding series of attenuation bands in the
transmission spectrum of the fiber.
The light coupling from the fundamental core mode to the mth order cladding
modes occurs at wavelengths that satisfy the phase-matching condition [100]
2m
clcore (3.2)
where βcore is the propagation constant of the LP01 fundamental core mode,
βclm, is the propagation constant of the mth order cladding mode and Λ is the
grating period.
The effective refractive index of a medium is defined as neff = β/k, where k is
the wave number in vacuum. Since k=2π/λ, the propogation constants βco and
βcl,m can be written as [100]
m
coreeffcore
n
,2
(3.3)
and
m
mcleffm
cl
n
,2
(3.4)
where neff,core is the effective refractive index of the fundamental core mode
(LP01) and neff,clm is the effective refractive indexes of the phase matched
cladding mode (LP0m).
If λm is the wavelength at which phase matching occurs with the mth forward
propagating cladding mode, then an attenuation band is created in the

Fabrication of asymmetric LPFGs using electrical arc and CO2 laser
73
transmission spectrum centred at the wavelength λm. Thus from 3.2, 3.3 and
3.4, λm can be deduced as
sim
clefficoreeffm nnTnnTn ,,,,,,, ,, (3.5)
Both indices (neff,core and neff,clm ) depend on the indices of the various
fiber layers, ni, the wavelength λ, the temperature T, and the strain
experienced by the fiber ε. Also, neff,clm is a function of the refractive index
of the surrounding medium, ns.
For each individual resonance, its transmission loss can be calculated
by[100]
2
2
2
1
1sin
1log10
g
gg
k
kLk
T (3.6)
where δ is the detuning parameter
1,,
m
mcleffcoreeff nn
(3.7)
kg is the grating coupling constant and L is the grating length.
Figure 3.2 shows the sample transmission spectrum of an LPFG
illustrating the attenuation bands corresponds to various LP0m cladding
modes to which the fundamental guided mode couples. Since these
attenuation bands are functions of applied strain, ambient temperature and
refractive index, long period fiber gratings can be used as sensors, where the
shift in resonance band gives the measure of ambient change.

Fabrication of asymmetric LPFGs using electrical arc and CO2 laser
74
3.4 Fabrication of Periodically tapered LPFG using fusion splicer
Long period fiber gratings were fabricated in commercially available
standard telecommunication fiber (SMF-28) received from Newport using
point-by-point technique. As shown in figure 3.3, a bare single mode fiber
(Newport SMF-28) without its protective coating was placed between the
electrodes of a fusion splice machine (Fujikura FSM-50S), while its ends
were fixed on two fiber holders. The fiber holder was fixed on a computer-
controlled translation stage (Newport) with a resolution of 100nm. An arc
discharge with a current of 5 mA was then applied for 200 ms, which raises
the temperature of the fiber section positioned in between the electrodes to
its softening point. The fusion splicer was programmed to taper the fiber by a
length of 50μm during each arc. The fiber was then moved by the translation
stage through a distance equal to the grating period and another arc discharge
along with tapering was applied. Care was taken to provide sufficient time
Figure 3.2 Transmission spectrum of an LPFG (reproduced from [1])

Fabrication of asymmetric LPFGs using electrical arc and CO2 laser
75
between arcs to allow the fiber to get cooled. The periodic tapering was
continued and the optical transmission of the fiber was monitored during the
LPFG fabrication process in order to obtain the desired spectral attenuation
notches. The setup employed for the experiments consists of a white light
source (Yokogawa AQ4305) coupled to one end of the fiber, while the other
end was connected to an optical spectrum analyzer, OSA (Yokogawa
AQ6319), set to a resolution of 0.05 nm. All the three writing parameters,
namely discharge current, discharge time and tapering length were found out
by trial and error method so that the fiber should retain its mechanical
strength during the formation of grating.
The transmission spectrum was acquired and processed by a computer to
determine the LPFG central dip wavelength and transmittance. The size of
the arc limited the minimum grating period Λ, and we got a peak attenuation
of 14 dB at 1318 nm after 34 engravings with a grating period of 500μm.
The spectral evolution of the LPFG is shown in figure 3.4, illustrating the
transmission spectra with various grating period numbers of 10, 21, 30 and
34. When fabrication was repeated without the tapering option, gratings were
not formed eventhough arc current and duration were the same.
Figure 3.3 LPFG fabrication setup using arc fusion splicer

Fabrication of asymmetric LPFGs using electrical arc and CO2 laser
76
As discussed in section 3.2 the different mechanisms involved in the
formation of arc induced gratings are modulation of core diameter due to
fiber tapering, stress relaxation, glass structure changes and dopant diffusion.
But it has been shown that the change of glass structure play the dominant
role in LPFGs written in boron-doped single-mode fiber [82-84] while
residual stress relaxation in the fiber core, is the dominant mechanism in a
conventional Ge-doped or Ge–B-codoped fiber like SMF 28. Since we have
used SMF 28 for LPFG fabrication, the effect of glass structure change on
refractive index modulation can thus be omitted. Also since the temperature
generated during arc cannot induce Ge diffusion to the cladding, the effective
refractive index variation in the periodically tapered LPFG can be expressed
as [104]
Δn=Δnresidue + Δntaper (3.8)
Figure 3.4 Evolution of resonance peaks for the arc induced LPFG

Fabrication of asymmetric LPFGs using electrical arc and CO2 laser
77
where Δnresidue is the initial refractive index change induced by the residual
stress relaxation as a result of the high local temperature and the constant
strain during the tapering process. Δntaper is the refractive index perturbation
caused by the periodic tapering of the fiber.
3.4.1 Origin of Asymmetry
Rego et.al.[61] did extensive studies on the asymmetric mode
coupling of arc induced LPFGs. They studied the temperature distribution in
the arc that is applied to the fiber. Since the current in the arc is direct (dc),
the arc is directional and it is found that the center between the electrodes is
not the center of symmetry of arc glow (figure 3.5).
The electrode at the bottom (cathode) glows only at its tip, while the
electrode at the top (anode) glows over a much larger area. The arc is
brighter near the lower electrode. This causes a gradient of temperature with
respect to the line joining the electrodes and hence along the diameter of the
fiber.
As discussed in section 3.2 glass structure change is reported to be
the dominant mechanism involved in grating formation in Boron doped
fibers while it has little effect in the case of normal SMF 28 fibers. It has
been shown that the mode coupling is symmetric in the case of LPFGs
fabricated using fusion splicer in Boron doped fibers while asymmetric in
SMF 28[60]. Thus it is evident that the temperature gradient has little or no
effect on glass structure changes. The origin of asymmetry in this case (SMF
Figure 3.5 Photograph of arc glow (reproduced from Rego etal [61] )

Fabrication of asymmetric LPFGs using electrical arc and CO2 laser
78
28) can thus be attributed to stress relaxation and physical deformation. Two
types of geometric deformation of the fiber occur in an arc discharge namely
tapering and microbending. Tapering is a symmetric diameter reduction and
an elongation of the fiber and it cannot induce coupling to the asymmetric
cladding modes. Rego et al [61] has also shown the asymmetric geometrical
microbending induced in the fiber core by the electric arc. Hence the
microbending and temperature gradient can be assumed to be the possible
cause for asymmetric mode coupling.
This periodic asymmetric refractive index modulation causes the
LPFG to couple light guided by the core mode (LP01) to the forward
propagating asymmetric cladding modes ( Clad1mLP ) of the optical fiber, which
decay rapidly through radiation. Since the fiber supports many cladding
modes, the LPFG induces a corresponding series of attenuation bands in the
transmission spectrum of the fiber. The centre wavelength λm of the
attenuation bands depends on the grating period Λ, external temperature,
strain experienced by the fiber and the refractive index of the medium
surrounding the fiber.
3.5 Fabrication of LPFG using CO2 laser
The LPFGs were fabricated in commercially available standard
telecommunications fiber (SMF-28) received from Newport using the point-
by-point technique. As shown in figure 3.6, a motorized translation stage
with a resolution of 10nm (Newport) was used to shift the fiber. A 12 W
continuous wave CO2 laser (LASY-12, 10.6μm, 12W) was used for
fabrication. The optical transmission of the fiber was monitored during the
LPFG fabrication process in order to obtain the desired spectral attenuation
notches. The setup employed for the experiments consists of a white light
source (Yokogawa AQ4305) coupled to one end of the fiber, while the other
end was connected to an optical spectrum analyzer, OSA (Yokogawa
AQ6319), set to a resolution of 0.05 nm. The fiber was exposed to CO2 laser
radiation using a shutter for a fraction of a second and then translated by the
required grating period. During the experiments the fiber was kept under
constant longitudinal tension. The beam diameter of the CO2 laser limited the
minimum grating period Λ. For a grating period of 600μm, we got an
attenuation of 14 dB at 1520nm after 76 periods producing a grating length

Fabrication of asymmetric LPFGs using electrical arc and CO2 laser
79
Figure 3.6 Experimental setup for LPFG fabrication using CO2 laser
of 4.5cm. The spectral evolution of the LPFG is shown in figure 3.7 and the
photograph of the LPFG in figure 3.8.
Figure 3.7 Evolution of resonance peaks for CO2 inscribed LPFG

Fabrication of asymmetric LPFGs using electrical arc and CO2 laser
80
The focused CO2 laser beam creates a local high temperature in the
fiber, which led to the vapourization of SiO2 from the surface of the fiber. As
a result, periodic grooves are carved on the fiber as shown in Figure 3.9.
Such grooves induce periodic refractive index modulation along the fiber
axis due to the photo elastic effect, thus creating an LPFG.
Since the LPFG is fabricated in SMF 28, the dominant mechanism involved
in the refractive index modulation is stress relaxation. Thus the refractive
index modulation in the CO2 laser carved LPFG can be expressed as
grooveresidual nnn (3.9)
where Δnresidual is the refractive index perturbation induced by the residual
stress relaxation resulting from the heating and Δngroove is the initial
refractive index perturbation induced by the periodic grooves on the fiber.
Figure 3.9 structure of CO2 inscribed LPFG
Figure 3.8 Photograph of CO2 inscribed LPFG

Fabrication of asymmetric LPFGs using electrical arc and CO2 laser
81
3.5.1 Origin of Asymmetry
In the case of CO2 fabrication the laser energy is strongly absorbed
on the incident side of the fiber and the non uniform absorption results in
asymmetrical refractive index profile within the cross-section of the LPFGs.
Thus, a larger refractive index change is induced on the incident side of the
fiber compared to the opposite side which in turn causes asymmetrical mode
coupling.
3.6 Temperature sensitivity of LPFG
The sensitivity of LPFGs to temperature is influenced by the period
of the LPFG governed by the order of the cladding mode to which coupling
takes place (105) and by the composition of the optical fiber (106). The
origin of the temperature sensitivity may be understood by differentiating
equation (3.5) (107)
dT
dnn
dT
dn
dT
dn
dT
d mcleffcoreeff
mcleffcoreeffm
,,
,, (3.10)
where λm is the central wavelength of the attenuation band, T is the
temperature, neff,core is the effective refractive index of the core mode, neff,clm
is the effective refractive index of the mth cladding mode and Λ is the period
of the LPFG.
In general, the effective refractive indices of the core and the cladding at a
particular temperature T can be written as
TTnTn corecoreeffcoreeff 0,, (3.11)
and
TTnTn mclo
mcleff
mcleff ,, (3.12)
where T0 is a reference temperature, ΔT =T -T0, and ξcore and ξcl are the
thermo-optic coefficients of the core and the cladding, respectively.
The first term on the right-hand side of equation 3.10 i.e.,
dT
dn
dT
dn mcleffcoreeff ,,
[105] is the material contribution, and is related to

Fabrication of asymmetric LPFGs using electrical arc and CO2 laser
82
the change in the differential refractive index of the core and cladding arising
from the thermo-optic effect. This contribution depends upon the
composition of the fiber and also on the order of the cladding mode. The
second term i.e., dT
dnn m
cleffcoreeff
,, is the waveguide contribution as it
results from changes in the LPFG’s period with respect to the changing
temperature. Since the thermal expansion coefficient of silica is very small
~0.5x10⁻⁶/0C [107], the waveguide contribution due to dΛ/dT can be
neglected for lower temperatures. However, at high temperatures, due to a
much stronger dependence on temperature [107] the role of the thermal
expansion coefficient becomes as important as that of the refractive index.
Therefore, at low temperatures, it is the temperature dependence of the
effective indices that determines mainly the temperature sensitivity of the
resonance wavelength. From equation 3.10,3.11 and 3.12 it is evident that
the temperature sensitivity of the resonance wavelength can be positive or
negative, depending on whether the thermo-optic coefficient of the core is
larger or smaller than that of the cladding.
In order to study the temperature characteristics of the fabricated
LPFGs , they are kept in a setup as shown in figure 3.10. An IR lamp is used
to heat the chamber and is connected through an auto transformer. The
temperature is varied by changing the voltage applied to the IR lamp and
measurements were taken after stabilizing the temperature. For temperature
readouts, we used an electronic thermometer placed next to the probe. As
usual an OSA –white light source arrangement was used to measure the
spectral shift and the grating was kept at constant tension during all the
investigations.
Figure 3.10 Experimental setup to find temperature sensitivity

Fabrication of asymmetric LPFGs using electrical arc and CO2 laser
83
Figure 3.11 Transmission Spectrum of UV LPFG
The temperature response of a UV fabricated LPFG was studied first. The
grating with a period of 435 μm was fabricated in Boron doped single mode
fiber which had a length of 10mm. Figure 3.11 below shows the transmission
spectrum of the LPFG which has attenuation peaks at 1418nm, 1473nm and
1570 nm.
The transmission spectrum of the LPFG was recorded by varying the
temperature and the figure 3.12 shows the shift in 1418nm and 1473 nm
attenuation peaks as the temperature changed from 250C to 750C. It is
evident that the resonance peak shifts to lower wavelengths as the
temperature increases and the measured temperature dependence of the peak
wavelengths (1418nm, 1473nm and 1570 nm) is shown in figure 3.13. The
points represent the average shifts calculated while the temperature increase
and decrease. A total shift of -1.3nm and -1.9nm occurs for the 1418 nm and
1473nm peaks respectively for the change in temperature from 250C to 750C
while 1570 band shows a shift of -1.6nm for the same temperature change.
Also dλ/dT is found decreasing for the 1570 nm attenuation peak.

Fabrication of asymmetric LPFGs using electrical arc and CO2 laser
84
Figure 3.13 Shift in resonance peak of UV- LPFG as a function of temperature
Figure 3.12 UV-LPFG spectrum at temperature 250C and 750C

Fabrication of asymmetric LPFGs using electrical arc and CO2 laser
85
The temperature sensitivity of the arc induced LPFG was then
evaluated and the LPFG transmission spectra thus obtained for an ambient
temperature of 250C and 800C are shown in figure 3.14. It is evident from
the graph that the LPFG is insensitive to temperature in the range of
measurements. The transmission spectrum of the CO2 inscribed LPFG
obtained for temperatures 250C and 800C is shown in figure 3.15. Even
though small, a red shift in resonance peak with increasing temperature is
observed. The shift in resonance peak with respect to rise in temperature is
shown in figure 3.16.
Figure 3.14 Spectrum of arc induced LPFG at temperatures 250C and 800C

Fabrication of asymmetric LPFGs using electrical arc and CO2 laser
86
Figure 3.16 Shift in resonance peak of CO2 induced LPFG as a function
of temperature
Figure 3.15 Spectrum of CO2 induced LPFG at temperatures 250C and 800C

Fabrication of asymmetric LPFGs using electrical arc and CO2 laser
87
The temperature response of all the LPFGs and an FBG are combined
in one graph and is shown in figure 3.17. While the arc induced LPFG
shows no sensitivity, the CO2 inscribed LPFG has a temperature sensitivity
of 11 pm/0C and UV LPFG has -24 pm/0C. Hence the following conclusions
can be deducted. Even though the LPFG are formed by thermal method in
similar SMF 28 fiber, the arc induced LPFG was found insensitive to
temperature while the 1417 nm peak of CO2 inscribed LPFG shows a red
shift of 1 nm for a temperature change from 25 0C to 80 0C. The UV
fabricated LPFG in Ge doped fiber shows a blue shift for temperature rise
and has shown a maximum sensitivity of -24 pm/0C.
The difference in temperature sensitivity between the SMF-28 and
Boron doped silica fibers ie. red shift and blue shift, can be explained on the
basis of the thermo-optic coefficients of the core and the cladding materials
[107,108]. As per equation 3.10, 3.11 and 3.12, if the thermo optic
coefficient of core is higher than that of cladding, the peak shift will be
positive. Since the addition of boron to the core brings down the thermo
optic coefficient of core below that of the cladding, blue shift occurs for the
Figure 3.17 Temperature response of different LPFGs and FBG
Fabrication of asymmetric LPFGs using electrical arc and CO2 laser
88
attenuation peak with respect to increasing temperature. Thus the presence of
Boron alters the temperature dependence of the effective refractive index
[56] and hence the UV fabricated LPFG has a negative wavelength shift with
increasing temperature. In the case of SMF-28, thermo optic coefficient of
core is higher than that of cladding and hence the CO2 inscribed LPFG in
SMF 28 has a positive shift.
There are contradictory reports comparing the temperature sensitivity
of LPFGs written by the arc and that with UV technology. Humbert et al
[55] fabricated LPFG with a period of 600μm in SMF 28 fiber using electric
arc and got temperature sensitivities around70 pm/0C. Almost similar
sensitivity was reported by Hwang et al [42] for the LPFG based on arc
induced microbends in standard single mode telecommunication fiber with
620 μm period. Temperature sensitivity as high as 154pm/0C in single mode
fibers fabricated using UV were reported [109]. Allsop et al have found arc
inscription a better method to achieve high temperature sensitivity [110]. In
contrast Smietana et al [109] have observed that the thermal sensitivity of
LPFGs fabricated in boron co-doped fiber is independent of the writing
method.
Since LPFG fabricated in SMF 28 using CO2 laser irradiation has
shown sensitivity to temperature, the temperature insensitivity of the
periodically tapered arc induced LPFGs in similar fiber can thus be attributed
to the fabrication method. It has been shown by Rego et al [54] that the
thermal sensitivity of arc induced LPFGs depends on the arc current and
pulling tension. Hence it can be concluded that the fabrication method makes
the arc induced LPFG temperature insensitive.
Conclusions
In this chapter the basic theory related to long-period fiber gratings is
presented. Afterwards, the different mechanisms proposed in the literature
for the formation of thermal induced gratings are discussed. The fabrication
process of asymmetric LPFGs in SMF 28 using fusion splicer and CO2 laser
is also elaborated. Compared with the UV laser exposure technique, the
fabrication methods discussed in the chapter based on electric arc and CO2
laser are much more flexible and cost effective because neither
photosensitivity nor any other pretreated processess are required to induce a
grating in the glass fibers. Moreover, the writing process can be controlled to

Fabrication of asymmetric LPFGs using electrical arc and CO2 laser
89
generate complicated grating profiles via point-by-point technique without
any expensive masks. Possible mechanisms of refractive index modulations
in the fabricated asymmetric LPFGs are due to residual stress relaxation and
physical deformation. The periodically tapered LPFG fabricated using
electric arc from fusion splicer is found to be insensitive to temperature in
the temperature range 250C to 800C. For telecommunication and sensing
applications spectral stability is of prime importance, and an LPFG with
temperature insensitive attenuation band is an attractive feature. The
fabricated LPFGs have been employed for sensor development and are
discussed in the next chapter.
References
1. A N Vengsarkar, P J Lemaire, J B Judkins, V Bhatia, T Erdogan and J E Sipe, “Long-period fiber gratings as band-rejection filters” J. Lightwave Technol. 14, 58-65 (1996).
2. S W James and R P Tatam, “Optical fiber long-period grating sensors: characteristics and applications”, Meas. Sci. Technol. 14, R49-R61 (2003).
3. C.D. Poole, H.M. Presby and J.P. Meester. “2-Mode Fiber Spatial-Mode Converter Using Periodic Core Deformation”, Electron. Lett. 30, 1437-1438 (1994.).
4. S. Ramachandran, M. Das, Z. Wang, J. Fleming and M. Yan, “High extinction, broadband polarisers using long-period fiber gratings in few-mode fibers”, Electron. Lett. 38, 1327- 1328 (2002.).
5. K.J. Han, Y.W. Lee, J. Kwon, S. Roh, J. Jung and B. Lee, “Simultaneous measurement of strain and temperature incorporating a long-period fiber grating inscribed on a polarization maintaining fiber”, IEEE Photonics Technol. Lett.16, 2114-2116 (2004.)
6. X. Chen, K. Zhou, L. Zhang and I. Bennion, “Optical chemsensors utilizing long-period fiber gratings UV-Inscribed in D-Fiber with enhanced sensitivity through cladding etching IEEE Photonics Technol. Lett. 16, 1352-1354 (2004).
7. G. Rego, R. Falate, J.L. Santos, H.M. Salgado, J.L. Fabris, S.L. Semjonov and E.M. Dianov, “Arc-induced long-period gratings in aluminosilicate glass fibers”, Opt. Lett. 30, 2065- 2067 (2005).
8. G. Rego, A.F. Fernandez, A. Gusarov, B. Brichard, F. Berghmans, J.L. Santos and H.M. Salgado, “Effect of ionizing radiation on the properties of arc-induced long-period fiber gratings”, Appl. Opt. 44, 6258-6263 (2005).
9. G. Rego, O. Okhotnikov, E. Dianov and V. Sulimov, “High-temperature stability of long-period fiber gratings produced using an electric arc”, J. Lightwave Technol. 19, 1574- 1579 (2001).
10. S. Lee, R. Kumar, P. Kumar, P. Radhakrishnan, C. Vallabhan and V. Nampoori, “Long period gratings in multimode optical fibers: application in chemical sensing”, Opt. Commun. 224, 237-241 (2003).

Fabrication of asymmetric LPFGs using electrical arc and CO2 laser
90
11. T.J. Eom, S.J. Kim, T.Y. Kim, C.S. Park and B.H. Lee, “Optical pulse multiplication and temporal coding using true time delay achieved by long-period fiber gratings in dispersion compensating fiber”, Opt. Express 12, 6410-6420 (2004)
12. L. Dong, L. Reekie and J. Cruz, “Long period gratings formed in depressed cladding fibers”, Electron. Lett. 33, 1897-1898 (1997)
13. G. Humbert, A. Malki, S. Fevrier, P. Roy, J.L. Auguste and J.M. Blondy, “Long period grating filters fabricated with electric arc in dual concentric core fibers”, Opt. Commun. 225, 47-53 (2003)
14. H.L. An, B. Ashton and S. Fleming, “Long-period-grating-assisted optical add-drop filter based on mismatched twin-core photosensitive-cladding fiber”, Opt. Lett. 29, 343-345 (2004)
15. T. Allsop, D. Webb and I. Bennion, “Investigations of the spectral sensitivity of long period gratings fabricated in three-layered optical fiber”, J. Lightwave Technol. 21, 264- 268 (2003)
16. A.A. Abramov, B.J. Eggleton, J.A. Rogers, R.P. Espindola, A. Hale, R.S. Windeler and T.A. Strasser, “Electrically tunable efficient broad-band fiber filter”, IEEE Photonics Technol. Lett. 11, 445-447 (1999).
17. D.M. Costantini, C.A.P. Muller, S.A. Vasiliev, H.G. Limberger and R.P. Salathe, “Tunable loss filter based on metal-coated long-period fiber grating”, IEEE Photonics Technol. Lett. 11, 1458-1460 (1999).
18. M. van Eijkelenborg, W. Padden and J. Besley, “Mechanically induced long-period gratings in microstructured polymer fiber”, Opt. Commun. 236(1-3), 75-78 (2004).
19. G. Kakarantzas, T. Birks and P. Russell, “Structural long-period gratings in photonic crystal fibers”, Opt. Lett. 27, 1013-1015 (2002).
20. G. Humbert, A. Malki, S. Fevrier, P. Roy and D. Pagnoux, “Electric arc-induced long-period gratings in Ge-free air-silica microstructure fibers”, Electron. Lett. 39, 349-350 (2003).
21. K. Morishita and Y. Miyake, “Fabrication and resonance wavelengths of long-period gratings written in a pure-silica photonic crystal fiber by the glass structure change”, J. Lightwave Technol. 22(2), 625-630 (2004).
22. B.J. Eggleton, P.S. Westbrook, R.S. Windeler, S. Spalter and T.A. Strasser, “Grating resonances in air-silica microstructured optical fibers”, Opt. Lett. 24(21), 1460-1462 (1999).
23. V. Bhatia, D. Campbell, R.O. Claus and A.M. Vengsarkar, “Simultaneous strain and temperature measurement with long-period gratings”, Opt. Lett. 22, 648-650 (1997).
24. V. Grubsky and J. Feinberg, “Long-period fiber gratings with variable coupling for real-time sensing applications”, Opt. Lett. 25, 203-205 (2000)
25. D.S. Starodubov, V. Grubsky and J. Feinberg, “All-fiber bandpass filter with adjustable transmission using cladding-mode coupling”, IEEE Photonics Technol. Lett. 10, 1590- 1592 (1998)
26. E.M. Dianov, D.S. Stardubov, S.A. Vasiliev, A.A. Frolov and O.I. Medvedkov, “Refractiveindex gratings written by near-ultraviolet radiation”, Opt. Lett. 22, 221-223 (1997)

Fabrication of asymmetric LPFGs using electrical arc and CO2 laser
91
27. B. Ortega, L. Dong, W. Liu, J. deSandro, L. Reekie, S. Tsypina, V. Bagratashvili and R. Laming, “High-performance optical fiber polarizers based on long-period gratings in birefringent optical fibers”, IEEE Photonics Technol. Lett. 9, 1370-1372 (1997).
28. B. Guan, H. Tam, S. Ho, S. Liu and X. Dong, “Growth of long-period gratings in H-2-loaded fiber after 193-nm UV inscription”, IEEE Photonics Technol. Lett. 12, 642-644 (2000).
29. C. Ye, S. James and R. Tatam, “Simultaneous temperature and bend sensing with long-period fiber gratings”, Opt. Lett. 25, 1007-1009 (2000).
30. Xuewen Shu, Tom Allsop, Bashir Gwandu, Lin Zhang and Ian Bennion, “High-Temperature Sensitivity of Long-Period Gratings in B–Ge Codoped Fiber”, IEEE Photonics Technol. Lett. 13, 818-820 (2001.
31. Rita Zanlorensi Visneck Costa, Ricardo Canute Kamikawachi, Marcia Muller and Jose Luis Fabris, “Thermal characteristics of long-period gratings 266 nm UV-point-by-point induced”, Opt. Commun. 282, 816–823 (2009)
32. J. Blows and D.Y. Tang, “Gratings written with tripled output of Q-switched Nd: YAG laser”, Electron. Lett. 36, 1837-1839 (2000).
33. A.I. Kalachev, D.N. Nikogosyan and G. Brambilla, “Long-period fiber grating fabrication by high-intensity femtosecond pulses at 211 nm”, J. Lightwave Technol. 23(8), 2568-2578 (2005).
34. A. Dragomir, D.N. Nikogosyan, A.A. Ruth, K.A. Zagorul'ko and P.G. Kryukov, “Long-period fiber grating formation with 264 nm femtosecond radiation”, Electron. Lett. 38, 269-271 (2002).
35. S.A. Slattery and D.N. Nikogosyan, “Long-period fiber grating inscription under high-intensity 352 nm femtosecond irradiation: Three-photon absorption and energy deposition in cladding”, Opt. Commun. 255, 81-90 (2005)
36. Mykhaylo Dubov, Ian Bennion Stephen, A. Slattery and David N. Nikogosyan, “Strong long-period fiber gratings recorded at 352 nm”, Opt. Lett. 30, 2533-2535 (2005)
37. K.A. Zagorul'ko, P.G. Kryukov, Y.V. Larionov, A.A. Rybaltovskii, E.M. Dianov, N.S. Vorob'ev, A.V. Smirnov, M.Y. Shchelev and A.M. Prokhorov, “Fabrication of a long-period grating in a fiber by second-harmonic radiation from a femtosecond Ti: sapphire laser”, Quantum Electron. 31, 999-1002 (2001)
38. P.G. Kryukov, Y.V. Larionov, A.A. Rybaltovskii, K.A. Zagorul'ko, A. Dragomir, D.N. Nikogosyan and A.A. Ruth, “Long-period fiber grating fabrication with femtosecond pulse radiation at different wavelengths”, Microelectron. Eng. 69, 248-255, 2003.
39. Yi Jiang, Caijie Tang and Jingjing Xu, “Fabrication of long-period gratings with a mercury-arc lamp”, Opt. Commun. 283, 1311–1315 (2010)
40. Toru Mizunami, Yutaku Sho, Kouitirou Yamamoto, Yoshihito Ishida, “Long-period fiber-gratings produced by exposure with a low-pressure mercury lamp and their sensing characteristics”, Opt. Commun. 282, 4699–4705 (2009)
41. X. Li, C. Yue, L. Xia, X. Chen and S. Xie. “Novel technique for long period gratings fabrication using broad spectrum ultraviolet source”, Microwave Opt. Technol. Lett 33, 368-370 (2002).
42. In Kag Hwang, Seok Hyun Yun and Byoung Yoon Kim, “Long-period fiber gratings based on periodic microbends”, Opt. Lett. 24 , 1263 -1265 (1999)

Fabrication of asymmetric LPFGs using electrical arc and CO2 laser
92
43. Yuki Kondo, Kentaro Nouchi, Tsuneo Mitsuyu, Masaru Watanabe, Peter G. Kazansky and Kazuyuki Hirao, “Fabrication of long-period fiber gratings by focused irradiation of infrared femtosecond laser pulses”, Opt. Lett. 24, 646-648 (1999)
44. D. D. Davis, T. K. Gaylord, E. N. Glytsis, S. G. Kosinski, S. C. Mettler and A. M. Vengsarkar, “Long-period fiber grating fabrication with focused CO2 laser pulses", Electron. Lett. 34, 302-303 (1998).
45. D. D. Davis, T. K. Gaylord, E. N. Glytsis and S. C. Mettler, "CO2 laser-induced long-period fiber gratings: spectral characteristics, cladding modes and polarisation independence," Electron. Lett. 34, 1416-1417 (1998).
46. M. I. Braiwish, B. L. Bachim and T. K. Gaylord, "Prototype CO2 Laser-induced Long-period Fiber Grating Variable Optical Attenuators and Optical Tunable Filters", Appl. Opt. 43, 1789-1793 (2004).
47. Yi-Ping Wang, D. N. Wang, ei Jin, Yun-Jiang RaO andng-Ding Peng, “Asymmetric long period fiber gratings fabricated by use of CO2 laser to carve periodic grooves on the optical fiber”, Appl. Phys. Lett. 89, 151105 (2006)
48. Victor Grubsky and Jack Feinberg, “Fabrication of Axially Symmetric Long-Period Gratings with a Carbon Dioxide Laser”, IEEE Photonics Technol. Lett. 18 , 2296-2298 (2006)
49. Lei Su, Kin Seng Chiang and Chao Lu, “CO2-Laser-Induced Long-Period Gratings in Graded-Index Multimode Fibers for Sensor Applications”, IEEE Photonics Technol. Lett. 18, 190-192 (2006)
50. Petr Cısarovsky, Jirı Dunovsky, Ladislav Kolarık, Filip Todorov , Ivan Kaxık and Vlastimil Matejec, “Recording of long-period gratings in special single-mode fibers by a CO2 laser”, Mater. Sci. Eng., C 26, 448 – 452 (2006)
51. Radan Slavık, “Coupling to circularly asymmetric modes via long-period gratings made in a standard straight fiber”, Opt. Commun. 275, 90–93 (2007)
52. Seungtae Oh, Kyung Rok Lee, Un-Chul Paek and Youngjoo Chung, “Fabrication of helical long-period fiber gratings by use of a CO2 laser”, Opt. Lett. 29, 1464-1466 (2004)
53. Yi-Ping Wang, Limin Xiao, D. N. Wang and Wei Jin, “Highly sensitive long-period fiber-grating strain sensor with low temperature sensitivity”, Opt. Lett. 31, 3414-3416 ( 2006)
54. Gaspar Rego, Rosane Falate, Oleg Ivanov and José Luís Santos, “Simultaneous temperature and strain measurements performed by a step-changed arc-induced long-period fiber grating”, Appl. Opt. 46, 1392-1396 (2007).
55. Georges Humbert and Abdelrafik Malki, “Electric-arc-induced gratings in non-hydrogenated fibers: fabrication and high-temperature characterizations”, J. Opt. A: Pure Appl. Opt. 4, 194–198 (2002)
56. G. Rego, P. V. S. Marques, J. L. Santos and H. M. Salgado, “Arc-Induced Long-Period Gratings”, Fiber Integr. Opt. 24, 245 -259 (2005)
57. Gaspar Rego, “Long-Period Gratings Arcinduced In B/Ge Codoped Fibers: Thermal Behavior And Uniform Exposure To Uv-Radiation”, Microwave Opt. Technol. Lett. 50, 68-70 (2008)
58. P. Palai, M.N. Satyanarayan, Mini Das, K. Thyagarajan and B.P. Pal, “Characterization and simulation of long period gratings fabricated using electric discharge”, Opt. Commun. 193, 181-185 (2001)

Fabrication of asymmetric LPFGs using electrical arc and CO2 laser
93
59. Sung Hyun Nam, Chun Zhan, Jon Lee, Corey Hahn, Karl Reichard, Paul Ruffin, Kung-Li Deng and Shizhuo Yin, “Bend-insensitive ultra short long-period gratings by the electric arc method and their applications to harsh environment sensing and communication”, Opt. Express 13, 731-737 (2005)
60. Gaspar Rego, Oleg V. Ivanov, and P.V.S. Marques, “Demonstration of coupling to symmetric and antisymmetric cladding modes in arc-induced long-period fiber gratings”, Opt. Express 14, 9594- 9599 (2006)
61. O. V. Ivanov and G. Rego, “Origin of coupling to antisymmetric modes in arc-induced long-period fiber gratings”, Opt. Express 15, 13936- 13941 (2007)
62. Gaspar Rego and Oleg V. Ivanov, “Two types of resonances in long-period gratings induced by arc discharges in boron/ germanium co-doped fibers”, Opt. Lett. 32, 2984-2986 (2007)
63. Paulo Caldas, Gaspar Rego, Oleg V. Ivanov and Jose L. Santos, “Characterization of the response of a dual resonance of an arc-induced long-period grating to various physical parameters”, Appl. Opt. 49, 2994-2996 (2010)
64. G. Rego, F. Durr, P.V.S. Marques and H.G. Limberger, “Strong asymmetric stresses arc-induced in pre-annealed nitrogen-doped fibers”, Electron. Lett. 42,334-335 (2006)
65. C.Y. Lin and L.A. Wang, “Loss-tunable long period fiber grating made from etched corrugationstructure”, Electron. Lett. 35, 1872-1873 (1999).
66. C. Y. Lin and Lon A. Wang, “A Wavelength- and Loss-Tunable Band-Rejection Filter Based on Corrugated Long-Period Fiber Grating”, IEEE Photonics Technol. Lett.13, 332-334 (2001)
67. Chunn-Yenn Lin, Lon A. Wang, and Gia-Wei Chern “Corrugated Long-Period Fiber Gratings as Strain, Torsion, and Bending Sensors”, J. Lightwave Technol. 19, 1159-1168 (2001)
68. K. P. Chen, P. R. Herman, R. Tam and J. Zhang, “Rapid long-period grating formation in hydrogen-loaded fiber with 157 nm F2-laser radiation”, Electron. Lett. 36, 2000–2001 (2000).
69. K. P. Chen, P. R. Herman, J. Zhang, and R. Tam, “Fabrication of strong long-period gratings in hydrogen-free fibers with 157-nm F2-laser radiation,” Opt. Lett. 26, 771–773 (2001).
70. O.V. Ivanov, “Fabrication of long-period fiber gratings by twisting of a standard single-modefiber”, Opt. Lett. 30, 3290-3292 (2005)
71. M. Fujimaki, Y. Ohki, J.L. Brebner and S. Roorda, “Fabrication of long-period optical fibergratings by use of ion implantation”, Opt. Lett. 25, 88-89 (2000).
72. M. von Bibra, A. Roberts and J. Canning, “Fabrication of long-period fiber gratings by use of focused ion-beam irradiation”, Opt. Lett. 26, 765-767 (2001).
73. A.F. Fernandez, B. Brichard and F. Berghmans, “In situ measurement of refractive index changes induced by gamma radiation in germanosilicate fibers”, IEEE Photonics Technol. Lett. 15, 1428-1430 (2003).
74. X. Shu, L. Zhang and I. Bennion, “Sensitivity characteristics near the dispersion turning points of long-period fiber gratings in B/Ge codoped fiber”, Opt. Lett. 26, 1755-1757 (2001).
75. Hand D P and Russell P S J,” Photoinduced refractive index changes in germanosilicate fibers”, Opt. Lett. 15, 144–146 (1990)

Fabrication of asymmetric LPFGs using electrical arc and CO2 laser
94
76. Limberger H G, Fonjallaz P Y, Salathe R P and Cochet F, “Compaction- and photoelastic-induced index changes in fiber Bragg gratings”, Appl. Phys. Lett. 68, 3069–3071 (1996)
77. Fonjallaz P Y, Limberger H G, Salathe R P, Cochet F and Leuenberger B, “Tension increase correlated to refractive-index change in fibers containing UV-written Bragg gratings”, Opt. Lett. 20, 1346–1348 (1995).
78. C. S. Kim, Y. Han, B. H. Lee, W. T. Han, U. C. Paek, and Y. Chung, "Induction of the refractive index change in B-doped optical fibers through relaxation of the mechanical stress," Opt. Commun. 185, 337-342 (2000).
79. B. H. Kim, Y. Park, T. J. Ahn, D. Y. Kim, B. H. Lee, Y. Chung, U. C. Paek, and W. T. Han, "Residual stress relaxation in the core of optical fiber by CO2 laser irradiation," Opt. Lett. 26, 1657-1659 (2001).
80. B. H. Kim, T.-J. Ahn, D. Y. Kim, B. H. Lee, Y. Chung, U.-C. Paek, and W.-T. Han, "Effect of CO2 Laser Irradiation on the Refractive-Index Change in Optical Fibers," Appl. Opt. 41, 3809-3815 (2002).
81. Y. Li, T. Wei, J. A. Montoya, S. V. Saini, X. Lan, X. Tang, J. Dong and H. Xiao, "Measurement of CO2-laser-irradiation-induced refractive index modulation in single-mode fiber toward long-period fiber grating design and fabrication," Appl. Opt. 47, 5296-5304 (2008).
82. K. Morishita and A. Kaino, "Adjusting resonance wavelengths of long-period fiber gratings by the glass-structure change," Appl. Opt. 44, 5018-5023 (2005).
83. V. Grubsky and J. Feinberg, "Rewritable densification gratings in boron-doped fibers," Opt. Lett. 30, 1279-1281 (2005).
84. Y. Liu, H. W. Lee, K. S. Chiang, T. Zhu and Y. J. Rao, "Glass Structure Changes in CO2-Laser Writing of Long-Period Fiber Gratings in Boron-Doped Single-Mode Fibers," J. Lightwave Technol. 27, 857-863 (2009).
85. M. Kim, D. Lee, B. Hong and H. Chung, “Performance characteristics of long-period fibergratings made from periodic tapers induced by electric-arc discharge”, J. Korean Phys. Soc. 40, 369-373 (2002)
86. S.G. Kosinski and A.M. Vengsarkar, “Splice-based long-period fiber gratings” (Optical Fiber Communications Conference 1998, 278-279)
87. U. C. Paek and C. R. Kurkjian, "Calculation of cooling rate and induced stresses in drawing of optical fibers," J. Am. Ceram. Soc. 58, 330-335 (1975).
88. A.D. Yablon, “Optical and mechanical effects of frozen-in stresses and strains in optical fibers”, IEEE Journal of Selected Topics in Quantum Electronics 10, 300-311 (2004).
89. B.H. Kim, Y. Park, T.J. Ahn, D.Y. Kim, B.H. Lee, Y. Chung, U.C. Paek, and W.T. Han, “Residual stress relaxation in the core of optical fiber by CO2 laser irradiation”, Opt. Lett. 26, 1657-1659 (2001).
90. H.G. Limberger, P.Y. Fonjallaz, R.P. Salathe and F. Cochet, “Compaction- and photoelastic- induced index changes in fiber Bragg gratings”, Appl. Phys. Lett. 68, 3069-3071 (1996)
91. E.M. Dianov, V.G. Plotnichenko, V.V. Koltashev, Y.N. Pyrkov, N.H. Ky, H.G. Limberger and R.P. Salathe, “UV-irradiation-induced structural transformation of germanosilicate glass fiber”, Opt. Lett. 22, 1754-1756 (1997.)
92. M. Douay, W.X. Xie, T. Taunay, P. Bernage, P. Niay, P. Cordier, B. Poumellec, L. Dong, J.F. Bayon, H. Poignant and E. Delevaque, “Densification involved in

Fabrication of asymmetric LPFGs using electrical arc and CO2 laser
95
the UV-based photosensitivity of silica glasses and optical fibers”, J. Lightwave Technol. 15, 1329-1342 (1997).
93. R. Bruckner, “Properties and Structures of Vitreous Silica. I”, J. Non-Cryst. Solids 5, 123-175 (1970).
94. R. Bruckner, “Properties and Structures of Vitreous Silica. II.”, J. Non-Cryst. Solids 5, 177-216 (1971).
95. L. Jin, Z. Wang, Q. Fang, Y. Liu, B. Liu, G. Kai and X. Dong, "Spectral characteristics and bend response of Bragg gratings inscribed in all-solid bandgap fibers", Opt. Express 15, 15555-15565 (2007).
96. G. Kakarantzas, T. E. Dimmick, T. A. Birks, R. Le Roux and P. S. J. Russell, "Miniature all-fiber devices based on CO2 laser microstructuring of tapered fibers", Opt. Lett. 26, 1137-1139 (2001).
97. H. Xuan, W. Jin and M. Zhang, "CO2 laser induced long period gratings in optical microfibers", Opt.Express 17, 21882-21890 (2009).
98. Y. Zhu, P. Shum, X. Chen, C.-H. Tan and C. Lu, "Resonance-temperature-insensitive phase-shifted long-period fiber gratings induced by surface deformation with anomalous strain characteristics", Opt.Lett. 30, 1788-1790 (2005).
99. E.M. Dianov, V.I. Karpov, M.V. Grekov, K.M. Golant, S.A. Vasiliev, O.I. Medvedkov, and R.R. Khrapko, “Thermo-induced long-period fiber gratings”, ( 23rd European Conference on Optical Communications1997, 53-56)
100. A M. Vengsarkar, P J. Lemaire, J B. Judkins, V Bhatia, T Erdogan, and J E. Sipe, “Long-Period Giber Gratings as Band-Rejection Filters”, J. Lightwave Technol. 14, 58-65 (1996).
101. Turan Erdogan, “Fiber Grating Spectra”, J. Lightwave Technol. 15, 1277-1294 (1997).
102. Turan Erdogan, “Cladding-mode resonances in short- and long period fiber grating filters”, J. Opt. Soc. Am. A 14, 1760-1773 (1997).
103. O V Ivanov, S A Nikitov and Yu V Gulyaev, “Cladding modes of optical fibers: properties and applications”, Phys. Usp. 49, 167 -191 (2006)
104. Li-Yang Shao, Jian Zhao, Xinyong Dong, H. Y. Tam, C. Lu and Sailing He, “Long-period prating fabricated by periodically tapering standard single-mode fiber”, Appl. Opt. 47, 1549-1552 (2008).
105. Vikram Bhatia, “Applications of long-period gratings to single and multi-parameter sensing”, Opt. Express 4 , 457-466 (1999).
106. K. Shima, K. Himeno, T. Sakai, S. Okude, A. Wada, R.Yamauchi, “A novel temperature-insensitive long-period fiber grating using a boron-codoped-germanosilicate-core fiber” (Optical Fiber Communications Conference (OFC’97), 1997)
107. Mei Nar Ng and Kin Seng Chiang, “Thermal effects on the transmission spectra of long-period fiber gratings”, Opt. Commun. 208, 321–327 (2002)
108. Shu X, Allsop T, Gwandu B, Zhang L and Bennion I, “Room-temperature operation of widely tunable loss filter”, Electron. Lett. 37, 216-218 (2001)
109. M Smietana, W J Bock and P Mikulic, “Comparative study of long-period gratings written in a boron co-doped fiber by an electric arc and UV irradiation”, Meas. Sci. Technol. 21, 025309(1-8) (2010)

Fabrication of asymmetric LPFGs using electrical arc and CO2 laser
96
110. Allsop T, Dubov M, Dobb H, Main A, Martinez A, Kalli K, Webb D J and Bennion I A, “comparison of the spectral properties of high temperature annealed long period gratings inscribed by fs laser, UV and fusion-arc”, Proc. SPIE 6193, 61930M(1-9) (2006)

Chapter IV
Fiber optic sensor for the quality evaluation of ethanol blended petrol
4.1 Introduction
Fossil fuels are complex mixtures of liquid hydrocarbons, volatile
and flammable, with physical and chemical properties that accounts for its
high applicability as a source of energy for motor vehicles. The chemical
structure of these fuels contains a variable number of carbon atoms
associated with the formation of paraffins, iso-paraffins, naphthenes, olefins
or aromatic compounds. However, the exact composition of a particular type
of fuel depends on the characteristics of the raw material, their production
process, its use as a final product and the specifications imposed by
regulatory agencies [1].
Fuel additives are compounds added to fuel in order to improve its
efficiency and its performance [2-5]. Several organic compounds have been
used as fuel additives, such as methanol, ethanol, tertiary butyl alcohol and
methyl tertiary butyl ether. Ethanol was the first fuel among the alcohols to
be used to power vehicles in the 1880s and 1890s and is a prospective
material for use in automobiles as an alternative to petroleum based fuels. At
present instead of pure ethanol, a blend of ethanol and petrol is used as a
more attractive fuel with good anti-knock characteristics and the exact
volumetric concentration of ethanol in the fuel is specified by the respective
governments. The main reason for advocating ethanol is that it can be
manufactured from natural products or waste materials while fossil fuels are
produced from non-renewable natural resources. Ethanol is mainly produced
from sugarcane and its use can be a boon to farmers. Moreover, combustion
of ethanol-petrol blend provides significant reduction in the emission of air
pollutants, such as carbon monoxide, carbon dioxide and hydrocarbons
thereby reduce the greenhouse effect and tone down global warming [2-5].
Countries are also seeing it as a means to reduce their dependence on oil
imports and are taking steps to make mandatory blending of 10 per cent
ethanol into petrol. Since ethanol is cheaper than petrol and can be locally distilled, the
fuel may be adulterated by increasing the proportion of ethanol in order to

Fiber optic sensor for the quality evaluation of ethanol blended petrol
98
maximize the profit derived from its sale. Consequently, operating an engine
with an ethanol fuel that presents a high water proportion or with a blend that
has too high hydrated alcohol content will cause engine damage and poor
performance, with possible damage to the environment. One of the most
significant factors responsible for rampant practice of adulteration is the non-
availability of a standard technique that is followed universally for the in-situ
detection of adulteration level. In this context, the development of smart
monitoring systems able to assess the fuel conformity and to supply real-time
and reliable results assumes a great importance.
Aqueous extraction method is the standard test employed to
determine the content of ethanol in the ethanol-petrol blend. Although
widespread, this technique presents high response time, low resolution and is
not susceptible to real-time monitoring. Besides, this method is subject to
errors of parallax and also dependent on a skilled operator to its correct
implementation. Therefore, the development of alternate tools to perform the
ethanol-petrol blend analysis is of great interest.
The petroleum hydrocarbon detection demands some special
characteristics of the sensors to be used. A passive electrical operation is one
of the main characteristics because the hydrocarbon environment can be very
inflammable, so it is interesting to have a sensor device which does not
produce sparks. On addition of ethanol, the refractive index of petrol varies
and therefore, it is natural to consider the utilization of optical fiber
technology to measure the refractive index because of its unique
characteristics such as ease of fabrication, high sensitivity, fast response,
compactness, resistant to harsh environments, distributed sensing besides
being chemically inert and immune to electromagnetic interference [6-10].
These last two qualities in addition to electricity free operation make optical
fiber sensors the safest devices to implement, as hydrocarbon environment is
intrinsically hazardous. Also, as the optical fibers are a very low loss
communication medium, it makes realization of a distributed sensing
network in a hydrocarbon region with signal processing and monitoring from
a remote location feasible.
Long period fiber grating (LPFG) has demonstrated its sensitivity to
the refractive index value of the surrounding material of the grating and
several scientists have exploited this feature of the LPFG to implement

Fiber optic sensor for the quality evaluation of ethanol blended petrol
99
refractive-index sensors based on the change in resonant wavelength [11-35].
The sensitivity to changes in the RI of the surrounding medium enable
LPFGs to be used as chemical detectors, that is, to measure the concentration
of a particular constituent in liquids, such as, salt solutions [11,12], ethylene
glycol [13,14] or hydrocarbon [15-21]. A biosensor based on a LPFG written
in a cladding etched fiber was employed to detect the concentration of the
haemoglobin protein in a sugar solution [22]. The use of LPFGs as liquid
level sensors [23] and as flow sensors [24,25] has also been demonstrated.
LPFGs have been used as a biosensor to detect the RI change when an
antigen bonds with the antibody [26].
Optical fiber sensors based on long period fiber gratings to determine
the ethanol concentration in ethanol blended petrol has already been reported
in the literature [15-19]. Falate et al [15] reported the use of an arc LPFG to
evaluate the quality of the automotive petrol and got an average sensitivity of
0.15 nm/% for the wavelength shift of the resonance band in the region
where the ethanol proportion changes from 20 to 50% in the mixture with
petrol. The successful utilization of LPFG for Biodiesel Quality Control was
also reported [16]. Possetti et al [17] combined the LPFG with artificial
neural networks for smart sensing with high applicability in the
petrochemical field. Successful implementation of long period fiber grating
based devices for kerosene adulteration in petrol was also reported.
In this chapter, we present the utilization of the fabricated LPFGs
(described in chapter 3) for quality evaluation of ethanol blended petrol,
which relies on the refractive indexes changes of the grating surrounding
media. The refractive index sensitivities of the LPFGs fabricated using
electric arc, CO2 laser beam and UV laser beam are determined using
standard liquids. The experiments are carried out with the LPFG immersed
in an external medium of petrol blend with ethanol and the periodically
tapered LPFG is found to have better refractive index sensitivity than normal
arc induced gratings in determining ethanol concentration in ethanol-petrol
blend. The obtained results show that long period fiber gratings can be
applied for fuel quality control.

Fiber optic sensor for the quality evaluation of ethanol blended petrol
100
4.2 Refractive index sensitivity
LPFGs are sensitive to external index of refraction of the substance
surrounding the cladding at the grating location and it arises from the
dependence of the phase matching condition upon the effective refractive
index of the cladding modes. The effective indices of the cladding modes are
dependent upon the difference between the refractive index of the cladding
and that of the medium surrounding the cladding. This affects the differential
effective mode index and hence the spectral attenuation band corresponding
to that cladding mode [13,14,36-39]. In addition to that the evanescent fields
of the cladding modes penetrate beyond the cladding-surround interface and
this cause interaction of cladding mode with that of the ambient [38,39].
Thus the central wavelengths of the attenuation bands show a dependence on
the refractive index of the medium surrounding the cladding, provided that
the cladding has the higher refractive index. In the case of an ambient
medium with refractive index less than that of cladding, the sensitivity of
LPFG to increasing external index of refraction is evident as a shift in central
wavelength and a decrease in peak depth of the of the attenuation band
[13,34,38]. The decrease in attenuation peak depth is due to the increasing
expansion of the cladding mode beyond the cladding boundary with
increasing ambient refractive index. As the ambient index increases beyond
the cladding index, the cladding modes no longer experience total internal
reflection and are referred to as leaky modes. In this case, the peak
transmission loss of the resonance band increases as ambient refractive index
increases. Also coupling occurs at slightly longer wavelengths than the initial
coupling wavelengths when the surrounding material is air (RI=1). As the
ambient index increase from that point, the wavelength shift is non-linear,
with an initial red shift and then blue shift. In this region the wavelength shift
is too small to be calculated or measured [13,33,40,41]. Greater ambient
index sensitivity is exhibited in higher order cladding modes because these
modes are less bound to the waveguide structure formed by the fiber itself
[13,33,40,41].
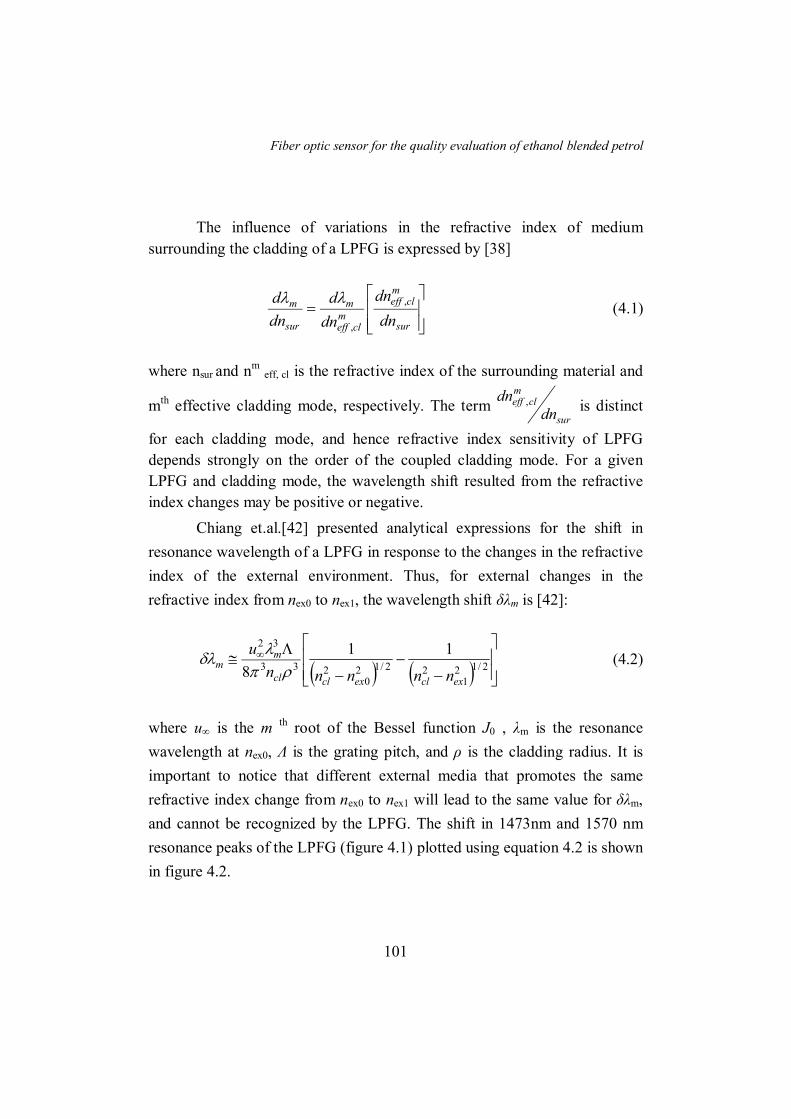
Fiber optic sensor for the quality evaluation of ethanol blended petrol
101
The influence of variations in the refractive index of medium
surrounding the cladding of a LPFG is expressed by [38]
sur
mcleff
mcleff
m
sur
m
dn
dn
dn
d
dn
d ,
,
(4.1)
where nsur and nm eff, cl is the refractive index of the surrounding material and
mth effective cladding mode, respectively. The term sur
mcleff
dndn , is distinct
for each cladding mode, and hence refractive index sensitivity of LPFG
depends strongly on the order of the coupled cladding mode. For a given
LPFG and cladding mode, the wavelength shift resulted from the refractive
index changes may be positive or negative.
Chiang et.al.[42] presented analytical expressions for the shift in
resonance wavelength of a LPFG in response to the changes in the refractive
index of the external environment. Thus, for external changes in the
refractive index from nex0 to nex1, the wavelength shift δλm is [42]:
2/121
22/120
233
32 11
8exclexclcl
mm
nnnnn
u
(4.2)
where u∞ is the m th root of the Bessel function J0 , λm is the resonance
wavelength at nex0, Λ is the grating pitch, and ρ is the cladding radius. It is
important to notice that different external media that promotes the same
refractive index change from nex0 to nex1 will lead to the same value for δλm,
and cannot be recognized by the LPFG. The shift in 1473nm and 1570 nm
resonance peaks of the LPFG (figure 4.1) plotted using equation 4.2 is shown
in figure 4.2.

Fiber optic sensor for the quality evaluation of ethanol blended petrol
102
Figure 4.2 Shift in resonance peak for change in ambient refractive index
Figure 4.1 LPFG Spectrum

Fiber optic sensor for the quality evaluation of ethanol blended petrol
103
4.3 Determination of refractive index sensitivity
The experimental setup used to calibrate the LPFGs for ambient
refractive index change is shown in figure 4.3. The LPFG was glued tightly
inside a glass chamber of volume approximately 20ml. This will ensure that
during the experiments the fiber would be under constant tension and this
reduces the noise due to the LPFG sensitivity to strain. Also to reduce
temperature sensitivity all efforts were made to conduct the experiments at
constant temperature of 240C. The glass cell has inlet and outlet valves to fill
in and drain out liquid samples. To minimize systematic errors and to clean
the measurement system, iso-propanol was introduced into the glass cell and
cleaned several times after draining out samples from the cell. The LPFG
resonance wavelength position relative to iso-propanol was used as the
reference for ensuring cleanliness of the LPFG. After draining out iso-
propanol, the LPFG was dried before transferring the next sample to the cell.
We have calibrated the LPFG for refractive index sensing by
determining the shift of the resonant peak for known refractive indices.
Water, ethanol, propanol, aqueous solutions of glycerol at various
concentrations, coconut oil, paraffin oil and groundnut oil were transferred
one after the other into the cell and the LPFG response was recorded. The
refractive indices of these solutions were also determined using an Abbe
refractometer. The shift in the attenuation peak for the change in ambient
refractive index is found to increase with increasing mode order. Thus, for
sensor applications, it is desirable to work with the highest-order cladding
Figure 4.3 Experiment setup for determining refractive index sensitivity

Fiber optic sensor for the quality evaluation of ethanol blended petrol
104
mode that falls within the bandwidth of the light source used to interrogate
the grating.
The refractive index sensitivity of UV fabricated symmetric LPFG
was evaluated and the shift in 1570nm attenuation band with different
ambient refractive index is shown in figure 4.4. When external refractive
index is less than that of cladding, the LPFG sensitivity to increasing
external index of refraction is evident as a blue shift in central wavelength of
the attenuation band and a decrease in its peak depth.
Once the value of ambient refractive index reaches that of the
cladding, discrete cladding modes are no longer guided along the fiber. The
absence of distinct attenuation bands in the LPFG transmission spectrum is
evident in figure 4.4 at an ambient refractive index around 1.45. . In effect
the cladding has an infinitely large radius when next≈ ncl , such that the
cladding modes are converted into radiation modes as a result of the lack of
total internal reflection at the cladding boundary. The LPFG is most sensitive
Figure 4.4 LPFG resonance peak for various ambient refractive indices
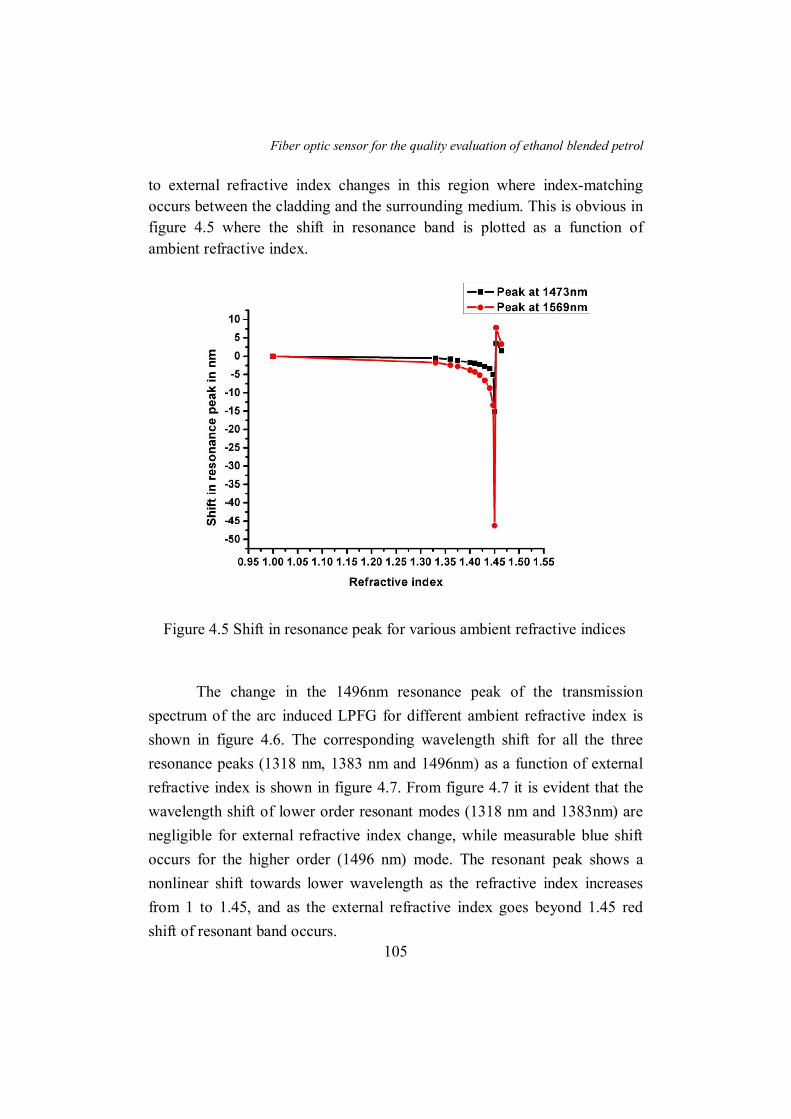
Fiber optic sensor for the quality evaluation of ethanol blended petrol
105
to external refractive index changes in this region where index-matching
occurs between the cladding and the surrounding medium. This is obvious in
figure 4.5 where the shift in resonance band is plotted as a function of
ambient refractive index.
The change in the 1496nm resonance peak of the transmission
spectrum of the arc induced LPFG for different ambient refractive index is
shown in figure 4.6. The corresponding wavelength shift for all the three
resonance peaks (1318 nm, 1383 nm and 1496nm) as a function of external
refractive index is shown in figure 4.7. From figure 4.7 it is evident that the
wavelength shift of lower order resonant modes (1318 nm and 1383nm) are
negligible for external refractive index change, while measurable blue shift
occurs for the higher order (1496 nm) mode. The resonant peak shows a
nonlinear shift towards lower wavelength as the refractive index increases
from 1 to 1.45, and as the external refractive index goes beyond 1.45 red
shift of resonant band occurs.
Figure 4.5 Shift in resonance peak for various ambient refractive indices

Fiber optic sensor for the quality evaluation of ethanol blended petrol
106
Figure 4.6 Resonance peak of arc induced LPFG for various ambient refractive indices
Figure 4.7 Shift in resonance peak for various ambient refractive indices

Fiber optic sensor for the quality evaluation of ethanol blended petrol
107
Figure 4.8 Resonance peak of CO2 LPFG for various ambient refractive indices
Figure 4.9 Shift in resonance peak for various ambient refractive indices

Fiber optic sensor for the quality evaluation of ethanol blended petrol
108
Figure 4.10 Refractive index sensitivities (dλ/dn) of the LPFGs in the refractive index range 1 to 1.4
The experiment was repeated for the CO2 inscribed LPFG and the
results obtained are depicted in figure 4.8 and 4.9. While the variation in
1528nm resonance band with various ambient refractive indices is shown in
figure 4.8, the shift in resonance bands as a function of ambient refractive
index is shown in figure 4.9.
It is known that the higher order modes are highly sensitive to refractive
index and the refractive index sensitivities obtained through the derivative of
the refractive index response (dλ/dn) of the three LPFGs are shown in figure
4.10 and 4.11. For the sake of comparison, the sensitivities are considered
within two ranges: a low sensitivity range (1 to 1.41), when the sample
refractive index is much lower than the cladding refractive index (figure
4.10), and a high sensitivity range (1.43 to 1.45), when the sample refractive
index approaches the cladding index (figure 4.11). The calculated
sensitivities in these two ranges (total shift in wavelength/ total refractive
index change) for all three LPFGs are tabulated in table 4.1. It is obvious that
the periodically tapered arc induced LPFG has a slight edge over other
LPFGs in the case of refractive index sensitivity in the range 1 to 1.41. In the
1.43 to 1.45 range, the UV fabricated LPFG shows a sensitivity of
1980nm/RIU which is much greater than the other two LPFGs.

Fiber optic sensor for the quality evaluation of ethanol blended petrol
109
Figure 4.11 Refractive index sensitivities (dλ/dn) of the LPFGs in the refractive index range 1.43 to 1.45
Table 4.1 Refractive index sensitivities
1 to 1.41 (nm/RIU) 1.43 to 1.45 (nm/RIU)
UV LPFG -10.5 -1980
Arc LPFG -13.4 -837.5
CO2 LPFG -3.4 -107.5
4.4 Ethanol concentration in petrol
In order to analyze ethanol blended petrol, samples were prepared
with ethanol percentages of 0, 10, 20, 50, 80 and 100 % in pure petrol.
Experiments were carried out by introducing each set of the samples into the
glass cell (same as the one used for refractive index measurements figure
4.2), in increasing order of ethanol concentration, and performing
consecutive measurements of the LPFG transmission spectrum. After
draining out each sample, the cell was cleaned several times using iso-

Fiber optic sensor for the quality evaluation of ethanol blended petrol
110
Figure 4.12 Refractive index of ethanol blended petrol as a function of ethanol concentration
propanol. After ensuring the resonance wavelength position of iso-propanol,
propanol was drained out and the cell was dried. The refractive index of each
sample was measured using an Abbe refractometer just after draining out the
sample from the glass cell and in figure 4.12 the refractive indices of the
different samples measured with the Abbe refractometer are presented
against ethanol concentration.
The average shift in higher order resonant peak of the LPFGs were
determined for each ethanol concentration and is plotted in figure 4.13. From
the LPFG response, it is clear that the peak shift is not noticeable up to 10%
ethanol concentration in the case of CO2 and arc induced gratings but
appreciable shift in resonance peak is observed as the ethanol concentration
varies from 10% to 100% in petrol. Since the mandatory ethanol
concentration is in between 10% to 20% the most common adulteration
range will be beyond 10% and mixing ethanol beyond 50% is a rare

Fiber optic sensor for the quality evaluation of ethanol blended petrol
111
Figure 4.13 Shift in resonance peak as a function of ethanol concentration in ethanol blended petrol
possibility. So if the compulsory ethanol blending is 10%, the most probable
adulteration range would be between 10% and 20%, while it will be between
20% and 30% if the blending concentration is 20%. Thus by properly tuning,
the fabricated periodically tapered LPFG based transducer system can be
effectively used for in-situ monitoring of adulteration in ethanol blended
petrol.
Even though the shift in resonance peak is not linear in the entire
concentration range of ethanol in petrol, the LPFGs shows measurable shift
as the concentration of ethanol is changed from 0% to 100% with good
repeatability. The sensitivity of the LPFG sensor for ethanol concentration
was calculated by the numerical derivative of the response curve. The
calculated sensitivities in the ethanol concentration range 10%-20% and 20%
-50% for the three LPFGs are tabulated in table 4.2.

Fiber optic sensor for the quality evaluation of ethanol blended petrol
112
Table 4.2 Sensitivity of LPFGs for ethanol blended petrol
Sensitivity for ethanol blended petrol in the
ethanol volumetric concentration range
10%-20% 20%-50%
Arc LPFG 280pm/V% 20pm/V%
CO2 LPFG 155pm/V% 31pm/V%
UV LPFG 36pm/V% 16pm/V%
From the table it is clear that the periodically tapered arc induced
gratings have a better sensitivity in determining ethanol concentration in
ethanol blended petrol in the 10% to 20% ethanol range. Possetti et.al.[17]
tried the same experiment using normal arc induced LPFG and they got a
shift of 1nm for ethanol concentration change from 0% to 40%. The 3nm
shift shown by periodically tapered LPFG for the concentration change from
10% -20% is hence better than the normal arc induced grating. Shao et.al
[43] have demonstrated the fabrication of periodically tapered long period
fiber gratings using resistive filament heating and the method of tapering has
proved to increase refractive index sensitivity. Hence the higher sensitivity
of periodically tapered arc induced LPFG towards ethanol concentration too
can be attributed to tapering.
Conclusions
In this chapter the basic theory related to the refractive index
sensitivity of long-period fiber gratings were discussed. Afterwards, the
response of the fabricated LPFGs namely UV, electric arc and CO2 induced
long period fiber gratings towards ambient refractive indices were
determined. The refractive index sensitivities were evaluated and the LPFGs
were successfully utilized for determining the quality of ethanol blended
petrol. Besides being insensitive to temperature, the arc induced LPFG have
shown better sensitivity among the three LPFGs in determining the purity of
ethanol blended petrol. Hence the periodically tapered arc induced LPFG can
be successfully utilized as a temperature insensitive transducer for quality
evaluation of ethanol blended petrol.

Fiber optic sensor for the quality evaluation of ethanol blended petrol
113
References
1. E. M. Goodger, Hydrocarbon fuels: production, properties and performance of liquids and gases (Wiley, 1975)
2. M. Al-Hasan, “Effect of ethanol–unleaded gasoline blends on engine performance and exhaust emission”, Energy Convers. Manage., 44, 1547-1561 (2003)
3. Robert K. Niven, “Ethanol in gasoline: environmental impacts and sustainability review article”, Renewable Sustainable Energy Rev. 9, 535-555 (2005).
4. Wei-Dong Hsieh, Rong-Hong Chen, Tsung-Lin Wu, Ta-Hui Lin, “Engine performance and pollutant emission of an SI engine using ethanol–gasoline blended fuels”, Atmos. Environ. 36, 403–410 (2002)
5. Alan C. Hansen, Qin Zhang and Peter W.L. Lyne, “Ethanol–diesel fuel blends––a review”, Bioresour. Technol. 96, 277–285 (2005)
6. B Culshaw and J Dakin, Optical Fiber Sensors: Systems and Applications, (Artech House, Boston, 1989)
7. D A Krohn, Fiber Optic Sensors: Fundamental and Applications, (Instrument Society of America, Research Triangle Park, North Carolina, 1988).
8. E Udd, Fiber Optic Sensors: An Introduction for Engineers and Scientists, (Wiley, New York, 1991).
9. Francis To So Yu and Shizhuo Yin, Fiber Optic Sensors, (Marcel Dekker, Inc., New York, 2002).
10. B.D.Gupta, Gupta and Banshi Das, Fiber Optic Sensors: Principles and Applications (New India Publishing, New Delhi,2006)
11. G R C Possetti, R C Kamikawachi, C L Prevedello, M Muller and J L Fabris, “Salinity measurement in water environment with a long period grating based interferometer”, Meas. Sci. Technol. 20, 034003(1-6) (2009)
12. Samer K. Abi Kaed Bey , Cathy Chung Chun Lam, Tong Sun and Kenneth T.V. Grattan, “Chloride ion optical sensing using a long period grating pair”, Sens. Actuators, A 141, 390–395 (2008)
13. Patrick H J, Kersey A D and Bucholtz F, “Analysis of the response of long period fiber gratings to external index of refraction “, J. Lightwave Technol. 16, 1606–1642 (1998)
14. Falciai R, Mignani A G and Vannini, “A Long period gratings as solution concentration sensors”, Sens. Actuators, B 74, 74–77 (2001)
15. R. Falate, R.C. Kamikawachi, M. Muller, H.J. Kalinowski and J.L. Fabris, “Fiber optic sensors for hydrocarbon detection”, Sensors and Actuators B, 105, 430–436 (2005)
16. Rosane Falate, Karen Nike, Pedro Ramos da Costa Neto, Eduardo Cacao Jr., Marcia Muller, Hypolito Jose Kalinowski and Jose Luis Fabris, “Alternative Technique For Biodiesel Quality Control Using An Optical Fiber Longperiod Grating Sensor” , Quim. Nova 30, 1677-1680 (2007)
17. G R C Possetti, L C Cocco, C I Yamamoto, L V R de Arruda, R Falate, M Muller and J L Fabris, “Application of a long-period fiber grating-based transducer in the fuel industry”, Meas. Sci. Technol. 20, 034012 (1-9) (2009)
18. R. Falate, R. C. Kamikawachi, J. L. Fabris, M. Müller and H. J. Kalinowski, “Fiber Optic Hydrocarbon Sensors Based On Long Period Gratings”, Journal of Microwaves and Optoelectronics,. 3, 47-55 (2004)
19. Gustavo Rafael Collere Possetti, Marcia Muller and Jose Luis Fabris, “Refractometric optical fiber sensor for measurement of ethanol concentration in

Fiber optic sensor for the quality evaluation of ethanol blended petrol
114
ethanol-gasoline blend”, (International Microwave & Optoelectronics Conference (IMOC), 2009)
20. Sumat Nanda, Nidhi Sharma and Sukhdev Roy, “Simple and Sensitive Fiber Optic Sensor to Detect Adulteration in Petrol and Diesel”, (PHOTONICS-2008: International Conference on Fiber Optics and Photonics, IIT Delhi, India ,2008)
21. Vandana Mishra, Subhash C Jain, Nahar Singh, G C Poddar and Pawan Kapur , “Fuel adulteration detection using long period fiber grating sensor technology”, Indian Journal of Pure & Applied Physics, 46, 106-110 (2008).
22. Xianfeng Chen, Kaiming Zhou, Lin Zhang and Ian Bennion, “Dual-peak long-period fiber gratings with enhanced refractive index sensitivity by finely tailored mode dispersion that uses the light cladding etching technique”, Appl. Opt. 46, 451-455 (2007).
23. Sarfraz Khaliq, Stephen W. James and Ralph P. Tatam, “Fiber-optic liquid-level sensor using a long-period grating”, Opt. Lett. 26, 1224-1226 (2001)
24. Dankers J P, Lenhart J L, Kueh S R, van Zanten J H, Advani S G and Parnas R S, “ Fiber optic flow and cure sensing for liquid composite molding”, Opt. Lasers Eng. 35, 91–104 (2001)
25. Kueh S R M, Parnas R S and Advani S G, “A methodology for using long-period gratings and mold-filling simulations to minimize the intrusiveness of flow sensors in liquid composite molding”, Compos. Sci. Technol. 62, 311–327 (2002)
26. Matthew P. DeLisa, Zheng Zhang, Mira Shiloach, Saeed Pilevar, Christopher C. Davis, James S. Sirkis and William E. Bentley, “Evanescent Wave Long-Period Fiber Bragg Grating as an Immobilized Antibody Biosensor”, Anal. Chem. 72, 2895-2900 (2000).
27. Jian Yang, Li Yang, Chang-Qing Xu, Chenglin Xu, Weiping Huang and Yingfu Li, “Long-period grating refractive index sensor with a modified cladding structure for large operational range and high sensitivity”, Appl. Opt. 45, 6142- 6147 (2006)
28. Joo Hin Chong, Ping Shum, H. Haryono, A. Yohana, M.K. Rao, Chao Lu and Yinian Zhu, “Measurements of refractive index sensitivity using long-period grating refractometer”, Opt. Commun. 229, 65–69 (2004)
29. Hou R, Ghassemlooy Z, Hassan A, Lu C and Dowker K P, “ Modelling of long-period fiber grating response to refractive index higher than that of cladding”, Meas. Sci. Technol. 12, 1709–1713 (2001)
30. Lee B H, Liu Y, Lee S B, Choi S S and Jang J N, “Displacements of the resonant peaks of a long-period fiber grating induced by a change of ambient refractive index”, Opt. Lett. 22, 1769–1771 (1997)
31. Duhem O, Henninot J-F, WarenghemM and Douay M, “ Demonstration of long-period grating efficient couplings with an external medium of a refractive index higher than that of silica”, Appl. Opt. 37, 7223–7228(1998)
32. Shu X and Huang D, “Highly sensitive chemical sensor based on the measurement of the separation of dual resonant peaks in a 100 μm period fiber grating”, Opt. Commun. 171, 65–69 (1999).
33. Allsop T, Zhang L and Bennion I, “Detection of organic aromatic compounds by a long period fiber grating optical sensor with optimised sensitivity”, Opt. Commun. 191, 181–190 (2001)
34. Stephen W James and Ralph P Tatam, “Optical fiber long-period grating sensors: characteristics and application”, Meas. Sci. Technol. 14, R49–R61(2003)
35. Gwandu B A L, Shu X, Allsop T D P, ZhangW, Zhang L and Bennion I, “Simultaneous refractive index and temperature measurement using cascaded long-period grating in double-cladding fiber”, Electron. Lett. 38, 695–696 (2002)

Fiber optic sensor for the quality evaluation of ethanol blended petrol
115
36. A N Vengsarkar, P J Lemaire, J B Judkins, V Bhatia, T Erdogan and J E Sipe, “Long-period fiber gratings as band-rejection filters”, J. Lightwave Technol. 14, 58-65 (1996).
37. X Shu, L Zhang and I Bennion, “Sensitivity characteristics of long-period fiber gratings”, J. Lightwave Technol. 20, 255-266 (2002).
38. V Bhatia, “Applications of long-period gratings to single and multi-parameter sensing”, Opt. Express 4, 457-466(1999).
39. V Bhatia and A M Vengsarkar, “Optical fiber long-period grating sensors”, Opt. Lett. 21, 692-694 (1996).
40. D B Stegall and T Erdogan, “Leaky cladding mode propagation in long-period fibre grating devices”, IEEE Photon. Technol. Lett. 11, 343–345 (1999).
41. R Hou, Z Ghassemlooy, A Hassan, C Lu, and K P Dowker, “Modelling of long-period fiber grating response to refractive index higher than that of cladding”, Meas. Sci. Technol. 12,1709-1713(2001).
42. K S Chiang, Y Liu, M N Ng and X Dong, “Analysis of etched long-period fiber grating and its response to external refractive index”, Electron. Lett. 36, 966-967 (2000).
43. Li-Yang Shao,Jian Zhao, Xinyong Dong, H. Y. Tam, C. Lu and Sailing He, “Long-period prating fabricated by periodically tapering standard single-mode fiber”, Appl. Opt. 47, 1549-1552 (2008)

Chapter V
Fiber optic sensor for determining relative humidity of the environment
5.1 Introduction
Water vapour is a natural component of air and the amount of water
vapour in the air is described by the term “humidity.” The mass of water
vapour in a given volume of air (i.e. density of water vapour in a given
volume, usually expressed in grams per cubic meter) is defined as Absolute
humidity while ratio of the percentage of water vapour present in air at a
particular temperature to the maximum amount of water vapour the air can
hold at that temperature is called relative humidity. It is often expressed as a
percentage using the following equation [1]
%100WS
W
P
PRH
where PW is the partial pressure of the water vapour and PWS is the saturation
water vapour pressure.
As humidity is a very common, continuously changing component of
our environment, the measurement and control of humidity is necessary in a
range of areas like air-conditioning, structural health monitoring, horticulture,
meteorological services, chemical and food processing industry, paper and
textile production, semiconductor manufacturing process etc [1]. The
requirements for humidity monitoring may vary according to the application
and hence various techniques from the simplest way of exploiting the
expansion and contraction of materials such as human hair to the most
sophisticated techniques, such as using a miniaturized electronic chip, have
been explored over many years to obtain meaningful humidity measurements
[1-4].
Generally, humidity sensors can be divided into two major groups
namely electronic and optical, those that measure changes in electrical and
optical properties of the sensing material upon interaction with moisture.
Materials that have been studied for humidity sensing purposes include

Fiber optic sensor for determining relative humidity of the environment
117
polymer, composite and ceramic, each of which has its own merits and
specific conditions of application. Since this subject has been studied for
some time, excellent reviews can be found in the literature on the principles
and preparation techniques of different humidity sensors [1-4].
Electronic humidity sensors are either capacitive or resistive type
which works on the electrical properties of the sensing material. Capacitive
humidity sensors consist of a substrate on which a thin film of polymer or
metal oxide is deposited between two conductive electrodes. The sensing
surface is coated with a porous metal electrode to protect it from
contamination and exposure to condensation. The incremental change in the
dielectric constant of a capacitive humidity sensor is proportional to the
relative humidity (RH) of the surrounding environment. Capacitive sensors
are characterized by low temperature coefficient, ability to function at high
temperatures (up to 200°C), full recovery from condensation, and reasonable
resistance to chemical vapours [2-7]. In capacitive type sensors the distance
of the sensing element from the signal conditioning circuitry is limited due to
the capacitive effect of the connecting cable with respect to the relatively
small capacitance changes of the sensor.
Resistive humidity sensors measure the change in electrical
impedance of a hygroscopic medium such as a conductive polymer, salt, or
treated substrate. Resistive sensors usually consist of noble metal electrodes
either deposited on a substrate by photo resist techniques or wire-wound
electrodes on a plastic or glass cylinder. The substrate is coated with a salt or
conductive polymer. Alternatively, the substrate may be treated with
activating chemicals such as acid. The sensor absorbs the water vapour and
ionic functional groups are dissociated, resulting in an increase in electrical
conductivity. A distinct advantage of resistive RH sensors is their
repeatability, which allows the electronic signal conditioning circuitry to be
calibrated by a resistor at a fixed RH point. This eliminates the need for
humidity calibration standards and hence resistive humidity sensors are
generally field replaceable. In residential and commercial environments, the
life expectancy of these sensors is greater than 5 years, but exposure to
chemical vapours and other contaminants such as oil mist may lead to
premature failure. Another drawback of some resistive sensors is their
tendency to shift values when exposed to condensation if a water-soluble
coating is used. Resistive humidity sensors have significant temperature

Fiber optic sensor for determining relative humidity of the environment
118
dependencies when installed in an environment with large (>10°F)
temperature fluctuations [2-4,8-10].
The most important specifications to keep in mind when selecting a sensor
are accuracy, repeatability, interchangeability, long-term stability, resistance
to chemical and physical contaminants, size, packaging, cost effectiveness,
field and in-house calibrations, and the complexity and reliability of the
signal conditioning and data acquisition (DA) circuitry. Generally electronic
sensors are inexpensive and have low power consumption, covering a wide
humidity range with good repeatability but suffer from temperature
dependency and cross-sensitivities to some chemical species. Their
performance is limited owing to their inability to remote and distributed
sensing, multiplexing, deployment in harsh environments, and their
susceptibility to electromagnetic and radio frequency interference. Fiber
optic type sensors can overcome these disadvantages and can be constructed
by utilizing the humidity sensitive variation in optical properties of sensor
materials. Optical fiber humidity sensors have been already used to facilitate
the remote sensing and continuous monitoring of humidity in diverse
applications such as the baking and drying of food, cigar storage, civil
engineering to detect water ingress in soils or in the concrete in civil
structures, medical applications and many other fields [1,11-22]. However,
the limitations of the operating range and accuracy of the FO-based humidity
sensors are some of the drawbacks which researchers are striving to continue
to address.
Various fiber optic sensor techniques based on absorption [16,23,24],
fluorescence [25,26], evanescent wave [14,18,21,27-29,30-35], fiber gratings
[11-13,36-38] and interferometry [39,40] have been exploited over the years
in the design and development of optical fiber RH sensors. Potential
materials and chemical reagents like cobalt chloride (CoCl2)[16,23,41,42] ,
cobalt oxide (Co3O4) [43], Rhodamine B [44] , titanium dioxide (TiO2)
[22,33,39,45], tin dioxide (SnO2) [46], silicon dioxide (SiO2) [20,47],
calcium chloride (CaCl2) [48] etc have been reported based on their
humidity-dependent optical absorption properties. Zhou et al. [16] who have
demonstrated an in-line absorption-based humidity sensor using a porous
optical fiber segment doped with CoCl2. The use of the absorption
characteristics of the same compound contained in a variety of materials
such as gelatine and cellulose has also been discussed by various authors

Fiber optic sensor for determining relative humidity of the environment
119
[41,42]. Tao et al. [23] have demonstrated an active fiber core optical sensor
(AFCOS) for humidity detection using an in-line absorption sensing concept.
An air-gap design configuration with Rhodamine B (RB) and hydroxypropyl
cellulose (HPC) coated fiber tip was reported by Otsuki et al. [44]. Titanium
dioxide, also known as titania (TiO2) , is the naturally occurring oxide of
titanium and has been extensively investigated as a hygrosensitive material
for humidity sensing applications. Humidity sensor based on TiO2 overlay on
side-polished fiber is reported by Alvarez-Herrero et.al [33]. Depending on
the refractive index value of the overlay, the wavelength of the resonance
shifts accordingly to fulfill the phase matching condition. This forms the
basis of the sensing scheme and the sensor has shown a linear wavelength
shift for 0 to 15%RH, with a sensitivity of 0.5 nm/%RH. A fiber optic
humidity sensor with a response time of 5 sec and a dynamic range of
20%RH to 80%RH based on the moisture dependence absorption of light by
the phenol red doped polymethylmethacrylate (PMMA) film was reported by
Gupta et. al. [18].
The use of long period fiber grating (LPFG) for humidity sensing was
first reported by Luo et al. [49] and in their work carboxymethylcellulose
(CMC) hydrogel was covalently attached to cladding of a LPFG to form the
humidity sensor. A similar LPFG-based humidity sensing scheme was
demonstrated by Tan et al. [37] using a gelatine-coated LPFG and
Konstantaki et al. [38] proposed a LPFG humidity sensor utilizing
polyethylene oxide (PEO)/CoCl2 hybrid overlay as the moisture sensitive
coating. An optical fiber humidity sensor based on LPFG coated with a
silicon dioxide (SiO2) nanosphere film was reported by Viegas et.al [20].
Studies by Venugopalan et al. [13,50] have shown the use of polyvinyl
alcohol (PVA) film as a sensing material for LPFG-based humidity detection.
A long-period fiber grating coated with hydrogel for humidity measurement
was developed by LiweiWang et al. [51].
Although various materials are used as humidity sensitive coatings in
fiber optic humidity sensors, polymer film based sensors have attracted a
great deal of interest due to their inherent advantages. They are compatible
with oxides and ceramics, low-cost, flexible, light weight, easily processibile
and can be used at room temperatures. In general, polymers provide useful
mechanical properties to the sensor design and hygroscopic polymers like
Poly-aniline [52,53], PVA [13,17,32,50], Chitosan [54,55],

Fiber optic sensor for determining relative humidity of the environment
120
polyethyleneoxide [56], PMMA [18] Polyimide (PI) [57].etc are being used
in optical sensors.
Gaston et al. [32] have proposed an evanescent wave type humidity
sensor based on a single mode, side-polished fiber with a PVA overlay and
got a linear response in the RH range 70% to 90%. The humidity sensitivity
of PVA was successfully utilized for the construction of LPFG based
humidity sensors [13,50]. The commercial polyimide-recoated FBGs were
found to respond linearly over a wide humidity range [57]. The sensor was
reported to respond well to a humidity range of 10–90%RH and display good
repeatability. Razat Nohria et.al. [52]worked on Humidity sensor based on
ultrathin polyaniline film deposited using layer-by-layer nano-assembly.
They used layer-by-layer (LbL) nano-assembly for deposition of ultrathin
poly(anilinesulfonic acid) (SPANI) films and the change in electrical sheet
resistance of the sensing film was monitored as the device was exposed to
humidity. In their work on Humidity sensors based on polymer thin films,
Sakai et.al. [59] had explained the humidity sensing behaviour of hydrophilic
polymers like poly-(2-acrylamido- 2-methylpropane sulfonate) and poly-(2-
hydroxy-3-methacryloxypropyi trimethylammonium chloride) impregnated
in microporous polyethylene film.. A humidity sensor with nanostructure Co
dispersed in polyaniline deposited as a clad, having quick response of 8 s
(20–95%RH) and recovery time of 1 min (95–20%RH) was reported [53].
Effect of changes in relative humidity and temperature on ultrathin chitosan
films were studied by Murray et al. [54] while Jinesh et al [55] was
successful in constructing a fiber optic evanescent wave based humidity
sensor using chitosan as the clad and macro bend fiber coated with Poly
(ethylene oxide) [56].
Chitosan is a natural polysaccharide formed by alkaline deacetylation
of the second most abundant naturally occurring chitin of crab and shrimp
shells [60]. Since it is inexpensive, non-toxic and possesses potentially
reactive amino functional groups, chitosan has been evaluated for numerous
applications, including medicine, food, cosmetics and wastewater treatment
[61] and has also showed its potential as hygroscopic coating for fiber optic
humidity sensor [54,55]. Though the response of the chitosan coated
evanescent wave sensor is linear its humidity sensitivity is found to be poor.
Poly (vinyl alcohol) is a non-toxic, water-soluble synthetic polymer that has
good film forming ability. It has a large number of hydroxyl groups which

Fiber optic sensor for determining relative humidity of the environment
121
allows it to react with many types of functional groups. This advantage
makes it suitable for biocompatible materials and has found use in the
fabrication of fiber optic humidity sensors [13,17,32,50]. The PVA coated
humidity sensor has shown better sensitivity but the operating range is 50% -
90% RH [32].
The humidity sensitivity of polymers depends on the availability of
hydrophilic head groups and their degree of swelling. Developement of
membranes with both sensitivity and mechanical strength has been deemed
extremely difficult. The mechanical strength of PVA can be enhanced by
acetalization. However, the degree of water absorption is considerably
lessened along with the increase in mechanical strength. Therefore, it is
extremely difficult to obtain polymer membranes which are satisfactory in
water sorbtion and mechanical strength. Addition of chitosan to PVA
improves hydrophilic head groups along with the improvement in
mechanical strength. If the proportion of chitosan is less than 10% , the
beneficial effect achievable by addition of chitosan will be significantly
reduced. On the other hand if the proportion becomes more than 60%, any
additional effects will hardly be obtained. Moreover chitosan will be leached
away in an acidic medium if the membrane is higher in its chitosan content.
Chitosan/PVA blend has been found to be miscible in all composition and
El-Hefian et.al [62] has shown that the blend with 50% PVA has maximum
degree of swelling compared with pure polymers.
It is observed that the presence of metal oxide ions increases the
humidity sensitivity of hydrophilic polymers. Khijwania et. al. [19] have
reported a RH sensor based on U-shaped probe coated with anhydrous CoCl2
and PVA. It has a response time of 1 sec with a sensing range of 1.6% RH to
92% RH. Recently an optical fiber humidity sensor based on TiO2-
nanoparticle doped nanostructured thin film as the fiber sensing cladding was
reported by R Aneesh et.al.[22]. Stannic oxide (SnO2) nanoparticles
suspended polyvinyl alcohol (PVA) matrix was used for humidity sensing by
Hatamie et.al. [63]. Enhancement of the humidity-sensing properties of
poly(methyl methacrylate) (PMMA) with the addition of alkali salts (KOH
and K2Co3) was reported by Su et.al [64]
In this work we have tried to find out the humidity sensing behavior
of PVA-chitosan blend by coating the polymer over an exposed core region
of a plastic clad silica fiber. The response of the evanescent wave fiber optic

Fiber optic sensor for determining relative humidity of the environment
122
humidity sensor thus constructed is presented. Also we have tried to improve
the sensitivity and operational range by dispersing TiO2 in the PVA-chitosan
blend. The fabricated sensor exhibits good characteristics, such as sensitivity,
range and time response.
5.2 Chitosan and PVA
Chitosan is a biopolymer derived primarily from deacetylation of
chitin, found in the shells of crustaceans and insects [60,61,65-67].
Structurally, both chitosan and chitin are linear polymers composed of 2-
amino-2-deoxy-(1,4)-β-D-glucopyranose with different degrees of N-
acetylation, which differentiates them. The molecular structure of chitosan is
shown in figure 5.1.
Alkali treatment of chitin replaces the acetyl side group on the chitin
repeat units with an amine group, converting them to chitosan. The degree of
N-acetylation in chitin, is the ratio of 2-acetamido-2-deoxy-D-glucopyranose
to 2-amino-2-deoxy-D-glucopyranose structural units. Chitosan is the
universally accepted non-toxic N-de acetylated derivative of chitin. In chitin,
the acetylated units prevail (degree of acetylation typically 0.90). Chitosan is
the fully or partially N-deacetylated derivative of chitin with a typical degree
of acetylation of less than 0.35. Thus the percentage of repeat units with
acetyl side groups is specified as the degree of acetylation (DA), with pure
chitin corresponding to DA-100% and pure chitosan corresponding to DA-
0% [65-67]. The degree of deacetylation (DD) is defined as DD=100-DA.
Chitosan is insoluble in water at neutral pH but it can be dissolved in weakly
Figure 5.1 Molecular structure of Chitosan

Fiber optic sensor for determining relative humidity of the environment
123
acidic aqueous solutions and be made into hydrogels. The hydrogel form of
chitosan can absorb up to 2000% of its own weight in water. For applications
that require mechanical rigidity and improved stability with respect to
changes in relative humidity, it is preferable to convert chitosan to chitin, and
this is typically accomplished by exposing the chitosan to acetic anhydride.
Unfortunately, the toxic nature of acetic anhydride makes the chemical
conversion of chitosan to chitin environmentally unfriendly.
To improve mechanical properties and pursue the wider utilities of
chitosan, poly(vinyl alcohol) (PVA) is mixed with chitosan which cause an
increase in the Young’s modulus [68].
Poly (vinyl alcohol) (PVA) is a nontoxic, watersoluble, biocompatible, and
biodegradable synthetic polymer, which is widely used in biochemical and
biomedical applications [69]. PVA is a hydrophilic and good fiber-forming
polymer which adsorbs moisture from the environment [32]. The molecular
structure of PVA is shown in figure 5.2.
Blends of chitosan and poly vinyl alcohol (PVA) with good
miscibility have been reported to provide good mechanical properties and
have biomedical applications [68,70,71].The schematic of intermolecular and
intramolecular hydrogen bonds that occurred after blending PVA with
chitosan is shown in figure 5.3
Figure 5.2 Molecular structure of poly vinyl alcohol (PVA)

Fiber optic sensor for determining relative humidity of the environment
124
5.3 Experimental
The fiber used for the sensor element fabrication is a multimode, step
index, plastic clad silica fiber of core diameter 400 μm with a numerical
aperture of 0.37. In order to have efficient light coupling from the source to
the fiber and the fiber to the detector, fiber ends were prepared properly to
get optically flat end faces, perpendicular to the axis of the fiber. The ends of
the fibers are wet polished with 600-grain sandpaper and alumina powder to
maximize the optical power coupling to the fiber probe. Since evanescent
wave is to be used, 5 cm length of the cladding was removed from the central
portion of the fiber.
Since the optic fiber is immune to the relative humidity, a moisture
sensitive polymer need to be coated onto the fiber as a transducer material to
convert the chemical relative humidity into a physical phenomena which the
fiber can sense. PVA and chitosan are two polymers whose refractive index
is found to be dependant on the amount of water trapped in the polymer
matrix.
The degree of swelling for pure chitosan and pure PVA films are
89% and 674% respectively while that of the chitosan/PVA blended films
Figure 5.3 Molecular structure of chitosan/PVA blend

Fiber optic sensor for determining relative humidity of the environment
125
ranges from 1047% to 2117% [62]. This is because PVA is a water-soluble
polymer and the blending of chitosan with PVA tends to increase the water
intake due to the increasing of hydrophilic groups (-OH) in the blends. Also,
the PVA chains are physically entangled with the chitosan chains leading to
the formation of a hydrogel network [62,71]. Thus the chitosan/PVA blend is
a better transducer for humidity than pure polymers and it is shown that the
blend containing 50% each of chitosan and PVA has the highest degree of
swelling. So in this work we have used a blend polymer film containing
equal concentration of chitosan and PVA.
Chitosan with a degree of deacetylation (DD) of 96% was purchased
from a commercial source. PVA with an average molecular weight of 195 x
103 g mol-1 was also used in this work. Distilled water was used to prepare
all solutions. All chemicals were used without further purification and
freshly prepared solutions were used in all experiments.
A 10 gm L-1 solution of chitosan was prepared by dissolving 5 gm of
chitosan in 500 mL acetic acid (0.1 M) followed by stirring and heating at
40oC for 6 hours. A similar 10 gmL-1 solution of PVA was prepared by
dissolving 5 gm of PVA in 500 mL of preheated ultra pure water. The
solution was then stirred and kept at about 60oC for 2 hours. The aqueous
PVA solution was added drop by drop to the chitosan solution, under
continuous stirring at around 60oC and stirring was allowed to continue for
Figure 5.4 Degree of swelling for chitosan PVA blend, reproduced from [62]

Fiber optic sensor for determining relative humidity of the environment
126
30 min after mixing. Proper amount of amorphous TiO2 powder is then
incorporated into this chitosan/PVA matrix and stirred continuously for 30
minutes to form the polymer composite. Air bubbles were eliminated by
keeping the solutions at room temperature for two hours and figure 5.5
shows the entire process as a flow chart.
Before coating with the sensing material, the fiber needed to be caliberated
and hence the fiber behavior towards exterior refractive index change was
gathered. The fiber was fixed straight and a diode laser output was coupled
to one end while the other end was connected to a power meter. The power
meter was interfaced with a computer to record time varying output.
Different oils and ethylene-glycol-water mixtures were used as mediums to
Figure 5.5 The fabrication of fiber probe

Fiber optic sensor for determining relative humidity of the environment
127
vary the refractive index around the decladded region of the fiber. An Abbe
refractometer was used to measure the refractive index of the prepared
solutions. The output power was recorded by embedding the decladded
region with the prepared liquids. After taking the reading for first liquid the
recording was stopped. The decladded region was cleaned using iso-propanol
and then the reading was continued with second liquid. The outputs were
recorded for all the prepared refractive index samples. The out put was
converted in to dB scale and is shown in figure 5.6. Figure 5.7 depicts the
optical power loss in decibels versus the refractive index of the medium
around the fiber.
Once the characterization of the prepared fiber was done, it was considered
ready for the next step in sensor fabrication viz the deposition of a suitable
polymeric layer. The dip coating method was used to deposit the TiO2
immobilized polymer film onto the bare fiber core. The decladded fibers are
dipped in the prepared polymer solutions and pulled out at a constant speed
using computer controlled set-up. The probes were then dried at room
temperature for two days and were thoroughly washed with NaOH solution
Figure 5.6 Loss in coupled power for various ambient refractive indices

Fiber optic sensor for determining relative humidity of the environment
128
and water. After drying, good homogeneous films firmly adhered to the fiber
were obtained.
Figure 5.8 Experimental setup to determine humidity sensitivity
Figure 5.7 Fiber output as a function of ambient refractive index

Fiber optic sensor for determining relative humidity of the environment
129
This polymer composite coated probe was then fixed in an in-house-
made plexi-glass humidity chamber in such a way that the sensing region
was in the middle of the chamber. The chamber had provisions for passing
the dry and moist air into it. A commercial moisture sensor was used for
calibration and its sensor head was fixed inside the chamber. The schematic
diagram of the experimental setup for humidity measurement is shown in
Figure. 5.8. In order to change the humidity inside the chamber to different
levels, an aerator was used to pump air into the chamber via ethylene glycol
(dry air) or water (humid air). Air bubbled through water will create a humid
environment in the chamber while dehumidification is achieved by passing
air through ethylene glycol. One end of the fiber was coupled to a diode laser
operating at 632.8 nm while the other end was coupled to a low power
silicon photo detector (Newport 818-IR). Outputs of the power meter
(Newport, Model 1815C) were monitored in a real time using a computer
based data acquisition system developed using Lab View. A constant
temperature of 25 °C was maintained throughout the experimental
investigations for all sensing probes.
5.3 Theory
We have used polymers as humidity sensitive transducer for which
refractive index varies upon adsorption of water molecules. The amount of
water molecules adsorbed is proportional to its concentration and hence the
refractive index change is proportional to ambient humidity of the
surrounding volume.
Thus the moisture mass in unit volume of the polymer, Cm is
proportional to ambient humidity H,
HSCm . (5.1)
where S is the moisture solubility of the polymer.
The variation in the refractive index (n) of these swelling polymers with
respect to humidity (H) is given by [72]
cm
f
fSk
n
n
H
n1
6
222
(5.2)
where km is the molar refraction divided by the molecular weight of water, S
is the moisture solubility of the polymer, parameter f (0<f<1) is the fraction
of the absorbed moisture that contributes to an increase in polymer volume.

Fiber optic sensor for determining relative humidity of the environment
130
In the case of f=0, the polymer exhibits no change in its volume as it sorbs
moisture. On the other hand, in the case of f=1, the volume of the polymer
increases by the same amount as that of the sorbed moisture. fc is a critical
value which defines the variation in refractive index. when f<f c , the
refractive index, n increases as H increases, while n decreases as H increases
when f>f c . If np is the refractive index of the polymer without any moisture
and ρm density of water fc is defined by the relation [72]
1
22
2
p
pmmc
n
nkf (5.3)
When light propagates in an optical fiber, a fraction of the radiation extends
a short distance from the guiding region into the medium of lower refractive
index that surrounds it. This is the evanescent field and the evanescent
energy may interact with analytes that attenuate it by means of refractive
index changes, absorption or scattering.
The output power (Pout) of the optical fiber sensor head with respect to the
refractive index (n) of sensing layer is given by [73,74]
22
21
221
nn
nnPP inout
(5.4)
where n1 is the refractive index of the core, n2 is the refractive index of the
cladding, Pin represents the total power injected into the guided modes of the
fiber from the source. It is evident from this equation that power coupled to
the fiber after the sensing region decreases linearly with the increase in n2.
The amplitude E(x) of the evanescent field decreases exponentially with the
distance x from the core–cladding interface according to the equation
pdx
eExE
0 (5.5)
where dp is the penetration depth.
The penetration depth describes the distance from the interface where
the intensity of the evanescent field has decreased to 1/e of the initial
intensity E0.
The magnitude of the penetration depth is given by [73,74]

Fiber optic sensor for determining relative humidity of the environment
131
2
12
1
221 sin2
n
nn
d p
(5.6)
where λ is the vacuum wavelength, θ is the angle of incidence and n1, n2 are
the refractive index values of the core and the cladding, respectively. From
equation 5.6 it is clear that the penetration depth dp increases with the
cladding refractive index, indicating an increase in the magnitude of the
electric field present in the cladding medium and thus a reduction in the
electric field within the core.
The normalized frequency (fiber V-parameter) is given by [73,74]
22
21
2nn
aV
(5.7)
where a is the core radius.
This equation shows that the V-parameter decreases when the cladding
refractive index increases. Since the number of modes N propagating within
the fiber is proportional to the square of the normalized frequency, it can be
inferred that increasing the refractive index of the cladding reduces the
number of modes propagating within the fiber.
5.4 Results and Discussion
Humidity response of PVA was studied by Gaston et al. [32] and he
did his experiments using a side polished fiber coated with PVA. It was
explained that PVA has a refractive index of 1.53 which is higher than that
of the fiber cladding. Upon increase in humidity, the refractive index of PVA
starts to decrease and hence the output decreases first and once the refractive
index drops below that of cladding, the output starts to increase. A similar
type of response (i.e. decrease in refractive index with respect to increase in
humidity) is observed by Venugopal [13] by coating PVA over an LPFG.
Chitosan as a humidity sensitive polymer for fiber optic sensors was studied
by Jinesh et. al [55]. It was observed that upon increase in humidity the
coupled power increases.
We have evaluated the response of Chitosan/PVA composite layer as
a function of change in relative humidity. The polymer coated fiber probe
was placed in the humidity chamber and the humidity level inside the

Fiber optic sensor for determining relative humidity of the environment
132
chamber was brought down to 45% RH by bubbling air through ethylene
glycol. We were not able to bring the relative humidity below 45% due to the
limitation of our setup. A constant temperature of 25 °C was maintained
throughout the experimental investigations for all sensing probes. Afterwards
the humidity was slowly increased to the maximum possible value by
bubbling air through water and the output power was recorded using a PC at
fixed time intervals of 1 sec. The result thus obtained is depicted in figure 5.9
As can be observed from this result, initially fiber output decreases as
the humidity increases within the chamber. On further increase in humidity,
the output starts to raise and reach a saturation level. On the introduction of
dry air, it is evident from the graph that the output power drops along with
humidity. At 45% RH, the optical output reaches the same value as before
Figure 5.9. Response of PVA-chitosan blend as a function of relative humidity

Fiber optic sensor for determining relative humidity of the environment
133
but it can be observed that the reverse response is different from the forward
path. The dip observed during the forward path is abscent in the reverse path.
To check whether the initial drop in output power is due to optical
absorption, we measured the absorption characteristics of the film. The
polymer blend was coated on a glass slide and using an absorption
spectrometer we took the absorption spectrum of the film. The glass slide
was then kept in a humid environment and repeated the absorption
measurement. The result obtained is depicted in figure 5.10 and is obvious
that the trapping of water molecules in the polymer matrix has very little
effect on optical absorption.
It has been shown that the blend contains 50% each of chitosan and
PVA has the highest degree of swelling on adsorption of water molecules
[62]. This volume expansion of the polymer, when exposed to humidity,
induces a strain effect on the fiber. Since the strain sensitivity of a bare fiber
is very small, this cannot be a reason for the drop in intensity.
Figure 5.10 . Absorption spectrum of PVA-chitosan blend film in dry state and upon adsorption of water

Fiber optic sensor for determining relative humidity of the environment
134
The evanescent type fiber optic sensors have been extensively studied
and the transmitted optical power depends on the refractive index of the
material in contact with the decladded region. The general shape of this
variation is similar to the one shown in Figure. 5.7 for the fiber sample used
in the experiments. It is evident that the maximum change in output occurs
when the external refractive index varies between 1.4 and 1.5. Minimum
transmittance occurs when the external refractive index matches the value of
the fiber core, a situation in which the guiding conditions are lost.
Under dry conditions the polymer chains tend to curl up into a
compact, coil form. On the other hand, at high humidity, polymer adsorbs
water molecules and gets hydrated uncurling of the compact, coil form into
straight chains that are aligned with respect to one another. This in turn
contributes towards the change in refractive index. Watanabe et.al [72] did
studies on humidity dependence of the refractive index of
polymethylmethacylate (PMMA) and found that the refractive index of
PMMA increases as humidity increases at room temperature, while it
decreases as humidity increases at temperatures higher than 60 °C. As
mentioned in equation 5.2 and 5.3, if the f parameter of the polymer is less
than f c , the refractive index, n increases with increase in humidity (RH),
while n decreases as RH increases when f>f c. It has been shown by Gaston
et.al[32] and Venugopalan et al [13] that the refractive index of PVA
decreases with the increase in ambient humidity, which means it has the f
parameter greater than fc. A higher value of f indicates a larger volume
increase. Since the degree of swelling of PVA-chitosan blend is much higher
than that of pure PVA [62], it can be deduced that the f parameter of PVA-
chitosan blend is greater than fc and hence its refractive index decreases with
increase in humidity.
Refractive index of chitosan/PVA blended film is around 1.5 [71] in
its dry state and hence the fiber coated with the film acts as a lossy medium.
As humidity increase water molecules diffuse into the polymer matrix and
get adsorbed in the pores. This causes a reduction in refractive index and
hence the output decreases till the refractive index reaches that of the core. It
is evident from figure 5.4 that a further decrease in polymer refractive index
increases the output. Since the response of chitosan/PVA blend is not linear
for humidity variation, it cannot be effectively used for humidity sensor.

Fiber optic sensor for determining relative humidity of the environment
135
Titanium Dioxide itself is a hygrosensitive material and has been
used by many authors in different ways as humidity sensors. We tried to
evaluate the effect of TiO2 on the humidity sensitivity of polymers like PVA
and PVA-Chitosan blend.
The titanium dioxide (TiO2) embedded PVA film was then estimated
for its humidity response in a similar way mentioned earlier. The response
thus obtained for a titanium dioxide concentration of 1g/L in PVA is shown
in figure 5.11.
Unlike in the case of pure chitosan-PVA film, the output starts to
increase with the introduction of humid air. The coupled power increases till
the ambient humidity reach saturation and on the introduction of dry air the
output drops and reaches the initial value.
As we did before, the absorption spectrum of the TiO2 embedded PVA film
was taken in its dry state and after keeping it in humid environment. The
result obtained is shown in figure 5.12. It is evident that absorption is
Figure 5.11. Response of TiO2- PVA composite film as a function of relative humidity

Fiber optic sensor for determining relative humidity of the environment
136
meager for 632 nm (wavelength of the laser used) and hence it can be
concluded that the variation in output is due to change in refractive index.
The humidity response of TiO2 embedded chitosan/PVA film was
then evaluated. Titanium dioxide powder was added to chitosan/PVA mix
containing 50% each of chitosan and PVA to produce film with 1 gm/L TiO2
concentration. Humidity inside the chamber was recorded using a
commercial hygrometer, and the fiber output corresponding to a particular
value of RH% was noted manually. Humid air was pumped into the chamber
for a short interval and humidity was allowed to stabilize to a specific value.
The process is continued till the humidity reached 95% and then dry air was
blown at various steps to reduce humidity. During this process the power
output from the coated fiber probe was recorded continuously and is
reproduced in figure 5.13 while the sensor output as a function of relative
humidity is shown in figure 5.14. It is clear from the graph that the sensor
response is linear and reversible in the range 50% to 95% RH with a
Figure 5.12 Absorption spectrum of TiO2- PVA composite film in dry state and upon adsorption of water

Fiber optic sensor for determining relative humidity of the environment
137
sensitivity of 0.1 μW/%RH. We were not able to record the response below
48% RH due to technical hurdles.
Figure 5.14 Output power of TiO2- PVA-chitosan composite film as a function of relative humidity
Figure 5.13 Output power of TiO2- PVA-chitosan composite film for different ambient humidity

Fiber optic sensor for determining relative humidity of the environment
138
The effect of titanium dioxide on the humidity sensitivity of PVA and
Chitosan/PVA blend is compared. The polymer coated fibers were fixed in
the chamber. After bringing down the humidity of chamber to 45%, humid
air was pumbed. The variation in output was recorded and Figure 5.15 shows
the comparison of humidity response of TiO2 -Chitosan/PVA composite with
that of TiO2-PVA composite for a TiO2 concentration of 1 gm/L. It is evident
that, with equal concentration of TiO2, the PVA-Chitosan blend film shows
better sensitivity than TiO2 embedded pure PVA film. The fiber output as a
function of relative humidity for the two probes is presented in figure 5.16.
Figure 5.15 Response of TiO2- PVA composite film and TiO2- chitosan/PVA composite film as a function of relative humidity

Fiber optic sensor for determining relative humidity of the environment
139
It is obvious that the initial drop in intensity observed in the case of
pure PVA-chitosan blend is absent in the case of TiO2-PVA-chitosan
composite. The addition of TiO2 might have reduced the refractive index of
the polymer composite below that of the fiber cladding. From the
characterization response shown in figure 5.7, it is obvious that if the coating
refractive index is less than that of cladding the output increases linearly with
decrease in coating refractive index.
Shadie Hatamie [63] et al. have carried out studies on Stannic oxide
(SnO2) nanoparticles suspended in polyvinyl alcohol (PVA) matrix and have
shown that the bonds of PVA does not alter after the formation of the
composite film. Thus in the case of titanium dioxide polymer composites too,
it can be assumed that the film formed was merely by embedding the TiO2
particles in the polymer matrix, homogeneously. The TiO2 particles are
attached to the polymer chain by weak Vander Waal’s force of attraction.
Figure 5.16 Fiber output as a function of relative humidity for TiO2- PVA composite film and TiO2- chitosan/PVA composite film

Fiber optic sensor for determining relative humidity of the environment
140
The presence of the titanium dioxide molecules in the polymer matrix thus
increases hydrophilic head groups and hence stimulates the rate of adsorption.
Figure 5.17 shows the output power for TiO2 embedded chitosan/PVA film
for titanium dioxide concentrations of 1 gm/L and 0.1 gm/L. It is obvious
that the polymer with higher titanium dioxide concentration shows a better
sensitivity.
The higher sensitivity of TiO2 embedded chitosan/PVA blend film
can be attributed to the fact that the chitosan addition to PVA increases
hydrophilic head groups available per unit volume of the polymer. It is clear
that the Chitosan/PVA blend film absorbs more water than pure PVA film
and thus increases the sorption capacity of the film. Titanium dioxide too is
hydrophilic and its addition to the polymer also helps in the enhancement of
available hydrophilic head groups per unit volume. This enhancement in
Figure 5.17 Fiber output as a function of relative humidity for TiO2- PVA-chitosan composite film for different concentrations of TiO2

Fiber optic sensor for determining relative humidity of the environment
141
hydrophilic heads helps in adsorbtion of more water molecules which in turn
causes a larger shift in refractive index and hence more output.
Conclusions
The design and fabrication of fiber optic humidity sensors using
polymers like poly vinyl alcohol and chitosan blended poly vinyl alcohol as
hygrosensitive coatings are discussed. The hygroscopic properties of PVA,
chitosan and TiO2 are discussed elaborately and the preparation and
characterization of polymer and fiber probes are explained. Both PVA and
chitosan/PVA blend are sensitive to humidity and their refractive index is
found to decreases with increase in ambient humidity. Blending of PVA in
chitosan helps to improve its mechanical strength and the available
hydrophilic head groups per unit volume. Though found sensitive to
humidity, the humidity response of the chitosan/PVA blend is not linear.
Addition of titanium dioxide to the polymer produces a linear output
variation for change in humidity. The TiO2 particles added to the polymer
does not alter the bonds and are attached to the polymer chain by weak
Vander Waal’s force of attraction. Blending of titanium dioxide increases
hydrophilic heads and increases humidity sensitivity. TiO2 embedded
Chitosan/PVA blend gives better humidity sensitivity than TiO2 embedded
pure PVA. The humidity sensitivity is found to increase with increase in
TiO2 concentration.
References
1. T.L. Yeo , T. Sun and K.T.V. Grattan, “Fiber-optic sensor technologies for humidity and moisture measurement”, Sens. Actuators, A 144, 280–295(2008)
2. Z.M. Rittersma, “Recent achievements in miniaturised humidity sensors-a review of transduction techniques”, Sens. Actuators, A 96, 196-210, (2002)
3. Zhi Chen and Chi Lu, “Humidity Sensors: A Review of Materials and Mechanisms”, Sens. Lett. 3, 274–295 (2005)
4. Noboru Yamazoe and Yasuhiro Shimizu, “Humidity sensors: Principles and applications”, Sens. Actuators 10, 379 – 398 (1986)
5. Celine Laville and Claude Pellet, “Comparison of Three Humidity Sensors for a Pulmonary Function Diagnosis Microsystem”, IEEE Sens. J. 2, 96-101 (2002).
6. M. Matsuguchi, S. Umeda, Y. Sadaoka and Y. Sakai, “Characterization of polymers for a capacitive-type humidity sensor based on water sorption behavior”, Sens. Actuators, B 49, 179–185 (1998)
7. Wenmin Qu , Jorg-Uwe Meyer, “A novel thick-film ceramic humidity sensor”, Sens. Actuators, B 40, I75-I82 (1997)

Fiber optic sensor for determining relative humidity of the environment
142
8. Weon-Pil Taia and Jae-Hee Oh, “Fabrication and humidity sensing properties of nanostructured TiO2-SnO2 thin films”, Sens. Actuators, B 85, 154-157 (2002)
9. Qin Kuang, Changshi Lao, Zhong Lin Wang, Zhaoxiong Xie, and Lansun Zheng, “High-Sensitivity Humidity Sensor Based on a Single SnO2 Nanowire”, J. Am. Chem. Soc. 129, 6070-6071 (2007).
10. Kan-Sen Chou, Tzy-Kuang Lee and Feng-Jiin Liu, “Sensing mechanism of a porous ceramic as humidity sensor”, Sens. Actuators, B 56, 106–111 (1999).
11. F.J. Arregui, I.R. Matıas, K.L. Cooper and R.O. Claus, “Simultaneous measurement of humidity and temperature by combining a reflective intensity-based optical fiber sensor and a fiber Bragg grating”, IEEE Sens. J. 2, 482–487 (2002).
12. T.L. Yeo, D. Eckstein, B. McKinley, L.F. Boswell, T. Sun and K.T.V. Grattan, “Demonstration of a fiber-optic sensing technique for the measurement of moisture absorption in concrete”, Smart Mater. Struct. 15, N40–N45 (2006).
13. T. Venugopalan, Teck L. Yeo, Tong Sun, and Kenneth T. V. Grattan, “LPG-Based PVA Coated Sensor for Relative Humidity Measurement”, IEEE Sens. J. 8, 1093-1098 (2008)
14. A.P. Russell and K.S. Flectcher, “Optical sensor for determination of moisture”, Anal. Chem. Acta., 170, 209-216 (1985).
15. D.S. Ballantine, “Optical waveguide humidity sensor”, Anal. Chem. 58, 2883-2885 (1986).
16. Q. Zhou, M.R. Shahriari, D. Kritz and G.H. Sigel, “Porous fiber-optic sensor for high-sensitivity humidity measurement”, Anal. Chem. 60, 2317-2320 (1988).
17. A. Gaston, I. Lozano, F. Perez, F. Auza, and J. Sevilla, “Evanescent wave optical-fiber sensing (Temperature, Relative Humidity, and pH Sensors)”, IEEE Sens. 3, 806-811 (2003).
18. B.D. Gupta and Ratnanjali, “A novel probe for a fiber optic humidity sensor,” Sens. Actuators B 80, 132-135 (2001).
19. S.K. Khijwania, K.L. Srinivasan and J.P. Singh, “Performance optimized optical fiber sensor for humidity measurement” Opt. Eng. 44, 34401(1-7) (2005).
20. D. Viegas, J. Goicoechea, J.L. Santos, F.M. Araujo, L.A. Ferreira, F.J. Arregui and I.R. Matias, “Sensitivity improvement of a humidity sensor based on Silica Nanosphers on a Long-Period Fiber grating”, Sensors 9, 519-527 (2009).
21. S. Muto, O. Suzuki, T. Amano and M. Morisawa, “A plastic optical fiber sensor for real-time humidity monitoring” Meas. Sci. Technol. 14, 746-750 (2003).
22. R. Aneesh and Sunil K. Khijwania, “Titanium dioxide nanoparticle based optical fiber humidity sensor with linear response and enhanced sensitivity”, Appl. Opt. 51, 2164-2171 (2012)
23. S. Tao, C.B. Winstead, R. Jindal and J.P. Singh, “Optical-fiber sensor using tailored porous sol–gel fiber core”, IEEE Sens. J. 4, 322–328 (2004).
24. T.E. Brook, M.N. Taib and R. Narayanaswamy, “Extending the range of a fibre-optic relative humidity sensor”, Sens. Actuators B, 38–39, 272– 276 (1997).
25. H.E. Posch and O.S. Wolfbeis, “Fiber-optic humidity sensor based on fluorescence quenching”, Sens. Actuators 15, 77–83 (1988).
26. M. Bedoya, M.T. Diez, M.C. Moreno-Bondi and G. Orellana, “Humidity sensing with a luminescent Ru(II) complex and phase-sensitive detection”, Sens. Actuators B 113, 573–581 (2006).
27. A. Kharaz and B. Jones, “A distributed fibre optic sensing system for humidity measurement”, Meas. Contr. 28, 101–103 (1995).

Fiber optic sensor for determining relative humidity of the environment
143
28. R. Jindal, S. Tao, J.P. Singh and P.S. Gaikwad, “High dynamic range fiber optic relative humidity”, Opt. Eng. 41, 1093–11093 (2002).
29. F.J. Arregui, Z. Ciaurriz, M. Oneca and I.R. Matias, “An experimental study about hydrogels for the fabrication of optical fiber humidity sensors”, Sens. Actuators B 96, 165-172 (2003).
30. C. Bariain, I.R. Matias, F.J. Arregui and M. Lopez-Amo, “Optical fiber humidity sensor based on a tapered fiber coated with agarose gel”, Sens. Actuators B 69, 127–131 (2000).
31. J.M. Corres, J. Bravo and I.R. Matias, “Nonadiabatic tapered single-mode fiber coated with humidity sensitive nanofilms”, IEEE Photonics Technol. Lett. 18, 935–937 (2006).
32. A. Gaston, F. Perez and J. Sevilla, “Optical fiber relative humidity sensor with polyvinyl alcohol film”, Appl. Opt. 43, 4127–4132 (2004).
33. A. Alvarez-Herrero, H. Guerrero and D. Levy, “High-sensitivity sensor of a low relative humidity based on overlay on side-polished fibers”, IEEE Sens. J. 4, 52–56 (2004).
34. K. Ogawa, S. Tsuchiya and H. Kawakami, “Humidity sensing effects of optical fibers with microporous SiO2 cladding”, Electron. Lett. 24, 42–43 (1988)
35. L. Xu, J.C. Fanguy, K. Soni and S. Tao, “Optical fiber humidity sensor based on evaenscent wave scattering”, Opt. Lett. 29, 1191–1193 (2004).
36. P. Kronenberg, P.K. Rastogi, P. Giaccari and H.G. Limberger, “Relative humidity sensor with optical fiber Bragg grating”, Opt. Lett. 27, 1385–1387 (2002).
37. K.M. Tan, C.M. Tay, S.C. Tjin, C.C. Chan and H. Rahardjo, “High relative humidity measurements using gelatin coated long-period grating sensors”, Sens. Actuators B 110, 335–341 (2005).
38. M. Konstantaki, S. Pissadaki, S. Pispas, N. Madamopoulous and N.A. Vainos, “Optical fiber long period grating humidity sensor with PEO/CoCl2 coating”, Appl. Opt. 45, 4567–4571 (2006).
39. F. Mitschke, ”Fiber optic sensor for humidity”, Opt. Lett. 14, 967–969 (1989). 40. F.J. Arregui, Y. Liu, I.R. Matias and R.O. Claus, “Optical fiber humidity sensor
using a nano Fabry–Perot cavity formed by the ionic self-assembly method”, Sens. Actuators B 59, 54–59 (1999).
41. S. Otsuki and K. Adachi, “Humidity dependence of visible absorption spectrum of gelatin films containing cobalt chloride”, J. Appl. Polym. Sci. 45, 1557–1564 (1993).
42. F. Boltinghouse and K. Abel, “Development of an optical relative humidty sensor. Cobalt chloride optical absorbency sensor study”, Anal. Chem. 61, 1863–1866 (1989).
43. M. Ando, T. Kobayashi and M. Harutu, “Humidity-sensitive optical absorption of Co3O4 film”, Sens. Actuators B 32, 157–160 (1996).
44. S. Otsuki, K. Adachi and T. Taguchi, “A novel fiber-optic gas sensing arrangement based on an air gap design and an application to optical detection of humidity”, Anal. Sci. 14, 633–635 (1998).
45. Pi-Guey Su, Lin-Nan Huang, “Humidity sensors based on TiO2 nanoparticles/ polypyrrole composite thin films”, Sens. Actuators B 123, 501–507 (2007).
46. T.M. Racheva and G.W. Critchlow, “SnO2 thin films prepared by the sol-gel process”, Thin Solid Films 292, 299-302 (1997).
47. Jesus M. Corres, Ignacio R. Matias, Miguel Hernaez, Javier Bravo,Francisco J. Arregui, “Optical Fiber Humidity Sensors Using Nanostructured Coatings of SiO2 Nanoparticles”, IEEE Sens. J. 8, 281-285 (2008)

Fiber optic sensor for determining relative humidity of the environment
144
48. D.V. Andreev, L.L. Makarshin and V.N. Parmon, “Sorption and Sensing Characteristics of Polyvinyl Alcohol Films Impregnated with CaCl2”, React.Kinet.Catal.Lett. 80, 181-188 (2003).
49. S. Luo, Y. Liu, A. Sucheta, M. Evans and R. van Tassell, “Applications of LPG fiber optical sensors for relative humidity and chemical warfare agents monitoring”, Proc. SPIE 4920, 193-204 (2002)
50. T. Venugopalan, T. Sun, K.T.V. Grattan, “Long period grating-based humidity sensor for potential structural health monitoring”, Sens. Actuators, B 148, 57–62(2008)
51. LiweiWang, Yang Liu, Min Zhang, Dongsheng Tu, Xianhui Mao and Yanbiao Liao, “A relative humidity sensor using a hydrogel-coated long period grating”, Meas. Sci. Technol. 18, 3131–3134 (2007).
52. Razat Nohria, Rajneek K. Khillan, Yi Su, Rohit Dikshit, Yuri Lvov and Kody Varahramyan, “Humidity sensor based on ultrathin polyaniline film deposited using layer-by-layer nano-assembly”, Sens. Actuators, B 114, 218–222 (2006).
53. Anu Vijayan, Madhavi Fuke, Ranjit Hawaldar, Milind Kulkarni, D. Amalnerkar, R.C. Aiyer, “Optical fiber based humidity sensor using Co-polyaniline clad”, Sens. Actuators, B 129, 106–112 (2008)
54. Christopher A. Murray and John R. Dutcher, “Effect of Changes in Relative Humidity and Temperature on Ultrathin Chitosan Films”, Biomacromolecules 7, 3460-3465 (2006)
55. Jinesh Mathew, K. J. Thomas, V. P. N. Nampoori and P. Radhakrishnan, “A Comparative Study of Fiber Optic Humidity Sensors Based on Chitosan and Agarose”, Sensors & Transducers Journal 84, 1633-1640 (2007)
56. Jinesh Mathew, YuliyaSemenova, GinuRajan, PengfeiWang, GeraldFarrell, “Improving the sensitivity of a humidity sensor based on fiber bend coated with a hygroscopic coating”, Opt. Laser Technol. 43, 1301–1305 (2011).
57. X.F. Huang, D.R. Sheng, K.F. Cen and H. Zhou, “Low-cost relative humidity sensor based on thermoplastic polyimide-coated fiber Bragg grating”, Sens. Actuators, B 127, 518–524 (2007).
58. Madhavi V. Fuke, Anu Vijayan, Prajakta Kanitkar and R. C. Aiyer, “Optical Humidity Sensing Characteristics of Ag-Polyaniline Nanocomposite”, IEEE Sens. J. 9, 648-653 (2009).
59. Y. Sakai, Y. Sadaoka, M. Matsuguchi, “Humidity sensors based on polymer thin films”, Sens. Actuators, B 35-36, 85-90 (1996).
60. Pradip Kumar Dutta, Joydeep Dutta and V S Tripathi, “Chitin and chitosan: Chemistry, properties and applications”, J. Sci. Ind. Res. 63, 20-31 (2004).
61. Marguerite Rinaudo, “Chitin and chitosan: Properties and applications”, Prog. Polym. Sci. 31, 603–632 (2006).
62. Esam A. El-Hefian, Mohamed Mahmoud Nasef and Abdul Hamid Yahaya, “The Preparation and Characterization of Chitosan / Poly (Vinyl Alcohol) Blended Films”, E-J. Chem. 7, 1212- 1219 (2010).
63. Shadie Hatamie , Vivek Dhas , B.B. Kale , I.S. Mulla and S.N. Kale, “Polymer-embedded stannic oxide nanoparticles as humidity sensors Mater. Sci. Eng., C 29, 847–850 (2009).
64. Pi-Guey Su , Yi-Lu Sun, Chu-Chieh Lin, “Humidity sensor based on PMMA simultaneously doped with two different salts”, Sens. Actuators, B 113, 883–886 (2006)
65. Majeti N.V. Ravi Kumar, “A review of chitin and chitosan applications”, React. Funct. Polym. 46, 1–27 (2000)

Fiber optic sensor for determining relative humidity of the environment
145
66. C.K.S. Pillai,Willi Paul and Chandra P. Sharma,” Chitin and chitosan polymers: Chemistry, solubility and fiber formation”, Prog. Polym. Sci. 34, 641–678 (2009).
67. M. Dash, F. Chiellini, R.M. Ottenbrite, E. Chiellini, “Chitosan—A versatile semi-synthetic polymer in biomedical applications”, Prog. Polym. Sci. 36, 981–1014 (2011).
68. Yumiko Nakano, Yuezhen Bin, Mami Bando, Teruo Nakashima, Tsumuko Okuno, Hiromichi Kurosu and Masaru Matsuo, “Structure and Mechanical Properties of Chitosan/Poly(Vinyl Alcohol) Blend Films”, Macromol. Symp. 258, 63–81 (2007).
69. Hua Zheng, Yumin Du, Jiahui Yu, Ronghua Huang and Lina Zhang, “Preparation and Characterization of Chitosan/Poly(vinyl alcohol) Blend Fibers”, J. Appl. Polym. Sci. 80, 2558–2565 (2001)
70. Ezequiel S. Costa-Junior, Edel F. Barbosa-Stancioli, Alexandra A.P. Mansur, Wander L. Vasconcelos and Herman S. Mansur, “Preparation and characterization of chitosan/poly(vinyl alcohol) chemically crosslinked blends for biomedical applications”, Carbohydr. Polym.76, 472–481(2009).
71. H.M.P. Naveen Kumar, M.N. Prabhakar, C. Venkata Prasad, K. Madhusudhan Rao, T.V. Ashok Kumar Reddy, K. Chowdoji Rao, M.C.S. Subha, “Compatibility studies of chitosan/PVA blend in 2% aqueous acetic acid solution at 30 ◦C”, Carbohydr. Polym. 82 ,251–255 (2010)
72. Toshio Watanabe, Naoki Ooba, Yasuhiro Hida, and Makoto Hikita, “Influence of humidity on refractive index of polymers for optical waveguide and its temperature dependence”, Appl. Phys. Lett. 72, 1533-1535 (1998).
73. Bishnu P. Pal, Fundamentals of Fiber Optics in Telecommunication and Sensor Systems (New Age Publishers, New Delhi, 1992)
74. M Sheeba, M Rajesh, C P G Vallabhan, V P N Nampoori and P Radhakrishnan, “Fiber optic sensor for the detection of adulterant traces in coconut oil”, Meas. Sci. Technol. 16, 2247–2250 (2005)

Chapter VI
Conclusions and Future Prospects
Fiber optic sensor is a vital topic and for the past four decades,
rigorous research in this area has been undertaken around the globe. A wide
variety of fiber optic sensors were reported and many of them have been
commercialized. Though fiber optic sensors have inherent advantages over
other sensing technologies, in terms of commercialization they face
competition in terms of cost. So it is worthwhile to develop less expensive
fiber optic sensors and in this thesis the design and development of some
fiber optic sensors for quality evaluation is discussed.
The design and fabrication of a fiber optic sensor probe for detection
of critical mole fraction and purity of alcohol is discussed first. The intensity
modulated extrinsic optical fiber sensor probe is fabricated by chemically
etching a plastic clad silica fiber using hydro fluoric acid. The probe couples
light through the tapered region and the theory of working was verified using
simulation results. The added use of the probe as a water level detector is
also explained. The probe was used for the measurement of critical
concentration of binary mixtures of alcohol and water. The critical mole
fractions obtained using the robust and inexpensive probe for methanol,
ethanol, 2-propanol and tert-butanol agrees well with the values obtained
using methods like neutron diffraction studies and microwave analysis.
Unlike lower alcohols like methanol, ethanol and propanol, micellization
occurs in tert-butanol water mixtures and the results obtained using this
probe also give an evidence for the phenomenon. The probe can be
effectively used for concentration detection of alcohol water mixtures, which
has applications in food and beverage industries.
We demonstrate the fabrication and characterization of long period
fiber gratings. The fabrication process of LPFGs in SMF 28 using fusion
splicer and carbon dioxide (CO2) laser is explained. The fabrication methods
discussed using arc and CO2 laser are found to be much more flexible and
cost effective than the UV laser exposure technique. The possible
mechanisms of refractive index modulations in the fabricated asymmetric
LPFGs are due to residual stress relaxation and physical deformation. The

Conclusions and Future Prospects
147
temperature sensitivities of the three types of LPFGs namely, arc induced,
CO2 laser induced and UV induced, are determined and compared in the
temperature range 250C to 800C. The periodically tapered LPFG fabricated
using electric arc from fusion splicer is found to be insensitive to temperature
in the range of experimental studies. For many telecommunication
applications spectral stability is of prime importance, and an LPFG with
temperature insensitive attenuation band is an attractive feature. The
fabricated LPFG is also attractive for fabricating temperature-insensitive
sensors.
The effective application of LPFG’s in determining the quality of
ethanol blended petrol is presented. The response of the fabricated LPFG’s
namely UV, electric arc and CO2 induced long period fiber gratings towards
ambient refractive indices are studied. Though the UV induced LPFG shows
better refractive index sensitivity near the cladding refractive index, the arc
induced LPFG has a better sensitivity in the 1 to 1.4 refractive index region.
Besides being insensitive to temperature, the periodically tapered arc induced
LPFG shows better sensitivity among the three LPFG’s in determining the
purity of ethanol blended petrol. The periodically tapered arc induced LPFG
can be successfully utilized as a temperature insensitive transducer for
quality evaluation of ethanol blended petrol.
We have also demonstrated the design of polymer coatings which can
be effectively used in fiber optic sensors. Humidity sensors are designed
using polymers like poly vinyl alcohol and chitosan blended poly vinyl
alcohol as hygrosensitive coatings. Both PVA and chitosan/PVA blend are
sensitive to humidity and their refractive index is found to decrease with
increase in ambient humidity. Blending of chitosan in PVA helps to improve
its mechanical strength and the available hydrophilic head groups per unit
volume. Though found sensitive to humidity, the humidity response of the
chitosan/PVA blend is not linear. A better and linear response towards
humidity is obtained by blending titanium dioxide with the polymer.
Blending of titanium dioxide powder in the polymer matrix is found to give
better sensitivity towards humidity than bare polymer due to the increase in
available hydrophilic heads. The humidity sensitivity is found to increase
when titanium dioxide is blended in chitosan/PVA matrix compared to pure
PVA. The humidity sensitivity is found to increase with increase in titanium
dioxide concentration.

Conclusions and Future Prospects
148
Future prospects
The works detailed in this thesis can form the basis for the
development of a variety of sensors and improvements can also be done on
the technologies explained. A list of few possible future works is given
below
The thermal insensitivity of arc induced long period fiber
grating (LPFG) can be studied in detail over a large
temperature range.
The TiO2 embedded chitosan/PVA film can be further
analyzed for its effectiveness as coating material for fiber
optic alcometer
The variation in humidity sensitivity can be studied by
embedding nano TiO2 instead of bulk TiO2 material.
LPFG coated with TiO2 embedded chitosan/PVA film can be
studied for its humidity sensitivity.