DESIGN AND CONTROL OF A POWERED TRANSFEMORAL ...
108
DESIGN AND CONTROL OF A POWERED TRANSFEMORAL PROSTHESIS By Frank Charles Sup IV Thesis Submitted to the Faculty of the Graduate School of Vanderbilt University in partial fulfillment of the requirements for the degree of MASTER OF SCIENCE in Mechanical Engineering December, 2006 Nashville, Tennessee Approved: Michael Goldfarb Eric J. Barth Nilanjan Sarkar
-
Upload
trinhxuyen -
Category
Documents
-
view
222 -
download
1
Transcript of DESIGN AND CONTROL OF A POWERED TRANSFEMORAL ...

DESIGN AND CONTROL OF A
POWERED TRANSFEMORAL PROSTHESIS
By
Frank Charles Sup IV
Thesis
Submitted to the Faculty of the
Graduate School of Vanderbilt University in
partial fulfillment of the requirements
for the degree of
MASTER OF SCIENCE
in
Mechanical Engineering
December, 2006
Nashville, Tennessee
Approved:
Michael Goldfarb
Eric J. Barth
Nilanjan Sarkar

ii
To my wife

iii
ACKNOWLEDGMENTS
I would first like to thank my advisor Dr. Michael Goldfarb for his guidance and support throughout the
duration of my masters. He has inspired me to think creatively and independently and has given me an
invaluable toolset in tackling complex open-ended problems. I would also like to express my appreciation
and gratitude to the members of my thesis committee Dr. Eric Barth and Dr. Nilanjan Sarkar for their time
and support.
Furthermore, I would like to acknowledge my wife, Lara, for her continuous encouragement and
support of my academic endeavors. Her confidence and faith in me has allowed me to push my abilities
past what I thought was possible. In addition, the encouragement I have received from my entire family
has been amazing and I have an enormous appreciation for them.
Lastly, I would like to pay tribute to all the members of the Center for Intelligent Mechatronics for their
help and guidance. Post-Docs Kevin Fite and Tom Withrow have been invaluable for their advice and
assistance throughout my masters work. In particular, I would like to acknowledge Amit Bohara for his
contributions to my work, continual drive to perfection and outstanding advice and critique.

iv
TABLE OF CONTENTS
Page
ACKNOWLEDGMENTS...................................................................................................................iii
LIST OF FIGURES.......................................................................................................................... vi
LIST OF TABLES ............................................................................................................................ x
Chapter
I. INTRODUCTION ........................................................................................................................1
1. Introduction ............................................................................................................1
2. Literature Survey....................................................................................................3
3. Motivation and Contribution ...................................................................................6
4. Organization of the Document ...............................................................................7
5. References ............................................................................................................8
II. MANUSCRIPT I: DESIGN OF A PNEUMATICALLY ACTUATED TRANSFEMORAL PROSTHESIS
.......................................................................................................................... 11
1. Abstract ..........................................................................................................12
2. Introduction ..........................................................................................................12
3. Kinematic Configuration.......................................................................................15
4. Prosthesis Design ................................................................................................19
5. Load Cell Design..................................................................................................26
6. Able-Body Testing Adaptor...................................................................................35
7. Conclusion ..........................................................................................................36
8. References ..........................................................................................................37
III. ADDENDUM TO MANUSCRIPT I ..........................................................................................40
1. Prosthesis Design ................................................................................................40
2. Socket Load Cell ..................................................................................................40
IV. MANUSCRIPT II: DESIGN AND CONTROL OF A POWERED TRANSFEMORAL PROSTHESIS
..........................................................................................................................43
1. Abstract ..........................................................................................................44
2. Introduction ..........................................................................................................44
2.1 Motivation.................................................................................. 44
2.2 Background............................................................................... 45
3. Prosthesis Design ................................................................................................46
3.1 Design Specifications................................................................ 47

v
4. Load Cell Design..................................................................................................51
5. Gait Control Strategy............................................................................................53
5.1 Impedance Characterization of Gait ......................................... 55
5.2 Gait Modes................................................................................ 56
6. Experimental Results ...........................................................................................59
7. Conclusion ..........................................................................................................63
8. References ..........................................................................................................64
V. ADDENDUM TO MANUSCRIPT II ..........................................................................................67
1. Experimental Testing Setup .................................................................................67
2. Electronics boards................................................................................................68
2.1 On-board Analog Circuit Board................................................. 68
2.2 Off-board Analog Circuit Board................................................. 69
3. Control and Tuning...............................................................................................69
4. Design Review .....................................................................................................72
5. References ..........................................................................................................74
Appendix
A. PARTS LISTS..........................................................................................................................75
B. OPTIMIZATION CODES .........................................................................................................78
1. Kinematic Configuration.......................................................................................78
1.1 Ankle Kinematic Configuration Optimization ............................ 78
1.2 Knee Kinematic Configuration Optimization ............................. 81
2. Socket Load Cell Volume Minimization................................................................85
C. SCHEMATICS OF ANALOG CIRCUITS .................................................................................88
1. On-board Analog Circuit.......................................................................................88
2. Off board Analog Circuit .......................................................................................90
D. MATLAB SIMULINK BLOCKS.................................................................................................94
1. Torque Control......................................................................................................94
2. Variable Values.....................................................................................................97

vi
LIST OF FIGURES
Page
Figure 1-1. Standard lower limb prostheses including mechanical damping knee with locking and solid
ankle cushioned heel (SACH) foot...................................................................................... 1
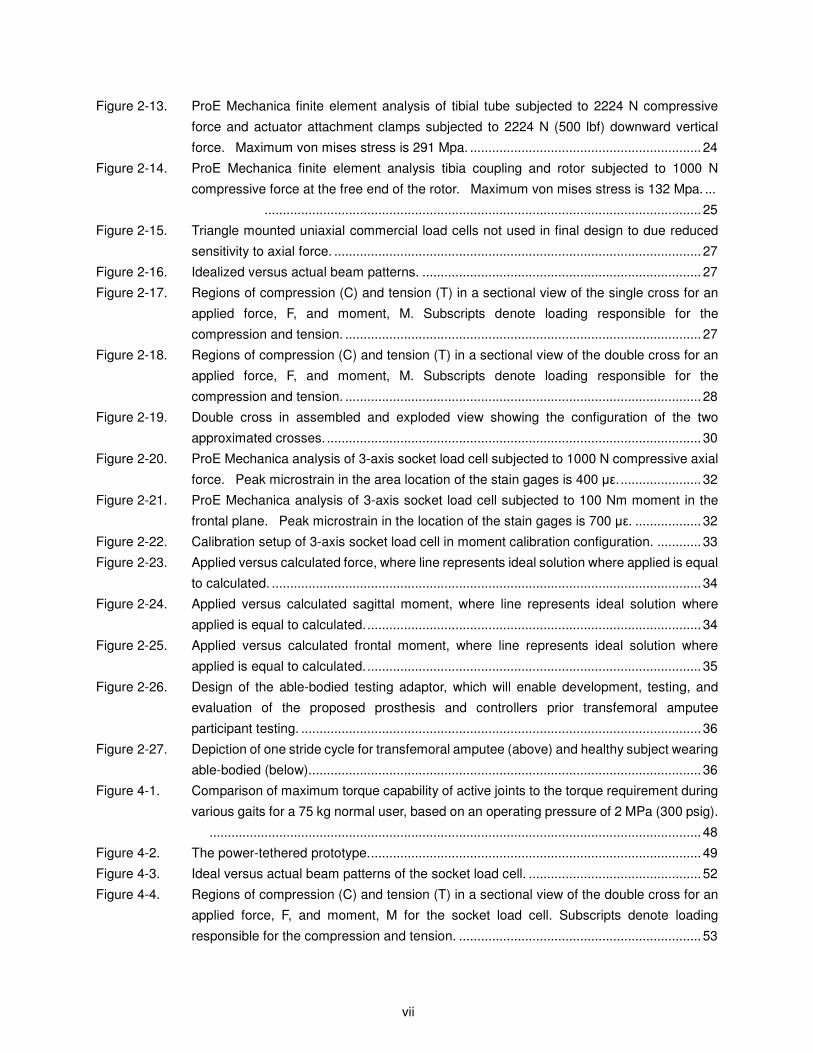
Figure 1-2. The Ossur Rheo knee (left) and the Otto Bock C-Leg (right) represent the cutting edge of
microprocesser controlled damping prosthetic knees......................................................... 2
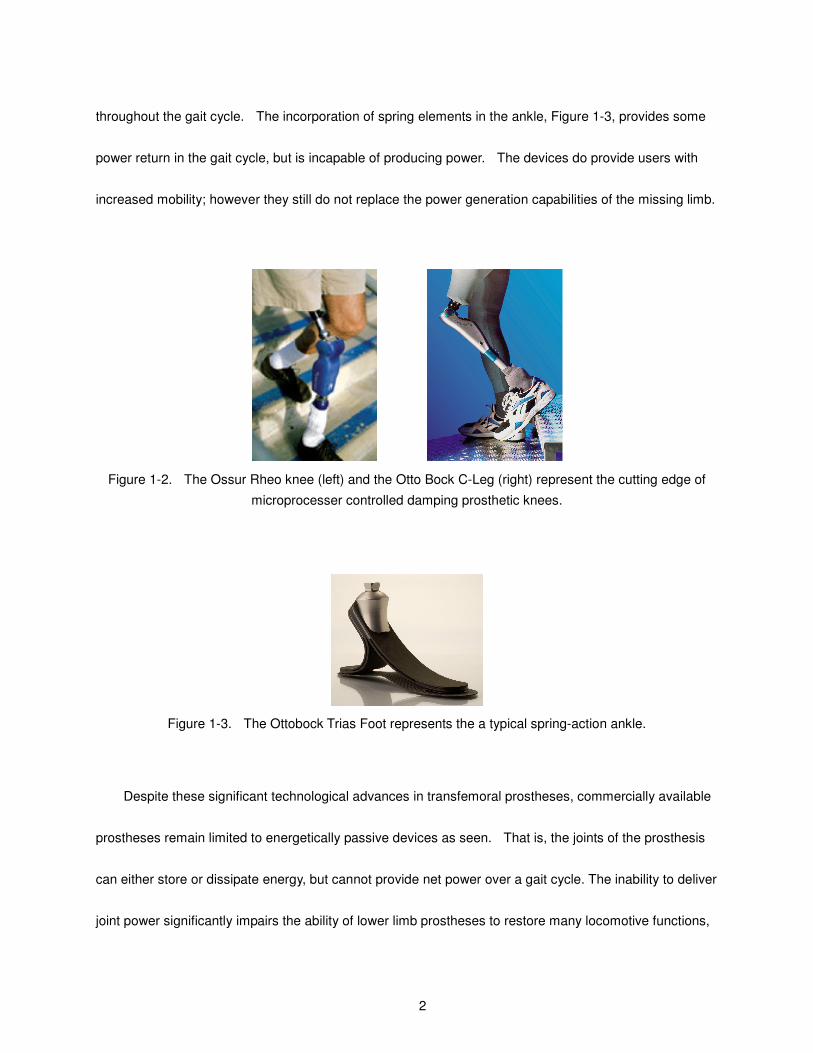
Figure 1-3. The Ottobock Trias Foot represents the a typical spring-action ankle................................ 2
Figure 1-5. Flowers et al. (circa 1970’s) developed a hydraulically actuated knee prosthesis that
pioneered the use of active joints. ...................................................................................... 4
Figure 1-6. Electromagnetically actuated powered knee developed by Popovic with the use of a
battery pack......................................................................................................................... 5
Figure 1-7. Ossur “Proprio” foot used for actively positions the foot for increased functionality. .......... 5
Figure 1-8. Victhom/Ossur “Power Knee” uses electromagnetic actuation and limited battery life. ..... 6
Figure 2-1. Joint power during one cycle for 75 kg normal subjects. Red represents power generated,
blue is power dissipated. Winter (1988), Winter and Sienko (1988), Nadeau et al. (2003)..
...................................................................................................................................... 13
Figure 2-2. Slider-crank configuration with parameters L1, L2, x, and θ. ............................................. 15
Figure 2-3. Knee joint angle versus torque during one power cycle for typical 75 kg normal subject and
theoretical active knee joint prosthetic operating at 2 MPa (300 psig). ............................ 18
Figure 2-4. Ankle joint angle versus torque during one power cycle for typical 75 kg normal subject
Winter and theoretical active ankle joint prosthetic operating at 2 MPa (300 psig). ......... 19
Figure 2-5. Rotary 4-way servovalve for use in prosthesis. ................................................................ 20
Figure 2-6. Major components of power-tethered prototype. .............................................................. 21
Figure 2-7. Actual tethered transfemoral prosthesis prototype. .......................................................... 21
Figure 2-8. Section view of ankle joint, showing integrated potentiometer (i.e., joint angle sensor). . 22
Figure 2-9. Range of motion of active knee and ankle prosthesis simulator. LEFT: Knee and ankle
joints at zero angular displacement; MIDDLE: Knee fully flexed (110°) and ankle fully
plantarflexed (45°); RIGHT: Knee fully extended (0°) and ankle fully dorsiflexed (20°).... 22
Figure 2-10. Sagittal and frontal geometry of the active knee and ankle prosthesis relative to an
anthropomorphic norm...................................................................................................... 23
Figure 2-11. ProE Mechanica finite element analysis of ankle joint housing actuator attachment point
subjected to 2224 N (500 lbf) vertical force. Maximum von mises stress is 297 Mpa. ... 23
Figure 2-12. ProE Mechanica finite element analysis of knee joint housing actuator attachment point
subjected to 2224 N (500 lbf) downward vertical force and 1000 N downward vertical force
on load cell attachment point. Maximum von mises stress is 155 Mpa. ......................... 24
vii
Figure 2-13. ProE Mechanica finite element analysis of tibial tube subjected to 2224 N compressive
force and actuator attachment clamps subjected to 2224 N (500 lbf) downward vertical
force. Maximum von mises stress is 291 Mpa. ............................................................... 24
Figure 2-14. ProE Mechanica finite element analysis tibia coupling and rotor subjected to 1000 N
compressive force at the free end of the rotor. Maximum von mises stress is 132 Mpa. ...
....................................................................................................................... 25
Figure 2-15. Triangle mounted uniaxial commercial load cells not used in final design to due reduced
sensitivity to axial force. .................................................................................................... 27
Figure 2-16. Idealized versus actual beam patterns. ............................................................................ 27
Figure 2-17. Regions of compression (C) and tension (T) in a sectional view of the single cross for an
applied force, F, and moment, M. Subscripts denote loading responsible for the
compression and tension. ................................................................................................. 27
Figure 2-18. Regions of compression (C) and tension (T) in a sectional view of the double cross for an
applied force, F, and moment, M. Subscripts denote loading responsible for the
compression and tension. ................................................................................................. 28
Figure 2-19. Double cross in assembled and exploded view showing the configuration of the two
approximated crosses. ...................................................................................................... 30
Figure 2-20. ProE Mechanica analysis of 3-axis socket load cell subjected to 1000 N compressive axial
force. Peak microstrain in the area location of the stain gages is 400 µε. ...................... 32
Figure 2-21. ProE Mechanica analysis of 3-axis socket load cell subjected to 100 Nm moment in the
frontal plane. Peak microstrain in the location of the stain gages is 700 µε. .................. 32
Figure 2-22. Calibration setup of 3-axis socket load cell in moment calibration configuration. ............ 33
Figure 2-23. Applied versus calculated force, where line represents ideal solution where applied is equal
to calculated. ..................................................................................................................... 34
Figure 2-24. Applied versus calculated sagittal moment, where line represents ideal solution where
applied is equal to calculated............................................................................................ 34
Figure 2-25. Applied versus calculated frontal moment, where line represents ideal solution where
applied is equal to calculated............................................................................................ 35
Figure 2-26. Design of the able-bodied testing adaptor, which will enable development, testing, and
evaluation of the proposed prosthesis and controllers prior transfemoral amputee
participant testing. ............................................................................................................. 36
Figure 2-27. Depiction of one stride cycle for transfemoral amputee (above) and healthy subject wearing
able-bodied (below)........................................................................................................... 36
Figure 4-1. Comparison of maximum torque capability of active joints to the torque requirement during
various gaits for a 75 kg normal user, based on an operating pressure of 2 MPa (300 psig).
...................................................................................................................................... 48
Figure 4-2. The power-tethered prototype........................................................................................... 49
Figure 4-3. Ideal versus actual beam patterns of the socket load cell. ............................................... 52
Figure 4-4. Regions of compression (C) and tension (T) in a sectional view of the double cross for an
applied force, F, and moment, M for the socket load cell. Subscripts denote loading
responsible for the compression and tension. .................................................................. 53

viii
Figure 4-5. Assembled and exploded views of the socket load cell.................................................... 53
Figure 4-6. Joint angle and torque convention used. Positive torque defined in the direction of
increasing angle. ............................................................................................................... 56
Figure 4-7. Subdivision of normal gait into four functional modes. ..................................................... 57
Figure 4-8. A finite state model of normal gait. Each box represents a state and the transition condition
between states are specified. ........................................................................................... 57
Figure 4-9. Piecewise fitting of knee and ankle torques during normal speed level walk (averaged
population data from Winter, 1991 scaled for a 75 kg adult) to a nonlinear spring-damper
impedance model. The number shown in each mode represents the mean ratio of the
stiffness forces to damping forces predicted by the fit. The vertical lines represent the
segmentation of a gait stride into four distinct modes....................................................... 59
Figure 4-10. Able-bodied testing adaptor for enabling development, testing, and evaluation of the
prosthesis and controllers prior transfemoral amputee participation. ............................... 60
Figure 4-11. Measured joint angles (degrees) for six consecutive gait cycles for a treadmill walk
(1.5mph). ....................................................................................................................... 62
Figure 4-12. Measured joint torques ( N.m ) for six consecutive gait cycles for a treadmill walk. ........ 62
Figure 4-13. Averaged measured joint powers (W) for six consecutive gait cycles for a treadmill walk...
....................................................................................................................... 63
Figure 5-1. Picture of fixed mount setup. ............................................................................................ 67
Figure 5-2. Picture of treadmill testing setup....................................................................................... 68
Figure 5-3. Knee actuator torque tracking to 1.0 Hz sine wave with a 30 Nm amplitude. The dotted
line represents the desired and the solid line is the actual. .............................................. 71
Figure 5-4. Ankle actuator torque tracking to 1.0 Hz sine wave with a 30 Nm amplitude. The dotted line
represents the desired and the solid line is the actual. ..................................................... 71
Figure 5-5. Knee stiffness during walking experiments desired knee stiffness of 2 Nm/deg and actual is
2.2 Nm/deg........................................................................................................................ 71
Figure 5-6. Ankle stiffness in walking experiments desired ankle stiffness of 4.5 Nm/deg and actual is
4.3 Nm/deg........................................................................................................................ 72
Figure C-1. Schematic of circuit used for onboard sensor power and amplifying. .............................. 88
Figure C-2. Board Layout (a), top trace (b) and bottom trace (c) of the circuit used for onboard signal
routing and amplification overall dimensions 0.78” x 5.20”. Printed via ExpressPCB
software and service. ........................................................................................................ 89
Figure C-3. Schematic of circuit used for off board servo amplifier encoder signal routing. ............... 90
Figure C-4. Schematic of circuit used for off board load cell sensor signal filtering and routing. ........ 91
Figure C-5. Schematic of circuit used for off board position sensor signal routing and differentiation.92
Figure C-6. Board Layout of circuit used for offboard signal processing and for computer input for
National Instruments Card PCI-6031E for analog signal routing and Measurement
Computing PCI-QUAD04 for encoder signal routing. ....................................................... 93
Figure D-1. Knee Torque to Force Conversion subblock for torque control diagram for Matlab Simulink.
...................................................................................................................................... 94

ix
Figure D-2. Ankle Torque to Force Conversion subblock for torque control diagram for Matlab Simulink.
...................................................................................................................................... 94
Figure D-3. Ramp up/down subblock for torque control diagram for Matlab Simulink. ....................... 94
Figure D-4. PID Force Control subblock for torque control diagram for Matlab Simulink.................... 95
Figure D-5. Torque control diagram for Matlab Simulink. .................................................................... 96

x
LIST OF TABLES
Page
Table 2-1. Parameters used for optimization of actuator size and configuration............................... 17
Table 2-2. Actuator parameters considered in optimization............................................................... 18
Table 2-3. Results of parameter optimization of actuator size and configuration. ............................. 18
Table 2-4. Results of parameter optimization of 3-axis load cell dimensions. ................................... 32
Table 4-1. Impedance parameters for prototypical gait (gait data from Winter, 1991)....................... 59
Table 4-2. Impedance parameters derived by experimental tuning................................................... 61
Table 5-1. PID control gains for force control loop............................................................................. 70
Table 5-2. Design Improvement Summary ........................................................................................ 72
Table A-1. Prosthesis Prototype Components ................................................................................... 75
Table A-2. Socket Load Cell Components ......................................................................................... 76
Table A-3. Able-Bodied Adaptor Components.................................................................................... 77

1
CHAPTER I
INTRODUCTION
1. Introduction
The evolution of the lower limb prosthesis over the recent decades has progressed from purely
mechanical systems to systems that include microprocessor control. When evaluating the basic function
of standard mechanical knee prosthesis, Figure 1-1, their function is to provide constant mechanical
damping in order to extract energy from the system and limit the flextion of the knee joint in the back swing
to prevent a collision of the knee joint at full extension. These devices allow for restricted mobility of
amputees and provide an abnormal gait pattern.
Figure 1-1. Standard lower limb prostheses including mechanical damping knee with locking and solid ankle
cushioned heel (SACH) foot.
The current generation of lower limb prosthesis, Figure 1-2, incorporate microprocessors to control either
electromagnetic breaks or magnetic rheological fluid for the modulation of the damping in the knee
2
throughout the gait cycle. The incorporation of spring elements in the ankle, Figure 1-3, provides some
power return in the gait cycle, but is incapable of producing power. The devices do provide users with
increased mobility; however they still do not replace the power generation capabilities of the missing limb.
Figure 1-2. The Ossur Rheo knee (left) and the Otto Bock C-Leg (right) represent the cutting edge of
microprocesser controlled damping prosthetic knees.
Figure 1-3. The Ottobock Trias Foot represents the a typical spring-action ankle.
Despite these significant technological advances in transfemoral prostheses, commercially available
prostheses remain limited to energetically passive devices as seen. That is, the joints of the prosthesis
can either store or dissipate energy, but cannot provide net power over a gait cycle. The inability to deliver
joint power significantly impairs the ability of lower limb prostheses to restore many locomotive functions,

3
including walking up stairs and slopes, running, and jumping, all of which require significant net positive
power at the knee joint, ankle joint, or both (Winter and Sienko 1988, Nadeau et al. 2003, Riener et al. 1999,
Prilutsky et al. 1996, DeVita et al. 1996, Nagano et al. 1998, Jacobs et al. 1996). Further, although less
obvious, even biomechanically normal walking requires positive power output at the knee joint and
significant net positive power output at the ankle joint (Winter, 1991). Transfemoral amputees walking with
passive prostheses have been shown to expend up to 60% more metabolic energy relative to healthy
subjects during level walking (Waters et al. 1976) and exert as much as three times the affected-side hip
power and torque (Winter 1991), presumably due to the absence of powered joints.
A prosthesis with the capacity to deliver power at the knee and ankle joints would presumably address
these deficiencies, and would additionally enable the restoration of biomechanically normal locomotion.
Such a prosthesis, however, would require 1) power generation capabilities comparable to an actual limb
and 2) a control framework for generating required joint torques for locomotion while ensuring stable and
coordinated interaction with the user and the environment.
2. Literature Survey
Though the author is not aware of any prior work on the development of a powered knee and ankle
prosthesis, prior work does exist on the development of powered knee transfemoral prostheses and
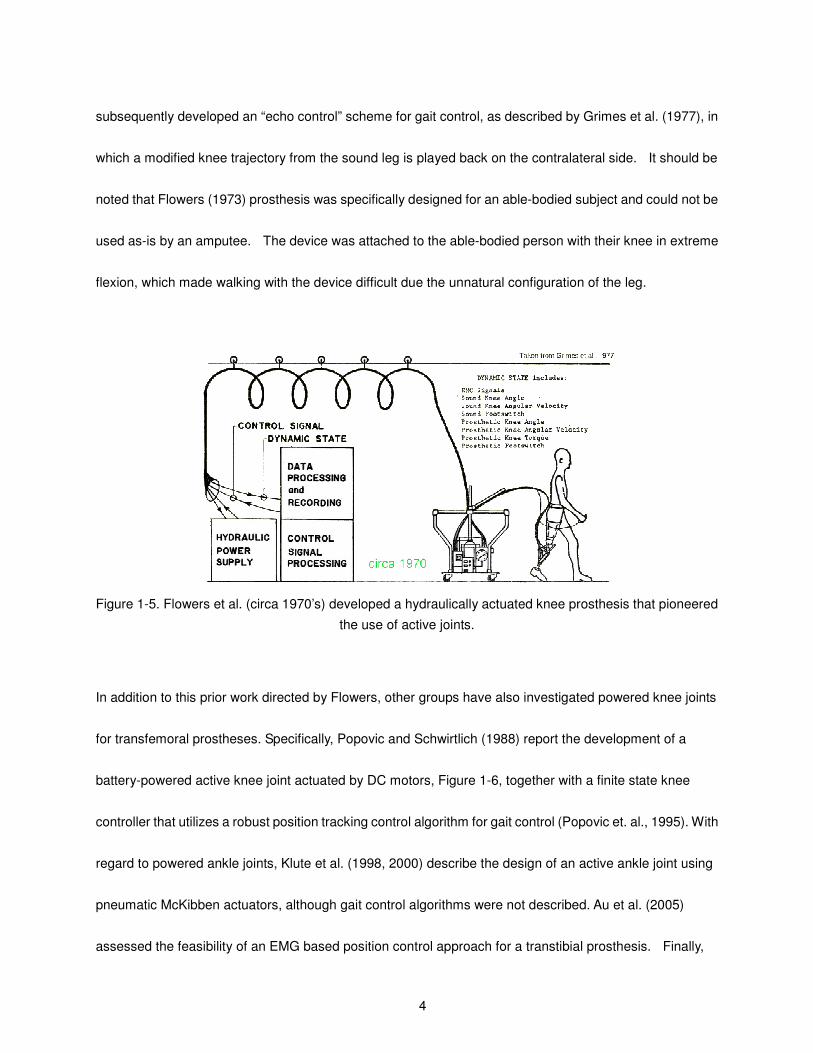
powered ankle transtibial prostheses. Regarding the former, Flowers (1973), Donath (1974), Flowers and
Mann (1977), Grimes et al. (1977), Grimes (1979), Stein (1983), and Stein and Flowers (1988) developed a
tethered electrohydraulic transfemoral prosthesis that consisted of a hydraulically actuated knee joint
tethered to a hydraulic power source and off-board electronics and computation, Figure 1-5. They
4
subsequently developed an “echo control” scheme for gait control, as described by Grimes et al. (1977), in
which a modified knee trajectory from the sound leg is played back on the contralateral side. It should be
noted that Flowers (1973) prosthesis was specifically designed for an able-bodied subject and could not be
used as-is by an amputee. The device was attached to the able-bodied person with their knee in extreme
flexion, which made walking with the device difficult due the unnatural configuration of the leg.
Figure 1-5. Flowers et al. (circa 1970’s) developed a hydraulically actuated knee prosthesis that pioneered
the use of active joints.
In addition to this prior work directed by Flowers, other groups have also investigated powered knee joints
for transfemoral prostheses. Specifically, Popovic and Schwirtlich (1988) report the development of a
battery-powered active knee joint actuated by DC motors, Figure 1-6, together with a finite state knee
controller that utilizes a robust position tracking control algorithm for gait control (Popovic et. al., 1995). With
regard to powered ankle joints, Klute et al. (1998, 2000) describe the design of an active ankle joint using
pneumatic McKibben actuators, although gait control algorithms were not described. Au et al. (2005)
assessed the feasibility of an EMG based position control approach for a transtibial prosthesis. Finally,

5
though no published literature exists, Ossur, a major prosthetics company based in Iceland, has announced
the development of both a powered knee and a self-adjusting ankle. The latter, called the “Proprio Foot”
(Figure 1-7), is not a true powered ankle, since it does not contribute power to gait, but rather is used to
quasistatically adjust the angle of the ankle to better accommodate sitting and slopes. The powered knee,
called the “Power Knee” (Figure 1-8), utilizes an echo control approach similar to the one described by
Grimes et al. (1977).
Figure 1-6. Electromagnetically actuated powered knee developed by Popovic with the use of a battery
pack.
Figure 1-7. Ossur “Proprio” foot used for actively positions the foot for increased functionality.

6
Figure 1-8. Victhom/Ossur “Power Knee” uses electromagnetic actuation and limited battery life.
3. Motivation and Contribution
Unlike any prior work, this thesis describes a prosthesis design that consists of both a powered knee
and ankle, and describes a method of control that enables natural, stable interaction between the user and
the powered prosthesis. The control approach is implemented on the prosthesis prototype fit to a user,
and experimentally shown to provide powered level walking representative of normal gait.
One of the most significant challenges in the development of a powered lower limb prosthesis is
providing self-powered actuation capabilities comparable to biological systems. State-of-the-art power
supply and actuation technology such as battery/DC motor combinations suffer from low energy density of
the power source (i.e., heavy batteries for a given amount of energy), low actuator force/torque density, and
low actuator power density (i.e., heavy motor/gearhead packages for a given amount of force or torque and
power output), all relative to the human musculoskeletal system. Recent advances in power supply and
actuation for self-powered robots, such as the liquid-fueled approaches described by Goldfarb et al. 2003,
Shields et al. 2006, Fite et al. 2006, and Fite and Goldfarb 2006, offer the potential of significantly improved
energetic characteristics relative to battery/DC motor combinations, and thus bring the potential of a

7
powered lower limb prosthesis to the near horizon. Specifically, the aforementioned publications describe
pneumatic-type actuators, which are powered by the reaction products of a catalytically decomposed liquid
monopropellant. The proposed approach has been experimentally shown to provide an energetic figure of
merit an order of magnitude greater than state-of-the-art batteries and motors (Shields et al. 2006, Fite and
Goldfarb 2006). Rather than construct a self-powered version directly, the authors have developed a
power-tethered version of the prosthesis, which enables laboratory-based controller development and
prosthesis testing. The self-powered version should be nearly identical to the power-tethered version, but
will include an on-board propellant cartridge and catalyst pack in place of the pneumatic tether. This thesis
describes the design of the power-tethered pneumatically actuated prosthesis prototype.
4. Organization of the Document
The thesis is organized into five chapters. Chapter I presents the introduction and motivation of the
overall powered transfemoral prosthesis concept. The thesis format is to present two manuscripts based
on the work and add additional technical detail in the subsequent chapter. Chapter II is a conference paper
that has been accepted by the 2006 ASME International Mechanical Engineering Congress and Exposition
as a technical paper. The paper presents the detailed design of a transfemoral prosthesis including the
optimization of the kinematic configuration, the overall prosthesis design, model verification with ProE
Mechanica Finite Element Analysis (FEA) software, the design of a three-axis socket load cell and the
design of an able-bodied adaptor that serves as a laboratory test bed. Chapter III is an addendum to
Manuscript I and adds technical details regarding the design, optimization, and socket load cell calibration.
Chapter IV is submitted as a full paper to the International Journal of Robotics Research for
8
consideration in a special issue on “Machines for Human Assistance and Augmentation”. Discussed in
this manuscript is the current prosthesis prototype design, methods for converting the prototype to a
self-powered version, development of an impedance based control approach and finally presents
experimental results for validation of the hardware and control approach. Chapter V is an addendum to
Manuscript and adds technical notes regarding the analog electronic circuitry, torque control, and a design
summary.
5. References
Au, S. Bonato, P., Herr, H., “An EMG-Postion Controlled System for an Active Ankle-Foot Prothesis: An
Initial Experimental Study,” Proceedings of the IEEE Int Conf. on Rehabilitation Robotics, pp. 375-379,
2005.
DeVita, P., Torry M., Glover, K.L., and Speroni, D.L.,“A Functional Knee Brace Alters Joint Torque and
Power Patterns during Walking and Running,” Journal of Biomechanics, vol. 29, no. 5, pp. 583-588,
1996.
Donath, M., “Proportional EMG Control for Above-Knee Prosthesis’, Department of Mechanical
Engineering Masters Thesis, MIT, 1974.
Fite, K.B., and Goldfarb, M. Design and Energetic Characterization of a Proportional-Injector
Monopropellant-Powered Actuator, IEEE/ASME Transactions on Mechatronics, vol. 11, no. 2, pp.
196-204, 2006.
Fite, K.B., Mitchell, J., Barth, E.J., and Goldfarb, M. A Unified Force Controller for a Proportional-Injector
Direct-Injection Monopropellant-Powered Actuator, ASME Journal of Dynamic Systems, Measurement
and Control, vol. 128, no. 1, pp. 159-164, 2006.
Flowers, W.C., “A Man-Interactive Simulator System for Above-Knee Prosthetics Studies, Department of
Mechanical Engineering PhD Thesis, MIT, 1973.
Flowers, W.C., and Mann, R.W., “Electrohydraulic knee-torque controller for a prosthesis simulator,” ASME
Journal of Biomechanical Engineering, vol. 99, no. 4, pp. 3-8., 1977.
Goldfarb, M., Barth, E.J., Gogola, M.A. and Wehrmeyer, J.A., “Design and Energetic Characterization of a
Liquid-Propellant-Powered Actuator for Self-Powered Robots.,” IEEE/ASME Transactions on

9
Mechatronics, vol. 8, no. 2, pp. 254-262, 2003.
Grimes, D. L., “An Active Multi-Mode Above Knee Prosthesis Controller. Department of Mechanical
Engineering PhD Thesis, MIT., 1979.
Grimes, D. L., Flowers, W. C., and Donath, M., “Feasibility of an active control scheme for above knee
prostheses. ASME Journal of Biomechanical Engineering, vol. 99, no. 4, pp. 215-221, 1977.
Jacobs, R., Bobbert, M.F., van Ingen Schenau, G.J.; “Mechanical output from individual muscles during
explosive leg extensions: the role of biarticular muscles,” Journal of Biomechanics, vol. 29, no. 4, pp.
513-523, 1996.
Klute, G.K., Czerniecki, J., Hannaford, B., “Development of Powered Prosthetic Lower Limb, Proceedings of
the First National Meeting, Veterans Affairs Rehabilitation Research and Development Service, 1998.
Klute, G.K., Czerniecki, J., Hannaford, B., “Muscle-Like Pneumatic Actuators for Below-Knee Prostheses,
Proceedings the Seventh International Conference on New Actuators, pp. 289-292, 2000.
Nadeau, S., McFadyen, B.J., and Malouin, F., “Frontal and sagittal plane analyses of the stair climbing task
in healthy adults aged over 40 years: What are the challenges compared to level walking?,” Clinical
Biomechanics, vol. 18, no. 10, pp. 950-959., 2003.
Nagano, A., Ishige, Y., and Fukashiro, S., “Comparison of new approaches to estimate mechanical output
of individual joints in vertical jumps,” Journal of Biomechanics, vol. 31, no. 10, pp. 951-955, 1998.
Popovic, D. and Schwirtlich, L., “Belgrade active A/K prosthesis, “ in de Vries, J. (Ed.), Electrophysiological
Kinesiology, Interm. Congress Ser. No. 804, Excerpta Medica, Amsterdam, The Netherlands, pp.
337–343, 1988.
Popovic D, Oguztoreli MN, Stein RB., “Optimal control for an above-knee prosthesis with two degrees of
freedom,” Journal of Biomechanics, vol. 28, no. 1, pp. 89-98, 1995.
Prilutsky, B.I., Petrova, L.N., and Raitsin, L.M., “Comparison of mechanical energy expenditure of joint
moments and muscle forces during human locomotion,” Journal of Biomechanics, vol. 29, no. 4, pp.
405-415, 1996.
Riener, R., Rabuffetti, M., and Frigo, C., “Joint powers in stair climbing at different slopes.”, Proceedings of
the IEEE International Conference on Engineering in Medicine and Biology, vol. 1, p. 530., 1999.
Shields, B.L., Fite, K., and Goldfarb, M. Design, Control, and Energetic Characterization of a Solenoid
Injected Monopropellant Powered Actuator, IEEE/ASME Transactions on Mechatronics, vol. 11, no. 4,
pp. 477-487, 2006.
Stein, J.L., “Design Issues in the Stance Phase Control of Above-Knee Prostheses,” Department of

10
Mechanical Engineering PhD Thesis, MIT, 1983.
Stein, J.L., and Flowers, W.C., “Stance phase control of above-knee prostheses: knee control versus SACH
foot design,” Journal of Biomechanics, vol. 20, no. 1, pp. 19-28, 1988.
Waters, R., Perry, J., Antonelli, D., and Hislop, H., “Energy cost of walking amputees: the influence of level
of amputation,” J. Bone and Joint Surgery. 58A, 42–46, 1976.
Winter, D. A. and Sienko, S. E., “Biomechanics of below-knee amputee gait,” J. Biomechanics. 21,
361–367., 1988.
Winter, D.A., “The biomechanics and motor control of human gait: normal, elderly and pathological,”
University of Waterloo Press, 2nd ed., 1991.

11
CHAPTER II
MANUSCRIPT I: DESIGN OF A PNEUMATICALLY ACTUATED TRANSFEMORAL PROSTHESIS
Frank Sup and Michael Goldfarb
Department of Mechanical Engineering
Vanderbilt University
Nashville, TN 37235
Accepted as a Technical Paper to the
2006 ASME International Mechanical Engineering Congress and Exposition

12
1. Abstract
This paper describes the design of an above-knee prosthesis with actively powered knee and ankle
joints, both of which are actuated via pneumatic actuators. The prosthesis serves as a laboratory test-bed to
validate the design and develop of control interfaces for future self-contained versions (i.e., with onboard
hot-gas power and computing), and therefore includes a tether for both pneumatic power and control. The
prototype prosthesis provides the full range of motion for both the knee and ankle joints while providing
100% of the knee torque required for fast cadence walking and stair climbing and 76% and 100%,
respectively, of the ankle torque required for fast cadence walking and for stair climbing, based on the
torques required by a healthy 75 kg subject. The device includes sensors to measure knee and ankle torque
and position, in addition to a load cell that measures the interaction force and (sagittal and frontal planes)
moments between the user and device.
2. Introduction
Despite significant technological advances over the past decade (such as the introduction of
microcomputer-modulated damping during swing), commercial transfemoral prostheses remain limited to
energetically passive devices. That is, the joints of the prostheses can either store or dissipate energy, but
cannot provide any net power over a gait cycle. Today’s lower limb transfemoral prosthesis is typically a
“locking” knee for stance phase, a passive (sometimes microprocessor modulated) damper at the knee
during swing phase, some form of damping at the ankle for heel strike, and often some form of compliant
energy storage at the ankle/foot for toe-off. The inability to deliver joint power significantly impairs the
ability of these prostheses to restore many locomotive functions, including walking up stairs and slopes,
13
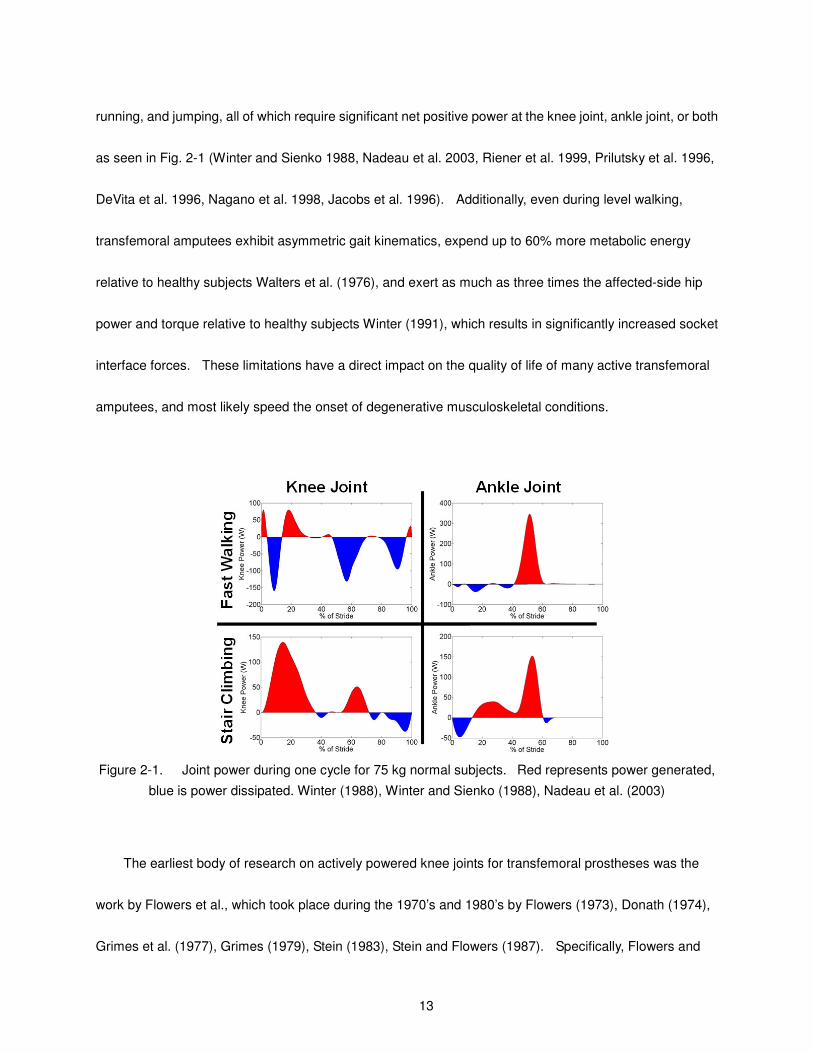
running, and jumping, all of which require significant net positive power at the knee joint, ankle joint, or both
as seen in Fig. 2-1 (Winter and Sienko 1988, Nadeau et al. 2003, Riener et al. 1999, Prilutsky et al. 1996,
DeVita et al. 1996, Nagano et al. 1998, Jacobs et al. 1996). Additionally, even during level walking,
transfemoral amputees exhibit asymmetric gait kinematics, expend up to 60% more metabolic energy
relative to healthy subjects Walters et al. (1976), and exert as much as three times the affected-side hip
power and torque relative to healthy subjects Winter (1991), which results in significantly increased socket
interface forces. These limitations have a direct impact on the quality of life of many active transfemoral
amputees, and most likely speed the onset of degenerative musculoskeletal conditions.
Figure 2-1. Joint power during one cycle for 75 kg normal subjects. Red represents power generated,
blue is power dissipated. Winter (1988), Winter and Sienko (1988), Nadeau et al. (2003)
The earliest body of research on actively powered knee joints for transfemoral prostheses was the
work by Flowers et al., which took place during the 1970’s and 1980’s by Flowers (1973), Donath (1974),
Grimes et al. (1977), Grimes (1979), Stein (1983), Stein and Flowers (1987). Specifically, Flowers and

14
Mann (1977) developed a tethered electrohydraulic transfemoral prosthesis that consisted of a hydraulically
actuated knee joint tethered to a hydraulic power source and off-board electronics and computation through
a tether. The prosthesis did not contain an active ankle joint, but rather incorporated a solid-ankle,
cushioned-heel (SACH) foot. The SACH foot effectively absorbed energy at heel strike, although provided
relatively little energy storage and return during toe-off. In addition to the body of work directed by Flowers
(1973) and Flowers and Mann (1977), other groups have also investigated actively powered knee joints for
transfemoral prostheses. Specifically, Popovic and Schwirtlich (1988) report the development of an active
knee joint battery-powered DC motor actuated transfemoral prosthesis. Finally, though no published
research exists, it should be noted that Ossur, a prosthetics company based in Iceland, has in development
an actively powered knee prosthesis for transfemoral amputees. With regard to active ankle joints, Klute
et al. (1998, 2000) conducted studies on the use of McKibben actuators in an active ankle joint for transtibial
prostheses.
One of the significant challenges in developing a powered lower limb prosthesis is providing on-board
power and actuation that is comparable to that of biological systems. Relative to biological systems,
state-of-the-art power supply and actuation technology is hindered by the combination of low energy
density of the power source (i.e., heavy batteries for a given amount of energy), low actuator force/torque
density, and low actuator power density (i.e., heavy motor/gearhead packages for a given amount of force
or torque and power output). Recent advances in power supply and actuation for self-powered robots,
such as the liquid-fueled approach developed by the investigators Goldfarb et al. (2003), Shields and
Goldfarb (2005), Shields et al. (2004) and Fite et al.(2004), offer the potential of significantly improved
energetic characteristics, relative to batteries and motors. This paper describes the design of a prototype
15
transfemoral prosthesis that is intended to be powered by the liquid-fueled approach developed by the
investigators. In its initial form, however, the prosthesis will be power-tethered, such that interface and
control algorithms can be developed and tested in a laboratory setting. Once such interface and control is
developed, the device will be converted for use with on-board power and computation. The remainder of
this paper describes the design of the power-tethered prototype.
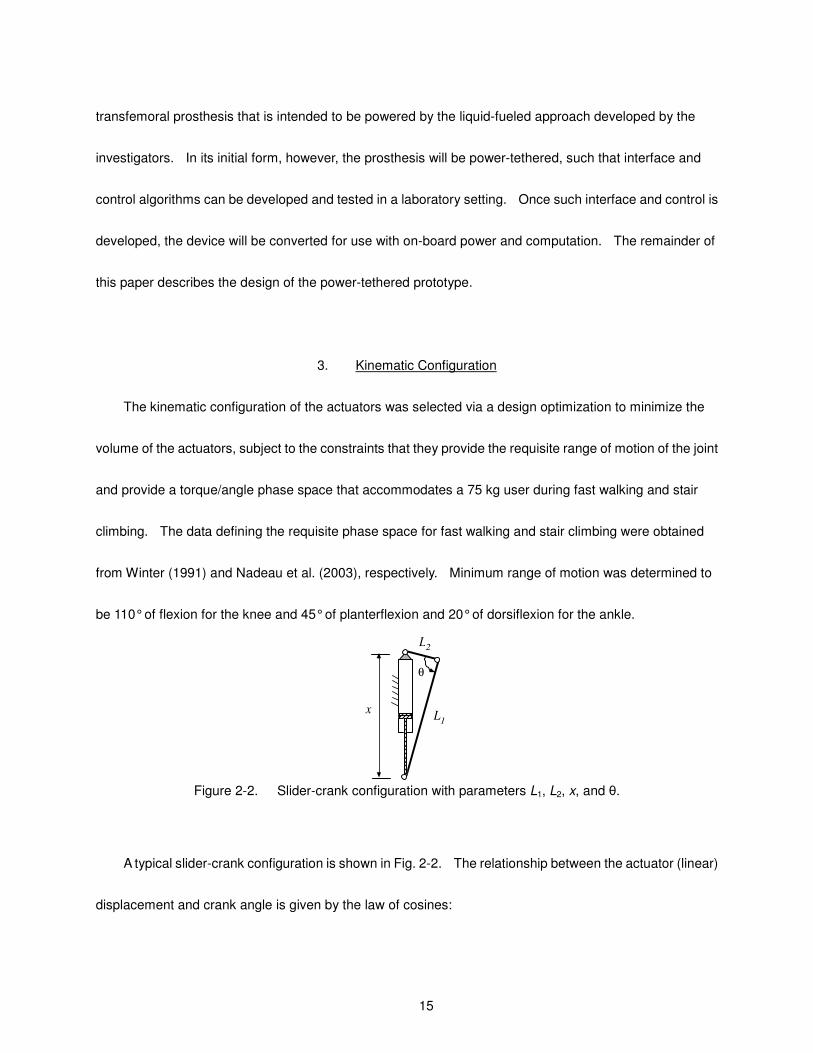
3. Kinematic Configuration
The kinematic configuration of the actuators was selected via a design optimization to minimize the
volume of the actuators, subject to the constraints that they provide the requisite range of motion of the joint
and provide a torque/angle phase space that accommodates a 75 kg user during fast walking and stair
climbing. The data defining the requisite phase space for fast walking and stair climbing were obtained
from Winter (1991) and Nadeau et al. (2003), respectively. Minimum range of motion was determined to
be 110° of flexion for the knee and 45° of planterflexion and 20° of dorsiflexion for the ankle.
x
θ
L1
L2
Figure 2-2. Slider-crank configuration with parameters L1, L2, x, and θ.
A typical slider-crank configuration is shown in Fig. 2-2. The relationship between the actuator (linear)
displacement and crank angle is given by the law of cosines:

16
x2
L1
2L
2
22L
1L
2cos (1)
where L1 and L2 are the two fixed-length segments of the slider-crank, θ is the angle between those
segments, and x (which represents the actuator length) can vary between a fully contracted state, xmin, and
a fully extended state, xmax. The relationship between slider force and crank torque can be obtained by
assuming no internal losses (i.e., method of virtual work) as follows:
Fdx
d
F L1L
2sin
L1
2L
2
22L
1L
2cos (2)
For the pneumatic actuator, the force F is given by the product of actuator diameter and operating
pressure, which in this case is 2 MPa (300 psig). Based on these relationships, a multi-tiered exhaustive
search minimization was conducted to find a minimum volume actuator that could provide the requisite
range of motion and torque/angle phase space as follows:
For a given actuator diameter and stroke length (which determine xmin and xmax), combinations of L1 and L2
were determined, based on equation (1), that provide the requisite range of motion. Note that the actuator
diameter influence is not intuitive, but does affect the cylinder length as a function of stroke. For these
combinations, the peak torque was computed, based on maximizing equation (2) as a function of θ. The
optimal solution was the one that provided the requisite peak torque and secondly minimized the angle
between the mechanism peak torque and the angle at which it occurs during gait, and, if necessary,
additionally minimized the length L1.

17
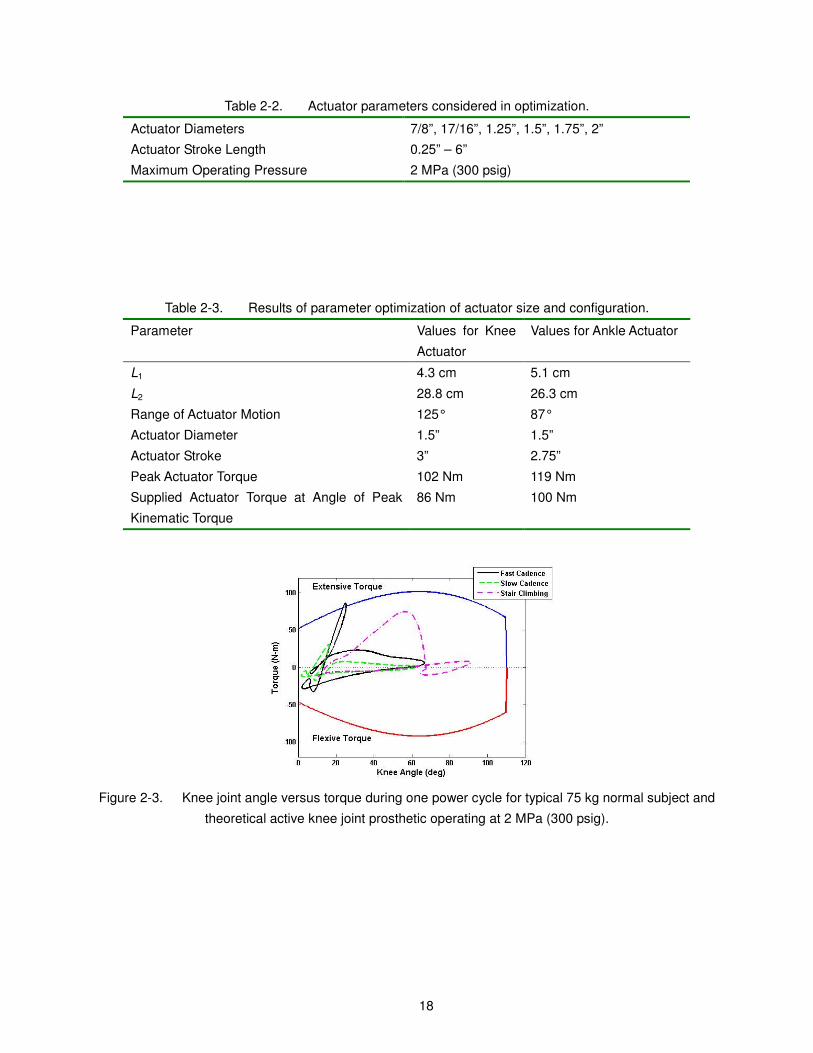
The joint specifications and ranges considered for L1 and L2 are given in Table 2-1, the actuator sizes
considered are given in Table 2-2, and finally the optimized solution is given in Table 2-3. Note that the
ankle actuator can supply only 76% of the torque required for fast walking by a 75 kg user. Though
solutions did exist for the full ankle torque, these solutions placed the geometry envelope of the prototype
outside of the typical human anthropomorphic envelope. As such, it was decided to trade the peak torque
capability of the ankle in order to limit the size of the ankle actuator and the L1 dimension in order to stay
within the volumetric envelope of the anthropomorphic norm and reduce overall weight of the device.
Experimental trials with the device will determine whether or not this was a worthwhile design trade-off.
The torque/angle phase space of the resulting knee and ankle actuator configurations are shown
graphically in Figs. 2-3 and 2-4, along with the data for a 75 kg normal human for slow and fast cadence and
stair climbing Winter (1988), Winter and Sienko (1988), Nadeau et al. (2003).
Table 2-1. Parameters used for optimization of actuator size and configuration.
Parameter Values for Knee
Actuator
Values for Ankle Actuator
Peak Kinematic Torque Required 86 Nm 130 Nm
Angle at Peak Kinematic Torque 25° 10°
Minimum Range of Motion 110° 65°
Range of L1 0.001 – 3.16 cm 0.001 – 3.16 cm
Range of L2 0.001 – 30 cm 0.001 – 30 cm
18
Table 2-2. Actuator parameters considered in optimization.
Actuator Diameters 7/8”, 17/16”, 1.25”, 1.5”, 1.75”, 2”
Actuator Stroke Length 0.25” – 6”
Maximum Operating Pressure 2 MPa (300 psig)
Table 2-3. Results of parameter optimization of actuator size and configuration.
Parameter Values for Knee
Actuator
Values for Ankle Actuator
L1 4.3 cm 5.1 cm
L2 28.8 cm 26.3 cm
Range of Actuator Motion 125° 87°
Actuator Diameter 1.5” 1.5”
Actuator Stroke 3” 2.75”
Peak Actuator Torque 102 Nm 119 Nm
Supplied Actuator Torque at Angle of Peak
Kinematic Torque
86 Nm 100 Nm
Figure 2-3. Knee joint angle versus torque during one power cycle for typical 75 kg normal subject and
theoretical active knee joint prosthetic operating at 2 MPa (300 psig).

19
Figure 2-4. Ankle joint angle versus torque during one power cycle for typical 75 kg normal subject
Winter and theoretical active ankle joint prosthetic operating at 2 MPa (300 psig).
4. Prosthesis Design
Figures 2-6 and 2-7 show a labeled solid model and a photograph, respectively, of the assembled
prosthesis prototype. The device incorporates double-acting pneumatic actuators (Bimba model 17-3-DP
for the knee joint, model 17-2.75-DP for the ankle). Operating at 300 psig, the actuators are capable of
producing 510 lbf of outward axial force, and 465 lbf on the return. It should be noted that heavier users
could be accommodated by increasing the operating pressure (e.g., up to 500 psig, which would
accommodate joint torques required for a 125 kg user). Flow to the cylinders is controlled by custom
four-way servovalves, shown in Fig. 2-5. The sensor package for the prosthesis includes joint torque and
position sensors along with a custom 3-axis socket load cell, described in detail in Section 5, which
measures the axial force, sagittal plane moment, and frontal plane moment at the interface between the
prosthesis and socket. The torque at each joint is measured via uniaxial load cells (Honeywell Sensotec
model 11) located in line with the actuator piston rods. The ankle and knee joints each contain integrated
joint motion sensors (ETI Systems model SP12S precision potentiometer). A potentiometer was chosen

20
as a joint angle sensor rather than an optical encoder to provide high-resolution absolute position
measurement in a small package size. The potentiometers lie inside a pair of Teflon/porous bronze
composite dry bearings (Garlock model DU) within each joint, as shown in the cross section of Fig. 2-8.
Figure 2-9 shows the range of motion of the knee and ankle joints, while Fig. 2-10 shows the geometric
envelope of the active knee and ankle prosthesis relative to the human leg.
Figure 2-5. Rotary 4-way servovalve for use in prosthesis.

21
Figure 2-6. Major components of power-tethered prototype.
Figure 2-7. Actual tethered transfemoral prosthesis prototype.
22
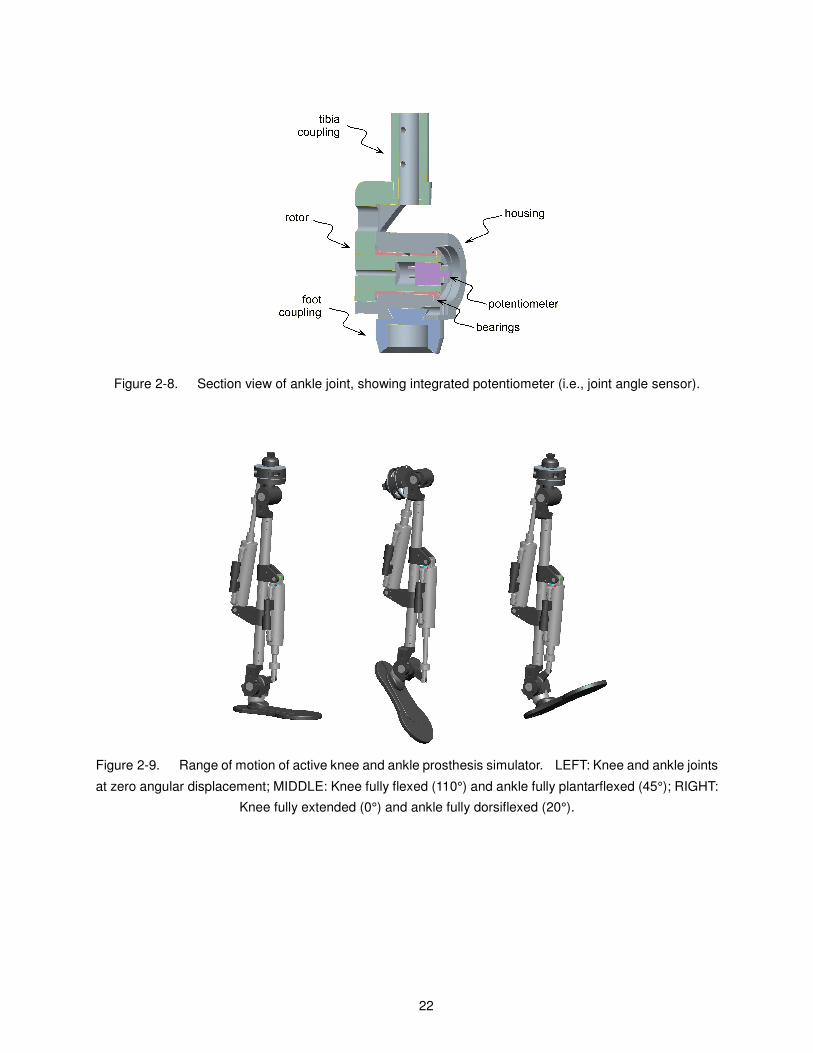
Figure 2-8. Section view of ankle joint, showing integrated potentiometer (i.e., joint angle sensor).
Figure 2-9. Range of motion of active knee and ankle prosthesis simulator. LEFT: Knee and ankle joints
at zero angular displacement; MIDDLE: Knee fully flexed (110°) and ankle fully plantarflexed (45°); RIGHT:
Knee fully extended (0°) and ankle fully dorsiflexed (20°).

23
Figure 2-10. Sagittal and frontal geometry of the active knee and ankle prosthesis relative to an
anthropomorphic norm.
The structural components of the prosthesis were designed to withstand a 2224 N (500 lbf) load and
maximum actuator joint torques using ProE Mechanica finite element analysis (FEA) software to verify safe
stress conditions. The results of these analyses, depicted in Figs. 2-11 through 2-14, indicate that 7075-T6
aluminum, which has a minimum yield strength in excess of 500 MPa, provides a factor of safety between
1.7 and 3.7 for the design conditions.
Figure 2-11. ProE Mechanica finite element analysis of ankle joint housing actuator attachment point
subjected to 2224 N (500 lbf) vertical force. Maximum von mises stress is 297 Mpa.

24
Figure 2-12. ProE Mechanica finite element analysis of knee joint housing actuator attachment point
subjected to 2224 N (500 lbf) downward vertical force and 1000 N downward vertical force on load cell
attachment point. Maximum von mises stress is 155 Mpa.
Figure 2-13. ProE Mechanica finite element analysis of tibial tube subjected to 2224 N compressive force
and actuator attachment clamps subjected to 2224 N (500 lbf) downward vertical force. Maximum von
mises stress is 291 Mpa.
25
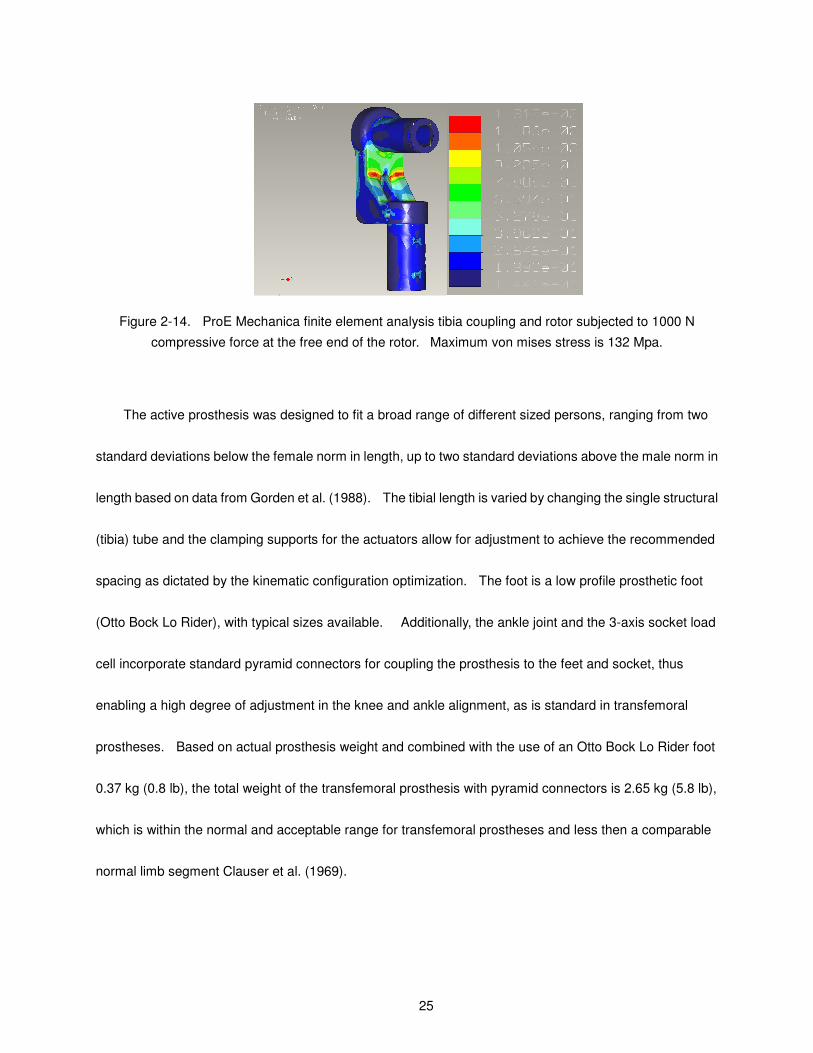
Figure 2-14. ProE Mechanica finite element analysis tibia coupling and rotor subjected to 1000 N
compressive force at the free end of the rotor. Maximum von mises stress is 132 Mpa.
The active prosthesis was designed to fit a broad range of different sized persons, ranging from two
standard deviations below the female norm in length, up to two standard deviations above the male norm in
length based on data from Gorden et al. (1988). The tibial length is varied by changing the single structural
(tibia) tube and the clamping supports for the actuators allow for adjustment to achieve the recommended
spacing as dictated by the kinematic configuration optimization. The foot is a low profile prosthetic foot
(Otto Bock Lo Rider), with typical sizes available. Additionally, the ankle joint and the 3-axis socket load
cell incorporate standard pyramid connectors for coupling the prosthesis to the feet and socket, thus
enabling a high degree of adjustment in the knee and ankle alignment, as is standard in transfemoral
prostheses. Based on actual prosthesis weight and combined with the use of an Otto Bock Lo Rider foot
0.37 kg (0.8 lb), the total weight of the transfemoral prosthesis with pyramid connectors is 2.65 kg (5.8 lb),
which is within the normal and acceptable range for transfemoral prostheses and less then a comparable
normal limb segment Clauser et al. (1969).

26
5. Load Cell Design
As previously mentioned, the interaction forces and moments between the prosthesis and user must
be measured for purposes of prosthesis control and user intent recognition. Such a measurement is most
logically made proximal to the knee joint. Based on the data for fast walking and stair climbing, the range
of measurement for the load cell was determined to be 1000 N of axial force (i.e., along the socket) and 100
N-m of sagittal and frontal plane moments. Relative to commercially available multi-axis load cells (e.g.,
ATI and JR3), this combination of force and moment is disproportionately weighted toward the moment
measurement. Specifically, commercial multi-axis load cells that met the force requirement had a moment
range that was an order of magnitude smaller than the moment requirement. Similarly, commercial
multi-axis load cells that met the moment requirement had force ratings an order of magnitude larger than
that required, and additionally were much larger than could be realistically implemented in a prosthetic leg.
As such, a custom load cell was designed and fabricated. Initially, an effort was made to utilize three
commercial uniaxial load cells (Honeywell Sensotec model 11) mounted in a triangle formation to
independently measure forces and moments, as depicted in Fig. 2-15. The large moment requirement
relative to the force range, and the fact that the package diameter was restricted by the diameter of a leg,
required the use of 2225 N (500 lbf) uniaxial load cells, such that the total force capacity would be 6675 N
(1500 lbf). Since the primary measurement range of interest is an order of magnitude less than this, the
sensitivity of this load cell would be unacceptable. As such, a custom three-axis socket load cell was
designed.

27
Figure 2-15. Triangle mounted uniaxial commercial load cells not used in final design to due reduced
sensitivity to axial force.
Figure 2-16. Idealized versus actual beam patterns.
Figure 2-17. Regions of compression (C) and tension (T) in a sectional view of the single cross for an
applied force, F, and moment, M. Subscripts denote loading responsible for the compression and tension.

28
Figure 2-18. Regions of compression (C) and tension (T) in a sectional view of the double cross for an
applied force, F, and moment, M. Subscripts denote loading responsible for the compression and tension.
The basis of the socket load cell design is a crossed beam, as depicted in Fig. 2-16. The initial design
utilized a single crossed beam, which measures the force and moments via the relative regions of tension
and compression as indicated in Fig. 2-17. Based on assumptions of linearly elastic, isotropic and
homogeneous behavior, the strain due to the axial force can be derived to be:
f
Mb h
2E I
3F L
2E b h2
(3)
and the strain due the moment derived to be:
m
M L h
2E I
3K L M L L
K L KT E b h2
(4)
where,
K L
8E I 3R2
3R L L2
L3
(5)
and
29
K T
2 Gbh3
L (6)
and
M L
K L Mb
K L KT (7)
and
M b EId
2v
dx2
M3L R L
2 3R2
3R L L2
L2
6L R L
8 3R2
3R L L2
(8)
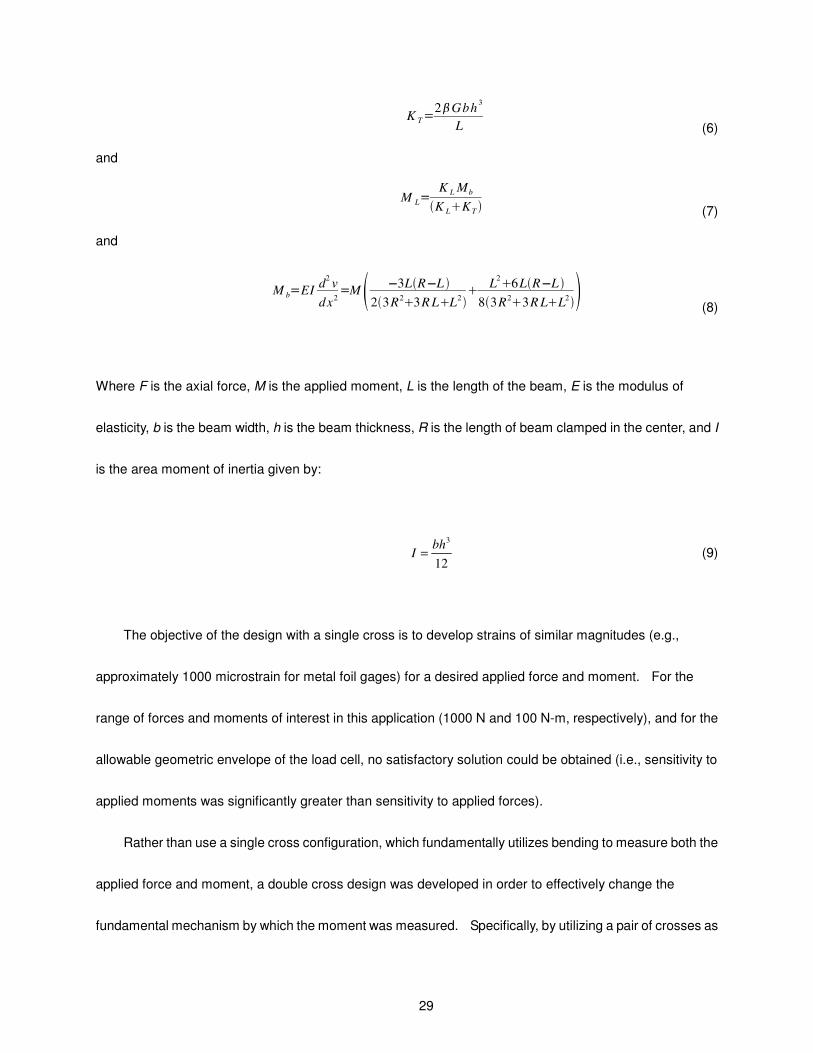
Where F is the axial force, M is the applied moment, L is the length of the beam, E is the modulus of
elasticity, b is the beam width, h is the beam thickness, R is the length of beam clamped in the center, and I
is the area moment of inertia given by:
12
3bhI = (9)
The objective of the design with a single cross is to develop strains of similar magnitudes (e.g.,
approximately 1000 microstrain for metal foil gages) for a desired applied force and moment. For the
range of forces and moments of interest in this application (1000 N and 100 N-m, respectively), and for the
allowable geometric envelope of the load cell, no satisfactory solution could be obtained (i.e., sensitivity to
applied moments was significantly greater than sensitivity to applied forces).
Rather than use a single cross configuration, which fundamentally utilizes bending to measure both the
applied force and moment, a double cross design was developed in order to effectively change the
fundamental mechanism by which the moment was measured. Specifically, by utilizing a pair of crosses as

30
shown in Fig. 2-18, the moment is counteracted by a force couple, which loads the beams in tension and
compression, while (like the single cross configuration) the force is counteracted by loading the beams in
bending. By introducing fundamentally different mechanisms of loading between the force and moment
measurement, the relative geometry of the cross could be manipulated to generate similar strain sensitivity.
Figure 2-19. Double cross in assembled and exploded view showing the configuration of the two
approximated crosses.
The double cross design, which is shown in Fig. 2-19, consists of two single crosses separated by a
distance and rigidly held together by a housing on the outside and load transmitter in the center. This
introduces a levering action, via the load transmitter, between the crosses when a moment is applied. For
a given applied moment, the strain in the beams can be calculated as:
m
F
A E
M
t b h E (10)
where,
FM
t (11)
and

31
A b h (12)
Where εm is the strain resulting from the applied moment, M, t is the separation between the plates, b is the
width of the beam, h is the thickness of the plates, and E is the modulus. As the distance increases
between the two plates, the forces in each of the supporting beams decreases. The distance between the
plates is used to bring the resulting force and moment strains on the same order and within the measurable
range of a strain gage. The double cross still utilizes beam bending to measure the force the same manner
as that used for the single cross design, however, the force is now distributed via four beams, instead of two
(i.e., strain given by equation (3), although a factor of two less for a given force).
Based on appropriate versions of equations (3) and (10), the double load cell was optimized using a
recursive MATLAB program code to optimize for the smallest overall device size. The optimization
constraints were to have the sum of strains be less than 1500 microstrain, have the strains, εf and εm, be on
the same order, and search for the minimum load cell volume that meets the criteria. The results of the
optimization for the load cell design are listed in Table 2-4. The resulting strains were then verified via a
ProE Mechanica finite element analysis, the results of which are shown in Figs. 2-20 and 2-21.

32
Table 2-4. Results of parameter optimization of 3-axis load cell dimensions.
Parameter Symbol Value
Length of Beam L 20 mm
Width of Beam b 16 mm
Height of Beam h 2 mm
Plate Separation t 23 mm
Modulus of Plate Material E 193 Gpa (301 stainless steel)
Predicted strain from Force εf 610 µε
Predicted strain from
Moment
εm 870 µε
Figure 2-20. ProE Mechanica analysis of 3-axis socket load cell subjected to 1000 N compressive axial
force. Peak microstrain in the area location of the stain gages is 400 µε.
Figure 2-21. ProE Mechanica analysis of 3-axis socket load cell subjected to 100 Nm moment in the frontal
plane. Peak microstrain in the location of the stain gages is 700 µε.

33
The device was fabricated using the actual cross design as depicted in Fig. 2-16. Strain gages
(Vishay Micromeasurements EA-06-125AC-350) were applied in a pattern depicted by Fig. 18. The final
assembled and wired device, which can be seen in Fig. 6, weighs 360 g. The calibration of the load cell
was two-fold. First, reference loads were placed directly on top of the load cell. In the second, depicted in
Fig. 2-22, reference masses were hung from an arm inline with cross beams at varying distances from the
load cell to impart a moment onto the load cell with varying forces, and forces onto the load cell with varying
moments. The voltage readings from each of the three bridges were taken for all calibration points. A
least squares method was used to calculate coefficients of a transformation matrix between the vector of
applied forces and moments and the vector of measured voltage output from the three bridges based on a
fifth-order polynomial fit using MATLAB. The results of the calibration are shown in Figs. 2-23, 2-24 and
2-25. In these figures, the 45° line represents the zero-error solution where applied load is equal to the
calculated load. The relatively small error that exists in the calibration is due to (mechanical) cross talk
between the applied forces and moments.
Figure 2-22. Calibration setup of 3-axis socket load cell in moment calibration configuration.

34
Figure 2-23. Applied versus calculated force, where line represents ideal solution where applied is equal
to calculated.
Figure 2-24. Applied versus calculated sagittal moment, where line represents ideal solution where
applied is equal to calculated.

35
Figure 2-25. Applied versus calculated frontal moment, where line represents ideal solution where applied
is equal to calculated.
6. Able-Body Testing Adaptor
Development and testing of the prosthesis controller will be facilitated by the use of an able-boded
testing adaptor, which will enable extensive in-house testing and validation of the prosthesis prior to any
transfemoral amputee participant involvement. The testing adaptor will enable a healthy subject to wear
and walk with the prosthesis prototype. Gait trials with the testing adaptor will be used to thoroughly
evaluate the performance, safety, and functionality of the fully controlled prosthesis prior to any transfemoral
participant involvement. Design of the able-bodied testing adaptor is shown in Fig. 2-26. As shown in the
figure, the adaptor consists of a commercial adjustable locking knee immobilizer (KneeRANGER-Universal
Hinged Knee Brace) with an adaptor bracket that transfers load from the subject to the prosthesis. Figure
2-27 shows for comparison both a transfemoral amputee with the prosthesis and a healthy subject with
adaptor/prosthesis. Since the prosthesis remains lateral to the immobilized leg of the healthy subject, the

36
adaptor will enable replication of transfemoral amputee gait without (geometric) interference from the
immobilized leg.
Figure 2-26. Design of the able-bodied testing adaptor, which will enable development, testing, and
evaluation of the proposed prosthesis and controllers prior transfemoral amputee participant testing.
Figure 2-27. Depiction of one stride cycle for transfemoral amputee (above) and healthy subject wearing
able-bodied (below).
7. Conclusion
This paper described the design of a tethered pneumatically actuated transfemoral prosthesis. The
design requirements were outlined from biomechanical data of unaffected persons and the design was
optimized to provide a lightweight device and the structural integrity validated with finite element analysis
software. A sensor set to provide full controllability of the prosthesis was integrated into the design.

37
Among the sensor set is a custom designed three-axis load cell, which measures the forces and moments
between the prosthesis and socket. This prosthesis will serve as a laboratory test bed to validate the
device performance and develop control algorithms using the able-bodied adaptor. Pending the
development of suitable user interface and control approaches, a self-contained version of the prosthesis
with on-board power and computing will be developed.
8. References
Clauser CE, McConville JT, Young JM, Weight, volume and center of mass of segments of the human body.
AMRL-TR-69-70, Wright Patterson Airforce Base, Dayton, Ohio, 1969.
DeVita, P., Torry M., Glover, K.L., and Speroni, D.L. A Functional Knee Brace Alters Joint Torque and
Power Patterns during Walking and Running, Journal of Biomechanics, vol. 29, no. 5, pp. 583-588,
1996.
Donath, M., Proportional EMG Control for Above-Knee Prosthesis’, Department of Mechanical Engineering
Masters Thesis, MIT, 1974.
Fite, K.B., Mitchell, J., Barth, E.J., and Goldfarb, M. Sliding Mode Control of a Direct-Injection
Monopropellant-Powered Arm, American Control Conference, pp. 4461-4466, 2004.
Flowers, W.C., A Man-Interactive Simulator System for Above-Knee Prosthetics Studies, Department of
Mechanical Engineering PhD Thesis, MIT, 1973.
Flowers, W.C., and Mann, R.W., Electrohydraulic knee-torque controller for a prosthesis simulator. ASME
Journal of Biomechanical Engineering, vol. 99, no. 4, pp. 3-8, 1977.
Goldfarb, M., Barth, E.J., Gogola, M.A. and Wehrmeyer, J.A., Design and Energetic Characterization of a
Liquid-Propellant-Powered Actuator for Self-Powered Robots. IEEE/ASME Transactions on
Mechatronics, vol. 8, no. 2, pp. 254-262, 2003.
Gordon, CC, B. Bradtmiller, T. Churchill, C.E. Clauser, J.T. McConville, I. Tebbetts and R. Walker. 1988
Anthropometric Survey of US Army Personnel: Methods and Summary Statistics. Technical Report
NATICK/TR-89/044, U.S. Army Natick Research, Development and Engineering Center, Natick, MA,
1989.
Grimes, D. L., Flowers, W. C., and Donath, M., Feasibility of an active control scheme for above knee

38
prostheses. ASME Journal of Biomechanical Engineering, vol. 99, no. 4, pp. 215-221, 1977.
Grimes, D. L., An Active Multi-Mode Above Knee Prosthesis Controller. Department of Mechanical
Engineering PhD Thesis, MIT, 1979.
Jacobs, R., Bobbert, M.F., van Ingen Schenau, G.J., Mechanical output from individual muscles during
explosive leg extensions: the role of biarticular muscles. Journal of Biomechanics, vol. 29, no. 4, pp.
513-523, 1996.
Klute, G.K., Czerniecki, J., Hannaford, B., Development of Powered Prosthetic Lower Limb, Proceedings of
the First National Meeting, Veterans Affairs Rehabilitation Research and Development Service, 1998.
Klute, G.K., Czerniecki, J., Hannaford, B., Muscle-Like Pneumatic Actuators for Below-Knee Prostheses,
Proceedings the Seventh International Conference on New Actuators, pp. 289-292, 2000.
Nadeau, S., McFadyen, B.J., and Malouin, F. Frontal and sagittal plane analyses of the stair climbing task
in healthy adults aged over 40 years: What are the challenges compared to level walking? Clinical
Biomechanics, vol. 18, no. 10, pp. 950-959, 2003.
Nagano, A., Ishige, Y., and Fukashiro, S., Comparison of new approaches to estimate mechanical output of
individual joints in vertical jumps. Journal of Biomechanics, vol. 31, no. 10, pp. 951-955, 1998.
Popovic, D. and Schwirtlich, L., Belgrade active A/K prosthesis, in de Vries, J. (Ed.), Electrophysiological
Kinesiology, Interm. Congress Ser. No. 804, Excerpta Medica, Amsterdam, The Netherlands, pp.
337–343, 1998.
Prilutsky, B.I., Petrova, L.N., and Raitsin, L.M., Comparison of mechanical energy expenditure of joint
moments and muscle forces during human locomotion. Journal of Biomechanics, vol. 29, no. 4, pp.
405-415, 1996.
Riener, R., Rabuffetti, M., and Frigo, C., Joint powers in stair climbing at different slopes. Proceedings of the
IEEE International Conference on Engineering in Medicine and Biology, vol. 1, p. 530, 1999.
Shields, B., Fite, K., and Goldfarb, M., Control of a Direct Injection Liquid Fueled Actuator, Proceedings of
the ASME International Mechanical Engineering Congress and Exposition, IMECE2004-59442, 2004.
Shields, B., and Goldfarb, M., Design and Energetic Characterization of a Solenoid Injected Liquid
Monopropellant Powered Actuator for Self-Powered Robots, accepted for the 2005 IEEE International
Conference on Robotics and Automation, 2005.
Stein, J.L., Design Issues in the Stance Phase Control of Above-Knee Prostheses. Department of
Mechanical Engineering PhD Thesis, MIT, 1983.
Stein, J.L., and Flowers, W.C., Stance phase control of above-knee prostheses: knee control versus SACH

39
foot design. Journal of Biomechanics, vol. 20, no. 1, pp. 19-28, 1987.
Waters, R., Perry, J., Antonelli, D., and Hislop, H., Energy cost of walking amputees: the influence of level of
amputation. J. Bone and Joint Surgery. 58A, 42–46, 1976.
Winter, D. A. and Sienko, S. E., Biomechanics of below-knee amputee gait. J. Biomechanics. 21, 361–367,
1988.
Winter, D.A., The biomechanics and motor control of human gait: normal, elderly and pathological,
University of Waterloo Press, 2nd ed., 1991.

40
CHAPTER III
ADDENDUM TO MANUSCRIPT I
1. Prosthesis Design
Appendix A comprises of parts list for the prosthesis, socket load cell and able-bodied adaptor. The
focal point of the design of a powered prosthesis is the kinematic configuration of the actuators. The
actuators in this design is what provides the paradigm shift from previous prosthesis designs and the
actuators must be able to provide the necessary torques at the knee and ankle in order to provide the
increased functionality promised. The basic design crux of the kinematic configuration of the actuators is
to provide the greatest amount of torque capability in the smallest volumetric envelope. In order to find a
solution two approaches were explored; analytical and numerical. The analytical solution did not lead to a
finite solution due to complications in the nonlinear geometry. Instead, a numerical approach was chosen
and used in the final design of the leg. The numerical method used is described in Chapter 2.3 and the
Matlab M-file code is presented in Appendix B.
2. Socket Load Cell
The calibration graphs presented in Chapter 2.5 for the socket load cell were obtained using a fifth order
linear least squares fit to the raw data. Using the standard definition for least squares:

41
( ) YT⋅Φ⋅Φ=
−1
θ (1)
where,
=Φ
5
4
3
2
5
4
3
2
5
4
3
2
S
S
S
S
S
F
F
F
F
F
M
M
M
M
M
M
M
M
M
M
F
F
F
F
F
(2)
and
( )SF MMFY = (3)
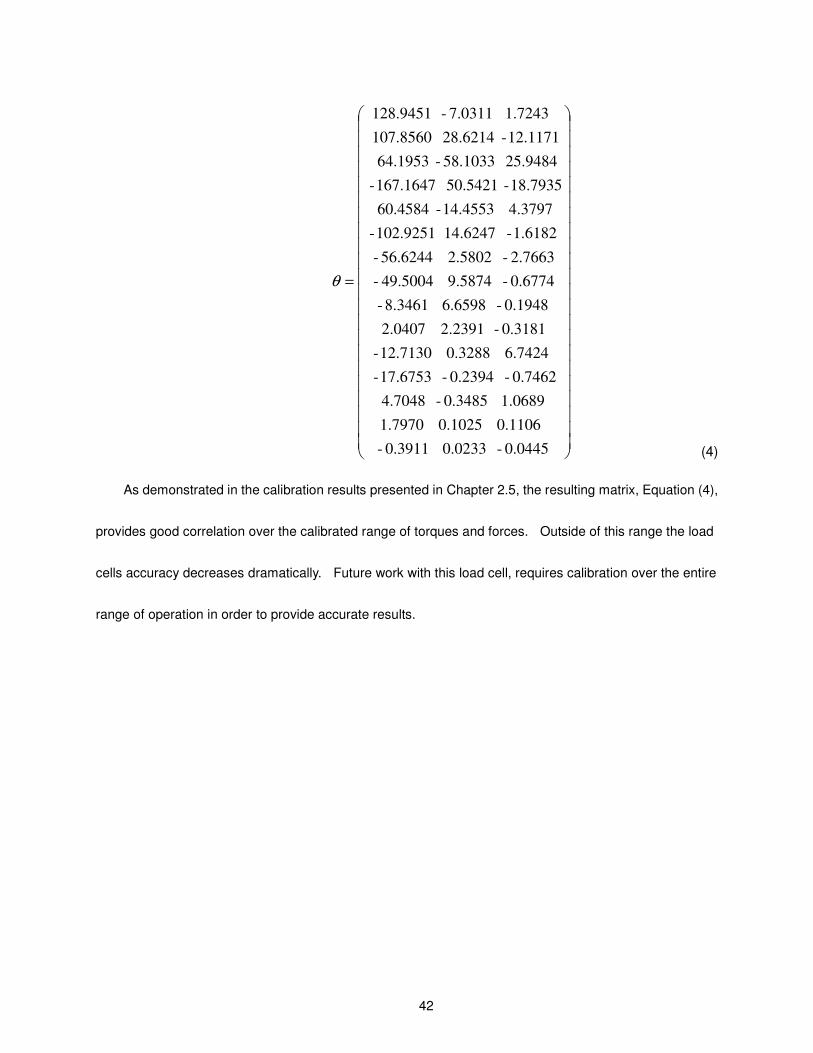
Using the calibration data in the linear least squares equation the following matrix results:
42
=
0.0445- 0.0233 0.3911-
0.1106 0.1025 1.7970
1.0689 0.3485- 4.7048
0.7462- 0.2394- 17.6753-
6.7424 0.3288 12.7130-
0.3181- 2.2391 2.0407
0.1948- 6.6598 8.3461-
0.6774- 9.5874 49.5004-
2.7663- 2.5802 56.6244-
1.6182- 14.6247 102.9251-
4.3797 14.4553- 60.4584
18.7935- 50.5421 167.1647-
25.9484 58.1033- 64.1953
12.1171- 28.6214 107.8560
1.7243 7.0311- 128.9451
θ
(4)
As demonstrated in the calibration results presented in Chapter 2.5, the resulting matrix, Equation (4),
provides good correlation over the calibrated range of torques and forces. Outside of this range the load
cells accuracy decreases dramatically. Future work with this load cell, requires calibration over the entire
range of operation in order to provide accurate results.

43
CHAPTER IV
MANUSCRIPT II: DESIGN AND CONTROL OF A POWERED TRANSFEMORAL PROSTHESIS
Frank Sup, Amit Bohara and Michael Goldfarb
Department of Mechanical Engineering
Vanderbilt University
Nashville, TN 37235
Submitted as a Full Paper to the
International Journal of Robotics Research
for consideration in the special issue on
Machines for Human Assistance and Augmentation

44
1. Abstract
The paper describes the design and control of a transfemoral prosthesis with powered knee and ankle
joints. The initial prototype is a pneumatically-actuated powered-tethered device, which is intended to
serve as a laboratory test bed for a subsequent self-powered version. After the design of the prosthesis is
described, a gait controller is proposed based on the use of passive impedance functions that coordinates
the motion of the prosthesis and user during level walking. The control approach is implemented on the
prosthesis prototype, and experimental results are shown that demonstrate the effectiveness of the active
prosthesis and control approach in restoring fully powered level walking to the user.
2. Introduction
2.1 Motivation
Despite significant technological advances over the past decade, such as the introduction of
microcomputer-modulated damping during swing, commercial transfemoral prostheses remain limited to
energetically passive devices. That is, the joints of the prostheses can either store or dissipate energy, but
cannot provide net power over a gait cycle. The inability to deliver joint power significantly impairs the ability
of these prostheses to restore many locomotive functions, including walking up stairs and slopes, running,
and jumping, all of which require significant net positive power at the knee joint, ankle joint, or both (Winter
and Sienko 1988, Nadeau et al. 2003, Riener et al. 1999, Prilutsky et al. 1996, DeVita et al. 1996, Nagano et
al. 1998, Jacobs et al. 1996). Further, although less obvious, even biomechanically normal walking
requires positive power output at the knee joint and significant net positive power output at the ankle joint
(Winter, 1991). Transfemoral amputees walking with passive prostheses have been shown to expend up

45
to 60% more metabolic energy relative to healthy subjects during level walking (Waters et al. 1976) and
exert as much as three times the affected-side hip power and torque (Winter 1991), presumably due to the
absence of powered joints. A prosthesis with the capacity to deliver power at the knee and ankle joints
would presumably address these deficiencies, and would additionally enable the restoration of
biomechanically normal locomotion. Such a prosthesis, however, would require 1) power generation
capabilities comparable to an actual limb and 2) a control framework for generating required joint torques
for locomotion while ensuring stable and coordinated interaction with the user and the environment. This
paper describes the authors’ progress to date in pursuing both of these goals. Specifically, section 2
presents the current prosthesis prototype design and discusses the means by which the authors intend to
convert this to a self-powered version; section 3 describes the control approach, and section 4 presents
experimental results that validate the hardware and control approach.
2.2 Background
Though the authors are not aware of any prior work on the development of a powered knee and ankle
prosthesis, prior work does exist on the development of powered knee transfemoral prostheses and
powered ankle transtibial prostheses. Regarding the former, Flowers (1973), Donath (1974), Flowers and
Mann (1977), Grimes et al. (1977), Grimes (1979), Stein (1983), and Stein and Flowers (1988) developed a
tethered electrohydraulic transfemoral prosthesis that consisted of a hydraulically actuated knee joint
tethered to a hydraulic power source and off-board electronics and computation. They subsequently
developed an “echo control” scheme for gait control, as described by Grimes et al. (1977), in which a
modified knee trajectory from the sound leg is played back on the contralateral side. In addition to this prior

46
work directed by Flowers, other groups have also investigated powered knee joints for transfemoral
prostheses. Specifically, Popovic and Schwirtlich (1988) report the development of a battery-powered
active knee joint actuated by DC motors, together with a finite state knee controller that utilizes a robust
position tracking control algorithm for gait control (Popovic et. al., 1995). With regard to powered ankle
joints, Klute et al. (1998, 2000) describe the design of an active ankle joint using pneumatic McKibben
actuators, although gait control algorithms were not described. Au et al. (2005) assessed the feasibility of
an EMG based position control approach for a transtibial prosthesis. Finally, though no published literature
exists, Ossur, a major prosthetics company based in Iceland, has announced the development of both a
powered knee and a self-adjusting ankle. The latter, called the “Proprio Foot,” is not a true powered ankle,
since it does not contribute power to gait, but rather is used to quasistatically adjust the angle of the ankle to
better accommodate sitting and slopes. The powered knee, called the “Power Knee,” utilizes an echo
control approach similar to the one described by Grimes et al. (1977).
Unlike any prior work, this paper describes a prosthesis design that consists of both a powered knee
and ankle, and describes a method of control that enables natural, stable interaction between the user and
the powered prosthesis. The control approach is implemented on the prosthesis prototype fit to a user,
and experimentally shown to provide powered level walking representative of normal gait.
3. Prosthesis Design
One of the most significant challenges in the development of a powered lower limb prosthesis is
providing self-powered actuation capabilities comparable to biological systems. State-of-the-art power
supply and actuation technology such as battery/DC motor combinations suffer from low energy density of

47
the power source (i.e., heavy batteries for a given amount of energy), low actuator force/torque density, and
low actuator power density (i.e., heavy motor/gearhead packages for a given amount of force or torque and
power output), all relative to the human musculoskeletal system. Recent advances in power supply and
actuation for self-powered robots, such as the liquid-fueled approaches described by Goldfarb et al. 2003,
Shields et al. 2006, Fite et al. 2006, and Fite and Goldfarb 2006, offer the potential of significantly improved
energetic characteristics relative to battery/DC motor combinations, and thus bring the potential of a
powered lower limb prosthesis to the near horizon. Specifically, the aforementioned publications describe
pneumatic-type actuators, which are powered by the reaction products of a catalytically decomposed liquid
monopropellant. The proposed approach has been experimentally shown to provide an energetic figure of
merit an order of magnitude greater than state-of-the-art batteries and motors (Shields et al. 2006, Fite and
Goldfarb 2006). Rather than construct a self-powered version directly, the authors have developed a
power-tethered version of the prosthesis, which enables laboratory-based controller development and
prosthesis testing. The self-powered version should be nearly identical to the power-tethered version, but
will include an on-board propellant cartridge and catalyst pack in place of the pneumatic tether. This
section describes the design of the power-tethered pneumatically actuated prosthesis prototype.
3.1 Design Specifications
The active joint torque specifications were based on the torque/angle phase space required for a 75 kg
user for fast walking and stair climbing, as derived from body-mass-normalized data from Winter (1991) and
Nadeau et al. (2003), respectively. Minimum range of motion was determined to be 110° of flexion for the
knee, and 45° of planterflexion and 20° of dorsiflexion for the ankle. Based on these desired specifications,

48
the joint actuators and their respective kinematic configurations were selected via a design optimization to
minimize the actuator volume that would achieve the desired phase space. The torque/angle phase space
for both joints for slow walking, fast walking, and stair climbing (for a 75 kg user), along with the active
torque envelope of the prosthesis, are shown in Fig. 1. The optimization resulted in the use of 3.8 cm (1.5
in) diameter cylinders for both knee and ankle joints to accommodate up to a 75 kg user. Note that heavier
users could easily be accommodated by slightly increasing the cylinder diameters (e.g., a 4.4 cm, or 1.75 in,
cylinder diameter would accommodate up to a 102 kg user).
Figure 4-1. Comparison of maximum torque capability of active joints to the torque requirement during
various gaits for a 75 kg normal user, based on an operating pressure of 2 MPa (300 psig).

49
Figure 4-2. The power-tethered prototype.
Figure 2 shows the resulting prosthesis prototype in a labeled photograph. Based on the previously
mentioned design optimization, the prosthesis incorporates a 7.6 cm (3 in) stroke, 3.8 cm (1.5 in) bore
double-acting pneumatic cylinder (Bimba model 17-3-DP), while the ankle joint incorporates a 7 cm (2.75 in)
stroke, 3.8 cm (1.5 in) bore double-acting cylinder (Bimba model 17-2.75-DP). Operating at 2 MPa (300
psig), the actuators are capable of producing 2270 N (510 lbf) of outward axial force, and 2070 N (465 lbf)
on the return. Each actuator is controlled via a four-way servovalve (Enfield Technologies LS-V05).
Sensors on the prosthesis include cylinder force sensors (which indirectly provide joint torque
measurement), joint angle sensors, and a custom 3-axis socket load cell that measures the axial force,
sagittal plane moment, and frontal plane moment at the interface between the prosthesis and socket. The
cylinder force sensors are uniaxial load cells (Honeywell Sensotec model 11) located in line with the

50
actuator piston rods. The ankle and knee joint angles are measured via integrated joint motion sensors
(ETI Systems model SP12S precision potentiometer), which are located inside the hollow axle and
composite plain bearings (Garlock model DU) in each joint. The custom 3-axis load cell, for measurement
of the interaction forces and moments between the user and prosthesis, is described subsequently.
The structural components of the prosthesis were designed to withstand a 2224 N (500 lbf) load and
maximum actuator joint torques. Safe stress conditions were verified using ProE Mechanica finite
element analysis (FEA) software. The results of these analyses indicate that 7075-T6 aluminum, which
has a minimum yield strength in excess of 500 MPa, provides a factor of safety between 1.7 and 3.7 for the
design conditions.
The powered prosthesis was designed to fit a broad range of different sized persons, ranging from two
standard deviations below the female norm in length, up to two standard deviations above the male norm in
length based on data from Gorden et al. (1989). The tibial length is varied by changing the single structural
(tibia) tube and the clamping supports for the actuators allow for adjustment to achieve the recommended
spacing as dictated by the kinematic configuration optimization. The foot is a low profile prosthetic foot
(Otto Bock Lo Rider), with typical sizes available. Additionally, the ankle joint and the 3-axis socket load
cell incorporate standard pyramid connectors for coupling the prosthesis to the feet and socket, thus
enabling a high degree of adjustment in the knee and ankle alignment, as is standard in transfemoral
prostheses. Combined with the Otto Bock Lo Rider foot, which weighs 0.37 kg (0.8 lbf), the total weight of
the tethered transfemoral prosthesis with pyramid connectors is 2.65 kg (5.8 lbf), which is within the normal
and acceptable range for transfemoral prostheses and less than a comparable normal limb segment
(Clauser et al., 1969). An untethered version is expected to add an additional 0.9 kg (2 lbf) of weight,

51
which maintains the prosthesis within an acceptable weight range.
4. Load Cell Design
For purposes of prosthesis control and user intent recognition, the prosthesis incorporates a load cell
between the prosthesis and user, which measures the interaction forces and moments. Based on the data
presented in Winter (1991) and Nadeau (2003), the required range of measurement for the load cell was
determined to be 1000 N of axial force (i.e., along the socket) and 100 N-m of sagittal and frontal plane
moments. Relative to commercially available multi-axis load cells (e.g., ATI and JR3), this combination of
force and moment is disproportionately weighted toward the moment measurement, and thus would require
load cells that are much larger than could be realistically implemented in a prosthetic leg. As such, a
custom load cell was designed and fabricated. The basis of the load cell design is a crossed beam spring
element, as shown in Fig. 3. The design objective was thus to provide similar strain sensitivities for the
axial load and moments (e.g., approximately 1000 microstrain for metal foil gages) for the desired applied
force and moment ranges. In order to achieve similar magnitudes, a double cross configuration was
developed (as shown in Fig. 4) in order to effectively separate, via a pair of connected crosses, the
fundamental mechanisms by which the moment and axial forces are measured. The moment is
counteracted by a force couple transmitted by a connecting rod, which loads the beams in tension and
compression, while the force is counteracted by loading the beams in bending. The different mechanisms
of loading allow the relative geometry of the pair to be manipulated to generate similar strain sensitivity to
the desired force and moments. Based on appropriate analytical descriptions of strain, the double load cell
was optimized for the smallest overall device size. The resulting strains were then verified via a ProE

52
Mechanica finite element analysis.
The resulting design, which is shown in Fig. 5, consists of two single crosses separated by a distance
and rigidly held together by a housing on the outside and load transmitter in the center. The device was
fabricated from a combination of stainless steel and aluminum using the actual cross design as depicted in
Fig. 3, and has a total mass of 360 g. The load cell was calibrated utilizing a least squares method to
obtain the transformation matrix between the vector of applied forces and moments and the vector of strain
gage outputs, based on a fifth-order polynomial. Coupling between load cell axes produces a maximum
error of 2.2% of full scale output (FSO) in the axial force measurement, a maximum error of 6.7% FSO in the
sagittal moment measurement, and a maximum error of 5.5% FSO in the frontal moment measurement.
Figure 4-3. Ideal versus actual beam patterns of the socket load cell.

53
Figure 4-4. Regions of compression (C) and tension (T) in a sectional view of the double cross for an
applied force, F, and moment, M for the socket load cell. Subscripts denote loading responsible for the
compression and tension.
Figure 4-5. Assembled and exploded views of the socket load cell.
5. Gait Control Strategy
The previously described prosthesis is a fully powered two degree-of-freedom robot, capable of
significant joint torque and power, which is rigidly attached to a user. As such, the prosthesis necessitates
a reliable control framework for generating required joint torques while ensuring stable and coordinated

54
interaction with the user and the environment.
The overarching approach in all prior work has been to generate a desired joint position trajectory,
which by its nature, utilizes the prosthesis as a position source. Such an approach poses several problems
for the control of a powered transfemoral prosthesis. First, the desired position trajectories are typically
computed based on measurement of the sound side leg trajectory, which 1) restricts the approach to only
unilateral amputees, 2) presents the problem of instrumenting the sound side leg, and 3) generally
produces an even number of steps, which can present a problem when the user desires an odd number of
steps. A subtler yet significant issue with position-based control is that suitable motion tracking requires a
high output impedance, which forces the amputee to react to the limb rather than interact with it. Specifically,
in order for the prosthesis to dictate the joint trajectory, it must assume a high output impedance (i.e., must
be stiff), thus precluding any dynamic interaction with the user and the environment.
Unlike prior works, the approach proposed herein utilizes an impedance-based approach to generate
joint torques. Such an approach enables the user to interact with the prosthesis by leveraging its dynamics
in a manner similar to normal gait (Mochon and McMahon, 1980), and also generates stable and
predictable behavior. The essence of the approach is to characterize the knee and ankle behavior with a
series of finite states consisting of passive spring and damper behaviors, wherein energy is delivered to the
user by switching between appropriate equilibrium positions (of the virtual springs) in each finite state. In
this manner, the prosthesis is guaranteed to be passive within each gait mode, and thus generates power
simply by switching between modes. Since the user initiates mode switching, the result is a predictable
controller that, barring input from the user, will always default to passive behavior.

55
5.1 Impedance Characterization of Gait
Based loosely on the notion of impedance control proposed by Hogan (1985), the torque required at
each joint during a single stride (i.e., a single period of gait) can be piecewise represented by a series of
passive impedance functions. A regression analysis of gait data from Winter (1991) indicates that joint
torques can be sufficiently characterized by functions of joint angle and velocity by the simple impedance
model
θθθθθτ &bkk ee +−+−=3
21 )()( (1)
Specifically, the joint torques within each gait mode can be described by the combination of linear and cubic
stiffness terms, together with a linear damping term, where k1 and k2 characterize the linear and cubic
stiffnesses, eθ is the equilibrium angle, b is the linear damping coefficient, and the angle, θ, and torque, τ,
are defined as in Fig. 6. If the coefficients b, k1, and k2 are constrained to be positive, then the joint will
exponentially converge to a stable equilibrium at eθθ = and 0=θ& within each gait mode. That is, in any
given mode, the behavior is passive, and will come to rest at a local equilibrium, thus providing a reliable
and predictable behavior for the human user.

56
Figure 4-6. Joint angle and torque convention used. Positive torque defined in the direction of
increasing angle.
5.2 Gait Modes
As previously discussed, the decomposition of joint behavior into passive segments requires dividing
the gait cycle into modes or “finite states,” as dictated by their functions and the character of the piecewise
segments of the impedance functions previously described. Though the number of modes required is not
unique, the switching rules between modes must be well defined and measurable, and the number of
modes should be sufficient to provide an accurate representation of normal joint function. One can
reasonably assert that the swing and stance phase of gait constitute a minimal set of modes for the
proposed approach. Based on least squares regression fitting of gait data (i.e., from Winter, 1991) to
equation (1), the authors determined that such fits were improved significantly by further dividing swing and
stance into two sub-modes, as shown in Fig. 7, with switching rules as shown in Fig. 8.
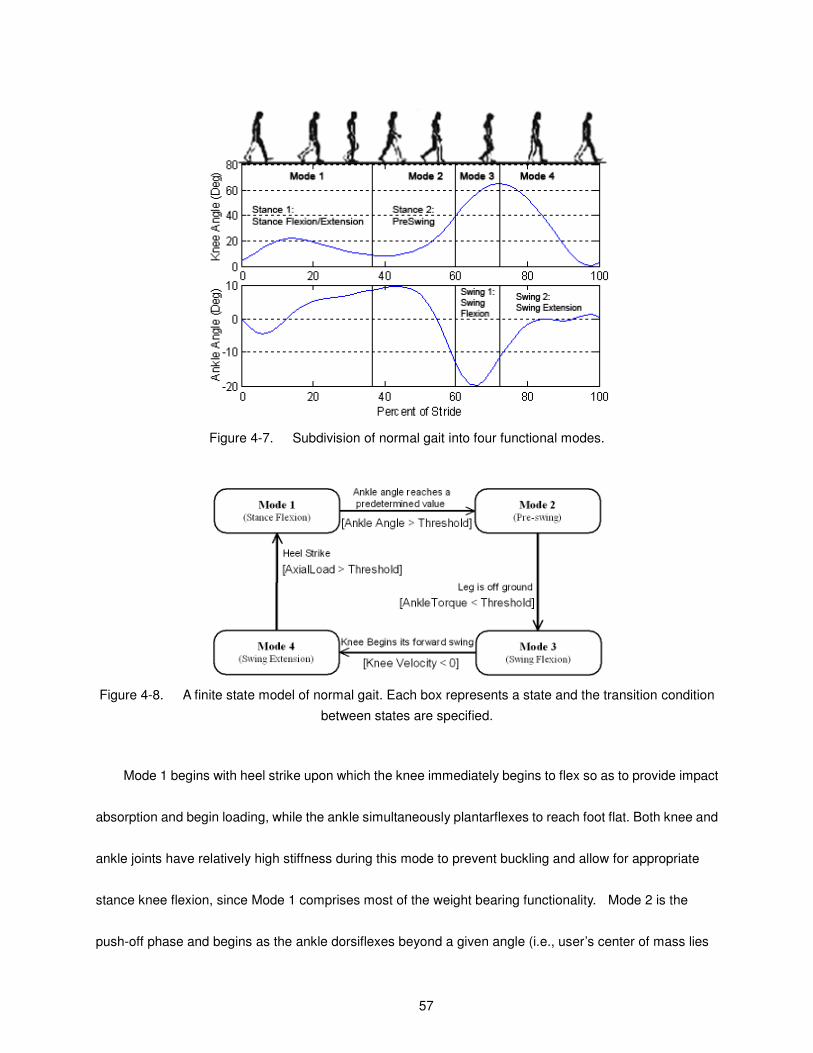
57
Figure 4-7. Subdivision of normal gait into four functional modes.
Figure 4-8. A finite state model of normal gait. Each box represents a state and the transition condition
between states are specified.
Mode 1 begins with heel strike upon which the knee immediately begins to flex so as to provide impact
absorption and begin loading, while the ankle simultaneously plantarflexes to reach foot flat. Both knee and
ankle joints have relatively high stiffness during this mode to prevent buckling and allow for appropriate
stance knee flexion, since Mode 1 comprises most of the weight bearing functionality. Mode 2 is the
push-off phase and begins as the ankle dorsiflexes beyond a given angle (i.e., user’s center of mass lies

58
forward of stance foot). The knee stiffness decreases in this mode to allow knee flexion while the ankle
provides a plantarflexive torque for push off. Mode 3 begins as the foot leaves the ground as indicated by
the ankle torque load cell and lasts until the knee reaches maximum flexion. Mode 4 is active during the
extension of the knee joint (i.e., as the lower leg swings forward) which begins as the knee velocity
becomes negative and ends at heel strike (as determined by the 3-axis load cell). In both the swing modes,
the ankle torque is small and is represented in the controller as a (relatively) weak spring regulated to a
neutral position. The knee is primarily treated as a damper in both swing modes (Mode 3 and 4).
The proposed approach to “impedance modeling” of joint torques was preliminarily validated by
utilizing the gait data of a healthy 75 kg subject, as derived from body-mass-normalized data from Winter
(1991). Incorporating the four gait modes previously described, along with the motion and torque data for
each joint provided by Winter (1991), a constrained least squares optimization was conducted to generate a
set of parameters for equation (1) in each mode. The resulting parameter set is listed for each mode in
Table 1, and the resulting fit to joint torques is shown graphically in Fig. 9. The fit shown in Fig. 9 clearly
indicates that normal joint function can be represented by the use of piecewise passive functions as
proposed.

59
Figure 4-9. Piecewise fitting of knee and ankle torques during normal speed level walk (averaged
population data from Winter, 1991 scaled for a 75 kg adult) to a nonlinear spring-damper impedance model.
The number shown in each mode represents the mean ratio of the stiffness forces to damping forces
predicted by the fit. The vertical lines represent the segmentation of a gait stride into four distinct modes.
Table 4-1. Impedance parameters for prototypical gait (gait data from Winter, 1991).
Knee Impedance Ankle Impedance
Mode 1k
(N.m/deg))
2k
(N.m/deg3)
b
(N.m.s) eθ
(deg)
1k
(N.m/deg))
2k
(N.m/deg3)
b
(N.m.s) eθ
(deg)
1 3.78 73e-3 25e-3 12 1.35 25e-3 0.118 -5
2 0 9e-6 30e-3 37 4.50 0 5e-3 -18
3 0 9e-3 16e-3 52 0.04 0 3e-3 23
4 0.093 2e-6 13e-3 44 0.134 0 2e-3 2
6. Experimental Results
The impedance based gait control strategy was implemented on the tethered prosthesis prototype on a

60
healthy subject using an able-bodied testing adaptor as shown in Fig. 10. The adaptor consists of a
commercial adjustable locking knee immobilizer (KneeRANGER-Universal Hinged Knee Brace) with an
adaptor bracket that transfers load from the subject to the prosthesis. Since the prosthesis remains lateral
to the immobilized leg of the healthy subject, the adaptor simulates transfemoral amputee gait without
geometric interference from the immobilized leg. While the adapter allows for preliminary testing of the gait
control algorithm, the setup does involve certain drawbacks in simulating prosthetic gait, some of which
include 1) compliance of the soft tissue interface between the device and user (more so than exhibited by a
limb/socket interface), 2) “parasitic” inertia of the intact lower limb (i.e., in addition to the inertia of the
prosthesis), and 3) asymmetry in the frontal and axial planes which results in a larger than normal planar
moments (i.e., as seen in Fig 10). Despite these, the adaptor provides a reasonable facsimile of amputee
gait, and enables testing of the device and proposed impedance-based control approach.
Figure 4-10. Able-bodied testing adaptor for enabling development, testing, and evaluation of the
prosthesis and controllers prior transfemoral amputee participation.
The prosthesis was tethered to a 2 MPa (300 psig) pressure source (i.e., compressed nitrogen) and to a
controller implemented via a desktop PC with the real-time interface provided by MATLAB Real Time
Workshop. Gait trials were performed on a treadmill, which provided a controlled walking speed and

61
enabled enhanced safety monitoring, including a safety suspension harness and the use of handrails.
Unlike the parameter tuning shown in Table 1 and Fig. 9, the gait data for the prosthesis and user did not
exist a priori. As such, the parameters shown in Table 1 were used as a starting point, and the parameters
were tuned to the user via a combination of joint sensor data, video recordings and user feedback. For
example, if the user felt that a joint was not generating necessary torques during support or push off, the
stiffness would be increased or the stiffness set point altered. With this iterative process, the impedance
functions were tuned, finally resulting in the set indicated in Table 2. Based on this parameter set, the
(measured) prosthesis joint angles and torques during level treadmill walking at 0.675 m/s (1.5 mph) are
shown in Figures 11 and 12.
Table 4-2. Impedance parameters derived by experimental tuning.
Mode Knee Impedance Ankle Impedance
1k
(N.m/deg))
2k
(N.m/deg3)
b
(N.m.s) eθ
(deg)
1k
(N.m/deg))
2k
(N.m/deg3)
b
(N.m.s) eθ
(deg)
1 7.5 0 0 14 4.5 0 0 -8
2 1.0 0.006 0 16 4.5 0 0 -25
3 0 0 0.005 0 0.5 0 0 0
4 0.08 0 0.08 30 0.75 0 0 -3

62
Figure 4-11. Measured joint angles (degrees) for six consecutive gait cycles for a treadmill walk (1.5mph).
Figure 4-12. Measured joint torques ( N.m ) for six consecutive gait cycles for a treadmill walk.
In comparing the knee and ankle angles and torques of Figs. 11 and 12 to the prototypical data from Winter
(1991) (shown in Figs. 7 and 9), one can observe that the powered prosthesis and controller provide
behavior quite similar to normal gait, except in the knee behavior during the first 20% of the stride (i.e., just
after heel strike). The difference in behavior during this period is most likely a result of the significant
compliance between the adaptor and user. Specifically, the role of the knee during this period is to flex
slightly upon impact, which absorbs energy and cushions the impact of heel strike. As such, the knee acts
effectively as a stiff spring, first absorbing the energy of impact and shortly after returning this energy to the

63
user. When used with the adaptor, this knee stiffness acts in series with the (much lower) stiffness of the
user/adaptor interface, and thus the cushioning role of knee flexion during heel strike is dominated by the
compliance in the user/adaptor interface. This behavior is evident by watching the relative motion between
the top of the brace and the subject’s hip during heel strike. The authors assume that once the axial
compliance between the user and prosthesis is reduced significantly (as would be the case with an
amputee subject), the knee joint will exhibit the flexion and subsequent extension evidenced in the
prototypical gait kinematics of Fig. 7.
The knee and ankle joint powers, which were computed directly from the torque and differentiated
angle data, are shown in Fig. 13, and indicate that the prosthesis is supplying a significant amount of power
to the user. Note that the measured power compares favorably to that measured for healthy subjects (see
Winter, 1991), and thus indicates an enhanced level of functionality relative to existing passive prostheses.
Figure 4-13. Averaged measured joint powers (W) for six consecutive gait cycles for a treadmill walk.
7. Conclusion
This paper described the design and control of a tethered pneumatically actuated transfemoral

64
prosthesis. The prosthesis design was optimized to provide the requisite joint torque/angle requirements
with a minimum volume actuator configuration. The control approach segments the gait cycle into four
modes and utilizes a passive impedance characterization of each mode to generate the required torques for
the knee and ankle joints during walking. The approach was validated against normal gait data and
through experimental testing with an able-bodied adaptor. Test results showed the prosthesis was able to
produce a near-normal gait pattern, deliver required joint torques, and supply a significant amount of power
to the user.
8. References
Au, S. Bonato, P., Herr, H., “An EMG-Postion Controlled System for an Active Ankle-Foot Prothesis: An
Initial Experimental Study,” Proceedings of the IEEE Int Conf. on Rehabilitation Robotics, pp. 375-379,
2005.
Clauser CE, McConville JT, Young JM, “Weight, volume and center of mass of segments of the human body.
AMRL-TR-69-70, Wright Patterson Airforce Base, Dayton, Ohio, 1969.
DeVita, P., Torry M., Glover, K.L., and Speroni, D.L.,“A Functional Knee Brace Alters Joint Torque and
Power Patterns during Walking and Running,” Journal of Biomechanics, vol. 29, no. 5, pp. 583-588,
1996.
Donath, M., “Proportional EMG Control for Above-Knee Prosthesis’, Department of Mechanical
Engineering Masters Thesis, MIT, 1974.
Fite, K.B., and Goldfarb, M. Design and Energetic Characterization of a Proportional-Injector
Monopropellant-Powered Actuator, IEEE/ASME Transactions on Mechatronics, vol. 11, no. 2, pp.
196-204, 2006.
Fite, K.B., Mitchell, J., Barth, E.J., and Goldfarb, M. A Unified Force Controller for a Proportional-Injector
Direct-Injection Monopropellant-Powered Actuator, ASME Journal of Dynamic Systems, Measurement
and Control, vol. 128, no. 1, pp. 159-164, 2006.
Flowers, W.C., “A Man-Interactive Simulator System for Above-Knee Prosthetics Studies, Department of
Mechanical Engineering PhD Thesis, MIT, 1973.

65
Flowers, W.C., and Mann, R.W., “Electrohydraulic knee-torque controller for a prosthesis simulator,” ASME
Journal of Biomechanical Engineering, vol. 99, no. 4, pp. 3-8., 1977.
Goldfarb, M., Barth, E.J., Gogola, M.A. and Wehrmeyer, J.A., “Design and Energetic Characterization of a
Liquid-Propellant-Powered Actuator for Self-Powered Robots.,” IEEE/ASME Transactions on
Mechatronics, vol. 8, no. 2, pp. 254-262, 2003.
Gordon, CC, B. Bradtmiller, T. Churchill, C.E. Clauser, J.T. McConville, I. Tebbetts and R. Walker, “1988
Anthropometric Survey of US Army Personnel: Methods and Summary Statistics,” Technical Report
NATICK/TR-89/044, U.S. Army Natick Research, Development and Engineering Center, Natick, MA,
1989.
Grimes, D. L., “An Active Multi-Mode Above Knee Prosthesis Controller. Department of Mechanical
Engineering PhD Thesis, MIT., 1979.
Grimes, D. L., Flowers, W. C., and Donath, M., “Feasibility of an active control scheme for above knee
prostheses. ASME Journal of Biomechanical Engineering, vol. 99, no. 4, pp. 215-221, 1977.
Hogan, N., Impedance Control: An approach to manipulation: Part 1 - theory, Part 2 - Implementation, and
Part 3 - Applications, ASME Journal of Dynamic Systems, Measurement and Control, vol. 107, pp. 1-24,
1985.
Jacobs, R., Bobbert, M.F., van Ingen Schenau, G.J.; “Mechanical output from individual muscles during
explosive leg extensions: the role of biarticular muscles,” Journal of Biomechanics, vol. 29, no. 4, pp.
513-523, 1996.
Klute, G.K., Czerniecki, J., Hannaford, B., “Development of Powered Prosthetic Lower Limb, Proceedings of
the First National Meeting, Veterans Affairs Rehabilitation Research and Development Service, 1998.
Klute, G.K., Czerniecki, J., Hannaford, B., “Muscle-Like Pneumatic Actuators for Below-Knee Prostheses,
Proceedings the Seventh International Conference on New Actuators, pp. 289-292, 2000.
Mochon, S., and McMahon, T.A. Ballistic Walking, Journal of Biomechanics, vol. 13, no. 1, pp. 49-57,
1980.
Nadeau, S., McFadyen, B.J., and Malouin, F., “Frontal and sagittal plane analyses of the stair climbing task
in healthy adults aged over 40 years: What are the challenges compared to level walking?,” Clinical
Biomechanics, vol. 18, no. 10, pp. 950-959., 2003.
Nagano, A., Ishige, Y., and Fukashiro, S., “Comparison of new approaches to estimate mechanical output
of individual joints in vertical jumps,” Journal of Biomechanics, vol. 31, no. 10, pp. 951-955, 1998.
Popovic, D. and Schwirtlich, L., “Belgrade active A/K prosthesis, “ in de Vries, J. (Ed.), Electrophysiological
Kinesiology, Interm. Congress Ser. No. 804, Excerpta Medica, Amsterdam, The Netherlands, pp.

66
337–343, 1988.
Popovic D, Oguztoreli MN, Stein RB., “Optimal control for an above-knee prosthesis with two degrees of
freedom,” Journal of Biomechanics, vol. 28, no. 1, pp. 89-98, 1995.
Prilutsky, B.I., Petrova, L.N., and Raitsin, L.M., “Comparison of mechanical energy expenditure of joint
moments and muscle forces during human locomotion,” Journal of Biomechanics, vol. 29, no. 4, pp.
405-415, 1996.
Riener, R., Rabuffetti, M., and Frigo, C., “Joint powers in stair climbing at different slopes.”, Proceedings of
the IEEE International Conference on Engineering in Medicine and Biology, vol. 1, p. 530., 1999.
Shields, B.L., Fite, K., and Goldfarb, M. Design, Control, and Energetic Characterization of a Solenoid
Injected Monopropellant Powered Actuator, IEEE/ASME Transactions on Mechatronics, vol. 11, no. 4,
pp. 477-487, 2006.
Stein, J.L., “Design Issues in the Stance Phase Control of Above-Knee Prostheses,” Department of
Mechanical Engineering PhD Thesis, MIT, 1983.
Stein, J.L., and Flowers, W.C., “Stance phase control of above-knee prostheses: knee control versus SACH
foot design,” Journal of Biomechanics, vol. 20, no. 1, pp. 19-28, 1988.
Waters, R., Perry, J., Antonelli, D., and Hislop, H., “Energy cost of walking amputees: the influence of level
of amputation,” J. Bone and Joint Surgery. 58A, 42–46, 1976.
Winter, D. A. and Sienko, S. E., “Biomechanics of below-knee amputee gait,” J. Biomechanics. 21,
361–367., 1988.
Winter, D.A., “The biomechanics and motor control of human gait: normal, elderly and pathological,”
University of Waterloo Press, 2nd ed. , 1991.

67
CHAPTER V
ADDENDUM TO MANUSCRIPT II
1. Experimental Testing Setup
In order to validate the integrity of the leg and control systems, a two-fold laboratory setup was
implemented. First, to test the structural integrity of the prosthesis and to tune the torque controller a fixed
mount was employed as in Figure 5-1.
Figure 5-1. Picture of fixed mount setup.
The second part of the testing was completed using the able-bodied adaptor before actual subject

68
testing on amputees. In order to provide a controlled environment for assessment and tuning of the device,
a treadmill was employed along with safety devices (i.e. support harness and handrails). The overall setup
is presented in Figure 5-2.
Figure 5-2. Picture of treadmill testing setup.
2. Electronics boards
2.1 On-board Analog Circuit Board
The transfemoral prosthesis was designed to house a small onboard analog electronics board
measuring (0.78” x 5.20”) within the shank tubing. The purpose of the board is to provide a central bus for
power and ground, signal routing, buffering and amplification for all onboard sensors. All signals and
power are routed to and from the board through a 50 ft. round jacket flat cable tether (3M model 3759/26)
with wire layout in Appendix C-1. The central bus functionality distributes +15 and –15 volts and ground to
the board. On the board two voltage regulating diodes are used to supply +10 and +5V to the sensors. To
mitigate noise issues in small signal output from load cells the board amplifies the signals from the ankle

69
and knee torque load cells and for each of the three axes of the socket load cell. Finally, the board buffers
the output of the knee and ankle potentiometers. The complete schematic and accompanying layout and
trace diagrams for the onboard analog circuit are presented in Appendix C-2. The final board was
designed with ExpressPCB software and manufactured by ExpressPCB.
2.2 Off-board Analog Circuit Board
The functionality of the off-board circuit board is two-fold. The first use is to route the signals between
the prosthesis via the tether to the computer. For the prosthesis it provides filtering for the ankle and knee
torque sensors, analog differentiation of the position signals, and a servo amplifier. The servo amplifier is
design to proportionally output ±1 amp from an input signal ranging from ±10V. The second function of the
board is to route signals from a sound leg sensor package consisting of foot switches, potentiometers and a
gyroscope. The schematics and layout for the off board circuit are presented in Appendix C-3.
3. Control and Tuning
The control of the prosthesis involves controlling the position and torques at the knee and ankle joints
and involves two nested loops. The inner loop is a PID torque controller and the outer loop outputs a
desired torque generated by the impedance based control approach outlined in Chapter IV and further
explained in Bohara (2006). The approach was implemented using Matlab Simulink and Real-Time
Workshop and the models for the knee and ankle joint control can be found in Appendix D.
Once the control loops were implemented the gains appropriate gains were determined experimentally
by starting with the torque control gains. With the prosthesis in a fixed mount setup and with the motion of

70
the prosthesis constrained physically by a person, the torque controller was tuned with sine wave torque
input with maximum amplitude of 30 Nm and frequency of 1.0 Hz. The resulting gains of the tuning are
presented in Table 5-1 and the tracking data in Figures 5-3 and 5-4. As an additional test of the torque
tracking capabilities of the device the stiffness tracking of knee and ankle joints is presented in Figures 5-5
and 5-6. The data was obtained experimental using the impedance based controller by Bohara (2006) by
a user walking with the able bodied adaptor. As demonstrated in the plots and degree of alignment is
present between the actual and desired stiffnesses, proving the capability of the device to generate the
desired torques. It should be noted in Figure 5-5 that the ankle is capable of producing the 100 Nm of
torque dictated by biomechanical data.
Table 5-1. PID control gains for force control loop.
Mode Ankle Joint Knee Joint
Proportional 0.01 0.01
Integral 0 0
Derivative 0 0
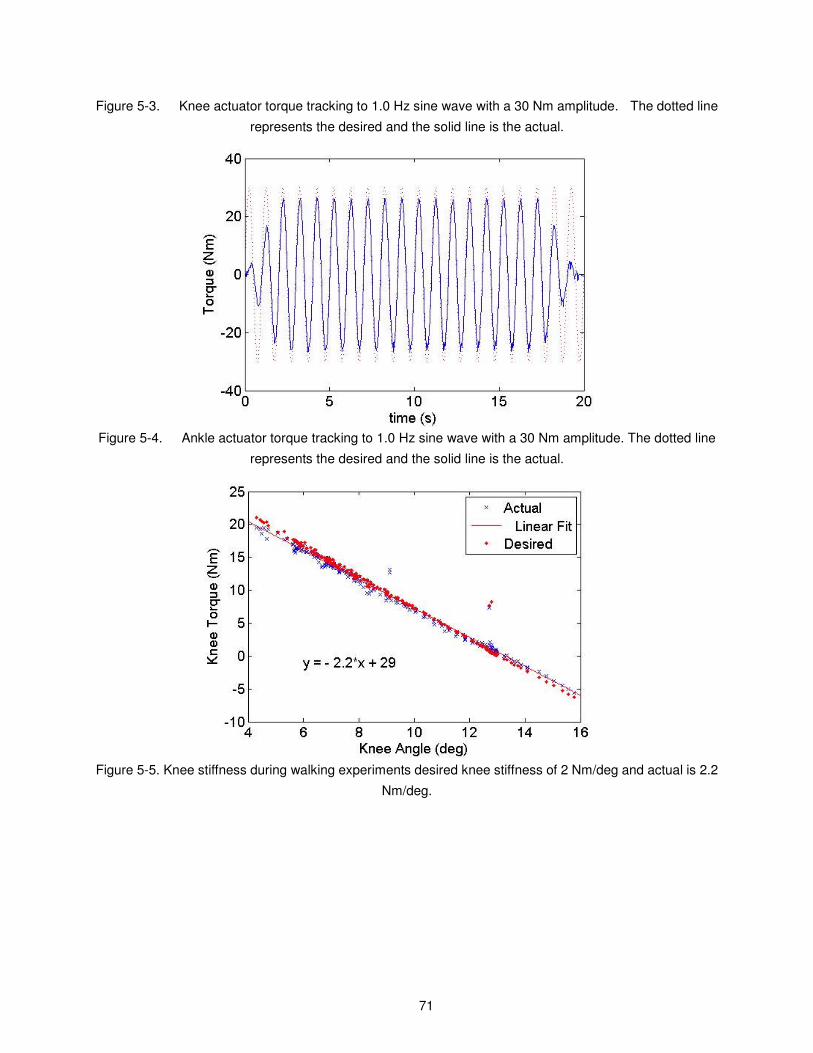
71
Figure 5-3. Knee actuator torque tracking to 1.0 Hz sine wave with a 30 Nm amplitude. The dotted line
represents the desired and the solid line is the actual.
Figure 5-4. Ankle actuator torque tracking to 1.0 Hz sine wave with a 30 Nm amplitude. The dotted line
represents the desired and the solid line is the actual.
Figure 5-5. Knee stiffness during walking experiments desired knee stiffness of 2 Nm/deg and actual is 2.2
Nm/deg.

72
Figure 5-6. Ankle stiffness in walking experiments desired ankle stiffness of 4.5 Nm/deg and actual is 4.3
Nm/deg.
4. Design Review
This thesis represents the first approach at a powered knee and ankle transfemoral prosthesis. The
initial qualitative assessment of the leg in conjugation with the data presented in this thesis is that the
prosthesis is capable of performing the required tasks of a powered lower limb prosthesis. Throughout
the initial assessment of the prototype notes were made regarding functionalities of the leg and are
presented in Table 5-2.
Table 5-2. Design Improvement Summary
Functionality/
Component
Comment Recommendation
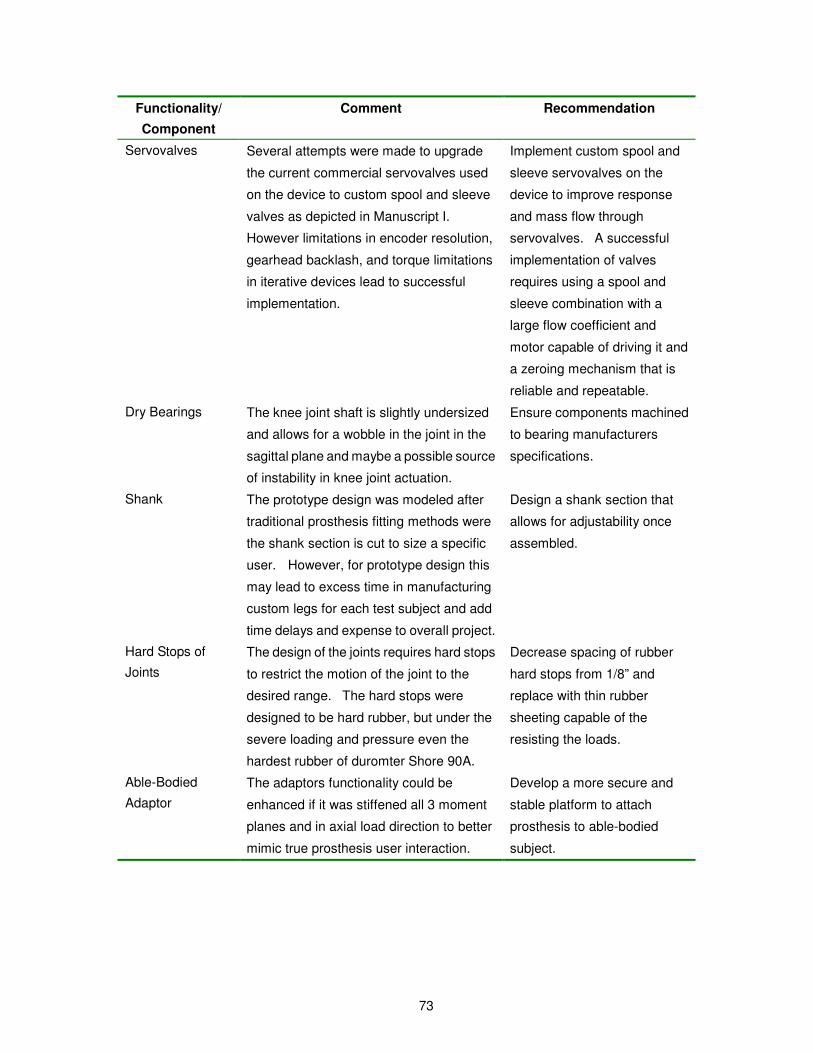
73
Functionality/
Component
Comment Recommendation
Servovalves Several attempts were made to upgrade
the current commercial servovalves used
on the device to custom spool and sleeve
valves as depicted in Manuscript I.
However limitations in encoder resolution,
gearhead backlash, and torque limitations
in iterative devices lead to successful
implementation.
Implement custom spool and
sleeve servovalves on the
device to improve response
and mass flow through
servovalves. A successful
implementation of valves
requires using a spool and
sleeve combination with a
large flow coefficient and
motor capable of driving it and
a zeroing mechanism that is
reliable and repeatable.
Dry Bearings
The knee joint shaft is slightly undersized
and allows for a wobble in the joint in the
sagittal plane and maybe a possible source
of instability in knee joint actuation.
Ensure components machined
to bearing manufacturers
specifications.
Shank
The prototype design was modeled after
traditional prosthesis fitting methods were
the shank section is cut to size a specific
user. However, for prototype design this
may lead to excess time in manufacturing
custom legs for each test subject and add
time delays and expense to overall project.
Design a shank section that
allows for adjustability once
assembled.
Hard Stops of
Joints
The design of the joints requires hard stops
to restrict the motion of the joint to the
desired range. The hard stops were
designed to be hard rubber, but under the
severe loading and pressure even the
hardest rubber of duromter Shore 90A.
Decrease spacing of rubber
hard stops from 1/8” and
replace with thin rubber
sheeting capable of the
resisting the loads.
Able-Bodied
Adaptor
The adaptors functionality could be
enhanced if it was stiffened all 3 moment
planes and in axial load direction to better
mimic true prosthesis user interaction.
Develop a more secure and
stable platform to attach
prosthesis to able-bodied
subject.

74
Functionality/
Component
Comment Recommendation
3-Axis Socket
Load Cell
The socket load cell design as-is is prone
slippage due to axial torques.
Physical mating and
asymmetry of pieces of the
cross, load transmitter and
pyramid adaptor could assist
and resisting the load.
5. References
Bohara, Amit, “Finite State Impedance Based Control of Powered Transfemoral Prosthesis” Department of
Mechanical Engineering Masters Thesis, Vanderbilt University, 2006.

75
APPENDIX A
PARTS LISTS
Table A-1. Prosthesis Prototype Components
Part
No.
Name Description File Name
1 Leg Assembly Main Leg Assembly file LEG-V2.asm
2 Shank Main support for leg. TUBE_LEG.prt
3
Joint Tube
Connector
Connects joint to tube.
JOINT_TUBE_CONNECTER.prt
4
Joint Angle Bracket Cantilever joint
support. JOINT_ANGLE_BRACKET.prt
5
Joint Axle and Pot
Housing
Integrated pot housing
in joint axle. JOINT_AXLE_POT_HOUSING.prt
6
Garlock Dry
Bearings
Garlock BB2017DU
Bearing GARLOCK_BEARING_BB2017DU.prt
7
Snap Ring ¾” Snap ring, holds
outer joint race on to
joint axle. SNAP_RING_3_4.prt
8
Potentiometers ETI Systems – SP12S
– 10K HONEYWELL_POT_.prt
9
Ankle Joint Outer
Race
N/a CANTILEVER_KNEE_OUTER_RACE.
prt
10
Knee Joint Mount Connector between
knee outer race and
socket load cell.
CANTILEVER_KNEE_JOINT_MOUNT.
prt
11
Joint Race End Cap End cap attaches to
outer joint race and
attachment point for
potentiometer.
CANTILEVER_JOINT_RACE_ENDCA
P.prt
12
Rubber Bumper 95 Shore A rubber to
provide mechanical
stop for joint rotation. BUMPER.prt

76
Part
No.
Name Description File Name
13
Ankle Joint Outer
Race
N/a CANTILEVER_ANKJOINT_OUT_RAC
E.prt
14
Female Pyramid
Slider
Standard Female slider
connector integrated
into ankle joint FEMALE_PRYIMADSLIDER.prt
15
Ankle Clamp Attaches ankle cylinder
to shank ANKLE__CLAMP.prt
16
Knee Clamp Attaches knee cylinder
to shank KNEE_CLAMP2PRT.prt
17
Clamp Pin Pivot pin between
cylinder and clamp CLAMP__PIN.prt
18
Clevis Pin Pivot pin between
cylinder and clevis CLEVIS_PIN.prt
19
Ankle Cylinder Bimba 1.5” Cylinder
part: 17-2.75-DP 15_275_PISTONCYLINDAR.prt
20
Knee Cylinder Bimba 1.5” Cylinder
part: 17-3-DP 15_3_PISTONCYLINDAR.prt
21
Load Cell Honeywell Sensotec
Model 31 ELPS-T3.prt
22
Clevis Ankle Clevis – Bimba
Part no: D-166-3 ROD_CLEVIS_25.prt
23 Clevis Knee Clevis - Custom ROD_CLEVIS_25_LONG.prt
24
Lo Rider Foot w/
cosmesis covering
Otto Bock Lo Rider
Foot sizes (25, 28) FLEX_FOOT_AXIA_.prt
Table A-2. Socket Load Cell Components
Part No. Name Description File Name
1 Socket Load Cell Assembly file MALCROSS_CIRLC.asm
1 Cross Pattern Disc N/a MALCROSS_CIR
2 Load Transmitter N/a MC_ROD
3 Housing N/a MALCROSS_HOUSE
4 Base N/a MALCROSS_CIRCLE_MOUNT.prt
5 Spacer N/a MC_TOPMOUNT.prt
6 Pyramid Connector Standard pyramid
connector milled to
specs.
PYRAMID_DISK_.prt

77
Part No. Name Description File Name
7 Strain Gages
Part no.
EA-06-125AC-350
Vishay
Micromeasurements
Linear Pattern Gage
n/a
Table A-3. Able-Bodied Adaptor Components
Part No. Name Description File Name
1 Knee Immobilizer Part No.
WM-94001
KneeRanger – Universal
Hinged Knee Brace,
Large
n/a
2 Female Pyramid Connector Standard 4-hole bolt
pattern connector
n/a
3 Angle Mount Custom-made to fit, no
drawings.
n/a

78
APPENDIX B
OPTIMIZATION CODES
6. Kinematic Configuration
6.1 Ankle Kinematic Configuration Optimization
% Frank Sup
% Vanderbilt University
%Find Ankle Dimensions
% m-file to find min actuator volume for Bimba pneumatic actuators
%Declare Variables
N=100;
l1_v=linspace(.001,.10,N); %m
%L_v=linspace(.05,.2,N); %m
theta_v=linspace(25,115,N); %degrees
%D_v=linspace(.01,.05,N); %m
D_v=[7/8,17/16,1.25,1.5,1.75,2 %
;3.56,3.84,4.72,4.38,5.75,5.62].*.0254; %Enter inches converts to meters
str_v=linspace(.25,12,48).*.0254; %enter inches, converts to m
clevis_v=[1.49,1.49,1.49,1.49,1.49,1.49]*.0254; %with Load Cell .59 enter inches, converts to m
Ps=300*4.45*39.3^2; %pascals
Td=130; %Nm
deltathetad_v=linspace(65,75,N).*pi./180; %radians
l2_max=.3; %m
Vmin = (D_v(2,6)+.001)*D_v(1,6)^2*pi*.25; %m^3
l1_final=100; %m
l2_final=0; %m
L_final=D_v(2,6); %m
str_final=str_v(12); %m
D_final=D_v(1,6); %m
T_final=1000; %Nm
theta1_final=0; %radians

79
theta2_final=0; %radians
deltatheta_final=0; %radians
theta_hat_final=0; %radians
thetadiffd=pi; %radians
thetashift=10*pi/180; %radians
Tmax=0; %Nm
for hh=1:N,
deltathetad=deltathetad_v(hh);
for ii=1:N,
l1=l1_v(ii);
for jj=1:6,
L=D_v(2,jj);
clevis=clevis_v(jj);
for kk=1:48,
str=str_v(kk);
for ll=1:N,
theta=theta_v(kk)*pi/180;
L1=L+str+clevis;
L2=L+2*str+clevis;
%Calculate l2 for desired range of motion
l21=sqrt(l1^2+L1^2-2*l1*L1*cos(pi-asin(l1*sin(theta)/L1)-theta));
l22=sqrt(l1^2+L2^2-2*l1*L2*cos(pi-asin(l1*sin(theta+deltathetad)/L2)-(theta+deltathetad)));
%Check if l21 and l22 are within desired tolerance
if abs(l22-l21)>(l1_v(1)/10)
break
end
%Average l2 calcuations
l2=(l21+l22)/2;
%Break if calculated l2 is greater then tolerances
if l2>l2_max,
break
end
%Calculate values for theta1 and theta2
theta1=acos((l1^2+l2^2-(L1)^2)/(2*l1*l2));

80
theta2=acos((l1^2+l2^2-(L2)^2)/(2*l1*l2));
%Remove any imaginary results
if imag(theta1)~=0 | imag(theta2)~=0
break
end
%Calculate delta theta
deltatheta=theta2-theta1;
%Confirm Delta theta has acceptable range of motion
if deltatheta<70*pi/180,
break
end
% combination provides desired range of motion, now find if
% combination provides desired torque within range of motion
theta_hat=acos(.5*((l1/l2)+(l2/l1)-sqrt(((l1/l2)+(l2/l1))^2-4)));
if (theta_hat < theta1)|(theta_hat > theta2),
break
end
% maximum torque occurs within range of motion
D=D_v(1,jj);
A=D^2*pi*.25;
%Find torque at required shift for max torque
T=Ps*A*(l1*l2*sin(theta1+thetashift)/sqrt(l1^2+l2^2-2*l1*l2*cos(theta1+thetashift)));
%Volume Calculation
V=L1*A;
%Shift from theta1 to theta_hat to match actual knee data
%for shift.
thetadiff=abs(theta1-theta_hat+thetashift);
%If Volume is less then Vmin and has desired or greater
%torque store values.

81
if V <= Vmin & T >= Td & l1 <= l1_final,
thetadiffd=thetadiff;
Vmin=V;
l1_final=l1;
l2_final=l2;
L_final=L;
str_final=str;
D_final=D;
T_final=T;
theta1_final=theta1;
theta2_final=theta2;
deltatheta_final=deltatheta;
theta_hat_final=theta_hat;
Tmax=Ps*A*(l1*l2*sin(theta_hat_final)/sqrt(l1^2+l2^2-2*l1*l2*cos(theta_hat_final)));
end
end %ll=1:N
end %kk=1:12
end %jj=1:12
end %ii=1:N
end %hh=1:N
%Print out results.
Vmin
l1_final
l2_final
L_final=L_final/.0254
str_final=str_final/.0254
D_final=D_final/.0254
T_final
Tmax
theta1_final=theta1_final*180/pi
theta2_final=theta2_final*180/pi
deltatheta_final=deltatheta_final*180/pi
theta_hat_final=theta_hat_final*180/pi
thetadiffd=thetadiffd*180/pi
6.2 Knee Kinematic Configuration Optimization
% Frank Sup
% Vanderbilt University
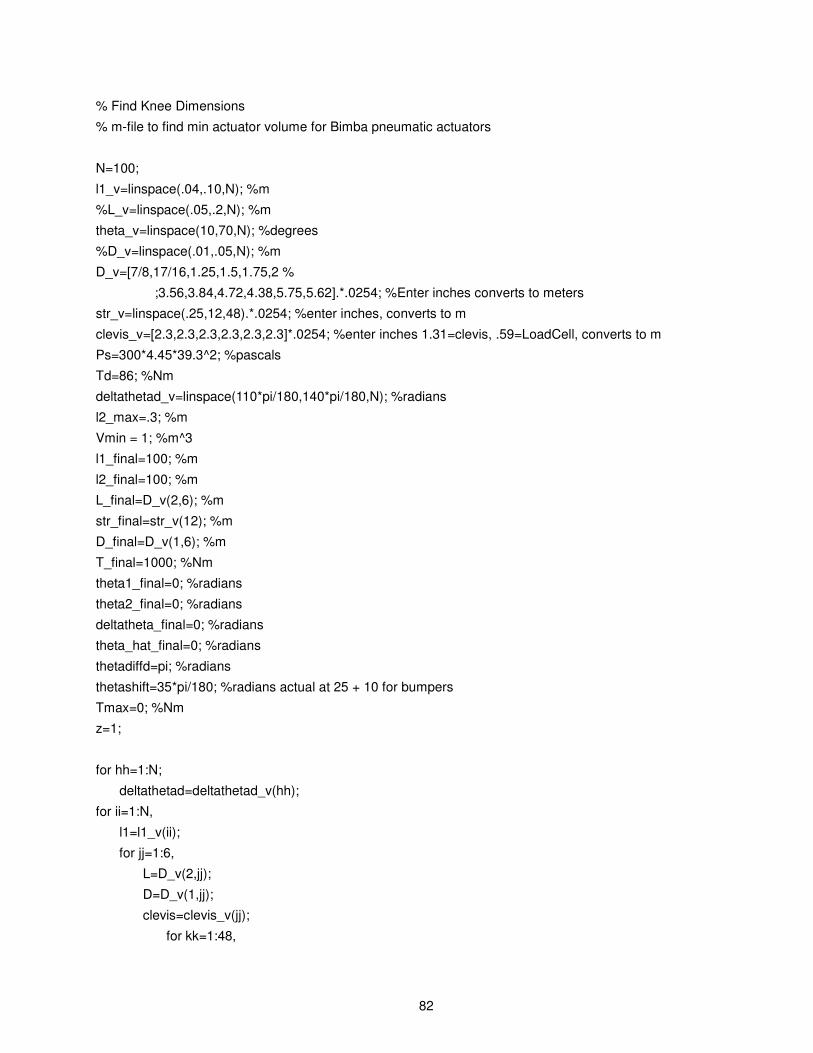
82
% Find Knee Dimensions
% m-file to find min actuator volume for Bimba pneumatic actuators
N=100;
l1_v=linspace(.04,.10,N); %m
%L_v=linspace(.05,.2,N); %m
theta_v=linspace(10,70,N); %degrees
%D_v=linspace(.01,.05,N); %m
D_v=[7/8,17/16,1.25,1.5,1.75,2 %
;3.56,3.84,4.72,4.38,5.75,5.62].*.0254; %Enter inches converts to meters
str_v=linspace(.25,12,48).*.0254; %enter inches, converts to m
clevis_v=[2.3,2.3,2.3,2.3,2.3,2.3]*.0254; %enter inches 1.31=clevis, .59=LoadCell, converts to m
Ps=300*4.45*39.3^2; %pascals
Td=86; %Nm
deltathetad_v=linspace(110*pi/180,140*pi/180,N); %radians
l2_max=.3; %m
Vmin = 1; %m^3
l1_final=100; %m
l2_final=100; %m
L_final=D_v(2,6); %m
str_final=str_v(12); %m
D_final=D_v(1,6); %m
T_final=1000; %Nm
theta1_final=0; %radians
theta2_final=0; %radians
deltatheta_final=0; %radians
theta_hat_final=0; %radians
thetadiffd=pi; %radians
thetashift=35*pi/180; %radians actual at 25 + 10 for bumpers
Tmax=0; %Nm
z=1;
for hh=1:N;
deltathetad=deltathetad_v(hh);
for ii=1:N,
l1=l1_v(ii);
for jj=1:6,
L=D_v(2,jj);
D=D_v(1,jj);
clevis=clevis_v(jj);
for kk=1:48,
83
str=str_v(kk);
for ll=1:N,
theta=theta_v(kk)*pi/180;
L1=L+str+clevis;
L2=L+2*str+clevis;
%Calculate l2 for desired range of motion
l21=sqrt(l1^2+L1^2-2*l1*L1*cos(pi-asin(l1*sin(theta)/L1)-theta));
l22=sqrt(l1^2+L2^2-2*l1*L2*cos(pi-asin(l1*sin(theta+deltathetad)/L2)-(theta+deltathetad)));
%Check if l21 and l22 are within desired tolerance
if abs(l22-l21)>(l1_v(1)/40)
break
end
%Average l2 calcuations
l2=(l21+l22)/2;
%Break if calculated l2 is greater then tolerances
if l2>l2_max,
break
end
%Calculate values for theta1 and theta2
theta1=acos((l1^2+l2^2-(L1)^2)/(2*l1*l2));
theta2=acos((l1^2+l2^2-(L2)^2)/(2*l1*l2));
%Remove any imaginary results
if imag(theta1)~=0 | imag(theta2)~=0
break
end
%Calculate delta theta
deltatheta=theta2-theta1;
%Confirm Delta theta has acceptable range of motion
if deltatheta<(115*pi/180),
break
end

84
% combination provides desired range of motion, now find if
% combination provides desired torque within range of motion
theta_hat=acos(.5*((l1/l2)+(l2/l1)-sqrt(((l1/l2)+(l2/l1))^2-4)));
if (theta_hat < theta1)|(theta_hat > theta2),
break
end
% maximum torque occurs within range of motion
A=D^2*pi*.25;
%Find torque at required shift for max torque
T=Ps*A*(l1*l2*sin(theta2-thetashift)/sqrt(l1^2+l2^2-2*l1*l2*cos(theta2-thetashift)));
%Volume Calculation
V=L1*A;
%Shift from theta1 to theta_hat to match actual knee data
%for shift.
thetadiff=abs(theta2-theta_hat-25*pi/180);
%If Volume is less then Vmin and has desired or greater
%torque store values.
if V <= Vmin & T >= Td,
S_v(1,z)=l1;
S_v(2,z)=l2;
S_v(3,z)=T;
thetadiffd=thetadiff;
Vmin=V;
l1_final=l1;
l2_final=l2;
L_final=L;
str_final=str;
D_final=D;
T_final=T;
theta1_final=theta1;
theta2_final=theta2;
deltatheta_final=deltatheta;
theta_hat_final=theta_hat;
Tmax=Ps*A*(l1_final*l2_final*sin(theta_hat_final)/sqrt(l1_final^2+l2_final^2-2*l1_final*l2_final*cos(theta_h

85
at_final)));
z=z+1;
end
end %ll=1:N
end %kk=1:12
end %jj=1:12
end %ii=1:N
end %hh=1:N;
%Print out results.
Vmin
l1_final
l2_final
L_final=L_final/.0254
str_final=str_final/.0254
D_final=D_final/.0254
T_final
Tmax
theta1_final=theta1_final*180/pi
theta2_final=theta2_final*180/pi
deltatheta_final=deltatheta_final*180/pi
theta_hat_final=theta_hat_final*180/pi
thetadiffd=thetadiffd*180/pi
7. Socket Load Cell Volume Minimization
% Frank Sup
% Vanderbilt University
% Minimize Socket Load Cell Volume
%Declare Variables
J = 20; %Interval
M = 100; %Nm Max Moment
F = 1000; %N Max Force
E_v = [193e9 70e9]; %Modulus Pa
b_v = linspace(.01,.02,J); %beam width %m
h_v = linspace(.0025,.005,J); %beam thickness %m
t_v = linspace(.01,.022,J); %beam seperation %m
L_v = linspace(.02,.022,J); %beam Length %m
k = 1;

86
%Determine configurations that meet meet strain criteria and ratio of bending strain to axial %force strain.
for N = 1:2,
E = E_v(N);
for O = 1:J,
b = b_v(O);
for P = 1:J,
h = h_v(P);
for Q = 1:J,
t = t_v(Q);
for R = 1:J,
L = L_v(R);
em = M/(t*b*h*E); %microstrain
ef = 3*F*L/(8*E*b*h^2); %microstrain
ratio = ef/em;
if abs(ratio-1)<.4 && em+ef < 1500e-6, %in microstrain
sol(k,1) = b; %beam width
sol(k,2) = h; %beam height
sol(k,3) = t; %beam seperation
sol(k,4) = E; %Modulus
sol(k,5) = em; %strain from Moment
sol(k,6) = ef; %strain from Force
sol(k,7) = L; %beam Lentgh
sol(k,8) = ratio; %ef/em
k = k+1;
end
end
end
end
end
end
%Review Solution Combinations that minimize volume and return the top 5 smallest %configurations.
tester=1000;
test = ones(5,8);
for N=1:size(sol(:,6)),
if sol(N,1)*sol(N,3)*sol(N,7)<tester,
%if abs(sol(N,5)+sol(N,6)-1000e-6) < abs(test(1,6)+test(1,5)-1000e-6),
test(5,:) = test(4,:);

87
test(4,:) = test(3,:);
test(3,:) = test(2,:);
test(2,:) = test(1,:);
test(1,:) = sol(N,:);
tester= sol(N,1)*sol(N,3)*sol(N,7);
end
end

88
APPENDIX C
SCHEMATICS OF ANALOG CIRCUITS
8. On-board Analog Circuit
Figure C-1. Schematic of circuit used for onboard sensor power and amplifying.

89
a) b) c)
Figure C-2. Board Layout (a), top trace (b) and bottom trace (c) of the circuit used for onboard signal
routing and amplification overall dimensions 0.78” x 5.20”. Printed via ExpressPCB software and service.
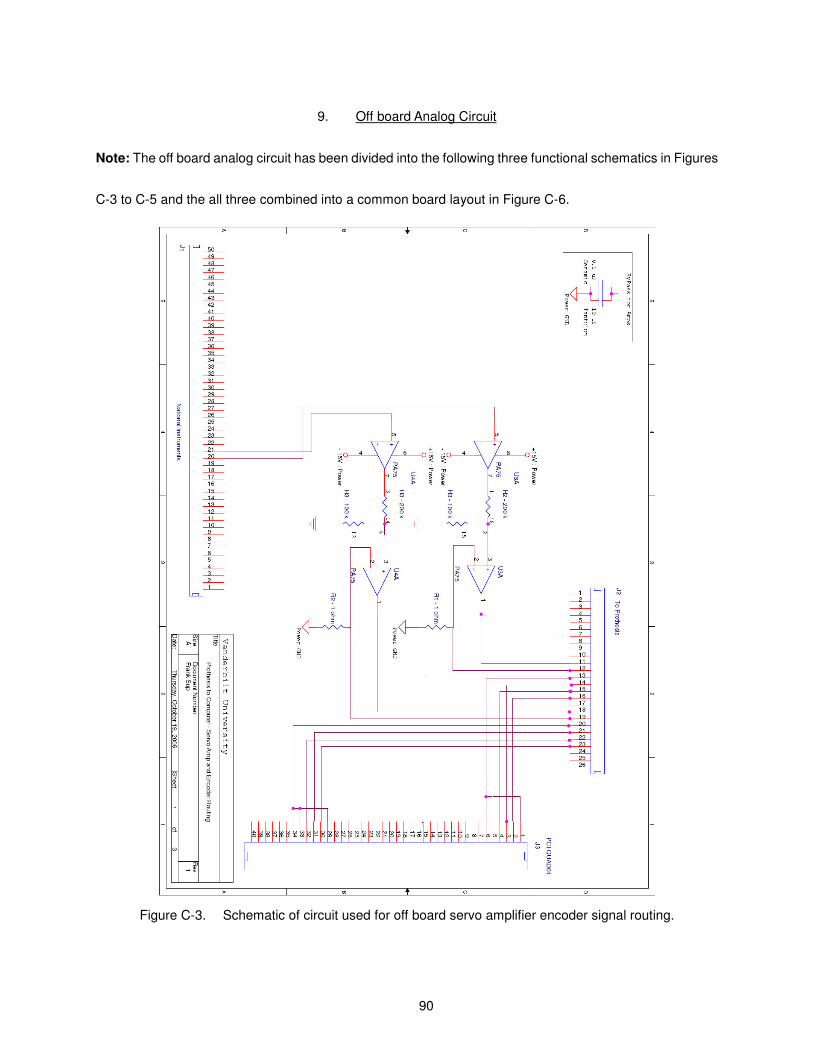
90
9. Off board Analog Circuit
Note: The off board analog circuit has been divided into the following three functional schematics in Figures
C-3 to C-5 and the all three combined into a common board layout in Figure C-6.
Figure C-3. Schematic of circuit used for off board servo amplifier encoder signal routing.

91
Figure C-4. Schematic of circuit used for off board load cell sensor signal filtering and routing.

92
Figure C-5. Schematic of circuit used for off board position sensor signal routing and differentiation.

93
Figure C-6. Board Layout of circuit used for offboard signal processing and for computer input for
National Instruments Card PCI-6031E for analog signal routing and Measurement Computing
PCI-QUAD04 for encoder signal routing.

94
APPENDIX D
MATLAB SIMULINK BLOCKS
10. Torque Control
Knee Torque to Force Conversion
1
Desired Force
145*pi/180
offsetf(u)
Torqe to Force-K-
Deg to Rad
2
Desired Knee Torque
1
Knee Angle
Figure D-1. Knee Torque to Force Conversion subblock for torque control diagram for Matlab Simulink.
Ankle Torque to Force Conversion
1
Desired Force
60*pi/180
offset1f(u)
Torqe to Force2-K-
Deg to Rad2
2
Desired Ankle Torque
1
Ankle Angle
Figure D-2. Ankle Torque to Force Conversion subblock for torque control diagram for Matlab Simulink.
1
Output
RampUp
RampDown
Product
1
Input
Figure D-3. Ramp up/down subblock for torque control diagram for Matlab Simulink.

95
Derivative Gain
Integral Gain
Proportional Gain N/deg
PID Force Control Block
2
PID Contribution
1
Position Command
Sign
Product2
Product1
Product
Position
Saturation
0
Invert1
1
s
Integrator
1
Amp gain
volts / amp2Add
3
PID Gains
2
Force
1
Force_d
e
e
e
e
e
<D>
Proportional
Proportional
<P>
Integral
Integral<I>
Deriv ativ e
Deriv ativ e
Figure D-4. PID Force Control subblock for torque control diagram for Matlab Simulink.

96
Figure D-5. Torque control diagram for Matlab Simulink.

97
11. Variable Values
%This file contains the constants for Leg Controller variables
%General Simulink Variables
sim_time = 60; %Length of Simulation
sampling_rate = 1000;
sample_time = 1/sampling_rate;
%%%%%%%%%%%%%%%%%%%%%%%%%%%%%%%%%%%%%%%%%%%%%%%%%%%%%%%%%%%%%%%%%%%%%%%
%Signal Conditioning for Prosthetic Leg
%Socket Load Cell Conversion Matrix;
SocketLoadMatrix =
[128.95,-7.0311,1.7243;107.86,28.621,-12.117;64.195,-58.103,25.948;-167.16,50
.542,-18.793;60.458,-14.455,4.3797;-102.93,14.625,-1.6182;-56.624,2.5802,-2.7
663;-49.5,9.5874,-0.67743;-8.3461,6.6598,-0.1948;2.0407,2.2391,-0.31808;-12.7
13,0.3288,6.7424;-17.675,-0.23942,-0.74621;4.7048,-0.34847,1.0689;1.797,0.102
45,0.11055;-0.3911,0.023332,-0.044451;];
%Prosthetics related conversion
prosthetic_ankle_angle_offset = 6.3030; %6.202
prosthetic_knee_angle_offset = 7.810;
zero_axial_load = 0.01;
zero_frontal_moment = 2.524;
zero_sagittal_moment = 2.305;
KneeTorqueZero = -182;
AnkleTorqueZero = -145;
%Force to Torque conversion
%Knee
L1k = .0434;
L2k = 10.875*.0254;
L = 11*.0254;
m = 2.72;
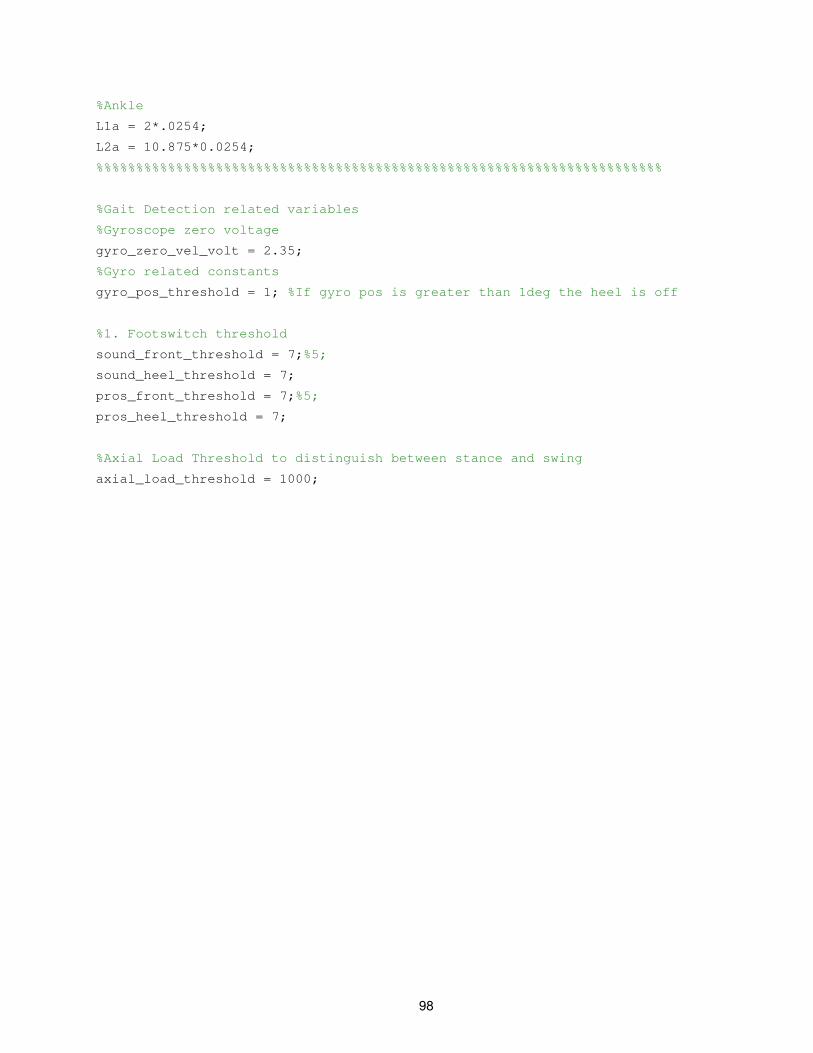
98
%Ankle
L1a = 2*.0254;
L2a = 10.875*0.0254;
%%%%%%%%%%%%%%%%%%%%%%%%%%%%%%%%%%%%%%%%%%%%%%%%%%%%%%%%%%%%%%%%%%%%%%%
%Gait Detection related variables
%Gyroscope zero voltage
gyro_zero_vel_volt = 2.35;
%Gyro related constants
gyro_pos_threshold = 1; %If gyro pos is greater than 1deg the heel is off
%1. Footswitch threshold
sound_front_threshold = 7;%5;
sound_heel_threshold = 7;
pros_front_threshold = 7;%5;
pros_heel_threshold = 7;
%Axial Load Threshold to distinguish between stance and swing
axial_load_threshold = 1000;