Design and Applied Technology (Secondary 4 6) Module 5cd1.edb.hkedcity.net/cd/wcms/3516/M5...
220
Design and Applied Technology (Secondary 4 – 6) Module 5
-
Upload
nguyenthien -
Category
Documents
-
view
213 -
download
0
Transcript of Design and Applied Technology (Secondary 4 6) Module 5cd1.edb.hkedcity.net/cd/wcms/3516/M5...

Design and Applied Technology (Secondary 4 – 6) Module 5

Design and Applied Technology (Secondary 4 – 6) Module 5
Design and Applied Technology ( Secondary 4 – 6 )
Elective Module 5 Visualisation and Computer - aided Design (CAD) Modelling
[ Learning Resource Materials ]
Resource Materials Series In Support of the Design and Applied Technology Curriculum
(S4 – 6)
Technology Education Section Curriculum Development Institute Education Bureau The Government of the HKSAR
Developed by Institute of Professional Education And Knowledge (PEAK), Vocational Training Council

Design and Applied Technology (Secondary 4 – 6) Module 5
Technology Education Section Curriculum Development Institute
Education Bureau The Government of the Hong Kong Special Administrative Region
Room W101, 1/F, West Block, Kowloon Tong Education Service Centre, 19 Suffolk Road, Kowloon Tong, Hong Kong
2009
Project Advisor: Mr. Wong Siu Kai (Head, Department of Engineering, IVE/Tuen Mun) Authors:
Dr. Lui Wai Kuen, Clarence (Head, Department of Information and Communications Technology, IVE/Tuen Mun) Mr. Chow Kin Fu (Lecturer, Department of Engineering, IVE/Tuen Mun) Mr. Chung Shiu Leung (Lecturer, Department of Engineering, IVE/Tuen Mun) Mr. Ho Siu Hung (Lecturer, Department of Engineering, IVE/Tuen Mun) Mr. Lam Chun Fan (Lecturer, Department of Information and Communications Technology, IVE/Tuen Mun) Mr. Yiu Ho Yin, Morris (Lecturer, Department of Information and Communications Technology, IVE/Tuen Mun) Associate author:
Mr. Choy Siu Ming (Teaching Associate, Department of Engineering, IVE/Tuen Mun) Project Co‐ordinator:
Mr. Li Yat Chuen (Senior Training Consultant, PEAK/VTC) Mr. Tsang Siu Wah (Training Consultant, PEAK/VTC) The copyright of the materials in this package, other than those listed in the Acknowledgements section and
the photographs mentioned there, belongs to the Education Bureau of the Government of the Hong Kong Special Administrative Region.
© Copyright 2009
Duplication of materials in this package other than those listed in the Acknowledgements section may be used freely for non‐profit making educational purposes only. In all cases, proper acknowledgements should be made.
Otherwise, all rights are reserved, and no part of these materials may be reproduced, stored in a retrieval system or transmitted in any form or by any means without the prior permission of the Education Bureau of
the Government of the Hong Kong Special Administrative Region.

Design and Applied Technology (Secondary 4 – 6) Module 5
Preface
A set of curriculum resource materials is developed by the Technology Education Section of
Curriculum Development Institute, Education Bureau for the implementation of the Design
and Applied Technology (Secondary 4-6) curriculum in schools.
The aim of the resource materials is to provide information on the Compulsory and Elective
Part of the DAT (Secondary 4-6) to support the implementation of the curriculum. The
resource materials consist of teacher’s guides and student’s learning resource materials of
each Strand and Module of the DAT (Secondary 4-6) arranged in eight folders.
All comments and suggestions related to the resource materials may be sent to:
Chief Curriculum Development Officer (Technology Education)
Technology Education Section
Curriculum Development Institute
Education Bureau
Room W101, West Block, 19 Suffolk Road
Kowloon Tong
Hong Kong

Design and Applied Technology (Secondary 4 – 6) Module 5
CONTENTS Introduction
Chapter 1 Product Visualisation and 3D Modelling 1.1 Visual Impact of Graphics 1.2 3D Modelling Concepts
18
Chapter 2 Technical Visualisation 2.1 Pictorial Drawing 2.2 Engineering Drawing 2.3 Standards, Conventions and Symbols 2.4 Data Presentation
32445769
Chapter 3 Computer‐Aided Design (CAD) 3.1 “Virtual” Prototypes (VP) 3.2 Criteria for Computer Modelling Techniques 3.3 CAD Software 3.4 Impact of CAD on the Design Process
7485101107
Chapter 4 Applications 4.1 CAD and Visualisation
110
Theme‐based Learning Tasks 1 3D Modelling – Making of Cardboard / Foam Board Remote Control Holder 2 Domestic Floor Plan – Architectural and Electrical Floor Plan Drawing 3 Rapid Prototyping for Entertainment Technology – 3D Printing of Timberland Prototypes 4 Michigan’s Gateway Arch Bridges – Structural Analysis 5 Virtual Reality – Ship Handling Simulation
119120123125127
Hands‐on Activities 1 Feature‐based Modelling 2 Parametric Modelling and 2D Sketches 3 Revolve, Loft and Sweep Features 4 Assembly 5 Engineering Drawing 6 Shading and Rendering
130143153159165170
Assessment Tasks Design Project Practical Tasks and Exercises for Chapter 1‐4 Quiz for Chapter 1‐4 Case Studies
180184196205
Useful Websites 206
References 208
Glossary of Terms 209
Acknowledgements 213

Design and Applied Technology (Secondary 4 – 6) Module 5
INTRODUCTION Product/ industrial design and engineering design are converging. Some five decades ago, people considered product/ industrial design as an art. Designers were trained to express their conceptual ideas on paper, together with colouring and rendering techniques. Design focused on the ease of use and appearance of products. The products concerned ranged from daily necessities to interior design of a house. Engineering design was more technology related in the past. Engineers emphasized on how the items could be made more efficiently and cost effectively. Product performance, in terms of durability, material fatigue, etc, was the main concern. Building a model for design presentation and performance test was highly desirable, even though the required time is long. Advancement of technology since the late 20th century has significant impact on the design and manufacturing process. Processes, such as graphics, rendering, colouring, prototyping and stress analysis can all be completed by a single designer or engineer nowadays. It is also possible for a designer or engineer to preview and manipulate 2D designs on a computer screen; generate prototypes; and simulate the performance of a system. The designer or engineer can even experience and visualize a 3D model though a virtual environment. Again, all these can be done by a single designer or engineer without much help from other specialists. This module consists of four chapters, responding to the needs and expectations from the industrial and commercial sectors as well as the New Secondary School system. This module aims at enabling students to explore various product modelling methods through visual images and Computer Aided Design (CAD). Traditional drawing-on-board and appearance models are a starting point. The focus gradually shifts to the development and impact of CAD technology to product design, visual communication and 3D modelling in product development, and finally the state-of-art technology. Though no software dependence is expected, students should be able to operate CAD software after completion of this module. Teachers can stimulate students’ creativity through discussions and the theme-based learning tasks provided in this document. Furthermore, during the learning process, teachers can assess students through the assessment tasks provided in this document. Finally, teachers can allocate some school or non-school hours for students to complete the hands-on activities.

Design and Applied Technology (Secondary 4 – 6) Module 5
1
CHAPTER 1 – PRODUCT VISUALISATION AND 3D MODELLING This chapter covers the following topics:
1.1 Visual Impact of Graphics 1.2 3D Modelling Concepts
These topics include learning materials and activities that facilitate students to:
(a) Apply visual impact to enhance graphics; and (b) Develop solutions modelled in appropriate materials to convey 3D concepts.
1.1 Visual impact of graphics The appearance of a product gives customers the first impression. This explains why visual representation is an important part in the product design and development process. Drawing is one of the major aspects in visual representation. Three major uses of drawing have been shown as follows: (a) Improving Perception
Drawing can help a designer to capture the details of an object at a particular moment, facilitating her/ his subsequent study and finished work development.
(b) Planning Projects Drawing can help a designer to prepare materials for presentation to clients in a project’s planning stage. Upon the client’s approval, a project can start.
(c) Making Finished Art Works Drawing can make finished art works.
Drawing can make finished art works. In addition to drawing, visual representation involves visual enhancement techniques as follows. Rendering refers to the process of creating, shading and texturing an object. It can also be used to describe the quality of an object after such a process. Rendering makes use of light-and-shadow and the surface properties of the objects concerned. Simple rendering can be done by tools as simple as pencils and airbrushes. Some rendering techniques have been illustrated as follows:
(a) Thick and thin lines, (b) Shading, (c) Highlighting, and (d) Colouring.

Design and Applied Technology (Secondary 4 – 6) Module 5
2
1.1.1 Thick and thin lines Thick and thin lines are important tools in technical illustration. Lines of different weights communicate different meanings to readers, facilitating readers’ understanding of the objects concerned. For example, a thick line indicates the boundary of a hidden surface, while a thin one represents two adjoining surfaces. 1.1.2 Shading Shading applies an appropriate level of darkness through the use of light and shadows to provide readers with a feeling of depth. There are two types of shading, namely Line Shading and Tone Shading. (a) Line Shading
(i) Using different line weights and densities to represent the light and shadows of an object;
(ii) For example, using low line density to enhance the light surface of an object; and (iii) Another example is the following square cube, which makes use of different
densities of lines to enhance the object layering.
Low line density shows the light surface
of a cylinder A square cube is represented in different
densities of lines. (b) Tone Shading
(i) Including shading in an object with back edge lines and white highlights; (ii) Showing different light and shadows on an object for light sources from different
positions; and (iii) Using different darkness ratio of the same colour to enhance the tone shading.
The right picture with different line weights is more clearly depicted than the left picture is.

Design and Applied Technology (Secondary 4 – 6) Module 5
3
Light sources from different positions give different shading effects on the same object.
A suitable colour for one side, and different
darkness for the rest two
Three shades of the same colour on different
sides
H I G H L I G H T Use a pencil to draw line shading and tone shading Hatching is a drawing technique for line shading. It is to draw a series of parallel lines together to create the shading. To adjust the darkness ratios of the lines, a designer can simply vary the heights, widths, densities, etc of the lines. When using with intersecting instead of parallel lines, the technique is called cross-hatching.
Different densities of lines
Return reflection effect applied on the
rectangular cube
Light source
Light source

Design and Applied Technology (Secondary 4 – 6) Module 5
4
When the return reflection effect is applied on the object, discontinuous lines can be added on the light surface where the dark surface can be represented in thick and thin lines.
When dealing with different darkness ratio, a designer can use a pencil to give a smooth transition from a light to a darker tone. The colour density depends on the amount of the pressure applied from the pencil. This technique is commonly used in tone shading.
Use a pencil to give a smooth darkness
transition
S T O P A N D T H I N K Using tone shading for colour objects Tone shading can enhance colour objects. For example, the picture below shows an object with and without tone shading. Which one will give better appearance of the object?
Tone shading can also be used in the medical sector. For example, tone shading can enhance the tiny parts of vessels and picture quality.
Picture A Picture B
The above two pictures show a human hand with different rendering techniques. Which picture and which parts of the picture use tone shading?

Design and Applied Technology (Secondary 4 – 6) Module 5
5
1.1.3 Highlighting Highlights refer to the area of an object that is illuminated by a light source direct. In fact, light’s behaviour varies when it falls on different surfaces. For example, it appears in white when reflected from a hard, polished curving surface. On the other hand, it carries some colour of the surface when reflected from a soft, dull, flat surface.
Highlight effects depend on the position of the
light sources.
H I G H L I G H T How to perform highlighting on the sphere There are two steps to perform highlighting on a sphere, namely: (a) On the side where the light source does not reach, draw an arc for the dark surface; and
(b) Draw smooth darkness transition from black to write to perform highlighting.

Design and Applied Technology (Secondary 4 – 6) Module 5
6
H I G H L I G H T Using two light sources to perform highlighting There may be light from more than one source falling on an object. The primary and secondary light sources differ in drawing or painting. (a) The light source of the strongest intensity or that is the closest to the object concerned is
called the Primary Source. It forms darker and more definite shapes to the shadow areas.
(b) On the other hand, the secondary forms weaker, lighter and softer edged shapes in the shadow areas.
An object illuminated by two light sources
1.1.4 Colouring In the design process, colouring is an important technique for object visualization. There are two major types of colours, namely: (a) Cool colours, which contain a large amount of blue, such as blue, violet and green, give
a calm and dull impression. In nature, it comes with, for example, overcast days. (b) Warm colours, which contain a large amount of yellow, such as yellow, red and orange,
give an energetic and comfortable impression. In nature, it comes with, for example, daylight.

Design and Applied Technology (Secondary 4 – 6) Module 5
7
Warm Cool
Colour spectrum of cool and warm colours
Cool colours on the left of colour wheel Warm colours on the right of colour wheel.
Some common colouring materials for design have been listed as follows: (a) Marker – A pen with a thick point (b) Colour Pencil – A pencil for drawing fine colour lines (c) Poster Colour – Water-based paint in an opaque colour
Marker Colour Pencil Poster Colour
S T O P A N D T H I N K Wall painting in a new flat Suppose an apartment owner is going to paint the walls of her/ his new flat. Is a warm or cool colour suitable for her/ him? What are the main factors s/he has to consider?

Design and Applied Technology (Secondary 4 – 6) Module 5
8
1.2 3D Modelling concepts 1.2.1 Limitations of graphical presentation Presenting a 3D object on a 2D medium, such as a piece of paper or a computer monitor, may encounter limitations.
S T O P A N D T H I N K
There are several out of perspective objects, i.e. those not drawn in properly to show their relative distances and sizes, in the above picture. Point out four of them.
Computer modelling facilitates scientists and engineers’ problem solving very much. However, computer modelling does have its limitations just as everything else does. For example,
(a) The computer resources required for modelling complex systems are too huge even for the fastest computers.

Design and Applied Technology (Secondary 4 – 6) Module 5
9
(b) Making assumptions to simplify problems for modelling are inevitable. However, these assumptions may disturb the modelling results.
(c) Bad assumptions may present data seemingly correct, hiding the underlying problems.
While computer modelling becomes a frequently-used tools of engineers and researchers in recent years, physical modelling cannot be replaced for, at least, the several years ahead.
S T O P A N D T H I N K List the advantages and disadvantages of the following: (a) 2D world map (b) 3D globe
S T O P A N D T H I N K
Two models of water molecules are shown below. Write down the major differences between the two models.

Design and Applied Technology (Secondary 4 – 6) Module 5
10
S T O P A N D T H I N K
Which of the following pictures is simulated by computer modelling?
Picture A Picture B Picture C Picture D
1.2.2 Physical model A physical model is used to represent a real object. It may be a single item as small as a bolt, or as large as the solar system.
A model and the object it represents are often similar, if not identical, in all aspects except their sizes or scales. In such cases, scale is considered an important characteristic. The importance of physical models in science and technology is its visualization function. A 3D physical object, such as an architectural model of a building, can be used for this purpose. One of the technical uses of an architectural model is to facilitate visualization of
(a) internal relationship within the structure, or (b) external relationship of the structure to the environment.
Some purposes of a physical model on a smaller scale are listed below:
(a) for a better overview of the object it represents (b) for testing purposes (c) for a hobby
A physical model on a larger scale is generally to enlarge objects that are too small to see

Design and Applied Technology (Secondary 4 – 6) Module 5
11
properly or to see at all. For example, scientists may need a model of an insect or a molecule. A physical model, a 3D object, sometimes is considered an alternative for a 2D representation. For example, a globe provides a different, all-round view from a distorted flat world map does, enabling demonstrations of sunrise, sunset, etc.
S T O P A N D T H I N K What scale should be used for the following objects? (a) A city of one million population (b) A set of desk and chair (c) A high-rise building (d) A human eye (e) A motor car (f) An optical mouse (g) Solar system (h) A water molecule
Examples on physical models:
A 1:100 model of the Legislative Council Building

Design and Applied Technology (Secondary 4 – 6) Module 5
12
A 1:1000 model of West Kowloon Cultural District
1.2.3 Selection of materials Materials commonly used for making display models are listed as follows:
Materials General characteristics Acrylic (a) Easy to bend when softened
(b) Easy to cut Cardboard (a) Soft and thin
(b) Easy to cut (c) Easy to glue together
Foam Board (a) Soft (b) Easy to cut
Materials commonly used for making models that have to undergo testing are listed as follows:
Materials General characteristics Acrylic (a) Easy to bend when softened
(b) Easy to cut Aluminium (a) Silvery surface
(b) Perfect machineability (c) Limited weldability
Chipboard (a) Similar to plywood (b) Made of wood chips and saw dust

Design and Applied Technology (Secondary 4 – 6) Module 5
13
Copper (a) Yellowish (b) Low friction and suitable for making bearing
High-density Foam Board
(a) Strong, stiff and resilient (b) Commonly used for mattress
Medium Density Fibreboard
(a) Similar to plywood (b) Made of softwood fibres
Plywood (a) Made of wood veneer (b) Commonly used for ordinary furniture
Steel (a) A commonly used metal (b) Good machineability (c) Good weldability
Cardboard is a paper-based product with, for example, less than 2-mm thickness. Its major uses include folding cartons, set-up boxes and carded packaging.
Corrugated fibreboard is a combination of cardboards with, for example, two flat liners and one corrugated medium. A major use is shipping products.
Plywood is the first engineered wood of its type. It is made from pliers, which are thin sheets of wood veneer. The piles are stacked together. The grain of each ply is put at right angles to its adjacent layers. The plies are glued under pressure and heat with strong adhesives of, for example, phenol formaldehyde resin. Plywood instead of plain wood is used because of its resistance to cracking, shrinkage and twisting, its strength, etc.

Design and Applied Technology (Secondary 4 – 6) Module 5
14
Chipboard is a type of fibreboard. It is made of wood particles, such as wood chips and shaving. Its pieces of wood are larger than those medium-density fibreboard and hardboard.
Medium density fibreboard (MDF or MDFB) is a wood product combined with wood fibres broken down from softwood, wax and resin. The combined matters are then applied with high temperature and pressure. It is a building material similar in application to plywood.

Design and Applied Technology (Secondary 4 – 6) Module 5
15
Foam board is like a sandwich: two sheets of thin, rigid paper are filled with a foam core. It is light in weight. Its thickness varies from 5 mm to 200 mm in general. It can be a material for display boards, poster boards, or even models of buildings and objects.
High density foam board is a material with a strong, stiff, resilient and lightweight board of polystyrene inside and covered by paper on both of its sides. There are different thicknesses and colours.
Acrylic is also known as polymethyl methacrylate (PMMA). It has been available in the market since 1933. Acrylic is a commonly used plastic for constructing aquariums, DVD’s, laserdiscs, lenses, motorcycle helmet and protection in ice hockey etc.

Design and Applied Technology (Secondary 4 – 6) Module 5
16
The most commonly used alloys for making models are listed as follows: (a) Aluminium alloy (b) Copper alloys (c) Steel (d) Zinc alloys They may be in the following forms:
Angle
Block
Flat bar
I beam

Design and Applied Technology (Secondary 4 – 6) Module 5
17
Plate
Rod
Sheet
Tube
Universal sections

Design and Applied Technology (Secondary 4 – 6) Module 5
18
Wire
S T O P A N D T H I N K What scale and materials should be used for making the following 3D models? (a) A domestic wooden chair (b) A double-decker (c) A house of an exterior area of 700 sq m (d) A house of an interior area of 700 sq m (e) An Olympics mascot set (f) A secondary school campus (g) A sprinkler
1.2.4 Simple tools and fabrication techniques This section introduces some common tools for cutting and bonding paper, timber, foam board and acrylic.
Common tools for making paper model
Procedure Tool Photo
Ruler
Marking
Pencil

Design and Applied Technology (Secondary 4 – 6) Module 5
19
Common tools for making paper model
Procedure Tool Photo
Marker
Scissors
Cutting
Utility Knife
Glue
Joining
Silicon glue

Design and Applied Technology (Secondary 4 – 6) Module 5
20
Fabricating paper model
Examples of paper models
Design and Applied Technology (Secondary 4 – 6) Module 5
21
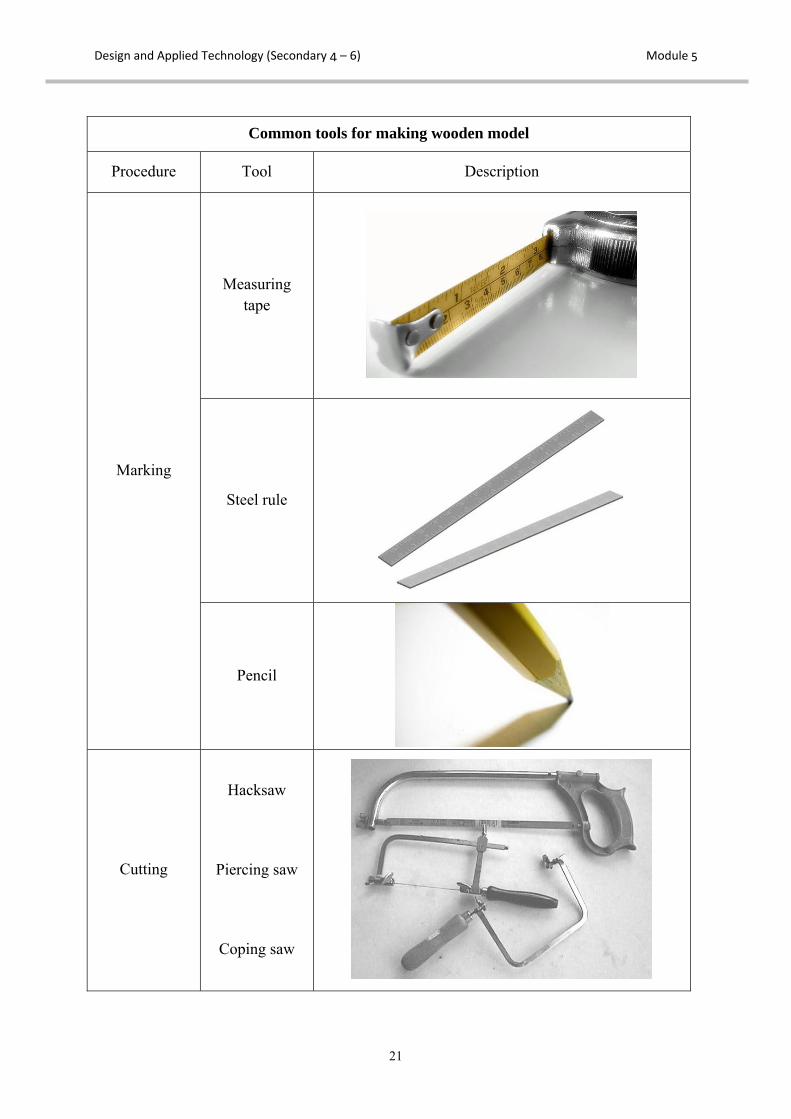
Common tools for making wooden model
Procedure Tool Description
Measuring tape
Steel rule
Marking
Pencil
Cutting
Hacksaw
Piercing saw
Coping saw

Design and Applied Technology (Secondary 4 – 6) Module 5
22
Common tools for making wooden model
Procedure Tool Description
Drill Press
Electric Hand Drill
white glue
Joining
Hammer

Design and Applied Technology (Secondary 4 – 6) Module 5
23
Common tools for making wooden model
Procedure Tool Description
Nail
Joining (Cont’d)
Self-tapping screw
Examples of wooden models

Design and Applied Technology (Secondary 4 – 6) Module 5
24
Common tools for making foam board model
Procedure Tool Description
Ruler
Marking
Marker
Utility Knife
Cutting
Hot wire cutter
Joining White glue

Design and Applied Technology (Secondary 4 – 6) Module 5
25
Examples of foam-board models
Common tools for making medium-density fibreboard and acrylic model
Procedure Tool Description
Measuring tape
Steel rule
Marking
Pencil

Design and Applied Technology (Secondary 4 – 6) Module 5
26
Common tools for making medium-density fibreboard and acrylic model
Procedure Tool Description
Acrylic cutter
Hack Saw
Piercing Saw
Coping Saw
Cutting
Electric Hand Drill
Forming Acrylic heater
(strip heater)
Joining Acrylic glue

Design and Applied Technology (Secondary 4 – 6) Module 5
27
Common tools for making medium-density fibreboard and acrylic model
Procedure Tool Description
Glue gun
Technique of bending acrylic sheet
Draw the acrylic cutter along a straight edge, such as a steel rule.
Break the sheet over edge of a bench.
Examples of acrylic models

Design and Applied Technology (Secondary 4 – 6) Module 5
28
Technique of bending acrylic sheet
Turn on the heater
Place the acrylic sheet on top of the heater until it softens
Bend the sheet to the desired shape

Design and Applied Technology (Secondary 4 – 6) Module 5
29
Common tools for metal model
Procedure Tool Description
Bench vice
Tough grip
Steel rule
and
scriber
Marking
Try square

Design and Applied Technology (Secondary 4 – 6) Module 5
30
Common tools for metal model
Procedure Tool Description
Snips
Cutting
Drill Press
Pop rivet
Joining
Bolt and nut

Design and Applied Technology (Secondary 4 – 6) Module 5
31
Glue gun or silicon glue may be used to reinforce the joints.
Example of metal model
Prototype of a power supply case
H I G H L I G H T Simple techniques to cut and bond paper, timber, foam board and acrylic are easy and have been dealt with. Cutting and welding of metals are however different; prior training is highly suggested. Temporal joining of metal can be found from the following web page: http://www.technologystudent.com/joints/joindex.htm.
Design and Applied Technology (Secondary 4 – 6) Module 5
32
CHAPTER 2 – TECHNICAL VISUALIZATION This chapter covers the following topics:
2.1 Pictorial Drawing 2.2 Engineering Drawing 2.3 Standards, Conventions and Symbols 2.4 Data Presentation
These topics include learning materials and activities that facilitate students to:
(a) Apply pictorial drawing techniques to communicate design ideas (b) Apply engineering drawing techniques to communicate design ideas (c) Apply presentation techniques to communicate design ideas and data (d) Understand the use and importance of standard practice, conventions, abbreviations
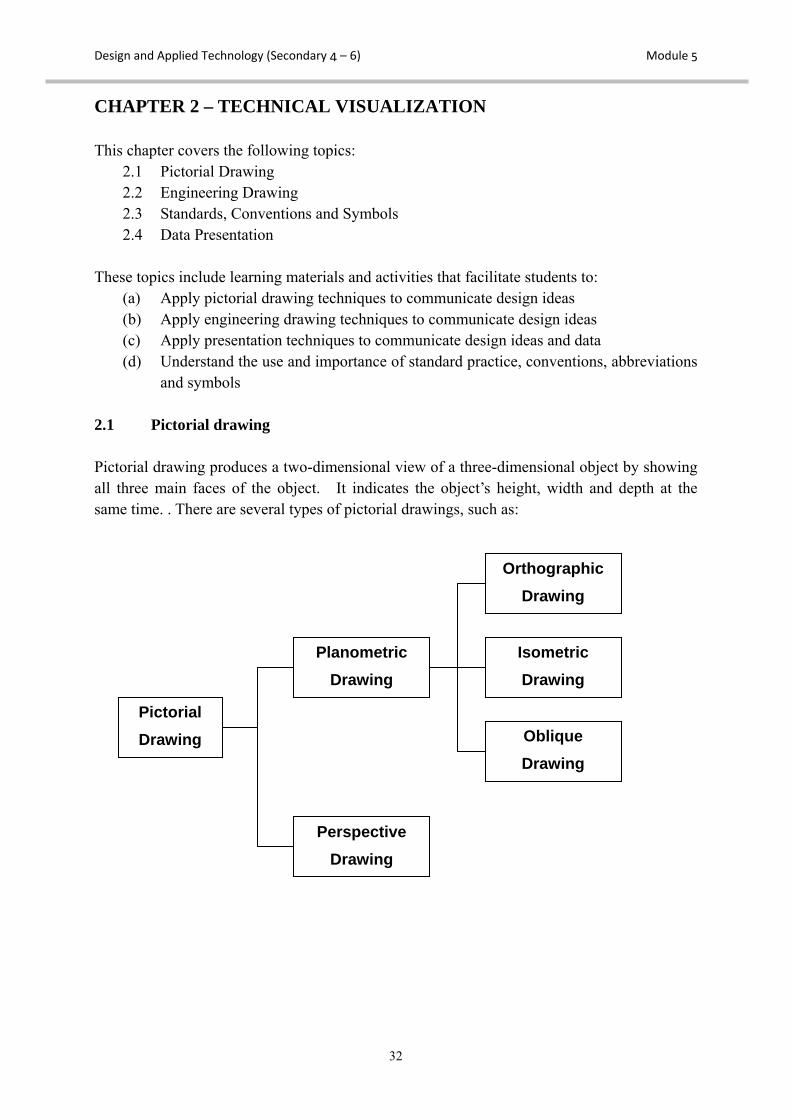
and symbols 2.1 Pictorial drawing Pictorial drawing produces a two-dimensional view of a three-dimensional object by showing all three main faces of the object. It indicates the object’s height, width and depth at the same time. . There are several types of pictorial drawings, such as:
Pictorial Drawing
Perspective Drawing
Planometric Drawing
Oblique Drawing
Isometric Drawing
Orthographic Drawing

Design and Applied Technology (Secondary 4 – 6) Module 5
33
Categories of the Pictorial Drawing
Orthographic Drawing
Perspective Drawing
Isometric Drawing
Oblique Drawing
Among the drawings, the perspective drawing is the easiest to understand. 2.1.1 Perspective drawing Perspective drawing is a kind of pictorial drawing. It assumes that a viewer sees an object from a distance away. The object is scaled relative to the viewer due to the distance. The representation of a picture includes parallel lines and vanishing points (VP’s). A VP acts as the eyes of a viewer who is observing an object. There are three types of perspective drawing, namely
(a) One-point Perspective (b) Two-point Perspective (c) Three-point Perspective
Three concrete buildings are shown with three different types of perspective drawing techniques.

Design and Applied Technology (Secondary 4 – 6) Module 5
34
One-point perspective There is only one VP for a one-point perspective drawing. This perspective joins all lines towards that single VP. It is typically used in interior design drawings and window displays.
A One-point Perspective Drawing A One-point Perspective Drawing
in Interior Design in Exterior Design
H I G H L I G H T How to sketch a one-point perspective in interior design (a) Set a VP; (b) Draw projection lines from the VP to form a rectangle (c) Design the ceiling, floor and the wall in the rectangle (d) Draw a window and a door on the left and the right respectively (e) Draw a tile pattern on the floor

Design and Applied Technology (Secondary 4 – 6) Module 5
35
D E F I N I T I O N (1) Sight Point: Sight Point indicates the position of the viewer’s eye. (2) Centre line of Vision: Centre line of Vision is a vertical line extending from the
viewer’s eye to the centre of object interest. (3) Vanishing Point: All perspective lines from an object converge at a point is called
Vanishing Point. (4) Horizon Line: Horizon Line is infinite horizontal line always at the eye level of
viewer. (5) Picture Plane: Picture Plane is the plane onto which the perspective is projected. (6) Ground Line: Ground Line is an infinite horizontal line parallel to the horizon from
which vertical measurements are made.
S T O P A N D T H I N K
Procedure for One-point Perspective Drawing (with directly find the true length) Remark: (1) The sight point is 70 mm from the picture plane, and 150 mm above the ground plane.(2) The distance between the ground plane and the horizon line is 130 mm. (3) The object is standing on the ground plane.
Steps: (a) Obtain the information from orthographic views (b) Locate the sight point and ensure that the cone of vision is less than 60° (c) Locate the picture line that is parallel with the front of the object on the plan (d) Locate the VP by projecting from the sight point on the horizon line perpendicularly (e) The true length is the length of the bottom line CAB on the picture plane

Design and Applied Technology (Secondary 4 – 6) Module 5
36
(f) Locate the ground line that is parallel to the picture plane (g) Produce an elevation on the ground line (h) Draw perspective lines from the VP through the front corners of the elevation of the
object (i) Draw visual rays from the sight point through all corners of the plan (j) Project down from those points from the picture plane to meet the corresponding
perspective lines to complete the perspective drawing

Design and Applied Technology (Secondary 4 – 6) Module 5
37
S T O P A N D T H I N K
Procedure for One-point Perspective Drawing (with no true length) Remark: (1) The sight point is 70 mm from the picture plane, and 150 mm above the ground plane.(2) The distance between the ground plane and the horizon line is 130 mm. (3) The object is standing on the ground plane.
Steps: (a) Obtain the information from orthographic views (b) Locate the sight point and ensure that the cone of vision is less than 60° (c) Locate the picture line that is parallel with the front of the object on the plan (d) Locate the VP by projecting from the sight point on the horizon line perpendicularly

Design and Applied Technology (Secondary 4 – 6) Module 5
38
(e) Locate the ground line that is parallel to the picture plane (f) Produce an elevation on the ground line (g) Draw perspective lines from the VP through the front corners of the elevation of the
object (h) Draw visual rays from the sight point through all corners of the plan (i) Project down from those points from the picture plane to meet the corresponding
perspective lines to complete the perspective drawing

Design and Applied Technology (Secondary 4 – 6) Module 5
39
Some English letter shaped forms can be used to create a one-point perspective drawing. How a one-point perspective of the following shape could be drawn? Given: (i) The sight point is 60 from the picture plane and 150 above the ground plane. (ii) The object is standing on the ground plane.

Design and Applied Technology (Secondary 4 – 6) Module 5
40
Two-point perspective There are two VP’s for a two-point perspective drawing. This perspective shows the depth and space of an object more practically and accurately. Two-point perspective drawings are typically used in architecture design and daily life objects.
A Two-point Perspective Drawing in Architecture Design
H I G H L I G H T Procedure for Two-point Perspective Drawing Remark: (1) The sight point is 100 mm from the picture plane and 150 mm above the ground plane. (2) The distance between the ground plane and the horizon line is 130 mm. (3) The object is standing on the ground plane.

Design and Applied Technology (Secondary 4 – 6) Module 5
41
Steps: (a) Obtain information from orthographic views (b) Locate the plan of the object and keep the centre line of vision vertical (c) Locate the sight point and ensure that the cone of vision is less than 60° (d) Locate the picture plane and the horizon line which are perpendicular to the centre line
of vision (e) From the sight point, draw 2 lines parallel to the sides of BC and CC to meet on the
picture (f) Draw two perpendicular lines to the horizon line to form two VP’s

Design and Applied Technology (Secondary 4 – 6) Module 5
42
(g) Project the heights of the object from the elevation (h) Draw perspective lines from both the left and right VP’s (i) Draw visual rays from the sight point to all points on the plan (j) Project down from those points from the picture plane to meet the corresponding
perspective lines to complete the perspective drawing

Design and Applied Technology (Secondary 4 – 6) Module 5
43
Three-point Perspective Three-point perspective is often used for viewing buildings from above or below. In addition to two VP’s at the viewer’s eye level, a third VP is put under or above the ground. A common example of a three-point perspective is looking up at a tall building, where the third VP is located at somewhere in the sky.
S T O P A N D T H I N K Two-point and Three-point Perspective Drawings In many situations, a two-point perspective drawing is used instead of a three-point perspective one. Consider the following isometric drawing:
(a) Draw a two-point perspective drawing (b) Draw a three-point perspective drawing (c) Compare and contrast the drawings Hint: A three-point perspective drawing is a combination of one-point and two-point perspective drawings.
V.P.
V.P.V.P. Horizon line
A Three-point Perspective Drawing
A Three-point Perspective Drawing for a building
Horizon line
V.P. V.P.
V.P.

Design and Applied Technology (Secondary 4 – 6) Module 5
44
2.2 Engineering drawing Engineering drawing is to represent objects on paper graphically. The drawing is to convey information, including the shapes, sizes and positions, of the drawn components. It must be concise and precise for its very purpose of communication among various project stakeholders, such as designers, engineers, manufacturers and users, ensuring the product meet all stakeholders’ needs. A drawn component can be small or big: as small as a pin, or as large as a building. It is also known as blueprint. It is commonly used in various engineering sectors, such as architectural, civil, electrical, electronic, manufacturing and mechanical. 2.2.1 Drawing format Before a design product is produced, an Engineering Drawing should be prepared for reference. Two popular specifications for engineering drawing are listed as follows:
(a) Line Specifications (b) Dimensioning Rules
H I G H L I G H T
Line Specifications Two thicknesses of line are recommended: (1) a wide line and a narrow line, in the ratio of 2:1 (2) 0.7mm for wide lines (3) 0.35mm for narrow lines The following lines are commonly used for different functions:
Shape Description Functions
Continuous (wide) Visible line
Continuous (narrow) Dimension line, projection line, section line, drawing line
Dashed (narrow) Hidden line
Long-dashed dotted (narrow)
Centre line
Long-dashed dotted (narrow), wide at ends
Cutting plane
Continuous irregular (narrow)
Border line, broken line

Design and Applied Technology (Secondary 4 – 6) Module 5
45
Dimensioning Rules The following are some rules governing the dimension labelled on a drawing: (1) Write all numbers on dimension lines with arrows, where measurement units are
optional and in mm if specified; (2) Use thin straight lines to represent dimension lines and leaders; (3) Read numbers either from the bottom or the right-hand side of the drawing; (4) Prevent dimension lines and leaders from intersecting other lines; (5) Draw dimension lines for angles in arcs; (6) Use symbols Ø and numbers to represent diameters of circles; and (7) Use symbols R and numbers to represent radii of circles and arcs.
Rule 5: Specifying angles
Rule 6: Specifying diameters
Rule 7: Specifying radii

Design and Applied Technology (Secondary 4 – 6) Module 5
46
An example of dimensioning
2.2.2 Orthographic Projection Orthographic projection is to represent a 3D object with several plane drawings. It is to see a 3D object from three different directions, such as the front, left and above, and project the object’s actual plane surface onto paper. There are three common views in orthographic projection, namely (a) Elevation – A view showing what a
viewer can see from the front; (b) Plan – A view showing what a viewer
can see from the above; and (c) End View – A view showing what a
viewer can see either from the left- or right-hand side of the elevation.
Observing a 3D object from three different directions

Design and Applied Technology (Secondary 4 – 6) Module 5
47
Placing the three projections in the same diagram There are two schemes of projections: (a) First Angle Orthographic Projection; and (b) Third Angle Orthographic Projection. First angle projection is more popular in European countries, while Third Angle Projection is more common in the United States. Each type of projection is represented by a symbol as follows:
First Angle Projection Third Angle Projection
(a) First Angle Orthographic Projection Practically, orthographic projection involves two principal planes, namely vertical and horizontal. The two planes intersect each other and produce four quadrants or angles as follows: When positioned in the first quadrant (first angle), an object is projected on, by drawing parallel lines to, the principal planes and an auxiliary vertical plane. The object’s views are then created on these planes. This is so called First Angle Orthographic Projection.

Design and Applied Technology (Secondary 4 – 6) Module 5
48
Orthographic projection of an object onto
the horizontal and vertical planes
Orthographic projection of an object onto the auxiliary plane
When the planes are unfolded, there are three views shown as follows: (i) ELEVATION (vertical plane) (ii) PLAN (horizontal place) (iii) END VIEW (auxiliary vertical plane) (b) Third Angle Orthographic Projection For Third Angle Orthographic Projection, an object is put in the third quadrant and projected on the principal planes.
Object in the third quadrant Orthographic projection of an
object onto three separate planes

Design and Applied Technology (Secondary 4 – 6) Module 5
49
The principal planes are located between the viewer and the object. Thus, the viewer should imagine that the planes are transparent. The views are projected on the principal plans, and the object should be viewed through the planes. The horizontal, vertical and auxiliary views can be unfolded and shown as follows:
H I G H L I G H T Steps for drawing the Orthographic Projection The following should be noted when first angle orthographic projection is used: (a) Reserve sufficient space for the required views; (b) Draw heights in the elevation and end views at the same level; (c) Obtain a plan view by viewing the elevation from the top and projecting downward. (d) Keep the corresponding points on the same vertical line; (e) Ensure that the depth in the plan is equal to the width in end views; (f) Position the views in a fixed pattern, but not any other ways; (g) Use short dashed lines to represent those hidden outlines and edges; (h) Draw dimensions lines, and (i) Add explanatory texts when necessary.
Drawing projection lines from the end view to the plan view

Design and Applied Technology (Secondary 4 – 6) Module 5
50
Drawing three views of projections
S T O P A N D T H I N K Second Angle and Fourth Angle Orthographic Projection An orthographic projection can be obtained by positioning an object in the second or fourth quadrant. However, it is not used in actual practice. Why? Hint: (a) Draw a second or fourth angle orthographic projection (b) Compare it with a first or third Angle one

Design and Applied Technology (Secondary 4 – 6) Module 5
51
2.2.3 Assembly and sectional drawing (a) Assembly Drawing Assembly drawing is to show how components fit together. It usually includes orthographic views and sections for showing details and relative positions of the components. A parts list is to tabulate all individual parts of an assembly. It usually contains part number, part name or description, material and quantity of each assembled part.
A balloon reference system is to link up a parts list and drawings. Each part number shown in the parts list is indicated in a balloon for reference.
Balloon reference shows the location of parts in an assembly drawing.

Design and Applied Technology (Secondary 4 – 6) Module 5
52
Assembly drawing
H I G H L I G H T Assembly Drawing of a Lens Mount Various parts of a lens mount are shown separately. An assembly drawing is also given according to the assembly positions and sequences of the parts.
All parts and assembly drawing of a Lens Mount

Design and Applied Technology (Secondary 4 – 6) Module 5
53
(b) Sectional drawing Sectional views are used to show the internal structure and complicated components of an object. Sectional views can clarify the complexity and details of the components. There are some guidelines for drafting a sectional drawing:
1. A sectional plane is a plane that separates the object 2. The parts separated in the plane are called sections 3. A sectional view is a drawing of sections 4. A sectional line X-X is to show the position of the sectional plane that separates the
object 5. A sectioned part of an object is shown by shading with thin lines of 45° that touch
the visible outline 6. Section lines of two adjacent parts are in opposite directions
An Orthographic Projection showing both elevation and sectional end views
Different separating methods give different sectional results. There are several types of sectional views:
1. Full Section 2. Half Section 3. Part Section 4. Offset Section

Design and Applied Technology (Secondary 4 – 6) Module 5
54
H I G H L I G H T Types of sectional views Several types of sectional views are shown below.
Type Features Full Section (a) The cutting plane passes through the object
(b) All visible edges behind the plane are shown (c) Hidden detailed lines are shown on the view
only when they are needed for describing the object completely
Half Section
(a) For symmetrical objects, one half is drawn in the section, and the other half as an outside view
(b) The two halves are separated by a centre line (c) Hidden detailed lines are mandatory only when
they are required for dimensioning
Part Section
(a) It is to show the internal details of an object (b) A continuous thin irregular line is used to show
a local break
Offset Section
(a) It uses one section to show two or more parallel planes
(b) There are two additional thick long dashes in the cutting plane to show the changes in direction

Design and Applied Technology (Secondary 4 – 6) Module 5
55
Analysis: One object gives different sectional views There may be different views for an object. The figures below show how different sectional views are formed for different section line positions:
As the figure illustrates, orthographic projection facilitates the subsequent drawing of sectional views. 2.2.4 Detailed drawings A detailed drawing is a document describing all items for mechanical equipment production in detail. It is to ensure that the items are manufactured according to designers’ requirements.
H I G H L I G H T Detailed Drawing A detailed drawing includes two kinds of information, namely (a) General information, which includes the company name, title of drawing, unit, scale
and projection method is shown in the title block. (b) Parts information, which includes orthographic views, dimensions and specifications
of parts

Design and Applied Technology (Secondary 4 – 6) Module 5
56
The diagram below shows how the information is placed.
A detailed drawing can contain one drawing, or a number of separate drawings on a single sheet. It depends on the required level of details. An example of a detailed drawing is shown below:
Analysis: Detailed drawing used in different aspects Detailed drawing is used in not only engineering drawing, but also architectural drawing and electrical drawing. Examples can be found from in Topics 2.3 and 2.4.
The following websites provide more information about engineering drawing:
http://www.design-technology.info/IndProd/drawings/default.htm http://www.ider.herts.ac.uk/school/courseware/graphics/engineering_drawing/ http://www.roymech.co.uk/Useful_Tables/Drawing/Mech_Drawings.html#GA

Design and Applied Technology (Secondary 4 – 6) Module 5
57
2.3 Standards, conventions and symbols The architect or designer of a building under planning has to communicate the construction details to relevant project stakeholders. For easy communication across different stakeholders and projects, standards and/ or convention should be adopted. In particular, symbols are used on floor plan drawings. 2.3.1 Architectural drawing Architecture is a big topic covering the designs of buildings, communities and outside areas. Architects create drawings based on designs. In the subsequent parts, architectural drawings are used to illustrate how standards and symbols work. (a) Architectural drawing terms Architectural drawing is extended from orthogonal projection. It has its own set of terms and conventions.
H I G H L I G H T
Architectural drawing There are five orthogonal views below, namely (a) Top view, which is known as the plan (b) Front view, which is the front elevation (c) Right side view, which is the right elevations; (d) Left side view, which is the left elevations (e) Rear view, which is the rear elevation
S T O P A N D T H I N K Viewing Angle Why do plan views instead of elevation views are more commonly used in many architectural drawings? A bird’s eye view can give a complete view of the floor area, including walls, windows and doors. It is known as the floor plan.

Design and Applied Technology (Secondary 4 – 6) Module 5
58
In order to indicate the features of a floor plan clearly, some conventions are used. For example, hinged doors are shown in the open position. Arcs traced by the edges of doors are also shown.
S T O P A N D T H I N K Architectural floor plan representation Some common floor plan representations for walls, windows and doors have been shown below for illustration purposes. Name some other representations that are used in floor plans.

Design and Applied Technology (Secondary 4 – 6) Module 5
59
(b) Domestic residence floor plans In an one-line floor plan, the outside of the outer walls and the centres of the internal walls are represented by single thin lines. The first rough floor plan is compiled to a 100 mm module, i.e. all measurements are in 100 mm or its multiples. Furthermore, it is a market practice to have the front door placed at the bottom of the plan.
H I G H L I G H T Drawing of walls and windows The thicknesses of the outer and inner walls have been drawn. The thickness of the outer walls varies with the construction method.

Design and Applied Technology (Secondary 4 – 6) Module 5
60
The next step is to add overall dimensions and door and window dimensions, as well as labelling different rooms of the flat.
(c) Building elevations Generally speaking, occupants of a building are concerned more about the interior layout. Exterior appearance and functionality should not be underestimated however. Taste, function and cost should be balanced as far as possible. A floor plan indicates the interior layout of a building, and gives no information about the appearance of the building. All external features of a building are shown in the elevations.

Design and Applied Technology (Secondary 4 – 6) Module 5
61
H I G H L I G H T
Building elevation The front, rear, left and right elevation drawings can provide the readers with more details about the appearance of a building.
(d) Sectional drawings Engineering drawings use sections to show the interior and hidden features of an object. Similarly, architectural drawings use sections to show the interior views of the rooms of a building and details of building construction. Sectional architectural drawings can be used to show where cupboards, kitchen and bathroom fixtures are located.

Design and Applied Technology (Secondary 4 – 6) Module 5
62
(e) Architectural drawing scales The most common scale for floor plans and elevations is 1:100. It means that a length of 10 mm on the drawing represents 1000 mm (l m) on the actual building. For small buildings, a smaller scale, such as 1:50, can be used to show more details. A site plan can be in a scale of 1:200, which is to small for larger buildings, especially when further details are desirable. For larger sites, a scale of 1:500 or even 1:1000 may be used. In other words, a building on a site plan may be as small as 0.5, 0.2 or 0.l of its size when shown on a floor plan. (f) Dimensioning architectural drawing The rules of dimensioning in orthogonal drawing can be applied to architectural drawing. Dimensions of architectural drawing are usually in millimetres. It facilitates scale conversion, such as from 37.5 m to 37,500 mm and vice versa. The overall layout size of a building has to be specified by the overall dimensions before foundation work starts. For the outside part of the object area, projection lines can be used to show dimensions of interior features. In many cases, in order to avoid overcrowding a drawing’s interior, projection lines do not originate from the actual feature. 2.3.2 Architectural electrical drawing (a) Use of symbols For large buildings, it is common to have different drawings for different workers, such as air conditioning, lifts, reinforcing materials, telephone and public address systems, fire detection, plumbing and electrical fittings. For smaller ones, separate drawings are prepared for plumbing and electrical work only.

Design and Applied Technology (Secondary 4 – 6) Module 5
63
H I G H L I G H T Electrical Drawing The picture below is a floor plan for electricians. The electrical wiring symbols in the picture focus on the outlets, such as fixed appliances, general-purpose outlets and lighting, as well as their control switches.
Among others, 1:100 is a scale often used in floor plans. Symbols have to be drawn in an ‘appropriate size’, but may or may not be on scale. An appropriate size means that a symbol has to be drawn in a size not too large to exaggerate the actual size; and not too small to create difficulty in drawing. For example, an outlet of 3.5 mm on a floor plan is considered too large since it represents an outlet of 350 mm. On the other hand, it is difficult for a designer to draw or a reader to spot a normal general-purpose outlet of a scaled size of l mm on a floor plan. Symbols of outlets, switches, fixed appliances, etc are only drawn in approximate position. The actual installation positions are determined by the electricians.
S T O P A N D T H I N K Electrical Wiring Connection What kind of drawing is used to represent the electrical connection between a switch and equipment?

Design and Applied Technology (Secondary 4 – 6) Module 5
64
(b) Electrical architectural symbols The symbols used in different organizations vary. Therefore, a legend can help electricians to know what the symbols mean. Some associations set standards on electrical symbols, such as:
1. Standards Australia 2. British Standards 3. National Standards (Guo Biao, GB)
There are amendments on symbols from time to time. Therefore, an engineer has to check for any amendments before producing electrical drawings. Examples for electrical symbols (British Standards)
Category Description Symbol
Lighting outlet position Lighting outlet on wall Number and power of lighting in a group (four 40-watt lamps)
Incandescent (LIGHTING)
Projector general purpose Fluorescent lamp – single tube Fluorescent lamp – double tube
Fluorescent (LIGHTING)
Discharge lamp – general symbol SWITCHBOARD M.C.B. distribution board
General symbol: the type of an appliance can be specified inside the symbol by using a standard abbreviation as follows.
EF: exhaust fan AC: air conditioner
APPLIANCES
DW: dish washer
One way: single pole
One way: two pole
One way: two pole with pilot lamp
One way: three pole
Pull cord switch: Single pole
SWITCHES
Push button

Design and Applied Technology (Secondary 4 – 6) Module 5
65
Category Description Symbol
Connector box: the actual type of connector box can be specified inside the symbol by using a standard abbreviation as list below.
F: 2A Fuse C: 15A
CONNECTOR BOX
S: 20A
General purpose outlet
Multiple outlet (two)
Wall telephone outlet
SOCKET OUTLETS
Floor telephone outlet
Electric bell Electric clock OTHERS
Exhaust fan
S T O P A N D T H I N K Electrical symbols 1. Name other types of electrical symbols. 2. Is National Standards (GB) or British Standards more common electrical symbols in Hong
Kong? Why? (c) Features and symbols Symbols carry only certain characteristics of the appearance of objects that they represent. Most of them are single lined. The major purpose of using symbols is to facilitate designers’ drawing and readers’ recognition.
S T O P A N D T H I N K Symbols Following the guideline mentioned above, create a symbol for a computer. (d) Symbols and floor plans Both specifications for electrical wiring and floor plan drawings are instructions for electrical installation. The specifications include
1. Wiring methods and materials 2. General layout methods 3. Types of accessories to be used 4. Mounting heights of switches and outlets

Design and Applied Technology (Secondary 4 – 6) Module 5
66
(e) Size of symbols The size of the symbols has no meaning with the actual size of an outlet or appliance. Normally, the size of a symbol is comparable with that of the lettering on the drawing. For example, if the height of the lettering is 3.5 mm, the diameter of the symbol of a lighting outlet should be around 3.5 mm as well. The size of symbols ranges from 3.5 mm to 5 mm in general. Otherwise, the symbols are either too small for readers to read, or too large to fit into a drawing. (f) Application of symbols A complete electrical installation covers the wiring system from the point of entry of the supply to the main switchboard and the final sub-circuits feeding the outlets and appliances. The position of a switchboard is usually indicated on an electrical floor plan. In larger installations, a special room is arranged to house the main switchboard. Furthermore, separate distribution boards are used and designated by the notation DSB within the symbol on the plan. A dashed line, which does not indicate the wiring positions, is drawn between a switch and an outlet to indicate the connection. Each switch is connected to the outlet by a dashed line in multi-way switching. 2.3.3 Furniture and appliance symbols In architectural drawings, the layouts of furniture and household appliances are important to the overall interior design. There are no specific symbol standards at the moment. Some examples of symbols which are drawn quite explicitly are shown below.
Bed
Sofa
Chair
Desk

Design and Applied Technology (Secondary 4 – 6) Module 5
67
Dining table with chairs
Refrigerator
Computer monitor
Computer keyboard and mouse
Lamp
2.3.4 Fastening devices symbols Temporary fastenings are items that can be withdrawn or replaced at any time, such as screws, bolts, nuts and keys. Permanent fastenings are items that involve destruction of the jointing elements if separated, such as riveting and welding. (a) Examples of temporary fastenings
Countersunk head
Round head
Screw
Recessed head

Design and Applied Technology (Secondary 4 – 6) Module 5
68
Hexagonal head
Bolt and nut
Key
(b) Examples of permanent fastenings
Rivet
Square butt weld
Single-V butt weld
Fillet weld

Design and Applied Technology (Secondary 4 – 6) Module 5
69
2.4 Data presentation The following information must be presented to audience clearly: (a) Major features of the design (b) Data gathered and analyzed (c) Benefits of implementing the design The presentation of the findings, conclusions and recommendations must be objective. 2.4.1 Types of presentation (a) Informal Presentations The audience of informal presentations are a group of knowledgeable design associates and/ or supervisors. (b) Formal Presentations Formal presentations are usually given to a larger group of people with different interests. For example, functionality and acceptability of a design are the primary concerns of engineering associates, while profitability is main concern to investors. 2.4.2 Visual Aids Visual aids, such as charts, graphs, artworks and models, are more preferable than lecture notes in presentations for efficient and effective communication. The following suggestions help the preparation of visual aids:
i. Each visual aid should be limited to a single concept ii. Illustrations, colours, etc can draw audience’s attention easier
iii. Only key points should be shown on presentation slides iv. Texts should be in large font size for easy reading
(a) Charts There is a large amount of data in the design process. To facilitate the subsequent analyses, charts can be used to present the data.
1. Bar chart The following are the passing rates of 7 subjects in an examination:
Subject English Language
Chinese Language Mathematics Liberal
Studies
Design and Applied
TechnologyGeography Economics
Passing rate (%) 78 80 87 70 78 72 70 A bar chart can be used to show the passing rates.

Design and Applied Technology (Secondary 4 – 6) Module 5
70
S T O P A N D T H I N K Bar chart Bar charts are commonly used for data comparison. Readers can simply compare the data by looking at the height of the bars. Spacing between adjacent bars has to be sufficient to facilitate the comparison. X- and Y-axes have to be labelled clearly. Name one application of bar charts in daily life.
2. Pie Chart
A pie chart is used to show the proportion of component items within a set. The sum of all the items is 100%.
S T O P A N D T H I N K Pie chart The pie chart below shows the distribution of favourite snacks of students in Class A. The proportion of students selecting various kinds of snacks is shown in the chart. Among the five types of snacks, chocolate is the most popular. Name one application of pie charts in daily life.

Design and Applied Technology (Secondary 4 – 6) Module 5
71
3. Line chart A line chart can show the quantity change of an individual item. It is therefore suitable for presenting the performance of an event over a period of time.
S T O P A N D T H I N K Line chart The example below shows the passing rates of final examinations from 1999 to 2009. It can easily be observed that the passing rates keep climbing. Name one application of line charts in daily life.
Passing rate of final examination
0
10
20
30
40
50
60
70
80
2002 2003 2004 2005 2006 2007 2008 2009
Year
Pass
ing
rate
(%
)

Design and Applied Technology (Secondary 4 – 6) Module 5
72
H I G H L I G H T Other line chart applications A line chart can be used to show the index of a stock market over a period of time, indicating the ups and downs of the index.
Stock index for the year 20XX
0
5000
10000
15000
20000
25000
30000
Jan Feb Mar Apr May Jun Jul Aug Sep Oct Nov Dec
Month
Stoc
k in
dex
(b) Artworks To keep audience’s attention, slides can be made more attractive and effective with artworks of different colours. White backgrounds should be avoided for their eye-tiring effects.
An example of artwork showing uppercase letters and spacing
(c) Models Models are the most practical and convincing visual aids for a final design. They should be large enough to be seen, especially when there is a large number of audience or the presentation venue is large. To facilitate the presentation, close-up photographs of different

Design and Applied Technology (Secondary 4 – 6) Module 5
73
angles of the model should be given.
S T O P A N D T H I N K Artworks and models What are the advantages of using artworks and models? (d) Multimedia presentation Software packages, such as PowerPoint, can be used to make presentation slides. For small groups of audience, the slides can be shown on computer monitors. For larger groups, the slides can be projected onto large screens.
1. PowerPoint texts: they may be of different colours, styles and font sizes 2. Multimedia applications: PowerPoint may include photos, videos, special effects
and animations.
S T O P A N D T H I N K Multimedia PowerPoint Name two types of multimedia applications that can be included in a PowerPoint presentation. Explain why they are used. 2.4.3 Presentation script Presenters usually prepare scripts for presentations. A script lists key points of a presentation. 2.4.4 Presentation stage During a presentation, a presenter can stand or sit near the screen. S/he can refer to the PowerPoint slides while facing the audience. S/he can also use a pointer to emphasize some points on the screen. 2.4.5 Presentation skills Layout: A good presentation should have an attractive introduction, a logical body and a clear conclusion. It should be presented in sequence to facilitate audience’s understanding. Arrangement of visual aids: Tables, diagrams and multimedia visual aids have to be arranged properly to help to highlight important points. Use of non-verbal communication: During a presentation, non-verbal communication channels, such as gesture and eye contact, can transmit messages more effectively.

Design and Applied Technology (Secondary 4 – 6) Module 5
74
CHAPTER 3 – COMPUTER-AIDED DESIGN (CAD) The chapter covers the following topics:
3.1 Virtual Prototypes 3.2 Criteria for Computer Modelling Techniques 3.3 CAD Software 3.4 The Impact of CAD on the Design Process
These topics include learning materials and activities that facilitate students to:
(a) Identify the fundamentals of Virtual Prototyping (VP) (b) Classify prototyping into three phases (c) Compare geometric modelling and prototyping (d) Understand VP’s benefits and roles in product development (e) Know the key techniques associated with VP (f) Understand the conversion of CAD file formats (g) Identify the primitives and features approaches of different modelling techniques (h) Identify the constructive solid geometry representation (C-Rep) (i) Know the advantages, disadvantages and constraints of different modelling
techniques (j) Appreciate the CAD software used in graphic design, multimedia production, interior
and architectural design, engineering design and product design (k) Appreciate CAD’s impact on the design process
3.1 Virtual Prototyping (VP) Computer-Aided Design (CAD) systems have experienced significant evolution since its development in the 1950’s. CAD systems utilize both hardware and software for users to create, revise and retain drawings. At first, CAD systems could develop only 2D drawings. Today, 3D models can also be created. All 3D models are mathematically enriched, allowing users to update whenever necessary. In addition, commercial 3D modelling software can effectively and efficiently produce virtual prototypes of real objects, such as bottles, furniture and aircrafts, from sketching. This chapter summarizes VP’s concepts, constraints and benefits in the product development process. 3.1.1 Fundamentals of VP A virtual prototype is a computer-based simulation of system or subsystem that has a certain functional realism comparable to a physical one. According to Garcia, Gocke and Johnson (Virtual Prototyping: Concept to Production, Defense System Management College Press, Fort Belvoir, VA, 1994), the process of using virtual, instead of physical, prototypes to examine and evaluate specific characteristics of a design is called virtual prototyping (VP).

Design and Applied Technology (Secondary 4 – 6) Module 5
75
It is not unusual that the physical prototype of a new product is modified many times to meet customers’ requirements before launched. These modifications provide feedbacks for design improvement, such as alternate design selection, engineering analysis, production planning, and product visualization. While manually made prototypes are costly, Rapid Prototype (RP) is a competent tool that can create precise prototypes within a short period of time. At the initial stage of manufacturing, RP systems use quality CAD/ CAM/ CAE software to construct solid models, which are manipulated by Stereolithography (STL) format subsequently. STL is a standard file format for prototyping machines to describe CAD geometry used in RP systems.
Stereolithography (STL) Technology
S T O P A N D T H I N K
Use any 3D programs such as Pro/Engineer, Unigraphics, SolidWorks, etc. to create a virtual prototype.
Explain the advantages of using virtual prototypes over physical ones. Try to convert a 3D CAD modelling file format to a Stereolithography (STL) one and
then use a prototyping machine to produce it.
The two main advantages of virtual prototypes over physical ones are higher speed and lower cost.

Design and Applied Technology (Secondary 4 – 6) Module 5
76
3.1.2 Three phases of prototyping Model making uses a physical prototype to realize the conceptualization of a design before mass production. Prototypes are experimental products made by, for example, different materials, castings or molds. A prototype is a preliminary model of an object. First Phase - Manual or Hard Prototyping People have been using prototypes for product development for hundred of years. The models then were primitive. Since they all were made manually, long creation time was required for each model.
Manual or hard prototyping
Second Phase - Virtual or Soft Prototyping (VP) Prototyping was integrated with sophisticated CAD/ CAM/ CAE software in the early 1980’s, evolving to virtual or soft prototyping. VP models can be tested and analysed as physical prototypes are, and are increasingly complex. For example, the stress factor of a product can be precisely estimated by in VP software through indicating the exact material features and quality. The prototypes built can also be input into some designated equipment for building physical models. The models are more precise than those made in the old days. The heavy skill-based efforts required however hinder the ability of time savings.

Design and Applied Technology (Secondary 4 – 6) Module 5
77
By assigned different natural or customized materials to a product in design, VP can also facilitate kinematics and motion analyses.
Third Phase - Rapid Prototyping (RP) RP is the third phase of the prototyping evolution. It includes solid free-form fabrication, desktop manufacturing and layer manufacturing technology. Parts nowadays are much more complex than those in the 1970’s were. The production time requirement is also much more demanding than that in the old days. This series of methodology therefore is also known as ‘watershed event’.
Virtual or soft Prototyping
Rapid Prototyping

Design and Applied Technology (Secondary 4 – 6) Module 5
78
3.1.3 Parallel comparison between geometric modelling and prototyping
Geometric Modelling Prototyping First Phase: 2D Wireframe
Began: mid 1960’s 2D wireframe applications, such as
1. Architecture layouts for ducting and wiring systems
2. Three plan views (top, front and side) for interpretation of actual objects
Manual drafting technique
First Phase: Manual Prototyping
Traditional practice Manual prototyping applications, such as
1. Physical models of mechanical objects 2. More clearer and precise illustration
Manual prototyping technique
Second Phase: Surface Modelling
Began: mid 1970’s More complex More information of surface shape,
size, direction and related surface properties provided
Second Phase: Virtual Prototyping
Began: mid 1970’s More complex Possible for stress testing and simulations
Third Phase: Solid Modelling
Began: early 1980’s Integration of parametric, constraint
and feature based modelling techniques for 3D solid model creation
Possible for dynamic analysis Possible to see interference among
parts Clearer presentation
Third Phase: Rapid Prototyping
Began: mid 1980’s Short lead time and cost effective for hard
prototype production Possible for limited testing Possible for sales and marketing Clearer presentation

Design and Applied Technology (Secondary 4 – 6) Module 5
79
3.1.4 The benefits of virtual prototype Virtual prototyping is a widely applied technology for its benefits as follows: 1. Good impression to buyers
(i) Enable interaction with buyers (ii) Enable demonstration of product functionalities and special features with
animation and movement capabilities, illustrating how the product is value for money and increasing bargaining power
2. Wider distribution Enable wide distribution to potential buyers through electronic means with
minimal additional cost 3. Low-cost development
Enable easy modification, making modification cost lower than physical ones 4. Sophisticated design
Enable easy and low-cost modification, making final products sophisticated enough with minimal, if not no, unexpected problems when launched
S T O P A N D T H I N K Name and describe one rapid prototyping technique. Explain the relationship between virtual prototyping and rapid prototyping.
3.1.5 Rapid Prototyping (RP) techniques RP is a collection of techniques for fast scale model fabrication of parts or assemblies using 3D CAD data. RP produces rapid prototypes with Laying Manufacturing Technology, which manufactures materials layer by layer. Refer to Section 3.4.5’s ‘HIGHLIGHT’ for more information. In addition to product visualization, RP produces physical models for testing. For example, RP can produce
(a) Airfoil-shape models for laboratory testing of wind tunnel (b) Male models for tooling, such as silicone rubber molds (c) Finalized parts (d) Complicated shapes or parts quickly.
Some RP’s commercial usages are shown as follows:
Stereolithography (SLA) Selective Laser Sintering (SLS) Laminated Object Manufacturing (LOM) Fused Deposition Modelling (FDM) Solid Ground Curing (SGC) Ink Jet printing techniques (3DP)

Design and Applied Technology (Secondary 4 – 6) Module 5
80
3.1.6 Product development process There are five components in a typical product development process, namely:
(a) Design (b) Analysis (c) Manufacture (d) Inspection (e) Production (Assembly)
1. In the design stage, designers use CAD/ CAE software to design new products. 2. If the clients accept the designs, designers use the software to analyse and optimize
the design. Detailed specifications for the manufacturing process are then produced.
3. End products are in the manufacture stage. 4. In the inspection stage, the end products are inspected to ensure their compliance
with client’s requirements. 5. In the final stage, i.e. production, information finalized along the product
development process is used for the product’s mass production. In reality, some stages of the product development process may overlap for various reasons. For example, it is a modern concurrent engineering practice that design and manufacturing are executed in parallel. 3.1.7 VP’s Roles in Product Development Process In order to generate detailed specifications for production of assemblies, designers have to input functional requirements, constraints and criteria into the design process. Such information mainly comes from market and customer requirements. The specifications consist of both geometrical and non-geometrical object information. Non-geometrical information refers to materials, hardness, etc. Traditionally, geometry is derived from engineering drawings, and has some significant shortcomings. VP can remedy these shortcomings. The standard activities of a product development life-cycle are shown as follows:

Design and Applied Technology (Secondary 4 – 6) Module 5
81
Product development process
A product can be marketed and distributed to buyers after it is assembled. To improve product quality, VP data can be shared among parties involved in the product development process. VP enables designers to create computational prototypes for operating and analysing the replica as if they were real physical objects. VP integrates computer supported modelling, simulation, target products and production for product realization in the virtual world. The design world interacts with the virtual world. A virtual design environment is formed by combining product definition, design engineering and manufacturing.
The principle of a virtual prototyping-aided design

Design and Applied Technology (Secondary 4 – 6) Module 5
82
H I G H L I G H T (a) Product design (i) Increase complexity and diversity of parts with minimal effects on lead time and
costs; and (ii) Minimize time spent on discussing and evaluating different manufacturing
possibilities (b) Tool design and manufacturing (i) Optimize design, manufacturing and verification processes of tools; (ii) Reduce parts count; and (iii) Eliminate tool wear (c) Assembly and test (i) Reduce manufacturing labour, such as machining, casting, inspection, and
assembly; and (ii) Reduce material costs, such as handling, waste, transportation, spare and
inventory (d) Function testing Avoid design misinterpretations, i.e. what you see is what you can get (WYSWYG)
3.1.8 Key techniques associated with virtual prototype (A) Modelling and Simulation 1. Simulation is usually used for assessing a product’s behaviour under various scenarios.
Computer simulation with virtual prototypes on manufacturing operations is to minimize the potential time and effort required for fixing errors after product launch.
2. Simulation facilitates feasibility test for new manufacturing process to be launched. The simulation results help designers to design products in the most effective manner before equipments and facilities are invested.
3. Modelling and simulation produce useful data for operations improvement, enabling testing of alternative operations without interrupting the production processes.
An overview of how modelling and simulation enhance operations and product development process is listed as follows:
Examine the impact on a product’s quality quickly for any changes in the manufacturing operations;
Identify root causes of problems in complicated procedures; Illustrate long-run performance rapidly; Test manufacturing controls and product flows before actual implementation; Fix activities by working out the production line and planning the process Explore alternatives and variables for best solutions

Design and Applied Technology (Secondary 4 – 6) Module 5
83
Simulating the manufacturing operation on a computer.
(B) Kinematic Analysis Kinematic analysis considers the behaviour of mechanical motion. It refers to dynamic analysis if force is exerted on the motion model. Commercial kinematic programs enable creation of 3D models and animated images of the movements of mechanisms and complex structures. Kinematic analysis enables the following benefits:
Visualize how a design will behave in reality, determining the velocities, accelerations and loads involved;
Enable slow-motion animation to reveal potential problems, such as unwanted vibrations and dangerous deflections;
Rotate 3D models to test whether or not parts fit the operations when assembled;
Detect the areas with cyclical or repetitive motions, such as gears and linkages;
Simulate events which happen too fast in reality, such as car accidents; and
Experiment objects that are not feasible to investigate in real life, such as artificial limbs or organs, deep-sea oil-drilling platforms and satellites
S T O P A N D T H I N K
Explain what kinematic analysis is. Name some examples of how kinematic analysis is used for industries.
Kinematics Analysis Diagram

Design and Applied Technology (Secondary 4 – 6) Module 5
84
(C) Product realization and modification Virtual modelling makes two major contributions, namely
1. Creating substitutes for real objects, and 2. Identify feasible solutions for problems.
Conventional design processes involve 2D technical hand drawings as well as manual production of supporting ground work. Thus, product modification is time and resources consuming. Gradually, CAD systems are used for computer-generated drawings, such as 3D wireframe and surface models and solid models. Nowadays, CAD/CAM/CAE software, such as SolidWorks, Unigraphics and Pro/Engineer, can build even more sophisticated 3D modelling. The major developments in virtual modelling are summarized below:
Parametric modelling Parametric modelling makes 3D modelling creation flexible. A user can specify parameters to control the properties, such as shape and size, of a 3D parametric model.
Constraint-based modelling Constraint-based modelling is similar to but more powerful than parametric modelling. A user creates a model by specifying constraints on design elements, such as ‘Plane surfaces A and B are mated together’ and ‘Holes A and B are of the same diameter’. The constraints are held even if the designs are modified. Feature-based modelling
Feature-based modelling allows users to create 3D models by specifying features, such as bosses, chamfers, fillets, holes and pockets, with specific edges and faces. When a model is re-generated or modified, its edges and faces change accordingly while features’ relationships remain unchanged.
Product realization using parametric modelling

Design and Applied Technology (Secondary 4 – 6) Module 5
85
3.2 Criteria for computer modelling techniques A designer may have her/ his own style to present the 3D objects of her/ his work. For example; s/he may express her/ his design concepts with different types of drawings and associated projection of 3D geometrical information onto a 2D medium. Nowadays, advanced 3D modelling is commonly used. In addition to easy creation of 3D models, advanced 3D modelling helps designers to evaluate different situations over the product development process. Furthermore, different 2D and 3D projection views can be generated for designers and other project stakeholders to visualize the real product. This section helps to foster the fundamental concepts of graphic systems. Students are expected to
1. Comprehend the principles and basic techniques of 3D modelling 2. Understand the related constraints 3. Be aware of the pros and cons of each methodology
3.2.1 Fundamentals of Graphic Systems There are two categories of computer graphic images, namely vector and raster. Vector graphic images cover lines, squares, rectangles, circles, etc. They are represented as mathematical formulae. Graphic elements can be combined, while keeping each element’s own integrity and identity in computer databases. Thus, they can be selected, modified and resized independently. Those graphic systems that create and manipulate vector images are called ‘draw programs’. AutoCAD, CorelDraw, Adobe Illustrator and Freehand are some of these software packages that are available in the market. A raster graphic image is a pattern of dots or a bit map, and usually called bitmapped image. Those graphic systems that create and manipulate raster images are called ‘paint programs’. Adobe Photoshop and Corel paint are some of these software packages that are available in the market.

Design and Applied Technology (Secondary 4 – 6) Module 5
86
The effects of magnifying vector and raster graphics are shown above. The label on the left hand side is a vector graphic image. When it is magnified by a draw program, the enlarged image is a vector one as shown in the upper-right circle. When it is magnified by a paint program, the enlarged image is a bitmap as shown in the lower-right circle.
S T O P A N D T H I N K (a) Create and save a logo with the Paint program bundled in Microsoft Windows. (b) State and explain whether the created graphic image is a vector or raster image. (c) State and explain whether Paint is a draw or paint program.
S T O P A N D T H I N K (a) Name five draw programs. (b) Name five paint programs. (c) Compare the advantages and disadvantages of draw and paint programs.
Computer monitors and printers are popular raster devices. Monitors display images as a matrix of dots, or ‘pixels’. To display a vector image on a monitor, the image has to be ‘rasterized’, or converted into dot patterns, through hardware or software. In addition; a vector image has to be rasterized into a pattern of ink dots before being able to be printed. Similarly, texts or pictures on paper have to be transformed into rasterized bitmapped images by optical scanners or fax machines.

Design and Applied Technology (Secondary 4 – 6) Module 5
87
S T O P A N D T H I N K (a) Scan and save some pictures. (b) Use a program to rotate the images by 90°, 180°, 270° and 360°. (c) Describe the rotated graphic images. (d) Use a program to scale the image by 2X, 20X and 40X. (e) Describe the scaled graphic images.
(a) Raster Image
A raster images is composed of many individual squares or pixels of assorted colours. The measurement unit of pixels, or resolution, is dots per inch (dpi). The higher the resolution, the higher quality an image is. For example, an image on the web can be 72 dpi, while a high-resolution image should be 300 dpi or more. Mosaic is a raster image, and looks smooth from a distance but shows individual pixels at a closer look.
S T O P A N D T H I N K Can the output quality of a raster image be affected by the resolution of the output device, such as a printer or monitor? Explain.
1. Resolution of raster image Similar to a raster image, the resolution of a printer or scanner is also measured in dpi. The output quality of a printer or scanner depends on the resolution of the bitmap or scan that the equipment is dealing with. Therefore, the printing quality of a 300 dpi raster image on a 300 dpi laser printer is identical to that on a 600 dpi one. When a 300 dpi bitmap is enlarged in a graphic program, its tiny pixels become bigger and bigger, to an extent that ‘jaggies’ become observable. As the image returns to its original size, the squares become smaller and the jaggy edges disappear eventually. This explains that the resolution of an image itself, capabilities of printing devices and whether or not the image has been scaled up all contribute to the quality of a printed raster image.
2. File formats of raster image No matter whether an image is vector or raster original, it will become a raster image when scanned. Some common file formats of raster images are listed below:
i. BMP (Windows Bitmap)
This bitmap shows jaggies when magnified ten times.
Bitmap Image:

Design and Applied Technology (Secondary 4 – 6) Module 5
88
ii. CPT (Corel PhotoPaint) iii. GIF (Graphics Interchange Format) iv. JPEG (Joint Photo-graphics Expert Group) v. PCX (Paintbrush)
vi. PNG (Portable Network Graphic) vii. PSD (Adobe PhotoShop)
viii. TIFF (Tag Interleave Format)
S T O P A N D T H I N K
Create a graphic image with Paint. Convert the image into BMP, GIF and JPEG formats. Compare the three file formats and identify the one of the smallest file size.
(b) Vector image Vector images are digital images that are constructed by a chain of commands or mathematical formulae. In Physics’ world, a vector image represents both quantity and direction simultaneously. In vector graphics, a file that results from a graphic artist’s work is created and saved as a set of vector statements. When creating a vector image in a vector illustration program, nodes or drawing points are inserted while nodes, lines and curves are connected together. Each node, line, curve and every aspect of a vector object are described mathematically by graphics software. Text objects are created by linking up nodes, lines and curves. Every letter in a font starts as a vector object. Vector images are object-oriented, while raster images are pixel-oriented. As a result, a vector object has a ‘wireframe’ underneath the colours in the object. Colours of a vector object are considered clothes over a skeleton. CorelDRAW and Illustrator are two examples that create text and objects using easily for easy manipulation.
S T O P A N D T H I N K
Create a logo with a draw program. Scale the image by 2X, 20X and 40X Describe the scaled image. State, and explain, whether the created graphic image is a raster or vector image. State, and explain, whether or not the output quality of a vector image can be affected
by the resolution of the output device, such as a printer or monitor.
Animation images are also created as vector files in general. As an example, Shockwave’s Flash creates 2D and 3D animations that are vector files during transmission and are rasterized as soon as they arrive at the destinations.

Design and Applied Technology (Secondary 4 – 6) Module 5
89
Vector Graphic:
This vector image is surrounded by eight anchor points shown as red squares. The size of the object can be scaled up or down by dragging any one of the anchor points using a mouse.
1. Resolution of vector image Vector graphics are a better choice than raster for use in computers because they impose no constraints on the resolution of printers or scanners. A vector image is defined by mathematical formulae instead of pixels. To enlarge or reduce the image, a draw program only has to multiply the object’s mathematical description by a scaling factor. The image quality will not deteriorate no matter whether it is scaled up or down. For example, the size of a 1-inch square object is doubled by multiplying its length with a scaling factor of 2. The mathematical formulae will recalculate and generate a double sized object. This explains why vector images are commonly used for clip art. 2. File formats of vector image Some common file formats of vector images are listed below:
i. AI (Adobe Illustrator) ii. CDR (CorelDraw)
iii. DXF (AutoCAD) iv. EPS (Encapsulated PostScript) v. PLT (Hewlett Packard Graphics Language Plot File)
vi. SVG (Scalable Vector Graphics) vii. WMF (Windows Metafile)
S T O P A N D T H I N K (a) State and explain whether a vector image can be converted into a raster one. (b) State and explain whether a raster image can be converted into a vector one.
3.2.2 CAD file format converting As mentioned above, vector graphics are represented mathematically while raster graphics by pixels. Bitmaps are also known as raster files. ‘Raster’ is a more appropriate term from a technical perspective for the bi-level and black-and-white nature of such files.

Design and Applied Technology (Secondary 4 – 6) Module 5
90
PostScript can be considered a computer language that converts vector graphics into raster for display in computers. Vector files thus need not be associated with particular resolutions since they can be generated from raster images of any sizes. The conversion of a raster graphic into a vector one is not as simple, unfortunately. Before a computer identifies a direction to draw a pattern of pixels in a raster image as a vector graphic, the pixels first have to be captured as shapes. Despite the availability of software packages in the market for such conversion, their performance is pending for improvement. In addition, a vector graphic describes how an image is drawn and contains raster information, and a raster graphic can be embedded in a vector graphic. It reverse does not hold: a raster graphic is not able to contain vector information. For a vector graphic being added to a raster, the only possible solution is to first convert the vector image into the raster.
S T O P A N D T H I N K Insert a vector image into a webpage. Insert a raster image into a webpage. Compare the raster image with the vector one. Identify, and explain, which format is preferred.
H I G H L I G H T It is important that a graphic created or modified be saved in a correct file format. An incorrect format risks losing the image’s quality. This section reviews the basics of image file formats and explains how to select an appropriate format for a particular task.
3.2.3 3D Modelling Time-consuming and high speed computers required for calculating and displaying image are two obstacles of 3D modelling. Despite that, 3D modelling provides the following benefits:
1. Enhance the efficiency of design and manufacturing applications greatly; it makes large complex drawings of, for example, pipe-work installations and architecture as well as plant layouts easier than the old days
2. Analyse physical properties automatically – such properties refer to centre of gravity, moments of inertia, weight, etc; with 3D modelling, geometric problems of complex blends, interpenetrations; etc can also be solved
3. Facilitate the tool-path and robotics simulation of integrated CAD/CAM/CAE systems
4. Process all primary data and information during product development to facilitate the design

Design and Applied Technology (Secondary 4 – 6) Module 5
91
There are three different categories of 3D modelling procedures in CAD/CAM/CAE systems, namely:
Wireframe Modelling Surface Modelling Solid Modelling
(a) Wireframe Modelling A vertex table and an edge table form a wireframe model which is considered the most primitive 3D object model. Such a model does not contain face information. A vertex table keeps each vertex point with corresponding coordinates. An edge table keeps the two incident vertices of every edge. The cube shown below has 8 vertices and 12 edges, with corresponding labels in red and black respectively.
Vertex Table Edge Table
Vertex x y z Edge Start
Vertex End
Vertex A 0 0 1 1 A B B 0 -1 1 2 B C C 1 -1 1 3 C D D 1 0 1 4 D A E 0 0 0 5 A E F 0 -1 0 6 B F G 1 -1 0 7 C G H 1 0 0 8 D H 9 E F 10 F G 11 G H 12 H E

Design and Applied Technology (Secondary 4 – 6) Module 5
92
Advantages and Disadvantages of a Wireframe Model Advantages
It is user-friendly and easy to build since it is a natural extension of drafting. It is easy for users to construct with minimal training needed. It takes much less time and system memory to construct a model than surface or solid
modelling does. It can be modified to a simple surface model by applying surface algorithms to
surface data. Wireframe databases contain basic surface data of points, lines and curves.
Disadvantages
It may confuse users for its ambiguous orientation and viewing planes. In terms of input time, its time effectiveness may decrease as object complexity
increases. It needs both topological and geometric data whilst solid modelling requires
geometric data only. It is unable to calculate volume and mass properties, numerical control tool path
generation, cross-sectioning and interference for objects that are not two-and-a-half dimensional.
(b) Surface Modelling A surface model is considered higher level and more versatile than a wireframe one because of its construction being based on points, lines and faces. Its strengths over a wireframe model are as follows:
It can recognize and display complicated curved profiles. It can create 3D shaded surfaces with its face recognition ability. It can recognize facial features, such as holes. It can display superior 3D tool-path simulations for multi-axial machining operations
and complicated shapes. In terms of efficiency, surface modelling best performs in 32-bit minicomputer facility, despite its minimum requirement of 16-bit systems. Solid modelling is more sophisticated than surface modelling. However, surface modelling is still considered the most appropriate choice for designing and manufacturing complicated curved surfaces, such as car bodies.

Design and Applied Technology (Secondary 4 – 6) Module 5
93
Examples of Surface Modelling
Analytical Surfaces
Free-form, Curved, or Sculptured Surface
(c) Solid modelling Solid modelling is considered the most up-to-date and advanced methodology that is effectively processed on 32-bit systems. The volumetric shape that a solid model occupies is used in calculation. It is so far the sole technique that can provides comprehensive and explicit descriptions pf 3D shapes. Some of a solid model’s advantages are listed as follows:
It can differentiate the exterior and interior of an object, giving a full definition of volumetric shape.
It can perceive the inside of an object, facilitating the detection of unnecessary interference among components.
It carries no hidden lines. It presents clear views of 3D sections even for complicated assemblies. It facilitates analytical work for displaying mass properties and construction of finite
elements. It can manipulate the light and shadow effects, and incorporate colours and tones to
for creation of colour shading. As a result, it improves the visualization of shape, components and cross-sections very much.
It can improve the simulation of mechanism dynamics, tool-path procedures and robot handling.

Design and Applied Technology (Secondary 4 – 6) Module 5
94
3.2.4 Primitives and features approach There are two approaches of solid modelling with CAD systems, namely primitives and features.
Primitives approach uses predefined shapes, also known as primitives, to create complicated solids. Primitives can be boxes, cones, cylinders, spheres, wedges, tori (donuts), etc. A solid modeller integrates these building blocks to create 3D objects. Furthermore, designers can construct new 3D objects by joining objects, subtracting some objects from other objects, or taking the intersecting volume (i.e. Booleans operations) of objects. However, restricted primitive shapes limit this approach’s application.
(a) Possible solid model of the object
Original Object
(b) Alternative solid model of the object
Features approach’s flexibility in building complicated objects is higher than primitives approach’s. For example, a new object can be created simply by sweeping a 2D object along a path or revolving it about an axis.
Possible sketch of the solid (Extrude profile A and cut extrude
profile B)
Alternative sketch of the solid
(Extrude profile A and add extrude profile B)

Design and Applied Technology (Secondary 4 – 6) Module 5
95
S T O P A N D T H I N K Name some of the benefits that a solid model could provides for CAM software.
H I G H L I G H T Use the following objects to illustrate the two approaches. 1. Create a block, and subtract six cylinders from it (Primitives Approach) 2. Create a rectangle with six circles inside the top sketch plane, and extrude it (Features
approach) Some CAD systems, such as Unigraphics, CATIA and I-DEAS, offer both approaches, whilst some others, such as SolidWorks and Pro/E, only offer the features one.
Features approach Primitives approach
Final Model
Object A Object B
Final Model

Design and Applied Technology (Secondary 4 – 6) Module 5
96
3.2.5 Constructive Solid Geometry Representative Method (C-Rep) All solid modelling systems allow users to create, modify and inspect models of 3D solid objects. However, these models may be represented in computers differently. There are generally six different categories as follows:
Boundary representation (B-rep) Cellular decomposition Constructive solid geometry (CSG) Generalized sweeps Pure primitive instancing Spatial occupancy enumeration
CSG is the most popular. A standard CSG primitive set consists of blocks or cubes, triangular prisms, spheres, cylinders, cones and torus. These basic, standard primitives are operated with Boolean operators to build CSG solid models. A C-Rep is like a tree, whose leaves are simple primitives and the node is the Boolean operator. Each node can show one operator which applies to two leaves or sub-solids underneath.
Basic primitives offered by a solid modelling system
Boolean Operation Boolean operation is a fundamental tool for construction of C-Rep models. It defines the relationships among neighbouring primitives. There are three Boolean operators, namely union, difference (subtraction) and intersection. They are developed on algebraic set theory. The following table shows an outline and example of solid modelling of each Boolean operator.
SET THEORY UNION (U) DIFFERENCE (–) INTERSECTION (∩)

Design and Applied Technology (Secondary 4 – 6) Module 5
97
A UNION (U) is the area within the outer boundaries of the combined shapes of two bodies. The union of the two different circles A and B is the shaded area of A U B. It is considered a single object. A DIFFERENCE (–) is the area bounded by the remaining outer boundary of one shape and that of the overlapped area of the two shapes. This resultant area is denoted by A – B. An INTERSECTION (∩) is the area within the boundaries of the overlapped region. It is denoted by A ∩ B (or B ∩ A).
H I G H L I G H T - Let A be a vertical cylinder and B be a horizontal cylinder. From left to right of the following figure, there are four objects coming from A U B, A ∩ B, A – B and B – A.
A U B A ∩ B A – B B – A.
As another example, a bracket-like object with a hole shown in Figure 3 can be created as follows: 1. Start with two blocks and one cylinder as shown in Figure 1 2. Scale the three objects as shown in Figure 2 3. Subtract the cylinder from the flat, longer block 4. Union the two block as an L-shaped object 5. Place the L-shaped object as shown in Figure 3
Figure 1 Figure 2 Figure 3

Design and Applied Technology (Secondary 4 – 6) Module 5
98
Example for solid model construction Construct the following solid model with C-Rep:
solid model C-Rep on the solid model
S T O P A N D T H I N K Use C-REP method to construct the following 3D solid modelling assembly.

Design and Applied Technology (Secondary 4 – 6) Module 5
99
S T O P A N D T H I N K 1. Construct the 3D solid modelling assembly (Object Z) with primitive objects A to E.
Object A Object B Object C Object D Object E
2. Build Object Z with the CGS Tree.
3.2.6 Advantages of 3D modelling Despite building a 2D model is easier and less time-consuming, 3D modelling have the following beauties:
3D modelling allows users to view a model from any angles 3D modelling can produce reliable standard and auxiliary 2D views 3D modelling can remove hidden lines, having realistic shading 3D modelling can check interference 3D modelling can facilitate engineering analysis which involves finite elements Manufacturing data of 3D modelling can be extracted for further processing 3D models can be exported to form an animation

Design and Applied Technology (Secondary 4 – 6) Module 5
100
3.2.7 Constraints in solid modelling Geometric constraints are supported by most commercial CAD/ CAM/ CAE software packages. Some basic commands are shown below:
coincident collinear intersect parallel perpendicular tangent
Geometric constraint relationship between entities should be built. Geometric constraints are only applied on underlying sketches or wireframe entities which define solid object boundaries. The entities are ‘constrained’ with each other. As a result, changes made on any one of the m probably will affect the rest. There are some system basics required to provide true geometric associatively. Geometric constraints are one of them. The reactions of different solid modellers vary. Some modellers assign constraints automatically. Some enable users to define constraints. Others assign constraints on a need basis, and allow users to modify or remove the constraints manually.

Design and Applied Technology (Secondary 4 – 6) Module 5
101
3.3 CAD software Computer-Aided Design (CAD) uses various computer-based tools to assist engineers, architects, product designers, etc in designing. Both software and (special-purpose) hardware, such as graphical input devices and graphical display screens, are involved. CAD systems help the design process in many aspects. For example, designers can
1. Explore conceptual proposals 2. Create more alternative designs in shorter time 3. Finalize designs more quickly 4. Reduces potential errors that may occur during data transmission from one
participant to another by using common databases 5. Enable designers to communicate design ideas and finalize proposals with realistic
3D rendering of the product with CAD systems’ graphics capabilities 6. Enable users to create 2D and 3D data in the computer with a range of modelling
techniques. These data can be displayed on the screen as wireframe, surface or solid models to facilitate users’ design work. Subsequently, the model data of the final designs can be used for producing final design drawings, generating manufacturing data for the design, etc.
In the following sub-sections, various applications of CAD systems are discussed. 3.3.1 Graphics design Graphic design is an artistic way to communicate and present ideas or messages visually by combining text and graphics. It is often used in designing logos, graphics, brochures, newsletters, posters, signs and other visual communications. Designers apply graphic design principles of, for example, alignment, balance, consistency, contrast, proximity and white space. Designers also use graphic design elements of, for example, lines, shapes, mass, texture and colour. CAD systems for graphic design support the above usages. Lines alone or with some shapes can change a design’s readability, appearance and/ or message. Shapes alone or with some lines can deliver universal meanings, guide readers’ eyes, or organize information. Geometric, natural and abstract are the three basic types of shapes. Geometric shapes are structured and often symmetrical. Their family covers squares, circles, triangles, octagons, hexagons, cones, etc. Mass means size or weight. Each design has a physical mass. Each element of a design, such as graphics, photos, lines and text blocks, has its own mass relative to the whole design.

Design and Applied Technology (Secondary 4 – 6) Module 5
102
Texture is the visual or tactile surface characteristics of a design. Visual textures are easy to be located in or create for a design. There are four basic ways to incorporate visual texture: (a) Objects within a photograph
Texture: The crayons have
fairly smooth surface, while the cement rough.
Texture: Both glass bottles
and potholder fabric are smooth.
Texture: There are worn
mallets and grass.
(b) Images created with photo-editing software The following may simulate actual or be imagined textures.
Texture: It simulates drapes or folds in a satiny fabric.
Texture: It simulates a rough
and rocky surface.
Texture: The random soft
circles create an imaginary texture.
(c) Digitized images of actual textures from scans or digital photos
Texture: It is a straw mat.
Texture: It is a piece of door
mat made from old tires.
Texture: It is tree bark.
(d) Symbolic textures created with lines or shapes These patterns suggest various textures. They represent ideas or objects like symbols or icons.
Texture: They are wavy lines
that symbolizing water, waves or rolling terrain.
Texture: These overlapping circles look like fish scales.
Texture: These grids of lines
simulate plaid or linen fabrics, wire mesh or other
textures.

Design and Applied Technology (Secondary 4 – 6) Module 5
103
Colour is not essential for a good design. If used wisely, it can become an added dimension evoking moods and making powerful statements. The following website provides a good summary of graphic design software available on the Internet:
http://www.download.com/Graphic-Design-Software/ 3.3.2 Multimedia production CAD systems can be used in multimedia production for creating 2D or 3D models of cartoon, animation and computer games. A 3D model of a human is shown in the following pictures; it is made up of a mesh of triangles or polygons.
Coarse mesh of a 3D model
The first 3D model looks unreal: the sizes of the triangles are larger than the curvature of the body, making the model’s sharp corners very obvious. If the size of the triangles is reduced greatly, the model becomes much smoother and looks more like a real human as shown in the second picture.
Fine mesh of a 3D model
When this model is rendered, it looks like a human as shown in the third picture.
Sculpture after rendering

Design and Applied Technology (Secondary 4 – 6) Module 5
104
Generally speaking, the smaller triangles used for making the model, the closer the shape of the model is to the real object. The consequences are
1. More data required for representing the model 2. More calculations required for rendering the model 3. More time required for the computation
The following websites provide a good summary of multimedia software for animation, video and audio production, etc available on the Internet:
1. http://www.educational-software-directory.net/multimedia/ 2. http://www.itvdictionary.com/itv_video_production_software.html 3. http://emusician.com/editing/index.html 4. http://www.animationschoolreview.com/animation-software-basics.html
3.3.3 Interior and architectural designs Interior and architectural designs create drawings for visual communication and expression. They are also a medium for perceiving form and visual thinking. Such designs make use of 3D pictorial drawings in perspectives, shade and shadow, reflections mirror images, etc. Very often, architects have to produce multi-view drawings of floor and roof plans, foundation, furniture, interior and exterior elevations, objects, sites, etc. Camera placement, lighting concepts, material creation, shadows, etc are used in some 3D modelling software packages. Such packages are usually used to create photo-realistically rendered images for architects, designers or other project stakeholders to visualize designs. Furthermore, different techniques of 3D modelling, animation, lighting, materials, renderings, etc can be used to produce virtual walkthroughs.
Architectural design using CAD software Interior design using CAD software The following websites provide a good summary of architectural and interior design software available on the Internet:
http://www.archiexpo.com/cat/architecture-software-conception-calculation-modelling/2d-3d-architecture-software-R-905.html

Design and Applied Technology (Secondary 4 – 6) Module 5
105
3.3.4 Engineering design CAD systems assist engineers in designing as large items as buildings and ships, and as small items as bolts and nuts. Engineers often analyse design alternatives with mathematical formulae before finalizing decisions. For example, CAD systems can help: 1. Study motions of moving mechanisms within a
3D CAD design in reality 2. Identify clash and interference aspects.
In addition, CAD systems can
1. Generate 3D-animated, for example, assembly and disassembly sequences for designers to visualize the situation
2. Simplify complex large assemblies into smaller, simpler design packages 3. Create 3D design alternatives with different components, ranging from single parts to
complete assemblies 4. Compile 3D inspection plans 5. Facilitate the communication between a design team with its counterpart teams,
suppliers and external teams members through effective use of the information in the CAD systems
6. Facilitate downstream teams’ work, such as Q&A, manufacturing, documentation and tooling, through the 3D CAD models instead of 2D drawings
H I G H L I G H T Engineering Design Engineering design identifies needs, defines problems, conducts research, finds alternative solutions, analyses possible solutions, makes decisions, presents products and finally communicates and sells the products.
S T O P A N D T H I N K Engineering Design List the types of engineering analysis required for an optimum design of a hair dryer. The following website provides a good summary of engineering design software for 3D modelling, stress analysis, thermal analysis, manufacturing, etc available on the Internet:
http://metals.about.com/od/cadcam/CAD_CAM_Software.htm
Sequential movement of a crank on a 3D CAD system

Design and Applied Technology (Secondary 4 – 6) Module 5
106
3.3.5 Product design CAD systems have become increasingly popular in product design. Such systems
1. Enable designers to communicate, visualize and analyse ideas with much less manpower than in the past
2. Enable speedy, flexible and responsive changes in the product design process 3. Create and manage product design data or models effectively and efficiently over the
whole product design process 4. Managing existing product design data effectively and efficiently 5. Enhance communication within the design team 6. Facilitate companies’ project management on design projects 7. Allow designers to create and visualize product models in different views on
computers before the products are manufactured
Product can be visualized on computer screen from different views
H I G H L I G H T Product Design Product design involves idea creation, concept development, testing and manufacturing or implementation of physical objects or services. Product designers combine art, science and commerce to make physical items and sell them in the market.
S T O P A N D T H I N K Product Design (a) Explain how a model is created for the product idea, such as a hair dryer, with a CAD
software package. (b) Explain how the initial product design can be improved. The following website provides a good summary of product design software, which is often integrated with engineering design software, available software on the Internet:
http://metals.about.com/od/cadcam/CAD_CAM_Software.htm

Design and Applied Technology (Secondary 4 – 6) Module 5
107
3.4 Impact of CAD on the design process People can design and develop their product ideas more efficiently with comprehensive CAD systems. Such systems can generate graphic images, computer models, such as 2D or 3D product design, 3D animations, architectural and interior design models, and make them visualized to customers. The following explore how these benefits help product design. 3.4.1 Design efficiency Nowadays designers can use CAD tools to create, develop, communicate and record product design information. The accuracy and interchangeability of such computerized design information are higher, resulting in better design and faster updating procedures than traditional technical drawings. The efficiency of the whole design process hence increases. 3.4.2 Quality of product images CAD systems allow designers to have an extensive range of control over image quality. For example, a designer can 1. Select textures, such as wood against metallic patterns 2. Select materials, such as reflective against non-reflective materials 3. Manipulate lighting conditions and camera lens in a CAD environment These functions facilitate creation of more photo-realistic product images, allowing customers or users to visualize the ultimate the product.
A photo-realistic product image created by CAD

Design and Applied Technology (Secondary 4 – 6) Module 5
108
3.4.3 Virtual product (Also refer to Topic 3.1.1) Some CAD systems enable customers or users to observe products from different angles or distances in a virtual reality environment. The product parts, even including their internal operations and motions, can be visualized. Such functionality enables designers and engineers to show the designs, mechanisms and structures to customers and users more clearly.
A virtual product demonstration
3.4.4 Automatic updating or re-drawing Some advanced CAD software packages support automatic updating or redrawing. Automatic updating or redrawing refers to the function that upon any changes made on a part of a product, other parts are updated or redrawn automatically. The accuracy and efficiency of the design process is enhanced highly. 3.4.5 Rapid prototyping (RP) (Also refer to Topic 3.1.5) RP is a physical modelling method that integrates computer modelling techniques into CAD systems. Once the 3D digital model is imported into an RP system, a physical model can be produced quickly. RP helps designers
1. Communicate better with customers about the design development 2. Discover potential technical problems of the products

Design and Applied Technology (Secondary 4 – 6) Module 5
109
Rapid Prototyping Machine
A 3D Model for a Mobile Phone
H I G H L I G H T Rapid Prototyping (RP) RP transforms virtual designs from CAD to physical models using RP machines. These machines capture CAD data and output successive layers of liquid, powder or sheet materials. Such layers are then joined together automatically and shaped. Almost all shapes and geometric features can be created in this way. The word ‘rapid’ is relative: constructing a model spends hours to days, subject to which method is used, what the size of the model, how complicated the model is, etc. 3D Printing is an RP and will be explained in a Theme-Based Learning chapter later.

Design and Applied Technology (Secondary 4 – 6) Module 5
110
CHAPTER 4 – APPLICATIONS This chapter contains the following topic:
4.1 CAD and Visualization The learning materials and activities of this topic help students to:
(a) Understand the use of CAD and visualization in daily life and industry (b) Appreciate the state of the art of the technology
4.1 CAD and Visualization CAD is widely used in different industries around the world. Professionals from construction, engineering, education and medical industries use CAD to improve the quality of their works. Virtual characters in video games are also CAD’s common features in daily life. This chapter introduces how people use latest CAD technologies in either their working environment or daily life. 4.1.1 CAD for heritage conservation Heritage conservation in Hong Kong is difficult due to various environmental factors and urban developments. In 2002, 3D scanning technology was introduced to the surveying industry. The technology helps building maintenance, heritage conservation, infrastructure construction, etc. The Old Star Ferry Pier, Old Blake Pier, Lei Cheng Uk Han Tomb, Tai Fu Tai Mansion, the Fire Boat Alexander Grantham, various slopes and retaining walls, etc have been scanned to create 3D models for digital recording and further manipulation.
Surveyors are scanning some buildings.
The technology has a wide range of applications, not only suitable for documenting heritage buildings and historical sites, but also rapid prototyping in the manufacturing industry, developing Geographic Information System (GIS), creating 3D characters for movies and video games, as well as capturing dental information.

Design and Applied Technology (Secondary 4 – 6) Module 5
111
H I G H L I G H T 3D scanning 3D scanning is a new technology for analysing and scanning through the surface of a real-world object or environment. It collects 3D coordinates on a shape, and constructs digital 3D models and images accordingly.
S T O P A N D T H I N K Processes of 3D scanning There are some tools and steps needed in 3D scanning an object. Imagine what tools are needed and how expertises scan and re-create the object in a virtual environment. Explain how the scanning tools work. 4.1.2 CAD for logistics simulations The logistics design of a production line is critical to the success of a factory. To design a good logistics system, designers have to consider the integration of different elements, such as control system, mechanical and electrical engineering, etc, inside the factory. Only after the factory is built, the system can be evaluated accurately in an easy manner. Therefore, computer simulation software for logistics designs is introduced. In the past when there was no computer simulation for predicting the operational outcomes, the performance of a logistics system relies mainly on engineers’ individual experiences. Today, designers can use logistics simulation software and its 3D animation to predict how a system will work. In case of any severe problems that may hold up the system, the designers can solve them before equipment installation. Simulation software and its 3D animation can also show the effects of any changes in system parameters on screens before a factory is built. Due to business or operations growth, existing factories might have to renew or upgrade their equipment and infrastructures periodically. It is difficult for designers to predict how well such renewals or upgrades will fit the existing logistics systems. If mismatching equipment is used, the existing system may not work or even be damaged. Using simulation software, designers can evaluate the suitability of each equipment renewal and upgrade plan.
Logistics simulation in a factory

Design and Applied Technology (Secondary 4 – 6) Module 5
112
The following URL shows examples of different industries, such as automobile, using visualization, virtual reality, etc to simulate design and manufacturing processes:
http://www.sme.org/cgi-bin/find-articles.pl?&03jam002&ME&20030122&&SME&#article
S T O P A N D T H I N K Transportation logistics In addition to simulating the logistics inside factories, can CAD software simulate the logistics of mass transportation in Hong Kong? If yes, to what extent can the tools help resolve Hong Kong’s traffic problems, such as jams, over-crowded? 4.1.3 Mass property analysis It is often necessary to determine the mass properties, such as mass, volume, surface area, etc, of a product during the design process. A CAD system can help calculate the values. For example, assume that the following solid bottle is made of a material of a specific gravity of 0.92. The volume of the material is 4.38 cubic centimetres (c.c.). The bottle is about 8 cm tall.
Thus, the mass of the bottle is 4.38 x 0.92 = 4.03 grams (g).
H I G H L I G H T Mass properties The mass properties of an object refer to its mass, centre of gravity, moments of inertia, etc. They are important information for product design.
S T O P A N D T H I N K Mass Property Calculation (a) How the external area or the internal volume of a bottle is calculated with a CAD
software package? (b) How the centroids of rotating parts, such as cams, are calculated with a CAD software
package? (c) Assuming that the wall thickness of the bottle is 1 mm, what is the volume of liquid that
can be contained in the bottle?

Design and Applied Technology (Secondary 4 – 6) Module 5
113
4.1.4 Virtual reality Virtual reality (VR) is a technology allowing users to interact with objects in a computer-simulated 3D environment. Users can interact with the environment using keyboard, mouse, or other special devices, such as wired glove, head-mounted display (HMD) and joystick. These devices can be seen in the upcoming HIGHLIGHT box of ‘Devices for virtual reality’. The simulated environment could be an imaginary world, such as a VR game or simulation of real world situation. VR has been used in different industries. For example, a high-fidelity simulation device was introduced in the medical field to improve patient safety. By controlling virtual surgical instruments and simulating virtual surgeries on screens, surgeons are able to practise complex surgical tasks before performing them on real patients. This device can also record errors and measure the efficiency and performance of virtual surgeries. Hence, it functions as an educational tool as well as skills validation instrument.
VR can also be found in the construction industry, helping machine operators to develop their skills in a controlled and safe environment. Operators can be trained any time regardless of the weather. Using a VR training system, the training duration and machine operating costs can be reduced. Operators can be more skilled and confident when starting to work with real machines.
Virtual surgery
Virtual operation of a vehicle for construction

Design and Applied Technology (Secondary 4 – 6) Module 5
114
H I G H L I G H T Devices for virtual reality To develop and run virtual reality environments, people usually use personal computers (PCs). Besides, some special devices may be used to enhance the ‘reality’ and interactivity in the virtual reality environment. Some examples of these devices are shown as follows:
An HMD (Head-Mounted Display) is a
headset with two small monitors installed inside, each for an eye to present a stereo
view of the virtual world.
CAVE (Cave Automatic Virtual
Environment) is a system for projecting images on the wall, floor and ceiling in a
chamber.
A tracking system is to identify the
location of a user in the virtual world.
Data gloves, joysticks, hand-held wands, etc are for interacting with a VR system.
S T O P A N D T H I N K Augmented reality There is a kind of visualization technology called augmented reality (AR), which is similar to Virtual Reality. Research in the Internet and explain the difference between AR and VR.

Design and Applied Technology (Secondary 4 – 6) Module 5
115
4.1.5 CAD and visualization technology for teaching Most of the CAD applications can show geometries, such as 3D cubes and pyramids, on screens. Interacting with these applications enables students to understand the concepts and theories of geometries in an easier way.
CAD applications and visualization may also help teaching science subjects. For example, CAD can be used to
(a) Simulate chemical reactions (b) Visualize biological concepts, such as
DNA structures (c) Visualize geographical shapes of
particular landscapes, such as cliff and gorge
(d) Explain spatial concepts 4.1.6 Structural analysis Structural analysis is the mathematical calculation of stresses, strains and forces within structures. It could be part of the design of those structures, or a tool for understanding the performance of existing structures. The results of such analyses can be used to compare the criteria to indicate the failure conditions. Stress is the distribution of forces inside a body, on which it balances and reacts to the loads applied. Stress’s intensity of stress is in units of force per unit area. Strain refers to the deformation per unit length. It is measured in the direction of stress
CAD tool for teaching 3D geometries
DNA structure visualization by

Design and Applied Technology (Secondary 4 – 6) Module 5
116
caused by forces acting on a body. A stress-strain curve is a graph showing the relationship between these two parameters, with data measured from during tensile tests. The nature of the curve varies for different materials. A typical stress-strain curve of structural steel comprises the following parts: 1. Ultimate strength 2. Yield strength 3. Rupture 4. Strain hardening region 5. Necking region Impact test is another common test for measuring the strength of a material. It is to give information on how a specimen of a particular material responds to a suddenly applied stress, such as a shock. The test tells whether a material is tough or brittle. For the test, Izod or Charpy methods are generally applied, while a notched test piece as shown below is normally used.
Being an ASTM (American Society for Testing and Materials) standard method of determining impact strength, the Izod impact strength differs from the Charpy impact test, which determines the impact toughness of a given material. Charpy is a standardized high strain-rate test. The result is usually reported as energy in ft.lbs or KJ needed to break the test piece. The diagram above shows an impact testing machine. An arm or pendulum held at a particular height (constant potential energy) is released to hit and break a specimen. The impact strength of the specimen is determined from the energy absorbed during the break.
Izod or Charpy test
A typical stress-strain curve
Impact testing machine

Design and Applied Technology (Secondary 4 – 6) Module 5
117
H I G H L I G H T Finite element analysis Finite element analysis (FEA), a computer simulation technique using a numerical technique called the finite element method (FEM) for structural analysis. In FEM, the structural system is modelled by a set of finite elements in, for example, rectangular or triangular form. The elements are interconnected at points called nodes. The elements may have their own physical properties, such as coefficient of thermal expansion, density, Poisson’s ratio, shear modulus, thickness and Young’s modulus.
A simple FE mesh with triangular and rectangular elements for cantilever beam
Articulated arm Its associated FEA analysis picture
S T O P A N D T H I N K Stress-strain curve There are five parts in a typical stress-strain curve of a material. Find out from the Internet or libraries for the meaning of each part. Finite element analysis CAD software is often used in Finite Element Analysis for modelling the structure and visualizing the resultant structure of an object as calculated from the analysis. Give an example of how CAD software is used in modelling an object for Finite Element Analysis and in visualizing the results. Search in the Internet or libraries for information.

Design and Applied Technology (Secondary 4 – 6) Module 5
118
Theme-based Learning Tasks

Design and Applied Technology (Secondary 4 – 6) Module 5
119
Theme-based Learning Task 1: 3D Modelling – Making Cardboard/ Foam board Remote Control Holder This case focuses on the understanding of content you learned in Topic 1.2.
Background Scaled 3D models can be made for many reasons, such as (a) During the early stage of development, engineers need scaled models to test the
possible performance of a particular design (b) Architects need scaled (architectural) models to evaluate and sell a new
construction before it is built (c) Filmmakers need scaled models for objects that cannot be built in full size (d) Salespersons for heavy items, such as equipments and automobiles, require scaled
models to facilitate their promotion of new products A handy model help convey an idea easily. Which of the following delivers an idea better?
2D sketch Photo
The pictures above tell the difference. Making models delivers ideas on one hand, it is fun on the other. Follow-up activities: Design and make a model with cardboard or foam board for a remote control holder with reference to a remote control at home. Procedure for model making
1. Select 1:1 as the model scale 2. Select either corrugated fibreboard or foam board as
materials 3. Mark out 4. Cut 5. Join
Consider also how the holder is fixed to a wall.
A remote control holder

Design and Applied Technology (Secondary 4 – 6) Module 5
120
Theme-based Learning Task 2 Domestic Floor Plan – Architectural and Electrical Floor Plan Drawing This case focuses on the understanding and preparation of an architectural plan and electrical layout that you learned in Topic 2.3 Background A common use of architectural floor plan drawing in daily life is property sales booklets. The following diagram illustrates a typical flat with a bedroom, a living room, a dining room, a bath room and a kitchen. It shows how walls, doors, windows and other features are drawn as well as how building dimensions are presented.
Standard accessories in kitchen and bathroom In a standard domestic floor plan, sanitary-ware and kitchen accessories are almost mandatory. The most common accessories in toilets and kitchens are sink units, toilet bowls, bathtubs and burners built-in hobs. Symbols for these accessories vary from developer to developer.

Design and Applied Technology (Secondary 4 – 6) Module 5
121
Electrical floor plan Symbols can be added on a floor plan to produce electrical drawing. The most common symbols are lighting points, air conditioners, MCB, connector boxes, clocks, door bells, fluorescent tubes, push buttons, socket outlets and switches. Switches and appliances are connected by dashed lines in the drawing. For reader friendliness, symbols and descriptions are documented in a legend. You may refer to the guidelines stated in topic 2.3.

Design and Applied Technology (Secondary 4 – 6) Module 5
122
Follow-up Activities Search for and analyse other floor plans of domestic flats, with the following hints:
Search for as many floor plans of domestic flats as possible Select one of the flats Identify the fixtures inside the flat Identify the electrical appliances inside the flat Create a set of symbols for fixtures and electrical appliances Sketch a domestic flat floor plan for the flat Use the symbols created to create fixtures and furniture on the plan Sketch another floor plan Use the symbols created to draw electrical appliances on the plan Draw a legend of the symbols used

Design and Applied Technology (Secondary 4 – 6) Module 5
123
Theme-based Learning Task 3 Rapid Prototyping for Entertainment Technology – 3D Printing of Timberland Prototypes Introduction Rapid prototyping (RP) is a collection of techniques for quick model creation with 3D CAD data. 3D Printing is an RP technology. This technology is generally faster, more economically affordable and easier to use than other RP technologies. The following is an example of 3D Printing with Timberland shoes. Read the information and imagine other uses of 3D Printing. Background Timberland is renowned for its shoes. Not only fashion elements, engineering on human foots is also key factors for Timberland to manufacture shoes. For this purpose, designers and engineers use CAD software to design, fine tune and make prototypes. The cost of a traditional prototype is about USD1200. It needs about one week to complete. In addition, 2D CAD drawings alone may not provide sufficient information for product development. In this connection, Timberland has chosen 3D colour printing for cheaper and faster physical prototypes. With a 3D colour printer, the cost and lead time for a coloured prototype decrease to USD35 and 90 minutes respectively. The overall development progress is shortened on one hand, engineers and designers can work more closely and frequently on the other. Furthermore, coloured prototypes are hardly possible provided by other prototyping technologies. While creating lifelike objects, 3D Printing creates objects for stress analysis, product labelling, highlighting key parts, etc. With more realistic prototypes, customers may comment on a product provide feedbacks on a more solid ground.
3D shoe CAD
Coloured Prototypes “printed” by 3D Colour Printer

Design and Applied Technology (Secondary 4 – 6) Module 5
124
How they are made? 1. User captures a 3D CAD file, which contains a design, into a 3D printer 2. 3D printer prints a shoe prototype, taking 90 minutes normally 3. 3D printer creates a physical 3D model with a method of Additive Fabrication, which
builds many layers and glues or fuses them together
Follow-up Activity Work in groups to carry out the following tasks: 1. Research - Locate in the Internet for two companies that sell 3D printers - Choose a printer from each company - Compare their functions 2. Questions - Other than the shoes, name at least two more products that are suitable for using 3D
printing technologies? - What are the advantages of using 3D colour printing over traditional prototyping
methods? - What are the disadvantages of using 3D colour printing?
3D Colour Printer
The building material may be liquid, powder or sheet. Heat, UV light, chemical reactions, laser may be used for curing. In some cases, a printer can create coloured 3D physical models by jetting colour binders onto powdered building materials.

Design and Applied Technology (Secondary 4 – 6) Module 5
125
Theme-based Learning Task 4 Michigan’s Gateway Arch Bridges – Structural Analysis The focus of this case study is on 1. The general methodology for analysing and simulating the behaviours of individual
elements 2. The whole structure under different situations and environments using CAD software. Background The objective of building Michigan’s Gateway Arch Bridges was to improve the transportation between the Detroit airport and downtown. In order to maintain the US Bridges at their best status, stress analysis software was used to 1. Optimize the arch profiles 2. Examine the hanger forces under both dead and live loadings 3. Determine the hanger stressing forces that should be applied
Bridge construction The bridges consist of a single span with two pairs of arches. The arches and arch ribs are box-section. The two pairs of arches are founded at differing levels. The outside pair is built on the lower road, while the inside on the span. To ensure an appropriate vertical clearance over the span, the arch ribs are connected to the respective arches at an inclination of 25°. The arches of each pair are manually supported with five rugby-like braces of designated sizes in between. Modelling the structure To investigate the behaviours of the bridges under different loading conditions and to determine the final profile of the arch ribs, detailed structural analyses can help.

Design and Applied Technology (Secondary 4 – 6) Module 5
126
Results obtained When the geometry is finalized, examination of the bridge performance under live, wind, temperature loads and any combinations of these factors can be performed with structural analysis software. Many structural analysis software packages can animate bridge displacements from moving live loads. It enables engineers better understand how different components interact to carry traffic loading as shown below.
Being a Hong Kong’s landmark, Tsing Ma Bridge is also the world second longest single-span suspension bridge.
Follow-up Activities Work in groups to carry out the following activities: 1. Research - Name two websites that provide information on other similar bridges in the world. - Compare the characteristics of these two bridges with those of Tsing Ma Bridge. 2. Questions - Outline the major components of Tsing Ma Bridge. - Explain how Tsing Ma Bridge was constructed.

Design and Applied Technology (Secondary 4 – 6) Module 5
127
Theme-based Learning Task 5 Virtual Reality – Ship Handling Simulation This case study focuses on ship handling simulation systems as an application of virtual reality as described in Topic 4.1.4. Background The Maritime Services Training Institute (MSTI) of the Vocational Training Council (VTC) has a Ship Handling Simulator in its Tai Lam Chung Campus for training ship operators and marine officers. The simulator provides versatile and realistic simulation of ship handling for the navigational training of deck watch officer, bridge team and pilot. Ship handling training through computer simulation can complement the theoretical study. Simulation help improve ship handling operations through navigating various ship types under simulated weathers and sea conditions in different seaways of the world. Ship handling simulation system The ship handling simulator contains a main bridge and a secondary bridge as shown in the following 3D layout of the simulation system. Main bridge The main bridge is the core of the ship handling simulator. It has a wheel house equipped with sophisticated instruments and represents a real bridge. The bridge includes all control and communication equipment needed for the ship’s commander and bridge team. Various scenarios, such as approaching port, shallow waters, narrow channels, oncoming ships, open sea, etc can be simulated using specially designed software. The bridge is ergonomically designed. The seascape changes in real-time in response to any operations made by trainees or the instructors in charge. Audio cues, such as engine noise, own or traffic ship whistle and sea state sound, can
3D layout of the ship handling simulator at MSTI

Design and Applied Technology (Secondary 4 – 6) Module 5
128
be added to the ambience. The ship handling simulator is housed within a 360° curved projection screen, which is 80 ft in diameter and 30 ft tall. The computer-generated vision system creates a visibility of 240° horizontally with 7 projectors. Secondary bridge The secondary bridge is mainly used as radar model equipped with a 60° visual display system. An accurate replication of handling characteristics of different vessels is possible with the help of the simulator. The day and night operations can be simulated in a wide range of geographic locations. Other sea areas can be constructed to meet different requirements. The instructor station allows an instructor to set up, design, modify, control and monitor the exercises.
Follow-up Activities Work in groups to carry out the following activities: 1. Research - Search for websites that provide information on other VR simulation applications - Share an interesting VR simulation application with the class 2. Questions - Name the major components of the ship handling simulator - Explain how the image is generated and projected on the curved screen of a ship handling
simulator
Main bridge
Secondary bridge

Design and Applied Technology (Secondary 4 – 6) Module 5
129
Hands-on Activities

Design and Applied Technology (Secondary 4 – 6) Module 5
130
Hands-on Activity 1 Feature-based modelling Learning Goals
Understand 2D sketches and profiles; Understand how a 3D solid model is created from a 2D profile; and Create a 3D solid model using the feature-base modelling method, which includes the
use of: • Extrude function to add materials • Extrude-cut function to remove materials • Hole, Round/ Fillet and Shell functions to modify the features
Introduction Computer Aided Design (CAD) systems can enable designers or other project stakeholders to visualise and analyse a product in the early stages of the product design process. The product’s 3D geometry models can be created with the help of a computer. There are three types of geometry modelling systems, namely:
(a) Wire-frame modelling (b) Surface modelling (c) Solid modelling
A wire-frame modelling system represents a product using its boundary outlines. The system keeps,only lines and end points. Boundary lines behind a surface can be hidden, dotted or solid lines to make the image clearer.
Wire-frame Modelling Surface modelling records information of surfaces using surface equations. The product’s appearance created by surface modelling can be displayed with shading and rendering. A solid modelling system creates a solid object by modelling an object with a closed volume. Material properties, such as density, are stored in the solid models.

Design and Applied Technology (Secondary 4 – 6) Module 5
131
Shading Rendering Sectional View
Review of 3D solid modelling method 3D solid models are represented and stored inside a computer by:
1. Constructive Solid Geometry (CSG) model 2. Boundary Representation (B-rep) model 3. Hybrid model, which is the combination of CSG and B-rep
CSG consists of a set of primitives, such as blocks, cylinders, cones, spheres, tori as well as other simple solid shapes. More complicated shapes can be created by combining the primitives with Boolean operations, i.e. union, difference and intersection. In defining a very complex solid model, B-rep model is more common than CSG. The time required for building a B-rep model is however longer because of its needs for defining every surface of a solid. For example, in defining a rectangular block with CSG, a user is only required to enter the width, length and height of the block. In a B-rep model, data of all eight vertices and six faces of the block are required to be entered. Most 3D solid modelling systems today use a hybrid model. Such systems use CSG for the basic shape and the B-rep model for local modification. Procedures for creating by primitives Two methods can be used to create a 3D model, i.e. building up from primitives and developing from 2D profiles. Most of the CAD software packages nowadays use 2D profiles to create 3D solid models for simplicity. Model creation by primitives Traditionally, models are created primitive by primitive as follows:
(a) Choose a primitive type (b) Define the dimensions (c) Locate the primitive in a 3D coordinate system

Design and Applied Technology (Secondary 4 – 6) Module 5
132
Example 1 A 3D solid model of a table with a top and four legs is created. The width, length and thickness of the table top are 1000 mm, 1000 mm and 15 mm respectively. The height of the table is 300 mm. The diameter of each leg is 40 mm. By using CSG, the table top will be represented by a block of 1000 mm x 1000 mm x 40 mm. Each leg is represented by a cylinder of 40 mm in diameter and 300mm in height. In modelling the table, each of the four legs is created by moving a cylinder primitive to a proper location with the move function as shown below.
The table top is then created by using a block primitive as shown below.
It is moved to a height of 300 mm. as shown
below.It is then union with the four legs as shown
below.
From 2D to 3D In the above example, the 3D solid model is created by
1. Creating primitives 2. Moving the primitives to proper locations 3. Joining the primitives together with Boolean operations
It is a time consuming method. One difficulty in defining a 3D model is how to define a 3D object in a 2D monitor screen. Most of the 3D CAD software packages create 3D models from 2D sketches (2D profiles) as follows:
(a) Select or create a 2D plane on the modelling screen

Design and Applied Technology (Secondary 4 – 6) Module 5
133
(b) Create a 2D closed profile on the 2D plane (c) Convert the 2D profile into a 3D solid model using special functions
Most primitives can be created in this way. Profiles A closed profile refers to an area enclosed by a continuous outline. Some sketches of valid closed profiles are shown as follows:
Nesting is allowed as shown below:
Some invalid closed profiles are shown as follows:
Creating 3D solids The four methods described below are commonly used to create 3D objects from 2D profiles: (a) Extrude (linear sweeping) Extrude can be understood as moving a 2D profile along a straight line to create a 3D solid. It is the most commonly used method.

Design and Applied Technology (Secondary 4 – 6) Module 5
134
(b) Revolve (rotating sweeping) Revolve refers to the generation of a 3D solid by rotating a 2D profile about an axis
(c) Sweep (non-linear sweeping) The word ‘sweep’ is commonly used in most CAD software packages for creating a 3D object by defining a profile moving along a predefined path. Similar to Extrude, Sweep can generate even more complex shapes.
(d) Loft Loft refers to the creation of a 3D object by joining a sequence of profiles. Whether or not a path is used is optional. This method is used when the sections, such as from Profile 1 to Profile 5 in the following figure, of the 3D object concerned is known.

Design and Applied Technology (Secondary 4 – 6) Module 5
135
S T O P A N D T H I N K Open profiles Closed profiles are used in the above methods to create 3D solid objects. What type of object shape will be generated if an open profile is used together with Extrude, Revolve, Sweep and/ or Loft? Extrude Extrude is considered the most fundamental function used in 3D model creation. Block, cylinder and wedge primitives can be created by this function. Example 2 Create a block primitive using Extrude. A closed rectangular 2D profile is used. A translation movement along a straight path extrudes the 2D profile to create a 3D solid. Example 3 Create a cylinder primitive using Extrude. Similarly, a cylinder can be created by a circle profile, which is extruded to a 3D solid.
S T O P A N D T H I N K Wedge primitive How a wedge solid primitive is created by Extrude?

Design and Applied Technology (Secondary 4 – 6) Module 5
136
Combined objects Complex shapes can be formed by combining different primitives together. Extrude can be applied on a plane of the existing model. For example, a cylinder added to an existing block is shown below. When a new cylinder is created, the two blocks are joined by union automatically by the CAD system.
Existing solid Select the top face Create a cylinder and draw a circle profile with Extrude Before creating a 2D sketch, the user has to specify a plane on which the sketch is drawn. In the figure below, the block is an existing solid. To add a cylinder on the top face of the block, the top face is selected as the sketch plane. A circle is drawn on the sketch for form the cylinder. Cuts Extrude, Revolve, Sweep and Loft can all be used to remove materials. Extrude-Cut removes materials from a solid by moving the profile along a straight line. It is a subtraction in CGS. Revolve-Cut, Sweep-Cut and Loft-Cut can be used for material removal similarly. An example of Extrude-Cut:
Hands-on Practice 1-a Create a 120 mm x 120 mm block with 4 holes as follows:
1. Select Front Plane as sketch plane 2. Use Rectangle function to draw a 120 mm x 120 mm square 3. Extrude the sketch with a 20-mm depth 4. Use the block’s front to draw four circles 5. Form four holes by Extrude-Cut’ing the four circles

Design and Applied Technology (Secondary 4 – 6) Module 5
137
Step 2 and 3
Create a sketch and an Extrude
Step 4 Draw 4 circles
on the block’s front
Wire-frame model
Shading model with hidden lines
Step 5 Use Extrude-Cut to form 4 holes
Feature-based Modelling Feature-based modelling enables designers to create 3D models with shape elements which make up the physical objects. Designers only need to specify information about the features. A ‘feature’ means an individual shape. Some features are created by 2D profiles as mentioned previously, while others, such as holes, fillets and chamfers, by modifying existing 3D objects. Hole Feature A Hole feature simulates the removal of materials by drilling. There are different types of holes, such as counter-bore holes, counter-sink holes and tap holes. They are defined by various standards, for instance, ISO, BS, JIS and ANSI. Using a Hole feature, a designer only need to select the type of standard, type, size and location of the hole. All other details for creating the hole will be taken care by the CAD system.

Design and Applied Technology (Secondary 4 – 6) Module 5
138
Round/ Fillet Feature The Round/ Fillet feature makes an edge or corner smooth. This feature can make a simple round/ fillet with constant radius, or multi-rounds/ fillets with varying radii.
Chamfer Feature The Chamfer feature is similar to Round/ Fillet, except that it uses straight cutting edges instead of circular edges. The length from an edge and the associated incline angle from that edge have to be specified for the feature to create a model. For example, in the following figure, 5 x 45o refers to a length of 5 mm from the vertical edge, and 45o from that edge.
Shell Feature A hollow object can be created by the Shell feature, which removes materials from a surface of a 3D object. With the start surface and the thickness defined, the CAD system removes materials from the specified surface until the required wall thickness is reached. Draft Feature The Draft feature was originally used in designing plastic parts, which require small angles for easy molding after plastic injection. Designers have to specify a neutral plane, a draft plane and a draft angle for inclining a plane with a specific angle.

Design and Applied Technology (Secondary 4 – 6) Module 5
139
S T O P A N D T H I N K Compare Hole and Extrude-Cut The Hole feature in the above example can also be made by Extrude-Cut. How can it be done? Compare the steps needed for creating a hole with the functions. Which one is easier to use? Hands-on Practice 1-b Use the given 2D sketch to create an electrical plug case.
Given sketch
Model created

Design and Applied Technology (Secondary 4 – 6) Module 5
140
Steps 1. Open the file EP1_Sketch, which will be provided in the class. The file contains the
above 2D sketch profile. You will learn in the next section how to create this 2D profile.
2. Use Extrude to extrude the given profile for 20 mm. 3. Use Shell to create a 3-mm thick shell. Use the rear side as the start face for materials
removal. 4. Use Extrude-Cut to cut three rectangular holes on the case’s top surface.
a. Select the front face as sketch plane. b. Draw three rectangles on the sketch plane. c. Extrude-Cut the rectangles with the “Through All” option, which cutting away the
entire material in the given direction. 5. Create a 3-mm countersink hole near the centre. 6. Round off (fillet) the front edge with a 1-mm radius. 7. Assign material (ABS) and calculate the weight.
H I G H L I G H T Properties Once a material is assigned, the density of the 3D object is known. The object’s properties, such as volume and weight, can be calculated by the CAD system as follows: Mass = 10.65 g Volume = 10444.46 mm3 Surface area = 7525.92 mm2 Centre of mass (mm): X = 12.27 Y = 7.87 Z = -0.00 Principal axes of inertia and principal moments of inertia (g * mm2) Taken at the centre of mass Ix = (0.00, 0.00, 1.00) Px = 2104.67 Iy = (-0.01, -1.00, 0.00) Py = 2217.74 Iz = (1.00, -0.01, 0.00) Pz = 3497.39 Moments of inertia [g * mm^2] Taken at the centre of mass and aligned with the output coordinate system: Lxx = 3497.32 Lxy = 9.63 Lxz = -0.00 Lyx = 9.63 Lyy = 2217.81 Lyz = 0.00 Lzx = -0.00 Lzy = 0.00 Lzz = 2104.67

Design and Applied Technology (Secondary 4 – 6) Module 5
141
Step 2
Step 3
Step 4a
Step 4b

Design and Applied Technology (Secondary 4 – 6) Module 5
142
Step 4c
Step 5
Step 6

Design and Applied Technology (Secondary 4 – 6) Module 5
143
Hands-on Activity 2 Parametric modelling and 2D sketches Learning Goals
Understand the concept of parametric modelling Understand the concept of geometric constraints Create 2D sketches and profiles using parametric modelling, which includes
• Using 2D entities: line, arc, circle and rectangles • Using operation tools to modify sketches: trim, fillet and erase • Fully constraining the 2D profile
Introduction Most CAD software packages create 3D models by manipulating 2D sketches. Upon its completion, a 2D sketch will be converted to 3D by Extrude, Revolve, Sweep or Loft. Activity 1 illustrates how a 2D sketch is converted to a 3D solid model by Extrude, and modified by other feature-based functions, such as Round/Fillet and Hole. Conceptually, the creation of a design from a 2D sketch is as follows:
The final design depends on the 3D object created by the 2D sketch.
S T O P A N D T H I N K Dependence on model creation 1. Do you think modifications in 2D sketch will change the final design? 2. To create models, is the order of features important?
Modify with
Features Extrude
2D Sketch 3D Object Final Design
Object 1

Design and Applied Technology (Secondary 4 – 6) Module 5
144
Example 1 Sequences 1 and 2 start with the same object – a block created by Extrude. For Sequence 1, Shell is used and followed by Hole. On the other hand, Sequence 2 first uses Hole, and then Shell, i.e. the input order is reversed. The final models have different shapes.
S T O P A N D T H I N K Sequence of Features Explain why different model shapes are created.

Design and Applied Technology (Secondary 4 – 6) Module 5
145
Parametric Modelling Normally, dimensions and shapes of a design are not fixed at the beginning phases of the design process. When dimensions are being determined during model creation, it is wise to consider geometric constraints at the same time. Geometric constraints describe how elements are related to each other. For example, a 5 x 3 rectangle can be described in two different ways: Method 1 (Dimensions only) Use 4 lines with exact coordinates to describe the rectangle, such as:
Line Start point coordinate End point coordinate 1 0, 0 5, 0 2 5, 0 5, 3 3 5, 3 0, 3 4 0, 3 0, 0
Method 2 (Dimensions with Geometric Constraints) Use 4 continuous lines with geometric constraints and dimensions specified:
Line Geometric constraint Fix start point at (0,0) Dimension
1 Horizontal line Length = 5 2 Vertical line Length = 3 3 Horizontal line Length = 1 4 Vertical line Length = 2
Both Methods 1 and 2 describe the shape, size and location of a rectangle completely. However, during the early stages of design, exact dimensions are usually unavailable, while, the lengths, such as 5 and 3 in the example, are just an approximation. It is not unusual that the designer may fix the dimensions as 4 x 3 or any other else finally.
S T O P A N D T H I N K Modifying a sketch 1. How can a designer change the lengths in Methods 1 and 2? 2. Which way is easier for a designer to modify rectangles with different sizes? Parametric modelling refers to the creation progress of 3D models using dimensions and geometric constraints. Any changes in dimensions or constraints affect the shape of the model created.

Design and Applied Technology (Secondary 4 – 6) Module 5
146
Sketch Sketch is used to create 2D outline profiles which in turn used for 3D solid object creation. It contains a series of 2D objects, such as lines and arcs, on a plane. Most 3D CAD systems use parametric modelling to create 2D profiles for easy modification in the future. The shape and size of a profile is defined by both geometric constraints and dimensions. Entities An entity is a single object which may be created by a CAD command. Some basic entities in 2D sketch are listed as follows:
(a) Point (b) Line (c) Construction Line (d) Arc (e) Circle (f) Ellipse (g) Rectangle (h) Polygon (i) Spline
Points
Line
Construction Line
Arc
Circle
Ellipse
Rectangle
Polygon
Spline
Geometric constraints Geometric constraints define the geometric relationships among existing entities. Some examples are shown below:

Design and Applied Technology (Secondary 4 – 6) Module 5
147
(Source: SolidWorks)
Dimensions Dimensions define the size of an entity, such as length, radius, angle and distance between two points. Fully-defined models In parametric modelling, some geometric constraints or dimensions can be omitted for flexibility and easy modification of outline profiles. Consider a rectangle joined by two horizontal and two vertical lines:
In fact, there are many rectangles that satisfy these constraints; for example,

Design and Applied Technology (Secondary 4 – 6) Module 5
148
Under-defined conditions allow designers to drag and change the shapes on screen freely. The object remains a rectangle no matter how it is changed because it is only governed by the geometry relations. Geometry constraints and dimensions can be added to uniquely define the profile. Such conditions are called fully-defined conditions. If further, redundant dimensions or constraints were added to a fully-defined sketch, they are called over-defined conditions. As a result, CAD systems will prompt warning or error messages, and asked designers to remove those unnecessary conditions.
S T O P A N D T H I N K Fully-defined conditions How many more geometric constraints and/or dimensions should be added such that the above rectangle will have a unique size, shape and location in the CAD space? Operation Tools To speed up sketch creation, most CAD systems have a set of tools to modify the outline profiles created by basic entities. Some of the commonly-used tools are:
(a) Fillet (b) Chamfer (c) Dim (d) Trim (e) Array (f) Rotate (g) Move (h) Copy (i) Mirror (j) Offset (k) Erase (l) Grid (m) Ortho (n) Snap (o) Osnap
Erase - removes entities from a sketch

Design and Applied Technology (Secondary 4 – 6) Module 5
149
Trim - erases part of an entity
Trim away part of Line A, which lies between Line B and Arc C
S T O P A N D T H I N K Trim After trimmed, is Line ‘A’ still a single entity or two? Fillet - trims away the intersection corner of two sketch entities to create a tangent arc.
Fillet between two lines
Fillet between a line and an arc

Design and Applied Technology (Secondary 4 – 6) Module 5
150
Hands-on Practice 2.1 Create the following 2D outline profile for an electrical plug.
Steps: 1. a. Draw a 40 x 40 square: Select two parallel lines for dimensioning but not the vertices,
which may be erased when the profile is modified subsequently. b. Constraint: Vertically align the mid-point of the lower horizontal line with the origin.
2. a. Draw a circle with a radius of 22.67. b. Constraint: Vertically align the centre of the circle with the origin. The tangent at the
top of the circle is the top horizontal line of the rectangle. 3. Trim the outline profile as shown. 4. Fillet the two lower corners each with a radius of 10: There are tangent symbols between
the arcs and the lines of fillets. 5. Fillet the two upper corners each with a radius of 6. 6. a. Draw a 3-point arc with a radius of 11.35.
b. Constraint: The two end points of the arc lie on the lower horizontal line of the rectangle. The centre of the arc aligns with the origin vertically.
7. Trim away the line segment between the arc’s two end points. 8. Shorten the top horizontal line, converting it to a construction line: A construction line is
only a reference line, but not part of the outline profile when a 2D sketch is converted into a 3D model.
9. Set equal length for the two vertical lines of the rectangle.

Design and Applied Technology (Secondary 4 – 6) Module 5
151
Step 1
Step 2
Step 3
Step 4
Step 5
Step 6

Design and Applied Technology (Secondary 4 – 6) Module 5
152
Step 7
Step 8
Step 9

Design and Applied Technology (Secondary 4 – 6) Module 5
153
Hands-on Activity 3 Revolve, Loft and Sweep features Learning Goals
Understand the concept of reference geometry Create 3D models using Revolve, Loft and Sweep functions
Reference Geometry Reference geometry aids the creation of 2D entities or 3D features. In 2D sketches, construction entities are used as references for creation of other entities. For example, a construction line can be used as an axis for creating a symmetrical sketch. The line is not part of the shape but should be identified for a ‘mirror operation’.
In 3D modelling, available reference geometries include axes, planes, coordinate systems, and points. For example: Reference axis - To create a Revolve feature, a rotation axis is needed. The axis can be a construction line from 2D sketch, or created from some existing features.
Reference plane – To create a Loft feature, two or more profiles are needed. Each profile is drawn on a reference plane. In the following example, five profiles are created on five reference planes.

Design and Applied Technology (Secondary 4 – 6) Module 5
154
Revolve Feature Revolve converts a 2D profile to a round 3D object, such as a cylinder or a sphere, by revolving the 2D profile about an axis. The following diagram shows a semi-circle rotated 270O to form a 3/4 sphere.
S T O P A N D T H I N K Revolve objects What 3D objects will be generated if the following profiles are rotated 360°?

Design and Applied Technology (Secondary 4 – 6) Module 5
155
Hands-on Practice 3.1 Use Revolve to create the following pin Loft feature Loft creates 3D models by making transitions between two profiles or more. The simplest one is connecting profiles on two parallel planes. A designer can create a 3D object by specifying the start and end profiles.

Design and Applied Technology (Secondary 4 – 6) Module 5
156
Hands-on Practice 3.2 Use Loft to create a wooden basket.
Steps 1. Draw a 75 x 50 rectangle on the top plane. 2. Create a reference plane, Plane 1, 20 over the top plane. 3. Draw a 100 x 150 ellipse on Plane 1. 4. Create a Loft feature between the rectangle and ellipse. 5. Assign a material, such as maple wood, to the solid model; and change the display mode
to ‘Shaded with Edge’. 6. Fillet the 4 edges that join the rectangle and the ellipse with a radius of 20 to form round
corners. 7. Use Shell with a thickness of 5 to create cavity.
Step 1
Step 2 and 3
Step 4 Step 5
Step 6
Step 7

Design and Applied Technology (Secondary 4 – 6) Module 5
157
Sweep Feature Sweep creates a 3D solid by moving a profile, also known as section, along a path or trajectory. The path’s start point lies on the profile’s plane. Error occurs if the profile, the path or the resulting solid is self-intersecting. Extrude is viewed as the simplest form of Sweep, where the profile sweeps along a straight line. The path for Sweep can be any continuous path, such as a straight line, a curve or a set of model edges. The figure below shows a Sweep with a hexagonal profile along a spline, or a free form curve, path:
Twist along the path Sweep can also be twisted along the path. The figure below shows a hexagon sweeping along a straight line with and without twist.

Design and Applied Technology (Secondary 4 – 6) Module 5
158
Hands-on Practice 3.3 Create a handle for the basket.
Steps: 1. Create an arc with a radius of 80 on the front plane. Each of the arc’s two end points
should be 4.5 from the basket’s edge of its side. 2. Create a 8.5 x 4.5 ellipse on either side of the basket’s top surface. The ellipse’s centre
should coincide one of the end points of the arc created in Step 1. 3. Use Sweep to create the handle. Select the ellipse as the section and the arc as its path.

Design and Applied Technology (Secondary 4 – 6) Module 5
159
Hands-on Activity 4 Assembly Learning Goal
Understand the associate relationship between parts and assemblies Understand the concept of degree of freedom in translation and rotation Understand the mating conditions used in assembly Create assemblies by using mating conditions:
• Coincidence of two axes • Coincidence of two planes • Parallel of two planes
Associate relationship between parts and assemblies When two or more parts are connected together, an assembly is formed. Parts of an assembly are stored in an assembly file. One part can form different assemblies. In the chart below, Parts 1, 2 and 3 form Assembly 1, while and Parts 2, 4 and 5 form Assembly 2. An associate relationship is formed between parts and the assembly. When there are changes in any parts, the associate assemblies will change accordingly. Similarly, when an assembly changes, its parts will be updated automatically.
Degree of freedom In an assembly, each part is regarded as a single object. The basic principle of an assembly is how parts translate (move) or rotate to a specific location and orientation relative to other parts. Degrees of freedom describe how an object can be freely moved in a 3D space. There are six degrees of freedom: three for translations and three for rotations.
Part 1
Part 2
Part 3
Assembly 1
Assembly 2 Part 4
Part 5
User 1 in China
User 2 in Hong Kong
User 3 in Europe

Design and Applied Technology (Secondary 4 – 6) Module 5
160
Translation There are three degrees of freedom for translations, which describe how an object moves along the directions of the x-, y- and z-axes. With all three independent translations, any movements of an object can be described.
Rotation There are three degrees of freedom for rotation, which describe how an object rotates around the x-, y- and z-axes.
Once all the six degrees of freedom are fixed, the position and orientation of an object is considered ‘fully defined’. Mating conditions Mating conditions describe the relative location and orientation between two parts. There are several common ways for specifying mating conditions: (a) Coincidence of two planes – Coincidence of two planes involves two faces on two
different objects. Under this condition, one face of an object is always touching a face of the other object. In the figure shown below, the red face indicates the mating face between the green block and the yellow plate. There are three degrees of freedom, i.e. the green block is free to move along the X- and Y-axes, and to rotate about the Z-axis.

Design and Applied Technology (Secondary 4 – 6) Module 5
161
Translation Rotation X Y Z X Y Z
Yes Yes No No No Yes
S T O P A N D T H I N K Degrees of Freedom Explain why the object cannot rotate about the Y-axis in the above example. (b) Coincidence of two edges – Coincidence of two edges involves two edges of two
different objects. The two edges must be in a collinear condition, i.e. they can slide along an infinite straight line. The degrees of freedom are shown below.
Translation Rotation
X Y Z X Y Z Yes No No Yes No No

Design and Applied Technology (Secondary 4 – 6) Module 5
162
S T O P A N D T H I N K
Mating of Vertices What are the degrees of freedom if two vertices of two parts are mated by coincidence? There are several mating conditions, such as parallel, perpendicular, tangent and concentric. Coincidence is one of the most commonly used. Combining mating conditions Different mating conditions can be applied to the same model. The more mating conditions an object contains, the more restrictions are imposed on the degrees of freedom. For example, if two objects have two mating conditions, namely coincidence of two faces and coincidence of two edges, there will be more restrictions on the movements. The results are:
Translation freedom Rotation freedom X Y Z X Y Z
Coincidence of X-Y planes Yes Yes No No No Yes
Coincidence of two edges Yes No No Yes No No
Results Yes No No No No No
S T O P A N D T H I N K
Fully Restricted What other mating conditions are necessary to restrict any translation or rotation movements from the above example?

Design and Applied Technology (Secondary 4 – 6) Module 5
163
Hands-on Practice 4.1 Create an assembly with two blocks and four pins that have been created in the previous section.
Assembly with two blocks and four pins
Steps: 1. a. Put 2 blocks into an assembly.
b. Given the following three mating conditions: i) Coincidence of the back face of one block and the front face of the other ii) Coincidence of the top faces of both blocks iii) Coincidence of the right faces of both blocks
2. a. Insert the four pins into the assembly. b. Given the following mating conditions: i) Concentric mating between the hole and the pins ii) Coincidence of the back face of the pin head and the front face of the block
Step 1.b.i. Coincidence 2 faces
Step 1.b.ii. Coincidence top faces

Design and Applied Technology (Secondary 4 – 6) Module 5
164
Sep 1.b.iii. Coincidence right faces
Step 2.b.i. Concentric circular faces
Step 2.b.ii. Coincidence two faces

Design and Applied Technology (Secondary 4 – 6) Module 5
165
Hands-on Activity 5 Engineering Drawing Learning Goal
Understand the associate relationships among parts, assemblies and drawings Understand sheets and sheet formats in creating drawings Create 2D component and assembly drawings from 3D models Use automation tools to create Bill of Materials tables for the assembly drawings
Associate relationships CAD systems are often used to express 3D parts and assemblies in the form of engineering drawings for communication. The drawings, which associate between parts and assemblies, are stored in the files separately. Any changes in the parts or assemblies will automatically update the others as shown in the figure below.
The three dimensional data of parts and assemblies on shapes, dimensions, etc can be projected onto 2D drawing sheets, according to various engineering drawing standards, such as ISO, ANSI, BSI and DIN. Sheet and sheet format Many CAD software packages categorize the editing function into ‘sheet format’ and ‘sheet’. ‘Sheet format’ of a drawing includes refers to the drawing’s border, the title block, data forms and tables, such as bill of materials and revision history. It is mainly expressed in letters and simple 2D graphics. ‘Sheet’ refers to the shapes and size of an object. Its contents come from 3D parts and assemblies. Sometimes other drafting tools are used to help complete a drawing. Users can edit either the ‘sheet’ or ‘sheet ‘format’ of a drawing using a CAD system once at a time. However, it is necessary for the user to know which portion is being edited.
Parts
files
Assemblies
files
Drawings
files

Design and Applied Technology (Secondary 4 – 6) Module 5
166
Component drawing On a sheet, many different views of an object can be shown. For example, four views are placed in the above example. There is a property table for users to record the scale, type of projection (1st angle or 3rd angle) and size of the drawing paper on each sheet. Each of the projected views on the sheet is enclosed by a viewport, onto which a 3D object is projected. Dimensions imported directly from 3D parts are used to define the 3D objects. Since they are associated or linked with the parts and the assemblies of the 3D objects, any changes in the dimensions in the drawing will automatically affect the 3D objects.

Design and Applied Technology (Secondary 4 – 6) Module 5
167
Hands-on Practice 5.1 Create a 2D engineering part for the block created in the last practice. Steps: 1. Prepare an A4 paper sheet for a new drawing 2. Edit the sheet format, such as. creating borders, title block and first angle projection
symbol 3. Save the borders and title block as a drawing template for later use 4. Switch to Edit Sheet mode 5. Use ‘3 Standard Views’ to add parts, creating the top, elevation and side views on the
drawing 6. Select a sheet scale of 1:2 7. Select first angle projection 8. Insert a single isometric view on the top left corner

Design and Applied Technology (Secondary 4 – 6) Module 5
168
Assembly Drawing Users can use other tools to automate the process of creating, for example, the bill of materials table and balloons as shown below. The file of each part is named after its part number. The column of ‘QTY’, which is counted automatically, shows the quantity of the parts used in the assembly.

Design and Applied Technology (Secondary 4 – 6) Module 5
169
Hands-on Practice 5.2 Create an assembly drawing for the mounting block assembly. Steps 1. Open the template drawing created in Hands-on Practice 5-a 2. Select Sheet Format mode 3. Enter the title, drawing number and date 4. Change to Sheet mode 5. Set sheet properties to first angle projection with a 1:2 scale 6. Add an assembly with 2 standard views, i.e. Top and Elevation 7. Enter dimensions 8. Add a section line on the Elevation view to create a section A-A view 9. Insert an isometric view on the right side of the drawing 10. Use the Bill of Materials tool to create a BOM table, when creating which, the column
header, part numbers, etc on the sheet format may have to be deleted 11. Use the Annotation / Balloon tool to create balloons

Design and Applied Technology (Secondary 4 – 6) Module 5
170
Hands-on Activity 6 Shading and Rendering Learning Goals
Understand the concept of shading and different shading methods Understand different types of light sources including: point light, directional light, spot
light and ambient light Create a photo realistic picture of the 3D model by rendering
Rendering To create a more realistic image from a model, it is common to use different drawing techniques. This process is called Rendering. To display the appearance of a product, colouring the surfaces of the product’s 3D model may be required. Colouring can be done by adopting material colours or assigning different colours. Each material has its own defined colour. If a part is assigned by a material, the part will inherit the predefined colour of that material. Different colours from the material colour can also be assigned to a model. For example, a designer may want to change or add a different colour to some portions of a part. This can be achieved by assigning colours to the faces or features of a part. The figure below shows a flash light assembly with assigned colours. Shading Shading is one of the two common ways to display colours for 3D models on screen. Another is light tracing. Shading simulates that colours appear on the surfaces of a 3D model when the model is illuminated by virtual light sources. Colours appear on a surface result from the reflection of light. The colour shown depends on the position, orientation and attributes of the lights and the surfaces. People may see different colours on the same surface for different colours of light sources. An illumination model can be used to describe the amount of light reflected or refracted from a surface in mathematical equations. Computer can be used to calculate the amount of colours that should be displayed for a particular surface.
An illumination model

Design and Applied Technology (Secondary 4 – 6) Module 5
171
In the opposite figure, a viewer takes different angles to see Surfaces 1 and 2, forming Angles θ1 and θ2 between the light source and the viewer. With these angles, a computer can calculate the amount of colours appearing on Surfaces 1 and 2.
For a curvature surface, a computer first ‘decomposes’ the surface into small polygons, each of which is flat. This creates a so-called ‘mesh’, which is an approximation of the shape of the 3D object. The smaller the polygons, the finer the display of the object and longer the computation time will be. The following figure shows a 16 x 16 mesh that represents a sphere.
Type of shading methods Generally speaking, Flat, Gouraud and Phong shadings are the three most common shading methods used in the computer graphics for shading. Among them, Flat is the fastest with less acceptable shading result. On the contrary, Phong gives the best result with longer computation time. Gouraud falls between.
S T O P A N D T H I N K Three different shading methods are used for the three spheres below. Compare the results and describe their differences.

Design and Applied Technology (Secondary 4 – 6) Module 5
172
Hands-on Practice 6.1 Steps 1. Open the Mount Block assembly file done in Hands-on Practice 4-a 2. Choose the block in the front 3. Assign light green in colour (Red 128, Green 255, Blue 128) 4. Set the transparency reading to 0.5 5. Choose the block at the back 6. Assign light brown in colour (Red 232, Green, 113, Blue 8) 7. Set the transparency reading to 0.5 8. Select the four pins 9. Assign light yellow in colour (Red 255, Green 255, Blue 128)
Lighting The attributes of the light source, including the position and orientation, the spectrum (colour) and the attenuation, can affect the result of the shading computation. Attenuation is used to describe the weakening effect on a lighting source. In other words, the further an object is away from the source, the weaker the lighting effect becomes. Attenuation is usually not applied on shading. For simple computation, light sources are classified into: directional light, point light, spot light and ambient light. A directional light source refers to the light with parallel rays. All the rays come from the same direction. When the light source is very far away, such as sunbeams, the light source can also be treated as a directional light source. A point light source describes the rays emitted from a single point in (almost) all directions. A light bulb is an example of a point light source.

Design and Applied Technology (Secondary 4 – 6) Module 5
173
Directional Light Point Light
For a spot light source, its light starts at a point and emits in a cone shape. There is no light outside the focus area. Ambient light is used to simulate the illumination produced in the surroundings from different light sources. It has equal intensity on all surfaces regardless of the directions of the individual surfaces. The amount of the light can be decided by designers to display the non-illuminated areas, which will be totally dark otherwise.
Spot Light Ambient Light

Design and Applied Technology (Secondary 4 – 6) Module 5
174
Hands-on Practice 6.2 Study the effect of light sources on an object. Steps 1. Show the positions of the light source introduced in the previous activity 2. Move the light source 3. Change the parameters of the light source 4. Study the effect of the light source on the object
Ray tracing Shading is regarded as a useful aid in design for its fast production of graphic images for 3D models and display of product appearances to designers. It ignores many factors for simple computation however. One of the ignored key factors is the effect of light reflected or refracted from other objects on the image of the object concerned. For image quality’s improvement, ray tracing is used. In ray tracing, the light of ray is traced to show the effect of reflection and refraction on an object.

Design and Applied Technology (Secondary 4 – 6) Module 5
175
In a CAD system, the number of reflections and refractions can be decided by users. The higher the number of reflections and refractions, the better quality of image and, however, the longer the computation time will be.
S T O P A N D T H I N K Illumination Reflection Compare the two images below. The indirect illumination in the image on the left is turned on whereas and the one on the right side is turned off.
(Source: SolidWorks 2006)
1. Describe the differences between the two images on the right wall, the ceiling and the floor.2. Explain why the right reflective sphere is more washed out. Material attributes In addition to light attributes, material attributes affect the appearance of a 3D object. These properties are:
(a) Transparency (b) Diffuse reflection (c) Specularity (d) shininess (e) Emissivity
Transparency refers to the amount of light passing through an object. The higher the transparency value is set, the more visible the object behind a transparent becomes. Diffuse reflection refers to the scatters of incoming rays. This reflection occurs from a very rough surface, such as clay and chalk, unlike the ideal reflection that reflects all the incoming rays to all equal directions.

Design and Applied Technology (Secondary 4 – 6) Module 5
176
In an illumination model, diffuse reflection is dependent on the angle of the light source but independent of the viewing angle. The setting of diffuse in CAD software is to set the intensity of reflected light, assuming that the surface is an ideal diffuse reflector.
Specular reflection is the opposite of diffuse reflection. An ideal specular reflection reflects a ray into a single outgoing direction without any scattering. For example, mirror is an ideal specular reflection.
Shininess refers to the reducing speed of the specular intensity when the view is moving away from the ideal reflected ray. The lower the shininess value is, the more slowly the intensity reduces. The higher the shininess value is, the faster the intensity reduces.

Design and Applied Technology (Secondary 4 – 6) Module 5
177
Emmisivity, which is the control of the light radiating from an object, simulates an object that can emit light without any light source.
Scene It is common to add some backgrounds to 3D objects in rendering. A scene, either a rectangular box or a sphere, is a simple way to add a surrounding environment to 3D objects in rendering. The following are some examples of application of scenes:
Rendering Example By using ray tracing, a photo-realistic picture can be produced before a product is created. In the picture below, a flash light is placed in the scene. A picture is mapped to the left wall to produce a pattern like wall paper. A mirror is placed on the right wall. . The light, from the flash, is reflected by the mirror on the right wall mirror and shines on the left wall.

Design and Applied Technology (Secondary 4 – 6) Module 5
178
Hands-on Practice 6.3 Use rendering to create a block similar to the one below.
Steps 1. Select a scene; 2. Turn on one direction light and one ambient light; 3. Adjust the light source and optical properties; and 4. Observe the light effect.

Design and Applied Technology (Secondary 4 – 6) Module 5
179
Assessment Tasks

Design and Applied Technology (Secondary 4 – 6) Module 5
180
Design Project Project Title: Hairdryer [Part A] Project Outlines Background The Marketing Manager complains about an existing hairdryer, saying that (1) The appearance of an existing hairdryer is not stylish enough (2) The contour is too hard (3) The colour is too dull In order to remain competitive in the market, the company intends to make the product innovative. It is decided that (1) The existing electrical parts, i.e. those inside the hairdryer case, remain unchanged (2) The position of the switch, control, etc may be changed (3) A brand new case should be made Project Task (1) Target Product: An hairdryer (2) Design (student) Grouping: In groups of 2 or 3 (3) Proposal: A project proposal should be submitted to the Marketing Manager (teacher) for
approval. The proposal has to be of two A4 paper sheets or less, without sketches and drawings. The proposal must cover the following points: (i) Students’ names and class (ii) A brief textual description of the selected product or mechanism, explaining the
general functions, operating conditions, and project objectives of the product (iii) A hand-drawn sketch of the product (iv) A brief project timeline
Upon approval, students have to use CAD software to construct the hairdryer model with simple shading on A4 paper. A scaled assembly drawing with all parts drawn and detailed dimensions should be provided. Students have to give a presentation of no more than 8 minutes plus a Q & A session of 3 minutes.
A hairdryer model

Design and Applied Technology (Secondary 4 – 6) Module 5
181
[Part B] Project Details Introduction Engineering projects provide students with exposure to design, research and problem-solving. Students can apply technological knowledge to the design and construction of complex projects. Throughout the process, students have to take into consideration appropriate technologies and artistic creativity. Subject matters include mechanical systems, design and drafting as well as calculation processes. Aim and Objectives You are a member of a design project team. The project manager has given you the following criteria to design a hairdryer: (1) The hairdryer must be made of a polymer (plastic) material (2) The hairdryer must be able to be held in one hand (3) Any creative and imaginative designs are welcome Task 1: Students will be able to plan, schedule and carry out all dimensional
measurement. (1) Measure the overall dimensions, such as width, height, depth and thickness, of an object (2) Select suitable tools for measurements (3) Understand errors in measurement and their impact on subsequent calculations Task 2: Students will be able to develop hand sketch drawings. (1) Gain access to, generate, process and transfer information using paper and pencils (2) Sketch a hairdryer case manually (3) Label the dimensions Task3: Students will develop an understanding of and be able to apply the design
process. (1) Initiate and carry out investigation into unfamiliar situations (2) Identify opportunities for technological invention or innovation (3) Understand mathematics and become mathematically confident by communicating and
reasoning mathematically by Applying mathematics in reality Solving problems through integrated knowledge of number systems, geometry, algebra,
data analysis, probability, trigonometry, etc. Task 4: Students will be able to build the mechanical parts and assemblies. Use computer aided drawing and design (CADD) software to build models with simple shading Task 5: Students will develop an understanding of the designed world (Materials and
Lighting). (1) Map the textures on the model surface with accurate placement

Design and Applied Technology (Secondary 4 – 6) Module 5
182
(2) Create stylish lighting in a scene to express the mood of content Task 6: Prepare and present formal documents (1) Prepare multimedia presentations to demonstrate a clear sense of audience and purposes (2) Prepare a final report [Part C] Project Guidelines Phase I: Project Proposal A project proposal (1) Should be submitted to the teacher for approval before any measurement and redesign
processes (2) Has to be of two A4 paper sheets or less, without sketches and drawings (3) Must cover the following points:
(a) Students’ names and class (b) A brief textual description of the selected product, explaining the general functions,
operating conditions, and project objectives of the product (c) A sketch of the product (d) A brief project timeline
Phase II: Weekly Progress Team Report Each student should complete a weekly progress report for submission to the teacher. Phase III: Final Project Report The final report is a group project. Students may refer to the following report format:
A. Executive Summary This is a brief summary of the integrated study with the project team’s recommendations. Both the project team’s original and redesigned product should be included. The advantages and disadvantages of the redesigned product against those of the existing one should also be pointed out.
B. Introduction
(1) Give necessary background information on the product chosen for the project;
(2) Point out the project’s importance (3) Present a 3D assembled or exploded view of the current product chosen
for redesign, leaving details at subsequent sections (4) Outline the report structure and contents

Design and Applied Technology (Secondary 4 – 6) Module 5
183
C. Objectives
(1) State project objectives in a precise and concise manner (2) Do not confuse with procedure
D. Procedure
Describe the overall procedure for achieving the stated objectives
E. Design and Analysis (1) Present and discuss the designed solid model representations of all the
components (2) State any simplifications made for the computer-based representations
created (3) Provide sound reasons to explain why these simplifications are used (4) Integrate all figures into text write up (5) Assign all figures in the report numbers, captions and reference
F. Conclusions and Recommendations
(1) Never present new materials in this part (2) Draw conclusions from the results presented in previous sections (3) Recommend solutions after conclusion
Phase IV: Oral Presentation Each presentation is limited to 8 minutes, with a 3-minute Q&A session.

Design and Applied Technology (Secondary 4 – 6) Module 5
184
PRACTICAL TASK SAND EXERCISES Practical Task 1 (for Chapter 1) Criteria of practical task
Number of students per group: 4 – 6 Tools required: pencils, rulers, paper cutters, scissors, crayon, and white glue Materials: cardboard and foam board
Remark: All tools and materials can be bought in stationery stores. Task 1.1 Make a paper architectural model of your secondary school campus using an appropriate scale in 2 hours Task 1.2 Make a foam-board model for a 60-m2 domestic flat using an appropriate scale in 1 hour

Design and Applied Technology (Secondary 4 – 6) Module 5
185
Practical Task 2 (for Chapter 2) Task 2.1 The figure below is a company logo. Use “X” as the pole to draw and enlarge the logo in a ratio of 2:1.
Time allowed: 20 minutes
Task 2.2 Draw the following in full size (1:1) in first-angle projection:
(1) A sectional front view on A-A (2) A sectional plan view on B-B (3) An end view, shown in the
following figure. Ensure that all views are in correct positions. Each side of a construction square is 5 mm in length.
Time allowed: 60 minutes
Elevation

Design and Applied Technology (Secondary 4 – 6) Module 5
186
Exercise 1 (for Chapter 2) Exercise 1.1: Drawing the One-Point Perspective Drawing (1) Determine the position of the vanishing
point (2) Sketch a one-point perspective drawing
for the following object
Exercise 1.2: Drawing the Two-Point Perspective Drawing Sketch a two-point perspective drawing for the following object. Given that (1) The sight point is 60 from the picture plane, and 150 above the ground plane (2) The object is standing on the ground plane.30°

Design and Applied Technology (Secondary 4 – 6) Module 5
187
Exercise 1.3: Drawing the First Angle Orthographic Projection Sketch a three-view projection for the following object using First Angle Orthographic Projection
Exercise 1.4: Drawing the Third Angle Orthographic Projection Sketch a full-size view in Third Angle Projection for the components shown below Remark: The directions of viewing indicated by the arrows correspond to the front view.
(1) (2)
Exercise 1.5: Sectional Drawing of an object Sketch a sectional view for the following 3D object

Design and Applied Technology (Secondary 4 – 6) Module 5
188
Exercise 1.6: Orthographic Projection and Sectional Drawing and of an object
Draw the following views in full size using First Angle Projection: (1) Plan (2) Sectional elevation on A-A (3) 2-end views
Exercise 1.7: More than one Sectional Drawings of an object Draw two sectional views cut by the section lines X-X and Y-Y for the following object

Design and Applied Technology (Secondary 4 – 6) Module 5
189
Exercise 2 (for Chapter 3) Exercise 2.1 Question 1 Create the earth prong of an electrical plug.
Question 2 Modify the earth prong in Question 1 to the live/ neutral prong of the electrical plug with the following dimensions. The diameters of the two holes remain unchanged.

Design and Applied Technology (Secondary 4 – 6) Module 5
190
Exercise 2.2 Design and create the following tape dispenser.
Steps: 1. Start with a rectangle and a circle to draw a 2D profile;

Design and Applied Technology (Secondary 4 – 6) Module 5
191
2. Extrude the profile with a depth of 45 mm; 3. On Extrude’s top face, create a rectangle profile; and
4. Use Extrude-Cut to cut downward with a depth of 45 mm.

Design and Applied Technology (Secondary 4 – 6) Module 5
192
Exercise 2.3 Question 1 Create a 3D solid model for an AA battery. Steps:
(1) Measure an AA battery’s geometry (2) Decide a sketch plane for drawing the profile for the battery (3) Create a 3D model
Question 2 Use Sweep to create a 3D model for the battery spring shown below. Steps:
(1) Draw a profile for the path on a vertical sketch plane (2) Draw a profile for the section on a horizontal sketch plane (3) Use Sweep to create the part
Step (2) Dimensions for the section profile

Design and Applied Technology (Secondary 4 – 6) Module 5
193
Exercise 2.4 Assemble the electrical plug created in the previous exercises.
Steps: 1. Place the main body in a fixed position as the first item of the assembly 2. Insert the earth prong to the assembly, with the following mating condition:
Three pairs of parallel planes are coincident. Each pair of the planes should be perpendicular to the other two.
3. Insert the live prong to the assembly, with the following mating condition:
Three pairs of parallel planes are coincident. Each pair of the planes should be perpendicular to the other two.
4. Insert the neutral prong to the assembly, with the following mating condition:
Three pairs of parallel planes are coincident. Each pair of the planes should be perpendicular to the other two
5. Insert the end cap to the assembly, with the following mating conditions:
The upper curve of the end cap and the body are coincident. The plane at the bottom of the cap and the body are coincident.
6. Insert the screw to the assembly, with the following mating conditions: The taper surface of the screw and the countersink hole are coincident. The top face the screw and that of the body are coincident. The plan on the slot and the plane at the bottom of the body are parallel.

Design and Applied Technology (Secondary 4 – 6) Module 5
194
Exercise 2.5 Question 1 Create an engineering part drawing for a pin from a 3D model on an A4 paper sheet.
Question 2 Create an engineering assembly drawing on an A4 paper sheet.

Design and Applied Technology (Secondary 4 – 6) Module 5
195
Exercise 2.6 (optional) Create a rendering image of an electrical plug similar to the figure below.
Practical Task 3 (for Chapter 4) Task 3.1: Research on CAD and Visualization 1. Work in groups of 4; 2. Quote ONE example to show how CAD and visualization helps in daily life or in a
particular industry through research in the Internet or library; and 3. Give a 5 to 8-minute presentation on the findings. Task 3.2: How can CAD and Visualization help you? 1. Explain, in 100 words, what CAD can help in organizing school activities, such as Open
Day, School Athletic Meeting and Christmas Party; and 2. Describe how CAD can be used in used accordingly.

Design and Applied Technology (Secondary 4 – 6) Module 5
196
QUIZ 1 (for Chapter 1) Multiple Choice Questions 1. Which of the following is NOT a technique to enhance the appearance of an object?
A. Colouring B. Drawing lines C. Highlighting D. Rendering
2. Which of the following is a warm colour?
A. Blue B. Green C. White D. Yellow
3. Which of the following is a cool colour?
A. Black B. Blue C. White D. Yellow
4. The X source of light can be the strongest light, performing a darker and more definite shape to a shadow area. The Y source of light gives a weaker, lighter and softer edged shape in a shadow area. X Y
A. primary primary B. primary secondary C. secondary primary D. secondary secondary

Design and Applied Technology (Secondary 4 – 6) Module 5
197
Short Questions 1. Use the Thick and Thin Line technique to enhance the object below.
Long Questions 1. (a) State and describe two types of shading techniques
(b) Demonstrate the two techniques mentioned in (a) with the following figure.

Design and Applied Technology (Secondary 4 – 6) Module 5
198
2. The figure below shows an architectural model of a park. (a) Suggest the most suitable material for each of the items indicated below.
(b) Select the most suitable materials for making the following models.
i. A mirror ii. A green house iii. A 3-storey house iv. an LCD TV v. A sampan vi. A domestic cabinet
(c) Explain why a 2D plan is usually used for the floor plan of an apartment.

Design and Applied Technology (Secondary 4 – 6) Module 5
199
QUIZ 2 (for Chapter 2) Multiple Choice Questions 1., What kind of Perspective Drawing is NOT commonly observed in the daily life?
A. One-Point Perspective B. Two-Point Perspective C. Three-Point Perspective D. None of the above
2. Which of the following countries usually use the First Angle Orthographic Projection in
drawing presentations?
(I) United States of America (II) China (III) France (IV) Britain
A. I, II and III only B. I, III and IV only C. II, III and IV only D. All of the above
3. Which of the following section(s) belong(s) to Sectional View?
(I) Full section (II) Half section (III) Offset section (IV) Part section
A. I, II and III only B. I, II and IV only C. II, III and IV only D. All of the above
4. Which type of the following architectural drawings can be used to display the placement of
cupboards, kitchen and bathroom fixtures and wall finishes in a room?
A. Sectional drawing B. Floor plan drawing C. One-line diagram D. Elevation drawing

Design and Applied Technology (Secondary 4 – 6) Module 5
200
5. Which of the following is NOT an association that provides standards of electrical symbols?
A. Standards Australia B. British Standards C. National Standards D. Standards Electrical
6. Which of the following violates the guidelines on preparation of visual aids?
A. Each visual aid should be limited to a single concept. B. Illustrations, colours, and attention-getting devices should be used. C. Statements should be shortened to key points so that ideas can be clearly and
concisely communicated. D. Visual aids should contain texts of small size.
7. Which of the following symbols is used to represent a socket outlet? A.
B.
C.
D.
8. Which of the following symbols is used to represent a lighting outlet on wall? A.
B.
C.
D.

Design and Applied Technology (Secondary 4 – 6) Module 5
201
Long Questions 1. Draw, in full size and in Third Angle Projection, the following views of the bracket shown below:
A. A sectional front view on A-A B. An end view from the right C. A plan view
Remarks: (i) The positioning of all views should be correct. (ii) Each construction square represents a 10 mm measurement.
2. Charts can help process information and data, and facilitate analysis. Briefly describe
three most commonly used charts.

Design and Applied Technology (Secondary 4 – 6) Module 5
202
QUIZ 3 (for Chapter 3) Multiple Choices 1. 3D solid modelling is created by manipulating a
A. 2D open profile. B. 2D closed profile. C. 3D open profile. D. 3D closed profile.
2. A Revolve function can be used to create
A. An object with a linear depth. B. A spherical-type 3D object. C. A highly irregular shape object. D. An object by joining a sequence of profiles.
3. An Extrude-Cut feature is created by
A. A union operation. B. An intersect operation. C. A subtraction operation. D. None of the above.
4. In parametric modelling, the shape of a model is driven by
A. Dimensions. B. Features. C. Primitives. D. Sketches.
5. In feature modelling, the final shape of a 3D model
A. Always depends on the sequence of the features. B. Never depends on the sequence of the features. C. Sometimes depends on the sequence of the features. D. Depends on the sequence of the features only after the dependency option is set.
6. A fillet function in a 2D sketch is to A. Erase a portion of an entity. B. Erase the whole entity. C. Replace the corner with two straight lines. D. Replace the corner with an arc.
7. The following shape can be created with
A. An Extrude function. B. A Revolve function. C. A Sweep function.

Design and Applied Technology (Secondary 4 – 6) Module 5
203
D. A Loft function. 8. Suppose two parts are mated together without any relative translation movements, but can
rotate independently of each other. The number of degrees of freedom is A. One. B. Two. C. Three. D. Four.
9. If the parts and the assembly have associate relationships, then
A. Any changes in the parts will update the assembly. B. Any changes in the assembly will update the parts. C. Both A and B. D. None of the above.
10. A bill of materials table will be created automatically when
A. A part is created. B. An assembly is created. C. A drawing is created. D. A balloon is created.
11. Which of the following shading methods gives the best image result?
A. Flat B. Curvature C. Gouraud D. Phong
12. Ray tracing is used to
A. Create photo-realistic images. B. Have fast displays of coloured 3D objects. C. Define the true colours of RGB. D. Define the true colours of HSV.
Long Questions 1. Use a diagram to illustrate how a 3D model of an object is represented in a CAD system. 2. Describe what need to be changed in the 3D model of Question 1 if more close
representation of a real object, such as a human head, is desired. Describe also what this change will affect the computation of the 3D model.

Design and Applied Technology (Secondary 4 – 6) Module 5
204
QUIZ 4 (for Chapter 4) Multiple Choice Questions 1. A 3D scanner is mainly to:
A. Scan computer files to protect 3D systems against malicious codes and viruses. B. Scan documents for digital records and distribution. C. Calculate the distance between the objects to be scanned and the scanner to scan. D. Scan physical objects for digital recording and further manipulation in CAD
software. 2. Which of the following is NOT a direct benefit of using CAD software to simulate the logistics in a manufacturing factory?
A. Achieving an optimized design before the factory is built. B. Preventing bottleneck problems from happening before equipment is installed. C. Increasing the sales of a product. D. Predicting whether or not any renewal of equipment will be fitted in the prevailing
logistics systems. 3. Which of the following is NOT a suitable device for implementing Virtual Reality (VR) systems?
A. Head-Mounted Display B. Rapid Prototyping Machines C. Cave Automatic Virtual Environments D. Joysticks
Long Questions 1. Explain what Virtual Reality is. 2. Name, and briefly explain the functions of, TWO devices that can be used for VR
systems. 3. Name, and briefly explain how, TWO subjects in secondary school that CAD and
visualization can help in teaching.

Design and Applied Technology (Secondary 4 – 6) Module 5
205
CASE STUDIES
Case Strategy and Activity
Drawing an Orthographic Projection for a Household Product
Choose a household item, such as fans, televisions or
chairs Draw three view projections using the third angle
projection Measure the dimensions of the product Label the dimensions on the projections Draw projection symbols
Architectural and Electrical Drawings for a Classroom
Develop a set of symbols for those specific fixtures and
electrical appliances Draw an architectural floor plan of a classroom with
fixtures on graph paper Draw electrical symbols of the appliances in the
classroom on the same floor plan Draw a legend for the symbols used on a separate paper
sheet
Virtual Reality used in daily life
Quote examples for virtual reality used in industry, film
making or entertainment, etc Discuss the functions and benefits of the system
How CAD can help in the classroom
Discuss how CAD can help in a particular subject, such as
a language subject or any others Express ideas in drawings or presentations

Design and Applied Technology (Secondary 4 – 6) Module 5
206
USEFUL WEBSITES
For topic 1.1 http://www.lowes.com/lowes/lkn?action=howTo&p=HomeDecor/ColorScheme.html
For topic 1.2.4
http://www.technologystudent.com/joints/joindex.htm For topic 2.1
http://www.khulsey.com/perspective_basics.html http://www.cadalot.co.uk http://www.bsi-global.com/en/ http://www.saiglobal.com/
For topic 2.2.4
http://www.design-technology.info/IndProd/drawings/default.htm http://www.ider.herts.ac.uk/school/courseware/graphics/engineering_drawing/ http://www.roymech.co.uk/Useful_Tables/Drawing/Mech_Drawings.html#GA
For topic 3.1.1
http://en.wikipedia.org/wiki/Stereolithography For topic 3.2.1
http://desktoppub.about.com/od/graphicdesign/Graphic_Design.htm?terms=graphic+design http://en.wikipedia.org/wiki/Stereolithograph
For topic 3.2.2
http://www.3dtotal.com/ffa/tutorials/max/head_tutorial/head.asp For topics 3.2.4 and 3.2.5
http://www.cocreate.com/products/Modeling-Overview.aspx For topic 3.3.1
http://www.about.com http://www.download.com/Graphic-Design-Software/
For topic 3.3.2
http://www.educational-software-directory.net/multimedia/ http://www.itvdictionary.com/itv_video_production_software.html http://emusician.com/editing/index.html http://www.animationschoolreview.com/animation-software-basics.html
For topic 3.3.3
http://www.archiexpo.com/cat/architecture-software-conception-calculation-modelling/2d-3d-architecture-software-R-905.html
For topic 3.3.4
http://metals.about.com/od/cadcam/CAD_CAM_Software.htm

Design and Applied Technology (Secondary 4 – 6) Module 5
207
For topic3.3.5
http://metals.about.com/od/cadcam/CAD_CAM_Software.htm For topic 4.1.1
http://www.hkis.org.hk/hkis/html/upload/NewsPressRelease/nwpr127_0.pdf For topic 4.1.2
http://www.fhi.com.tw/english/d2_11.htm For topic 4.1.4
http://www.cat.com/cda/servlet/cat.vce.servlet.VeritySearchServlet?m=8703&x=7&searchField=Virtual+Reality
http://www-vrl.umich.edu/intro/index.html http://electronics.howstuffworks.com/virtual-reality4.htm
For topic 4.1.6
http://www.instron.com.tw/wa/products/impact/charpy_izod.aspx For Theme-based Learning Task 4
http://www.lusas.com/case/bridge/index.html http://www.cityu.edu.hk/CIVCAL/book/bridge.html
For Theme-based Learning Task 5
http://www.transas.com/products/simulators/ http://www.shipanalytics.com/MS/SHS.asp
For Hands-on Activity 6
http://www.cs.brandeis.edu/~cs155/Lecture_16.pdf http://prosjekt.ffi.no/unik-4660/lectures04/chapters/Introduction.html

Design and Applied Technology (Secondary 4 – 6) Module 5
208
REFERENCES
AutoDesk Inc (2008). Building Your World, Conceptual Design and Visualisation with AutoCAD. AutoDesk Inc.,
2008.
Bedworth, D. D., Mark R. Henderson M. R., Wolfe, P. M. (1991). Computer-integrated Design and Manufacturing.
McGraw-Hill, New York.
Cooper, K. G. (2001). Rapid Prototyping Technology: Selection and Application. Marcel Dekker, New York.
Dieter, G. E. (1991). Engineering Design : A Materials and Processing Approach. McGraw-Hill, New York.
Earle, J. H. (2007). Engineering Design Graphics AutoCAD 2007, 12th Edition. Prentice-Hall
Garcia, A.B., Gocke Jr. R.P., Johnson Jr. N.P. (1993). Virtual Prototyping: Concept to Production. Defence System
Management College Press, Fort Belvoir, VA.
Hart, K. R. (1975). Engineering Drawing with Problems and Solution. Edward Arnold .
Hawkes, B. (1977). The CADCAM Process. Pitman Publishing.
Jacobs, P. F. (1996). Stereolithography and Other RP&M Technologies : From Rapid Prototyping to Rapid Tooling.
Society of Manufacturing Engineers in cooperation with the Rapid Prototyping Association of SME, 1996.
Lam, C.L., Chan, K.W. (2004). Creative Design and Technology Book 1. Chinese Technical Press.
Ostrowsky, O. (1989). Engineering Drawing for Technicians volume 1. Edward Arnold.
Szalapaj, P. (2000). CAD Principles of Design, An Analytical Approach to the Computational Representation of
Architectural Form. Architectural Press.
Yee, R. (2003). Architectural Drawing, Second Edition. John Wiley & Sons Inc.
Yuen, P. C. (1993). New Design and Technology for Hong Kong Book 3. Pilot Publishing Company Ltd.
陳忠偉,馮景堂 (1998)。中學會考設計與科技第一冊、第二冊。現代教育研究社。

Design and Applied Technology (Secondary 4 – 6) Module 5
209
GLOSSARY OF TERMS
Term Definition 2D Two Dimension(al) 3D Three Dimension(al) 3D modelling 3D modelling is a computer aided engineering technique that creates
model objects on a computer. It involves three-dimensional geometrical information and enables the production of various projected views to aid visualization.
Acrylic A chemical substance produced from a type of acid Algorithm A computational method for solving problems Alloy A metal made by mixing two or more metals, or a metal and another
substance Animation A rapid display of a sequence of images or frames of 2D artwork or
model positions to create an appearance of continuous movement AutoCAD A popular CAD application; developed by Autodesk Auxiliary plane A plane parallel to the desired line or lines representing an edge view of
the desired surface Bitmap A computer file format for images. It carries a file extension of BMP.
It is a ‘map’ of the bits (0 and 1) that form a particular picture when rendered to a display like a computer monitor.
Boolean (set) operations
A Boolean operation combines two or more solids into a single new solid object with the mathematical set operations of union, intersection and difference (or subtraction). It is also a natural way to construct complex solid objects from simple primitives. For example, the CSG representation scheme allows a user to define complex 3D solid objects by hierarchically combining simple geometric primitives using Boolean operations. (a) Union (U)
This operation places all original solids into a new solid. The symbol is A U B. The union corresponds to the logical operator OR.
(b) Intersection (∩) This operation places the volume that is common to each original solid into a new solid. The symbol is A ∩ B. The intersection corresponds to the logical operator AND.
(c) Difference or Subtraction (-) This operation places the first-named original solid into a new solid except for the volume that is common with the second-named original solid. The symbol is A - B or B - A. The order of the subtraction operation is important because the resulting solid of A - B is different from that of B - A. The subtraction operator corresponds to the logical NOT.
C-REP Constructive Solid Geometry Representative Method CAD Computer Aided Design, i.e. using computers to facilitate one’s design
process

Design and Applied Technology (Secondary 4 – 6) Module 5
210
Term Definition CAD/ CAM Using computers to facilitate one’s design and manufacturing processesCAM Computer Aided Manufacturing, i.e. using computers to facilitate one’s
manufacturing process Cardboard A material like very thick stiff paper; usually pale brown in colour Chipboard A hard material made from small pieces of wood mixed with glue; often
used instead of wood in making furniture CS Case Study CSG Constructive Solid Geometry is a representation model based on the
Boolean set operations. Cut Cut, in the context of CAD, refers to the removal of materials from a
solid by moving the profile in a straight line. Dimensioning Addition of dimensions, notes and lines to a drawing DM Demonstration DP Design Project DWG A computer file format for AutoCAD drawings Electrical appliance
A household electrical device, machine or piece of equipment, such as a cooker or washing machine
Electrical wiring Insulated conductors used to carry electricity, and associated devices to provide power in buildings and structures
EX Exercises/Practical Task Extrude Extrude, in the context of CAD, refers to the moving of a 2D profile
along a straight line to create a 3D solid. Floor plan A bird’s-eye view plan of a room or a floor of a building drawn on scaleFluorescent light Using electricity to excite mercury vapour in argon or neon gas to create
a plasma that produces short-wave ultraviolet light – This light then causes a phosphor to fluoresce, producing visible light. Since less heat is produced, its efficiency is higher.
Foam board A display board made primarily with foam Full section The view obtained when the cutting plane is right across the object Half section The view obtained when the cutting plane goes half way across the
object to the centre line. It is used for symmetrical objects. Heritage Conservation
The act of maintaining and repairing as well as retaining existing historic materials
HO Hands-on Activity Incandescent light 1. First type of electric light;
2. Introduced in the early 19th century; 3. Banned in some countries nowadays for its low efficiency of
converting electricity to light Infrastructure Basis buildings, systems or service for a community, such as roads,
electricity, telephone service, and public transportation Isometric drawing A drawing used to show three sides of an object, all in dimensional
proportion but not true shapes

Design and Applied Technology (Secondary 4 – 6) Module 5
211
Term Definition Loft Loft, in the context of CAD, refers to the creation of a 3D object by
joining a sequence of profiles. Logistics The planning, implementation and management of the efficient and
effective flow and storage of resources, such as goods, services, energy and related information, from one location to another
Mock-up A full-size scale model of a structure or device for teaching, demonstration, testing a design, etc purposes
Multimedia A combination of different types of contents, such as text, graphics, video, animation and sound, for advertising, entertainment, public information, training and education, etc
Parametric modelling
The capability of CAD software that allows the design of a product in which certain dimensions are not fixed, but can be varied for purposes of design modification or to generate different members of the same family of products.
Pixel The smallest displayable point in a graphic system Power sockets outlets
Electrical connectors with slots or holes for delivery of electricity to plugs
Pro/Engineer A CAD, CAM and CAE software package, developed by Parametric Technology Corporation
Raster graphics Raster graphics are the creation of images by grouping many individual very tiny squares (pixels) of various colours. More pixels used can lead to a better look of images and vice versa.
Rendering Rendering, in the context of CAD, refers to the process of using computer programs to generate an image from a computer model of objects. The model is a description of 3D objects in a specifically defined language or data structure. The model contains the information of geometry, viewpoint, texture, lighting and shading. The term is an analogy to an “artist’s rendering” of a scene. Rendering has been used in architecture, video games, simulators, movie or TV special effects, and design visualization.
Revolve Revolve, in the context of CAD, refers to the generation of a 3D solid by rotating the 2D profile about an axis.
RM Resources Material SolidWorks A CAD software package for mechanical design, drafting, solid
modelling and product assembly Stress analysis An engineering discipline for calculating the stresses in materials and
structures under forces or loads Switchboard A control panel for operating electrical equipment, such as switches,
circuit breakers, fuses and meters Sweep Sweep, in the context of CAD, refers to the creation of a 3D object by
defining a profile moving along a predefined path.

Design and Applied Technology (Secondary 4 – 6) Module 5
212
Term Definition Texture Feel and appearance of the surface of a substance, such as how rough or
smooth the object is. Texturing A process of adding texture details to an object TG Teachers’ Guide TLT Theme-based Learning Task Unigraphics A software package for product design, drafting, 3D solid modelling,
engineering analysis and project management, CAM, etc; used by many large manufacturers for cars, airplanes, medical implant devices and machine tools
Vector graphics Vector graphics are the creation of digital images through a sequence of commands or mathematical statements that place lines and shapes in a given 2D or 3D space. Scaling up or down the size of an image will not affect the output quality.
Virtual prototyping
The process of using a virtual prototype, in lieu of a physical prototype, for index and evaluation of specific characteristics of a candidate design.
Virtual reality Virtual reality is the simulation of a real or imagined environment that can be experienced visually in 3D and that may additionally provide an interactive experience visually in full real-time motion with sound and possibly with tactile and other forms of feedback. The simplest form of virtual reality is a 3D image that can be explored interactively at a personal computer, usually by manipulating keys or the mouse so that the content of the image moves in some direction or zooms in or out.
Visual representation
One type of visual representation is interpreted by a perceptual visual system. Another is used to represent visual information.
Visualization A technique for creating images, diagrams or animations using computer systems to communicate a message or present data to users
VP Vanishing Point

Design and Applied Technology (Secondary 4 – 6) Module 5
213
Acknowledgements The authors wish to thank the following organizations/companies for permission to use their photographs and images in this resource package:
LUSAS (P. 125-126) Solidworks (P. 52, 146, 147, 175 and 177) Transas Ltd. (P.127-128) University of Michigan Virtual Reality Laboratory ( P.114 in Highlight Box)
Every effort has been made to trace the copyright for the photographs and images as needed. We apologize for any accidental infringement and shall be pleased to come to a suitable arrangement with the rightful owner if such accidental infringement occurs.

Design and Applied Technology (Secondary 4 – 6) Module 5
214
Technology Education Section Curriculum Development Institute Education Bureau The Government of HKSAR
Developed by Institute of Professional Education And Knowledge (PEAK), Vocational Training Council