Describing the Academic Content of International Mathematics and Science Assessments
16
Describing the Academic Content of International Mathematics and Science Assessments & Their Relationship To State Academic Content Standards & Assessments Presented at the 2009 IES Conference, June 2009, Washington, DC Presented at the 2009 IES Conference, June 2009, Washington, DC John Smithson, Ph.D., Wisconsin Center for Education Research John Smithson, Ph.D., Wisconsin Center for Education Research
-
Upload
phillip-whitfield -
Category
Documents
-
view
22 -
download
1
description
Describing the Academic Content of International Mathematics and Science Assessments & Their Relationship To State Academic Content Standards & Assessments. Presented at the 2009 IES Conference, June 2009, Washington, DC John Smithson, Ph.D., Wisconsin Center for Education Research. - PowerPoint PPT Presentation
Transcript of Describing the Academic Content of International Mathematics and Science Assessments

Describing the Academic Content of International Mathematics and Science Assessments
& Their RelationshipTo State Academic Content Standards & Assessments
Presented at the 2009 IES Conference, June 2009, Washington, DCPresented at the 2009 IES Conference, June 2009, Washington, DCJohn Smithson, Ph.D., Wisconsin Center for Education ResearchJohn Smithson, Ph.D., Wisconsin Center for Education Research

Using a Comprehensive Descriptive Language and a Systematic Set of Procedures
to Describe Academic Content
A common, neutral language that can be applied to describe any curriculum-based materials or practices.
A systematic procedure, utilizing teams of content experts to employ this common, neutral language as a tool for describing the content embedded in the selected materials.
Content Analysis
The Language (Taxonomy)
A two-dimensional framework for describing:
1) WHAT STUDENTS SHOULD KNOW(Represented by a detailed topic list organized into content areas.)
&2) BE ABLE TO DO
(Represented by five categories of student performance expectations.)

The Process (Content Analysis)
• Coding Teams of 3-5 Content Experts
• Independent Coding by each Analyst w/ Group Discussion
• Goal: Describe the Assessed Content
• Data Quality: Generalizability not Inter-rater Reliability

Categories of Student Performance
Topics Memorize Procedures Demonstrate
Understanding Conjecture
Analyze Solve non-
routine prob.
Place Value
Whole Nbrs.
Operations
Fractions
Decimals
Percents
B FEDC
101
105
104
103
102
104 E
106
The Description (Content Analysis)

From Coding Form
Data Collection (Content Analysis)

The Results (Content Description)
Th
e 3
Th
e 3
rdrd Dim
en
sion
Dim
en
sion

Contour Interval = 1%Tile Interval = 2.5%
K-12 Science Content PISA 2006 Science Item Pool

Alignment Analysis
Identifying similarities and differences between two content descriptions…
Alignment Indices: A summary measure, or set of Alignment Indices: A summary measure, or set of measures, designed to indicate the extent of similarity & measures, designed to indicate the extent of similarity & difference between two content descriptions.difference between two content descriptions.
… … in order to answer the question: in order to answer the question: To what extent (and how) is the PISA similar or different to To what extent (and how) is the PISA similar or different to U.S. curriculum standards and/or other key assessments.U.S. curriculum standards and/or other key assessments.

PISA 2006PISA 2006 2007 TIMSS Gr.82007 TIMSS Gr.8
I II III IV VI II III IV V I II III IV VI II III IV V
I MemorizeI MemorizeII ProceduresII ProceduresIII CommunicateIII CommunicateIV Analyze IV Analyze V Apply ConceptsV Apply Concepts
CG Align: CG Align: 0.500.50FG Align: FG Align: 0.370.37
K-12 Science Content

Gr. 8 TIMSS Gr. 8 NAEP
Mathematics Content: All Content AreasPISA 2006PISA 20060.340.34 0.620.620.380.38 0.590.59

Test Document Grade Type
TIMSS Math Gr. 8
NAEP 05 Frmwrk Gr. 8
State N Test (05) Gr. 7 7 State 0.46 0.31TIMSS Math Gr. 4 4 Internatl. 0.45 0.30State P Test (04) Gr. 8 8 State 0.45 0.29State M Inter Tst (04) Gr. 8 8 State 0.45 0.32MT CRT (07) Gr. 7 7 State 0.43 0.32State G Test (04) Gr. 7 7 State 0.42 0.29OH M OGT (08) Gr. 10 10 State 0.42 0.29OH M Ach Tst (05) Gr. 7 7 State 0.41 0.31MT CRT (07) Gr. 6 6 State 0.41 0.22OH M Ach Tst (08) Gr. 8 8 State 0.41 0.30
Standards Document Grade Type
TIMSS Math Gr. 8
NAEP 05 Frmwrk Gr. 8
MN Stnds (05) Gr. 5 5 State 0.38 0.32Hong Kong Stnds Gr. 7_9 7_9 Internatl. 0.38 0.35KS Stnds Gr. 8 8 State 0.36 0.36England Stnds Gr. 6_8 6_8 Internatl. 0.36 0.31New ME Stnds Gr. 7 7 State 0.35 0.28OH Indctrs Gr. 6 6 State 0.34 0.36DE GLEs Gr. 7 7 State 0.34 0.29OK Stnds Gr. 5 5 State 0.34 0.36NECAP Gr. 4 4 State 0.33 0.35England Stnds Gr. 9_10 9_10 Internatl. 0.33 0.29
TIMSS Mathematics Content Alignment
Test Document Grade Type
TIMSS Math Gr. 4
NAEP 05 Frmwrk Gr. 4
NAEP08Gr4 4 National 0.49 0.38State P Test (04) Gr. 4 4 State 0.47 0.40TIMSS Math Gr. 8 8 Internatl. 0.45 0.39State P Test (04) Gr. 8 8 State 0.43 0.32State N Test (05) Gr. 5 5 State 0.43 0.33State X Test (03) Gr. 6 6 State 0.42 0.35MT CRT (06) Gr. 5 5 State 0.42 0.40State N Test (05) Gr. 4 4 State 0.41 0.30State G Test (05) Gr. 5 5 State 0.40 0.35State G Test (06) Gr. 3 3 State 0.40 0.32
Standards Document Grade Type
TIMSS Math Gr. 4
NAEP 05 Frmwrk Gr. 4
MI Stnds Gr. 4 4 State 0.47 0.34MN Stnds (05) Gr. 5 5 State 0.46 0.37MI Stnds Gr. 3 3 State 0.46 0.33MI Stnds Gr. 2 2 State 0.42 0.26IN Stnds Gr. 4 4 State 0.40 0.33Singapore Stnds Gr. P4 P4 Internatl. 0.39 0.27CA Stnds Gr. 1_4 1_4 State 0.39 0.37MS Stnds Gr. 4 4 State 0.39 0.36OR Stnds Gr. 4 4 State 0.38 0.40OR Stnds Gr. 3 3 State 0.37 0.37
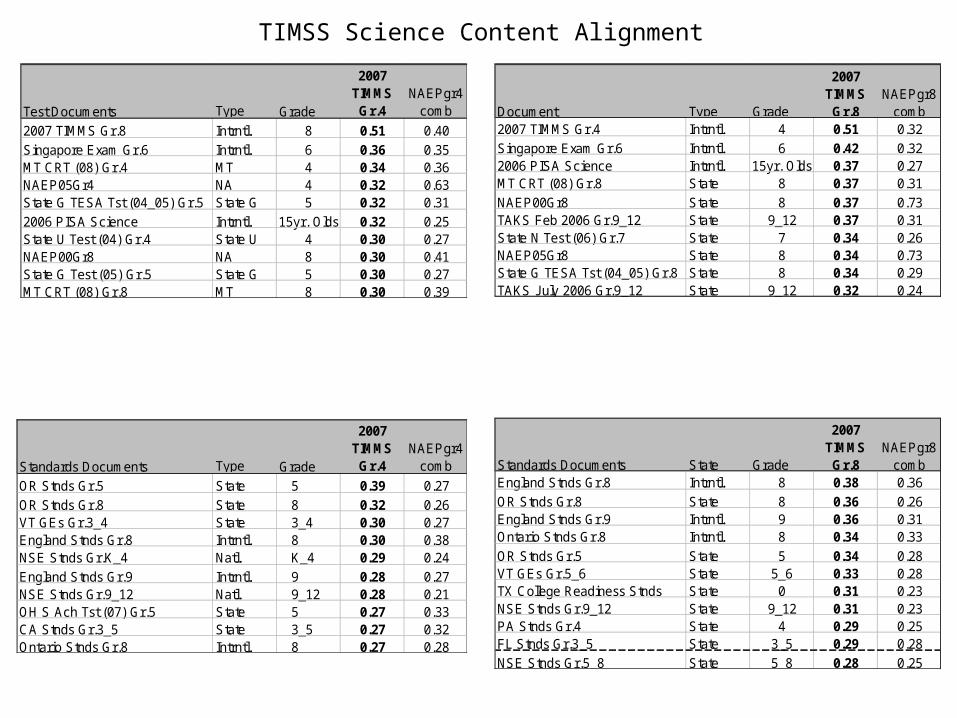
Document Type Grade
2007 TIMMS
Gr.8NAEPgr8
comb2007 TIMMS Gr.4 Intrntl. 4 0.51 0.32
Singapore Exam Gr.6 Intrntl. 6 0.42 0.322006 PISA Science Intrntl. 15yr. Olds 0.37 0.27MT CRT (08) Gr.8 State 8 0.37 0.31
NAEP00Gr8 State 8 0.37 0.73TAKS Feb 2006 Gr.9_12 State 9_12 0.37 0.31State N Test (06) Gr.7 State 7 0.34 0.26NAEP05Gr8 State 8 0.34 0.73State G TESA Tst (04_05) Gr.8 State 8 0.34 0.29TAKS July 2006 Gr.9_12 State 9_12 0.32 0.24
Standards Documents State Grade
2007 TIMMS
Gr.8NAEPgr8
combEngland Stnds Gr.8 Intrntl. 8 0.38 0.36
OR Stnds Gr.8 State 8 0.36 0.26England Stnds Gr.9 Intrntl. 9 0.36 0.31Ontario Stnds Gr.8 Intrntl. 8 0.34 0.33
OR Stnds Gr.5 State 5 0.34 0.28VT GEs Gr.5_6 State 5_6 0.33 0.28TX College Readiness Stnds State 0 0.31 0.23NSE Stnds Gr.9_12 State 9_12 0.31 0.23PA Stnds Gr.4 State 4 0.29 0.25FL Stnds Gr.3_5 State 3_5 0.29 0.28
NSE Stnds Gr.5_8 State 5_8 0.28 0.25
TIMSS Science Content Alignment
Standards Documents Type Grade
2007 TIMMS
Gr.4NAEPgr4
comb
OR Stnds Gr.5 State 5 0.39 0.27
OR Stnds Gr.8 State 8 0.32 0.26VT GEs Gr.3_4 State 3_4 0.30 0.27England Stnds Gr.8 Intrntl. 8 0.30 0.38NSE Stnds Gr.K_4 Natl. K_4 0.29 0.24
England Stnds Gr.9 Intrntl. 9 0.28 0.27NSE Stnds Gr.9_12 Natl. 9_12 0.28 0.21OH S Ach Tst (07) Gr.5 State 5 0.27 0.33CA Stnds Gr.3_5 State 3_5 0.27 0.32Ontario Stnds Gr.8 Intrntl. 8 0.27 0.28
Test Documents Type Grade
2007 TIMMS
Gr.4NAEPgr4
comb
2007 TIMMS Gr.8 Intrntl. 8 0.51 0.40
Singapore Exam Gr.6 Intrntl. 6 0.36 0.35MT CRT (08) Gr.4 MT 4 0.34 0.36NAEP05Gr4 NA 4 0.32 0.63State G TESA Tst (04_05) Gr.5 State G 5 0.32 0.31
2006 PISA Science Intrntl. 15yr. Olds 0.32 0.25State U Test (04) Gr.4 State U 4 0.30 0.27NAEP00Gr8 NA 8 0.30 0.41State G Test (05) Gr.5 State G 5 0.30 0.27MT CRT (08) Gr.8 MT 8 0.30 0.39

Test Documents Type Grade
2006 PISA
ScienceNAEPgr8_12comb
2007 TIMMS Gr.8 Intrntl. 8 0.37 0.45
Singapore Exam Gr.6 Intrntl. 6 0.34 0.30NAEPcombGr8_12 Natl. 8_12 0.32 1.00State N Test (06) Gr.7 State 7 0.32 0.262007 TIMMS Gr.4 Intrntl. 4 0.32 0.35OH Sci OGT (05_06_08) Gr.10 State 10 0.31 0.33OH S OGT (08) Gr.10 State 10 0.30 0.28TAKS Feb 2006 Gr.9_12 State 9_12 0.30 0.33OH S Ach Tst (08) Gr.8 State 8 0.30 0.23Singapore Life Sci Exam Gr.6 Intrntl. 6 0.29 0.18
Standards Documents Type Grade
2006 PISA
ScienceNAEPgr8_12comb
MI GLCE Gr.7 State 7 0.38 0.19
MI GLCE Gr.6 State 6 0.37 0.18MI GLCE Gr.5 State 5 0.37 0.18NSE Stnds Gr.9_12 State 9_12 0.35 0.28NSE Stnds Gr.5_8 State 5_8 0.34 0.28IA Core Benchmarks Gr.3_12 State 3_12 0.34 0.07OK Bio Stnds Gr.10 State 10 0.33 0.14England Stnds Gr.9 Intrntl. 9 0.33 0.34ID Bio Stnds Gr.9_10 State 9_10 0.32 0.12OK Stnds Gr.6_8 State 6_8 0.32 0.23
PISA Alignment
Test Document Grade Type
PISA Math Age15
NAEP 05 Frmwrk Gr. 8
TIMSS Math Gr. 8 8 Internatl. 0.38 0.37State P Test (04) Gr. 8 8 State 0.37 0.29State G Test (05) Gr. 5 5 State 0.36 0.27State G Test (04) Gr. 6 6 State 0.35 0.24NAEP 05 Frmwrk Gr. 8 8 National 0.33 1.00MT CRT (05) Gr. 8 8 State 0.33 0.32State X Test (03) Gr. 8 8 State 0.33 0.34MT CRT (07) Gr. 6 6 State 0.33 0.22State K Test Gr. 8 8 State 0.33 0.28NAEP08Gr4 4 National 0.33 0.29
Document Grade Type
PISA Math Age15
NAEP 05 Frmwrk Gr. 8
OK Stnds Gr. 5 5 State 0.32 0.36OH Indctrs Gr. 4 4 State 0.31 0.39NH GLE Gr. 6 6 State 0.29 0.38VT Stnds Gr. 6 6 State 0.28 0.36KS Stnds Gr. 3 3 State 0.28 0.26MN Stnds (05) Gr. 6 6 State 0.28 0.39NECAP Gr. 4 4 Regional 0.27 0.35OR Stnds Gr. 5 5 State 0.27 0.35VT Stnds Gr. 5 5 State 0.27 0.38Hong Kong Stnds Gr. 7_9 7_9 Internatl. 0.27 0.35

Alignment Levels to Key Targets Across All Documents
2 1% 33 33%85 32% 47 47%125 47% 17 17%55 21% 3 3%
Tests
AI > 0.20 & < 0.30AI > 0.30
AI > 0.10 & < 0.20AI < 0.10
Alignment Level StandardsPISA Math
40 15% 55 55%101 38% 32 32%
93 35% 13 13%33 12% 0 0%AI < 0.10
AI > 0.30Alignment Level TestsStandards
AI > 0.20 & < 0.30AI > 0.10 & < 0.20
Gr.8 TIMSS Math
40 15% 48 48%95 36% 31 31%80 30% 17 17%52 19% 4 4%
TestsStandardsAI > 0.30
AI > 0.20 & < 0.30AI > 0.10 & < 0.20
AI < 0.10
Alignment Level
Gr.4 TIMSS Math
Total # Documents 267 101
16 8% 9 12%83 43% 39 51%77 39% 25 33%19 10% 3 4%AI < 0.10
Alignment Level Standards Tests
AI > 0.20 & < 0.30AI > 0.30
AI > 0.10 & < 0.20
PISA Science
8 15% 23 55%68 38% 30 32%
105 35% 20 13%14 12% 3 0%AI < 0.10
AI > 0.30Alignment Level TestsStandards
AI > 0.20 & < 0.30AI > 0.10 & < 0.20
Gr.8 TIMSS Science
4 2% 15 20%56 29% 27 36%103 53% 28 37%32 16% 6 8%
AI > 0.10 & < 0.20AI < 0.10
Alignment Level TestsStandardsAI > 0.30
AI > 0.20 & < 0.30
Gr.4 TIMSS Science
Total # Documents 195 77

www.SEConline.org