Describing Patterns and Disruptions in Large Scale Mobile App Usage Data
35
Describing Patterns and Disruptions in Large Scale Mobile App Usage Data Steven van Canneyt*, Marc Bron, Mounia Lalmas and Andy Haines *Work carried out as part of Steven Canneyt internship at Yahoo London
-
Upload
mounia-lalmas-roelleke -
Category
Internet
-
view
229 -
download
0
Transcript of Describing Patterns and Disruptions in Large Scale Mobile App Usage Data
Describing Patterns and Disruptions in Large Scale Mobile App Usage Data
Steven van Canneyt*, Marc Bron, Mounia Lalmas and Andy Haines
*Work carried out as part of Steven Canneyt internship at Yahoo London

This work
§ Why is it important to understand patterns of app usage? § What is known about patterns of app usage?
§ What we did ● Disruption of app usage behaviour through major sport (Euro 2016),
political (Brexit) and social (new year day)

Why is it important to understand patterns of app usage?
● Increasing usage of mobile devices and mobile applications (apps) ● Emergence of online marketplaces and APIs à developers, market
intermediaries & consumers develop, disseminate, and use apps
● Advertising industry wants to improve targeting and experience with apps ● Marketplace operators want to identify popular or problematic apps à provide
effective app recommender systems ● Developers want to understand why their apps are liked or disliked à improve app
design ● Insights for Yahoo London Ad Sales

What is known about patterns of app usage?
● Relationship between demographics and app usage ● Identify distinct types of users based on their app usage (e.g.
evening learners, screen checkers, game addicts)
● Simple features app category, time of day, workday versus weekend
(Malmi & Weber, 2016; Zhao etal, 2016)

Teenager app usage (UK)
13-17: peak in morning
13-17: drop during day school!
13-17: increase in evening
Weekday Percentage of app sessions per 15-minute window by age
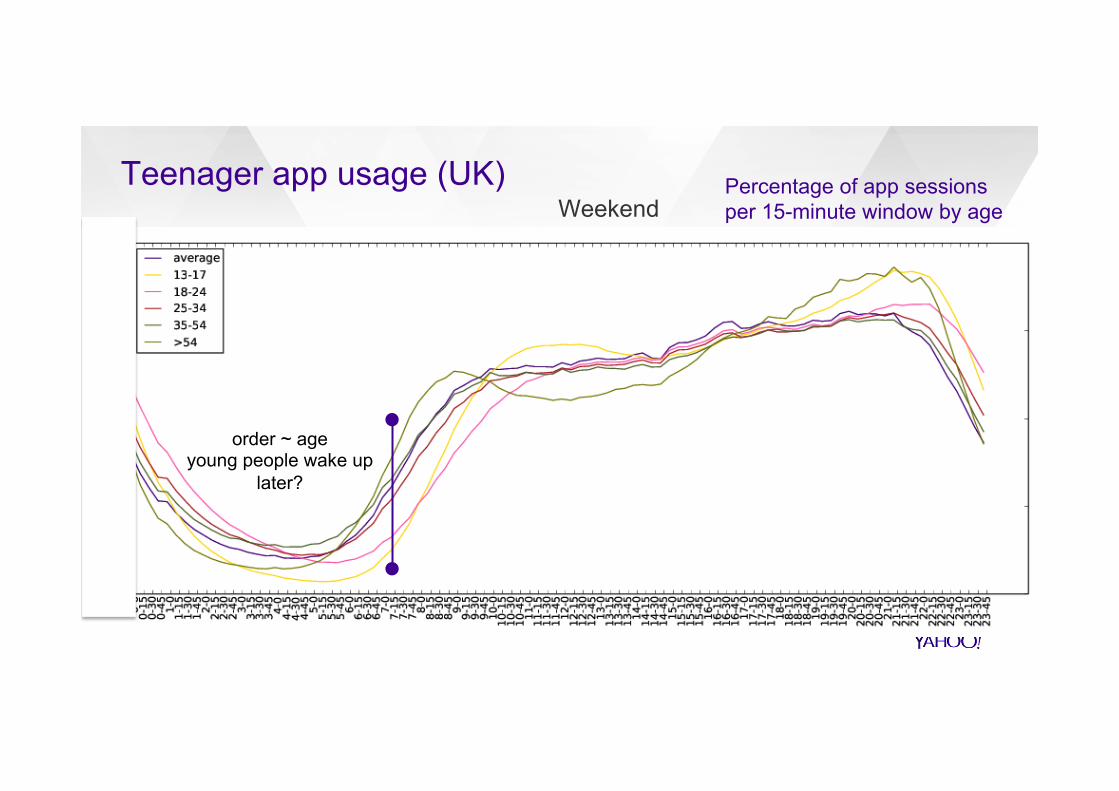
Teenager app usage (UK)
order ~ age young people wake up
later?
Weekend Percentage of app sessions per 15-minute window by age

General patterns of app usage
• Average number of visited app per week and per user is 7 with 5 app categories within a day
social network > search > e-commerce
• Users interact between 10 to 200 times a day on average with session length between 10-250 seconds
• Mostly short sessions with 80% of apps used ≤ 2 minutes
• Overwhelmingly only one app per session • App usage often focused at specific time (news app in morning)
(Yang etal, 2015; Falaki etal, 2010)
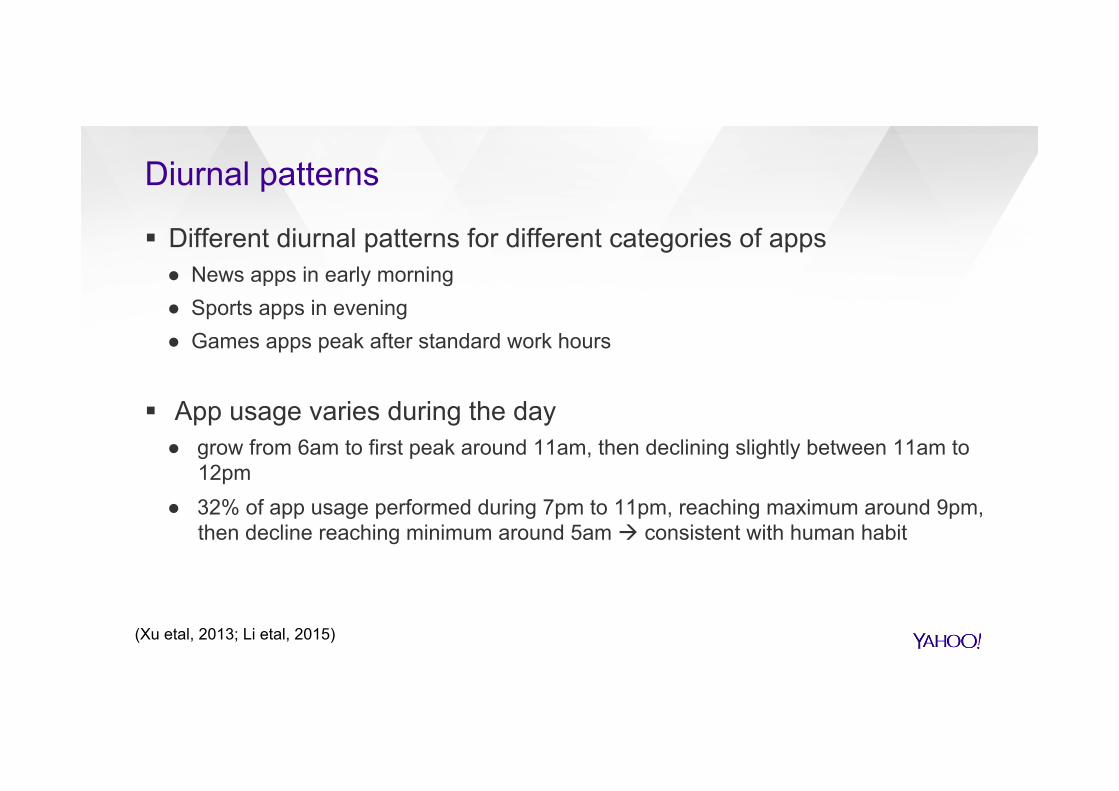
Diurnal patterns
§ Different diurnal patterns for different categories of apps ● News apps in early morning ● Sports apps in evening ● Games apps peak after standard work hours
§ App usage varies during the day ● grow from 6am to first peak around 11am, then declining slightly between 11am to
12pm ● 32% of app usage performed during 7pm to 11pm, reaching maximum around 9pm,
then decline reaching minimum around 5am à consistent with human habit
(Xu etal, 2013; Li etal, 2015)
What is known about patterns of mobile app usage?
● App usage follows regular patterns, in terms of which app, and when during the day or the weekday they are mostly used
● So what about cases when these patterns are disrupted?
Data: Flurry Analytics
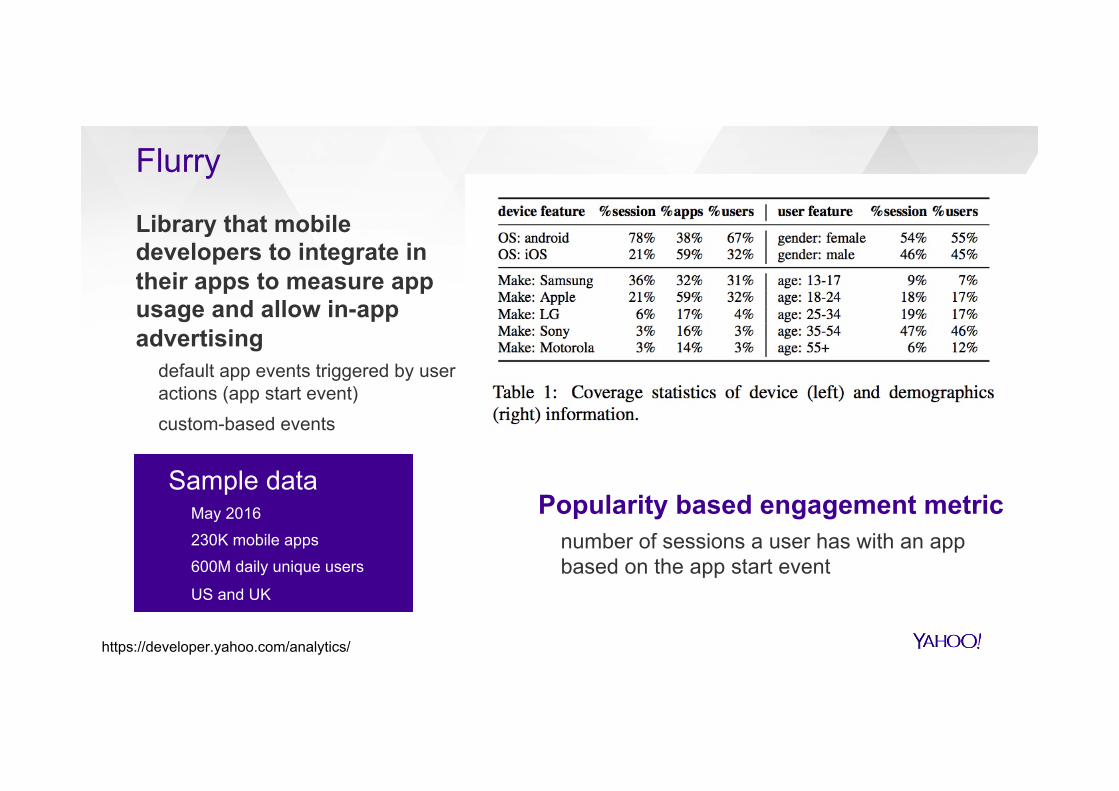
Flurry
Library that mobile developers to integrate in their apps to measure app usage and allow in-app advertising
default app events triggered by user actions (app start event) custom-based events
Popularity based engagement metric number of sessions a user has with an app based on the app start event
Sample data May 2016
230K mobile apps
600M daily unique users
US and UK
https://developer.yahoo.com/analytics/
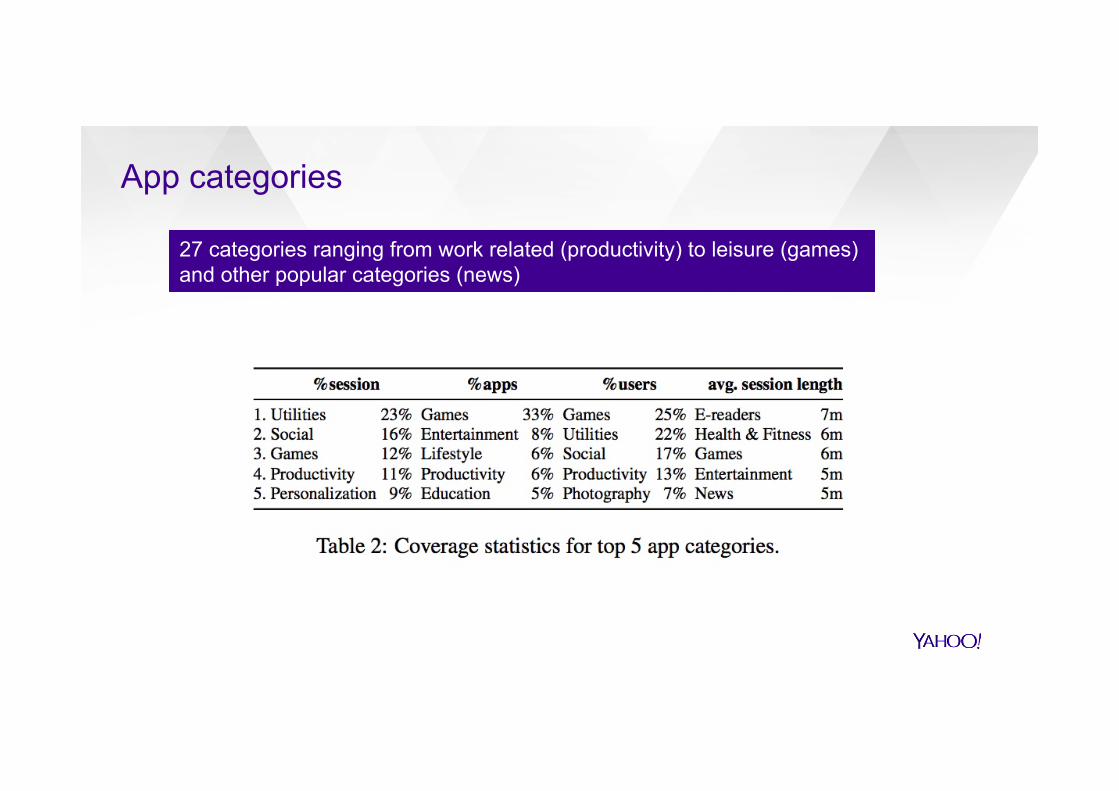
App categories
27 categories ranging from work related (productivity) to leisure (games) and other popular categories (news)
Engagement patterns in app usage
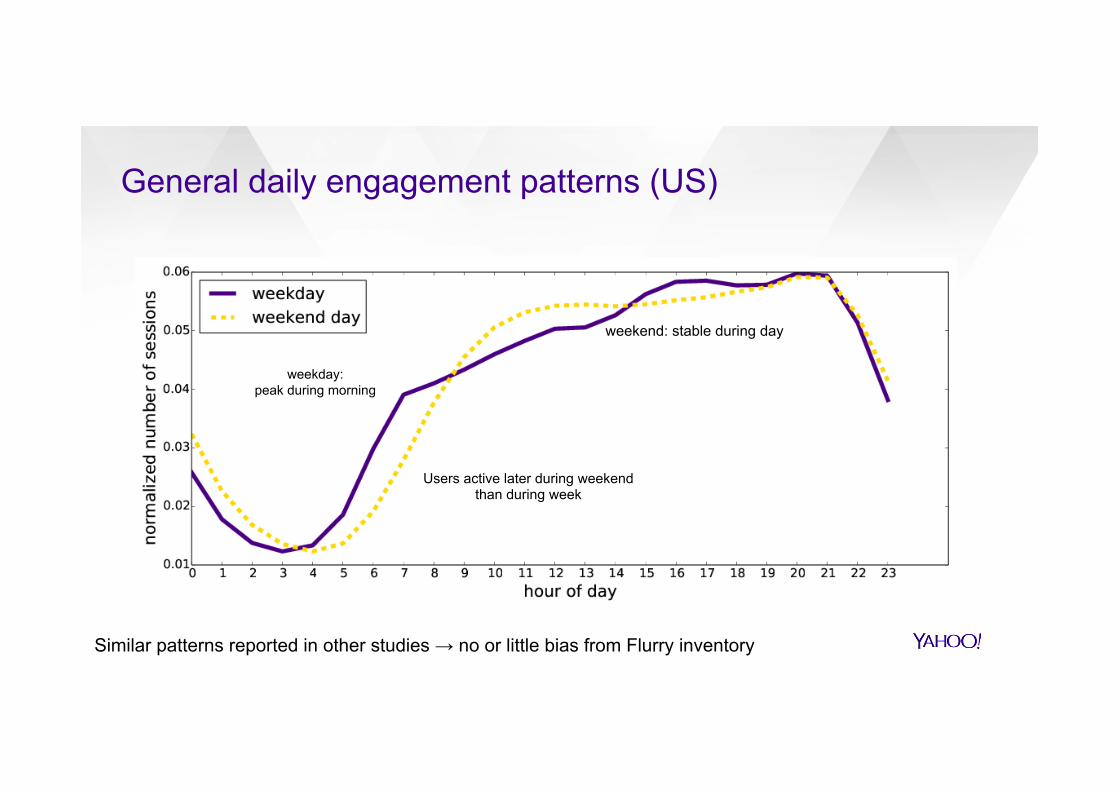
General daily engagement patterns (US)
weekday: peak during morning
Users active later during weekend than during week
weekend: stable during day
Similar patterns reported in other studies → no or little bias from Flurry inventory

Daily engagement patterns by category (US)
Similar patterns reported in other studies → no or little bias from Flurry inventory
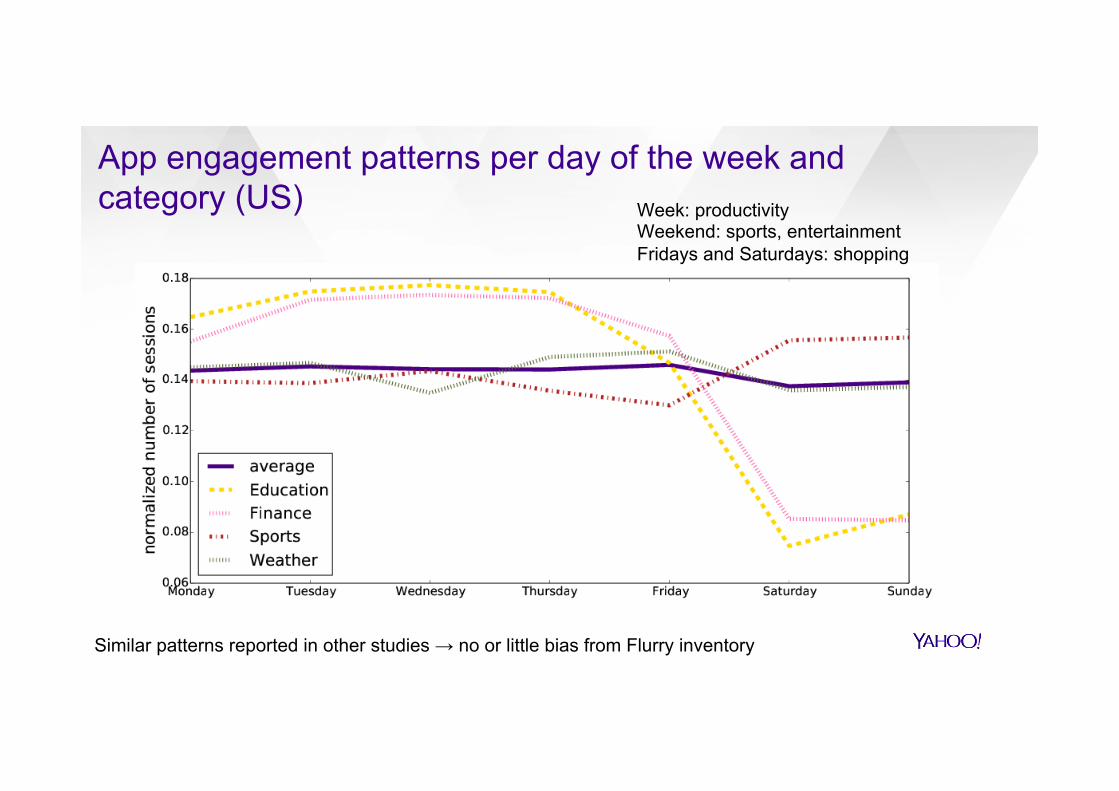
App engagement patterns per day of the week and category (US) Week: productivity
Weekend: sports, entertainment Fridays and Saturdays: shopping
Similar patterns reported in other studies → no or little bias from Flurry inventory
Disruptions in engagement patterns in app usage in major UPCOMING KNOWN events
SPORT: EURO 2016 POLITICAL: BREXIT SOCIAL: NEW YEAR DAY

Data processing and measurement
• Target day and reference days If target event occurs on Saturday then take a number of Saturdays before event
• Remove outliers from reference days (outage, new app release, other major event) number of start session events either ≤ 1st quartile – 1.5 or ≥ 3rd quartile + 1.5
• Day divided into time segments (e.g., 15 minutes) and normalize • avgt: expected number of sessions per time segment t estimated by averaging
normalized number of sessions for reference days • stdt: standard deviation for reference days
• Behaviour “significantly” disrupted: normalized number of sessions during target period ≥ avgt + 2·stdt or ≤ avgt − 2·stdt

Case study 1: EURO 2016
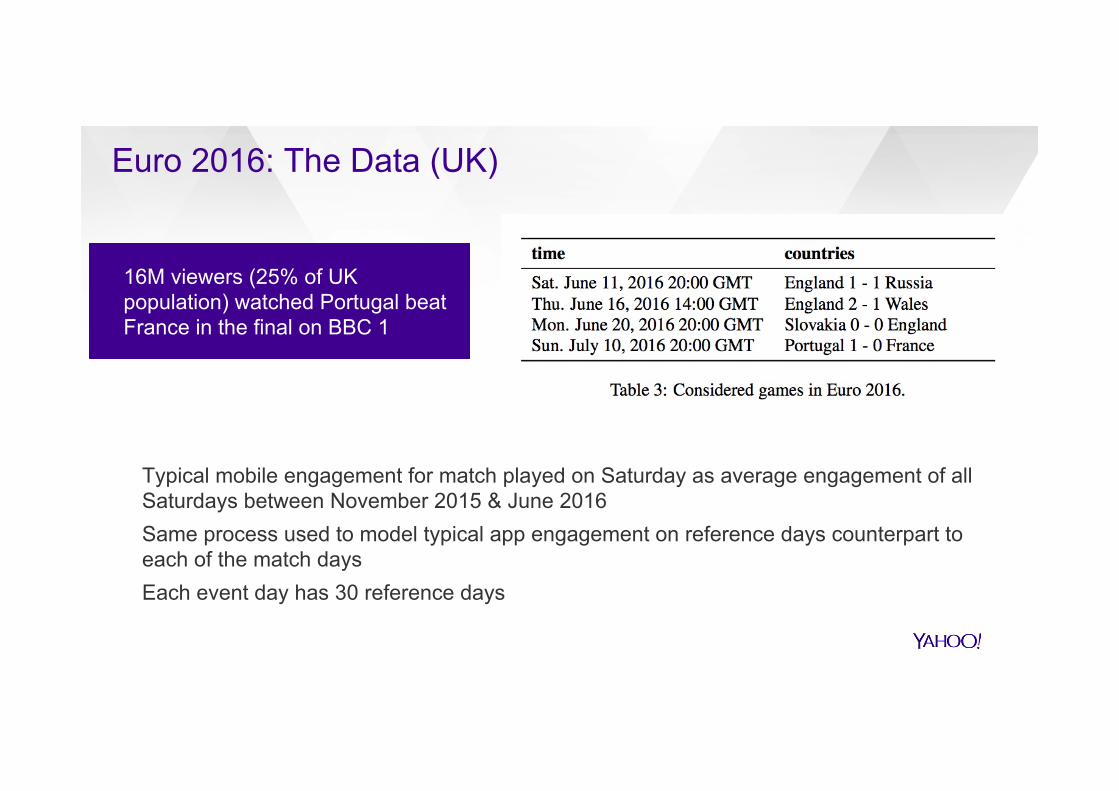
Euro 2016: The Data (UK)
16M viewers (25% of UK population) watched Portugal beat France in the final on BBC 1
Typical mobile engagement for match played on Saturday as average engagement of all Saturdays between November 2015 & June 2016 Same process used to model typical app engagement on reference days counterpart to each of the match days Each event day has 30 reference days
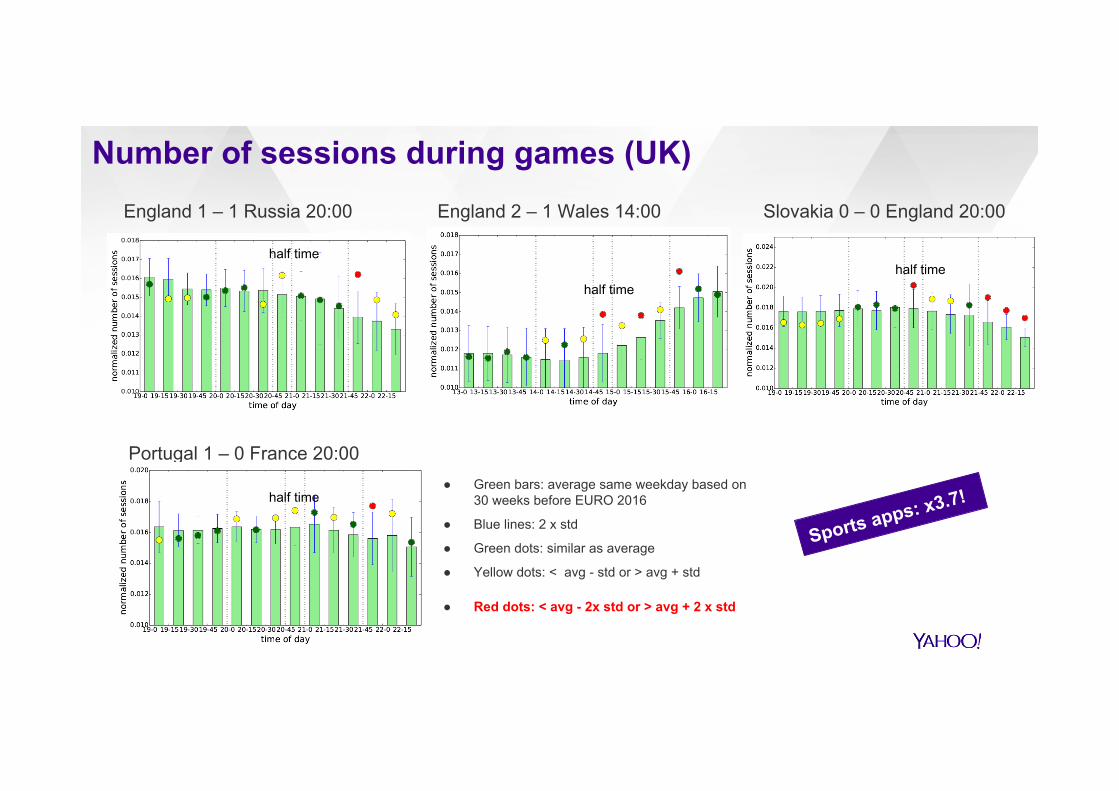
Number of sessions during games (UK)
England 2 – 1 Wales 14:00 Slovakia 0 – 0 England 20:00
Portugal 1 – 0 France 20:00 ● Green bars: average same weekday based on
30 weeks before EURO 2016
● Blue lines: 2 x std
● Green dots: similar as average
● Yellow dots: < avg - std or > avg + std
● Red dots: < avg - 2x std or > avg + 2 x std
England 1 – 1 Russia 20:00
Sports apps: x3.7!
half time
half time half time
half time
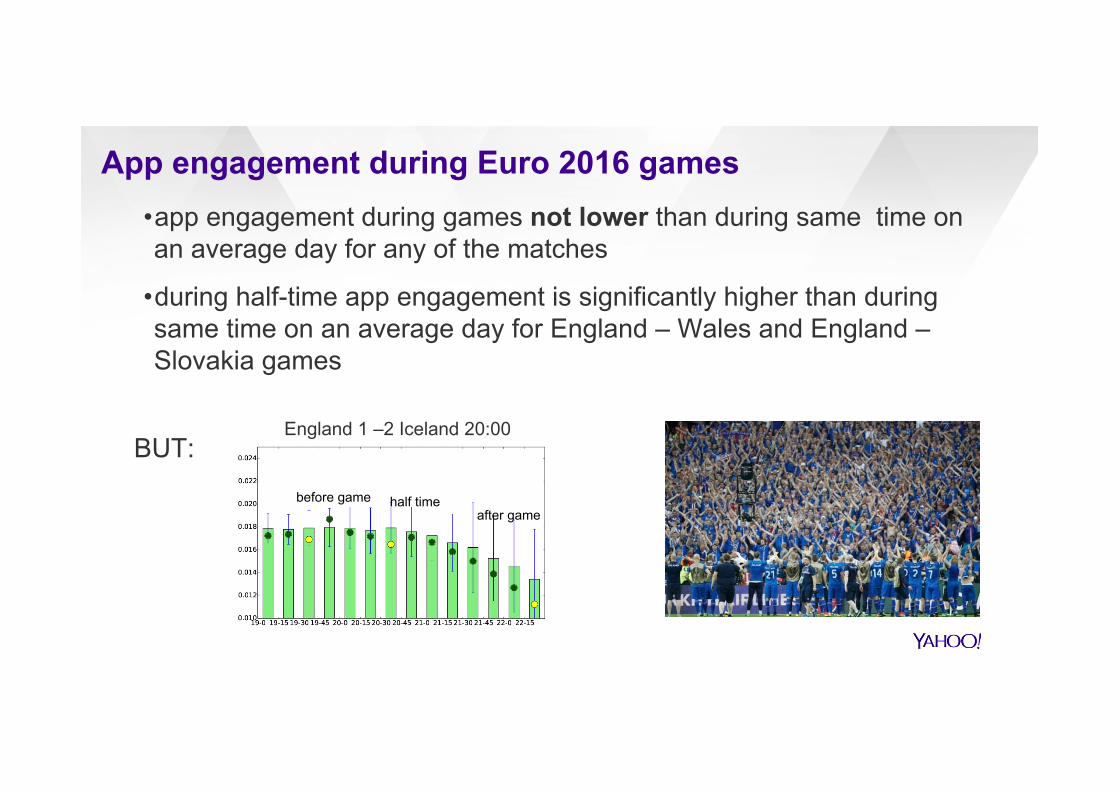
England 1 –2 Iceland 20:00
before game half time
App engagement during Euro 2016 games • app engagement during games not lower than during same time on an average day for any of the matches
• during half-time app engagement is significantly higher than during same time on an average day for England – Wales and England – Slovakia games
BUT:
after game
Case study 2: BREXIT
BREXIT (UK)
European Union membership referendum – Brexit – took place on Thursday June 23, 2016 in the UK to gauge support for the country’s continued membership of the European Union
§ Study whether outcome coincides with disruptions in app usage § Reference days are all weekdays in June before June 24 § Top 10 app categories with largest percentage change in session volume compared
to average usage
Result was announced in early morning of June 24, 2016: overall vote to leave the EU by 51.9% on a national turnout of 72% unstability in financial markets & turmoil in UK political landscape
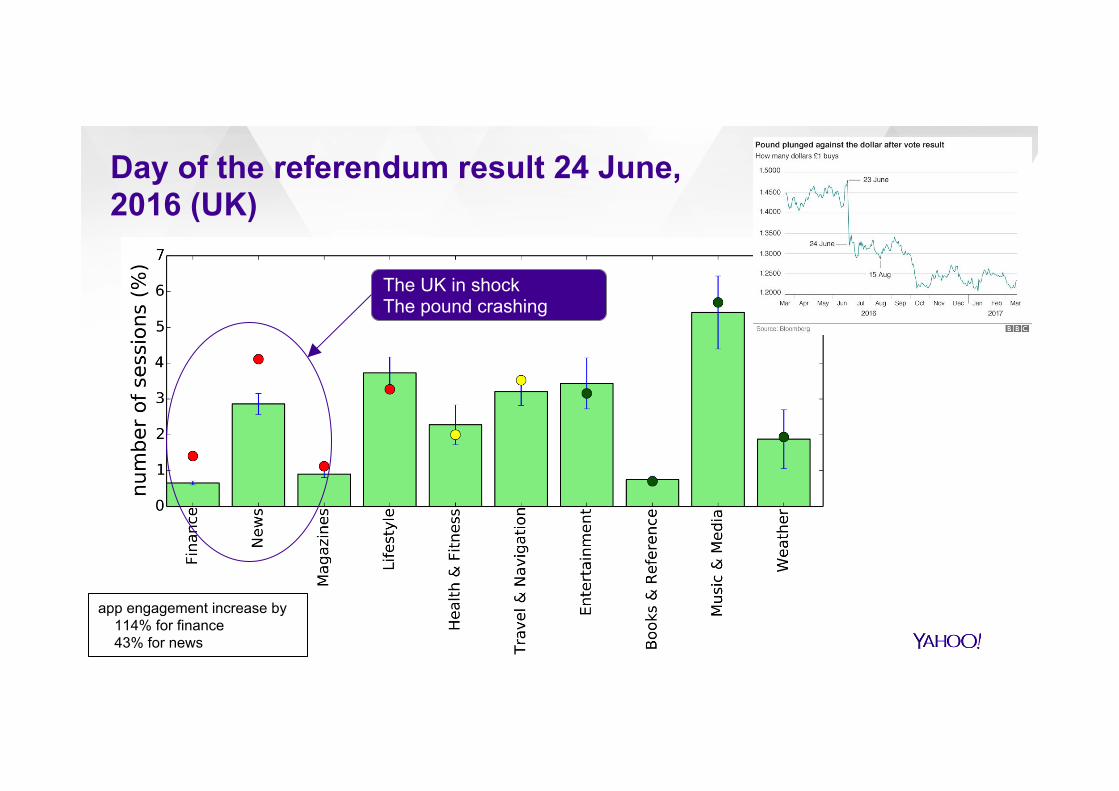
Day of the referendum result 24 June, 2016 (UK)
The UK in shock The pound crashing
app engagement increase by 114% for finance 43% for news

First week after the referendum result (UK)
The UK slowly calming down but still concerned?

Second week after the referendum result (UK)
The UK calming down further
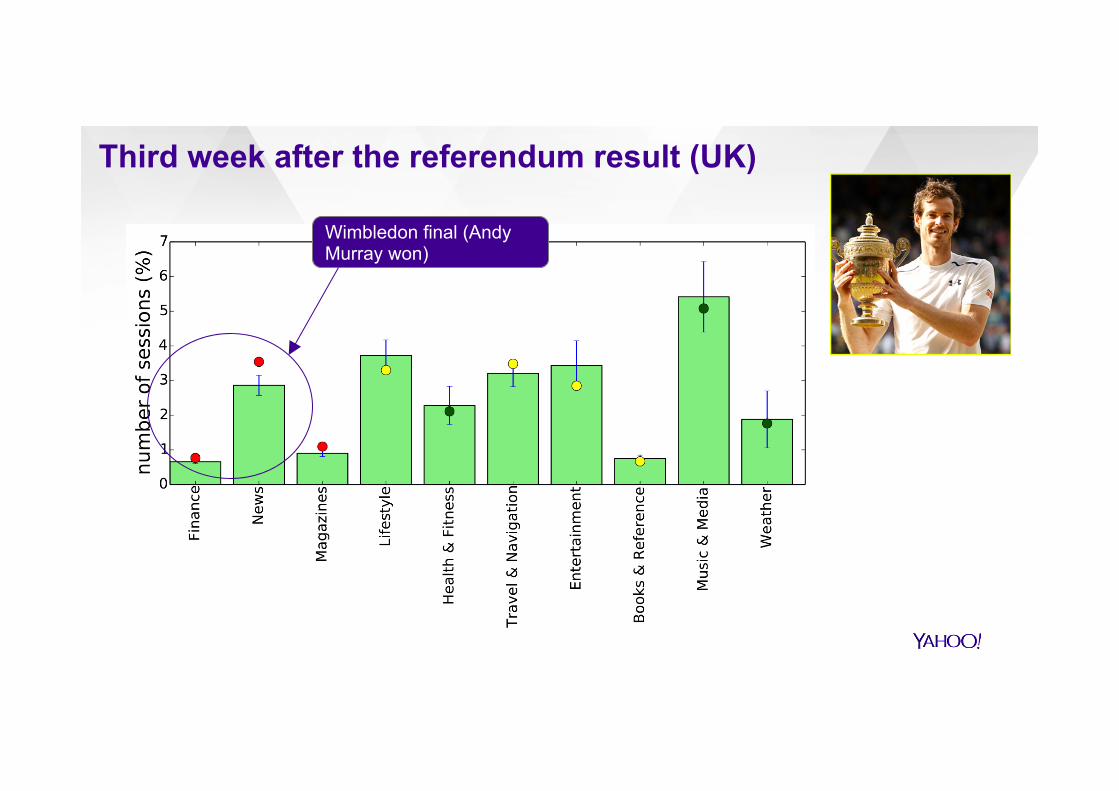
Third week after the referendum result (UK)
Wimbledon final (Andy Murray won)

Fourth week after the referendum (UK)
Took 4 weeks for UK to be back to normal?
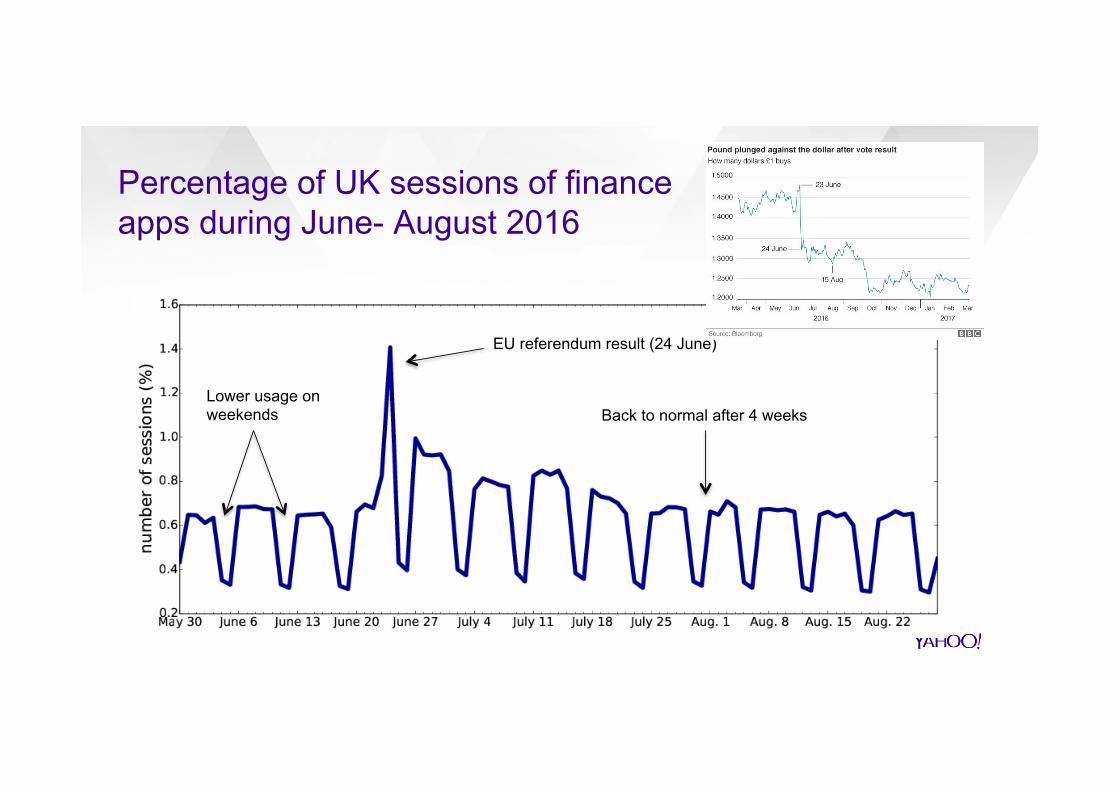
Percentage of UK sessions of finance apps during June- August 2016
Lower usage on weekends
EU referendum result (24 June)
Back to normal after 4 weeks
Case study 3: New year’s day
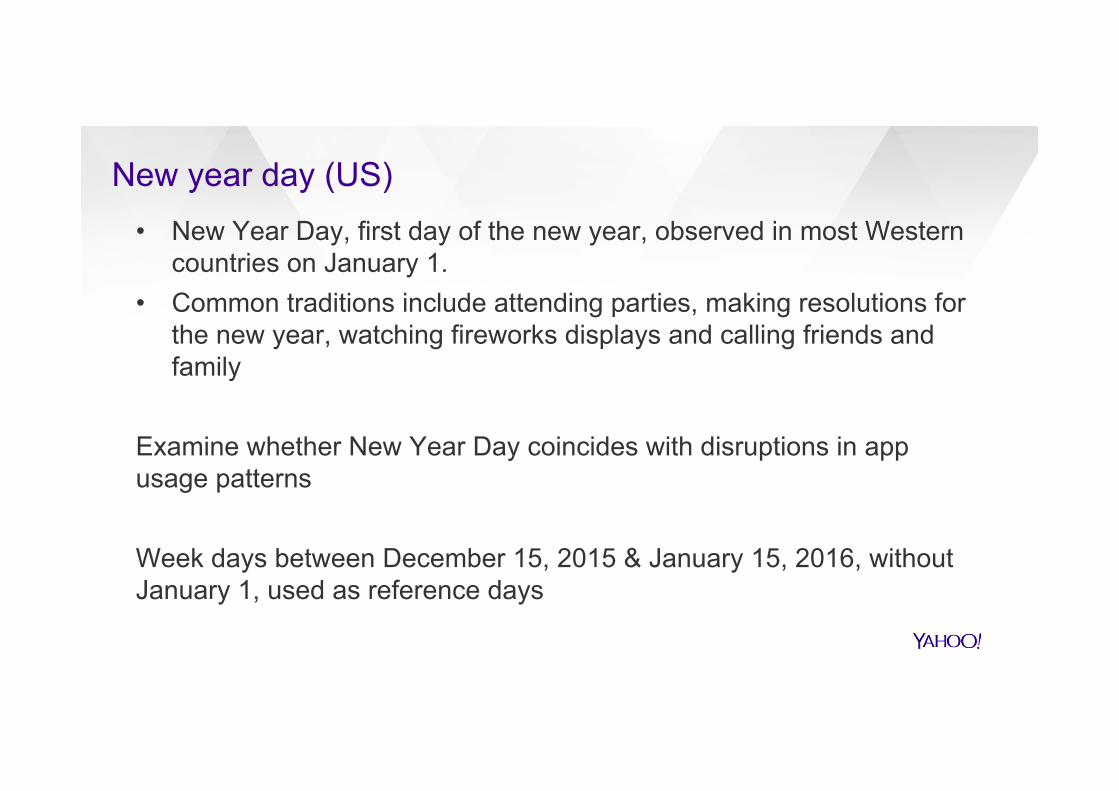
New year day (US) • New Year Day, first day of the new year, observed in most Western
countries on January 1. • Common traditions include attending parties, making resolutions for
the new year, watching fireworks displays and calling friends and family
Examine whether New Year Day coincides with disruptions in app usage patterns Week days between December 15, 2015 & January 15, 2016, without January 1, used as reference days
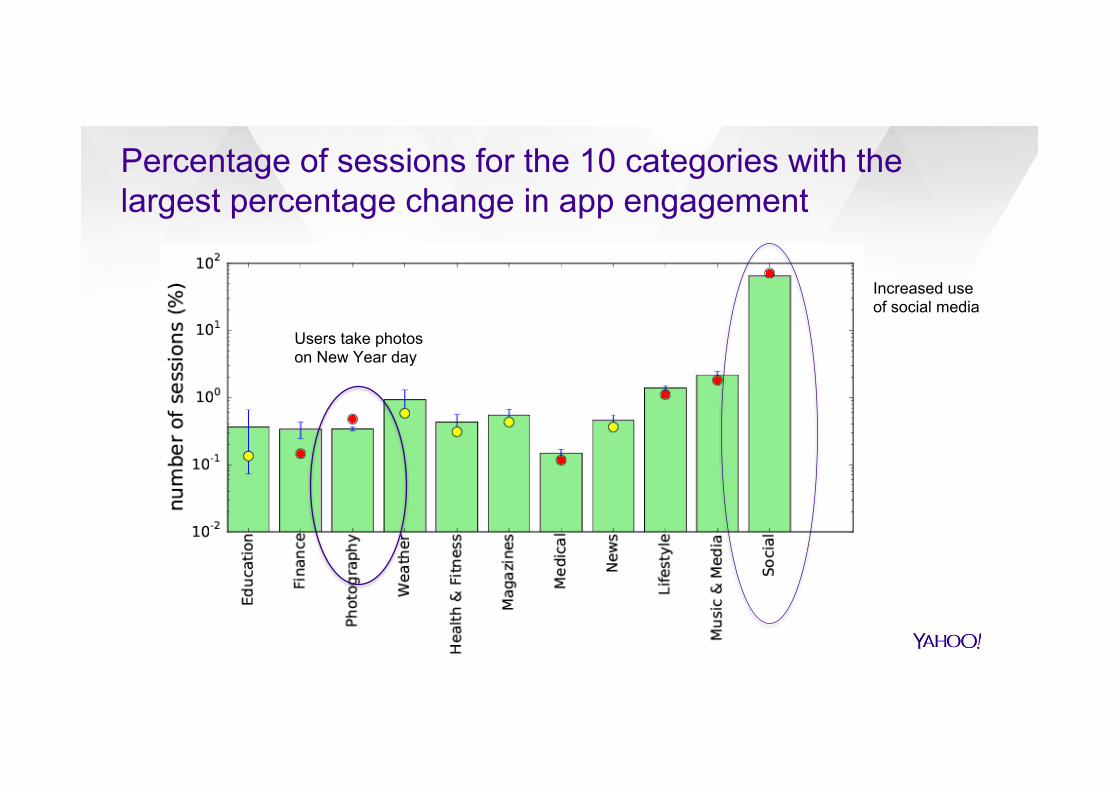
Percentage of sessions for the 10 categories with the largest percentage change in app engagement
Users take photos on New Year day
Increased use of social media
Conclusions and what next
Some final thoughts
§ We are able to detect disruption of app engagement patterns § A tool to judge people habit, mood, interest, concern, etc
What next § We want to look at country difference § Automatically detect events based on disruptions § Profile users based on disruptions § Study of “mobile addiction”
![Welcome []Title Technology Disruptions Author Oracle Corporation Subject Technology Disruptions Keywords Technolgy Disruptions, Mobile Internet Access, Public Cloud, Consumer Technology,](https://static.fdocuments.net/doc/165x107/5f6684cb020da61543073133/welcome-title-technology-disruptions-author-oracle-corporation-subject-technology.jpg)