Deriving the Pricing Power of Product Features by...
25
MANAGEMENT SCIENCE Vol. 57, No. 8, August 2011, pp. 1485–1509 issn 0025-1909 eissn 1526-5501 11 5708 1485 doi 10.1287/mnsc.1110.1370 © 2011 INFORMS Deriving the Pricing Power of Product Features by Mining Consumer Reviews Nikolay Archak, Anindya Ghose, Panagiotis G. Ipeirotis Leonard Stern School of Business, New York University, New York, New York 10012 {[email protected], [email protected], [email protected]} I ncreasingly, user-generated product reviews serve as a valuable source of information for customers making product choices online. The existing literature typically incorporates the impact of product reviews on sales based on numeric variables representing the valence and volume of reviews. In this paper, we posit that the information embedded in product reviews cannot be captured by a single scalar value. Rather, we argue that product reviews are multifaceted, and hence the textual content of product reviews is an important determinant of consumers’ choices, over and above the valence and volume of reviews. To demonstrate this, we use text mining to incorporate review text in a consumer choice model by decomposing textual reviews into segments describing different product features. We estimate our model based on a unique data set from Amazon contain- ing sales data and consumer review data for two different groups of products (digital cameras and camcorders) over a 15-month period. We alleviate the problems of data sparsity and of omitted variables by providing two experimental techniques: clustering rare textual opinions based on pointwise mutual information and using externally imposed review semantics. This paper demonstrates how textual data can be used to learn consumers’ relative preferences for different product features and also how text can be used for predictive modeling of future changes in sales. Key words : Bayesian learning; consumer reviews; discrete choice; electronic commerce; electronic markets; opinion mining; sentiment analysis; user-generated content; text mining; econometrics History : Received November 13, 2008; accepted February 23, 2011, by Ramayya Krishnan, information systems. Published online in Articles in Advance June 30, 2011. 1. Introduction The growing pervasiveness of the Internet has changed the way that consumers shop for goods. Whereas in a “brick-and-mortar” store visitors can usually test and evaluate products before making pur- chase decisions, in an online store their ability to directly assess product value is significantly more lim- ited. Online shoppers increasingly rely on alternative sources of information such as “word of mouth” in general, and user-generated product reviews in par- ticular. In fact, some researchers have established that user-generated product information on the Internet attracts more interest than vendor information among consumers (Bickart and Schindler 2001). In contrast to product descriptions provided by vendors, consumer reviews are, by construction, more user oriented. In a review, customers describe the product in terms of different usage scenarios and evaluate it from the user’s perspective (Chen and Xie 2008). Despite the subjectivity of consumer evaluations in the reviews, such evaluations are often considered more credi- ble and trustworthy by customers than traditional sources of information (Bickart and Schindler 2001). The hypothesis that product reviews affect product sales has received strong support in prior empirical studies (Godes and Mayzlin 2004, Duan et al. 2005, Chevalier and Mayzlin 2006, Liu 2006, Dellarocas et al. 2007, Forman et al. 2008, Ghose and Ipeirotis 2010, Ghose et al. 2011). However, these studies have only used the numeric review ratings (e.g., the num- ber of stars) and the volume of reviews in their empirical analysis, without formally incorporating the information contained in the text of the reviews. To the best of our knowledge, only a handful of empir- ical studies have formally tested whether the textual information embedded in online user-generated con- tent can have an economic impact. Ghose et al. (2007) estimate the impact of buyer textual feedback on price premiums charged by sellers in online second-hand markets. Eliashberg et al. (2007) combine natural- language-processing techniques and statistical learn- ing methods to forecast the return on investment for a movie, using shallow textual features from movie scripts. Netzer et al. (2011) combine text mining and semantic network analysis to understand the brand associative network and the implied market struc- ture. Decker and Trusov (2010) use text mining to estimate the relative effect of product attributes and brand names on the overall evaluation of the prod- ucts. But none of these studies focus on estimat- ing the impact of user-generated product reviews in influencing product sales beyond the effect of numeric 1485
-
Upload
nguyenkhanh -
Category
Documents
-
view
222 -
download
4
Transcript of Deriving the Pricing Power of Product Features by...
MANAGEMENT SCIENCEVol. 57, No. 8, August 2011, pp. 1485–1509issn 0025-1909 �eissn 1526-5501 �11 �5708 �1485 doi 10.1287/mnsc.1110.1370
© 2011 INFORMS
Deriving the Pricing Power of Product Features byMining Consumer Reviews
Nikolay Archak, Anindya Ghose, Panagiotis G. IpeirotisLeonard Stern School of Business, New York University, New York, New York 10012
{[email protected], [email protected], [email protected]}
Increasingly, user-generated product reviews serve as a valuable source of information for customers makingproduct choices online. The existing literature typically incorporates the impact of product reviews on sales
based on numeric variables representing the valence and volume of reviews. In this paper, we posit that theinformation embedded in product reviews cannot be captured by a single scalar value. Rather, we argue thatproduct reviews are multifaceted, and hence the textual content of product reviews is an important determinantof consumers’ choices, over and above the valence and volume of reviews. To demonstrate this, we use textmining to incorporate review text in a consumer choice model by decomposing textual reviews into segmentsdescribing different product features. We estimate our model based on a unique data set from Amazon contain-ing sales data and consumer review data for two different groups of products (digital cameras and camcorders)over a 15-month period. We alleviate the problems of data sparsity and of omitted variables by providing twoexperimental techniques: clustering rare textual opinions based on pointwise mutual information and usingexternally imposed review semantics. This paper demonstrates how textual data can be used to learn consumers’relative preferences for different product features and also how text can be used for predictive modeling offuture changes in sales.
Key words : Bayesian learning; consumer reviews; discrete choice; electronic commerce; electronic markets;opinion mining; sentiment analysis; user-generated content; text mining; econometrics
History : Received November 13, 2008; accepted February 23, 2011, by Ramayya Krishnan, informationsystems. Published online in Articles in Advance June 30, 2011.
1. IntroductionThe growing pervasiveness of the Internet haschanged the way that consumers shop for goods.Whereas in a “brick-and-mortar” store visitors canusually test and evaluate products before making pur-chase decisions, in an online store their ability todirectly assess product value is significantly more lim-ited. Online shoppers increasingly rely on alternativesources of information such as “word of mouth” ingeneral, and user-generated product reviews in par-ticular. In fact, some researchers have established thatuser-generated product information on the Internetattracts more interest than vendor information amongconsumers (Bickart and Schindler 2001). In contrast toproduct descriptions provided by vendors, consumerreviews are, by construction, more user oriented. Ina review, customers describe the product in termsof different usage scenarios and evaluate it from theuser’s perspective (Chen and Xie 2008). Despite thesubjectivity of consumer evaluations in the reviews,such evaluations are often considered more credi-ble and trustworthy by customers than traditionalsources of information (Bickart and Schindler 2001).
The hypothesis that product reviews affect productsales has received strong support in prior empiricalstudies (Godes and Mayzlin 2004, Duan et al. 2005,
Chevalier and Mayzlin 2006, Liu 2006, Dellarocaset al. 2007, Forman et al. 2008, Ghose and Ipeirotis2010, Ghose et al. 2011). However, these studies haveonly used the numeric review ratings (e.g., the num-ber of stars) and the volume of reviews in theirempirical analysis, without formally incorporating theinformation contained in the text of the reviews. Tothe best of our knowledge, only a handful of empir-ical studies have formally tested whether the textualinformation embedded in online user-generated con-tent can have an economic impact. Ghose et al. (2007)estimate the impact of buyer textual feedback on pricepremiums charged by sellers in online second-handmarkets. Eliashberg et al. (2007) combine natural-language-processing techniques and statistical learn-ing methods to forecast the return on investment fora movie, using shallow textual features from moviescripts. Netzer et al. (2011) combine text mining andsemantic network analysis to understand the brandassociative network and the implied market struc-ture. Decker and Trusov (2010) use text mining toestimate the relative effect of product attributes andbrand names on the overall evaluation of the prod-ucts. But none of these studies focus on estimat-ing the impact of user-generated product reviews ininfluencing product sales beyond the effect of numeric
1485

Archak, Ghose, and Ipeirotis: Deriving the Pricing Power of Product Features1486 Management Science 57(8), pp. 1485–1509, © 2011 INFORMS
review ratings, which is one of the key research objec-tives of this paper. The papers closest to this paper arethose by Ghose and Ipeirotis (2010) and Ghose et al.(2011), who explore multiple aspects of review text,such as lexical, grammatical, semantic, and stylisticlevels to identify important text-based features andstudy their impact on review helpfulness (Ghose andIpeirotis 2010) and product sales (Ghose and Ipeirotis2010, Ghose et al. 2011). However, they do not focuson examining the economic impact of different prod-uct attributes and opinions on product sales.
There is a potential issue with using only numericratings as being representative of the information con-tained in product reviews. By compressing a complexreview to a single number, we implicitly assume thatthe product quality is one-dimensional, whereas eco-nomic theory (see, for example, Rosen 1974) tells usthat products have multiple attributes and differentattributes can have different levels of importance toconsumers. Tastes for product attributes tend to varyacross individuals. Thus, unless the person reading areview has exactly the same preferences as the per-son who wrote the review, a single number, like anaverage product rating, might not be sufficient for thereader to extract all information relevant to the pur-chase decision.
Moreover, it has been shown that idiosyncratic pref-erences of early buyers can affect long-term consumerpurchase behavior and that rating can have a self-selection bias (Li and Hitt 2008). Consequently, Li andHitt (2008) suggest that consumer-generated productreviews may not be an unbiased indication of unob-served product quality. Furthermore, recent workhas shown that the distribution of an overwhelm-ing majority of reviews posted in online marketsis bimodal (Hu et al. 2008). In such situations, theaverage numerical star rating assigned to a productmay not convey a lot of information to a prospec-tive buyer. Instead, the reader has to read the actualreviews to examine which of the positive and whichof the negative attributes of a product are of interest.Furthermore, there may be extra information in thetext because of the discreteness problem: Reviews areallowed to be rated only as an integer from 1 to 5.However, some “4” reviews read like “3” reviews,whereas others read like “5” reviews. Therefore, oursecond research objective in this paper is to analyzethe extent to which product reviews can help us learnconsumer preferences for different product attributesand how consumers make trade-offs between differ-ent attributes.
The key challenge is in bridging the gap betweenthe essentially textual and qualitative nature ofreview content and the quantitative nature of discretechoice models. Any successful attempt to addressthis challenge necessitates an answer to the followingquestions.
1. How can we identify which product attributesare evaluated in a product review?
2. How can we extract opinions about the productattributes expressed in a product review?
3. How can we model the economic impact of theseextracted opinions?
With the rapid growth and popularity of user-generated content on the Web, a new area of researchapplying text-mining techniques to content analy-sis of product reviews has emerged. The first streamof this research has focused on sentiment analysisof product reviews. The earliest work in this areawas targeted primarily at evaluating the polarity ofa review. Reviews were classified as positive or neg-ative based on the occurrences of specific sentimentphrases (Das and Chen 2007, Hu and Liu 2004). Morerecent work has suggested that sentiment classifica-tion of consumer reviews is complicated, because con-sumers may provide a mixed review by praising someaspects of a product but criticizing other. This stimu-lated additional research on identifying product fea-tures in reviews (Hu and Liu 2004, Ghani et al. 2006).Automated extraction of product attributes has alsoreceived attention in the recent marketing literature.In particular, Lee and Bradlow (2007) present an auto-matic procedure for obtaining conjoint attributes andlevels through the analysis of Epinions reviews thatlist the explicit pros and cons of a product. Pang andLee (2008) offer an excellent and comprehensive sur-vey of the research in the field of sentiment analysis.
So, how does this paper contribute to priorresearch? Prior work in text mining does not reliablycapture the pragmatic meaning of the customer eval-uations; in particular, the existing approaches do notprovide quantitative evaluations of product features.In most cases, the evaluation of a product featureis done in a binary manner (positive or negative).It is also possible to use a counting scale to com-pute the number of positive and negative opinionsentences for a particular feature; opinion counts canlater be used for the feature-based comparison of twoproducts (Liu et al. 2005). Such a comparison tool isundoubtedly useful for consumers using an onlineshopping environment. Unfortunately, this techniqueignores the strength of the evaluations and does notdemonstrate the importance of the product feature inthe consumers’ choice process. Is “good battery life”more important for a digital camera than a “smallsize”? If so, then how important is it in influencing thepurchase decision? Although questions of this naturemight seem fuzzy, they can gain meaning if evalu-ated in the economic context surrounding consumerreviews and sales.
In sum, our paper aims to infer the economicimpact of user-generated product reviews by iden-tifying the weight that consumers put on individ-ual evaluations and product features, and estimating

Archak, Ghose, and Ipeirotis: Deriving the Pricing Power of Product FeaturesManagement Science 57(8), pp. 1485–1509, © 2011 INFORMS 1487
the overall impact of review text on sales. We do soby using both econometric and predictive modelingmethods. Our paper can be considered an extensionof the prior work of Chevalier and Mayzlin (2006) thatincorporates textual consumer opinions directly in areduced-form equation for product demand. A jus-tification of our empirical modeling approach basedon a theoretical model of multiattribute choice underuncertainty is described in this paper, with detailsgiven in the appendix. We compare estimation resultsfrom the inferred polarity model with a model inwhich the polarity is imposed ex ante from a pre-defined ontology. We alleviate the problems of datasparsity and of omitted variables by providing twoexperimental techniques: clustering rare textual opin-ions based on pointwise mutual information andusing externally imposed review semantics.
For estimation, we use a 15-month panel of productsales and reviews of digital cameras and camcordersretrieved from Amazon. To properly capture bothlongitudinal and cross-sectional properties of ourdata set, we apply generalized method of moments(GMM)-based dynamic panel data estimators. Weadditionally consider a purely predictive problem offorecasting product sales based on textual reviewcontents. Results demonstrate that our text-miningapproach delivers an explicit improvement in the out-of-sample forecasting performance.
The econometric modeling approach we adopt canbe compared to the hedonic regressions that are com-monly used in econometrics to identify the weightof individual features in determining the overallprice of a product. However, instead of studying therelationship between the fixed and objective productqualities and the product price, we study the relation-ship between beliefs about features that are either notdirectly measurable or are qualitative in nature andproduct demand.
Our approach also differs from classic discretechoice models, such as BLP (Berry et al. 1995). Simi-lar to the BLP model, we study substitution patterns.However, the nature of the patterns that we captureis somewhat different. In a typical discrete choicemodel, a consumer can switch from one product toanother product either when a new product is intro-duced in the market or when some attribute of anexisting product changes. Because most of the prod-uct attributes generally do not change after the intro-duction of the product, substitutions happen mostlybecause of new product introductions and variationin prices of the existing products. There is gener-ally no uncertainty about product qualities in stan-dard discrete choice models. To the contrary, we thinkof online consumers as having certain beliefs aboutfeatures of the products offered. As new productreviews appear, consumers read them and update
their beliefs about products. Thus, in our model, sub-stitution between products may occur when a newonline review is published.
Figure 1 shows a simplistic example of how areview may influence consumer’s beliefs about agiven product feature, in this case image quality. Theconsumer has an initial belief distribution about theproduct quality, taking values from 0 to 1, with amean value of 0.5. After reading a few reviews talkingabout the excellent, fantastic, and superb image quality,the belief distribution is updated and moves toward 1,having a mean value around 0.75. After reading a fewmore reviews, the belief is further updated, and so on.
Our paper touches a vast area of marketing researchon conjoint analysis (Green and Srinivasan 1978) andpreference measurement. The techniques presented inour paper and the statistical techniques used in con-joint analysis/preference measurement are targetedat determining how people value different featuresin a product or service. Where the approaches pri-marily differ is in the source of data used for anal-ysis. Perhaps the simplest approach to preferenceelicitation, known as the self-explicated method, orSEM (Srinivasan 1988), is based on data from directlysurveying consumers about their preferences for par-ticular product attributes. Alternatively, one can use asimple conjoint analysis technique, in which a smallset of attributes is used to create product profiles, andrespondents are asked to directly rate these profiles.Because this approach does not scale well with thenumber of attributes, hybrid conjoint analysis tech-niques (Marshall and Bradlow 2002, Frenkel et al.2002), the fast polyhedral method (Toubia et al. 2003),and the adaptive conjoint analysis (Johnson 1987)have been proposed in the literature.
A recent stream of research has focused on iden-tifying new sources of data, such as revealed pref-erence data, that can supplement stated preferencedata from the SEM and conjoint analysis. Prominentexamples include combining scanner-based data withsurvey data (Horsky et al. 2006), incorporating marketshare information in choice-based conjoint analy-sis (Gilbride et al. 2008), and using Web prod-uct reviews to automate construction of conjointattributes (Lee and Bradlow 2007). The paper byLee and Bradlow (2007) is particularly close toour research. In their paper, the authors presentan unsupervised text-mining technique to automati-cally identify attributes and attribute levels for con-joint analysis from the product review summariesposted on epinions.com. In contrast, in this paper, wepresent two alternative techniques for the attributeextraction: (i) a semisupervised extraction techniqueemploying the crowdsourcing platform (Mturk) and(ii) a fully automated ontology-driven extraction tech-nique. Potentially, both techniques can be applied in

Archak, Ghose, and Ipeirotis: Deriving the Pricing Power of Product Features1488 Management Science 57(8), pp. 1485–1509, © 2011 INFORMS
Figure 1 Example of Sequential Belief Updating from Consumer Reviews
1.0
“Excellent image quality”“Fantastic image quality”“Superb image quality”
“Great image quality”“Fantastic image quality”“Superb image quality”
0.80.60.4
Belief for image quality Updated belief forimage quality
0.20 1.00.80.60.40.20
Updated belief forimage quality
1.00.80.60.40.200
0.5
1.0
1.5
2.0
2.5
3.0
0
0.5
1.0
1.5
2.0
2.5
3.0
3.5
0
0.5
1.0
1.5
2.0
the same way as in Lee and Bradlow (2007), i.e.,by using the extracted attributes and attribute levelsas inputs to a conjoint analysis study. However, wetake an alternative approach and show that reason-able information on user preferences can be extractedpurely from contrasting temporal variation in aggre-gate sales data for a panel of consumer productswith the emergence of new product reviews on theretailer’s website.
To summarize, the main contribution of this paperis to show how textual information embedded inonline reviews can be incorporated in a simpledemand estimation model and to provide insightsfor using text-mining techniques in quantitative infor-mation systems, marketing, and economics research.Simultaneously, we aim to highlight the value ofusing an economic context to computer scientists toestimate both the intensity and the polarity of con-sumer opinions.
The rest of this paper is organized as follows. Sec-tion 2 presents our text-mining approach. Section 3describes how we incorporate textual information inthe empirical model of demand. We present a sim-ple theoretical model of multiattribute choice underuncertainty that leads to our empirical estimationframework. A discussion of the results is given in §4.In §5, we show that the textual content can improvethe power of purely predictive models of future salesand provide superior out-of-sample validation results.Finally, §6 concludes this paper with a discussion ofthe results, managerial implications, and directionsfor future research.
2. Econometric Modeling ofText Information
Prior research on consumer reviews and “word ofmouth” marketing has largely ignored the nonquan-titative nature of information contained in the con-sumer reviews. The economic analysis of textualdata is nontrivial and presents a number of chal-lenges. Consider, for example, our specific context:
Consumers read product reviews and receive signalsabout different product attributes. To apply the modelempirically, for each product review it is important tobe able to answer the following three questions.
1. Which product features are evaluated in theproduct review?
2. What evaluations are given to these attributes?3. What is the pragmatic and economic value of
these evaluations to the consumer? That is, how arethe evaluations taken into account by the consumerto adjust their beliefs about the given product?
In this section, we discuss the first two questionsand our proposed text-mining solution. We presenttwo alternative approaches for extracting the productfeatures (§2.1) and opinions about these features (§2.2)from the text of product reviews: a fully automatedapproach, based on natural-language processing, anda crowdsourcing approach, using Amazon Mechani-cal Turk.
2.1. Identifying Important Product FeaturesThe first step of our approach is to identify the prod-uct features that consumers describe in the reviewsand determine which of them are important for thedecision-making process of consumers. For the pur-pose of our study, it is not useful to follow prod-uct descriptions provided by manufacturers. This isbecause manufacturer-provided product descriptionsare static and often do not contain information aboutintangible product features, such as the quality ofproduct design, ease of use, robustness, and so on.Such intangible product features are hard to measureobjectively, yet they may be important determinantsof consumer buying decisions. Because we want totake consumer opinions explicitly into account, we donot exogenously specify the set of relevant productattributes. Instead, we rely on the contents of reviewsto identify product features that are most frequentlydiscussed by consumers.
2.1.1. Fully Automated Product Feature Identi-fication Algorithm. Many techniques for identify-ing product features mentioned in consumer reviews

Archak, Ghose, and Ipeirotis: Deriving the Pricing Power of Product FeaturesManagement Science 57(8), pp. 1485–1509, © 2011 INFORMS 1489
have been introduced in the last few years in text-mining research (Hu and Liu 2004, Ghani et al. 2006).One popular technique is to use a part-of-speech (POS)tagger to annotate each word in the review with itspart of speech and mark whether the word is a noun,an adjective, a verb, and so on. Nouns and nounphrases are usual candidates for product features,although other constructs (like verb phrases) are usedas well. Alternative techniques involve searching forstatistical patterns in the text, for example, words andphrases that appear frequently in the reviews. Hybridmethods combine both approaches, where a POS tag-ger is used as a preprocessing step before applyingan association-mining algorithm to discover frequentnouns and noun phrases.
Although it is generally acknowledged that themost frequently described features are nouns andnoun phrases, in reality, reviewers do use a widerange of language constructs to describe the products.For example, consider the following sentence from adigital camera review: “A little noisy in low light,for example on cloudy days, grass will lack sharp-ness and end up looking like a big mass of green.”This sentence gives an evaluation of the camera’s pic-ture quality even though the feature itself is neverexplicitly mentioned. Some techniques for discover-ing implicitly described product features have beendeveloped. For example, one can use a binary clas-sifier that determines whether a particular feature isdiscussed (implicitly) in the review or not (Ghaniet al. 2006).
For our purposes, we follow the paradigm of (Huand Liu 2004) and use a POS tagger to identify fre-quently mentioned nouns and noun phrases, whichwe consider to be candidate product features. UsingWordNet (Fellbaum 1998), we then cluster thesephrases into a set of similar nouns and noun phrases.In the final step, we examine the words that appear ina window of four words around the candidate nounphrase to extract the “context” in which a particularnoun appears. Based on the context, we further grouptogether the noun phrases that appear in similar con-texts, using a hierarchical agglomerative clusteringalgorithm (Manning and Schütze 1999). The result-ing set of clusters corresponds to the set of identifiedproduct features mentioned in the customer reviews.
Because of the inherent complexity of the naturallanguage, no text-mining technique so far has provedto be as efficient in feature extraction as humanscan be, especially when dealing with complex con-structs such as implicitly described product features.Because the precision and recall of our text-miningtechnique can directly affect the quality of the resultsextracted by our econometric analysis (§3), it is impor-tant to consider alternative semiautomated featureextraction methods. We describe this below in thenext subsection.
2.1.2. A Crowdsourcing-Based Technique forProduct Feature Identification. To extract productfeatures in a scalable, yet noise-free manner wedecided to rely on a “human-powered comput-ing” technique and used a semiautomated humanintelligence approach instead of a fully automatedapproach. In particular, we used the Amazon Mechani-cal Turk system to distribute feature extraction assign-ments to workers. Amazon Mechanical Turk is anonline marketplace, used to automate the execution ofmicrotasks that require human intervention (i.e., can-not be fully automated using data-mining tools). Taskrequesters post simple microtasks known as humanintelligence tasks (HITs) in the marketplace. Workersbrowse the posted microtasks and execute them for asmall monetary compensation. The marketplace pro-vides proper control over the task execution such asvalidation of the submitted answers or the ability toassign the same task to several different workers. Italso ensures proper randomization of assignments oftasks to workers within a single task type.
The obvious question is whether such crowdsourc-ing techniques can be used for reliable extraction ofinformation, given that it is difficult to check the qual-ity of work submitted by each individual worker. Thebasic idea is to get each review examined by multi-ple workers and let the workers extract, in free-textform, the product features described in the review. Iftwo workers extract the same product feature fromthe review, we consider the answer reliable. This ideahas been used in the past, with a high degree of suc-cess, in the ESP game by von Ahn and Dabbish (2004).The goal in the ESP game is to get multiple users totag images on the Web by letting them play a game:Two players, unknown to each other, see an imageand have to type the same word to proceed to thenext level. If they type the same word, they get pointsand proceed to the next image. The tagging resultswere of extremely high quality; the game is nowlicensed and used by Google (Google Image Labeler1).In the context of Mechanical Turk, Snow et al. (2008)review recent research efforts that use MechanicalTurk for annotation tasks and also evaluate the accu-racy of “Turkers” for a variety of natural-language-processing tasks. They conclude that the nonexpertusers of Mechanical Turk can generate results of com-parable quality to those generated by experts, espe-cially after gathering results for the same microtaskusing multiple Turkers. Sheng et al. (2008) describehow to effectively allocate tasks to multiple, noisylabelers (such as those on Mechanical Turk) to gener-ate results that are comparable to those obtained withnonnoisy data.
1 http://images.google.com/imagelabeler/.
Archak, Ghose, and Ipeirotis: Deriving the Pricing Power of Product Features1490 Management Science 57(8), pp. 1485–1509, © 2011 INFORMS
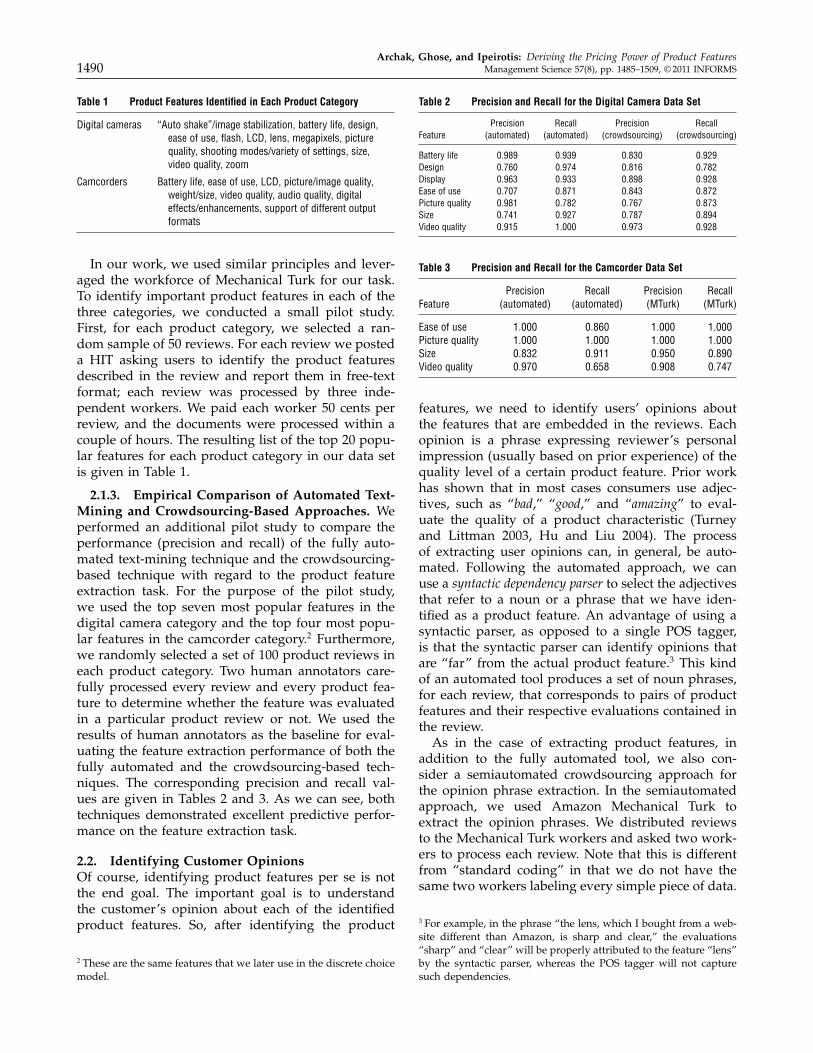
Table 1 Product Features Identified in Each Product Category
Digital cameras “Auto shake”/image stabilization, battery life, design,ease of use, flash, LCD, lens, megapixels, picturequality, shooting modes/variety of settings, size,video quality, zoom
Camcorders Battery life, ease of use, LCD, picture/image quality,weight/size, video quality, audio quality, digitaleffects/enhancements, support of different outputformats
In our work, we used similar principles and lever-aged the workforce of Mechanical Turk for our task.To identify important product features in each of thethree categories, we conducted a small pilot study.First, for each product category, we selected a ran-dom sample of 50 reviews. For each review we posteda HIT asking users to identify the product featuresdescribed in the review and report them in free-textformat; each review was processed by three inde-pendent workers. We paid each worker 50 cents perreview, and the documents were processed within acouple of hours. The resulting list of the top 20 popu-lar features for each product category in our data setis given in Table 1.
2.1.3. Empirical Comparison of Automated Text-Mining and Crowdsourcing-Based Approaches. Weperformed an additional pilot study to compare theperformance (precision and recall) of the fully auto-mated text-mining technique and the crowdsourcing-based technique with regard to the product featureextraction task. For the purpose of the pilot study,we used the top seven most popular features in thedigital camera category and the top four most popu-lar features in the camcorder category.2 Furthermore,we randomly selected a set of 100 product reviews ineach product category. Two human annotators care-fully processed every review and every product fea-ture to determine whether the feature was evaluatedin a particular product review or not. We used theresults of human annotators as the baseline for eval-uating the feature extraction performance of both thefully automated and the crowdsourcing-based tech-niques. The corresponding precision and recall val-ues are given in Tables 2 and 3. As we can see, bothtechniques demonstrated excellent predictive perfor-mance on the feature extraction task.
2.2. Identifying Customer OpinionsOf course, identifying product features per se is notthe end goal. The important goal is to understandthe customer’s opinion about each of the identifiedproduct features. So, after identifying the product
2 These are the same features that we later use in the discrete choicemodel.
Table 2 Precision and Recall for the Digital Camera Data Set
Precision Recall Precision RecallFeature (automated) (automated) (crowdsourcing) (crowdsourcing)
Battery life 00989 00939 00830 00929Design 00760 00974 00816 00782Display 00963 00933 00898 00928Ease of use 00707 00871 00843 00872Picture quality 00981 00782 00767 00873Size 00741 00927 00787 00894Video quality 00915 10000 00973 00928
Table 3 Precision and Recall for the Camcorder Data Set
Precision Recall Precision RecallFeature (automated) (automated) (MTurk) (MTurk)
Ease of use 10000 00860 10000 10000Picture quality 10000 10000 10000 10000Size 00832 00911 00950 00890Video quality 00970 00658 00908 00747
features, we need to identify users’ opinions aboutthe features that are embedded in the reviews. Eachopinion is a phrase expressing reviewer’s personalimpression (usually based on prior experience) of thequality level of a certain product feature. Prior workhas shown that in most cases consumers use adjec-tives, such as “bad,” “good,” and “amazing” to eval-uate the quality of a product characteristic (Turneyand Littman 2003, Hu and Liu 2004). The processof extracting user opinions can, in general, be auto-mated. Following the automated approach, we canuse a syntactic dependency parser to select the adjectivesthat refer to a noun or a phrase that we have iden-tified as a product feature. An advantage of using asyntactic parser, as opposed to a single POS tagger,is that the syntactic parser can identify opinions thatare “far” from the actual product feature.3 This kindof an automated tool produces a set of noun phrases,for each review, that corresponds to pairs of productfeatures and their respective evaluations contained inthe review.
As in the case of extracting product features, inaddition to the fully automated tool, we also con-sider a semiautomated crowdsourcing approach forthe opinion phrase extraction. In the semiautomatedapproach, we used Amazon Mechanical Turk toextract the opinion phrases. We distributed reviewsto the Mechanical Turk workers and asked two work-ers to process each review. Note that this is differentfrom “standard coding” in that we do not have thesame two workers labeling every simple piece of data.
3 For example, in the phrase “the lens, which I bought from a web-site different than Amazon, is sharp and clear,” the evaluations“sharp” and “clear” will be properly attributed to the feature “lens”by the syntactic parser, whereas the POS tagger will not capturesuch dependencies.

Archak, Ghose, and Ipeirotis: Deriving the Pricing Power of Product FeaturesManagement Science 57(8), pp. 1485–1509, © 2011 INFORMS 1491
Instead we have hundreds of workers processing thedata in parallel, and for quality assurance we requiretwo workers to look at each piece. Each assignmentcontained the review text for a single product and alist of product features identified in the previous step.Workers were responsible for reading the review thor-oughly and extracting opinion phrases evaluating anyfeature in the given list. The answers were returnedin free-text format, and the workers were asked notto change the wording used in the original review. Inour empirical study, interrater reliability was 34.27%,as measured by the Jaccard coefficient; that is, in morethan one-third of all cases, two workers processingthe same review reported exactly the same evaluationphrase for a particular product feature.4
3. Econometric AnalysisOur work is motivated by the seminal paperof Chevalier and Mayzlin (2006), who examinedthe dynamic effect of consumer product reviewson subsequent sales of books at Amazon.com andBarnesandnoble.com. Their estimation results showthat the marginal effect of a one-star increase in theaverage review rating of a book on Amazon (as com-pared to the same book on Barnesandnoble.com) isequal to approximately 0.2 unit decrease in the loga-rithm of the sales rank. We build on their approachand proceed to evaluate how much consumer opin-ions about the different attributes of the product con-tribute to changes in product sales. Toward this, weexamine “simple” hedonic products such as digitalcameras and camcorders, which can be representedby a small number of well-defined attributes.
3.1. DataWe gathered data on a set of products using publiclyavailable information at Amazon.com. The data setcovered two different product categories: “digitalcameras” (41 unique products) and “camcorders”(19 unique products). During a 15-month period(from March 2005 to May 2006), we collected dailyprice and sales rank information for the products inour data set using the programming interface pro-vided by Amazon Web Services. Each observation
4 Although this reliability score may be considered low for con-ventional surveys where participants report answers on numericLikert-type scales, this is a good agreement score for free-textmatching. Note that only for the “picture quality” feature did weidentify 1,424 different evaluation phrases in consumer reviews, 197of which were used more than once; it is significantly more diffi-cult for two readers to select exactly the same phrase than to selectthe same number on a scale from one to five. Notice that we werechecking for identical phrases to compute the inter-rater agreementand did not resort to substring or approximate matching. So thisimplies, for example, that “very good” and “very good!” will beconsidered nonidentical phrases.
contains the collection date, the product ID, the retailprice on Amazon, the sales rank of the product, theproduct release date, and the average product ratingaccording to the posted consumer reviews. Addition-ally, we used Amazon Web Services to collect the fullset of reviews for each product. Each product reviewhas a numerical rating on a scale of one to five stars,the date the review was posted, and the entire textposted by the reviewer.
Amazon.com does not publicly reveal informa-tion on actual product shares or total number ofunits sold for a particular product. Instead, Amazonreports a sales rank for each product, which canbe used as a proxy for demand based on priorresearch (Brynjolfsson et al. 2003, Chevalier andGoolsbee 2003, Ghose and Sundararajan 2006). Thesestudies have associated the sales ranks with demandlevels for products such as books, software, and elec-tronics. The association is based on the experimen-tally observed fact that the distribution of demand interms of sales rank has a Pareto distribution, i.e., apower law. Based on this observation, it is possible toconvert sales ranks into demand levels using the log-linear relationship ln4D5= a+ b · ln4S5, where D is theunobserved product demand, S is the observed salesrank, and a > 0, b < 0 are industry-specific parame-ters. However, for our purposes, such conversion isunnecessary; as long as one stays in the world of lin-ear models, the estimation can be performed directlyon sales ranks, and the marginal coefficients can beinterpreted in terms of changes in sales ranks.
3.2. Empirical ModelIn our data, we have a series of observations on salesand reviews for each product. Following Chevalierand Mayzlin (2006), we model the impact of prod-uct reviews on sales by directly incorporating productreview information in a linear equation for the salesrank. Our estimation equation is given by
log4sjt5 = dj +�ppjt +Xjt�xjt +Yjt�
yjt +Zjt�
zjt
+ � log4sjt−15+ �jt1 (1)
where sjt is the sales rank for product j at time t, djis the product-specific fixed effect, pjt is the price forproduct j at time t, Xjt is the vector of numeric reviewvariables, Yjt is the vector of textual review variables,and Zjt is the vector of control variables. Note that theright side of Equation (1) includes only review con-tent for products reviews that were published at leasta day before the current time t; that is, instead ofconsidering contemporaneous reviews, we considera one-period lagged effect of reviews. The intuitionbehind this specification is that updating sales statis-tics on the Amazon’s website takes some time, andhence the influence of “fresh” product reviews is

Archak, Ghose, and Ipeirotis: Deriving the Pricing Power of Product Features1492 Management Science 57(8), pp. 1485–1509, © 2011 INFORMS
unlikely to be captured by the current sales rank. InXjt we include all standard numeric summaries forthe set of product reviews: the average review rat-ing, the total number of reviews, the total length ofreviews, the fraction of one- and five-star reviews, andthe standard deviation of review ratings to accountfor possible valence of reviews.
3.3. Theoretical Motivation forEmpirical Estimation
Although Equation (1) is a direct extension of theapproach of Chevalier and Mayzlin (2006), it alsohas an alternative independent construction basedon a combination of two well-known theoreticalapproaches: multiattribute choice under uncertaintyand Bayesian learning. We build such a model to for-mally motivate our empirical analyses. Although thetheoretical model is not necessary to understand themethodologies and the results of this paper, throughthe description of the model, we hope to outlineclearly the scope and applicability of our research,explain what the implicit assumptions behind ourcurrent approach are, and identify directions forfuture research. This can enable future researchers inthis domain to adopt similar empirical approaches asours. The full derivation of the model is given in theappendix; a short summary follows.
Products can be represented by n-dimensionaltuples of attributes, and the quality of each attributeis uncertain to consumers. Consumers are expected-utility maximizers. We incorporate risk aversion byadopting negative exponential utility, a widely usedspecification (Roberts and Urban 1988, Bell and Raiffa1988). To reduce uncertainty, consumers read productreviews before choosing a product and use Bayesianlearning to update their beliefs about the quality ofproduct attributes. Beliefs are assumed to be nor-mally distributed, to be consistent with possibility ofa recursive learning process (Chen 1985). It can beshown (Roberts and Urban 1988) that normal pri-ors in combination with negative exponential util-ity give a particularly simple analytic representa-tion for the expected utility function. The consumers’choices will be monotone with respect to the so-called“risk-adjusted preference function,” which incorpo-rates the linear component of the consumers’ util-ity function evaluated at the mean of the currentconsumers’ beliefs about the particular product qual-ity and the additional risk-aversion component rep-resenting the cost of uncertainty about the productattributes. Our final result is obtained by connectingthe “risk-adjusted preference function” directly to themarket share for a particular product using Lemma 1.
In the scope of Equation (1), we can interpret vec-tor Yjt as representing the current mean of consumers’beliefs about the product quality. As new reviews are
published, the change in Yjt represents the shift inconsumers’ beliefs, whereas the change in Yjt�
yjt repre-
sents the corresponding direct effect of these changeson the product sales. The change in the risk-aversioncomponent is controlled for by including additionalvariables in the regression such as the fraction of one-and five-star reviews and the standard deviation ofreview ratings.
3.4. Incorporating Textual InformationEvery component in vector Yjt represents a single pos-sible opinion phrase, i.e., a combination of an evalu-ation e (for example, “good,” “bad,” “excellent”) anda product feature f (“zoom,” “size,” “weight”). In thefollowing discussion, we use F to represent the setof all interesting product features and E to representthe set of all interesting evaluations. Then the dimen-sion of vector Yjt will be equal to �F� × �E�. We useYjt4f 1 e5 to represent a component corresponding tothe pair of feature f and evaluation e, and Score4f 1 e5to represent the corresponding slope in �
yzt (the inter-
pretation is that this value is a “score” that consumersassign to this particular opinion phrase). We can nowwrite Equation (1) as
log4sjt5 = dj +�ppjt +Xjt�xjt +
∑
f∈F
∑
e∈E
Yjt4f 1 e5Score4f 1 e5
+Zjt�zjt + � log4sjt−15+ �jt0 (2)
Equation (2) has an interesting and novel interpre-tation. Note that traditional consumer-review-miningapproaches consider extracted product features andopinions as simple sets and impose no algebraic struc-ture on them. We propose that we can meaningfullydefine a vector space structure for consumer reviews.Each opinion phrase (for example, “great synchro-nization with PC”) will represent a single dimen-sion of a consumer review. Furthermore, we pro-pose measuring the value of each dimension as thenumber of times the corresponding opinion phraseoccurred in the review text, normalized by the num-ber of times the corresponding feature was evalu-ated in the review text. A theoretical justification forsuch weighting scheme based on a simple model ofBayesian learning by consumers with normal priorscan be found in the appendix. The proposed weight-ing scheme is
Yjt4f 1 e5=N4f 1 e5
s +∑
e∈EN4f 1 e50 (3)
This idea can be illustrated with a simple example.
Example 1. Consider the following review for adigital camera: “The camera is of high qualityand relatively easy to use. The lens is fantastic.Bright and clear! I have been able to use the LCD

Archak, Ghose, and Ipeirotis: Deriving the Pricing Power of Product FeaturesManagement Science 57(8), pp. 1485–1509, © 2011 INFORMS 1493
viewfinder 0 0 0 0 To summarize, this is a very highquality product.” This review can be represented byelements of the consumer review space with thefollowing weights (assume s = 0 for this example):Yjt4quality1high5 = 1/1 = 100, Yjt4use1 easy5 = 1/1 = 100,Yjt4lens1 fantastic5 = 1/3 = 0033, Yjt4lens1bright5 = 1/3 =
00333, Yjt4lens1 clear5 = 1/3 = 00333. Notice that eachopinion phrase dimension has a weight coefficientdetermining its relative importance in the review.Because the feature quality is evaluated once in thereview (“high quality”), the weight of the evaluationis 1.0. In contrast, the feature lens has three evalua-tions (fantastic, bright, clear); therefore the weight ofeach evaluation is 1/3.
If we employ this particular representation of con-sumer reviews, the impact of the product reviews onthe market share of that product can be modeled sim-ply as a linear functional from the space of consumerreviews.
3.5. IdentificationThe typical source of endogeneity in demand mod-els is unobservable exogenous shocks that simulta-neously affect prices set by firms as well as buyingdecisions made by consumers. In addition, therecould be some external factors that influence bothconsumer reviews and product demand, such asadvertising or publicity. Thus, using ordinary leastsquares estimation, we will likely overestimate thedirect effect of consumer reviews on product demand.To alleviate this concern, we use data on the “prod-uct search volume” of different products from GoogleTrends to control for exogenous demand shocks. Foreach product, we retrieved the search volume fromthe Google Trends website. Because the search vol-ume for the brand can be correlated with the prod-uct sales, we include it as a control variable inthe model. The use of search volume from GoogleTrends as a measure of product publicity acts assuitable control for any unobserved factor drivingboth sales and word of mouth; it is consistent withthe approach of Luan and Neslin (2009), who showthat publicity has a significant impact when mappingthe relationship between sales and word of mouth.Additionally, we follow Villas-Boas and Winer (1999)and use lagged product prices as instruments. Thelagged price may not be an ideal instrument becauseits possible to have common demand shocks that arecorrelated over time and affect prices set by produc-ers. Nevertheless, common demand shocks that arecorrelated through time are essentially trends. Ourcontrol for trends using Google search volume datathus should alleviate most, if not all, such concerns.
Furthermore, our data set represents a longitudi-nal panel in which a number of products have beenobserved for more than a year. Hence, we need to
control for different time-series-specific effects suchas autocorrelation in the sales rank. Toward this,we include a lag of the dependent variable in themodel and apply the system GMM (Hansen 1982)estimator for dynamic panel data models developedby Arellano and Bover (1995). The system GMM esti-mator uses the original estimation equation to obtaina system of two equations: one in differences and onein levels. The system GMM estimator has been shownby Blundell and Bond (1998) to have much betterfinite-sample properties than that of the original dif-ference GMM estimator.5 We apply the finite-samplecorrection proposed by Windmeijer (2005), which cor-rects for the two-step covariance matrix and increasesthe efficiency of the GMM estimator. We were carefulto take into account the problem of using too manylags as instruments (Roodman 2006).
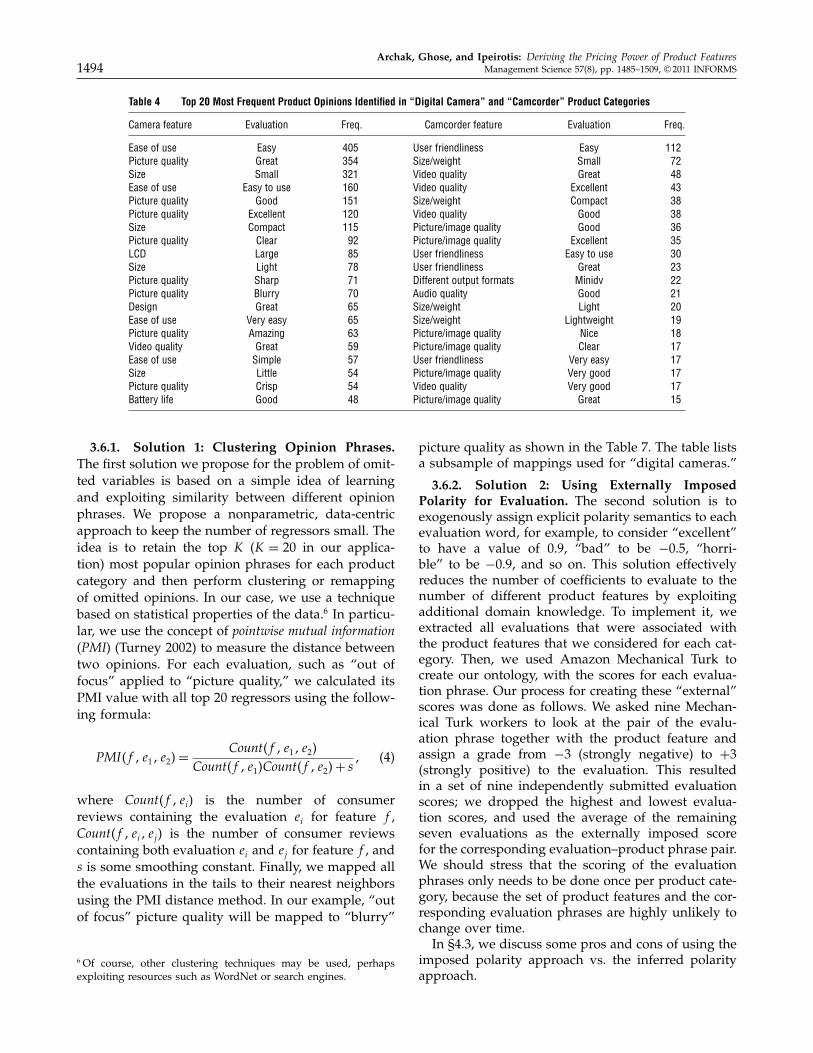
3.6. Dealing with “Curse of Dimensionality”Because the set of different opinion phrases extractedfrom online user-generated content is typically verylarge, it is infeasible to include all these variablesin any statistical model. One has to restrict con-sideration to only the top K most popular opinionphrases in each product category, for some relativelysmall K. Unfortunately, this also means that, after themodel estimation, we might get coefficients that alsoinclude the projection of some omitted variables. That isparticularly problematic, because many of the omit-ted variables are negative, whereas many frequentphrases are generally positive (see Table 4). This hap-pens because consumers tend to use standard opin-ion phrases to describe their positive impressions butuse longer and comparatively far less standardizedsentences to describe their negative experiences. Forexample, for digital camera products, highly posi-tive evaluations of the “picture quality” feature mightfrequently co-occur with negative evaluations of thecamera size in consumer reviews (like a person say-ing “this camera has great picture quality but its toobig and heavy”). Including the “great picture quality”opinion but excluding the “big and heavy” opinionfrom the model will likely bias downward our esti-mates of consumer value for “great picture quality.”
5 Arellano and Bond (1991) developed a GMM estimator that treatsthe model as a system of equations, one for each time period. Theequations differ only in their instrument/moment condition sets.The key idea is that if the error terms are serially uncorrelated, thenthe lagged values of the dependent variable and the exogeneousvariables represent valid instruments. The resulting estimator isknown as the difference GMM (DGMM). A potential difficulty withthe DGMM estimator is that lagged levels may not be good instru-ments for first differences when the underlying variables are highlypersistent over time.
Archak, Ghose, and Ipeirotis: Deriving the Pricing Power of Product Features1494 Management Science 57(8), pp. 1485–1509, © 2011 INFORMS
Table 4 Top 20 Most Frequent Product Opinions Identified in “Digital Camera” and “Camcorder” Product Categories
Camera feature Evaluation Freq. Camcorder feature Evaluation Freq.
Ease of use Easy 405 User friendliness Easy 112Picture quality Great 354 Size/weight Small 72Size Small 321 Video quality Great 48Ease of use Easy to use 160 Video quality Excellent 43Picture quality Good 151 Size/weight Compact 38Picture quality Excellent 120 Video quality Good 38Size Compact 115 Picture/image quality Good 36Picture quality Clear 92 Picture/image quality Excellent 35LCD Large 85 User friendliness Easy to use 30Size Light 78 User friendliness Great 23Picture quality Sharp 71 Different output formats Minidv 22Picture quality Blurry 70 Audio quality Good 21Design Great 65 Size/weight Light 20Ease of use Very easy 65 Size/weight Lightweight 19Picture quality Amazing 63 Picture/image quality Nice 18Video quality Great 59 Picture/image quality Clear 17Ease of use Simple 57 User friendliness Very easy 17Size Little 54 Picture/image quality Very good 17Picture quality Crisp 54 Video quality Very good 17Battery life Good 48 Picture/image quality Great 15
3.6.1. Solution 1: Clustering Opinion Phrases.The first solution we propose for the problem of omit-ted variables is based on a simple idea of learningand exploiting similarity between different opinionphrases. We propose a nonparametric, data-centricapproach to keep the number of regressors small. Theidea is to retain the top K (K = 20 in our applica-tion) most popular opinion phrases for each productcategory and then perform clustering or remappingof omitted opinions. In our case, we use a techniquebased on statistical properties of the data.6 In particu-lar, we use the concept of pointwise mutual information(PMI) (Turney 2002) to measure the distance betweentwo opinions. For each evaluation, such as “out offocus” applied to “picture quality,” we calculated itsPMI value with all top 20 regressors using the follow-ing formula:
PMI4f 1 e11 e25=Count4f 1 e11 e25
Count4f 1 e15Count4f 1 e25+ s1 (4)
where Count4f 1 ei5 is the number of consumerreviews containing the evaluation ei for feature f ,Count4f 1 ei1 ej5 is the number of consumer reviewscontaining both evaluation ei and ej for feature f , ands is some smoothing constant. Finally, we mapped allthe evaluations in the tails to their nearest neighborsusing the PMI distance method. In our example, “outof focus” picture quality will be mapped to “blurry”
6 Of course, other clustering techniques may be used, perhapsexploiting resources such as WordNet or search engines.
picture quality as shown in the Table 7. The table listsa subsample of mappings used for “digital cameras.”
3.6.2. Solution 2: Using Externally ImposedPolarity for Evaluation. The second solution is toexogenously assign explicit polarity semantics to eachevaluation word, for example, to consider “excellent”to have a value of 0.9, “bad” to be −0.5, “horri-ble” to be −0.9, and so on. This solution effectivelyreduces the number of coefficients to evaluate to thenumber of different product features by exploitingadditional domain knowledge. To implement it, weextracted all evaluations that were associated withthe product features that we considered for each cat-egory. Then, we used Amazon Mechanical Turk tocreate our ontology, with the scores for each evalua-tion phrase. Our process for creating these “external”scores was done as follows. We asked nine Mechan-ical Turk workers to look at the pair of the evalu-ation phrase together with the product feature andassign a grade from −3 (strongly negative) to +3(strongly positive) to the evaluation. This resultedin a set of nine independently submitted evaluationscores; we dropped the highest and lowest evalua-tion scores, and used the average of the remainingseven evaluations as the externally imposed scorefor the corresponding evaluation–product phrase pair.We should stress that the scoring of the evaluationphrases only needs to be done once per product cate-gory, because the set of product features and the cor-responding evaluation phrases are highly unlikely tochange over time.
In §4.3, we discuss some pros and cons of using theimposed polarity approach vs. the inferred polarityapproach.

Archak, Ghose, and Ipeirotis: Deriving the Pricing Power of Product FeaturesManagement Science 57(8), pp. 1485–1509, © 2011 INFORMS 1495
Table 5 Descriptive statistics for Digital Cameras
Variable Obs. Mean Std. dev. Min Max
log(sales rank) 111897 5038 1077 0 10079log(price) 111897 5070 00657 30434 703139Rating 111897 3026 10798 1 5Trend 111897 4026 00281 2089 40846log(numreviews) 111897 3037 1009 0 4093Product age 111897 204031 114009 1 423LCD, large 111897 30662 401562 0 19LCD, large 2 111897 300678 530416 0 361Battery life, good 111897 10094 10836 0 10Battery life, good 2 111897 40566 1301679 0 100Design, great 111897 10181 1067 0 7Design, great 2 111897 40188 7061 0 49Ease of use, easy 111897 70576 70819 0 36Ease of use, easy to use 111897 20852 30342 0 20Ease of use, easy to use 2 111897 190297 430615 0 400Ease of use, easy 2 111897 1180503 1990276 0 11296Ease of use, simple 111897 10177 10743 0 10Ease of use, simple 2 111897 40423 110603 0 100Ease of use, very easy 111897 20012 302546 0 20Ease of use, very easy 2 111897 140635 4708091 0 400Picture quality, amazing 111897 20073 206145 0 10Picture quality, amazing2 111897 110129 1907314 0 100Picture quality, blurry 111897 20093 302692 0 18Picture quality, blurry 2 111897 15006525 4104147 0 324Picture quality, clear 111897 50173 60019 0 23Picture quality, clear 2 111897 620977 1120311 0 529Picture quality, crisp 111897 20341 30212 0 12Picture quality, crisp2 111897 150798 310604 0 144Picture quality, excellent 111897 3015 3032 0 15Picture quality, excellent 2 111897 210021 340075 0 225Picture quality, good 111897 20759 30647 0 19Picture quality, good 2 111897 20091 530001 0 361Picture quality, great 111897 8015 90426 0 39Picture quality, great 2 111897 1550364 2840025 0 11521Picture quality, sharp 111897 20899 208411 0 14Picture quality, sharp2 111897 160472 240655 0 196Picture quality, very good 111897 10454 2068 0 10Picture quality, very good 2 111897 9029 240299 0 100Size, compact 111897 5041 50668 0 23Size, compact 2 111897 61040 990727 0 529Size, light 111897 30225 4022 0 16Size, light 2 111897 280203 540221 0 256Size, small 111897 7084 8028 0 33Size, small 2 111897 13000022 182054 0 11089Video quality, great 111897 1047 205345 0 10Video quality, great 2 111897 8058 19060 0 100
4. ResultsIn this section, we discuss the estimation results foreach product category. We start by discussing resultsfrom the model with inferred polarity and then pro-ceed to discuss results from the model with exoge-nously imposed polarity.
4.1. Inferred Polarity ModelBecause of the limited size of our sample, we usedonly the top 20 most popular opinion phrases for the“digital camera” category and the top 10 most pop-ular opinion phrases for the “camcorder” category.The rest of opinion phrases were mapped into oneof the top opinions based on the clustering algorithm
described in §3.6. Results are given in Tables 9, 10,and 11.
The first column of each of these tables reportsresults of a GMM estimation without textual data.7
Following Villas-Boas and Winer (1999), we usedlagged prices to instrument for potential price endo-geneity. The second column reports estimates fromthe same model but including textual data. The third
7 We have also estimated a simple IV (two-stage least squares)model with similar set of instruments. Because the results are qual-itatively very similar to our current results, we only present resultsfrom the more efficient GMM estimator.

Archak, Ghose, and Ipeirotis: Deriving the Pricing Power of Product Features1496 Management Science 57(8), pp. 1485–1509, © 2011 INFORMS
Table 6 Descriptive Statistics for Camcorders
Variable Obs. Mean Std. dev. Min Max
log(sales rank) 61786 5094 1025 1061 9047log(price) 61786 5094 0088 30044 70004Rating 61786 20543 10868 1 5Trend 61786 40454 00171 30618 40859log(numreviews) 61786 20252 00976 0 40331Product age 61786 195085 1150557 1 420Picture/image quality, excellent 61786 10066 10573 0 6Picture/image quality, excellent 2 61786 3061 7097 0 36Picture/image quality, good 61786 10846 20829 0 11Picture/image quality, good 2 61786 110405 290515 0 121Picture/image quality, great 61786 10510 20464 0 14Picture/image quality, great 2 61786 80347 2604101 0 196Size/weight, compact 61786 20142 302608 0 12Size/weight, compact 2 61786 150211 35087 0 144Size/weight, small 61786 30515 3091 0 16Size/weight, small 2 61786 270628 470889 0 256User friendliness, ease of use, easy 61786 40561 60068 0 22User friendliness, ease of use, easy to use 61786 10090802 102737 0 4User friendliness, ease of use, easy to use 2 61786 2081 40346 0 16User friendliness, ease of use, easy 2 61786 570592 121084 0 484Video quality, excellent 61786 1035 20071 0 9Video quality, excellent 2 61786 6011 16077 0 81Video quality, good 61786 10784 20552 0 9Video quality, good 2 61786 90689 210398 0 81Video quality, great 61786 10738 20251 0 12Video quality, great 2 61786 80084 210131 0 144
column adds a lag of the dependent variable to con-trol for autocorrelation in the sales rank and appliesthe Arellano and Bover (1995) estimator. The last col-umn consists of estimates from a robustness check inwhich we aggregate observations on a weekly basisto ensure that using daily units does not result ina significant downward bias of the standard errorsbecause of potential within-group autocorrelation indaily regression residuals (Moulton 1986).
Table 7 Some Mappings Produced by PMI Based Clustering in the “Digital Cameras” Category
From feature From evaluation To feature To evaluation PMI (∗Const)
Picture quality Dark Picture quality Blurry 43025259516Ease of use Very easy to use Ease of use Very easy 4102371134Battery life Very good Battery life Good 31091489362Picture quality Very clear Picture quality Clear 3006122449Picture quality Vivid Picture quality Sharp 29012621359Picture quality Grainy Picture quality Blurry 25095155709Picture quality Vibrant Picture quality Crisp 22098850575Picture quality Bright Picture quality Clear 21078649237Picture quality Fuzzy Picture quality Blurry 18033740831Picture quality Detailed Picture quality Clear 18011594203LCD Bright LCD Large 17094974073Video quality Fantastic Video quality Great 16039344262Picture quality Fabulous Picture quality Clear 16033986928Size Good Size Light 16028664495Picture quality Out of focus Picture quality Blurry 15097444089Design Perfect Design Great 15097444089Picture quality Blurred Picture quality blurry 15059251559Ease of use Great Ease of use Simple 15041623844
GMM estimators for dynamic panel data modelssuch as the Arellano and Bover (1995) estimator withdefault settings will use, for each time period, allavailable lags of the specified variables as instru-ments, thus generating moment conditions prolifically(Roodman 2006). To avoid model overidentification,we have restricted the number of lags to two. TheSargan (1958) test of the moment conditions does notindicate overidentification (“digital camera” data set,
Archak, Ghose, and Ipeirotis: Deriving the Pricing Power of Product FeaturesManagement Science 57(8), pp. 1485–1509, © 2011 INFORMS 1497
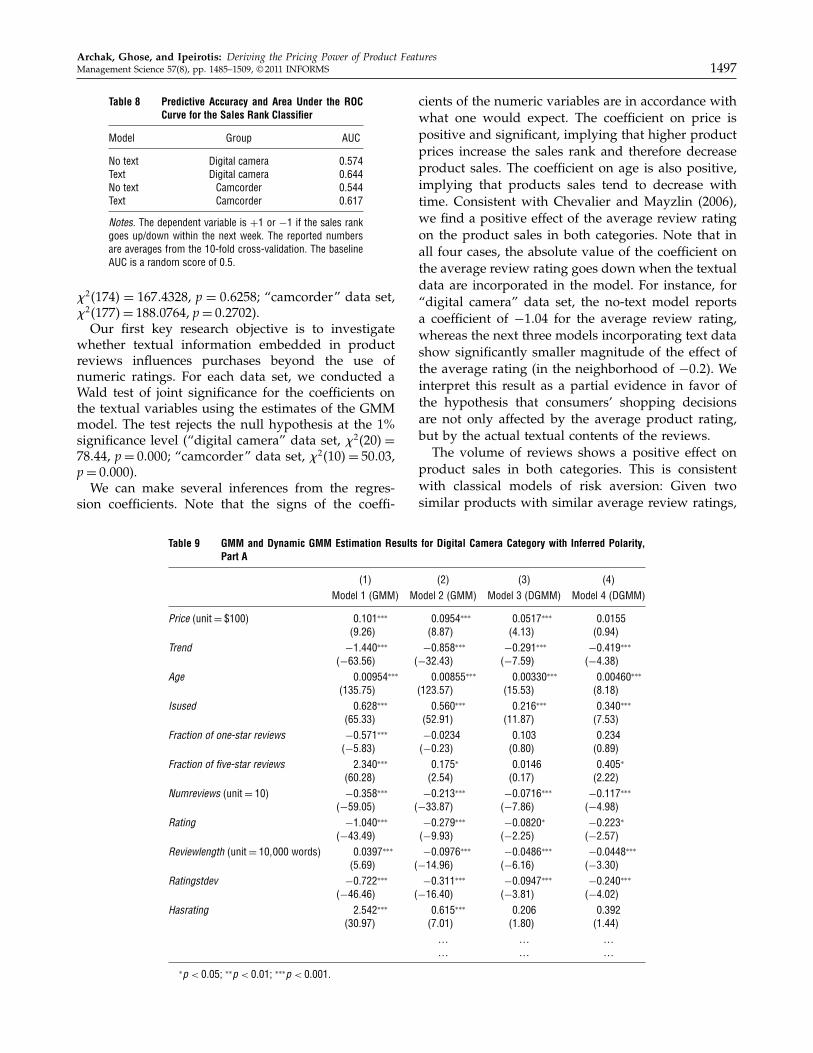
Table 8 Predictive Accuracy and Area Under the ROCCurve for the Sales Rank Classifier
Model Group AUC
No text Digital camera 00574Text Digital camera 00644No text Camcorder 00544Text Camcorder 00617
Notes. The dependent variable is +1 or −1 if the sales rankgoes up/down within the next week. The reported numbersare averages from the 10-fold cross-validation. The baselineAUC is a random score of 0.5.
�241745 = 16704328, p = 006258; “camcorder” data set,�241775= 18800764, p = 002702).
Our first key research objective is to investigatewhether textual information embedded in productreviews influences purchases beyond the use ofnumeric ratings. For each data set, we conducted aWald test of joint significance for the coefficients onthe textual variables using the estimates of the GMMmodel. The test rejects the null hypothesis at the 1%significance level (“digital camera” data set, �24205 =
78044, p = 00000; “camcorder” data set, �24105= 50003,p = 00000).
We can make several inferences from the regres-sion coefficients. Note that the signs of the coeffi-
Table 9 GMM and Dynamic GMM Estimation Results for Digital Camera Category with Inferred Polarity,Part A
(1) (2) (3) (4)Model 1 (GMM) Model 2 (GMM) Model 3 (DGMM) Model 4 (DGMM)
Price (unit = $100) 00101∗∗∗ 000954∗∗∗ 000517∗∗∗ 000155490265 480875 440135 400945
Trend −10440∗∗∗ −00858∗∗∗ −00291∗∗∗ −00419∗∗∗
4−630565 4−320435 4−70595 4−40385Age 0000954∗∗∗ 0000855∗∗∗ 0000330∗∗∗ 0000460∗∗∗
41350755 41230575 4150535 480185Isused 00628∗∗∗ 00560∗∗∗ 00216∗∗∗ 00340∗∗∗
4650335 4520915 4110875 470535Fraction of one-star reviews −00571∗∗∗ −000234 00103 00234
4−50835 4−00235 400805 400895Fraction of five-star reviews 20340∗∗∗ 00175∗ 000146 00405∗
4600285 420545 400175 420225Numreviews (unit = 10) −00358∗∗∗ −00213∗∗∗ −000716∗∗∗ −00117∗∗∗
4−590055 4−330875 4−70865 4−40985Rating −10040∗∗∗ −00279∗∗∗ −000820∗ −00223∗
4−430495 4−90935 4−20255 4−20575Reviewlength (unit = 101000 words) 000397∗∗∗ −000976∗∗∗ −000486∗∗∗ −000448∗∗∗
450695 4−140965 4−60165 4−30305Ratingstdev −00722∗∗∗ −00311∗∗∗ −000947∗∗∗ −00240∗∗∗
4−460465 4−160405 4−30815 4−40025Hasrating 20542∗∗∗ 00615∗∗∗ 00206 00392
4300975 470015 410805 410445… … …… … …
∗p < 0005; ∗∗p < 0001; ∗∗∗p < 00001.
cients of the numeric variables are in accordance withwhat one would expect. The coefficient on price ispositive and significant, implying that higher productprices increase the sales rank and therefore decreaseproduct sales. The coefficient on age is also positive,implying that products sales tend to decrease withtime. Consistent with Chevalier and Mayzlin (2006),we find a positive effect of the average review ratingon the product sales in both categories. Note that inall four cases, the absolute value of the coefficient onthe average review rating goes down when the textualdata are incorporated in the model. For instance, for“digital camera” data set, the no-text model reportsa coefficient of −1004 for the average review rating,whereas the next three models incorporating text datashow significantly smaller magnitude of the effect ofthe average rating (in the neighborhood of −002). Weinterpret this result as a partial evidence in favor ofthe hypothesis that consumers’ shopping decisionsare not only affected by the average product rating,but by the actual textual contents of the reviews.
The volume of reviews shows a positive effect onproduct sales in both categories. This is consistentwith classical models of risk aversion: Given twosimilar products with similar average review ratings,

Archak, Ghose, and Ipeirotis: Deriving the Pricing Power of Product Features1498 Management Science 57(8), pp. 1485–1509, © 2011 INFORMS
Table 10 GMM and Dynamic GMM Estimation Results for Digital Camera Category with Inferred Polarity,Part B
(1) (2) (3) (4)Model 1 (GMM) Model 2 (GMM) Model 3 (DGMM) Model 4 (DGMM)
Picturequalityblurry −00524∗∗∗ −00214∗∗ −001874−80955 4−20735 4−10115
Picturequalityclear −00819∗∗∗ −00288∗∗ −00517∗∗
4−110665 4−30175 4−20665Picturequalitygood 00507∗∗∗ 00232∗∗∗ 00352∗∗
4120675 440415 420905Picturequalityverygood −00654∗∗∗ −00366∗∗ −00863∗∗
4−70735 4−30095 4−20845Picturequalitygreat −30043∗∗∗ −10186∗∗∗ −10634∗∗∗
4−680585 4−120935 4−60625Picturequalitysharp 00486∗∗∗ 00169 00535∗
460095 410655 420255Picturequalitycrisp 000846 000841 −00375
400875 400695 4−10415Picturequalityexcellent −10755∗∗∗ −00692∗∗∗ −00934∗∗∗
4−230405 4−60805 4−40265Picturequalityamazing −40901∗∗∗ −10921∗∗∗ −20194∗∗∗
4−390325 4−100365 4−50795Easeofusesimple −30086∗∗∗ −10349∗∗∗ −10330∗∗∗
4−330395 4−90575 4−40975Easeofuseeasy −00540∗∗∗ −00221∗∗∗ −00374∗∗
4−120165 4−30805 4−20895Easeofuseeasytouse 10706∗∗∗ 00710∗∗∗ 00550∗
4190275 450965 420205Easeofuseveryeasy 20208∗∗∗ 00824∗∗∗ 10470∗∗∗
4180415 450185 430885Sizesmall −00699∗∗∗ −00237∗∗∗ −00321∗∗∗
4−240285 4−50925 4−30415Sizecompact −00530∗∗∗ −00197∗∗ −00412∗∗
4−100265 4−30035 4−30065Sizelight 000160 −0000451 −00155
400245 4−00055 4−00845Videoqualitygreat 30102∗∗∗ 10196∗∗∗ 10634∗∗∗
4280405 470605 440535LCDlarge −00326∗∗∗ −00139∗∗∗ −00156∗
4−130075 4−40185 4−20135Designgreat −20401∗∗∗ −00872∗∗∗ −10005∗∗
4−210555 4−50795 4−20825Batterylifegood 50624∗∗∗ 20224∗∗∗ 20744∗∗∗
4440765 4100905 460145Log of sales rank 00618∗∗∗ 00466∗∗∗
4260325 470235_Cons 50242∗∗∗ 50908∗∗∗ 20123∗∗∗ 30433∗∗∗
4620265 4670765 4110965 470295N 7,307 7,307 7,267 1,349
Note. The t-statistics are in parentheses.∗p < 0005; ∗∗p < 0001; ∗∗∗p < 00001.
consumers will prefer the product that was reviewedmore. Controlling for the number of reviews, we can-not make a similar claim for the total review length.Whereas in the “digital camera” category the coeffi-cient on the review length is negative (indicating apositive effect on sales), in the “camcorder” category,
it is not statistically significant. This ambiguous resultmay be due to two conflicting phenomena: Althoughlonger reviews may theoretically provide more infor-mation about a product, they may also be perceivedas more bloated and less relevant or helpful. Thus,everything else being equal, consumers may have a

Archak, Ghose, and Ipeirotis: Deriving the Pricing Power of Product FeaturesManagement Science 57(8), pp. 1485–1509, © 2011 INFORMS 1499
Table 11 GMM and Dynamic GMM Estimation Results for Camcorder Category with Inferred Polarity
(1) (2) (3) (4)Model 1 (GMM) Model 2 (GMM) Model 3 (DGMM) Model 4 (DGMM)
Price (unit = $100) 000560∗∗∗ 000374∗ 000272 000341430555 420305 410705 410445
Trend 00687∗∗∗ 00605∗∗∗ 00326∗∗∗ 00438∗∗∗
4170285 4130875 460595 430805Age 0000688∗∗∗ 0000580∗∗∗ 0000342∗∗∗ 0000283∗∗∗
4850055 4640425 4190285 470515Isused 00341∗∗∗ 00250∗∗∗ 00141∗∗∗ 00152∗∗
4170425 4110395 450845 430135Fraction of one-star reviews −30362∗∗∗ −20886∗∗∗ −10633∗∗∗ −10252∗∗∗
4−280845 4−230205 4−100845 4−40265Fraction of five-star reviews 10746∗∗∗ 00867∗∗∗ 00543∗∗∗ 00433∗∗
4210615 4160135 470965 430155Numreviews (unit = 10) −00461∗∗∗ −00228∗∗∗ −00134∗∗∗ −00103
4−320515 4−80935 4−40675 4−10855Rating −10017∗∗∗ −00736∗∗∗ −00446∗∗∗ −00417∗∗∗
4−470935 4−280525 4−120455 4−50885Reviewlength (unit = 101000 words) 00122∗∗∗ 000000268 0000278 −0000547
480155 400005 400145 4−00135Ratingstdev −10024∗∗∗ −00499∗∗∗ −00292∗∗∗ −00219∗∗∗
4−460775 4−240925 4−100735 4−30835Hasrating 10536∗∗∗ 10890∗∗∗ 10158∗∗∗ 10201∗∗∗
4200805 4240105 4110235 450505Pictureimagequalitygood −20523∗∗∗ −10444∗∗∗ −10125∗∗∗
4−360735 4−130915 4−50125Pictureimagequalitygreat 00245 00236 00248
410285 410165 400725Pictureimagequalityexcellent −10180∗∗∗ −00791∗∗∗ −00548
4−50815 4−30395 4−10375Sizeweightsmall 00117 000544 000147
410545 400665 400095Sizeweightcompact 00115 00134 000743
410925 410895 400465Userfriendlinesseaseofuseeasy −10201∗∗∗ −00701∗∗∗ −00539∗∗∗
4−140785 4−70515 4−30355Userfriendlinesseaseofuseeasytouse −10816∗∗∗ −10074∗∗∗ −00610∗∗∗
4−290815 4−120575 4−30515Videoqualitygood 00383∗∗∗ 00241∗ 00221
430505 420115 410025Videoqualitygreat 10389∗∗∗ 00771∗∗∗ 00587∗∗
4140005 470155 420895Videoqualityexcellent −00426∗∗∗ −00186∗ −00142
4−50855 4−20195 4−00875Log of sales rank 00424∗∗∗ 00551∗∗∗
4160435 490335_Cons 70309∗∗∗ 60257∗∗∗ 30555∗∗∗ 20587∗∗∗
4600495 4570495 4170455 450995N 4,377 4,377 4,356 790
Note. The t-statistics are in parentheses.∗p < 0005; ∗∗p < 0001; ∗∗∗p < 00001.
preference for shorter, more readable reviews, whichis consistent with Ghose and Ipeirotis (2010).
Finally, the standard deviation of the set of reviewratings has a strong positive effect on sales in both cat-egories. This finding suggests that controlling for the
average review rating, consumers will prefer a morepolarized set of reviews. For example, a set of a one-star and a five-star review will be preferred to a set oftwo three-star reviews. We argue that a more polarizedset of reviews may be perceived as more informative

Archak, Ghose, and Ipeirotis: Deriving the Pricing Power of Product Features1500 Management Science 57(8), pp. 1485–1509, © 2011 INFORMS
by consumers, consistent with prior work (Ghose andIpeirotis 2010).
The more interesting results, however, are relatedto the coefficients for the text-based data. In the“digital camera” category, the top positive eval-uations are (in decreasing order of importance)“amazing picture quality,” “great picture quality,”“simple ease of use,” “great design,” “excellent pic-ture quality,” “very good picture quality.” In the“camcorder” category, the statistically significant pos-itive evaluations are (in decreasing order of impor-tance) “good picture/image quality” and “ease ofuse.” Interestingly, some seemingly positive evalua-tions are estimated to be negative and statisticallysignificant: “good” and “sharp picture quality” and“good battery life” for digital cameras, and “greatvideo quality” for camcorders. One plausible expla-nation for this effect is that consumers of camcordershave strong prior expectations about the product videoquality, just as consumers of digital cameras havestrong prior expectations about the battery life and thepicture quality, and it is the difference between the signaland the prior expectation that determines the influence ofa consumer review (see the appendix). Therefore, it ispossible that this may be due to the fact that, from thebuyer’s perspective, a neutral or a lukewarm evalu-ation for a major product attribute is not sufficientlystrong enough to warrant an increase in sales.
4.2. Exogenously Imposed Polarity ModelWe also estimated the model in which the polarity ofevaluations is imposed ex ante from the predefinedontology. In this scenario, the data are used only toinfer the weights of the product features. The resultsare given in Tables 12 and 13. Consistent with theinferred polarity model, the textual data are jointlysignificant at the 1% level (“digital camera” data set,�2475= 62051, p = 00000; “camcorder” data set, �2445=
35005, p = 00000). Furthermore, the Sargan (1958) testalleviates any concerns of overidentification (“digi-tal camera” data set, �241745 = 16506693, p = 006620;“camcorder” data set, �241745= 19002418, p = 002351).
Results for the control variables align very wellwith expectations and are consistent with the resultsfrom the induced polarity model. Both price and agehave a negative effect on product sales, whereas theaverage review rating, the volume of reviews, and thestandard deviation of review ratings have a positiveimpact on sales.
Finally, the signs on textual variables are mostly asexpected, with a couple of interesting exceptions. Inthe “digital camera” category, “picture quality” is notrecognized as a statistically significant feature, and“ease of use” seems to have a negative effect on sales.In the “camcorder” category, “video quality” has asimilar problem. As before, we argue that the effect
may be purely due to strong prior consumer expec-tations for certain features of certain products. Forexample, if consumers expect digital cameras to havegood picture quality by default, then its effect on salesis unlikely to be statistically significant. Nonetheless,it can also be an indication of other limitations in thedata or estimation approach. We discuss these below.
4.3. Interpretation of Results: LimitationsWe believe it is useful to alert the readers to poten-tial limitations of our approach and how such limi-tations can affect interpretation of the results. First ofall, heterogeneity in consumer tastes and its interac-tion with producers’ pricing strategies can potentiallybias the estimates of a simple linear model. Pakes(2003) shows that if firms are engaging in Bertrandpricing, then markups of products over marginal costsare a complex function of the interplay between char-acteristics of competing products and the distributionof consumer preferences. As a result, the coefficientson product characteristics obtained by linear estima-tors may often be in an unexpected direction (i.e.,increases in good features may be negatively corre-lated with price).8
Second, omitted variable bias can also be presentin our approach. Extracting all opinions in reviewswith complete precision using automated methods ispractically implausible (as is widely recognized in thetext-mining community). Even if one resorts to man-ual processing of reviews, there are distinct trade-offs:Because of the limited number of observation pointsin manual processing, one either has to drop manyextracted opinions to avoid the curse of dimension-ality (thus creating an omitted variable bias), or onehas to pool multiple opinions together (thus biasingthe results in a different way).
For instance, in the situation with “good batterylife,” an unexpected sign of the estimate can likelybe attributed to a mix of high prior expectationsabout the product quality combined with the omittedvariable bias. We investigated this further. A manualinspection of the review corpora shows that in manycases when consumers use the “good battery life”opinion, they often proceed with a complex critiqueof the camera using opinion sentences or describingfeatures that cannot be fully captured in the model.Some examples of such scenarios using actual phrasesextracted from review data are given below (originalspelling preserved, italics added):
• “The battery life even though did not impress mewas still good and presence of battery level indicatorinstead of low battery light was also a big plus.”
• “Battery life has been good, but not great.”
8 We thank an anonymous reviewer for suggesting this explanation.

Archak, Ghose, and Ipeirotis: Deriving the Pricing Power of Product FeaturesManagement Science 57(8), pp. 1485–1509, © 2011 INFORMS 1501
Table 12 GMM and Dynamic GMM Estimation Results for Digital Camera Category with Induced Polarity
(1) (2) (3) (4)Model 1 (GMM) Model 2 (GMM) Model 3 (DGMM) Model 4 (DGMM)
Price (unit = $100) 00101∗∗∗ 00101∗∗∗ 000513∗∗∗ 000186490265 490105 440075 410125
Trend −10440∗∗∗ −00941∗∗∗ −00341∗∗∗ −00410∗∗∗
4−630565 4−380045 4−90075 4−40525Age 0000954∗∗∗ 0000889∗∗∗ 0000350∗∗∗ 0000482∗∗∗
41350755 41390205 4150845 480305Isused 00628∗∗∗ 00674∗∗∗ 00263∗∗∗ 00383∗∗∗
4650335 4660465 4130145 470865Fraction of one-star reviews −00571∗∗∗ −00718∗∗∗ −00160 −000174
4−50835 4−60945 4−10265 4−00065Fraction of five-star reviews 20340∗∗∗ 10287∗∗∗ 00490∗∗∗ 00920∗∗∗
4600285 4230495 460465 450005Numreviews (unit = 10) −00358∗∗∗ −00355∗∗∗ −00130∗∗∗ −00200∗∗∗
4−590055 4−500275 4−100775 4−60365Rating −10040∗∗∗ −00283∗∗∗ −000934∗∗ −00248∗∗
4−430495 4−100435 4−20725 4−20955Reviewlength (unit = 101000 words) 000397∗∗∗ −0000686 −000117 0000254
450695 4−10045 4−10555 400195Ratingstdev −00722∗∗∗ −00193∗∗∗ −000576∗ −00207∗∗∗
4−460465 4−100615 4−20535 4−30705Hasrating 20542∗∗∗ 10072∗∗∗ 00399∗∗∗ 00614∗
4300975 4120355 430575 420275Picturequality 000303 000249 −000217
410155 400785 4−00355Easeofuse 00808∗∗∗ 00309∗∗∗ 00648∗∗∗
4180435 450365 450275Size −00675∗∗∗ −00265∗∗∗ −00529∗∗∗
4−230495 4−60815 4−50495Videoquality −10626∗∗∗ −00695∗∗∗ −00604∗∗
4−200665 4−60845 4−30175LCD −10783∗∗∗ −00694∗∗∗ −10074∗∗∗
4−400275 4−90765 4−60405Design −00972∗∗∗ −00379∗∗ −00332
4−100095 4−30085 4−10185Batterylife −00809∗∗∗ −00301∗∗∗ −00253∗
4−270505 4−70235 4−20555Log of sales rank 00611∗∗∗ 00462∗∗∗
4250475 470155_Cons 50242∗∗∗ 40476∗∗∗ 10615∗∗∗ 20905∗∗∗
4620265 4520165 4100605 470105N 7,307 7,307 7,267 1,349
Note. The t-statistics are in parentheses.∗p < 0005; ∗∗p < 0001; ∗∗∗p < 00001.
• “The battery life is good (but I wouldn’t know whatto compare it to), but I would say it lasted me about a1.5–2 days of shooting pics throughout the day (I’mnot sure what it should last, but 1.5–2 days batt life ispretty good to me).”
• “The battery life is good, but get a backup batteryif you want to take a lot of pictures.”
• “The battery life is good enough to take onextended trips from your hotel.”
• “Battery life is good. My personal camera is theSony V1, it too is a nice camera, however the screen
size is much smaller and the glossy finish makes isalmost impossible to view in bright light. Overall bothcameras are very nice. The DSCW-5 is quite a bitsmaller and lighter than the V1. Another good featureabout the DSCW5 is that is runs on two AA batteriesthat in an emergency you could purchase from anystore. Battery life however on non-rechargeable batterieswould not be good, but it is better than having a deadspecialized battery, like most other cameras have includingmy V1.”

Archak, Ghose, and Ipeirotis: Deriving the Pricing Power of Product Features1502 Management Science 57(8), pp. 1485–1509, © 2011 INFORMS
Table 13 GMM and Dynamic GMM Estimation Results for Camcorder Category with Induced Polarity
(1) (2) (3) (4)Model 1 (GMM) Model 2 (GMM) Model 3 (DGMM) Model 4 (DGMM)
Price (unit = $100) 000560∗∗∗ 000928∗∗∗ 000602∗∗∗ 000467∗
430555 460235 440035 420115Trend 00687∗∗∗ 00734∗∗∗ 00389∗∗∗ 00432∗∗∗
4170285 4180735 480255 440075Age 0000688∗∗∗ 0000656∗∗∗ 0000371∗∗∗ 0000318∗∗∗
4850055 4770575 4190355 470725Isused 00341∗∗∗ 00365∗∗∗ 00201∗∗∗ 00179∗∗∗
4170425 4180875 480755 430755Fraction of one-star reviews −30362∗∗∗ −30323∗∗∗ −10849∗∗∗ −10525∗∗∗
4−280845 4−400825 4−140535 4−50685Fraction of five-star reviews 10746∗∗∗ 10663∗∗∗ 00927∗∗∗ 00776∗∗∗
4210615 4280255 4110845 450085Numreviews (unit = 10) −00461∗∗∗ −00404∗∗∗ −00225∗∗∗ −00181∗∗∗
4−320515 4−280145 4−110385 4−40015Rating −10017∗∗∗ −10105∗∗∗ −00643∗∗∗ −00577∗∗∗
4−470935 4−390455 4−150065 4−60895Reviewlength (unit = 101000 words) 00122∗∗∗ 00101∗∗∗ 000549∗∗∗ 000470
480155 470355 430425 410335Ratingstdev −10024∗∗∗ −00871∗∗∗ −00483∗∗∗ −00372∗∗∗
4−460775 4−440415 4−140795 4−50515Hasrating 10536∗∗∗ 20209∗∗∗ 10336∗∗∗ 10346∗∗∗
4200805 4200695 4100475 450485Picturequality −20487∗∗∗ −10373∗∗∗ −10055∗∗∗
4−410635 4−140095 4−40865Easeofuse −00526∗∗∗ −00268∗∗∗ −00235∗∗
4−140325 4−60425 4−20995Weightsize −00547∗∗∗ −00252∗∗∗ −00260∗
4−80035 4−30435 4−20025Videoquality 00732∗∗∗ 00391∗∗∗ 00391∗∗∗
4190735 480455 440235Log of sales rank 00445∗∗∗ 00561∗∗∗
4170165 490575_Cons 70309∗∗∗ 60689∗∗∗ 30658∗∗∗ 20765∗∗∗
4600495 4640805 4170375 460135N 4,377 4,377 4,356 790
Note. The t-statistics are in parentheses.∗p < 0005; ∗∗p < 0001; ∗∗∗p < 00001.
That being noted, there is no doubt that we candemonstrate and claim that review text has significantexplanatory power for product sales (both as a contempora-neous indicator and as a forecasting tool, as described inthe next section). Causal interpretation of the resultsof our model should only be made while recognizingthe potential noise and biases in the data.
4.4. Comparison of MethodsIn this section, we discuss the strengths and weak-nesses of the crowdsourcing-based solution versus theautomated text-mining approach. We also discuss thestrengths and weaknesses of the imposed polarityversus the inferred polarity approach. Such discus-sions would inform future researchers of the meritsof each approach.
4.4.1. Crowdsourcing vs. Automatic Text Mining.We can consider these approaches as solutions withdifferent start-up costs and different variable costs.
Crowdsourcing has a low start-up cost, and anyresearcher can quickly use it for processing relativelylarge collections of text documents (e.g., a few thou-sand documents). The accuracy is good to great, andit can be done reasonably quickly. It is ideal forresearchers that have a one-off task regarding con-tent analysis and do not expect to repeatedly applythe same techniques for a variety of data sets. Onthe other hand, text mining has a much higher start-up cost. Setting up the algorithms requires significantexpertise, and if the text analysis needs to be donein a new, previously unstudied domain, the develop-ment of the necessary resources requires both human

Archak, Ghose, and Ipeirotis: Deriving the Pricing Power of Product FeaturesManagement Science 57(8), pp. 1485–1509, © 2011 INFORMS 1503
effort and time. However, it has the advantage of zeromarginal cost once everything is set up. It can scaleto collections with hundreds of thousands of docu-ments and in many different data sets. Our analysisindicates that the analysis and noise level of the twoapproaches is similar. Therefore, the choice of whichtechnique to use depends on “external” factors thatare particular to each researcher.
4.4.2. Inferred vs. Imposed Polarity. The estima-tion with inferred polarity and the estimation withinduced polarity represent two competing solutionsto the same problem.
The imposed polarity approach takes a more “tradi-tional” view of language. This approach assumes thatlanguage is static and has a given and unambiguousmeaning. The main advantage of the imposed polar-ity is the reduction in the number of variables thatare included in the econometric model. The imposedpolarity approach brings outside actors to decideon the strength of particular evaluations and usesdata only to evaluate feature weights. This efficientlysolves the problem of data sparsity but potentiallyintroduces human bias in the results.
The inferred polarity approach takes an agnosticview toward language. This model assumes that theway that humans interpret language (in this case,evaluations) depends on many contextual factors, andit is not possible to ex post assign a polarity andstrength to the evaluations. Thus, the inferred polar-ity approach attempts to learn as much as possibleabout the language from the given data itself. How-ever, the inferred polarity approach can only separateweights of individual features from strengths of indi-vidual evaluations under some assumptions. In addi-tion, because the dimensionality of the data increasestremendously, we need to impose restrictions on whatdata can be included in the model.
We believe that the choice of which method toadopt depends on both the particular application cho-sen as well as the data set. For example, for a fore-casting task, the inferred polarity model is likely tobe preferred simply because it feeds more featuresinto the machine-learning model (described above).We believe that the best way to interpret the coeffi-cients of the inferred polarity model is from a purelypredictive viewpoint. To separate weights of individ-ual features from strengths of individual evaluationsnaturally, we recommend using the imposed polaritymodel.
5. Predictive Modeling of Sales RankIn the previous section, we demonstrated that con-sumer opinions have a significant effect on prod-uct sales, and we can attempt to learn consumerpreference for particular product features by relating
changes in the product demand to the changes in thecontent of consumer reviews. In this section, we adopta purely forecasting perspective and show that textof newly published product reviews can be used topredict short-term future changes to the product sales.In particular, we state our prediction task as follows:given the set of product reviews posted for a prod-uct within the last week and related changes to othernumeric variables such as product price, predict
• whether the product sales (as measured by thesales rank) will go up or down within the next week,
• what the exact product sales rank after the nextweek will be.
5.1. Classification ProblemThe first task is a binary classification task: Wepredict the sign of the value SalesRank4t + 75 −
SalesRank4t5 using whatever information is availableat time t (measured in days). We have experi-mented with four different classifier types: logisticregression, support vector machines, decision trees,and random forests. Support vector machine slightlyoutperformed (2%–3%) logistic regression but tooksignificantly longer time to train, whereas tree-basedclassifiers performed significantly worse on bothproduct categories; thus, in the following, we reportresults of the logistic regression model.
For each of the three product categories, we esti-mated two models: the baseline model using all vari-ables (including numeric review data) except for thereview text and the full model, which additionallyincludes the top 20 most popular opinion phrases asfeatures. For every feature, we included its absolutelevel at time t as well as its change within the pastweek (Feature4t5− Feature4t − 75).
Table 8 reports results of 10-fold cross-validation (Kohavi 1995) on each category basedon the area under curve (AUC) metric. For digitalcameras, we see that whereas the no-text modelincreases the AUC from the random baseline levelof 0.5 to 0.574, the addition of textual content inthe model raises the AUC from 0.574 to 0.644. Inother words, we see an almost twofold increase in theAUC from the baseline case once we add the textualcontent of reviews. In the case of camcorders, wesee an almost threefold increase in predictive powerwith text from the baseline case of 0.5 to 0.617,when compared to the AUC of the no-text model(0.544). Both these categories demonstrate substantialimprovements in the AUC compared to the baselinecases when textual data are added to the models.
5.2. Regression ProblemThe second task we consider is a regression problem,in which we try to predict the exact product sales rankone week into the future. This is somewhat similar

Archak, Ghose, and Ipeirotis: Deriving the Pricing Power of Product Features1504 Management Science 57(8), pp. 1485–1509, © 2011 INFORMS
to the regression problem we studied in §3.2, how-ever the independent variables are now lagged by oneweek, and we are only concerned about the out-of-sample predictive power of the model and not thestructural interpretation of the coefficients.
In addition to the baseline model, which includesthe top 20 opinion phrases for every product category,we also propose and evaluate a novel technique thatallows including more regressors by making addi-tional assumptions about the parameter space thatreduce the dimensionality of the problem and avoidoverfitting.
In §3.2, we defined Score4f 1 e5 of every opinionphrase (evaluation e applied to feature f ) to be ajoint function of the evaluation and the feature: Thesame evaluation applied to different features can havedifferent relative impact, and vice versa, the same fea-ture can have different relative weight when com-bined with different evaluations. For the predictivemodeling part, we relax this assumption and assumethat the score of each evaluation is independent of thefeature being described. For example, the strength ofthe evaluation “great” (compared to the strength ofother evaluations like “good”) should be the same forboth “picture quality” and “video quality” features.Formally, this can be written as
∃SF 2 F⇒�1 SE 2 E⇒� ∀ f ∈F1 e ∈E
Score4f 1 e5= SF 4f 5SE4e50
In other words, every evaluation has certain weightSE4e5 independent of the feature that it evaluates, andevery feature has certain weight SF 4f 5 independentof the evaluation applied to the feature; the impact ofany particular opinion is calculated as a product ofthese two weights. For N features and M evaluations,the number of model parameters is therefore reducedfrom MN to 2M +N .
Formally, the estimated model can be representedby the following equation:
log4sjt+75− log4sjt5 = x ·� +∑
f∈F
∑
e∈E
Yjt4f 1 e5
· SE4e5 · SF 4f 5+ �jt1 (5)
where sjt represents product j sales rank at time t,vector 4Yjtt4f 1 e55f∈F1 e∈E represents review opinionsavailable at time t, and vector x represents all othernumeric variables such as product price.
Although the model is nonlinear, it can be esti-mated by a sequence of regression operations. We usethe observation that, for a fixed vector SE , Equation (5)represents a regression for SF . Vice versa, for a fixedvector SF , Equation (5) represents a regression for SE .Because the model exhibits significant nonlinearity inparameters and can potentially overfit the data, we
further add a regularization term � ·�SE�2 ·�SF �
2 to theoptimization function. Overall, the estimation algo-rithm is as follows:
SF 4f 5≡ 1 {all features are initially assumed to beequally important}
while not converged doSE4e5⇐ coefficients from regression of
log4rjt+75− log4rjt5 on x and SF 4f 5wt4f 1 e5 with
regularization weight ��SF �2
SF 4f 5⇐ coefficients from regression oflog4rjt+75− log4rjt5 on x and SE4e5w
t4f 1 e5 withregularization weight ��SE�
2
end while
We have implemented the algorithm above with 10different feature names and 10 different evaluationadjectives (i.e., 100 different opinion phrases) in bothproduct categories and compared its results withresults of a simple regression model including onlythe top 20 most popular opinion phrases. In everycategory, we saw a 5% to 10% increase in predictivepower as measured by out-of-sample R2.
6. Managerial Implications andConclusions
We are the first to combine a theoretically motivatedeconometric model with text-mining techniques tostudy the influence of textual product reviews onproduct choice decisions. Using a unique data setfrom a leading online retailer of electronic products,Amazon.com, we demonstrate the value of combiningtextual data with econometric and predictive model-ing for quantitative interpretation of user-generatedcontent. Our empirical approach is able to imputewhich product features described in reviews are moreimportant to consumers and how one can quan-tify opinions contained in the textual component ofreviews. The results of our study indicate that the tex-tual content in product reviews has a significant pre-dictive power for consumer behavior and explains alarge part of the variation in product demand overand above the impact of changes in numeric infor-mation such as product price, product age, trends,seasonal effects, and the valence and the volume ofreviews.
Our results have several managerial implications.Most consumer products have a mix of attributes thatcan be objectively evaluated prior to purchase andsubjective attributes that are harder to quantitativelyevaluate. In this vein, this distinction between sub-jective and objective attributes is similar to the dis-tinction between search and experience goods (Nelson1970). One of the interesting applications of our text-based approach is that it allows us to easily incor-porate, into quantitative models, product attributes

Archak, Ghose, and Ipeirotis: Deriving the Pricing Power of Product FeaturesManagement Science 57(8), pp. 1485–1509, © 2011 INFORMS 1505
that were inherently qualitative and hence difficultto measure and incorporate into econometric mod-els. Using our approach, it is now possible to inferthe weight that customers put in such features. Forexample, in the case of digital cameras, attributes like“design” and “ease of use” are attributes that are hardto evaluate quantitatively because they are suscepti-ble to subjectivity of the evaluator. On the other hand,attributes like “battery life” and size would belongto the more “objective features” category. Attributeslike “picture quality” would fall somewhere in themiddle. Our focus on combining econometrics withautomated text-based analyses can help recover therelative economic weight that consumers place onthese features, irrespective of whether they are “objec-tive” of “subjective.” Our technique can be of inter-est to manufacturers and retailers to determine whichfeatures contribute the most to the sales of their prod-ucts. Such information, for example, can help manu-facturers facilitate changes in product design over thecourse of a product’s life cycle as well as help retailersdecide on which features to promote and highlight inadvertisements and in-store displays.
Our paper also provides some insights to onlineadvertisers (manufacturers or retailers) who aim touse customer-generated opinions to automaticallydevise an online advertising strategy for each productusing the widely popular model of sponsored searchadvertising. For instance, our methods can be extrapo-lated to different product categories for firms to selectthe appropriate keywords to bid in these advertisingauctions, and for selecting the most pertinent text inthe advertisement that highlights the differentiatingcharacteristics of the advertised products that con-sumers value the most. For example, if the phrase“excellent video quality” is associated with increase insales three times more than the phrase “great design”for a given model of Sony digital cameras, then itmight make sense for the manufacturer or the retailerto choose the set of keywords associated with the for-mer phrase rather than the latter.
We would like to note that methodologies pre-sented in this paper possess flexibility: Althoughsome of our current choices can be derived froma simple model of Bayesian learning by consumers,there are alternative approaches for almost all stepsof the text-mining process, from feature extractionto choosing a particular functional form for the esti-mation equation. To the best of our knowledge, ourpaper is the first application of text mining to demandestimation and it provides encouraging results byshowing that even a simple choice model combinedwith simple text-mining techniques can have signifi-cant explanatory power. Overall, we believe that theinteraction of economics and marketing mix models
with text-mining tools from natural-language process-ing can benefit both fields. Economic approaches canoffer natural solutions to text-mining problems thatseemed too hard to solve in a vacuum (e.g., determin-ing the strength of an opinion). Similarly, text-miningapproaches can improve the current state of the art inempirical economics, where the focus has tradition-ally been on relatively small, numeric data sets.
Although we have taken a first step in several direc-tions, we acknowledge that our approach has sev-eral limitations, some borne by the nature of the datathemselves. Our work attempts to combine econo-metric modeling with text-mining techniques and canbenefit from parallel improvements in both fields. Inparticular, the methodologies presented in this papercan benefit from improvements in discrete choicemodeling and in text mining. Better techniques forhandling absence of individual-level data, overcom-ing sparsity of textual review contents, improvementson natural-language processing algorithms, and bettertechniques for handling noisy information on prod-uct sales would all result from improvements of ourown work.
Our research has certain limitations. First, ourmethods and results are better suited for verticallydifferentiated products like electronics. Future workcould examine what kind of empirical models couldbe applied products that are horizontally differenti-ated. Second, our approach implicitly assumes thatconsumers learn independently across attributes andindependently for each product. In reality, consumersmay learn about quality levels across attributes oreven across products. Consumer might even engageinto a process of learning the weights that they shouldplace in each product feature by reading the reviewsof other, more experiences customers. Application ofmore advanced models of learning with uncertaintycan potentially provide better insights. Third, someof the variables in our data are proxies for the actualvariables needed for more advanced empirical mod-eling. For example, we use sales rank as a proxyfor demand (Brynjolfsson et al. 2003, Chevalier andGoolsbee 2003, Ghose and Sundararajan 2006) fromone retailer. Future work can use real demand datafrom multiple retailers for estimating the value of dif-ferent product features, as in the paper by Ghose et al.(2011), who estimate demand for hotels using actualtransactions. To control for effects of potential adver-tising shocks and the inherent endogeneity in theword of mouth–sales relationship, we used GoogleTrends data as a measure of publicity. Future workcan incorporate more explicit and better measures ofpublicity and advertising such as in Luan and Nes-lin (2009). Notwithstanding these limitations, we hopeour paper paves the way for future research in thisexciting domain.

Archak, Ghose, and Ipeirotis: Deriving the Pricing Power of Product Features1506 Management Science 57(8), pp. 1485–1509, © 2011 INFORMS
AcknowledgmentsThe authors thank Rhong Zheng for assistance with datacollection. They offer deep thanks to Kenneth Reismanand his company Pluribo.com for providing them withan ontology construction tool. They thank seminar par-ticipants at Microsoft Research, IBM Research, YahooResearch, Carnegie Mellon University, Columbia Univer-sity, New York University, University of Utah, SCECR 2008,INFORMS-CIST 2008, and the 2008 NET Institute Confer-ence for helpful comments. This work was supported by a2006 Microsoft Live Labs Search Award, a 2007 MicrosoftVirtual Earth Award, and by National Science FoundationCAREER Grants IIS-0643847 and IIS-0643846. Any opin-ions, findings, and conclusions expressed in this materialare those of the authors and do not necessarily reflect theviews of the Microsoft Corporation or of the National Sci-ence Foundation.
Appendix. Figures, Summary Statistics, andEstimation Results
Theoretical ModelIn this appendix, we present a justification of our empiri-cal approach based on a simple theoretical model of mul-tiattribute choice under uncertainty. Although the modelis not required to understand the methodologies and theresults of this paper, through the description of the model,we hope to outline clearly the scope and applicability ofour research, explain what are the implicit assumptionsbehind our current approach are, and identify directions forfuture research. The foundation of our model is the seminalpaper of Roberts and Urban (1988). Products have multi-ple attributes, and the quality of each attribute is uncer-tain to consumers. To reduce uncertainty, consumers readproduct reviews and use Bayesian learning to update theirbeliefs about the quality of product attributes. Based ontheir beliefs, consumers buy the product that maximizestheir expected utility, a fact that is reflected in the productsales. We outline the basic concepts of the model below.
Multiattribute Products. We model products as n-dimensional vectors of well-defined product attributes.Ignoring the uncertainty aspect, our model will representevery product by an n-dimensional point zj = 4z1j1 0 0 0 1 znj5,where each zij should be read as the amount or qualityof the ith attribute for the jth good. Although natural inmany markets, such as markets for consumer appliances,this assumption indicates that our model cannot be appliedto products such as movies or music that cannot be repre-sented by a small set of well-defined attributes.
Preferences. We assume a simple scenario of homoge-neous preferences for product attributes. To incorporate riskaversion in our model, we abstain from linear utility setting,instead adopting negative exponential utility (Roberts andUrban 1988, Bell and Raiffa 1988).9 Formally, we assume
9 Roberts and Urban (1988) provide an elaborate argument infavor of negative exponential utility based on the observation that,for measurable value functions, if the consumer obeys the vonNeumann–Morgenstern axioms for lotteries, and if a utility functionexists, the value function should show constant risk aversion withrespect to the strength of preference measure (Bell and Raiffa 1988).
that for any consumer and any product zj with deterministicvector of attributes 4z1j1 0 0 0 1 znj5 and price pj , the utility ofpurchasing the product is given by
u4zj5= −exp(
�pj −n∑
k=1
�kzkj + �ij
)
1 (6)
where �ij is the “taste for randomness” residual represent-ing inherent randomness in consumer’s choice process.
Uncertainty. Instead of having a direct assessment ofvector zj for each product, consumers are uncertain andhave beliefs about the distribution of zj . We futher assumethat consumers share a common information set and there-fore have common beliefs about the attributes of the jthproduct represented by the distribution function Fj . In sucha scenario, consumers making purchase decisions are notchoosing just a product (i.e., a bundle of attributes), butthey choose a lottery over bundles of attributes. We fol-low classic modeling approach for choice under uncertaintyand adopt the von Neumann–Morgenstern expected utilityframework: consumers always choose product zj with thehighest expected utility Eu4zj5.
Prior Beliefs. Application of our theory requires specifi-cation of the form of consumers’ beliefs. We assume normalprior beliefs with a diagonal covariance matrix:10
Fj ∼N
�1j
�2j
0 0 0
�nj
1
�21j 0 0 0 0 0
0 �22j 0 0 0 0
0 0 0 0 0 0 0 0 0 0 0 0
0 0 0 0 0 0 0 �2nj
0
Our argument is that, under certain regularity conditions,recursive the Bayesian learning process results in asymp-totic normality of the posterior distribution (Chen 1985).Consumers often use their previous experiences with simi-lar products to form a prior distribution about the qualityof a new product. Because such experiences correspond to atype of recursive Bayesian learning process, we can assumethat consumers use normal priors. This is also consistentwith the original approach of Roberts and Urban (1988),who also assumed that consumers’ uncertainty is character-ized by a normal distribution. It can be shown (Roberts andUrban 1988) that, in combination with negative exponentialutility, it gives a particularly simple analytic representationof the expected utility function:
Eu4zj5= −exp(
�pj −n∑
k=1
�k�jk + 12
n∑
k=1
�2k�
2jk + �ij
)
0 (7)
It immediately follows that consumers will prefer productzj to product zl if and only if
�ij − �il ≥ −�4pj − pl5+n∑
k=1
�k4�jk −�lk5−12
n∑
k=1
�2k4�
2jk −�2
lk51
(8)
10 Diagonality of the covariance matrix implicitly enforces indepen-dence of beliefs for different attributes. For example, additionalinformation about picture quality for a digital camera should notaffect consumers’ beliefs about its battery life.

Archak, Ghose, and Ipeirotis: Deriving the Pricing Power of Product FeaturesManagement Science 57(8), pp. 1485–1509, © 2011 INFORMS 1507
or�ij − �il ≥ 4−�pj +R4Fj55− 4−�pl +R4Fl551 (9)
where
R4Fj5=
n∑
k=1
�k�jk − 12
n∑
k=1
�2k�
2jk (10)
is the so-called “risk-adjusted preference function” (Robertsand Urban 1988) representing the expected value of theproduct attributes after discounting for the uncertaintyassociated with the product.
Idiosyncratic Preferences. We further follow Roberts andUrban (1988) and assume that the “taste for randomness”term �ij is uncorrelated to particular product attributes andfollows the type I extreme value distribution. This assump-tion gives a familiar logit expression for the probability Pj
that consumers choose the product j ,
Pj =exp4−�pj +R4Fj55∑
l exp4−�pl +R4Fl551 (11)
and, assuming that the total mass of consumers is normal-ized to one, a similar expression for the expected productdemand,
sj =exp4−�pj +R4Fj55∑
l exp4−�pl +R4Fl550 (12)
We are now ready to formulate our main result.
Lemma 1 (First-Order Effects of Changes in Beliefs).Assume that in Equation (12), the “risk-adjusted preference func-tion” for product j is changed by 4R, i.e., R4Fj5 = R4Fj5 + 4R
and R4Fl5 = R4Fl5 for l 6= j . Let sj represents the new marketshare for the product j . Then,
log4sj5− log4sj5= 4R+ �1 (13)
where
��� ≤�sj4R�
1 − �sj4R�= o4�4R�50 (14)
Proof. We will proceed assuming 4R≥ 0; the other casefollows by symmetry. Define Z =
∑
l 6=j exp4−�pl +R4Fl55;
sj =exp4−�pj +R4Fj5+ 4R5
exp4−�pj +R4Fj5+ 4R5+Z
= exp44R5exp4−�pj +R4Fj55
exp4−�pj +R4Fj5+ 4R5+Z(15)
= exp44R5exp4−�pj +R4Fj55
exp4−�pj +R4Fj55+Z
·exp4−�pj +R4Fj55+Z
exp4−�pj +R4Fj5+ 4R5+Z(16)
= exp44R5sjU1 (17)
where
U =exp4−�pj +R4Fj55+Z
exp4−�pj +R4Fj5+ 4R5+Z0 (18)
After taking logs,
log4sj5− log4sj5= 4R+ log4U51 (19)
thus Equation (13) holds with � ≡ log4U5. It remains to putthe bound on �. Using well-known inequality 41 − e−x5 ≤ xfor x ≥ 0, one can show that
�1−U � =
∣
∣
∣
∣
exp4−�pj +R4Fj5+4R5−exp4−�pj +R4Fj55
exp4−�pj +R4Fj5+4R5+Z
∣
∣
∣
∣
(20)
= �sj41−exp4−4R55�≤�sj4R�0 (21)
Also, log4U5≤ 41 −U5/U for 0 <U ≤ 1; therefore,
log4U5≤1 −U
U=
1 −U
1 − 41 −U5≤
�sj4R�
1 − �sj4R�0 Q.E.D. (22)
The main message of Lemma 1 is that the effect ofchanges in the risk-adjusted preference function on theproduct sales can be approximated by a linear function, andunless the product under consideration controls a signifi-cant fraction of the total market share, the error of suchapproximation is negligible for practical purposes.
Bayesian Updating of Beliefs. The final component ofour model is the mechanism used by consumers to updatetheir beliefs. We use a Bayesian learning approach. Forsimplicity of estimation, we assume that the qualities ofdifferent product attributes are learned independently. Forexample, observing the picture quality of a digital cameradoes not give consumers much information on the cam-era design, the camera size, battery life, etc. Note that thisassumption can hold either because signals of different fea-tures are actually independent or because consumers havebounded rationality and cannot capture complex depen-dencies. Although a number of marketing models allowfor cross-attribute consumer learning, e.g., Bradlow et al.(2004), because of the limited size of our data set, we leavesuch extensions as directions for future research.
A convenient choice of the likelihood function is the con-jugate distribution, which, as we assume normal priors, isalso normal. In this setting, if consumers current beliefsabout quality of the kth attribute for the product j are givenby the distribution N4�kj1�
2kj5, the variance of the likeli-
hood function is �2k , and consumers observe a sequence of
signals 8xkj11 0 0 0 1 xkjmjk9, then the posterior distribution of
beliefs about the kth product attribute will be
N
(
�kj +1
mkj +�kj
mkj∑
r=1
4xkjr −�kj511
mkj +�kj
�2kj
)
1 (23)
where �kj = �2k/�
2kj represents the strength of prior beliefs
about the attribute quality (Duda et al. 2000).In particular, with the negative exponential utility
assumption, the risk-adjusted preference function is
R4Fj5=
K∑
k=1
�k
1mkj +�kj
mkj∑
r=1
4xkjr −�kj5−12�2k
1mkj +�kj
�2kj 0 (24)
Connection to the Estimation Equation. Our resultingestimation Equation (2) is obtained by connecting Equa-tions (13) and (24) and adopting the following conventions:
• Every feature f ∈F described in product reviews rep-resents one product dimension k.
• Every evaluation e ∈E for a particular feature f repre-sents a single quality signal xkjr . There is the following rela-tionship between signal xkjr and opinion weight Score4f 1 e5:
Score4f 1 e5= �k4xkjr −�kj50 (25)

Archak, Ghose, and Ipeirotis: Deriving the Pricing Power of Product Features1508 Management Science 57(8), pp. 1485–1509, © 2011 INFORMS
• The weighting coefficients for opinions are defined as
Yjt4f 1 e5=N4f 1 e5
mkj +�kj
(26)
if opinion phrase 4f 1 e5 is mentioned N4f 1 e5 times in thedata, and mkj is the total number of opinions for feature fin product reviews for product j (both are measured asof time t); �kj is represented by the smoothing factor s inEquation (3).
• We do not directly incorporate the variance terms �2kj
in the estimation equation because of the absence of a non-ambiguous approach to measure them. Instead, we controlfor variance of consumer beliefs by including a numberof control variables in the model, such as the number ofreviews, the fraction of one- and five-star reviews, and thestandard deviation of numeric review ratings.
We would like to conclude by noting that Equation (25)provides interesting identification insights. It shows that,without making additional assumptions and obtainingadditional data, we cannot separate the following threeeffects: the effect of the information contained in the opin-ion or opinion strength (xkjr ), the prior consumers’ expecta-tions of the feature quality (�kj ), and the sensitivity of theconsumers’ utility to the particular feature (�k).
ReferencesArellano, M., S. Bond. 1991. Some tests of specification for panel
data: Monte carlo evidence and an application to employmentequations. Rev. Econom. Stud. 58(2) 277–297.
Arellano, M., O. Bover. 1995. Another look at the instrumental vari-able estimation of error-components models. J. Econometrics68(1) 29–51.
Bell, D., H. Raiffa. 1988. Managerial value and intrinsic risk aver-sion. Decision Making: Descriptive, Normative, and PrescriptiveInteractions. Cambridge University Press, New York, 384–397.
Berry, S., J. Levinsohn, A. Pakes. 1995. Automobile prices in marketequilibrium. Econometrica 63(4) 841–890.
Bickart, B., R. M. Schindler. 2001. Internet forums as influentialsources of consumer information. J. Interactive Marketing 15(3)31–40.
Blundell, R., S. Bond. 1998. Initial conditions and moment restric-tions in dynamic panel data models. J. Econometrics 87(1)115–143.
Bradlow, E. T., Y. Hu, T.-H. Ho. 2004. A learning-based model forimputing missing levels in partial conjoint profiles. J. MarketingRes. 41(4) 369–381.
Brynjolfsson, E., Y. Hu, M. Smith. 2003. Consumer surplus in thedigital economy: Estimating the value of increased productvariety. Management Sci. 49(11) 1580–1596.
Chen, C.-F. 1985. On asymptotic normality of limiting densityfunctions with bayesian implications. J. Roy. Statist. Soc. 47(3)540–546.
Chen, Y., J. Xie. 2008. Online consumer review: Word-of-mouth asa new element of marketing communication mix. ManagementSci. 54(3) 477–491.
Chevalier, J. A., A. Goolsbee. 2003. Measuring prices and price com-petition online: Amazon.com and BarnesandNoble.com. Quant.Marketing Econom. 1(2) 203–222.
Chevalier, J. A., D. Mayzlin. 2006. The effect of word of mouth onsales: Online book reviews. J. Marketing Res. 43(3) 345–354.
Das, S. R., M. Chen. 2007. Yahoo! for Amazon: Sentiment extractionfrom small talk on the Web. Management Sci. 53(9) 1375–1388.
Decker, R., M. Trusov. 2010. Estimating aggregate consumer pref-erences from online product reviews. Internat. J. Res. Marketing27(4) 293–307.
Dellarocas, C., N. Farag Awady, X. (Michael) Zhang. 2007. Explor-ing the value of online product ratings in revenue forecasting:The case of motion pictures. Working paper, Robert H. SmithSchool of Business, University of Maryland, College Park.
Duan, W., B. Gu, A. B. Whinston. 2005. Do online reviews mat-ter? An empirical investigation of panel data. Technical report,McCombs Research Paper Series, University of Texas at Austin,Austin.
Duda, R. O., P. E. Hart, D. G. Stork. 2000. Pattern Classification, 2nded. John Wiley & Sons, New York.
Eliashberg, J., S. K. Hui, Z. J. Zhang. 2007. From story line to boxoffice: A new approach for green-lighting movie scripts. Man-agement Sci. 53(6) 881–893.
Fellbaum, C. 1998. WordNet: An Electronic Lexical Database. MITPress, Cambridge, MA.
Forman, C., A. Ghose, B. Wiesenfeld. 2008. Examining the relation-ship between reviews and sales: The role of reviewer iden-tity disclosure in electronic markets. Inform. Systems Res. 19(3)291–313.
Frenkel, T. H., Y. Kim, M. Wedel. 2002. Bayesian prediction inhybrid conjoint analysis. J. Marketing Res. 39(2) 253–261.
Ghani, R., K. Probst, Y. Liu, M. Krema, A. Fano. 2006. Text mining forproduct attribute extraction. SIGKDD Explorations 1(8) 41–48.
Ghose, A., P. G. Ipeirotis. 2010. Estimating the helpfulness and eco-nomic inpact of product reviews: Mining text and reviewercharacteristics. IEEE Trans. Knowledge Data Engrg., IEEE Com-puter Society, Washington, DC. http//doi.ieeecomputersociety.org/10.1109/TKDE.2010.188.
Ghose, A., P. G. Ipeirotis, A. Sundararajan. 2007. Opinion min-ing using econometrics: A case study on reputation systems.Proc. 44th Annual Meeting Assoc. Comput. Linguistics (ACL 2007),Association for Computational Linguistics, Stroudsburg, PA,416–423.
Ghose, A., P. G. Ipeirotis, B. Li. 2011. Designing ranking systems forhotels on travel search engines by mining user-generated andcrowd-sourced content. Working paper, New York University,New York.
Ghose, A., A. Sundararajan. 2006. Evaluating pricing strategy usingecommerce data: Evidence and estimation challenges. Statist.Sci. 21(2) 131–142.
Gilbride, T. J., P. J. Lenk, J. D. Brazell. 2008. Market share constraintsand the loss function in choice-based conjoint analysis. Market-ing Sci. 27(6) 995–1011.
Godes, D., D. Mayzlin. 2004. Using online conversations to studyword-of-mouth communication. Marketing Sci. 23(4) 545–560.
Green, P., V. Srinivasan. 1978. Conjoint analysis in consumerresearch: Issues and outlook. J. Consumer Res. 5(2) 103–123.
Hansen, L. P. 1982. Large sample properties of generalized methodof moments estimators. Econometrica 50(4) 1029–1054.
Horsky, D., S. Misra, P. Nelson. 2006. Observed and unobservedpreference heterogeneity in brand-choice models. MarketingSci. 25(4) 322–335.
Hu, M., B. Liu. 2004. Mining and summarizing customer reviews.Proc. 10th ACM SIGKDD Internat. Conf. Knowledge Discovery andData Mining (KDD-2004), Association for Computing Machin-ery, New York, 168–177.
Hu, N., P. Pavlou, J. Zhang. 2008. Why do online productreviews have a J-shaped distribution? Overcoming biases inonline word-of-mouth communication. Working paper, Singa-pore Management University, Singapore.
Johnson, R. 1987. Adaptive conjoint analysis. Sawtooth Software Conf.Perceptual Mapping, Conjoint Anal. Comput. Interviewing, Saw-tooth Software, Sequim, WA.
Kohavi, R. 1995. A study of cross-validation and bootstrap for accu-racy estimation and model selection. Proc. 14th Internat. JointConf. Artificial Intelligence (IJCAI-95), American Association forArtificial Intelligence, Menlo Park, CA, 1137–1143.
Lee, T., E. Bradlow. 2007. Automatic construction of conjointattributes and levels from online customer reviews. Work-ing paper, The Wharton School, University of Pennsylvania,Philadelphia.

Archak, Ghose, and Ipeirotis: Deriving the Pricing Power of Product FeaturesManagement Science 57(8), pp. 1485–1509, © 2011 INFORMS 1509
Li, X., L. M. Hitt. 2008. Self-selection and information role of onlineproduct reviews. Inform. Systems Res. 19(4) 456–474.
Liu, B., M. Hu, J. Cheng. 2005. Opinion observer: Analyzing andcomparing opinions on the Web. Proc. 14th Internat. World WideWeb Conf. (WWW 2005), Chiba, Japan, 342–351.
Liu, Y. 2006. Word of mouth for movies: Its dynamics and impacton box office revenue. J. Marketing 70(3) 74–89.
Luan, J., S. Neslin. 2009. The development and impact of consumerword of mouth in new product diffusion. Working paper, TuckSchool of Business at Dartmouth, Hanover, NH.
Manning, C. D., H. Schütze. 1999. Foundations of Statistical NaturalLanguage Processing. MIT Press, Cambridge, MA.
Marshall, P., E. Bradlow. 2002. A unified approach to conjoint anal-ysis models. J. Amer. Statist. Assoc. 97(459) 674–682.
Moulton, B. R. 1986. Random group effects and the precision ofregression estimates. J. Econometrics 32(3) 385–397.
Nelson, P. 1970. Information and consumer behavior. J. PoliticalEconom. 78(2) 311–329.
Netzer, O., R. Feldman, M. Fresko, J. Goldenberg. 2011. Mine yourown business:market structure surveillance through text min-ing. Working paper, Columbia University, New York.
Pakes, A. 2003. A reconsideration of hedonic price indexes with anapplication to PCs. Amer. Econom. Rev. 93(5) 1578–1596.
Pang, B., L. Lee. 2008. Opinion mining and sentiment analysis.Foundations and Trends Inform. Retrieval 2(1–2) 1–135.
Roberts, J. H., G. L. Urban. 1988. Modeling multiattribute utility,risk, and belief dynamics for new consumer durable brandchoice. Management Sci. 34(2) 167–185.
Roodman, D. 2006. How to do xtabond2: An introduction to “differ-ence” and “system” GMM in Stata. Working Paper 103, Centerfor Global Development, Washington, DC.
Rosen, S. 1974. Hedonic prices and implicit markets: Product differ-entiation in pure competition. J. Political Econom. 82(1) 34–55.
Sargan, J. D. 1958. The estimation of economic relationships usinginstrumental variables. Econometrica 26(3) 393–415.
Sheng, V. S., F. Provost, P. Ipeirotis. 2008. Get another label? Improv-ing data quality and data mining using multiple, noisy label-ers. Proc. 14th ACM SIGKDD Internat. Conf. Knowledge Discov-ery and Data Mining (KDD-2007), Association for ComputingMachinery, New York, 614–622.
Snow, R., B. O’Connor, D. Jurafsky, A. Y. Ng. 2008. Cheap and fastbut is it good? evaluating non-expert annotations for naturallanguage tasks. Proc. Conf. Empirical Methods in Natural Lan-guage Processing (EMNLP 2008), Association for ComputationalLinguistics, Stroudsburg, PA, 254–263.
Srinivasan, V. 1988. A conjunctive-compensatory approach to theself-explication of multiattributed preferences. Decision Sci.19(2) 295–305.
Toubia, O., D. I. Simester, J. R. Hauser, E. Dahan. 2003. Fastpolyhedral adaptive conjoint estimation. Marketing Sci. 22(3)273–303.
Turney, P. D. 2002. Thumbs up or thumbs down? Semactic orienta-tion applied to unsupervised classification of reviews. Proc. 40thAnnual Meeting Assoc. Comput. Linguistics (ACL 2002), Associa-tion for Computational Linguistics, Stroudsburg, PA, 417–424.
Turney, P. D., M. L. Littman. 2003. Measuring praise and criticism:Inference of semantic orientation from association. ACM Trans.Inform. Systems 21(4) 315–346.
Villas-Boas, J. M., R. S. Winer. 1999. Endogeneity in brand choicemodels. Management Sci. 45(10) 1324–1338.
von Ahn, L., L. Dabbish. 2004. Labeling images with a computergame. CHI ’04: Proc. SIGCHI Conf. Human Factors Comput.Systems, Association for Computing Machinery, New York,319–326.
Windmeijer, F. 2005. A finite sample correction for the varianceof linear efficient two-step GMM estimators. J. Econometrics126(1) 25–51.