Derivatives Market - NSE · PDF fileISMR 183 Derivatives Market Derivatives Market...
32
ISMR www.nseindia.com 183 Derivatives Market Derivatives Market Introduction By their very nature Financial markets are volatile. Through the use of derivative products, it is possible to manage volatility and risks of faced by the financial agents. Given the different risk bearing capacity of them, with some of the agents being risk-averse and some risk-lover, derivatives emerged essentially to satisfy both of them. Derivatives are financial contracts whose values are derived from the value of an underlying primary financial instrument, commodity or index, such as: interest rates, exchange rates, commodities, and equities. Derivatives include a wide assortment of financial contracts, including forwards, futures, swaps and options. As per the definition of the International Monetary Fund, derivatives are “financial instruments that are linked to a specific financial instrument or indicator or commodity and through which specific financial risks can be traded in financial markets in their own right. The value of a financial derivative derives from the price of an underlying item, such as an asset or index. Unlike debt securities, no principal is advanced to be repaid and no investment income accrues.” Derivatives allow financial institutions and other participants to identify, isolate and manage separately the market risks in financial instruments and commodities for the purpose of hedging, speculating, arbitraging price differences and adjusting portfolio risks. The emergence of the market for derivative products, most notably forwards, futures and options, can be traced back to the 12 th century. At that time these were used exhaustively in agricultural markets. The primary motivation for pre-arranging a buyer/seller for a stock of commodities in early forward contracts was to lessen the possibility that large swings would inhibit marketing the commodity after a harvest. Subsequently, in the past few decades (post 1970s) derivatives have been used extensively in financial markets to respond to the increased volatility in exchange rates, interest rates. Through the use of derivative products, it has been possible to partially or fully transfer price risks by locking-in asset prices. As instruments of risk management, derivative products generally do not influence the fluctuations in the underlying asset prices. However, by locking-in asset prices, derivative products minimise the impact of fluctuations in asset prices on the profitability and cash flow situation of risk-averse investors. In recent years, the market for financial derivatives, both OTC as well as exchange traded, has grown both in terms of variety of instruments available, their complexity and also turnover. Need for a Derivatives Market The derivatives market performs a number of economic functions. 1. The prices in an organised derivatives market reflect the perception of market participants about the future and lead the prices of underlying to the perceived future level. The prices of derivatives normally would converge with the prices of the underlying at the expiration of derivative contract. Thus derivatives help in discovery of future as well as current prices.
Transcript of Derivatives Market - NSE · PDF fileISMR 183 Derivatives Market Derivatives Market...

ISMR
www.nseindia.com
183 Derivatives Market
Derivatives Market
IntroductionBy their very nature Financial markets are volatile. Through the use of derivative products, it
is possible to manage volatility and risks of faced by the financial agents. Given the different
risk bearing capacity of them, with some of the agents being risk-averse and some risk-lover,
derivatives emerged essentially to satisfy both of them. Derivatives are financial contracts whose
values are derived from the value of an underlying primary financial instrument, commodity
or index, such as: interest rates , exchange rates, commodities, and equities. Derivatives include
a wide assortment of financial contracts, including forwards, futures, swaps and options. As
per the definition of the International Monetary Fund, derivatives are “financial instruments thatare linked to a specific financial instrument or indicator or commodity and through which specific financialrisks can be traded in financial markets in their own right. The value of a f inancial derivative derivesfrom the price of an underlying item, such as an asset or index. Unlike debt securities, no principal is advancedto be repaid and no investment income accrues.” Derivatives allow financial institutions and other
participants to identify, isolate and manage separately the market risks in financial instruments
and commodities for the purpose of hedging, speculating, arbitraging price differences and
adjusting portfolio risks.
The emergence of the market for derivative products, most notably forwards, futures
and options, can be traced back to the 12th century. At that time these were used exhaustively in
agricultural markets. The primary motivation for pre-arranging a buyer/seller for a stock of
commodities in early forward contracts was to lessen the possibility that large swings would
inhibit marketing the commodity after a harvest. Subsequently, in the past few decades (post
1970s) derivatives have been used extensively in financial markets to respond to the increased
volatility in exchange rates, interest rates. Through the use of derivative products, it has been
possible to partially or fully transfer price risks by locking-in asset prices. As instruments of
risk management, derivative products generally do not influence the fluctuations in the underlying
asset prices. However, by locking-in asset prices , derivative products minimise the impact of
fluctuations in asset prices on the profitability and cash flow situation of risk-averse investors.
In recent years, the market for financial derivatives, both OTC as well as exchange traded,
has grown both in terms of variety of instruments available, their complexity and also turnover.
Need for a Derivatives MarketThe derivatives market performs a number of economic functions.
1. The prices in an organised derivatives market reflect the perception of market participants
about the future and lead the prices of underlying to the perceived future level. The prices
of derivatives normally would converge with the prices of the underlying at the expiration
of derivative contract. Thus derivatives help in discovery of future as well as current prices.

www.nseindia.com
ISMR Derivatives Market 184
2. The derivatives market helps to transfer risks from those who have them but may not
like them to those who have appetite for them i.e. transferring the risk from risk averse
people to risk oriented people.
3. Derivatives due to their inherent nature are linked to the underlying cash markets. With
the introduction of derivatives, the underlying market may witness higher trading volumes
because of participation by more players who would not otherwise participate for lack of
an arrangement to transfer risk.
4. Speculative trades may shift to a more controlled environment of derivatives market. In
the absence of an organised derivatives market, speculators trade in the underlying cash
markets. Margining, monitoring and surveillance of the activities of various participants
become extremely difficult in such mixed markets.
5. Derivatives markets help increase savings and investment in the long run. Transfer of
risk enables market participants to expand their volume of activity.
Products, Participants and FunctionsDerivative contracts have several variants. Some of them have been described herewith:
Forward contract is a customised contract between two entities, where settlement takes place on
a specific date in the future at today’s pre-agreed price.
Futures contract is an agreement between two parties to buy or sell an asset at a certain time in
the future at a certain price. Futures contracts are special types of forward contracts in the
sense that the former are standardized exchange-traded contracts.
Option contract are of two types – calls and puts. Call option give the buyer the right but not the
obligation to buy a given quantity of the underlying asset, at a given price on or before a given
future date. Whereas put option give the buyer the right, but not the obligation to sell a given
quantity of the underlying asset at a given price on or before a given date.
Swaps are private agreements between two parties to exchange cash flows in the future according
to a pre-arranged formula. The two commonly used swaps are:
• Interest rate swaps: These entail swapping only the interest related cash flows between
the parties in the same currency.
• Currency swaps: These entail swapping both principal and interest between the parties,
with the cash flows in one direction being in a different currency than those in the opposite
direction.
Warrants: All options having maturity above one year are called warrants. These are generally
traded over-the-counter.
LEAP the acronym for Long-term Equity Anticipation Securities are options having a maturity
of up to three years.
Swaptions are options to buy/sell a swap that will become operative at the expiry of the option.
Thus a swaption is an option on a forward swap. Rather than having calls and puts, the swaptions
market has receiver swaptions and payer swaptions. A receiver swaption is an option to receive
fixed and pay floating, whereas a payer swaption is an option to pay fixed and receive floating.

ISMR
www.nseindia.com
185 Derivatives Market
There are three broad categories of participants who trade in the derivatives market. They are
as discussed below:
Hedgers use futures or options markets to reduce or eliminate the risk associated with
price of an asset.
Speculators use futures and options contracts to get extra leverage in betting on future
movements in the price of an asset. They can increase both the potential gains and
potential losses by usage of derivatives in a speculative venture.
Arbitrageurs are in business to take advantage of a discrepancy between prices in two different
markets. If, for example, they see the futures price of an asset getting out of line with the
cash price, they will take offsetting positions in the two markets to lock in a profit.
Exchange-traded vs. OTC MarketsThe OTC market for derivative contracts has existed in some form or other since many years.
It is a negotiated and client specific market. The features of this market are as below:
i. The management of counter-party (credit) risk is decentralised and located within individual
institutions;
ii. There are no formal centralised limits on individual positions, leverage, or margining;
iii. There are no formal rules for risk and burden-sharing;
iv. There are no formal rules or mechanisms for ensuring market stability and integrity, and
for safeguarding the collective interests of market participants; and
v. OTC contracts are generally not regulated by a regulatory authority although they are
affected indirectly by national legal systems, banking supervision and market surveillance.
Some of the features of OTC derivatives markets can give rise to financial instability
affecting not only institutions but also the overall domestic financial markets. Thus it poses to
be a threat to the stability of the entire international financial system. Few of them are: (i) the
dynamic nature of gross credit exposures; (ii) information asymmetries; (iii) the effects of
OTC derivative activities on available aggregate credit; (iv) the high concentration of OTC
derivative activities in major institutions; and (v) the central role of OTC derivatives markets in
the global financial system. Sharp movements in underlying asset prices and counter-party
defaults give rise to instability, which apart from significantly altering the perceptions of current,
also alters potential future credit exposures. If the asset prices change rapidly, the size and
configuration of counter-party exposures may become unsustainably large and provoke a rapid
unwinding of positions.
There has been some progress in addressing these risks and perceptions. However, the
progress has been limited in implementing reforms in risk management, including counter-
party, liquidity and operational risks as they are outside the regulatory purview. In view of the
inherent risks associated with OTC derivatives, Indian law considers them illegal except for
specific contracts under FRAs/IRS on domestic currency as allowed by RBI.
Development of Derivatives Market in IndiaThe prohibition on options in securities was withdrawn with the promulgation of the Securities
Law (Amendment) Ordinance, 1995. This paved the way for introduction of derivatives in the
www.nseindia.com
ISMR Derivatives Market 186
Indian financial markets. On November 18, 1996, SEBI set up a 24-member Committee under
the Chairmanship of Dr. L. C. Gupta to develop appropriate regulatory framework for
derivatives trading in India. The Committee was of the view that derivatives should be declared
as ‘securities’ so that regulatory framework applicable to trading of ‘securities’ could be
extended to govern derivatives. Under the Chairmanship of Prof. J. R. Varma, SEBI set up
another group in June 1998 to recommend measures for risk containment in derivatives
market. The Report worked out the operational details of margining system, methodology
for charging initial margins, broker net worth, deposit requirement and real-time monitoring
requirements.
In December 1999, the Securities Contract Regulation Act [SC(R)A] was amended to include
derivatives within the ambit of ‘securities’. Thereafter a regulatory framework was developed
for governing the trading in derivatives. Derivatives were formally defined to include: (a) a securityderived from a debt instrument, share, loan whether secured or unsecured , risk instrument or contract fordifferences or any other form of security, and (b) a contract which derives its value from the prices, or indexof prices, or underlying securities. The Act also made it clear that derivatives are legal and valid, but
only if such contracts are traded on a recognised stock exchange. The Government also rescinded
in March 2000 the three-decade old notification, which prohibited forward trading in securities.
Derivatives trading commenced in India after SEBI granted the final approval to
commence trading and settlement in approved derivative contracts on the NSE and BSE.
NSE started operations in the derivatives segment on June 12, 2000. Initially, NSE introduced
futures contracts on S&P CNX Nifty index. However, the basket of instruments has widened
considerably. Now trading in futures and options is based on not only on S&P CNX Nifty
index, but also on CNX IT Index as well as options and futures on single stocks (currently on
51 stocks) and also futures on interest rates.
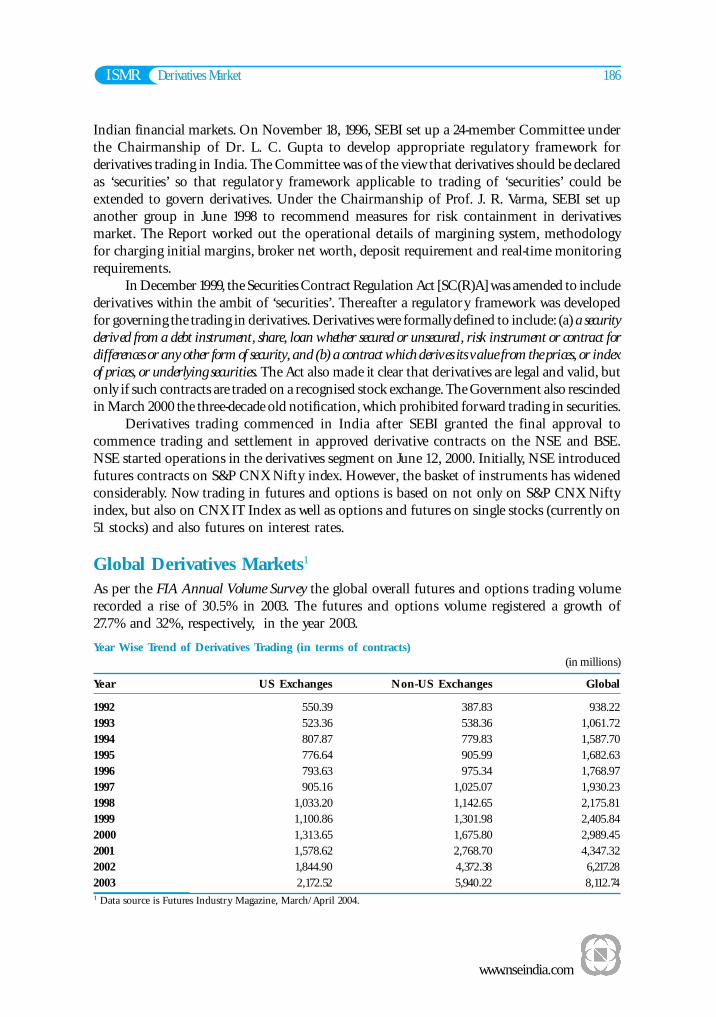
Global Derivatives Markets1
As per the FIA Annual Volume Survey the global overall futures and options trading volume
recorded a rise of 30.5% in 2003. The futures and options volume registered a growth of
27.7% and 32%, respectively, in the year 2003.
Year Wise Trend of Derivatives Trading (in terms of contracts)(in millions)
Year US Exchanges Non-US Exchanges Global
1992 550.39 387.83 938.22
1993 523.36 538.36 1,061.72
1994 807.87 779.83 1,587.70
1995 776.64 905.99 1,682.63
1996 793.63 975.34 1,768.97
1997 905.16 1,025.07 1,930.23
1998 1,033.20 1,142.65 2,175.81
1999 1,100.86 1,301.98 2,405.84
2000 1,313.65 1,675.80 2,989.45
2001 1,578.62 2,768.70 4,347.32
2002 1,844.90 4,372.38 6,217.28
2003 2,172.52 5,940.22 8,112.741 Data source is Futures Industry Magazine, March/April 2004.

ISMR
www.nseindia.com
187 Derivatives Market
The trading in equity derivatives has grown by 42% in 2003 as compared to the previous
year, followed by Interest rates registering growth of 27%.
Volume by Category(in millions)
GLOBAL 2003 2002 % Change
Equity Indices 3,960.87 2,791.18 41.91
Interest Rate 1,881.27 1,478.44 27.25
Individual Equities 1,558.52 1,354.70 15.05
Energy Products 261.15 199.39 30.97
Ag Commodities 217.56 209.37 3.91
Non-Precious Metals 90.39 71.57 26.30
Foreign Currency/Index 77.85 60.56 28.55
Precious Metals 64.46 51.26 25.75
Other 0.66 0.80 -17.50
Total Volume 8,112.73 6,217.28 30.49
The details for the top 20 contracts for the year 2003 are presented in Table 7-1. Kospi
200 options of KSE led the table with more than 2.8 billion contracts in 2003 followed by
Euro-Bond Futures of Eurex.
Table 7-1: Top 20 Contracts for the year 2003(in millions — net of individual equities)
Sl. Contract Exchange 2003 2002 Volume % ChangeNo. Change
1 Kospi 200 Options KSE 2,837.72 1,889.82 947.90 50.16
2 Euro-Bond Futures Eurex 244.41 191.26 53.15 27.79
3 3 Month Eurodollar Futures CME 208.77 202.08 6.69 3.31
4 TIIE 28 Futures MexDer 162.08 80.60 81.48 101.09
5 E-Mini S&P 500 Index Futures CME 161.18 115.74 45.44 39.26
6 Euro-Bobl Futures Eurex 150.09 114.68 35.41 30.88
7 10 Year T-Note Futures CBOT 146.75 95.79 50.96 53.20
8 3 Month Euribor Futures Euronext 137.69 105.76 31.93 30.19
9 Euro-Schatz Futures Eurex 117.37 108.76 8.61 7.92
10 DJ Euro Stoxx 50 Futures Eurex 116.04 86.35 29.69 34.38
11 3-Month Eurodollar Options CME 100.82 105.58 -4.76 -4.51
12 5-Year T-Note Futures CBOT 73.75 50.51 23.24 46.01
13 CAC 40 Index Options Euronext 73.67 84.34 -10.67 -12.65
14 E-Mini Nasdaq 100 Futures CME 67.89 54.49 13.40 24.59
15 30-Year T-Bond Futures CBOT 63.52 56.08 7.44 13.27
16 Kospi 200 Futures KSE 62.20 42.87 19.33 45.09
17 DJ Euro Stoxx 50 Options Eurex 61.79 39.48 22.31 56.51
18 No. I Soybean Futures DCE 60.00 12.69 47.31 372.81
19 3-Month Euribor Options Euronext 57.73 33.48 24.25 72.43
20 Interest Rate Futures BM&F 57.64 48.57 9.07 18.67
Source: FI Futures Industry, March/April 2004. The monthly magazine of the FIA.

www.nseindia.com
ISMR Derivatives Market 188
NSE, too, has been making huge strides by moving upwards in the global ranking.
NSEIL ranked second (2nd) next only to RTS Stock Exchange in the single stock future category
(Table 7-2). NSE has been ranked 20th in the global futures and options volume in 2003
against its rank of 33rd in the previous year (Table 7-3). In the top 40 Futures Exchanges of the
World, NSE stands at the 14th position (Table 7-4).
Table 7-2: Futures on Individual Equities (Stock Futures)(Number of Contracts)
Exchange 2002 2003
RTS Stock Exchange 21,320,434 31,782,174
National Stock Exchange of India 8,587,332 25,572,505
Spanish Exchange (BME) 12,645,186 12,492,568
Euronext 7,570,175 7,004,235
JSE South Africa 2,224,042 4,585,919
Helsinki 2,157,347 1,675,025
Stockholm 1,290,181 1,424,890
Budapest 452,638 618,261
Athens Derivatives Exchange 202,730 477,464
Borsa Italiana 59,853 468,083
Australian 412,535 267,630
Mumbai 28,339 103,936
Warsaw 92,097 93,055
SFE Corporation 29,286 47,822
Hongkong 21,056 18,654
Singapore 13,690 549
Copenhagen 1,170 310
Source: WFE 2003 Annual Report and Statistics.
Table 7-3: Global Futures and Options Volume
Rank Exchange Volume % Change
2003 2002 2002 2003
1 1 Korea Stock Exchange 1,932,749,868 2,899,937,895 50.04
2 2 Eurex 801,200,873 1,014,932,312 26.68
3 3 Euronext 696,323,560 694,970,981 -0.19
4 4 Chicago Mercantile Exchange 558,447,820 640,209,634 14.64
5 5 Chicago Board of Trade 343,882,529 454,190,749 32.08
6 6 Chicago Board Options Exchange 267,616,496 283,946,495 6.10
7 8 International Securities Exchange 152,399,279 244,968,190 60.74
8 7 American Stock Exchange 186,039,445 180,074,778 -3.21
9 11 Bovespa 90,884,897 177,223,140 95.00
10 14 Mexican Derivatives Exchange 84,274,979 173,820,944 106.25
11 9 New York Mercantile Exchange 133,744,435 137,225,439 2.60
12 10 BM&F 101,615,788 120,785,602 18.86
13 12 Philadelphia Stock Exchange 88,955,247 112,705,597 26.70
14 15 Tokyo Commodity Exchange 75,413,190 87,252,219 15.70

ISMR
www.nseindia.com
189 Derivatives Market
15 13 Pacific Exchange 85,426,649 86,152,637 0.85
16 18 Dalian Commodity Exchange 48,407,404 74,973,493 54.88
17 17 London Metal Exchange 58,634,004 72,308,327 23.32
18 16 OM 60,920,817 72,137,347 18.41
19 21 Sydney Futures Exchange 36,243,524 44,755,340 23.49
20 33 National Stock Exchange of India 13,287,113 43,081,968 224.2421 34 Shanghai Futures Exchange 12,173,083 40,079,750 229.25
22 19 Tel-Aviv Stock Exchange 41,419,705 38,098,479 -8.02
23 22 Singapore Exchange 32,887,395 35,648,224 8.39
24 24 International Petroleum Exchange 30,441,474 33,341,244 9.53
25 23 JSE Securities Exchange South Africa 30,966,583 33,001,743 6.57
26 36 Taiwan Futures Exchange 7,944,254 31,874,934 301.23
27 25 Central Japan Commodity Exchange 30,011,863 31,538,530 5.09
28 20 MEFF 41,382,257 31,471,330 -23.95
29 27 Osaka Securities Exchange 20,584,972 28,235,033 37.16
30 26 New York Board of Trade 20,928,479 24,832,158 18.65
31 28 Tokyo Grain Exchange 18,728,266 21,120,468 12.77
32 29 Italian Derivatives Market 17,246,629 17,731,994 2.81
33 32 Bourse de Montreal 14,491,971 17,682,999 22.02
34 30 Tokyo Stock Exchange 14,759,690 17,035,830 15.42
35 58 Australian Stock Exchange N/A 16,955,039 N/A
36 35 Hong Kong Exchanges & Clearing 11,029,404 14,546,213 31.89
37 31 Korea Futures Exchange 14,623,295 12,956,139 -11.40
38 37 Osaka Mercantile Exchange 5,207,652 6,162,589 18.34
39 51 Budapest Stock Exchange 1,072,966 4,939,893 360.40
40 39 Tokyo International Finance Futures Exchange 4,470,763 4,771,917 6.74
41 41 Oslo Stock Exchange 3,175,729 3,823,814 20.41
42 46 Budapest Commodity Exchange 1,624,401 3,673,978 126.17
43 38 Kansai Commodities Exchange 4,491,954 3,444,296 -23.32
44 40 Kansas City Board of Trade 3,326,836 3,099,805 -6.82
45 55 Rosario Futures Exchange 408,470 2,842,496 595.89
46 42 Fukuoka Futures Exchange 3,170,986 2,739,383 -13.61
47 49 Malaysia Derivatives Exchange 1,276,787 2,009,460 57.38
48 43 Helsinki Exchanges 2,644,358 1,968,343 -25.56
49 47 Yokohama Commodity Exchange 1,507,210 1,852,158 22.89
50 44 Winnipeg Commodity Exchange 2,193,283 1,842,776 -15.98
51 56 OneChicago 184,081 1,619,194 779.61
52 48 Wiener Borse 1,327,084 1,392,529 4.93
53 45 Broker Tec Futures Exchange 2,109,670 1,356,825 -35.69
54 50 Minneapolis Grain Exchange 1,262,769 1,133,731 -10.22
55 57 NQLX 90,091 858,900 853.37
56 53 Copenhagen Stock Exchange 536,796 762,050 41.96
57 52 New Zealand Futures Exchange 627,018 493,250 -21.33
58 54 MidAmerica Commodity Exchange 483,253 142,298 -70.55
Source: FI Futures Industry, March/April 2004. The monthly magazine of the FIA.
Table 7-3: Global Futures and Options Volume (Contd.)
Rank Exchange Volume % Change
2003 2002 2002 2003

www.nseindia.com
ISMR Derivatives Market 190
Table 7-4: Top 40 Futures Exchanges (Volume figures do not include options on futures)
Rank Exchange Volume % Change
2003 2002 2002 2003
1 1 Eurex 536,013,920 668,650,028 24.74
2 2 Chicago Mercantile Exchange 444,537,987 530,989,007 19.45
3 3 Chicago Board of Trade 276,316,047 373,669,290 35.23
4 4 Euronext 221,275,462 267,822,143 21.04
5 7 Mexican Derivatives Exchange 84,274,979 173,820,944 106.25
6 6 BM&F 95,912,579 113,895,061 18.75
7 5 New York Mercantile Exchange 107,359,719 111,789,658 4.13
8 8 Tokyo Commodity Exchange 75,413,190 87,252,219 15.70
9 10 Dalian Commodity Exchange 48,407,404 74,973,493 54.88
10 9 London Metal Exchange 56,303,779 68,570,154 21.79
11 11 Korea Stock Exchange 42,868,164 62,204,783 45.11
12 12 Sydney Futures Exchange 33,987,967 41,831,862 23.08
13 22 Shanghai Futures Exchange 12,173,083 40,079,750 229.25
14 25 National Stock Exchange of India 10,199,111 36,141,561 254.36
15 13 Singapore Exchange 32,623,190 35,356,776 8.38
16 14 International Petroleum Exchange 30,233,664 33,258,385 10.00
17 15 Central Japan Commodity Exchange 30,011,863 31,538,530 5.09
18 16 OM 20,208,149 22,667,198 12.17
19 17 Tokyo Grain Exchange 18,670,931 21,084,727 12.93
20 19 New York Board of Trade 16,272,144 18,822,048 15.67
21 18 MEFF 17,314,065 17,110,745 -1.17
22 21 Tokyo Stock Exchange 13,630,046 15,965,175 17.13
23 23 JSE Securities Exchange South Africa 11,233,002 14,947,523 33.07
24 24 Osaka Securities Exchange 11,134,754 13,231,287 18.83
25 20 Korea Futures Exchange 14,596,861 12,954,907 -11.25
26 26 Bourse de Montréal 8,058,498 10,676,279 32.48
27 28 Taiwan Futures Exchange 6,377,808 9,953,118 56.06
28 29 Hong Kong Exchanges & Clearing 6,228,037 8,174,652 31.26
29 27 Italian Derivatives Market 7,071,028 7,302,565 3.27
30 30 Osaka Mercantile Exchange 5,207,652 6,162,589 18.34
31 45 Budapest Stock Exchange 1,072,566 4,939,893 360.57
32 32 Tokyo International Financial Futures Exchange 4,470,763 4,771,917 6.74
33 31 Kansai Commodities Exchange 4,488,914 3,441,365 -23.34
34 42 Budapest Commodity Exchange 1,338,846 3,237,088 141.78
35 35 Fukuoka Futures Exchange 3,170,986 2,739,383 -13.61
36 50 Rosario Futures Exchange 399,432 2,708,313 578.04
37 36 Kansas City Board of Trade 2,755,949 2,634,424 -4.41
38 43 Malaysia Derivatives Exchange 1,276,787 2,009,460 57.38
39 41 Yokohama Commodity Exchange 1,507,210 1,852,158 22.89
40 39 Winnipeg Commodity Exchange 2,155,796 1,811,616 -15.97
Source: FI Futures Industry, March/April 2004. The monthly magazine of the FIA.
ISMR
www.nseindia.com
191 Derivatives Market
Policy DevelopmentsThis section discusses the policy developments initiated by the regulators and the Government
during April 2003 to June 2004.
I. Introduction of Exchange Traded Interest Rate Derivatives
A scheme for introduction of futures contracts on dated Government Security and Treasury
Bills and its risk containment measures have been framed by the SEBI in consultation with the
Government and the RBI. The product specifications and the risk containment measures are
as follows:
Product Specifications
i. The Exchange should initially introduce notional long bond (10-years maturity) and
T-bills futures. The notional underlying should be a coupon bond or/and a zero coupon
bond. The exchange should specify the coupon rate and disclose the same to the market
prior to introduction of the contracts. The minimum contract size of any interest rate
derivative contract should not be less than Rs. 2,00,000 at the time of the launch.
ii. The bonds should be quoted on the basis of prices, yields or 100-yield, initially up to
2 decimal points and after a period of two months since the introduction of the contract
up to 4 decimal points. Both the futures have to be initially settled in cash.
iii. The Exchanges are also permitted to introduce futures contracts on the notional bonds
up to a maturity of one year. They are given freedom to determine the maturity structures
of the contracts. There can either be quarterly contracts beyond the first three months,
and whether the quarters should be fixed or rolling months of the year.
iv. The final settlement price of the futures should be determined using a “zero couponyield curve (ZCYC)”. The ZCYC should be computed from the prices of government
securities traded on the Exchange/s or reported on the NDS of RBI or both.
Risk Containment Measures
The parameters for risk containment model include the following:
i. Initial Margin: The Initial Margin requirements should be based on the worst
scenario loss on a portfolio of a client to cover 99% VaR over one day horizon across
different possible price changes, based on the volatility estimates, and volatility changes.
The (σt) (sigma) should be estimated at the end of day using the previous volatility estimate
i.e. as at the end of t-1 day (σt - 1
), and the return (rt) observed in the futures market during
day t.
The formula should be (σt)2 = λ (σ
t - 1)2 + (1 - λ)(r
t)2 where (i) λ is a parameter which
determines how rapidly volatility estimates changes. The value of λ is fixed at 0.94 and
(ii) σ (sigma) means the standard deviation of daily returns in the interest rate futures
contract. In case of long bond futures, the price scan range should be 3.5σ and in no case
the initial margin should be less than 2% of the notional value of the contract. For T-Bill
futures, the price scan range should be 3.5σ and in no case the initial margin should be
less than 0.2% of the notional value of the contract.

www.nseindia.com
ISMR Derivatives Market 192
ii. Calendar Spread Charge: The Calendar spread margin is charged in addition to the
initial margin. For interest rate futures contracts a calendar spread margin should be at a
flat rate of 0.125% per month of spread on the far month contract subject to minimum
margin of 0.25% and a maximum margin of 0.75% on the far side of the spread with legs
up to 1 year apart.
iii. Exposure Limits: The notional value of gross open positions at any point in futures
contracts on the Notional 10 year bond and T-bill should not exceed 100 times and
1000 times the available liquid net worth of a member, respectively.
iv. Real Time Computation: Initially, the zero coupon yield curve should be computed at
the end of the day. However, the Exchange/yield curve provider should endeavour to
compute the ZCYC on a real time basis or at least several times during the course of the
day.
v. Margin Collection and Enforcement: The mark to market settlement margin should
be collected before start of the next day’s trading. If mark to market margins is not
collected before start of the next day’s trading, the clearing corporation/house should
collect correspondingly higher initial margin to cover the potential for losses over the
time elapsed in the collection of margins. The higher initial margin should be calculated
as specified in the Prof. J.R. Varma committee reports on risk containment measures for
index futures. The mark to market margin is to be paid in cash.
vi. Position Limits: The positions limits for interest rate futures contracts should be specified
at the client level and for the near month contracts. It should be Rs. 100 crore or 15% of
open interest whichever is higher.
II. Investments by FIIs/NRIs in Exchange Traded Derivative Contracts
The Foreign Exchange Management (Transfer or Issue of security by a Person Resident outside
India) Regulations 2000 have been amended to include that (i) a registered FII having a valid
account under FERA 1973 or under FEMA 1999 may trade in all SEBI approved exchange
traded derivative contracts (ii) a Non-Resident Indian (NRI) may also invest in exchange traded
derivative contracts out of INR funds held in India on non-repatriable basis. These investments
will however not be eligible for repatriation benefits.
In addition, the investments by FIIs/NRIs should be subject to the position limits as
specified by SEBI.
The FII position limit, which came into effect from October 31, 2003, is as follows:
• For stocks, in which the market wide position limit is less than or equal to Rs. 250 crore,
the FII position limit in such stock should be 20% of the market wide limit.
• The FII position limit in stock, in which the market wide position limit is greater than
Rs. 250 crore, should be Rs. 50 crore.
The position limits for NRIs should be as follows:
• For index based contracts, a disclosure is required for any person or persons acting in
concert who together owns 15% or more of the open interest of all derivative contracts
on a particular underlying index.

ISMR
www.nseindia.com
193 Derivatives Market
• For stock option and single stock futures contracts, the gross open position across all
derivative contracts on a particular underlying stock of a NRI should not exceed the
higher of 1% of the free float market capitalization (in terms of number of shares) OR
5% of the open interest in the derivative contracts on a particular underlying stock (in
terms of number of contracts).
This position limits would be applicable on the combined position in all derivative contracts
on an underlying stock at an exchange. The Exchange should monitor the position limits for
both of them. The NRI would be required to notify the Exchange the names of the Clearing
Member/s who will clear his derivative trades. The Exchange would then assign a unique client
code to the NRI.
III. Interest Rate Future Contracts
As per the recommendations of the SEBI Advisory Committee on Derivatives and Market
Risk Management, SEBI has also decided to permit interest rate futures contract on a “10 year
coupon bearing notional bond” which would be priced off a basket of bonds. The scheme for
introduction of such futures contract and the risk containment measures are as follows: -
Product Specification
a. With the prior approval of SEBI, the interest rate derivatives (IRD) contract could be
traded on the derivative exchange/segment and settled through the Clearing house/
corporation of the Exchange. The contracts should comply with the relevant requirements
as specified by SEBI.
b. The minimum contract size of the IRD contract should not be less than Rs. 2,00,000 at
the time of its introduction in the market.
c. The interest rate futures contract on a 10 year coupon bearing notional bond should be
priced on the basis of the ‘Yield To Maturity’ (YTM) of a basket comprising bonds
with maturity ranging from 9 to 11 years. The basket should comprise of at least three
bonds and the YTM of the basket should be a simple average of each bond’s YTM in the
basket. The Exchanges have to prescribe the precise formula, including the day count
and other conventions, for arriving at the YTM’s of the bonds constituting the basket.
d. The interest rate futures contract should be with a maximum maturity of 12 months and
be settled through cash. The Exchange should decide the nature of contracts; it can have
quarterly contracts beyond the first three months, or the quarters could be fixed months
of the year or rolling quarterly horizon from the contract introduction date.
e. The features of the notional bond including, the coupon rate should be disclosed to the
market in advance and should form a part of the contract specification.
f. The composition of the basket of bonds should be disclosed to the market prior to the
launch of the futures contract. The Exchange should specify the eligibility criteria for
selecting the bonds constituting the basket. It should also review the eligibility criteria
and the basket at periodic intervals. The eligibility criteria should be based on volume,
turnover etc., and should be disclosed to the market.
g. The price of the futures contract should be quoted and traded as 100 minus the YTM of
the basket.

www.nseindia.com
ISMR Derivatives Market 194
h. For the purpose of computing the final settlement price, the Exchange should disclose,
in advance, the methodology for arriving at the YTMs of the bonds, comprising the
basket.
i. The final settlement price of the notional bond should be obtained by discounting the
cash flows of the notional bond at the YTM of the basket. The precise formulas for
arriving at the settlement price, including, the day count and other conventions, should
be fully disclosed to the market.
j. The Exchange should specify the parameters to determine whether a bond constituting
the basket is illiquid. For this purpose an illiquid bond should be one where, in the opinion
of the Exchange, the volumes and/or turnover in a bond are not sufficient to reflect the
fair price of the bond. In the event that bonds comprising the basket become illiquid
during the life of the contract the following measures should be adopted:
• In case a bond is illiquid for 7 consecutive days excluding the shut period, reconstitution
of the basket should be attempted. In case reconstitution of the basket is not possible,
the YTM of the basket should be determined from the YTMs of the remaining bonds
for arriving at the final settlement price and the daily closing price.
• Polled prices should be used for determining the final settlement price and the daily
closing price, when at least 2 out of the 3 bonds comprising the basket become
illiquid. Polling should be carried out by the Exchange in a transparent manner and
the prices of bond constituting the basket should be regularly polled and published.
The methodology of polling should also be disclosed to the market.
Risk Containment Measures
The portfolio based margining system presently applicable to the exchange traded equity and
interest rate derivative contracts is to be extended to the interest rate futures contracts. The
margins should be computed by taking an integrated view comprising positions of a client in
all the derivative contracts.
IV. Issuance of Offshore Derivative Instruments by Registered FIIs
In February 2004, SEBI amended the SEBI (FII) Regulations, 1995 to include a new regulation
which states that “a FII or sub-account may issue, deal in or hold, offshore derivative instruments
such as Participatory Notes (P-Notes), Equity Linked Notes (ELN) or any other similar
instruments against underlying securities, listed or proposed to be listed on any stock exchange
in India, only in favour of those entities which are regulated by any relevant authority in the
countries of their incorporation or establishment, subject to compliance of “Know your client”
requirement, provided that if any such instrument has already been issued, prior to
February 2004, to a person other than a regulated entity, contract for such transaction should
expire on maturity of the instrument or within a period of five years from February 3, 2004
whichever is earlier”.
V. Minimum Contract Size for Exchange Traded Derivative Contracts
It was observed that with the increase/decrease in prices of underlying stock, the contract
size/value of most derivative contracts far exceeded or fell below the stipulated value of

ISMR
www.nseindia.com
195 Derivatives Market
Rs. 2 lakh. To address these concerns, SEBI revoked the stipulation that the lot size/multiplier
should be in the multiple of 100. Earlier, SEBI vide its circulars had stipulated that the minimum
contract size of derivative contracts and its value should not be less than Rs. 2 lakh. The lot size
should be in the multiples of 100 and the fractions, if any should be rounded off to the next
higher multiple of 100. Therefore, SEBI decided that the lot size/multiplier should be reduced
for contracts with value exceeding Rs. 2 lakh and should be increased for contracts with
value less than Rs. 2 lakh. For instance, the derivative contracts , which have a contract size/
value of Rs. 4 lakh and above, the lot size/multiplier should be reduced to one-half of the
existing lot size/multiplier and for derivative contracts that have a contract size/value of
Rs. 8 lakh and above, the lot size/multiplier should be reduced to one-fourth of the existing lot
size/multiplier.
Similarly, where the contract size of the derivative contracts is less than Rs. 2 lakh, for
the sake of standardization, the existing lot size/multiplier should be increased so as to
bring the contract size to Rs. 2 lakh. The increase should be carried out by increasing the lot
size/multiplier in multiples of 2. For the purpose of revising the contract size, the contract
size/value should be determined on the basis of the closing prices of the underlying on the day
prior to the beginning of the notice period.
Market DesignOnly the NSE and the BSE offer a platform for trading in derivatives contracts. Over the years,
however, statistics show that the BSE’s contribution to the total derivatives turnover in the
market has been declining. Hence, the market design enumerated in this section is the derivative
segment of NSE (called Futures and Options (F&O) segment).
Trading MechanismThe derivatives trading system at NSE is called NEAT-F&O system, which provides a fully
automated screen-based, anonymous order driven trading system for derivatives on a nationwide
basis. It provides tremendous flexibility by allowing users to place orders with their own time
and price related conditions. Nevertheless, trading in derivatives segment is essentially similar
to that of CM segment.
There are four entities in the trading system:
1. Trading members: Trading members can trade either on their own account or on behalf of
their clients including participants. They are registered as members with NSE and are
assigned an exclusive Trading member ID.
2. Clearing members: Clearing Members are members of NSCCL. They carry out risk
management activities and confirmation/inquiry of trades through the trading system.
These clearing members are also trading members and clear trades for themselves and/
or others.
3. Professional clearing members: A professional clearing member (PCM) is a clearing member
who is not a trading member. Typically, banks and custodians become PCMs and clear
and settle for their trading members.
4. Participants: A participant is a client of trading members like financial institutions. These
clients may trade through multiple trading members, but settle their trades through a
single clearing member only.

www.nseindia.com
ISMR Derivatives Market 196
Membership CriteriaThe members are admitted by NSE for its F&O segment in accordance with the rules and
regulations of the Exchange and the norms specified by the SEBI. NSE offers a composite
membership of two types for trading in the derivatives segment viz., membership of ‘CM and
F&O segment’ or of ‘CM, WDM and F&O segment’. Trading and clearing members are admitted
separately. While, the trading members (TMs) execute the trades, the clearing members (CM)
do the clearing for all his TMs, undertake risk management and perform actual settlement. The
eligibility criteria for membership on F&O segment are summarized in Table 7-5(a & b). The
trading members are required to have qualified users and sales persons, who have passed a
certification programme approved by SEBI. At the end of March 2004, there were 589 members
in the F&O segment.
Contract SpecificationsThe index futures and index options contracts traded on NSE are based on S&P CNX Nifty
Index and the CNX IT Index, while stock futures and options are based on individual securities.
Presently stock futures and options are available on 51 securities. Interest rate future contracts
are available on notional 91 day T-bill and 10 year bonds (6% coupon bearing and zero coupon
bond). While the index options are European style, stock options are American style. There are
a minimum of 5 strike prices, two ‘in-the-money’, one ‘at-the-money’ and two ‘out-of-the-money’ for
every call and put option. The strike price is the price at which the buyer has a right to purchase
Table 7-5 A: Eligibility Criteria for Membership on F&O Segment of NSE
Particulars New Members Existing
CM and F&O CM, WDM Members
Segment and F&OSegment
Net Worth1 Rs. 100 lakh Rs. 200 lakh Rs. 100 lakh
Interest Free Security Deposit (IFSD)2 Rs. 125 lakh Rs. 275 lakh Rs. 8 lakh
Collateral Security Deposit (CSD)2 Rs. 25 lakh Rs. 25 lakh —
Annual Subscription Rs. 1 lakh Rs. 2 lakh Rs. 1 lakh
Note: 1. Net worth of Rs. 300 lakh is required for clearing membership.
2. Additional Rs. 25 lakh is required for clearing membership. In addition, the clearing member is required
to bring in IFSD of Rs. 2 lakh and CSD of Rs. 8 lakh per trading member in the F&O segment.
Table 7-5 B: Requirements for Professional Clearing Membership
Particulars F&O Segment CM and F&O Segment
Eligibility Trading members of NSE/SEBI registered
custodians/recognised banks
Net Worth Rs. 300 lakh
Interest Free Security Deposit (IFSD) Rs. 25 lakh Rs. 34 lakh
Collateral Security Deposit (CSD) Rs. 25 lakh Rs. 50 lakh
Annual Subscription Nil Rs. 2.5 lakh
Note: The PCM is required to bring in IFSD of Rs. 2 lakh and CSD of Rs. 8 lakh per trading member in the
F&O segment.
Source: NSE.

ISMR
www.nseindia.com
197 Derivatives Market
or sell the underlying. Contract specification for derivatives contracts are summarized in
Annexure 7-1.
In respect of equity derivatives , at any point of time, contracts with 1 month,
2 months and 3 months to expiry are available for trading. These contracts expire on last
Thursday of their respective expiry months. A new contract is introduced on the next trading
day following the expiry of the near month contract. All the derivatives contracts are presently
cash settled.
The interest rate future contracts are available for a period of one-year maturity with
three months continuous contracts and fixed quarterly contracts for the entire year. New
contracts are introduced on the trading day following the expiry of the near month contract.
These contracts expire on the last Thursday of the expiry month. In case of last Thursday
being a holiday, the contracts expire on the previous trading day.
ChargesThe maximum brokerage chargeable by a TM for the trades effected in the contracts entered
on the F&O segment is fixed at 2.5% of the contract value in case of index futures and stock
futures. In case of index options and stock options, it is 2.5% of notional value of the contract
[(Strike price + Premium) * Quantity)] in case of index options. The brokerages charged are
exclusive of statutory levies.
The transaction charges payable by the trading member for the trades executed by him
on the F&O segment are fixed at Rs. 2 per lakh of turnover (0.002%) subject to a minimum of
Rs. 1 lakh per year.
The trading members contribute to Investor Protection Fund of F&O segment at the
rate of Rs. 10 per crore of turnover (0.0001%).
Basket Trading FacilityTo ease the arbitrage between futures and cash markets, NSE has provided basket-trading
facility. This enables generation of portfolio offline order files in the derivatives trading system
and its execution in the cash segment. A trading member can buy or sell a portfolio through a
single order. Once he determines its size, the system automatically works out the quantity of
each security to be bought or sold in proportion to their weights in the portfolio.
Clearing and SettlementNational Securities Clearing Corporation Limited (NSCCL) undertakes clearing and settlement
of all trades executed on the futures and options (F&O) segment of the NSE. It also acts as
legal counterparty to all the trades on the F&O segment and guarantees their settlement. The
Clearing and Settlement process comprises of three main activities viz., Clearing, Settlement
and Risk Management.
Clearing Mechanism
The first step in clearing process is working out open positions and obligations of clearing
(self-clearing/trading-cum-clearing/professional clearing) members. The open positions in the
contracts traded of CMs are arrived at by aggregating the open positions of all the TMs and all
custodial participants (CPs) clearing through him. The open position of a TM is arrived at by

www.nseindia.com
ISMR Derivatives Market 198
summing up his proprietary open position and his clients’ open positions. While entering orders
on the trading system, TMs identify the orders as either proprietary or client through ‘Pro/Cli’
indicator provided in the order entry screen. Proprietary positions are calculated on net basis
for each contract and that of clients’ are arrived at by summing together net positions of each
individual client. A TM’s open position is the sum of proprietary open position, client open
long position and client open short position. Table 7-6 illustrates determination of open position
of a CM, who clears for two TMs having two clients.
Settlement Mechanism
The underlying for index futures/options on the index cannot be delivered, therefore, they
have to be settled in cash. Futures and options on individual securities can be delivered as in the
spot market. However, it has been currently mandated that stock options and futures would
also be cash settled. The settlement amount for a clearing member is netted across all their
TMs/clients, across various settlements. For the purpose of settlement, all CMs are required to
open a separate bank account with NSCCL designated clearing banks for F&O segment.
Settlement of Futures Contracts on Index or Individual Securities
Futures contracts have two types of settlements, the MTM settlement which is done on a daily
basis, and the final settlement, which is on the last trading day of the futures contracts.
• MTM Settlement
All futures contracts for each member are mark-to-market (MTM) to the daily settlement
price of the relevant futures contracts at the end of each day. The clearing members who
have a loss position are required to pay MTM loss amount in cash, which is passed on to
the clearing members who have made a MTM profit. This is known as the daily mark-to-
market settlement. Clearing members are responsible to collect and settle the daily MTM
profits/losses incurred by the TMs and their clients. In turn, TMs are responsible to
collect/pay losses/profits from/to their clients by the next day. The pay-in and pay-out
of the mark-to-market settlement are affected on the day following the trade day (T+1).
After completion of daily settlement computations, all the open positions are reset to the
daily settlement price. These positions become the open positions for the next day.
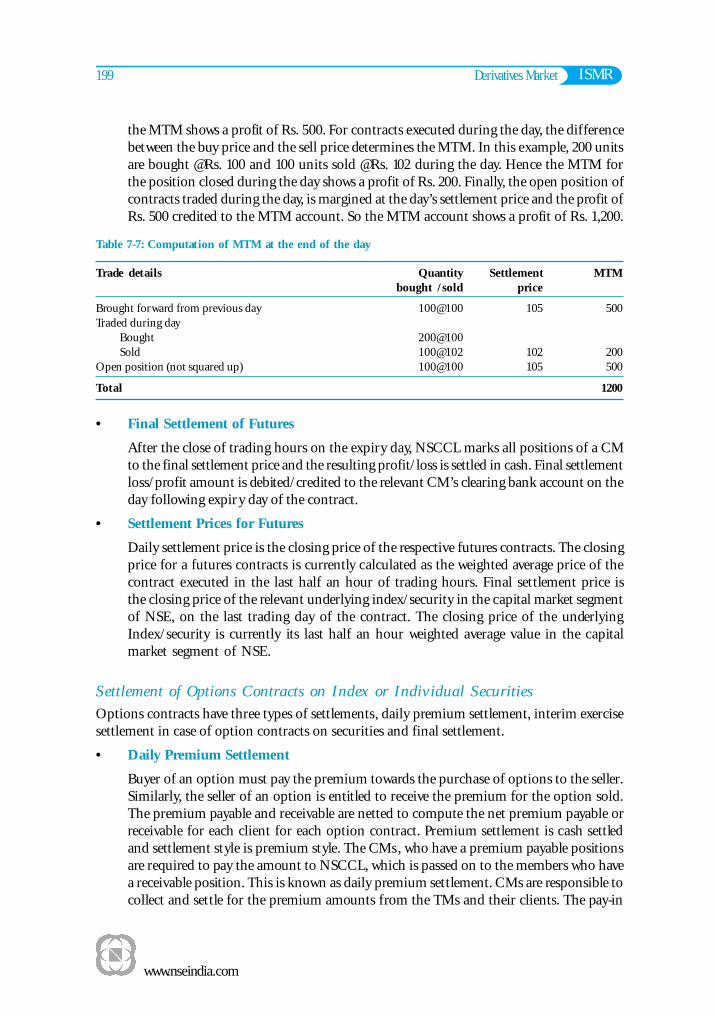
The settlement price for the contract for today is assumed to be 105. The table 7-7 gives
the MTM charged on various positions. The margin charged on the brought forward
contract is the difference between the previous day’s settlement price of Rs. 100 and
today’s settlement price of Rs. 105. Hence on account of the position brought forward,
Table 7-6 : Determination of Open Position of a Clearing Member
TMs clearing Proprietary Trades: Trades: Openthrough CM Trades Client 1 Client 2 Position
Buy Sell Net Buy Sell Net Buy Sell Net Long Short
ABC 4000 2000 2000 3000 1000 2000 4000 2000 2000 6000 —
PQR 2000 3000 -1000 2000 1000 1000 1000 2000 -1000 1000 2000
Total 6000 5000 2000 5000 2000 3000 5000 4000 2000 7000 2000-1000 -1000
ISMR
www.nseindia.com
199 Derivatives Market
the MTM shows a profit of Rs. 500. For contracts executed during the day, the difference
between the buy price and the sell price determines the MTM. In this example, 200 units
are bought @Rs. 100 and 100 units sold @Rs. 102 during the day. Hence the MTM for
the position closed during the day shows a profit of Rs. 200. Finally, the open position of
contracts traded during the day, is margined at the day’s settlement price and the profit of
Rs. 500 credited to the MTM account. So the MTM account shows a profit of Rs. 1,200.
• Final Settlement of Futures
After the close of trading hours on the expiry day, NSCCL marks all positions of a CM
to the final settlement price and the resulting profit/loss is settled in cash. Final settlement
loss/profit amount is debited/credited to the relevant CM’s clearing bank account on the
day following expiry day of the contract.
• Settlement Prices for Futures
Daily settlement price is the closing price of the respective futures contracts. The closing
price for a futures contracts is currently calculated as the weighted average price of the
contract executed in the last half an hour of trading hours. Final settlement price is
the closing price of the relevant underlying index/security in the capital market segment
of NSE, on the last trading day of the contract. The closing price of the underlying
Index/security is currently its last half an hour weighted average value in the capital
market segment of NSE.
Settlement of Options Contracts on Index or Individual Securities
Options contracts have three types of settlements, daily premium settlement, interim exercise
settlement in case of option contracts on securities and final settlement.
• Daily Premium Settlement
Buyer of an option must pay the premium towards the purchase of options to the seller.
Similarly, the seller of an option is entitled to receive the premium for the option sold.
The premium payable and receivable are netted to compute the net premium payable or
receivable for each client for each option contract. Premium settlement is cash settled
and settlement style is premium style. The CMs, who have a premium payable positions
are required to pay the amount to NSCCL, which is passed on to the members who have
a receivable position. This is known as daily premium settlement. CMs are responsible to
collect and settle for the premium amounts from the TMs and their clients. The pay-in
Table 7-7: Computation of MTM at the end of the day
Trade details Quantity Settlement MTMbought /sold price
Brought forward from previous day 100@100 105 500
Traded during day
Bought 200@100
Sold 100@102 102 200
Open position (not squared up) 100@100 105 500
Total 1200

www.nseindia.com
ISMR Derivatives Market 200
and pay-out of the premium settlement is on T+1 day. The premium payable and
receivable are directly debited/credited to the CMs clearing bank account.
• Interim Exercise Settlement
Interim exercise settlement takes place only for option contracts on securities. An investor
can exercise his in-the-money options at any time during trading hours. Interim exercise
settlement is effected for such options at the close of the trading hours. Valid exercised
option contracts are assigned to short positions in the option contract with the same
series (i.e. having the same underlying, same expiry date and same strike price) randomly
at the client level. The CM, who has exercised the option, receives the exercise settlement
value per unit of the option from the CM. The interim exercise settlement value is the
difference between the strike price and the settlement price of the relevant option contract.
Exercise settlement value is debited/credited to the relevant CMs clearing bank account
on T+2 day (T=exercise date).
• Final Exercise Settlement
Final exercise settlement is effected for option at in-the-money strike prices existing at
the close of trading hours on the day of expiry. All long positions at in-the-money strike
prices are automatically assigned randomly to short positions in option contracts with
the same series. Index options are exercised using European style, while stock options
using American style. Final Exercise is Automatic on expiry of the option contracts.
Final settlement loss/profit amount for option contracts on Index is debited/credited to
the relevant CMs clearing bank account on T+1 day (T=expiry day). On the other hand,
final settlement loss/profit amount for option contracts on Individual Securities is
debited/credited to the relevant CMs clearing bank account on T+2 day (T=expiry day).
Open positions, in option contracts, cease to exist after their expiration day.
Settlement of Interest Rate Futures
Daily and Final Mark to Market settlement of interest rate futures contracts are also cash
settled. All positions (brought forward, created during the day, closed out during the day) in
futures contracts, at the end of trading hours, should be marked to market at the Daily Settlement
Price. And on the last trading day it should be marked to market at Final Settlement Price for
settlement. Daily settlement price should be the closing price of the relevant futures contract
for the trading day. Final settlement price should be based on the value of the notional bond
determined using the ZCYC computed by the Exchange.
• Daily Settlement Price: Daily settlement price is the closing price of the interest rate
futures contracts on the trading day. The closing price for the contract is calculated on
the basis of the weighted average price of the contracts executed in the last half an hour
of trading in these contracts. In the absence of trading in the last half an hour, the
theoretical price is taken or such other price as may be decided by the relevant authority
from time to time.
Theoretically, the daily settlement price for unexpired futures contracts should be the
futures prices computed using the (price of the notional bond) spot prices arrived at
from the applicable ZCYC Curve. The ZCYC should be computed by the Exchange or
by any other approved agency from the prices of securities either traded on the Exchange

ISMR
www.nseindia.com
201 Derivatives Market
or reported on the Negotiated Dealing System of RBI or both taking trades of same day
settlement (i.e. t = 0).
For zero coupon notional bonds, the price should be the present value of the principal
payment discounted using discrete discounting for the specified period at the respective
zero coupon yield. The settlement price for the notional T-bill should be 100 minus the
annualized yield for the specified period using the zero coupon yield curve. In respect of
coupon bearing notional bond, the present value should be obtained as the sum of present
value of the principal payment discounted at the relevant zero coupon yield and the
present values of the coupons obtained by discounting each notional coupon payment at
the relevant zero coupon yield for that maturity. For this purpose the notional coupon
payment date should be half yearly and commencing from the date of expiry of the
relevant futures contracts. For computation of futures prices , the rate of interest to be
used may be the relevant MIBOR rate or such other rate as may be specified from time to
time.
• Final Settlement Price: Final settlement price for an interest rate futures contracts on
zero coupon notional and coupon bearing bond is based on the price of the bond
determined using the zero coupon yield curve. In respect of notional T-bill it should be
100 minus the annualized yield for the specified period computed using the ZCYC.
• Since the T-bills are priced at 100 minus the relevant annualized yield, the settlement value
should be arrived at using the relevant multiplier factor.
Settlement of Custodial Participant (CP) Deals
NSCCL provides a special facility to Institutions/Foreign Institutional Investors (FIIs)/MFs
to execute trades through any TM, but cleared and settled by their own CM. They are known as
Custodial Participants (CPs). To avail of this facility, a CP is required to register with NSCCL
through his CM. A unique CP code is allotted to him by NSCCL. All trades executed by a CP
through any TM are required to have the CP code in the relevant field on the trading system at
the time of order entry itself. These trades have to be confirmed by their own CM within the
time specified by NSE through the on-line confirmation facility on the same day. Only then he
is responsible for clearing and settling of deals of such custodial clients. Unless CP confirms
the trade, the same is considered as a trade of the TM and the responsibility of settlement of
such trade vests with CM of the TM.
FIIs have been permitted to trade in all the exchange traded derivative contracts within
the position limits prescribed for them and their sub-accounts. A FII/a sub-account of the
FII, intending to trade in the F&O segment of the exchange, are required to obtain a unique
Custodial Participant (CP) code from the NSCCL. The FII/sub-account of FII should ensure
that all orders placed by them on the Exchange carry the relevant CP code allotted by NSCCL.
Risk Management
NSCCL has developed a comprehensive risk containment mechanism for the F&O segment.
The salient features of risk containment mechanism on the F&O segment are:
1. Since financial soundness is a key to risk management, NSCCL has set stringent conditions
for membership in terms of capital adequacy (net worth, security deposits).

www.nseindia.com
ISMR Derivatives Market 202
2. NSCCL charges an upfront initial margin for all the open positions of a CM on
a daily basis. The CM in turn collects the initial margin from the TMs and their respective
clients.
3. The open positions of the members are marked to market based on contract settlement
price for each contract. The difference is settled in cash on a T+1 basis.
4. A CM’s open positions are monitored on a real-time basis using NSCCL’s on-line position
monitoring system. The positions limits for each CM are set on the basis of his capital
deposits and whenever a CM reaches the position limit the on-line position monitoring
system generates alerts. NSCCL monitors the CMs for MTM value violations, while TMs
are monitored for contract-wise position limit violations. It has also put in place a system
which tracks on real time basis the client level portfolio based upfront margining and
monitoring.
5. CMs are provided with a trading terminal for the purpose of monitoring the open positions
of all the TMs, who clear and settle through him. A CM may set exposure limits for his
TM. NSCCL assists the CM to monitor the intra-day exposure limits set up by a CM and
whenever a TM exceed the limits, it stops that particular TM from further trading.
6. A member is alerted of his position to enable him to adjust his exposure or bring in
additional capital. Position violations by the CM result in disablement of trading facility
for all TMs of a CM.
7. A separate settlement guarantee fund for this segment has been created.
The most critical component of risk containment mechanism for F&O segment is the
margining system and on-line position monitoring. The actual position monitoring and margining
is carried out on-line through Parallel Risk Management System (PRISM). PRISM uses SPAN®2
(Standard Portfolio Analysis of Risk).
Risk Management for Interest Rate Futures
Initial margin should be payable on real time basis on all open positions of Clearing Members
in accordance with the system adopted by Clearing Corporation. Presently, the initial margins
are based on the zero coupon yield curve computed at the end of the day. However, in case of
large deviation between the yields generated using only t=0 trades and all trades, initial margins
are to be revised accordingly.
Initial Margin should include SPAN margins and any other additional margins that may
be specified by Clearing Corporation. Clearing Corporation has to adopt SPAN (Standard
Portfolio Analysis of Risk) system or any other system for the purpose of real time initial
margin computation.
Initial margin requirements should be based on 99% VaR over a one day time horizon. In
case of futures contracts, if it may not be possible to collect mark to market settlement value,
before the commencement of trading on the next day, the initial margin may be computed over
a two day time horizon. The methodology for computation of VaR percentage should be as
per the recommendations of SEBI.
2 SPAN® is a registered trademark of the Chicago Mercantile Exchange (CME) used here under licence.

ISMR
www.nseindia.com
203 Derivatives Market
The Initial margin for a member is to be computed taking into consideration requirements
such as : (a) client positions should be netted at the level of individual client and grossed across
all clients for the Trading/Clearing Member, however, without any set offs between clients
(b) proprietary positions should be netted at Trading/Clearing Member level without any set
offs between client and proprietary positions.
For this purpose, various parameters should be as specified hereunder:
(a) Price Scan Range: In the case of Notional Bond Futures, the price scan range should
be 3.5 sigma (3.5 σ) and in no case the initial margin should be less than 2% of the
notional value of the Futures Contracts, which should be scaled up by look ahead period.
For Notional T-Bill Futures , the price scan range should be same as for notional bond
futures, but in no case the initial margin should be less than 0.2% of the notional value of
the futures contracts.
(b) Calendar Spread Charge: The margin on calendar spread should be calculated at a flat
rate of 0.125% per month of spread on the far month contract subject to a minimum
margin of 0.25% and a maximum margin of 0.75% on the far side of the spread with
legs upto 1 year apart. A Calendar spread positions will be treated as non-spread (naked)
positions in the far month contract, 3 trading days prior to expiration of the near
month contract.
Exposure Limits (2nd line of defense): Clearing Members should be subject to Exposure
limits in addition to initial margins. Exposure Limit should be 100 times the liquid net
worth i.e. 1% of the notional value of the gross open positions in Notional 10 year
bond futures (both coupon bearing and zero coupon) and should be 1000 times the
liquid net worth i.e. 0.1% of the gross open positions in notional 91 day T-Bill futures.
Exposure limit for calendar spreads should be regarded as an open position of one third
of the mark to market value of the far month contract. As the near month contract
approaches expiry, the spread should be treated as a naked position in the far month
contract three days prior to the expiry of the near month contract.
Trading Member wise/Custodial Participant wise Position Limit: Each Trading Member/
Custodial Participant should ensure that his clients do not exceed the specified position
limit. The position limits should be at the client level for near month contracts should
be 15% of the open interest or Rs. 100 crore, whichever is higher. For futures contracts
open interest should be equivalent to the open positions in that futures contracts
multiplied by its last available closing price.
NSE–SPAN®
The objective of NSE–SPAN® is to identify overall risk in a portfolio of all futures and
options contracts for each member. The system treats futures and options contracts uniformly,
while at the same time recognizes the unique exposures associated with options portfolios, like
extremely deep out-of-the-money short positions and inter-month risk. Its overriding objective
is to determine the largest loss that a portfolio might reasonably be expected to suffer from
one day to the next day based on 99% VaR methodology. SPAN considers uniqueness of
option portfolios. The following factors affect the value of an option:
1. Underlying market price
2. Strike price

www.nseindia.com
ISMR Derivatives Market 204
3. Volatility (variability) of underlying instrument
4. Time to expiration
5. Interest rate
As these factors change, the value of options within the portfolio also changes. Thus,
SPAN constructs scenarios of probable changes in underlying prices and volatilities in order to
identify the largest loss, a portfolio might suffer from one day to the next. Then it sets the
margin requirement to cover this one-day loss. These complex calculations (e.g. the pricing of
options) are executed using SPAN. The results of these calculations are called risk arrays. Risk
arrays and other data inputs required for margin calculation are provided to members daily in a
file called the SPAN risk parameter file. Members can apply the data contained in the risk
parameter files, to their specific portfolios of futures and options contracts, to determine their
SPAN margin requirements. Hence, members need not execute complex option pricing
calculations, which are performed by NSCCL.
Margins
The margining system for F&O segment is explained below:
! Initial Margin: Margin in the F&O segment is computed by NSCCL upto client level for
open positions of CMs/TMs. These are required to be paid up-front on gross basis at
individual client level for client positions and on net basis for proprietary positions. NSCCL
collects initial margin for all the open positions of a CM as computed by NSE-SPAN.
A CM is required to ensure collection of adequate initial margin from his TMs up-front,
in turn the TM collects it from his clients.
! Premium Margin: In addition to initial margin, premium margin is charged at client level.
This margin is required to be paid by a buyer of an option till the premium settlement
is complete.
! Assignment Margin for Options on Securities: Assignment margin is levied in addition to
initial margin and premium margin. It is required to be paid on assigned positions of
CMs towards interim and final exercise settlement obligations for option contracts on
individual securities, till such obligations are fulfilled. The margin is charged on the net
exercise settlement value payable by a CM towards interim and final exercise settlement.
! Client Margins: NSCCL intimates all members of the margin liability of each of their
client. Additionally members are also required to report details of margins collected from
clients to NSCCL, which holds in trust client margin monies to the extent reported by
the member as having been collected from their respective clients.
Margin/Position Limit Violations
PRISM, the Parallel Risk Management System, is the real-time position monitoring and risk
management system for the F&O market segment. The risk of each trading and clearing member
is monitored on a real time basis by generating various alerts whenever a CM exceeds any limits
set up by NSCCL. These are detailed below:
! Initial Margin Violation: The initial margin is computed on a real time basis i.e. for each
trade the amount of initial margin is reduced from the effective deposits of the CM held
with the clearing corporation. For this purpose, effective deposits are computed by reducing

ISMR
www.nseindia.com
205 Derivatives Market
the total deposits of the CM by Rs. 50 lakh (referred to as minimum liquid net worth).
The CM receives warning messages on his terminal when 70%, 80% and 90% of the
effective deposits are utilized. At 100% the clearing facility provided to a CM is automatically
withdrawn. Withdrawal of clearing facility of a CM in case of a violation leads to automatic
withdrawal of trading facility for all TMs and/or custodial participants clearing and settling
through such CM.
Similarly, the initial margins on positions taken by a TM is also computed on a real-
time basis and compared with the TM limits set by his CM. As the TM limit is used up
to 70%, 80%, and 90%, the member receives a warning message on his terminal. At
100%, the trading facility provided to the TM is automatically withdrawn.
A member is provided with adequate warnings on the violation before his trading/
clearing facility is withdrawn. A CM may appropriately reduce his exposure to contain
the violation or alternately bring in additional capital.
! Member-wise Position Limit Violation: The member-wise position limit on open position of
a TM is supervised by PRISM. The open position in all index futures and index
option contracts of any TM, cannot exceed 15% of the total open interest of the market
or Rs. 100 crore, whichever is higher at any time, including during trading hours. The open
positions in all the futures and option contracts on the same underlying security of any TM,
cannot exceed 7.5% of the total open interest of the market or Rs. 50 crore, whichever is
higher, at any time, including during trading hours. For futures contracts , open interest is
equivalent to the open positions in the futures contracts multiplied by last available traded
price or closing price, as the case may be. For option contracts, open interest is equivalent
to the notional value, which is computed by multiplying the open position in that option
contracts multiplied with the last available closing price of the underlying.
! Exposure Limit Violation: PRISM monitors exposure of members on all futures and
option contracts, which cannot exceed 33.33 times the liquid net worth for index options
and index futures contracts. For option and futures contracts on individual securities,
the exposure limits of, which is higher, 5% or 1.5 standard deviation of the notional
value of gross open position in futures on individual securities and gross short open
positions in options on individual securities in a particular underlying should be
collected/adjusted from the liquid networth of a member on a real time basis.
! Market-wide Position Limit Violation: PRISM monitors market wide position limits for
futures and option contracts on individual securities. The open position across all
members, across all contracts cannot exceed lower of the following limits: 30 times the
average number of shares traded daily in the previous calendar month or 10% of the
number of shares held by non-promoters in the relevant underlying security i.e. 10% of
the free float in terms of the number of shares of a company. When the total open
interest in an option contract, across all members, reaches 80% of the market wide
position limit for a contract, the price scan range and volatility scan range (for SPAN
margin) are doubled. NSCCL specifies the market-wide position limits once every month,
at the beginning of the month, which is applicable for the subsequent month.
! Client-wise Position Limit Violation: Whenever the open position of any client exceeds 1%
of the free float market capitalization (in terms of no. of shares) or 5% of the open

www.nseindia.com
ISMR Derivatives Market 206
interest (in terms of number of shares) whichever is higher, in all the futures and option
contracts on the same underlying security, then it is termed as client-wise position limit
violation. The TM/CM through whom the client trades/clears his deals should be liable
for such violation and penalty may be levied on such TM/CM which he may in turn
recover from the client. In the event of such a violation, TM/CM should immediately
ensure that the client does not take fresh positions and reduces the positions of those
clients within the permissible limits.
! Misutilisation of TM/Constituent’s Collateral and/or Deposit: It is a violation, if a CM utilize
the collateral of one TM and/or constituent towards the exposure and/or obligations of
another TM and/or constituent.
! Violation of Exercised Positions: NSCCL verifies whether open long positions for CM/TM
and/or constituent exist in relation to option contracts , which are exercised by a
CM/TM, before initiating exercise processing. If the contracts are exercised without
open positions, then such cases are treated as violations.
Market OutcomeTrading VolumesAs mentioned earlier, the derivatives are traded only on two exchanges , the NSE and the BSE
(Table 7-8). The total exchange traded derivatives volume witnessed a sharp rise to Rs. 21,422,690
million during 2003-04 as against Rs. 4,423,333 million during the preceding year. NSE emerged
as a market leader in the Indian Market by accounting for about 99.5% of total turnover. Since
more than 99% of volumes came from NSE, the further detailed analysis is based on NSE data.
During 2003-04, the F&O segment of NSE reported a total turnover for Rs. 21,306,492
million as against Rs. 4,398,548 million during the preceding year. The number of contracts
Table 7-8: Trade Details of Derivatives Market*
Month/Year NSE BSE TOTAL
No. of Turnover No. of Turnover No. of TurnoverContracts (Rs. mn.) Contracts (Rs. mn.) Contracts (Rs. mn.)
Traded Traded Traded
Apr-03 2,205,470 500,196 5,280 873 2,210,750 501,069
May-03 2,252,050 534,233 1,155 229 2,253,205 534,462
Jun-03 2,750,294 730,173 423 92 2,750,717 730,265
Jul-03 3,720,563 1,098,495 4,718 1,031 3,725,281 1,099,526
Aug-03 4,314,098 1,403,625 23,634 5,090 4,337,732 1,408,715
Sep-03 5,481,939 1,851,509 34,274 8,509 5,516,213 1,860,018
Oct-03 5,989,205 2,303,645 30,668 8,574 6,019,873 2,312,219
Nov-03 4,769,938 1,921,714 31,337 9,287 4,801,275 1,931,001
Dec-03 5,724,035 2,389,067 107,545 36,840 5,831,580 2,425,907
Jan-04 6,976,023 3,240,630 103,573 37,869 7,079,596 3,278,499
Feb-04 5,696,541 2,728,392 22,212 7,299 5,718,753 2,735,691
Mar-04 7,006,620 2,604,813 17,439 505 7,024,059 2,605,318
2003-04 56,886,776 21,306,492 382,258 116,198 57,269,034 21,422,690
*: For NSE, data pertains to Index Futures, Stock Futures, Index Options , Stock Options and Futures on Interest
Rates.
Source: NSE and SEBI Bulletin.

ISMR
www.nseindia.com
207 Derivatives Market
traded in 2003-04 amounted to 569 lakh as against 168 lakh in the previous year. The
segment witnessed a record turnover of Rs. 219,213 million on January 28, 2004. The monthly
turnover increased from Rs. 500,196 million in April 2003 to Rs. 2,604,813 million in
March 2004. The average daily turnover increased from Rs. 25,010 million in April 2003 to
Rs. 118,401 million in March 2004. The business growth of the F&O segment is presented
in Annexure 7-2. It is evident from the statistics as presented in the Annexure 7-2 and the
Chart 7-1 that the futures are more popular than options; contracts on securities are more
popular than those on indices; and call options are more popular than put options.
During the year, Mumbai contributed nearly 47.8% of total turnover. The contributions
from Delhi and Kolkata were 25.5% and 11.3% respectively (Table 7-9).
Table 7-9: City-wise Distribution of Turnover of F&O Segment of NSE 2003-04
Sl. Location Share in Turnover (%)No. 2002-03 2003-04
1. Mumbai 41.20 47.812. Delhi/Ghaziabad 20.31 25.453. Calcutta/Howrah 15.16 11.324. Ahmedabad 2.11 2.795. Hyderabad/Secunderabad/Kukatpally 0.97 2.076. Chandigarh/Mohali/Panchkula 2.00 2.067. Chennai 2.24 1.858. Cochin/Ernakulam/Parur/Kalamserry/Alwaye 0.63 1.079. Bangalore 1.19 0.72
10. Ludhiana 0.99 0.6111. Indore 0.38 0.5712. Jaipur 1.89 0.5113. Baroda 0.71 0.4914. Rajkot 0.36 0.4515. Pune 0.31 0.3416. Agra 0.53 0.2017. Coimbatore 0.44 0.1618. Lucknow 0.21 0.1419. Trivandrum 0.13 0.1320. Surat 0.47 0.1221. Tenali 0.09 0.09
22. Others 7.69 1.05
Total 100.00 100.00
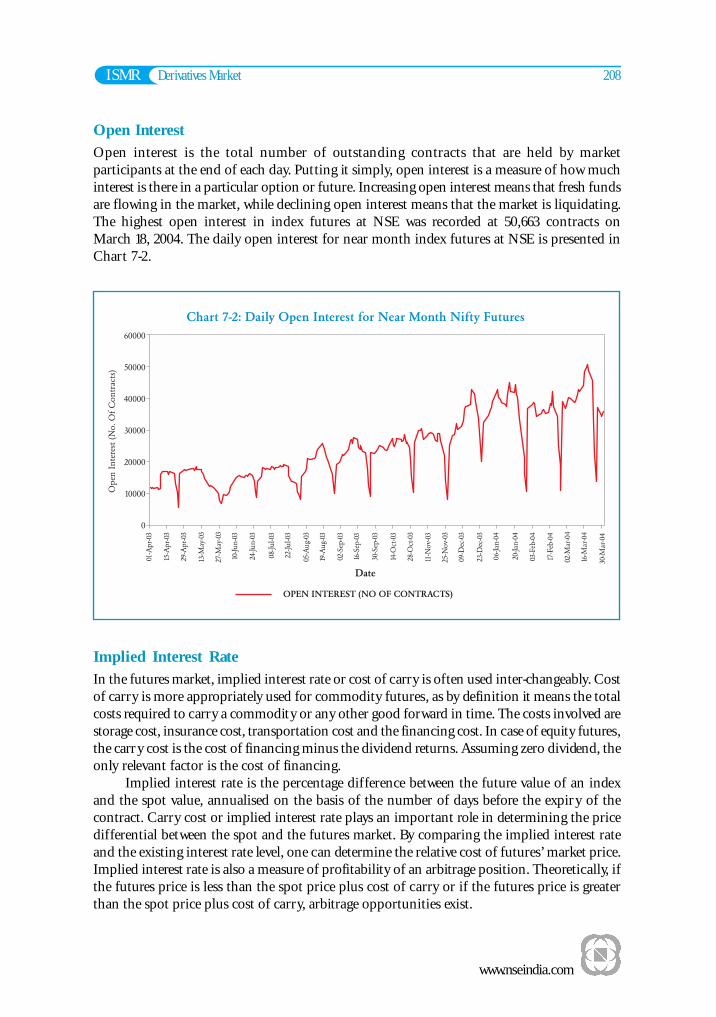
www.nseindia.com
ISMR Derivatives Market 208
Open InterestOpen interest is the total number of outstanding contracts that are held by market
participants at the end of each day. Putting it simply, open interest is a measure of how much
interest is there in a particular option or future. Increasing open interest means that fresh funds
are flowing in the market, while declining open interest means that the market is liquidating.
The highest open interest in index futures at NSE was recorded at 50,663 contracts on
March 18, 2004. The daily open interest for near month index futures at NSE is presented in
Chart 7-2.
Implied Interest RateIn the futures market, implied interest rate or cost of carry is often used inter-changeably. Cost
of carry is more appropriately used for commodity futures, as by definition it means the total
costs required to carry a commodity or any other good forward in time. The costs involved are
storage cost, insurance cost, transportation cost and the financing cost. In case of equity futures,
the carry cost is the cost of financing minus the dividend returns. Assuming zero dividend, the
only relevant factor is the cost of financing.
Implied interest rate is the percentage difference between the future value of an index
and the spot value, annualised on the basis of the number of days before the expiry of the
contract. Carry cost or implied interest rate plays an important role in determining the price
differential between the spot and the futures market. By comparing the implied interest rate
and the existing interest rate level, one can determine the relative cost of futures’ market price.
Implied interest rate is also a measure of profitability of an arbitrage position. Theoretically, if
the futures price is less than the spot price plus cost of carry or if the futures price is greater
than the spot price plus cost of carry, arbitrage opportunities exist.

ISMR
www.nseindia.com
209 Derivatives Market
The futures prices are available for different contracts at different points of time.
Chart 7-3 presents Nifty futures close prices for the near month contracts, and the spot Nifty
close values from April 2003 to March 2004. The difference between the future and the spot
price is called basis. As the time to expiration approaches, the basis reduces. Daily implied
interest rate for Nifty futures from April 2003 to March 2004 is presented in Chart 7-4.

www.nseindia.com
ISMR Derivatives Market 210
The implied interest rate for near month Nifty futures as on last trading of the month is
presented in Table 7-10.
Implied VolatilityVolatility is one of the important factors, which is taken into account while pricing options.
It is a measure of the amount and the speed of price change. To estimate future volatility, a
time series analysis of historical volatility may be carried out to know the future movements
of the underlying. Alternatively, one could work out implied volatility by entering all parameters
into an option pricing model and then solving it for volatility. For example, the Black Scholes
model solves for the fair price of the option by using the following parameters-days to expiry,
strike price, spot price, volatility of underlying, interest rate, and dividend. This model could
be used in reverse to arrive at implied volatility by putting the current price of the option
prevailing in the market.
Putting it simply, implied volatility is the estimate of how volatile the underlying will be
from the present until the currency of option. If volatility is high, then the options premiums
are relatively expensive and vice-versa. However, implied volatility estimate can be biased,
especially if they are based upon options that are thinly traded samples.
Prof. J. R. Varma (“Mispricing of Volatility in the India Index Options Market”, Working
Paper 2002-04-01, April 2002, IIM, Ahmedabad) has estimated the option prices and implied
volatility from the Black formula. It was found that for about 6.5% of all calls and about 7.5%
of all puts, implied volatility was undefined because the option traded below its intrinsic value.
Volatility SmileThe volatility smile is the relation between the implied volatility and the strike price of the
same maturity. Normally the smiles for equity options have a downward sloping curve and
they look alike for both put and call option. However, Prof. J. R. Varma in his paper “Mispricing
of Volatility in the India Index Options Market”, Working Paper 2002-04-01, April 2002, IIM,
Ahmedabad found V shaped smiles and the smiles markedly different for puts and calls. He
estimated volatility smiles separately for put and call options and established that the smiles
are sharply different for calls and puts. The implied probability distribution is more highly
peaked and has (except for deep-in-the-money calls) thinner tails than the normal distribution
Table 7-10: Implied Interest Rate for Near Month Nifty Futures (April 2003 - March 2004)
Month Expiry Date Closing Closing Spot Impliedof near month Future Price Interest
Contract Price Rate (%)
Apr-03 29-May-2003 930.65 934.05 -4.59May-03 26-Jun-2003 999.35 1006.80 -10.04Jun-03 31-Jul-2003 1123.60 1134.15 -11.00Jul-03 31-Jul-2003 1187.35 1185.85 NAAug-03 25-Sep-2003 1358.80 1356.55 2.24Sep-03 30-Oct-2003 1418.25 1417.10 0.99Oct-03 27-Nov-2003 1559.45 1555.90 3.08Nov-03 24-Dec-2003 1619.95 1615.25 4.08Dec-03 29-Jan-2004 1888.30 1879.75 5.71Jan-04 26-Feb-2004 1814.85 1809.75 3.80Feb-04 25-Mar-2004 1804.80 1800.30 3.37
Mar-04 29-Apr-2004 1765.55 1771.90 -4.52
Note: (1) The implied interest rate is calculated on the last trading day of the month for Near Month Nifty Futures.(2) Number of days in a year have been taken as 365.
Source: NSE.
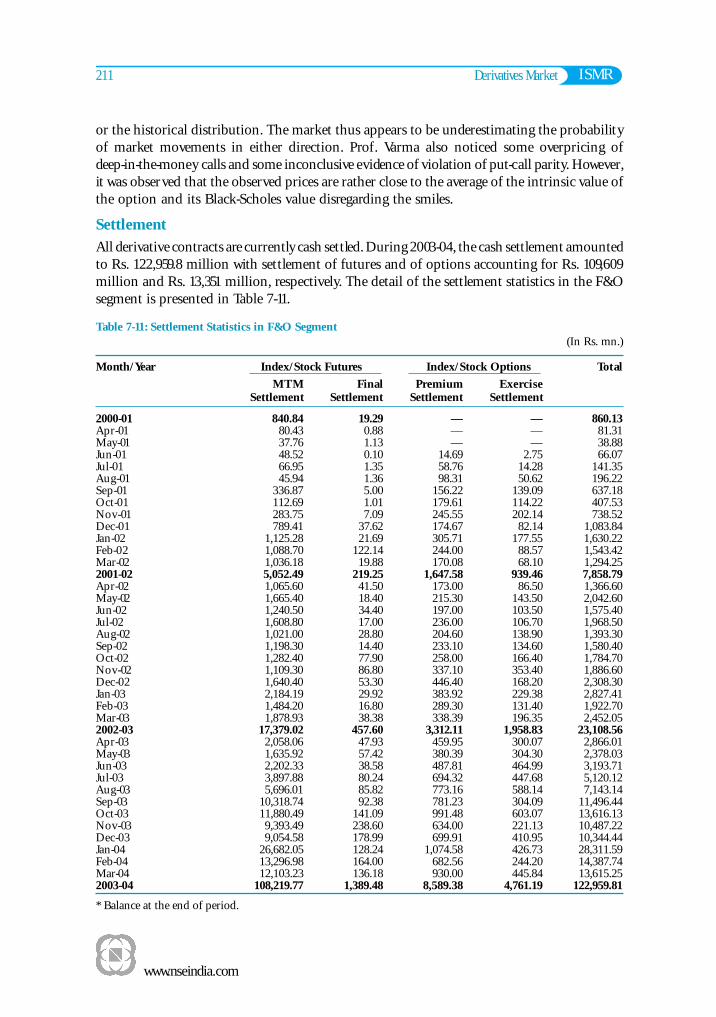
ISMR
www.nseindia.com
211 Derivatives Market
or the historical distribution. The market thus appears to be underestimating the probability
of market movements in either direction. Prof. Varma also noticed some overpricing of
deep-in-the-money calls and some inconclusive evidence of violation of put-call parity. However,
it was observed that the observed prices are rather close to the average of the intrinsic value of
the option and its Black-Scholes value disregarding the smiles.
SettlementAll derivative contracts are currently cash settled. During 2003-04, the cash settlement amounted
to Rs. 122,959.8 million with settlement of futures and of options accounting for Rs. 109,609
million and Rs. 13,351 million, respectively. The detail of the settlement statistics in the F&O
segment is presented in Table 7-11.
Table 7-11: Settlement Statistics in F&O Segment(In Rs. mn.)
Month/Year Index/Stock Futures Index/Stock Options Total
MTM Final Premium ExerciseSettlement Settlement Settlement Settlement
2000-01 840.84 19.29 — — 860.13Apr-01 80.43 0.88 — — 81.31May-01 37.76 1.13 — — 38.88Jun-01 48.52 0.10 14.69 2.75 66.07Jul-01 66.95 1.35 58.76 14.28 141.35Aug-01 45.94 1.36 98.31 50.62 196.22Sep-01 336.87 5.00 156.22 139.09 637.18Oct-01 112.69 1.01 179.61 114.22 407.53Nov-01 283.75 7.09 245.55 202.14 738.52Dec-01 789.41 37.62 174.67 82.14 1,083.84Jan-02 1,125.28 21.69 305.71 177.55 1,630.22Feb-02 1,088.70 122.14 244.00 88.57 1,543.42Mar-02 1,036.18 19.88 170.08 68.10 1,294.252001-02 5,052.49 219.25 1,647.58 939.46 7,858.79Apr-02 1,065.60 41.50 173.00 86.50 1,366.60May-02 1,665.40 18.40 215.30 143.50 2,042.60Jun-02 1,240.50 34.40 197.00 103.50 1,575.40Jul-02 1,608.80 17.00 236.00 106.70 1,968.50Aug-02 1,021.00 28.80 204.60 138.90 1,393.30Sep-02 1,198.30 14.40 233.10 134.60 1,580.40Oct-02 1,282.40 77.90 258.00 166.40 1,784.70Nov-02 1,109.30 86.80 337.10 353.40 1,886.60Dec-02 1,640.40 53.30 446.40 168.20 2,308.30Jan-03 2,184.19 29.92 383.92 229.38 2,827.41Feb-03 1,484.20 16.80 289.30 131.40 1,922.70Mar-03 1,878.93 38.38 338.39 196.35 2,452.052002-03 17,379.02 457.60 3,312.11 1,958.83 23,108.56Apr-03 2,058.06 47.93 459.95 300.07 2,866.01May-03 1,635.92 57.42 380.39 304.30 2,378.03Jun-03 2,202.33 38.58 487.81 464.99 3,193.71Jul-03 3,897.88 80.24 694.32 447.68 5,120.12Aug-03 5,696.01 85.82 773.16 588.14 7,143.14Sep-03 10,318.74 92.38 781.23 304.09 11,496.44Oct-03 11,880.49 141.09 991.48 603.07 13,616.13Nov-03 9,393.49 238.60 634.00 221.13 10,487.22Dec-03 9,054.58 178.99 699.91 410.95 10,344.44Jan-04 26,682.05 128.24 1,074.58 426.73 28,311.59Feb-04 13,296.98 164.00 682.56 244.20 14,387.74Mar-04 12,103.23 136.18 930.00 445.84 13,615.252003-04 108,219.77 1,389.48 8,589.38 4,761.19 122,959.81
* Balance at the end of period.

www.nseindia.com
ISMR Derivatives Market 212
Policy DebatesDerivatives are being traded in India for about more than three years now. After a subdued
start, the trading volumes have picked up substantially thereafter. Some of the financial experts
and market participants are of the opinion that the full potential of the market is yet to be
realized. Few policy debates regarding the derivatives market are as discussed below:
Further Products
Derivatives trading in India have so far been introduced in a fairly limited range of products.
Index futures and options are available only on S&P CNX Nifty, CNX IT Index and BSE
Sensex, options and futures on individual stocks are available only on select 51 securities.
However, conceptually, there is no limit to the range of derivative products as can be seen from
the international experience. After the market gains some more familiarity with derivative
products, the logical next step would be to consider expanding the basket of derivative products
based on various other instruments available in financial markets. The index futures/options
could be extended to other popular indices, such as the Nifty Junior and Defty. Stock
futures/options could be extended to all active securities. The possibility of introducing
derivatives based on the exchange rate, interest rate and gold as the underlying could also be
explored.
Cross Margining
Cross-margining takes into account a member/client’s combined position across
products/market segments. This would imply that a member’s margin with an exchange for
one market could be used against the margin requirements of another market. Cross-margining
thus results in a far more efficient use of a member’s capital for trading in related products and
in more than one market. A clearing corporation can easily compute and levy a single net
margin amount based upon offsetting positions in different products/markets/exchanges.
In fact, the L. C. Gupta Committee which had suggested the regulatory framework for derivatives,
had recommended that cross margining (between spot and derivatives market) should
eventually be allowed, as this would optimally use resources. A SEBI constituted advisory
committee on derivatives under the chairmanship of Prof. J. R. Varma is currently looking into
cross margining.
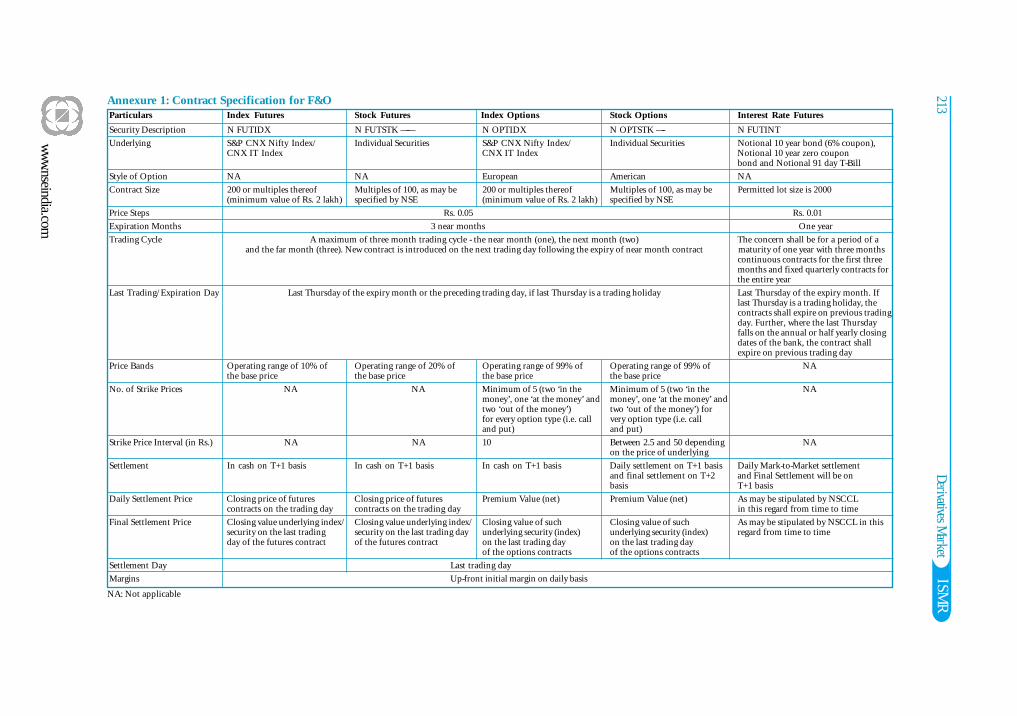
ISMR
ww
w.nseindia.com
213Derivatives M
arket
Annexure 1: Contract Specification for F&OParticulars Index Futures Stock Futures Index Options Stock Options Interest Rate Futures
Security Description N FUTIDX N FUTSTK —— N OPTIDX N OPTSTK —- N FUTINT
Underlying S&P CNX Nifty Index/ Individual Securities S&P CNX Nifty Index/ Individual Securities Notional 10 year bond (6% coupon),CNX IT Index CNX IT Index Notional 10 year zero coupon
bond and Notional 91 day T-Bill
Style of Option NA NA European American NA
Contract Size 200 or multiples thereof Multiples of 100, as may be 200 or multiples thereof Multiples of 100, as may be Permitted lot size is 2000(minimum value of Rs. 2 lakh) specified by NSE (minimum value of Rs. 2 lakh) specified by NSE
Price Steps Rs. 0.05 Rs. 0.01
Expiration Months 3 near months One year
Trading Cycle A maximum of three month trading cycle - the near month (one), the next month (two) The concern shall be for a period of aand the far month (three). New contract is introduced on the next trading day following the expiry of near month contract maturity of one year with three months
continuous contracts for the first threemonths and fixed quarterly contracts forthe entire year
Last Trading/Expiration Day Last Thursday of the expiry month or the preceding trading day, if last Thursday is a trading holiday Last Thursday of the expiry month. Iflast Thursday is a trading holiday, thecontracts shall expire on previous tradingday. Further, where the last Thursdayfalls on the annual or half yearly closingdates of the bank, the contract shallexpire on previous trading day
Price Bands Operating range of 10% of Operating range of 20% of Operating range of 99% of Operating range of 99% of NAthe base price the base price the base price the base price
No. of Strike Prices NA NA Minimum of 5 (two ‘in the Minimum of 5 (two ‘in the NAmoney’, one ‘at the money’ and money’, one ‘at the money’ andtwo ‘out of the money’) two ‘out of the money’) forfor every option type (i.e. call very option type (i.e. calland put) and put)
Strike Price Interval (in Rs.) NA NA 10 Between 2.5 and 50 depending NAon the price of underlying
Settlement In cash on T+1 basis In cash on T+1 basis In cash on T+1 basis Daily settlement on T+1 basis Daily Mark-to-Market settlementand final settlement on T+2 and Final Settlement will be onbasis T+1 basis
Daily Settlement Price Closing price of futures Closing price of futures Premium Value (net) Premium Value (net) As may be stipulated by NSCCLcontracts on the trading day contracts on the trading day in this regard from time to time
Final Settlement Price Closing value underlying index/ Closing value underlying index/ Closing value of such Closing value of such As may be stipulated by NSCCL in thissecurity on the last trading security on the last trading day underlying security (index) underlying security (index) regard from time to timeday of the futures contract of the futures contract on the last trading day on the last trading day
of the options contracts of the options contracts
Settlement Day Last trading day
Margins Up-front initial margin on daily basis
NA: Not applicable

www.nseindia.com
ISMR Derivatives Market 214
An
nex
ure
7-2:
Bus
ines
s G
row
th o
f D
eriv
ativ
es S
egm
ent
Mon
th/
Inde
x Fu
ture
sSt
ock
Futu
res
Inte
rest
Rat
e Fu
ture
s I
nde
x O
ptio
ns
Stoc
k O
ptio
ns
Tot
alA
vera
geO
pen
Int
eres
tYe
arD
aily
at t
he
end
ofN
o. o
fT
urn
over
No.
of
Tu
rnov
erN
o. o
fT
rad
ing
Cal
lP
ut
Cal
lP
ut
No.
of
Tur
nov
erT
urn
over
Con
trac
tsC
ontr
acts
Con
trac
tsV
alue
Con
trac
ts(R
s. m
n.)
(Rs.
mn
.)N
o. o
fT
urn
over
Trad
ed (
Rs.
mn
.)Tr
aded
(Rs.
mn
.)Tr
aded
(Rs.
mn
.)N
o. o
fN
otio
nal
No.
of
Not
ion
alN
o. o
fN
otio
nal
No.
of
Not
ion
al T
rade
dC
ontr
acts
(Rs.
mn
.)C
ontr
acts
Tu
rnov
erC
ontr
acts
Tur
nov
erC
ontr
acts
Tu
rnov
erC
ontr
acts
Tu
rnov
er T
rade
d(R
s. m
n.)
Trad
ed(R
s. m
n.)
Trad
ed(R
s. m
n.)
Tra
ded
(Rs.
mn
.)
Jun
-00
toM
ar-0
190
,580
23,6
50-
--
--
--
--
--
-90
,580
23,6
5011
6A
pr-
0113
,274
2,9
17
--
--
--
--
--
--
13,2
742,9
17
154
1,4
30
319
May
-01
10,0
482,3
05
--
--
--
--
--
--
10,0
482,3
05
105
2,0
33
471
Jun
-01
26,8
055,9
02
--
--
5,2
32
1,1
85
3,4
29
766
--
--
35,4
667,8
54
374
4,0
71
904
Jul-
0160
,644
13,0
86-
--
-8,6
13
1,9
08
6,2
21
1,3
52
13,0
82
2,9
02
4,7
46
1,0
57
93,3
0620
,306
967
14,0
402,9
48
Au
g-0
160
,979
13,0
46-
--
-7,5
98
1,6
53
5,5
33
1,1
93
38,9
71
8,4
37
12,5
082,
633
125,
589
26,9
621,2
84
19,0
963,9
61
Sep
-01
154,
298
28,5
71-
--
-12
,188
2,4
32
8,2
62
1,6
87
64,3
44
13,2
2133
,480
6,90
027
2,57
252
,810
2,6
40
16,2
042,7
80
Oct
-01
131,
467
24,8
48-
--
-16
,787
3,2
63
12,3
242,
329
85,
844
16,3
1943
,787
8,01
529
0,20
954
,775
2,6
08
25,0
514,6
28
No
v-0
112
1,69
724
,835
125,
946
28,1
14-
-14
,994
3,0
99
7,1
89
1,4
53
112,4
99
23,7
2231
,484
6,37
941
3,80
987
,601
4,3
80
60,4
1413
,291
Dec
-01
109,
303
23,3
9330
9,75
575
,147
--
12,8
902,8
66
5,5
13
1,1
84
84,1
3419
,859
28,4
256,
740
550,
020
129,
187
6,7
99
37,8
918,0
24
Jan
-02
122,
182
26,5
9848
9,79
313
2,61
0-
-11
,285
2,5
28
3,9
33
853
133,9
47
38,3
6144
,498
12,5
2980
5,63
821
3,47
99,2
82
78,3
8417
,753
Feb
-02
120,
662
27,4
7252
8,94
713
9,39
5-
-13
,941
3,2
35
4,7
49
1,0
68
133,6
30
36,3
4733
,055
8,64
383
4,98
421
6,15
910
,808
89,5
6020
,104
Mar
-02
94,2
2921
,846
503,
415
139,
890
--
10,4
462,4
87
4,7
73
1,1
13
101,7
08
28,6
2837
,387
10,9
3675
1,95
820
4,89
910
,784
93,9
1721
,499
2001
-02
1,02
5,58
821
4,81
91,
957,
856
515,
155
--
113,
974
24,6
5761
,926
12,9
9876
8,15
918
7,79
526
9,37
063
,830
4,19
6,87
31,
019,
254
4,12
793
,917
21,4
99A
pr-
0273
,635
16,5
6255
2,72
715
0,65
1-
-11
,183
2,6
00
5,3
89
1,2
15
121,2
25
34,0
0440
,443
11,7
0480
4,60
221
6,73
69,8
52
66,9
2215
,540
May
-02
94,3
1220
,223
605,
284
159,
810
--
13,0
702,9
45
7,7
19
1,6
87
126,8
67
34,9
0157
,984
16,4
3290
5,23
623
5,99
810
,727
55,8
3912
,053
Jun
-02
99,5
1421
,228
616,
461
161,
783
--
10,2
722,2
29
7,8
05
1,6
62
123,4
93
33,2
4648
,919
13,1
7390
6,46
423
3,32
011
,666
65,8
3415
,315
Jul-
0212
2,66
325
,133
789,
290
212,
047
--
16,6
373,4
98
7,6
88
1,6
16
154,0
89
43,4
0665
,530
18,3
691,
155,
897
304,
069
13,2
2085
,369
17,9
97
Au
g-0
215
2,37
529
,778
726,
310
178,
806
--
15,9
673,1
78
10,1
242,
000
147,
646
38,3
6765
,630
17,2
551,
118,
052
269,
383
12,8
2871
,655
16,6
02
Sep
-02
144,
303
28,3
5770
0,05
117
5,01
1-
-16
,578
3,3
18
12,5
432,
507
151,
291
40,1
6080
,038
22,0
511,
104,
804
271,
404
13,5
7067
,261
13,8
58
Oct
-02
164,
934
31,4
4885
6,93
021
2,13
4-
-23
,628
4,5
94
13,9
102,
671
214,
027
55,9
5310
4,65
927
,612
1,37
8,08
833
4,41
315
,924
135,
239
30,2
28
Nov-0
217
5,56
735
,000
970,
251
254,
630
--
25,4
135,0
90
17,1
913,
360
261,
600
71,0
6010
4,52
929
,220
1,55
4,55
139
8,36
020
,966
94,6
1522
,134
Dec
-02
277,
403
59,5
801,
217,
873
355,
316
--
30,2
616,6
01
19,9
734,
274
309,
573
95,5
2411
1,75
634
,907
1,96
6,83
955
6,20
126
,486
110,
431
28,9
33
Jan
-03
258,
955
55,5
671,
304,
122
382,
988
--
26,3
765,7
69
16,8
053,
635
322,
876
101,
743
132,
021
41,7
902,
061,
155
591,
400
25,7
1710
0,76
423
,888
Feb
-03
237,
803
50,4
031,
198,
564
324,
448
--
26,5
015,7
11
17,6
813,
749
268,
156
76,4
4411
4,51
233
,192
1,86
3,21
749
3,94
825
,997
109,
192
27,3
78
Mar
-03
325,
299
66,2
371,
138,
980
297,
698
--
53,7
8811
,165
35,7
397,
397
255,
658
71,6
3414
0,54
039
,186
1,95
0,00
449
3,31
724
,666
97,0
2521
,943
2002
-03
2,12
6,76
343
9,51
610
,676
,843
2,86
5,32
1-
-26
9,67
456
,698
172,
567
35,7
722,
456,
501
696,
441
1,06
6,56
130
4,89
116
,768
,909
4,39
8,54
817
,524
97,0
2521
,943
Ap
r-03
362,
157
69,9
391,
291,
493
297,
492
--
54,8
9010
,914
31,1
076,
157
297,
270
74,7
1316
8,55
340
,981
2,20
5,47
050
0,19
625
,010
121,
089
25,8
77
May
-03
325,
784
62,8
261,
354,
581
327,
517
--
53,1
9810
,387
30,1
095,
784
332,
529
88,6
0615
5,84
939
,113
2,25
2,05
053
4,23
325
,440
101,
396
20,0
66
Jun
-03
439,
151
93,4
751,
694,
505
465,
047
9,76
81,
819
55,8
7412
,065
34,8
957,
351
383,
603
113,
026
132,
498
37,3
902,
750,
294
730,
173
34,7
7013
2,38
336
,892
Jul-
0364
1,00
214
7,43
02,
282,
426
705,
146
963
193
87,1
4920
,395
50,6
6911
,634
495,
853
161,
801
162,
501
51,8
953,
720,
563
1,09
8,49
547
,761
254,
332
74,8
11
Au
g-0
399
0,73
124
9,88
62,
620,
897
912,
876
5010
96,8
7524
,769
54,6
4913
,616
434,
526
160,
276
116,
370
42,1
914,
314,
098
1,40
3,62
570
,181
161,
027
55,3
00
Sep
-03
1,67
6,35
845
8,61
03,
122,
432
1,13
8,73
50
011
0,01
430
,877
69,9
2019
,250
401,
660
163,
785
101,
555
40,2
525,
481,
939
1,85
1,50
984
,160
192,
544
66,0
84
Oct
-03
1,86
6,40
756
4,35
13,
469,
563
1,46
3,77
10
089
,794
27,6
1360
,330
18,1
2840
5,70
618
5,58
197
,405
44,2
015,
989,
205
2,30
3,64
510
0,15
817
9,67
066
,773
Nov-0
31,
557,
909
494,
862
2,76
1,72
51,
224,
630
00
71,6
9623
,135
48,2
8115
,342
269,
032
133,
135
61,2
9530
,610
4,76
9,93
81,
921,
714
96,0
8617
9,70
469
,197
Dec
-03
1,87
5,46
865
3,77
73,
334,
468
1,50
9,32
60
087
,683
31,0
0268
,394
23,5
5229
4,59
614
0,95
163
,426
30,4
605,
724,
035
2,38
9,06
710
8,59
423
0,10
910
0,03
8
Jan
-04
2,61
1,64
999
8,77
63,
791,
114
1,95
7,88
30
010
5,43
141
,204
72,8
6927
,929
327,
135
178,
041
67,8
2536
,797
6,97
6,02
33,
240,
630
154,
316
182,
708
76,1
58
Feb
-04
2,33
9,95
086
3,59
02,
868,
432
1,61
4,63
90
098
,938
37,5
3674
,933
27,9
1223
8,51
713
8,73
175
,771
45,9
845,
696,
541
2,72
8,39
214
3,60
016
6,79
470
,504
Mar
-04
2,50
5,10
288
7,10
13,
777,
206
1,44
2,43
10
013
2,35
248
,115
92,3
6433
,567
367,
722
143,
090
131,
874
50,5
097,
006,
620
2,60
4,81
311
8,40
123
5,79
271
,876
2003
-04
17,1
91,6
685,
544,
625
32,3
68,8
4213
,059
,493
10,7
812,
022
1,04
3,89
431
8,01
168
8,52
021
0,22
24,
248,
149
1,68
1,73
61,
334,
922
490,
384
56,8
86,7
7621
,306
,492
83,8
8423
5,79
271
,876
Note
:1.
Noti
onal
Turn
ove
r = (
Stri
ke
Pric
e + P
rem
ium
) *
Quan
tity
.
2.In
dex
Futu
res,
Inde
x O
pti
ons,
Sto
ck O
pti
ons
and S
tock
Futu
res
wer
e in
troduce
d in J
une
2000
, Ju
ne
2001
, Ju
ly 2
001 a
nd N
ove
mber
200
1, res
pec
tivel
y.