Depth to Bedrock Using Electrical - dnr.wi.gov · Slide courtesy of Mike Parsen . Frequencies...
31
Depth to Bedrock WGNHS Resources and Methods Dave Hart, Mike Parsen, Carolyn Streiff, and Steve Mauel
Transcript of Depth to Bedrock Using Electrical - dnr.wi.gov · Slide courtesy of Mike Parsen . Frequencies...

Depth to Bedrock WGNHS Resources and Methods
Dave Hart, Mike Parsen, Carolyn Streiff, and Steve Mauel

Resources
Published Maps
Well Construction Reports
Hydrodata Viewer
Staff
Steve Mauel - WGNHS

Published Maps
Statewide: Trotta and Cotter Published 1973

Published Maps Regional: USGS Open File Report 78-108 Sherrill 1979

Published Maps Regional: USGS Open File Report 78-108

Maps
Statewide This map is is compiled from two maps: 1. Groundwater Contamination Susceptibility in Wisconsin” depth to bedrock map 2. Previously shown Trotta and Cotter map.

Published Maps County:

Published Maps

Town of Byron

Karst Potential Map combines geology and depth to bedrock
Depth to bedrock Carbonate Bedrock Wisconsin’s shallow karst potential map

Well Construction Reports and HydroDataviewer
Online Web GIS Search for individual wells for spot depths to bedrock.

Well Construction Reports and HydroDataviewer
Online Web GIS Search for individual wells for spot depths to bedrock.
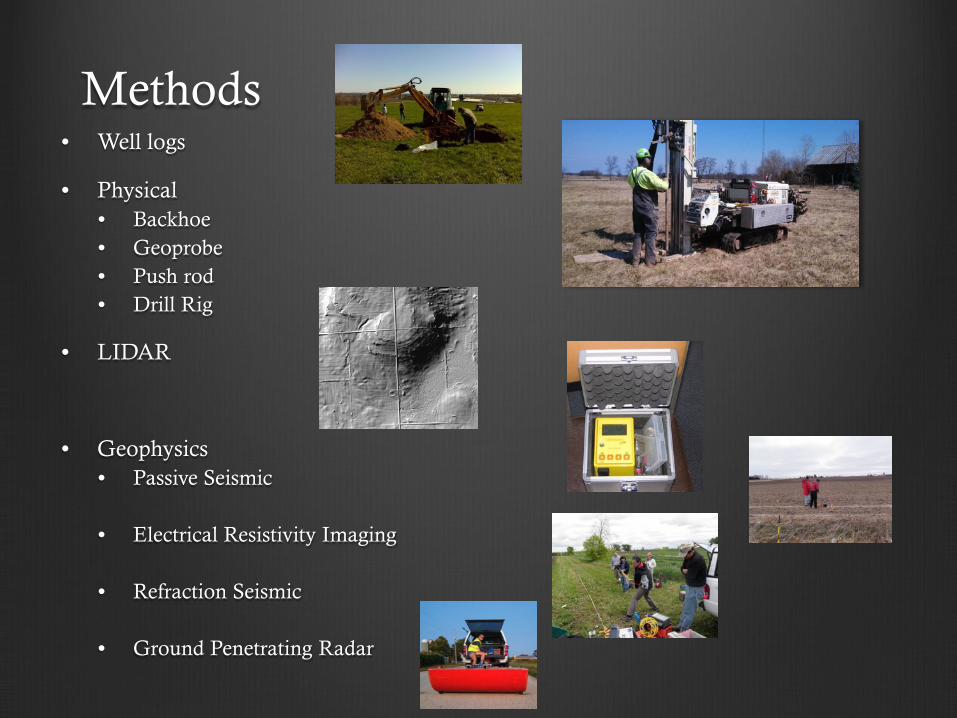
Methods • Well logs
• Physical • Backhoe • Geoprobe • Push rod • Drill Rig
• LIDAR
• Geophysics • Passive Seismic
• Electrical Resistivity Imaging
• Refraction Seismic
• Ground Penetrating Radar

Methods • Well Log Data
• Most Basic
• Well Construction Reports • Reported by drillers to WDNR, previously to WGNHS
• Geologic Logs • higher quality – studied by WGNHS geologist
• Needs to located and checked for quality • Historically located to the nearest quarter-quarter section
• Descriptions are sometimes cryptic and confusing

Methods • Physical
• Backhoe
• Geoprobe
• Push rod
• Drill Rig
• Readily available
• Point measurement instead of continuous
• Push methods – refusal might underestimate depth • Hit rock in sediment rather than bedrock

LIDAR data – land surface elevation mapping
– Light Detection and Ranging
– High-resolution elevation mapping
– Evaluate bedrock features by elevation
– Use with other methods to identify larger areas of shallow bedrock
1,020 ft msl
576 ft msl
3 miles
Methods

Illustration of a point data issue
A’
A
Dolomite has layers Planes of weakness
Results in scarps in the landscape. Create varying shallow depth to bedrock Good model to keep in mind when using point data for depth to bedrock
A
Land surface Bedrock surface
A’
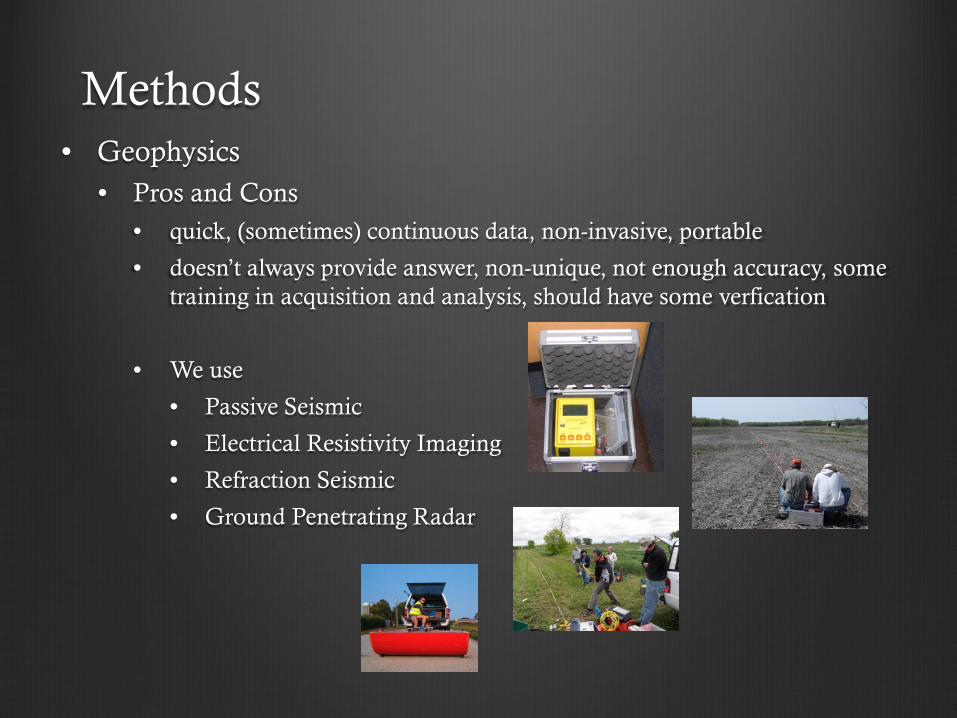
Methods • Geophysics
• Pros and Cons • quick, (sometimes) continuous data, non-invasive, portable
• doesn’t always provide answer, non-unique, not enough accuracy, some training in acquisition and analysis, should have some verfication
• We use
• Passive Seismic
• Electrical Resistivity Imaging
• Refraction Seismic
• Ground Penetrating Radar
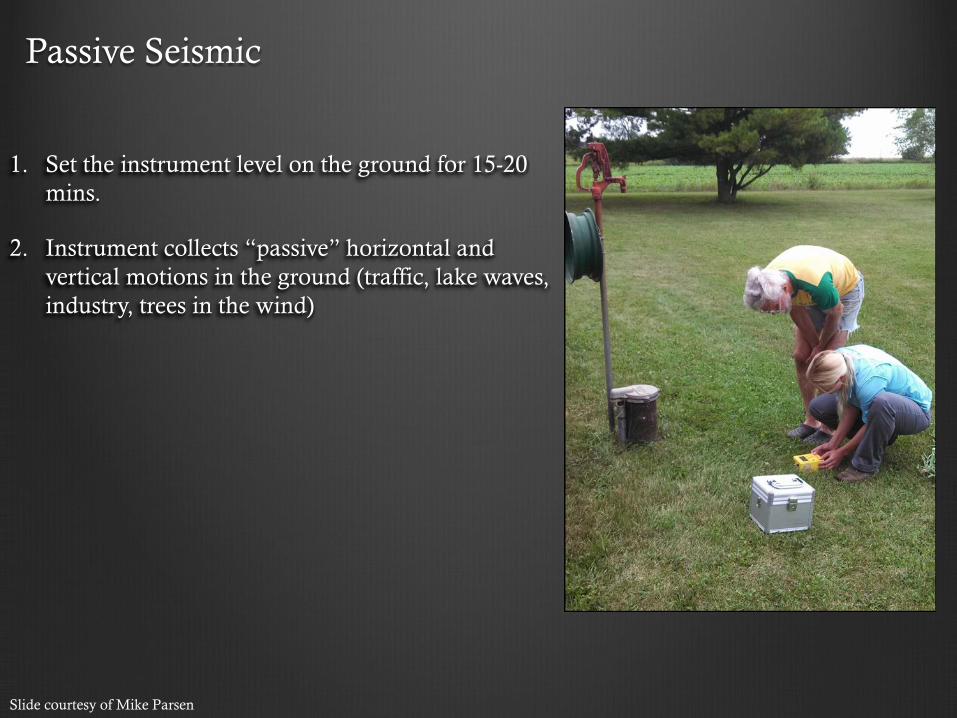
1. Set the instrument level on the ground for 15-20 mins.
2. Instrument collects “passive” horizontal and vertical motions in the ground (traffic, lake waves, industry, trees in the wind)
Passive Seismic
Slide courtesy of Mike Parsen

North-South Horizontal Movement
East-West Horizontal Movement
Vertical Movement
15 mins 0 mins
The instrument collects horizontal and vertical ground motion
Time (mins)
Slide courtesy of Mike Parsen

Frequencies present in the ground vs their amplitude (~magnitude)
N-S E-W Vertical
Average
N-S/Vertical
E-W/Vertical
Compare horizontal to vertical ground motions at each frequency collected from the ground
Other output plots
for data quality
Peak at 2.19 Hz Frequency (Hz)
Frequency (Hz)
The dominant frequency, that shakes the sediment horizontally vs. vertically the most, is the resonant frequency of the sediment This resonant frequency is inversely proportional to the sediment thickness depth-to-bedrock estimate
Slide courtesy of Mike Parsen

Electrical Resistivity Imaging (ERI)
24 electrodes placed in ground in a line. Current put into and out of an electrode pair. Voltage measured across another pair. Diffrent sets of electrodes provides resistivity measurements at different depths and distances along the survey line This creates a resistivity profile with depth along the line Best in more conductive conditions (wet units and/or less competent rock)
Slide courtesy of Mike Parsen

Extended Test Pit data for depth to bedrock at proposed Goat Dairy Farm in Calumet County

Depths to bedrock based on passive seismic
Locations of ERI lines
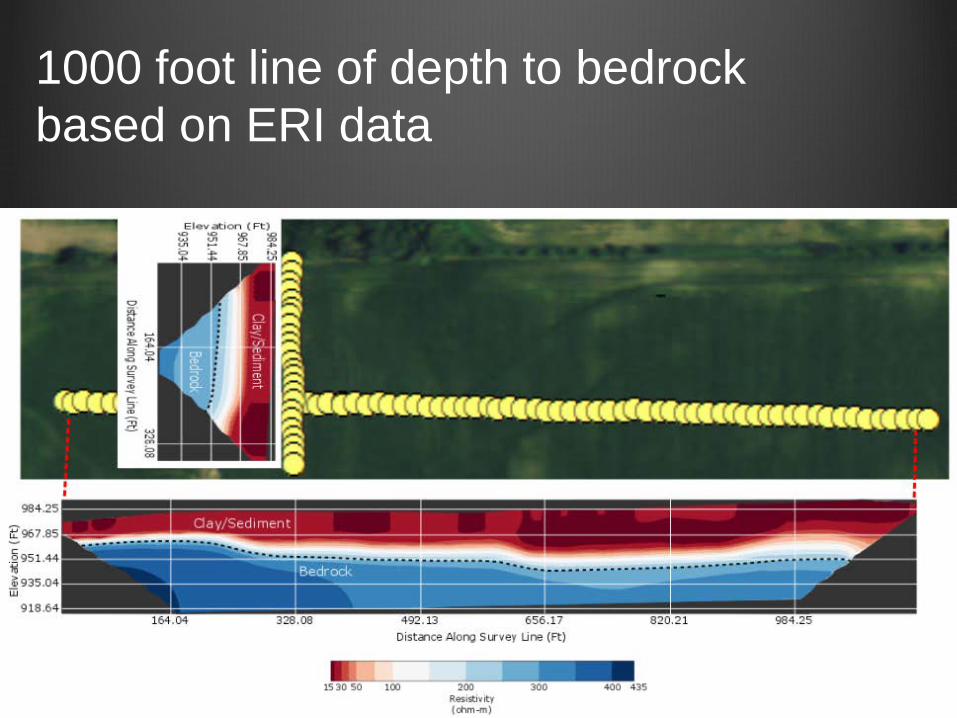
1000 foot line of depth to bedrock based on ERI data

Refraction Seismic
• Expensive and takes twice as long but gives good data
• Identified zone of weathered bedrock
• Indicated deeper bedrock than push methods.
• Verified by backhoe
Seismic Results from Gold Star Farms, Calumet Co.
http://www.uwdiscoveryfarms.org/UWDiscoveryFarms/media/sitecontent/PublicationFiles/mappingbedrock/Using-seismic-refraction-to-ID-vulnerable-landscape-factsheet.pdf?ext=.pdf
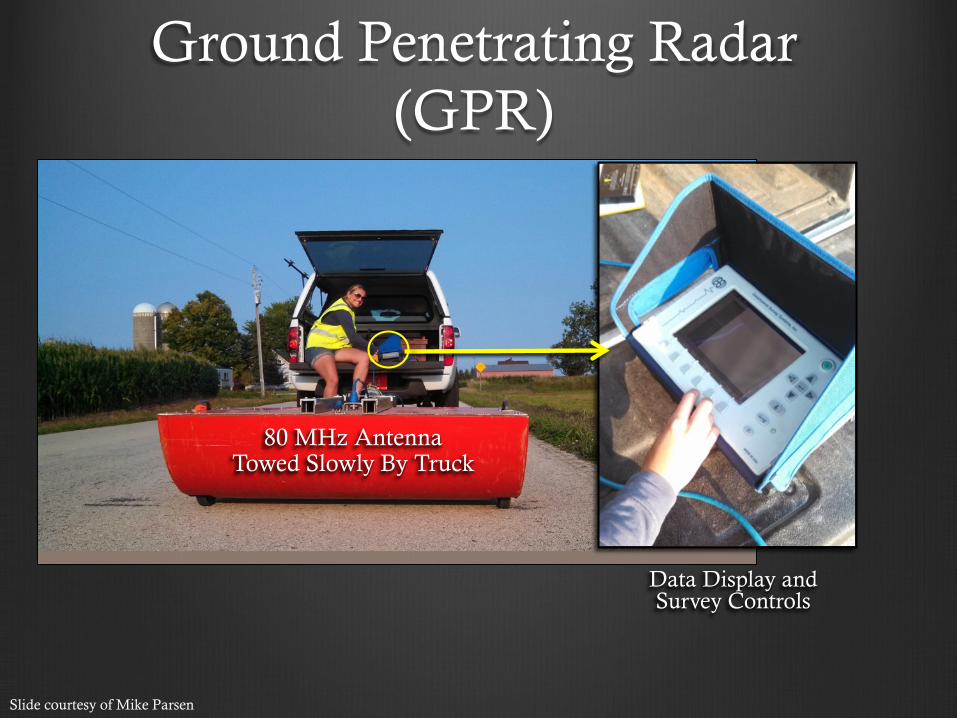
80 MHz Antenna Towed Slowly By Truck
Ground Penetrating Radar (GPR)
Data Display and Survey Controls
Slide courtesy of Mike Parsen
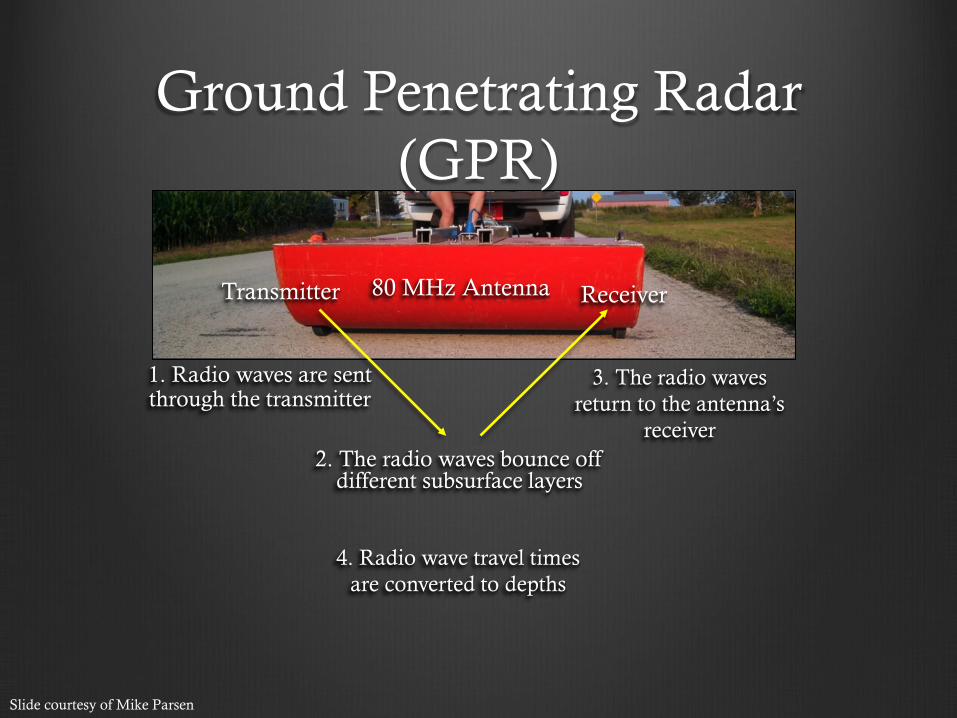
80 MHz Antenna
Ground Penetrating Radar (GPR)
1. Radio waves are sent through the transmitter
2. The radio waves bounce off different subsurface layers
3. The radio waves return to the antenna’s
receiver
4. Radio wave travel times are converted to depths
Transmitter Receiver
Slide courtesy of Mike Parsen

GPR image after processing
Depth = Up to 20 m in some study areas
Hawk Rd between Fir Rd and Hwy P
Sediment Layers
No Reflections: Inferred Bedrock
Top of Inferred Bedrock
- Similar to an X-Ray at the doctor, except with radio waves
- When sediment or rock units vary in dielectric constant (strongly controlled by water content) a reflection is created
- The depth of radio wave (GPR) penetration into the ground is dependent on the conductivity of the subsurface
Slide courtesy of Mike Parsen

Putting it all together Preliminary bedrock interpretation town of Lincoln
Consider all data inputs
- Well construction records
- Geophysics, borings,
visual observations…
- NRCS soils map
- Farmer maps
- LIDAR elevation map
2 miles
Slide courtesy of Mike Parsen

Questions?

![Untitled Document [dnr.wi.gov]Title: Untitled Document Created Date: 10:32 12/7/2004](https://static.fdocuments.net/doc/165x107/5ff7c6e947c90667e7668635/untitled-document-dnrwigov-title-untitled-document-created-date-1032-1272004.jpg)