
Depth-Duration Frequency of Precipitation for Texas · Depth-Duration Frequency of Precipitation...
112
In cooperation with the Texas Department of Transportation Depth-Duration Frequency of Precipitation for Texas Water-Resources Investigations Report 98–4044 U.S. Department of the Interior U.S. Geological Survey
Transcript of Depth-Duration Frequency of Precipitation for Texas · Depth-Duration Frequency of Precipitation...
In cooperation with the Texas Department of Transportation
Depth-Duration Frequency of Precipitation for Texas
Water-Resources Investigations Report 98–4044
U.S. Department of the InteriorU.S. Geological Survey
DistrictCover.fm��Page�1��Wednesday,�October�23,�2002��3:47�PM
Depth-Duration Frequency ofPrecipitation for Texas
By William H. Asquith
U.S. GEOLOGICAL SURVEY
Water-Resources Investigations Report 98–4044
In cooperation with the Texas Department of Transportation
Austin, Texas1998
ii
U.S. DEPARTMENT OF THE INTERIOR
Bruce Babbitt, Secretary
U.S. GEOLOGICAL SURVEY
Thomas J. Casadevall, Acting Director
Second printing
Any use of trade, product, or firm names is for descriptive purposes only and does not imply endorsement by the U.S. Government.
For additional information write to
District ChiefU.S. Geological Survey8011 Cameron Rd.Austin, TX 78754–3898
Copies of this report can be purchased fromU.S. Geological SurveyBranch of Information ServicesBox 25286Denver, CO 80225–0286

CONTENTS iii
CONTENTSAbstract ............................................................................................................................................................................... 1Introduction ......................................................................................................................................................................... 1
Purpose and Scope ................................................................................................................................................... 1Previous Studies ....................................................................................................................................................... 2Climate of Texas ...................................................................................................................................................... 2Data Base of Precipitation Annual Maxima ............................................................................................................ 3
Data Sources ................................................................................................................................................ 3Correction of Precipitation Annual Maxima for Fixed-Interval Recording ................................................. 6
Acknowledgments ................................................................................................................................................... 11Regionalization of Precipitation Annual Maxima ............................................................................................................... 11
L-moments ............................................................................................................................................................... 12Generalized Logistic and Generalized Extreme-Value Distributions ...................................................................... 16Spatial Averaging of L-coefficient of Variation and L-skew and Estimation of L-scale ......................................... 17Contouring Distribution Parameters ........................................................................................................................ 21
Depth-Duration Frequency of Precipitation for Texas ........................................................................................................ 21Examples of Depth-Duration Frequency Computation ........................................................................................... 23Precipitation Intensity-Duration Frequency Curve .................................................................................................. 24Comparison to Previous Studies .............................................................................................................................. 25
Summary ............................................................................................................................................................................. 25Selected References ............................................................................................................................................................ 26Appendix 1. Fifteen-Minute Precipitation Stations in Texas With at Least 10 Years of Annual Maxima
Data Through 1994 ........................................................................................................................................ 722. Hourly Precipitation Stations in Texas With at Least 10 Years of Annual Maxima Data
Through 1994 ................................................................................................................................................. 753. Daily Precipitation Stations in Texas With at Least 10 Years of Annual Maxima Data
Through 1994 ................................................................................................................................................. 83
PLATE
(Plate is in pocket)
1. Map showing locations of 15-minute, hourly, and daily recording precipitation stations in Texas with at least 10 years of annual maxima data through 1994
FIGURES
1. Graph showing relation between precipitation depth and storm duration for world record, Texas record, and Texas data-base maxima ............................................................................................................................... 4
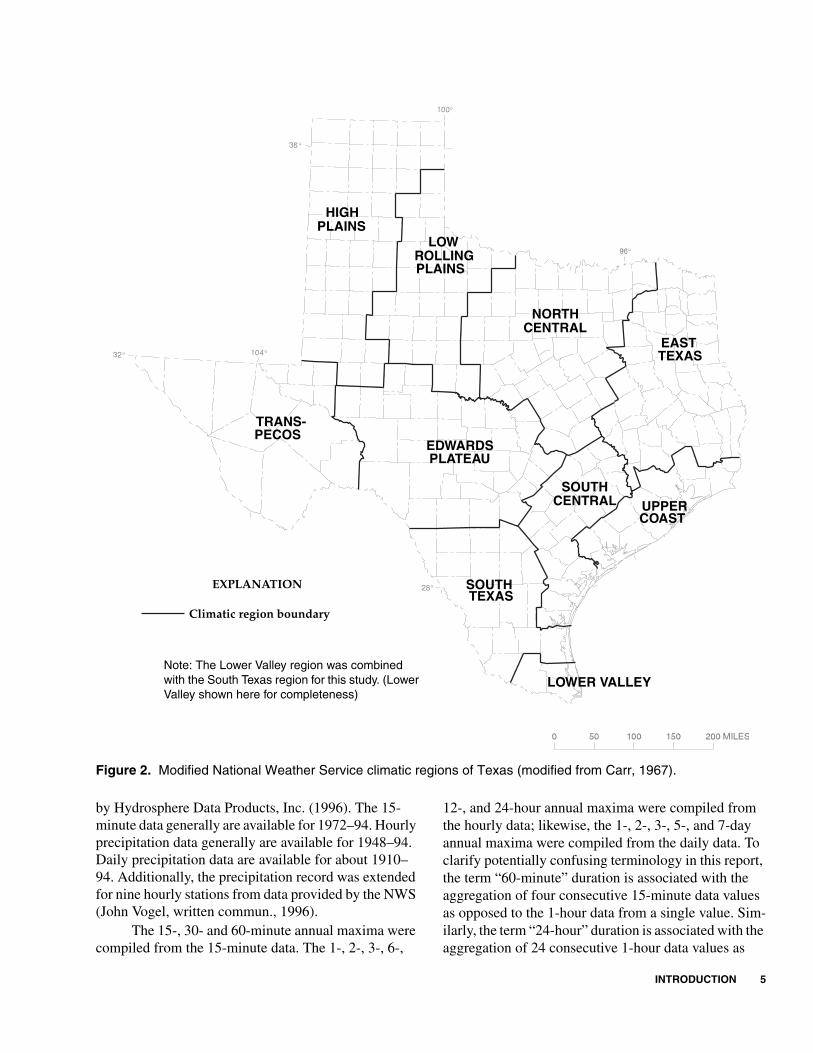
2. Map showing modified National Weather Service climatic regions of Texas ..................................................... 53. Boxplots showing record-length distribution for 15-minute, hourly, and daily precipitation stations in
climatic regions of Texas ..................................................................................................................................... 74–7. Graphs showing:
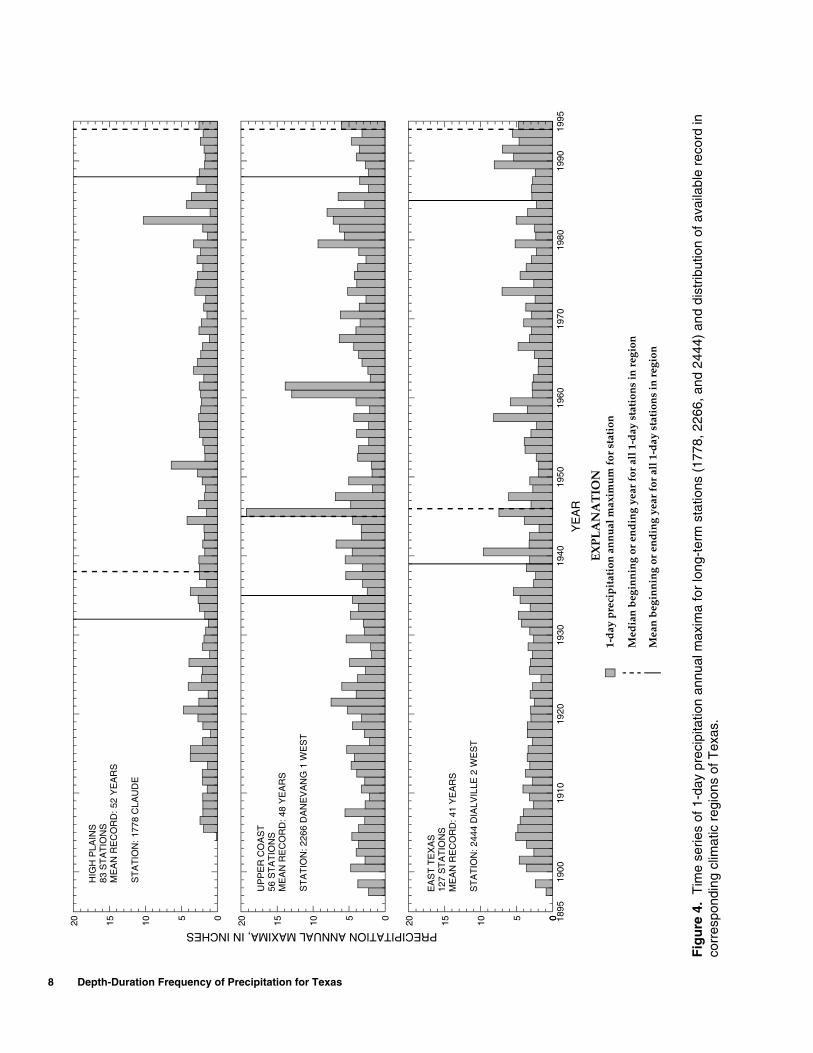
4. Time series of 1-day precipitation annual maxima for long-term stations (1778, 2266, and 2444) and distribution of available record in corresponding climatic regions of Texas ..................................... 8
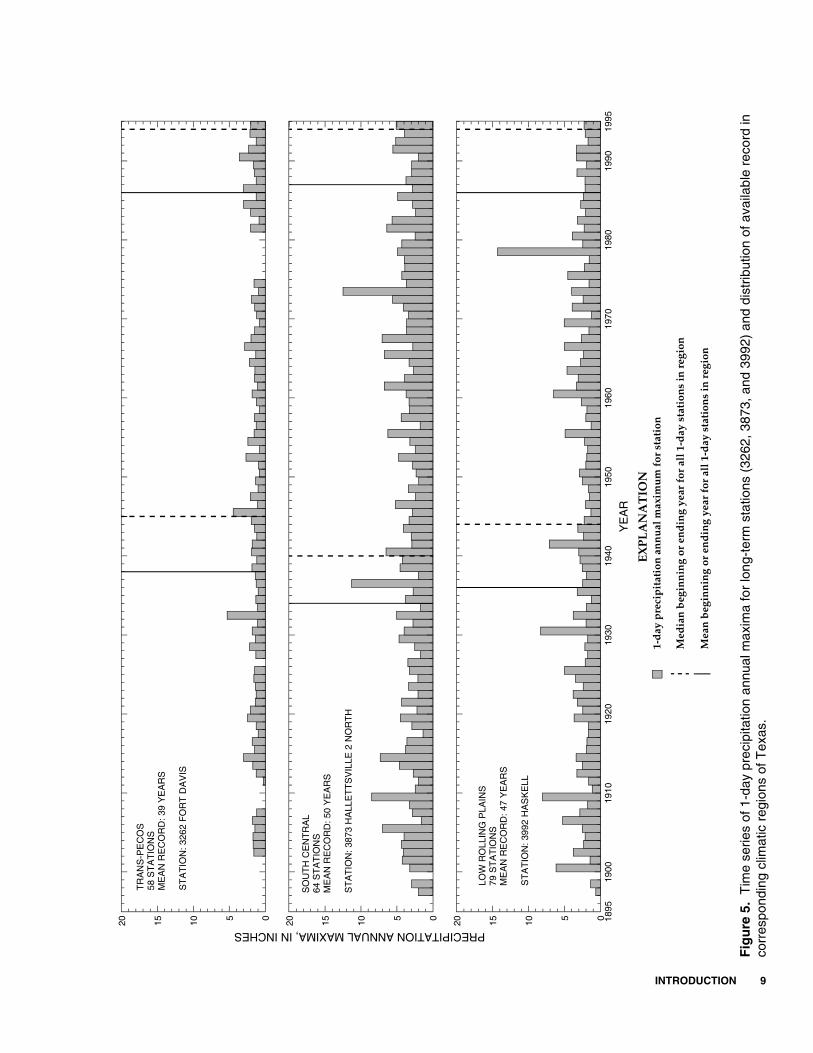
5. Time series of 1-day precipitation annual maxima for long-term stations (3262, 3873, and 3992) and distribution of available record in corresponding climatic regions of Texas ..................................... 9
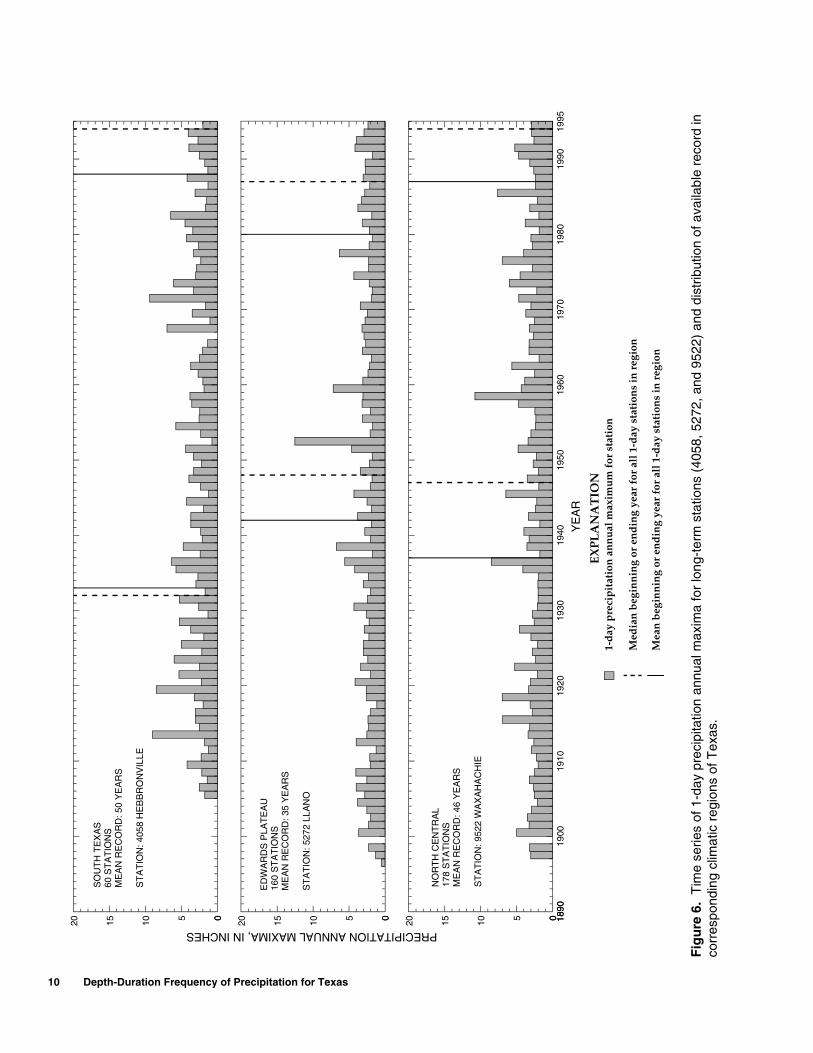
6. Time series of 1-day precipitation annual maxima for long-term stations (4058, 5272, and 9522) and distribution of available record in corresponding climatic regions of Texas ..................................... 10
7. L-moment ratio diagrams for selected precipitation durations in Texas .................................................. 148–9. Boxplots showing:
8. Effects of spatial averaging on the statewide distribution of L-coefficient of variation for each precipitation duration ................................................................................................................................ 19
9. Effects of spatial averaging on the statewide distribution of L-skew for each precipitation duration ..................................................................................................................................................... 20
iv
10–18. Maps showing location (ξ) parameter of generalized logistic (GLO) distribution for:10. 15-minute precipitation duration in Texas ................................................................................................ 2811. 30-minute precipitation duration in Texas ................................................................................................ 2912. 60-minute precipitation duration in Texas ................................................................................................ 3013. 1-hour precipitation duration in Texas ...................................................................................................... 3114. 2-hour precipitation duration in Texas ...................................................................................................... 3215. 3-hour precipitation duration in Texas ...................................................................................................... 3316. 6-hour precipitation duration in Texas ...................................................................................................... 3417. 12-hour precipitation duration in Texas .................................................................................................... 3518. 24-hour precipitation duration in Texas .................................................................................................... 36
19–23. Maps showing location (ξ) parameter of generalized extreme-value (GEV) distribution for:19. 1-day precipitation duration in Texas ........................................................................................................ 3720. 2-day precipitation duration in Texas ........................................................................................................ 3821. 3-day precipitation duration in Texas ........................................................................................................ 3922. 5-day precipitation duration in Texas ........................................................................................................ 4023. 7-day precipitation duration in Texas ........................................................................................................ 41
24–32. Maps showing scale (α) parameter of generalized logistic (GLO) distribution for:24. 15-minute precipitation duration in Texas ................................................................................................ 4225. 30-minute precipitation duration in Texas ................................................................................................ 4326. 60-minute precipitation duration in Texas ................................................................................................ 4427. 1-hour precipitation duration in Texas ...................................................................................................... 4528. 2-hour precipitation duration in Texas ...................................................................................................... 4629. 3-hour precipitation duration in Texas ...................................................................................................... 4730. 6-hour precipitation duration in Texas ...................................................................................................... 4831. 12-hour precipitation duration in Texas .................................................................................................... 4932. 24-hour precipitation duration in Texas .................................................................................................... 50
33–37. Maps showing scale (α) parameter of generalized extreme-value (GEV) distribution for:33. 1-day precipitation duration in Texas ........................................................................................................ 5134. 2-day precipitation duration in Texas ........................................................................................................ 5235. 3-day precipitation duration in Texas ........................................................................................................ 5336. 5-day precipitation duration in Texas ........................................................................................................ 5437. 7-day precipitation duration in Texas ........................................................................................................ 55
38–46. Maps showing shape (κ) parameter of generalized logistic (GLO) distribution for:38. 15-minute precipitation duration in Texas ................................................................................................ 5639. 30-minute precipitation duration in Texas ................................................................................................ 5740. 60-minute precipitation duration in Texas ................................................................................................ 5841. 1-hour precipitation duration in Texas ...................................................................................................... 5942. 2-hour precipitation duration in Texas ...................................................................................................... 6043. 3-hour precipitation duration in Texas ...................................................................................................... 6144. 6-hour precipitation duration in Texas ...................................................................................................... 6245. 12-hour precipitation duration in Texas .................................................................................................... 6346. 24-hour precipitation duration in Texas .................................................................................................... 64
47. Graph showing precipitation intensity-duration curves of 100-year storm for selected localities in Texas ........ 6548. Map showing depth of 100-year storm for 6-hour precipitation duration in Texas ............................................. 6649. Graph showing precipitation intensity-duration curves of 100-year storm for Amarillo and Orange,
Texas .................................................................................................................................................................... 67
TABLES
1. Correction factors for mean annual maxima of precipitation .............................................................................. 112. Summary of goodness-of-fit and heterogeneity measures for Texas ................................................................... 153. Summary statistics of distribution-parameter maps for each precipitation duration in Texas ............................. 22
Abstract 1
Depth-Duration Frequency of Precipitation for Texas
By William H. Asquith
Abstract
The U.S. Geological Survey, in cooperation with the Texas Department of Transportation, con-ducted a study of the depth-duration frequency of pre-cipitation for Texas. Depth-duration frequency is an estimate of the depth of precipitation for a specified duration and frequency or recurrence interval. For this report, precipitation durations of 15, 30, and 60 minutes; 1, 2, 3, 6, 12, and 24 hours; and 1, 2, 3, 5, and 7 days were investigated. The recurrence inter-vals for the frequencies range from 2 to 500 years.
The time series of precipitation annual maxima for 173 fifteen-minute, 274 hourly, and 865 daily National Weather Service precipitation stations with at least 10 years of record in Texas provide the basis of depth-duration frequency for each identified dura-tion. In total, about 3,030; 10,160; and 38,120 cumu-lative years of record are available for the 15-minute, hourly, and daily stations, respectively.
L-moment statistics of the precipitation annual maxima were calculated for each duration and for each station using unbiased L-moment estimators. The statistics calculated were the mean, L-scale, L-coefficient of variation, L-skew, and L-kurtosis. The mean for each station and duration was corrected for the bias associated with fixed-interval recording of precipitation. The generalized logistic distribution was determined, using L-moment ratio diagrams, as an appropriate probability distribution for modeling the frequency of annual maxima for durations of 15 minutes to 24 hours; whereas, the generalized extreme-value distribution was determined as appro-priate for durations of 1 to 7 days.
The location, scale, and shape parameters of the distributions for each duration and each station were calculated from the L-moments. These parame-ters were contoured using spatial interpolation, based on the geostatistical method of kriging, to produce
37 maps that depict the spatial variation and magni-tude of each parameter. Contour maps of the shape parameter for the generalized extreme-value distribu-tion for durations of 1 to 7 days are not presented; the root mean square errors of preliminary maps for 1- to 7-day shape parameters were not appreciably smaller than the statewide standard deviation. Therefore, a single statewide mean shape parameter was used for 1- to 7-day durations. The depth-duration frequency for any location in Texas can be estimated using the contour maps and the equation of the corresponding distribution.
INTRODUCTION
Precipitation depths for various durations and frequencies, referred to as depth-duration frequency (DDF) in this report, have many uses. A common use of DDF is for the design of structures that control and route localized runoff—such as parking lots, storm drains, and culverts. Another use of DDF is to drive river-flow models that incorporate precipitation charac-teristics. Accurate DDF estimates are important for cost-effective structural designs at stream crossings and for developing reliable flood prediction models. In 1996, the U.S. Geological Survey (USGS), in coopera-tion with the Texas Department of Transportation, began a 3-year study of precipitation characteristics for Texas. The major objectives of the study are (1) to define the DDF of precipitation for Texas, (2) to deter-mine appropriate areal-reduction factors for the 1-day design storm for Texas, and (3) to investigate the extreme precipitation potential for Texas.
Purpose and Scope
The purpose of this report is to present procedures to determine DDF of precipitation for any location in Texas. This report updates previous DDF studies for Texas. For this report, precipitation durations of 15, 30, and 60 minutes; 1, 2, 3, 6, 12, and 24 hours; and 1,
2 Depth-Duration Frequency of Precipitation for Texas
2, 3, 5, and 7 days were investigated. The frequencies (expressed as recurrence intervals) range from 2 to 500 years. Selection of a bound on recurrence interval is difficult. In general, as recurrence interval increases, the accuracy of DDF estimate decreases. An upper recurrence interval of 500 years is considered reason-able since most hydraulic design criteria for engineered structures and controls incorporating DDF require recurrence intervals equal to or less than 500 years. The reciprocal of a recurrence interval is an exceedance probability. For example, a 100-year precipitation has an annual exceedance probability of 0.01, which by def-inition means that there is a 1-percent chance in each and every given year that this precipitation will be equaled or exceeded.
Accurate DDF analysis using data from any one station is difficult because the data for one station represent a poor spatial and (or) temporal sampling of precipitation. For example, storms occur over areas that might or might not contain a station; and generally, only short record is available at a single station. Addi-tionally, the distribution of precipitation associated with any one station tends to be highly nonuniform. More accurate DDF estimates can be developed by “pooling” or “regionalizing” data from many nearby stations (see Stedinger and others, 1993, p. 18.33). The regionalization procedures used are explained in the “Regionalization of Precipitation Annual Maxima” sec-tion of this report. The procedures were developed using a data base of precipitation annual maxima for 173 (15-minute), 274 (hourly), and 865 (daily) National Weather Service (NWS) stations, each with at least 10 years of record in Texas. In total, about 3,030 cumu-lative years of record is available for the 15-minute stations, 10,160 years for the hourly stations, and 38,120 years for the daily stations.
Previous Studies
DDF information for the area of the United States east of the Rocky Mountains, including Texas, is avail-able from two principal sources. The first source, com-monly known as TP–40 (Hershfield, 1962), presents DDF for durations of 30 minutes to 24 hours and recur-rence intervals of 2 to 100 years. The work of Hershfield was extended by Frederick and others (1977) and com-monly is known as HYDRO–35. The HYDRO–35 study presents DDF for durations of 5 to 60 minutes and recurrence intervals of 2 to 100 years.
In recent years, other investigations of precipita-tion frequency have been conducted. Schaefer (1990) and Parrett (1997) presented precipitation frequency investigations based on the generalized extreme-value (GEV) distribution for Washington State and Montana, respectively. Also, the GEV distribution was selected by Huff and Angel (1992) to model the frequency of annual precipitation maxima for durations of 5 minutes to 10 days for the midwestern United States (Illinois, Indiana, Iowa, Kentucky, Michigan, Minnesota, Missouri, Ohio, and Wisconsin). For the western United States (Arizona, Nevada, New Mexico, Utah, and parts of California, Colorado, Idaho, Oregon, Texas, and Wyoming), the generalized Pareto distribution was selected to model the frequency of annual precipitation maxima for durations of 1 hour to 7 days (L.T. Julian, National Weather Service, written commun., 1997). The NWS study covers only a small part of the Texas Panhandle and the northern one-half of the Trans-Pecos region of West Texas. Wilks and Cember (1993) selected the Beta-P distribution to model the frequency of annual precipitation maxima for durations of 1 to 10 days for northeastern United States and southeastern Canada. Other studies of precipitation frequency, which are at or near completion, are for Canada (Younes Alila, University of British Columbia, Vancouver, Canada, written commun., 1998), for southern British Columbia (M.G. Schaefer, MGS Consultants, Lacey, Wash., writ-ten commun., 1998), and for Oklahoma (R.L. Tortorelli, U.S. Geological Survey, written commun., 1998).
Climate of Texas
The climate of Texas varies considerably across the State, and the climate for any given location in Texas is highly variable and nonuniform. This variabil-ity and nonuniformity is due in part to the influences of four principal types of air masses that periodically move through the State (Bomar, 1995). Two of these air masses generally are characterized as warm and moist. The “continental tropical” originates in the Pacific Ocean and moves into Texas from the west; and the “maritime tropical” originates in the Gulf of Mexico, southeast of Texas. The “maritime polar” and “continental polar,” or Arctic, arrive from the northwest and north, respectively, and generally are characterized as cold and dry. Additionally, tropical cyclones, which also contribute to the climatic variability and nonunifor-mity, occasionally affect Texas during the summer and early fall. These cyclones have produced many daily
INTRODUCTION 3
rainfall totals in excess of 20 inches (in.) for many loca-tions in the State.
A comprehensive discussion of the climate and weather phenomenon in Texas is found in recent works by Bomar (1995) and by the Office of the State Clima-tologist (1987). A report by Carr (1967) also presents a discussion of the State’s climate, and a discussion of cli-mate change and related topics for Texas is presented by Norwine and others (1995).
The climatic characteristics of Texas magnify the two extremes of the hydrologic spectrum—floods and droughts. Destructive flooding, caused by excessive precipitation, occurs somewhere in the State nearly every year. Conversely, short- and long-term droughts also occur throughout the State. At least one drought has occurred in some part of Texas in the majority of decades of the 20th century (Bomar, 1995; Jones, 1991).
Many near-world-record precipitation events have occurred in Texas (World Meteorological Organi-zation, 1986). For example, a total of 38.2 in. of rain fell in 24 hours during September 9–10, 1921, near Thrall [about 30 miles (mi) northeast of Austin]; a storm on May 31, 1935, near D'Hanis (about 40 mi west of San Antonio) produced 22 in. of rain in 2 hours 45 min-utes; and about 10 in. of rain fell in 1 hour at New Braunfels (about 20 mi north of San Antonio) on May 11, 1972. These and other greatest precipitation depths in Texas are compared to the greatest worldwide precip-itation depths (represented by an equation) in figure 1.
The number in parenthesis shown in figure 1 is the ratio of selected greatest-observed precipitation depths in Texas to the corresponding 100-year depth (derived from this report) for that locality. The greatest depths generally are documented at sites without sys-tematic precipitation-recording stations. The maximum statewide 100-year depths shown in figure 1 were derived from this report.
In general, the maximum depths shown in figure 1 are larger than the maximum depths measured at pre-cipitation stations. This observation is significant because it indicates that the potential exists for very large depths to be measured at precipitation stations in the future. Also, even with about 3,030; 10,160; and 38,120 cumulative years of data for the 15-minute, hourly, and daily stations, respectively, some of the largest depths have gone unrecorded by systematic data-collection activities because of limited spatial and (or) temporal sampling. A trend is indicated for maxi-mum depths in Texas to approach world maximum
depths as duration decreases. This trend could be caused by a physical upper limit (meteorologically affected) of precipitation potential for short durations or, possibly reflect the scantiness of short-duration data on a world-wide basis. Additionally, the large ratios of maximum-known to 100-year depths indicate that the potential exists for precipitation depths greatly in excess of those that can be reliably1 estimated from available data. These depths have estimated recurrence intervals con-siderably greater than 1,000 years.
For purposes of investigation and scrutiny of the data, a regional division of the State is considered nec-essary. The regions used in this report represent those developed and used by the NWS (Bomar, 1995; Carr, 1967). However, for this study the southeastern bound-ary of the Edwards Plateau region was positioned one county farther southeast to incorporate Bexar, Comal, Hays, and Travis Counties. This alternative positioning is considered necessary because large storms in these counties are similar to those in adjacent counties to the northwest (Slade, 1986). Additionally, the Lower Valley (Rio Grande) region was combined with the South Texas region because of the lack of substantial precipi-tation data in the Lower Valley region due to its small geographic area. The climatic regions of Texas used in this study are shown in figure 2, with the Lower Valley also identified.
Data Base of Precipitation Annual Maxima
Data Sources
Information concerning precipitation data for 15-minute, hourly, and daily NWS stations is available through the National Climatic Data Center in Asheville, N.C. (Internet address <http://www.ncdc.noaa.gov/ncdc.html>). The precipitation annual maxima for the selected durations for the NWS stations were compiled
1“Reliability” in this context means that minor changes in (1) spatial and (or) temporal sampling of precipitation annual maxima, (2) distribution choice for modeling the frequency of annual maxima, or (3) method of sample summarization—that is, distribution parameter estimation—can lead to large differences in estimates for very large recurrence intervals. For example, the relative percent differences between 100-, 1,000-, and 10,000-year estimates from the generalized logistic and extreme-value distributions (fitted to a data set characteristic of annual maxima in Texas) are 5.5, 20, and 40 percent, respectively. The relative percent differences increase dramatically for large recurrence intervals although the generalized logistic and extreme-value distributions are closely related.

4 Depth-Duration Frequency of Precipitation for Texas
Fig
ure
1.
Rel
atio
n be
twee
n pr
ecip
itatio
n de
pth
and
stor
m d
urat
ion
for
wor
ld r
ecor
d, T
exas
rec
ord,
and
Tex
as d
ata-
base
max
ima.
60 minutes
1 hour
75
1010
1530
23
612
12
35
ST
OR
M D
UR
AT
ION
2.5
100 34567891015202530405060708090
PRECIPITATION DEPTH, IN INCHES
EX
PL
AN
AT
ION
Wor
ld m
axim
um
dep
th-d
ura
tion
rel
atio
n (W
orld
Met
eoro
logi
cal O
rgan
izat
ion
, 198
6)—
Equ
atio
n co
mpu
tes
enve
lope
cu
rve
Sta
tew
ide
max
imu
m a
t rec
ord
ing
pre
cip
itat
ion
sta
tion
s fo
r co
rres
pon
din
g d
ura
tion
—d
eriv
ed fr
om T
exas
pre
cipi
tati
on d
ata
base
Sel
ecte
d g
reat
est p
reci
pit
atio
n d
epth
s in
Tex
as (J
ohn
Pat
ton
, Nat
ion
al W
eath
er S
ervi
ce, w
ritt
en c
omm
un
., 19
96)—
Num
ber
Max
imu
m s
tate
wid
e 10
0-ye
ar p
reci
pit
atio
n d
epth
—d
eriv
ed fr
om d
epth
-dur
atio
n fr
eque
ncy
anal
ysis
in r
epor
t
New
Bra
unfe
ls (
5/11
–12/
1972
)
D’H
anis
(5/
31/3
5)
Ode
m (
10/1
9/84
)T
hral
l (9/
6–10
/192
1)
Ingr
am (
6/30
–7/2
/193
2)
Alv
in (
7/24
–27/
1979
)
Med
ina
and
Ker
r
Sha
ckel
ford
Cou
nty
(8/1
–3/1
978)
Cou
ntie
s (8
/1–3
/197
8)
(2.8
)
(3.2
)
(3.5
)
(4.1
)
(4.1
)
(4.0
)
in p
aren
thes
is is
rat
io o
f dep
th to
100
-yea
r d
epth
for
corr
espo
ndin
g lo
calit
y d
eriv
ed fr
om d
epth
-dur
atio
n fr
eque
ncy
anal
ysis
,
P =
2.37
D.4
75 (D
in m
inut
es)
figu
res
10–4
6
1M
INU
TE
SH
OU
RS
DA
YS
24 hours
1 day
(2.8
)
Not
e: T
his
valu
e m
ight
be
in e
rror
ow
ing
to it
s re
latio
n to
the
othe
r st
atew
ide
max
ima.
Max
imum
100
-yea
r pre
cipi
tatio
n de
pth
occu
rs a
t mos
t sou
thea
ster
n pa
rt o
f Sta
te
INTRODUCTION 5
by Hydrosphere Data Products, Inc. (1996). The 15-minute data generally are available for 1972–94. Hourly precipitation data generally are available for 1948–94. Daily precipitation data are available for about 1910–94. Additionally, the precipitation record was extended for nine hourly stations from data provided by the NWS (John Vogel, written commun., 1996).
The 15-, 30- and 60-minute annual maxima were compiled from the 15-minute data. The 1-, 2-, 3-, 6-,
12-, and 24-hour annual maxima were compiled from the hourly data; likewise, the 1-, 2-, 3-, 5-, and 7-day annual maxima were compiled from the daily data. To clarify potentially confusing terminology in this report, the term “60-minute” duration is associated with the aggregation of four consecutive 15-minute data values as opposed to the 1-hour data from a single value. Sim-ilarly, the term “24-hour” duration is associated with the aggregation of 24 consecutive 1-hour data values as
HIGHPLAINS
TRANS-PECOS
SOUTHTEXAS
EDWARDSPLATEAU
LOWER VALLEY
SOUTHCENTRAL
NORTHCENTRAL
EASTTEXAS
LOWROLLINGPLAINS
UPPERCOAST
Note: The Lower Valley region was combined with the South Texas region for this study. (Lower Valley shown here for completeness)
EXPLANATION
Climatic region boundary
Figure 2. Modified National Weather Service climatic regions of Texas (modified from Carr, 1967).
6 Depth-Duration Frequency of Precipitation for Texas
opposed to the 1-day data from a single value. For some years, the influence of missing record or deleted record caused inconsistencies in the availability of depths for all the durations. In these instances, the missing or deleted year was removed from the data base. Removal of some years did not greatly reduce the available pre-cipitation data for Texas.
Only those stations that have at least 10 years of data were selected for inclusion in this study. The author believes that a minimum of 10 years of data for stations in Texas is needed before the data become representa-tive of the true precipitation characteristics. A basis for the 10-year minimum record length is that droughts or periods of abundant rainfall in Texas seldom last more than 4 to 5 years. Therefore, using data with at least 10 years of record is an attempt to insure that the col-lected data are not unduly biased by the cyclical nature of the climate.
The 15-minute, hourly, and daily NWS stations used for this study are listed in the Appendices. The locations of the 15-minute, hourly, and daily stations are shown on plate 1.
Each of the three types of precipitation stations generally are uniformly distributed around the State; however, of the three, the daily precipitation stations have the densest network. The areal densities in stations per 1,000 square miles (mi2) for each of the station types are 0.646, 1.02, and 3.23 for the 15-minute, hourly, and daily stations, respectively. The distribution of record length for each region and station type are shown in figure 3. The figure indicates that the record length is reasonably well distributed among the regions for each of the station types. However, there are clear differences in the record availability between the station types. In general, the daily stations have the longest records of the three station types; whereas, the 15-minute stations have the shortest records.
To illustrate the inherent variability of a series of 1-day precipitation annual maxima, graphs are shown for each climatic region using data from a long-term station (figs. 4–6). Similar variability is indicated by graphs of the 15-minute and hourly stations (not included in this report). Additionally, figures 4–6 show the median and mean beginning and ending years of daily precipitation stations for each climatic region.
Occasionally an existing station is relocated to a nearby site, and new stations might be established near an existing station. If the distance between two or more stations is small, then their records were assumed equiv-alent and combined into one longer record. Geographic
proximity (about 3 mi north to south or 2 mi east to west) is the basis for combining the records of a few sta-tions. For this study, (1) the records of 8 fifteen-minute stations were combined into 4 records; (2) the records of 30 hourly stations were combined into 15 records; and (3) the records of 47 daily stations were combined into 23 records. The combined records are not separately identified; however, they can be determined from the station names in the Appendices.
Correction of Precipitation Annual Maxima for Fixed-Interval Recording
The ratios of 60-minute to 1-hour maxima and 24-hour to 1-day maxima were analyzed. Both the 1-hour and 1-day maxima generally are less than the 60-minute and 24-hour maxima, respectively, because the 1-hour and 1-day maxima are collected on a fixed-interval basis (beginning to end of each hour or mid-night to midnight); whereas, the 60-minute and 24-hour maxima are determined with four consecutive or “moving” 15-minute windows or 24 consecutive 1-hour windows, respectively. In total, 170 stations have con-current 15-minute (therefore 60-minute) and hourly maxima, which comprise about 2,900 values; and 144 stations have concurrent hourly (therefore 24-hour) and daily maxima, which comprise about 4,800 values. A 60-minute to 1-hour weighted-mean ratio of 1.13 [weighted standard deviation (SD) = 0.054] and a 24-hour to 1-day weighted-mean ratio of 1.13 (weighted SD = 0.082) were determined for the entire State. The weighting is based on record length for each station. The spatial distribution of the two mean ratios was investigated. The mean ratios show no apparent spatial dependence.
Weiss (1964) considered the ratio of true to fixed-interval maxima on the basis of probability theory and determined a theoretical “correction” factor of 1.143 for the true 60-minute to hourly maxima and for the true 24-hour to daily maxima. Miller and others (1973) used an empirically derived factor of 1.13. Both factors are either reasonably close to or match those determined for this report. On a conceptual basis, both empirical factors from this report would be expected to be slightly less than the theoretical factor because both the 60-minute and 24-hour maxima were developed from finite samples (15-minute or 1-hour intervals) and therefore are biased slightly downward themselves.
However, it is possible that Weiss’s corrections are too large, given that 1.13 has been determined by

INTRODUCTION 7
(17) (14) (57) (19) (14) (29) (7)(7)
(9)
0
130
20
40
60
80
100
120
RE
CO
RD
LE
NG
TH
, IN
YE
AR
S
EXPLANATION
Minimum value25th percentileMedian75th percentileMaximum value
(17) Number of stationsDistribution of record length
(26)
(21)(73)
(33)
(27)
(50)
(12)
(18)
(14)
0
130
20
40
60
80
100
120
RE
CO
RD
LE
NG
TH
, IN
YE
AR
S
(83) (79)
(178)
(127)
(58)
(160) (64) (56) (60)
CLIMATIC REGION
0
130
0
20
40
60
80
100
120
RE
CO
RD
LE
NG
TH
, IN
YE
AR
S
15-MINUTE STATIONS
HOURLY STATIONS
DAILY STATIONS
HIG
HP
LAIN
S
LOW
RO
LLIN
GP
LAIN
S
TR
AN
S-
PE
CO
S
EA
ST
TE
XA
S
SO
UT
HC
EN
TR
AL
UP
PE
RC
OA
ST
NO
RT
HC
EN
TR
AL
SO
UT
HT
EX
AS
ED
WA
RD
SP
LAT
EA
U
Interquartile range
Figure 3. Record-length distribution for 15-minute, hourly, and daily precipitation stations in climatic regions of Texas.
8 Depth-Duration Frequency of Precipitation for Texas
Fig
ure
4.
Tim
e se
ries
of 1
-day
pre
cipi
tatio
n an
nual
max
ima
for
long
-ter
m s
tatio
ns (
1778
, 226
6, a
nd 2
444)
and
dis
trib
utio
n of
ava
ilabl
e re
cord
in
corr
espo
ndin
g cl
imat
ic r
egio
ns o
f Tex
as.
020 51015
EX
PL
AN
AT
ION
1-d
ay p
reci
pit
atio
n a
nn
ual
max
imu
m f
or s
tati
on
Med
ian
beg
inn
ing
or e
nd
ing
year
for
all
1-d
ay s
tati
ons
in r
egio
n
Mea
n b
egin
nin
g or
en
din
g ye
ar f
or a
ll 1
-day
sta
tion
s in
reg
ion
020 51015
PRECIPITATION ANNUAL MAXIMA, IN INCHES
1895
1995
1900
1910
1920
1930
1940
1950
1960
1970
1980
1990
YE
AR
020 051015
HIG
H P
LAIN
S83
ST
AT
ION
SM
EA
N R
EC
OR
D: 5
2 Y
EA
RS
ST
AT
ION
: 177
8 C
LAU
DE
UP
PE
R C
OA
ST
56 S
TA
TIO
NS
ME
AN
RE
CO
RD
: 48
YE
AR
S
ST
AT
ION
: 226
6 D
AN
EV
AN
G 1
WE
ST
EA
ST
TE
XA
S12
7 S
TA
TIO
NS
ME
AN
RE
CO
RD
: 41
YE
AR
S
ST
AT
ION
: 244
4 D
IALV
ILLE
2 W
ES
T
INTRODUCTION 9
Fig
ure
5.
Tim
e se
ries
of 1
-day
pre
cipi
tatio
n an
nual
max
ima
for
long
-ter
m s
tatio
ns (
3262
, 387
3, a
nd 3
992)
and
dis
trib
utio
n of
ava
ilabl
e re
cord
in
corr
espo
ndin
g cl
imat
ic r
egio
ns o
f Tex
as.
PRECIPITATION ANNUAL MAXIMA, IN INCHES
020 51015 020 51015 1895
1995
1900
1910
1920
1930
1940
1950
1960
1970
1980
1990
YE
AR
020 51015
TR
AN
S-P
EC
OS
58 S
TA
TIO
NS
ME
AN
RE
CO
RD
: 39
YE
AR
S
ST
AT
ION
: 326
2 F
OR
T D
AV
IS
SO
UT
H C
EN
TR
AL
64 S
TA
TIO
NS
ME
AN
RE
CO
RD
: 50
YE
AR
S
ST
AT
ION
: 387
3 H
ALL
ET
TS
VIL
LE 2
NO
RT
H
LOW
RO
LLIN
G P
LAIN
S79
ST
AT
ION
SM
EA
N R
EC
OR
D: 4
7 Y
EA
RS
ST
AT
ION
: 399
2 H
AS
KE
LL
EX
PL
AN
AT
ION
1-d
ay p
reci
pit
atio
n a
nn
ual
max
imu
m f
or s
tati
on
Med
ian
beg
inn
ing
or e
nd
ing
year
for
all
1-d
ay s
tati
ons
in r
egio
n
Mea
n b
egin
nin
g or
en
din
g ye
ar f
or a
ll 1
-day
sta
tion
s in
reg
ion
10 Depth-Duration Frequency of Precipitation for Texas
Fig
ure
6.
Tim
e se
ries
of 1
-day
pre
cipi
tatio
n an
nual
max
ima
for
long
-ter
m s
tatio
ns (
4058
, 527
2, a
nd 9
522)
and
dis
trib
utio
n of
ava
ilabl
e re
cord
in
corr
espo
ndin
g cl
imat
ic r
egio
ns o
f Tex
as.
020 051015 020 051015
PRECIPITATION ANNUAL MAXIMA, IN INCHES
1890
1995
1890
1900
1910
1920
1930
1940
1950
1960
1970
1980
1990
YE
AR
020 051015
SO
UT
H T
EX
AS
60 S
TA
TIO
NS
ME
AN
RE
CO
RD
: 50
YE
AR
S
ST
AT
ION
: 405
8 H
EB
BR
ON
VIL
LE
ED
WA
RD
S P
LAT
EA
U16
0 S
TA
TIO
NS
ME
AN
RE
CO
RD
: 35
YE
AR
S
ST
AT
ION
: 527
2 LL
AN
O
NO
RT
H C
EN
TR
AL
178
ST
AT
ION
SM
EA
N R
EC
OR
D: 4
6 Y
EA
RS
ST
AT
ION
: 952
2 W
AX
AH
AC
HIE
EX
PL
AN
AT
ION
1-d
ay p
reci
pit
atio
n a
nn
ual
max
imu
m f
or s
tati
on
Med
ian
beg
inn
ing
or e
nd
ing
year
for
all
1-d
ay s
tati
ons
in r
egio
n
Mea
n b
egin
nin
g or
en
din
g ye
ar f
or a
ll 1
-day
sta
tion
s in
reg
ion
INTRODUCTION 11
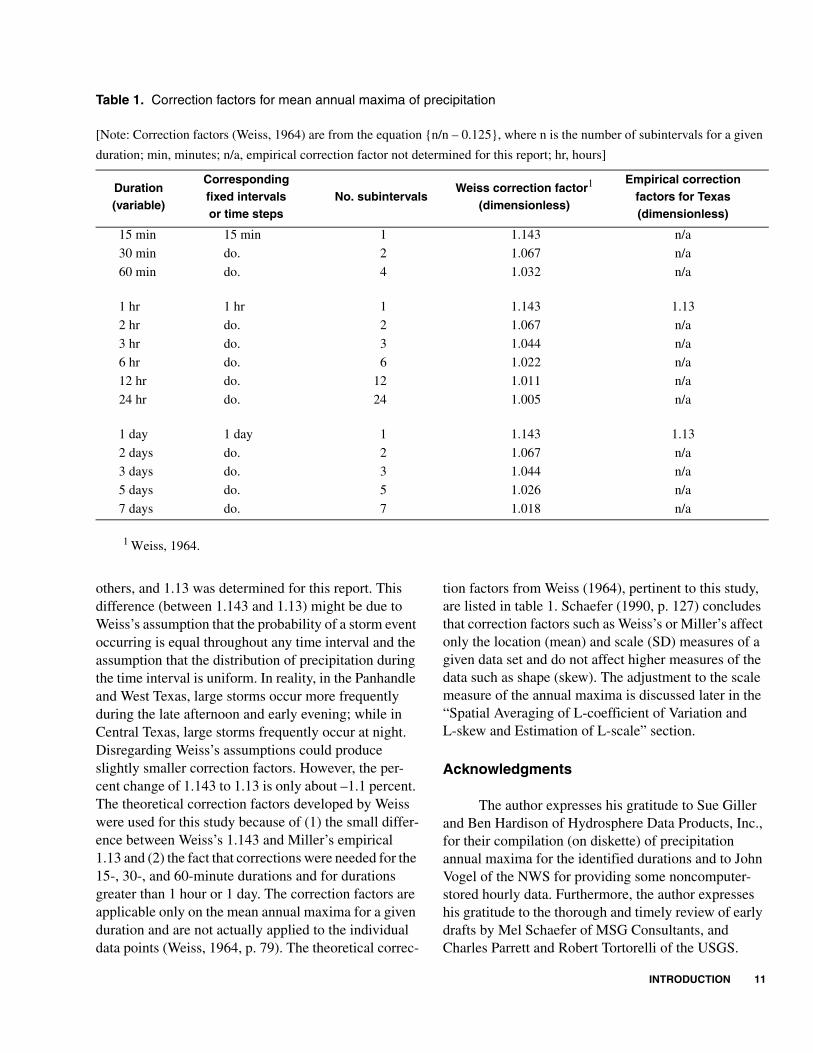
others, and 1.13 was determined for this report. This difference (between 1.143 and 1.13) might be due to Weiss’s assumption that the probability of a storm event occurring is equal throughout any time interval and the assumption that the distribution of precipitation during the time interval is uniform. In reality, in the Panhandle and West Texas, large storms occur more frequently during the late afternoon and early evening; while in Central Texas, large storms frequently occur at night. Disregarding Weiss’s assumptions could produce slightly smaller correction factors. However, the per-cent change of 1.143 to 1.13 is only about –1.1 percent. The theoretical correction factors developed by Weiss were used for this study because of (1) the small differ-ence between Weiss’s 1.143 and Miller’s empirical 1.13 and (2) the fact that corrections were needed for the 15-, 30-, and 60-minute durations and for durations greater than 1 hour or 1 day. The correction factors are applicable only on the mean annual maxima for a given duration and are not actually applied to the individual data points (Weiss, 1964, p. 79). The theoretical correc-
tion factors from Weiss (1964), pertinent to this study, are listed in table 1. Schaefer (1990, p. 127) concludes that correction factors such as Weiss’s or Miller’s affect only the location (mean) and scale (SD) measures of a given data set and do not affect higher measures of the data such as shape (skew). The adjustment to the scale measure of the annual maxima is discussed later in the “Spatial Averaging of L-coefficient of Variation and L-skew and Estimation of L-scale” section.
Acknowledgments
The author expresses his gratitude to Sue Giller and Ben Hardison of Hydrosphere Data Products, Inc., for their compilation (on diskette) of precipitation annual maxima for the identified durations and to John Vogel of the NWS for providing some noncomputer-stored hourly data. Furthermore, the author expresses his gratitude to the thorough and timely review of early drafts by Mel Schaefer of MSG Consultants, and Charles Parrett and Robert Tortorelli of the USGS.
Table 1. Correction factors for mean annual maxima of precipitation
[Note: Correction factors (Weiss, 1964) are from the equation {n/n – 0.125}, where n is the number of subintervals for a given
duration; min, minutes; n/a, empirical correction factor not determined for this report; hr, hours]
1 Weiss, 1964.
Duration(variable)
Correspondingfixed intervalsor time steps
No. subintervalsWeiss correction factor1
(dimensionless)
Empirical correctionfactors for Texas(dimensionless)
15 min 15 min 1 1.143 n/a
30 min do. 2 1.067 n/a
60 min do. 4 1.032 n/a
1 hr 1 hr 1 1.143 1.13
2 hr do. 2 1.067 n/a
3 hr do. 3 1.044 n/a
6 hr do. 6 1.022 n/a
12 hr do. 12 1.011 n/a
24 hr do. 24 1.005 n/a
1 day 1 day 1 1.143 1.13
2 days do. 2 1.067 n/a
3 days do. 3 1.044 n/a
5 days do. 5 1.026 n/a
7 days do. 7 1.018 n/a
12 Depth-Duration Frequency of Precipitation for Texas
REGIONALIZATION OF PRECIPITATION ANNUAL MAXIMA
The concept of “regionalization” in the context of a precipitation frequency analysis is the process by which the precipitation characteristics surrounding a particular station are combined or “pooled together” to develop more accurate statistical summaries of precipitation characteristics than can be derived from a single station. Additionally, once regionalization is completed, precipitation frequency can be estimated for locations other than precipitation stations.
The underlying assumption of the regionalization approach adopted for Texas is that the parameters of the distribution selected to model the frequency of annual maxima can be expressed as either spatially continuous variables or as single statewide means. A parameter is considered expressible by contours on a map (instead of a single statewide mean) provided that the root mean square error (RMSE) associated with the mapped con-tours of a parameter is appreciably smaller than the statewide SD of the parameter. If the percent decrease from the statewide SD to the RMSE is not at least 15 percent, then a contour map is considered no better than a single statewide mean. A tenet of the underlying assumption is that a single distribution is appropriate for modeling the frequency of annual maxima for a given duration.
The five primary elements of the regionalization approach of precipitation annual maxima for this report are (1) to compute the L-moment statistics for each station and determine an appropriate distribution for modeling the frequency of annual maxima; (2) to improve the estimation of the L-coefficient of variation and L-skew by spatial averaging; (3) to estimate a corrected L-scale from the product of the corrected mean depth and the spatially averaged L-coefficient of variation; (4) to transform the L-moment statistics to the parameters of the distribution; and (5) to contour the parameters using “spatial interpolation” based on the geostatistical method of kriging to produce maps that depict the magnitude and spatial variation of the param-eters. The precipitation depth (X) for a specified nonex-ceedance probability (F) and duration (d) for any location in Texas is determined by obtaining the distri-bution parameters from the contour maps and comput-ing the quantiles, Xd(F), from the equation defining the distribution.
L-moments
This section presents a brief introduction to the theory of L-moments and the technique for selecting an appropriate probability distribution. Comprehensive discussion pertinent to L-moments, their historical development, and distribution selection can be found in Hosking (1986, 1990), Hosking and Wallis (1993, 1997), and Vogel and Fennessey (1993).
Consider a random variable X (precipitation depth in this report) with a cumulative probability distribution function F (nonexceedance probability). The quantities
, (1)
where E = the expectation operator, are known as probability-weighted moments (PWM) as defined by Greenwood and others (1979). By letting Mijk = M1r0, the PWM for moment r can be expressed as
. (2)
An unbiased sample estimate of βr (PWM) for any distribution is computed from the following (Landwehr and others, 1979):
, (3)
where= unbiased sample estimate of for moment
number r = 0, 1, 2, . . . and= ordered values of X where is the largest
observation and is the smallest.
In a sense, the PWM are somewhat analogous to the more widely known product moments (mean, SD, coefficient of variation, skew, kurtosis). For example, b0 is equal to the mean; however, interpretation of the higher-order PWM is difficult. To facilitate PWM inter-pretation, Hosking (1986, 1990) developed L-moments as specific linear combinations of the PWM. Unbiased L-moment sample estimates are obtained by substitut-ing the sample estimates of βr into the following equation:
. (4)
Mijk E X iF j 1 F–( )k[ ] X iF j 1 F–( )k Fd0
1
∫= =
βr E XFr[ ]=
br1n---
n j–r
n 1–r
----------------- xj
j 1=
n r–
∑=
br βr
x j( ) x 1( )x n( )
λr 1+ βk 1–( )r k– rk
r k+k
k 0=
r
∑=
REGIONALIZATION OF PRECIPITATION ANNUAL MAXIMA 13
The L-moments can be formulated into values that are exactly analogous, though not equal, to the product moments (Hosking, 1990). The mean, scale, coefficient of variation, skewness, and kurtosis of a distribution estimated using equation 4 are expressed by the follow-ing L-moments and L-moment ratios:
mean, and corrected mean (Weiss, 1964); (5)
L-scale; (6)
L-coefficient of variation (L–CV); (7)
L-skew; and (8)
L-kurtosis. (9)
For this report, the L-moments and the L-moment ratios were calculated for each duration and for each station using unbiased estimators. The use of the unbi-ased estimators for L-moment computation decreases the chance of selecting an inappropriate distribution to fit to a given data set (Hosking and Wallis, 1995, p. 2,024).
L-moment ratio diagrams allow simple compari-sons between the sample estimates of τ3 and τ4 and their theoretical counterparts from selected distributions. Discussion of L-moment ratio diagrams is available in the previously identified sources at the beginning of this section and others in the “Selected References.” Vogel and Fennessey (1993) demonstrated the significant differences between product-moment ratio diagrams (skew and kurtosis) and L-moment ratio diagrams; fur-thermore, they concluded that L-moment ratio diagrams always should be preferred over product-moment ratio diagrams for distribution selection.
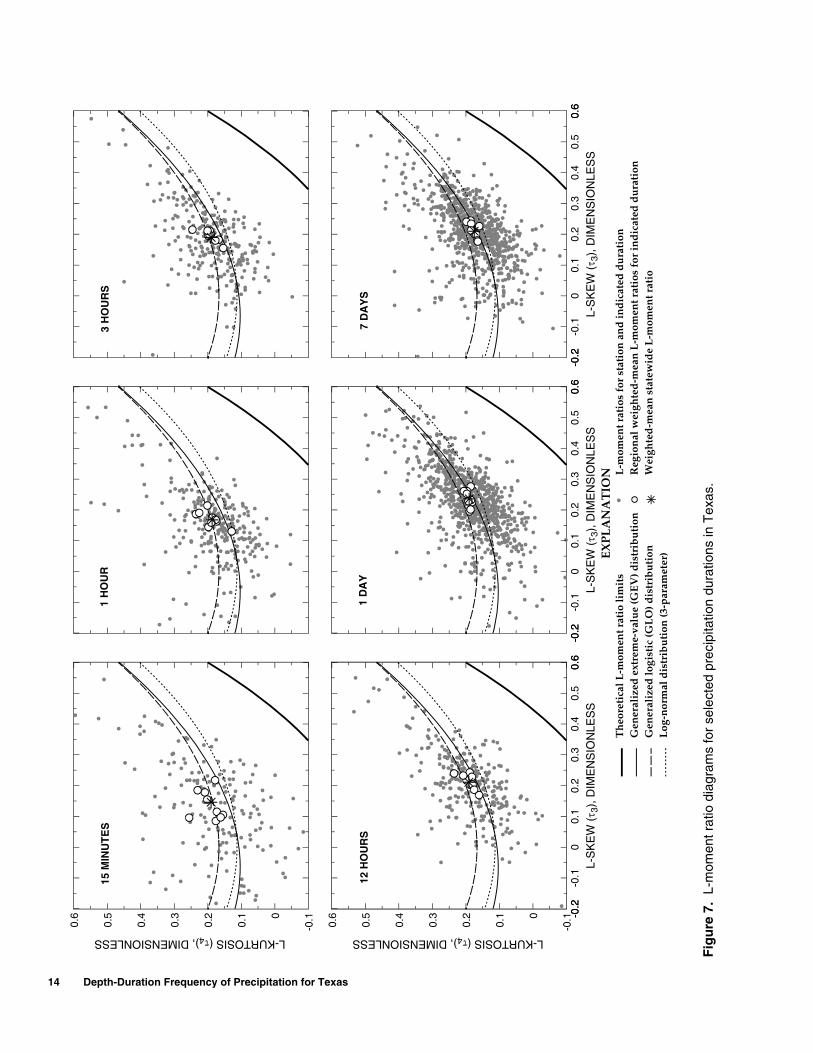
The relation between values of τ3 and τ4 and weighted-mean values of τ3 and τ4 for the State to the theoretical τ3 and τ4 relations (Hosking, 1991b) from the generalized extreme value (GEV), generalized logistic (GLO), and log-normal distributions are shown in figure 7. The gray points represent the τ3 and τ4 for each station. The scatter around the cluster of regional (weighted) means and around the single statewide (weighted) mean, in general, represents sampling vari-
ability—that is, stations with long record are more likely to have τ3 and τ4 that plot closer to the cluster of regional means and to the single statewide mean. The generalized Pareto and Pearson Type III distributions (Hosking, 1990; Stedinger and others, 1993) were eval-uated, and the τ3 and τ4 relation from the data was found to be clearly different from the generalized Pareto and Pearson Type III distributions. Therefore, the general-ized Pareto and Pearson Type III distributions are not shown in figure 7. Figure 7 indicates that the data for the corresponding weighted mean of τ3 and τ4 generally plot between the GLO and GEV distributions. The fig-ure further indicates that the data for 15-minute duration and the corresponding weighted values of τ3 and τ4 cluster around the GLO distribution; and the data for the 7-day duration and the corresponding weighted val-ues cluster around the GEV distribution. Additionally, there exists a steady trend away from the GLO to the GEV distribution as duration increases, as shown by the movement of the weighted-mean statewide data point as duration increases. This trend is supported in similar L-moment ratio diagrams (not reported here) for the durations not shown in figure 7. The log-normal distri-bution can be dismissed on the basis of its general rela-tion to the data points.
From the L-moment ratio diagrams, the author concludes that the distribution shifts from GLO like to GEV like between the 12-hour and 1-day duration. Although a change from the GLO to GEV distribution is observed between the 12-hour and 1-day duration, determination of an exact duration for which the change occurs is difficult. Therefore, the GLO distribution was selected for durations up to and including 24 hours, and the GEV distribution was selected for durations of 1 day or more.
Goodness-of-fit measures (Z-statistics) of the GLO and GEV distributions were computed for each duration following the methods of Hosking and Wallis (1993) by considering the entire State as a single region (see weighted statewide mean in fig. 7). The Z-statistics of the GLO and GEV distributions of each duration are listed in table 2. The Z-statistics of the GLO distribution are less than those of the GEV distribution for 15 min-utes to 24 hours, whereas the Z-statistics of the GEV distribution are smaller than those of the GLO distribu-tion for 1 to 7 days.
The goodness-of-fit measure can be interpreted in two ways. The first interpretation (Hosking and Wallis, 1993) is that a distribution is considered appro-priate if the absolute value of the Z-statistic is less
λr( ) τr( )
λ1 ≡ λ′1 1.022 λ1( )≡
λ2 ≡
τ2λ2λ1----- ≡=
τ3λ3λ2----- ≡=
τ4λ4λ2----- ≡=
14 Depth-Duration Frequency of Precipitation for Texas
Fig
ure
7.
L-m
omen
t rat
io d
iagr
ams
for
sele
cted
pre
cipi
tatio
n du
ratio
ns in
Tex
as.
-0.2
0.6
-0.2
-0.1
00.
10.
20.
30.
40.
50.
6
L-S
KE
W (
τ 3),
DIM
EN
SIO
NLE
SS
-0.10.6 0
0.1
0.2
0.3
0.4
0.5
L-KURTOSIS (τ4), DIMENSIONLESS
-0.10.6 0
0.1
0.2
0.3
0.4
0.5
L-KURTOSIS (τ4), DIMENSIONLESS
-0.2
0.6
-0.2
-0.1
00.
10.
20.
30.
40.
50.
6
L-S
KE
W (
τ 3),
DIM
EN
SIO
NLE
SS
-0.2
0.6
-0.2
-0.1
00.
10.
20.
30.
40.
50.
6
L-S
KE
W (
τ 3),
DIM
EN
SIO
NLE
SS
15 M
INU
TE
S1
HO
UR
3 H
OU
RS
12 H
OU
RS
1 D
AY
7 D
AY
S
EX
PL
AN
AT
ION
Th
eore
tica
l L-m
omen
t rat
io li
mit
sG
ener
aliz
ed e
xtre
me-
valu
e (G
EV
) dis
trib
uti
onG
ener
aliz
ed lo
gist
ic (G
LO
) dis
trib
uti
onL
og-n
orm
al d
istr
ibu
tion
(3-p
aram
eter
)
L-m
omen
t rat
ios
for
stat
ion
an
d in
dic
ated
du
rati
onR
egio
nal
wei
ghte
d-m
ean
L-m
omen
t rat
ios
for
ind
icat
ed d
ura
tion
Wei
ghte
d-m
ean
sta
tew
ide
L-m
omen
t rat
io
REGIONALIZATION OF PRECIPITATION ANNUAL MAXIMA 15
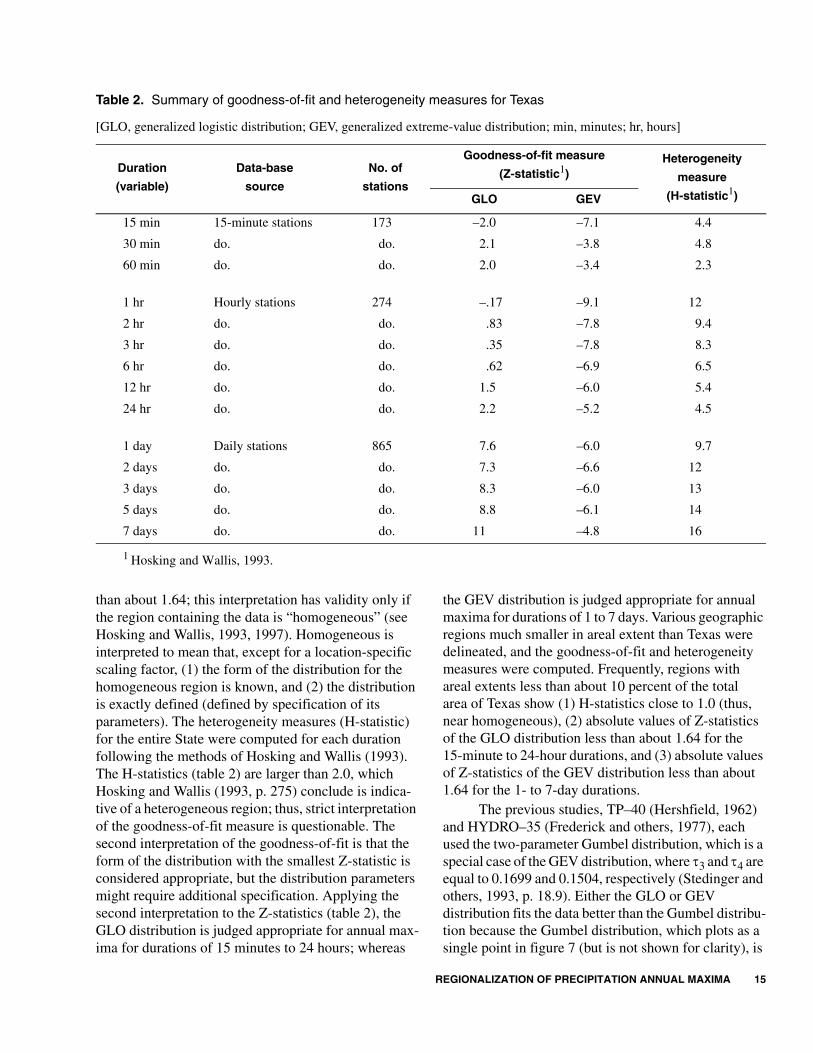
than about 1.64; this interpretation has validity only if the region containing the data is “homogeneous” (see Hosking and Wallis, 1993, 1997). Homogeneous is interpreted to mean that, except for a location-specific scaling factor, (1) the form of the distribution for the homogeneous region is known, and (2) the distribution is exactly defined (defined by specification of its parameters). The heterogeneity measures (H-statistic) for the entire State were computed for each duration following the methods of Hosking and Wallis (1993). The H-statistics (table 2) are larger than 2.0, which Hosking and Wallis (1993, p. 275) conclude is indica-tive of a heterogeneous region; thus, strict interpretation of the goodness-of-fit measure is questionable. The second interpretation of the goodness-of-fit is that the form of the distribution with the smallest Z-statistic is considered appropriate, but the distribution parameters might require additional specification. Applying the second interpretation to the Z-statistics (table 2), the GLO distribution is judged appropriate for annual max-ima for durations of 15 minutes to 24 hours; whereas
the GEV distribution is judged appropriate for annual maxima for durations of 1 to 7 days. Various geographic regions much smaller in areal extent than Texas were delineated, and the goodness-of-fit and heterogeneity measures were computed. Frequently, regions with areal extents less than about 10 percent of the total area of Texas show (1) H-statistics close to 1.0 (thus, near homogeneous), (2) absolute values of Z-statistics of the GLO distribution less than about 1.64 for the 15-minute to 24-hour durations, and (3) absolute values of Z-statistics of the GEV distribution less than about 1.64 for the 1- to 7-day durations.
The previous studies, TP–40 (Hershfield, 1962) and HYDRO–35 (Frederick and others, 1977), each used the two-parameter Gumbel distribution, which is a special case of the GEV distribution, where τ3 and τ4 are equal to 0.1699 and 0.1504, respectively (Stedinger and others, 1993, p. 18.9). Either the GLO or GEV distribution fits the data better than the Gumbel distribu-tion because the Gumbel distribution, which plots as a single point in figure 7 (but is not shown for clarity), is
Table 2. Summary of goodness-of-fit and heterogeneity measures for Texas
[GLO, generalized logistic distribution; GEV, generalized extreme-value distribution; min, minutes; hr, hours]
1 Hosking and Wallis, 1993.
Duration
(variable)
Data-base
source
No. of
stations
Goodness-of-fit measure
(Z-statistic1)Heterogeneity
measure
(H-statistic1)GLO GEV
15 min 15-minute stations 173 –2.0 –7.1 4.4
30 min do. do. 2.1 –3.8 4.8
60 min do. do. 2.0 –3.4 2.3
1 hr Hourly stations 274 –.17 –9.1 12
2 hr do. do. .83 –7.8 9.4
3 hr do. do. .35 –7.8 8.3
6 hr do. do. .62 –6.9 6.5
12 hr do. do. 1.5 –6.0 5.4
24 hr do. do. 2.2 –5.2 4.5
1 day Daily stations 865 7.6 –6.0 9.7
2 days do. do. 7.3 –6.6 12
3 days do. do. 8.3 –6.0 13
5 days do. do. 8.8 –6.1 14
7 days do. do. 11 –4.8 16
16 Depth-Duration Frequency of Precipitation for Texas
not as close to the data as the GLO or the GEV distribu-tions. The two-parameter Gumbel distribution is not as “flexible” for fitting to data having different τ3.
The investigation of precipitation frequency in Washington (Schaefer, 1990) determined that the GEV distribution was appropriate for durations of 2, 6, and 24 hours, although subsequent investigation by Schaefer (1993) determined that the four-parameter Kappa distribution (Hosking, 1994) was a better choice2. The investigations of precipitation frequency by Huff and Angel (1992) and Parrett (1997) deter-mined that the GEV distribution was appropriate for durations of 1 or more days for the midwestern United States and Montana, respectively.
Generalized Logistic and Generalized Extreme-Value Distributions
The GLO distribution (Hosking, 1990) was selected as appropriate for the entire State and for dura-tions of 15 minutes to 24 hours. Computation of the pre-cipitation depth for a given frequency, , from the GLO distribution is as follows:
, (10)
where
ξ, α, and κ = location, scale, and shape parameters, respectively, of the GLO distribution, and
F = annual nonexceedance probability, 1 –
exceedance probability, or [1 – (1/T)]
where T is recurrence interval.
Alternatively, if a storm depth for a given duration is known, the storm’s point nonexceedance probability
can be estimated by the following inversion of equation 10:
. (11)
Equations for estimating the parameters of the GLO distribution are in Hosking (1990). The parameters of the GLO distribution are estimated from L-moments by the following:
; (12)
, (13)
where= the gamma function;
. (14)
The ξ parameter of the GLO distribution describes the location of the distribution and is interpreted as the median depth, or alternatively, as the 2-year depth for a given duration. The scale and shape of the distribution are described by α and κ, respectively. Both ξ and α have units of inches, and κ is dimensionless.
The GEV distribution (Stedinger and others, 1993, p. 18.16–19) was selected as appropriate for the entire State for 1-day and greater durations. Computa-tion of from the GEV distribution is as follows:
, (15)
whereξ, α, and κ = location, scale, and shape parameters,
respectively, of the GEV distribution; and
ln (F) = natural logarithm of annual nonexceed-ance probability.
Alternatively, if a storm depth for a given duration is known, the storm’s “point” annual nonexceedance probability can be estimated by the following inversion of equation 15:
. (16)
2 The four-parameter Kappa distribution is a more flexible distribution than the three-parameter distributions. On an L-moment ratio diagram, the Kappa distribution plots as an area, not a line, and therefore can take on τ3 and τ4 values between the theoretical GLO and GEV distribution lines (Hosking, 1994). The four-parameter Kappa distribution was considered briefly for this report; however, it was not chosen because (1) its use requires the specification of another parameter and (2) the differences between these three distributions (GLO, GEV, and Kappa) are mitigated by the upper recurrence interval bound of 500 years.
Xd F( )
Xd F( ) ξ ακ--- 1 1 F–( )
F-----------------
κ–
+=
F 1
1 1 κα--- Xd F( ) ξ–[ ]–
1 κ⁄
+
-------------------------------------------------------------------=
κ τ3–=
αλ2
Γ 1 κ+( )Γ 1 κ–( )-------------------------------------------=
Γ –( )
ξ λ1λ2 α–( )
κ--------------------+=
Xd F( )
Xd F( ) ξ ακ--- 1 F( )ln–[ ]κ
–{ }+=
F e1 κ
α--- Xd F( ) ξ–[ ]–
1 κ⁄
–
=

REGIONALIZATION OF PRECIPITATION ANNUAL MAXIMA 17
Equations for estimating the parameters of the GEV distribution are presented in Hosking (1990). The parameters of the GEV distribution are estimated from L-moments by the following:
, (17)
, (18)
, (19)
. (20)
The GEV distribution parameters (ξ, α, and κ) are somewhat analogous to their counterparts in the GLO distribution. However, ξ in the GEV distribution is not interpreted as the median depth because of the different formulation of the GEV distribution from the GLO dis-tribution. Both ξ and α have units of inches, and κ is dimensionless.
Spatial Averaging of L-coefficient of Variation and L-skew and Estimation of L-scale
The values for τ2 and τ3 were spatially averaged in an effort to (1) reduce the random component in their values and (2) improve the accuracy of their estimates. Also, averaging τ2 and τ3 has the desirable effect of reducing the influence of any one station on the eventual contouring of the ξ, α, and κ parameters. Efficient investigation of “discordant” data (see Hosking and Wallis, 1993, p. 272–273) within the entire data base was not feasible because of the large number of stations and durations—in total, some 261,000 individual data values. The first L-moment, the mean, was not spatially averaged because (1) the mean depths exhibit very strong spatial dependence and (2) the estimates of the mean depth of each station are the most accurate of the λ2, τ2, and τ3 statistics.
A formal justification and development of the spatial-averaging method involves the following relation:
, (21)
where ΦS
i(x,y) = the value of τ2 or τ3 for station i at location (x,y);
ΦTi(x,y) = the “true” but always unknown value of τ2
or τ3 for station i; and
ΦNi(r) = the unknown random component of τ2
or τ3, which is a function of record length (r) at the station (with a model-error component included).
In equation 21, ΦTi(x,y) is a constant for the loca-
tion (x,y), whereas both ΦSi(x,y) and ΦN
i(r) are random variables. The references to spatial location and record length in equation 21 are dropped without a loss of gen-erality, and ΦT
i is computed as:
. (22)
Continuing, assume that ΦTi is fixed within the
area defined by n neighboring stations (call this the neighborhood or “mini” region). Specifically, the station of interest is i = 1, the first nearest station is i = 2, the farthest station is i = n; thus, the neighborhood contains n stations:
. (23)
When ΦTi is assumed fixed, ΦT
i becomes spa-tially constant on small geographic scales. On large geo-graphic scales, this assumption is not true; however, if the neighborhood is small, then the gradient of ΦT
i is close to zero, and ΦT
i can be considered constant. Reformulating equation 22 for a neighborhood of five stations (n = 5) yields
. (24)
Next, expand the terms in the summation in equation 24:
. (25)
If the expected value of ΦN is zero, then the expected value of ΦΤ becomes the mean of ΦS
i. How-ever, consider that the random components are time biased; that is, as record length (r) gets large, ΦN
i must get small because ΦS
i must approach ΦTi. Therefore, it
is practical to incorporate record length as a weighting factor on ΦS
i:
Z 23 τ3+( )
------------------- 2( )ln3( )ln
-------------–=
κ 7.8590Z 2.9554Z2+≈
αλ2κ
1 2 κ––( )Γ 1 κ+( )
--------------------------------------------=
ξ λ1ακ--- Γ 1 κ+( ) 1–{ }+=
ΦSi x y,( ) ΦTi x y,( ) ΦNi r( )+=
ΦTi ΦSi ΦNi–=
ΦT1 ΦT2 ΦT3 ΦT4 ΦTn= = = =
5ΦT ΦSi ΦNi–( )
i 1=
5
∑=
ΦT 15--- ΦSi
i 1=
5
∑15--- ΦNi
i 1=
5
∑–=

18 Depth-Duration Frequency of Precipitation for Texas
. (26)
The choice of the weights in equation 26 is some-what arbitrary. Other weights could have been chosen, such as those based upon separation distance from sta-tion i = 1 to station i = n or those based on cross corre-lations in the data.
Equation 26 represents the spatial averaging method used on τ2 and τ3 where n represents the number of nearest (neighborhood) stations to average together. Equation 26 is equivalent to the regional moment estimation equation frequently seen in “index-flood” regional analyses (for example, Hosking and Wallis, 1993, p. 271, eq. 2). Because equation 26 is applied to each duration and each station in the data base, the approach here can be considered a “moving index-flood.” The spatially averaged τ2 and τ3 are rep-resented by the following:
spatially averaged L–CV, and (27)
spatially averaged L-skew. (28)
If n = 1 in equation 26, then no averaging takes place and and are equal to the values for each station; likewise, if n equals the total number of stations (n = 173, 274, or 865), the computed values are weighted statewide means. The assumption that ΦT
i is constant weakens as n gets larger. To determine an appropriate value for n, various values of n were tried, and the effects of different n values were evaluated on the basis of changes in the geographic distribution of τ2 and τ3 and the overall reduction in statewide variance for τ2 and τ3. A value of n = 5, which corresponds to a “mini” region containing five stations being generated for each station, was selected as appropriate. Values of n much greater than about 8 had the effect of severely reducing the variance of τ2 and τ3 across the State and obscuring local variations.
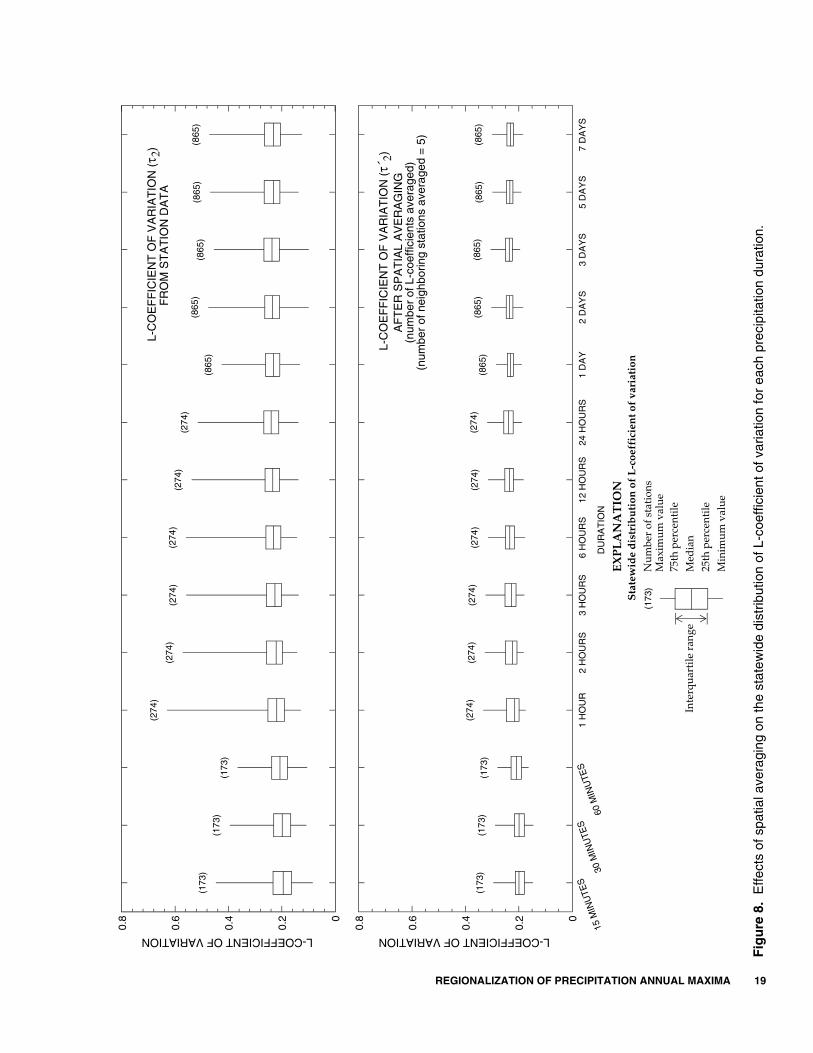
The effects of spatial averaging on the statewide distributions of τ2 and τ3 are shown in figures 8 and 9. The spatial averaging of τ2 and τ3 results in an apprecia-ble reduction in the interquartile range (IQR); and the deviations of values outside the IQR are largely reduced. The median values remain nearly the same
after averaging, suggesting that the values for τ2 and τ3 have not been unduly biased.
The bottom graph of figure 8 illustrates the effects of the spatial averaging on τ2. The median of
increases steadily as the duration increases from 15 minutes to about 24 hours. (The 15- and 30-minute medians are about equal.) The median of takes a downward step from 24 hours to 1 day, after which the median of is nearly constant. The origin of this step trend is unknown. The IQR and the deviations of values outside the IQR are greatly reduced. Also, after spatial averaging (bottom graph), the deviation of values greater than the IQR is similar to the deviation of values less than the IQR, suggesting that a more normal-like distribution of τ2 has been generated.
Analogous to figure 8, the effects of the spatial averaging on the statewide distribution of τ3 are shown in figure 9. The top graph of figure 9 illustrates that the median of τ3 increases with increasing duration from the 30-minute to 1-day duration and then levels off somewhat (or possibly declines). The top graph also illustrates that the IQR is larger for the 15- to 60-minute durations and nearly constant for all other durations. This pattern might be partially due to the shorter record length (thus more sampling variance) of the 15-minute stations (fig. 3). Unlike the deviations of values of τ2 greater than and less than the IQR (top graph of fig. 8), the deviations of values of τ3 greater than and less than the IQR (top graph of fig. 9) are relatively similar for all durations.
The bottom graph of figure 9 illustrates the effects of spatial averaging on τ3. The median of τ3 still increases with increasing duration from the 30-minute to 1-day duration and then levels off somewhat. The 15-minute median τ3 in both graphs is larger than the 30-minute median (whose origin is unknown). The IQR and the deviations of values outside the IQR are greatly reduced.
The author believes that a more accurate estimate of L-scale (λ2) can be determined because more accu-rate values of L–CV ( ) are available from the spatial averaging and because the mean (λ1) has been corrected for fixed-time-interval bias (λ'1). Recalling that τ2 is the ratio between L-scale and the mean (eq. 7), it follows that a more accurate estimate of L-scale than λ2 can be derived from
. (29)
ΦTriΦ
Si
i 1=
n
∑
rii 1=
n
∑
-----------------------=
τ′2 =
τ′3 =
τ′2 τ′3
τ′2
τ′2
τ′2
τ′2
λ′2 λ′1 τ′2( )=
REGIONALIZATION OF PRECIPITATION ANNUAL MAXIMA 19
Fig
ure
8.
Effe
cts
of s
patia
l ave
ragi
ng o
n th
e st
atew
ide
dist
ribut
ion
of L
-coe
ffici
ent o
f var
iatio
n fo
r ea
ch p
reci
pita
tion
dura
tion.
AF
TE
R S
PA
TIA
L A
VE
RA
GIN
G
(173
)
(173
)(1
73)
(274
)
(274
)(2
74)
(274
)(2
74)
(274
)
(865
)
(865
)(8
65)
(865
)(8
65)
0
0.8
0.2
0.4
0.6
L-COEFFICIENT OF VARIATION
(173
)(1
73)
(173
)
(274
)(2
74)
(274
)(2
74)
(274
)(2
74)
(865
)(8
65)
(865
)(8
65)
(865
)
15 M
INU
TES
30 M
INU
TES
60 M
INU
TES
1 H
OU
R2
HO
UR
S3
HO
UR
S6
HO
UR
S12
HO
UR
S24
HO
UR
S1
DA
Y2
DA
YS
3 D
AY
S5
DA
YS
7 D
AY
S0
0.8
0.2
0.4
0.6
L-COEFFICIENT OF VARIATION
L-C
OE
FF
ICIE
NT
OF
VA
RIA
TIO
N (τ´
2)
L-C
OE
FF
ICIE
NT
OF
VA
RIA
TIO
N (τ 2
)F
RO
M S
TA
TIO
N D
AT
A
EX
PL
AN
AT
ION
Min
imum
val
ue25
th p
erce
ntile
Med
ian
75th
per
cent
ileM
axim
um v
alue
(173
)N
umbe
r of
sta
tion
sS
tate
wid
e d
istr
ibu
tion
of
L-c
oeff
icie
nt o
f va
riat
ion
DU
RA
TIO
N
Inte
rqu
arti
le r
ange
(num
ber
of L
-coe
ffici
ents
ave
rage
d)(n
umbe
r of
nei
ghbo
ring
stat
ions
ave
rage
d =
5)

20 Depth-Duration Frequency of Precipitation for Texas
Fig
ure
9.
Effe
cts
of s
patia
l ave
ragi
ng o
n th
e st
atew
ide
dist
ribut
ion
of L
-ske
w fo
r ea
ch p
reci
pita
tion
dura
tion.
(173
)
(173
)(1
73)
(274
)(2
74)
(274
)(2
74)
(274
)(2
74)
(865
)(8
65)
(865
)(8
65)
(865
)
-0.51.0
-0.4
-0.20
0.2
0.4
0.6
0.8
L-SKEW
(173
)(1
73)
(173
)(2
74)
(274
)(2
74)
(274
)(2
74)
(274
)(8
65)
(865
)(8
65)
(865
)(8
65)
-0.51.0
-0.4
-0.20
0.2
0.4
0.6
0.8
L-SKEW
L-S
KE
W (τ´
3) A
FT
ER
SP
AT
IAL
L-S
KE
W (τ 3
) F
RO
M S
TA
TIO
N D
AT
A
EX
PL
AN
AT
ION
Min
imum
val
ue
25th
per
cent
ileM
edia
n75
th p
erce
ntile
Max
imu
m v
alu
e(1
73)
Num
ber
of s
tati
ons
Sta
tew
ide
dis
trib
uti
on o
f L
-sk
ew
15 M
INU
TES
30 M
INU
TES
60 M
INU
TES
1 H
OU
R2
HO
UR
S3
HO
UR
S6
HO
UR
S12
HO
UR
S24
HO
UR
S1
DA
Y2
DA
YS
3 D
AY
S5
DA
YS
7 D
AY
S
DU
RA
TIO
N
AV
ER
AG
ING
Inte
rqu
arti
le r
ange
(num
ber
of L
-ske
w v
alue
s av
erag
ed)
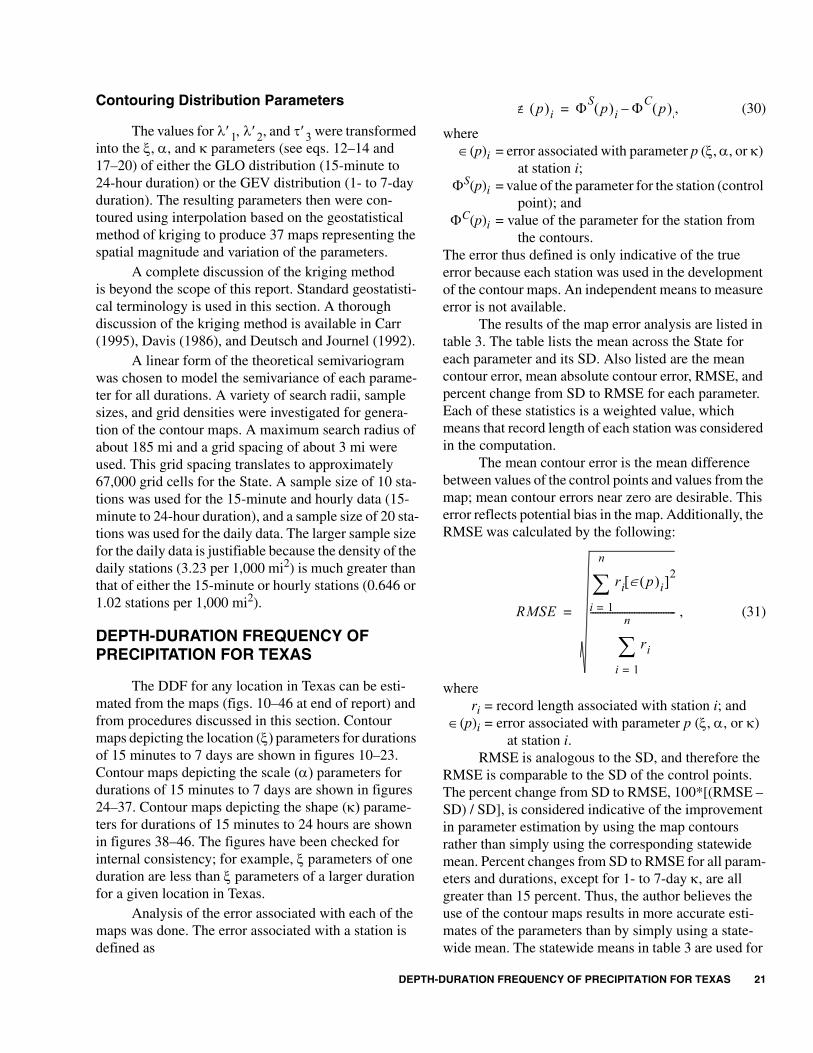
DEPTH-DURATION FREQUENCY OF PRECIPITATION FOR TEXAS 21
Contouring Distribution Parameters
The values for , , and were transformed into the ξ, α, and κ parameters (see eqs. 12–14 and 17–20) of either the GLO distribution (15-minute to 24-hour duration) or the GEV distribution (1- to 7-day duration). The resulting parameters then were con-toured using interpolation based on the geostatistical method of kriging to produce 37 maps representing the spatial magnitude and variation of the parameters.
A complete discussion of the kriging method is beyond the scope of this report. Standard geostatisti-cal terminology is used in this section. A thorough discussion of the kriging method is available in Carr (1995), Davis (1986), and Deutsch and Journel (1992).
A linear form of the theoretical semivariogram was chosen to model the semivariance of each parame-ter for all durations. A variety of search radii, sample sizes, and grid densities were investigated for genera-tion of the contour maps. A maximum search radius of about 185 mi and a grid spacing of about 3 mi were used. This grid spacing translates to approximately 67,000 grid cells for the State. A sample size of 10 sta-tions was used for the 15-minute and hourly data (15-minute to 24-hour duration), and a sample size of 20 sta-tions was used for the daily data. The larger sample size for the daily data is justifiable because the density of the daily stations (3.23 per 1,000 mi2) is much greater than that of either the 15-minute or hourly stations (0.646 or 1.02 stations per 1,000 mi2).
DEPTH-DURATION FREQUENCY OF PRECIPITATION FOR TEXAS
The DDF for any location in Texas can be esti-mated from the maps (figs. 10–46 at end of report) and from procedures discussed in this section. Contour maps depicting the location (ξ) parameters for durations of 15 minutes to 7 days are shown in figures 10–23. Contour maps depicting the scale (α) parameters for durations of 15 minutes to 7 days are shown in figures 24–37. Contour maps depicting the shape (κ) parame-ters for durations of 15 minutes to 24 hours are shown in figures 38–46. The figures have been checked for internal consistency; for example, ξ parameters of one duration are less than ξ parameters of a larger duration for a given location in Texas.
Analysis of the error associated with each of the maps was done. The error associated with a station is defined as
, (30)
where∈(p)i = error associated with parameter p (ξ, α, or κ)
at station i;ΦS(p)i = value of the parameter for the station (control
point); andΦC(p)i = value of the parameter for the station from
the contours.The error thus defined is only indicative of the true error because each station was used in the development of the contour maps. An independent means to measure error is not available.
The results of the map error analysis are listed in table 3. The table lists the mean across the State for each parameter and its SD. Also listed are the mean contour error, mean absolute contour error, RMSE, and percent change from SD to RMSE for each parameter. Each of these statistics is a weighted value, which means that record length of each station was considered in the computation.
The mean contour error is the mean difference between values of the control points and values from the map; mean contour errors near zero are desirable. This error reflects potential bias in the map. Additionally, the RMSE was calculated by the following:
, (31)
whereri = record length associated with station i; and
∈(p)i = error associated with parameter p (ξ, α, or κ) at station i.
RMSE is analogous to the SD, and therefore the RMSE is comparable to the SD of the control points. The percent change from SD to RMSE, 100*[(RMSE – SD) / SD], is considered indicative of the improvement in parameter estimation by using the map contours rather than simply using the corresponding statewide mean. Percent changes from SD to RMSE for all param-eters and durations, except for 1- to 7-day κ, are all greater than 15 percent. Thus, the author believes the use of the contour maps results in more accurate esti-mates of the parameters than by simply using a state-wide mean. The statewide means in table 3 are used for
λ′1 λ′2 τ′3
p( )i∉ ΦS p( )i ΦC p( )i–=
RMSE
ri ∈ p( )i[ ]2
i 1=
n
∑
rii 1=
n
∑
-----------------------------------=
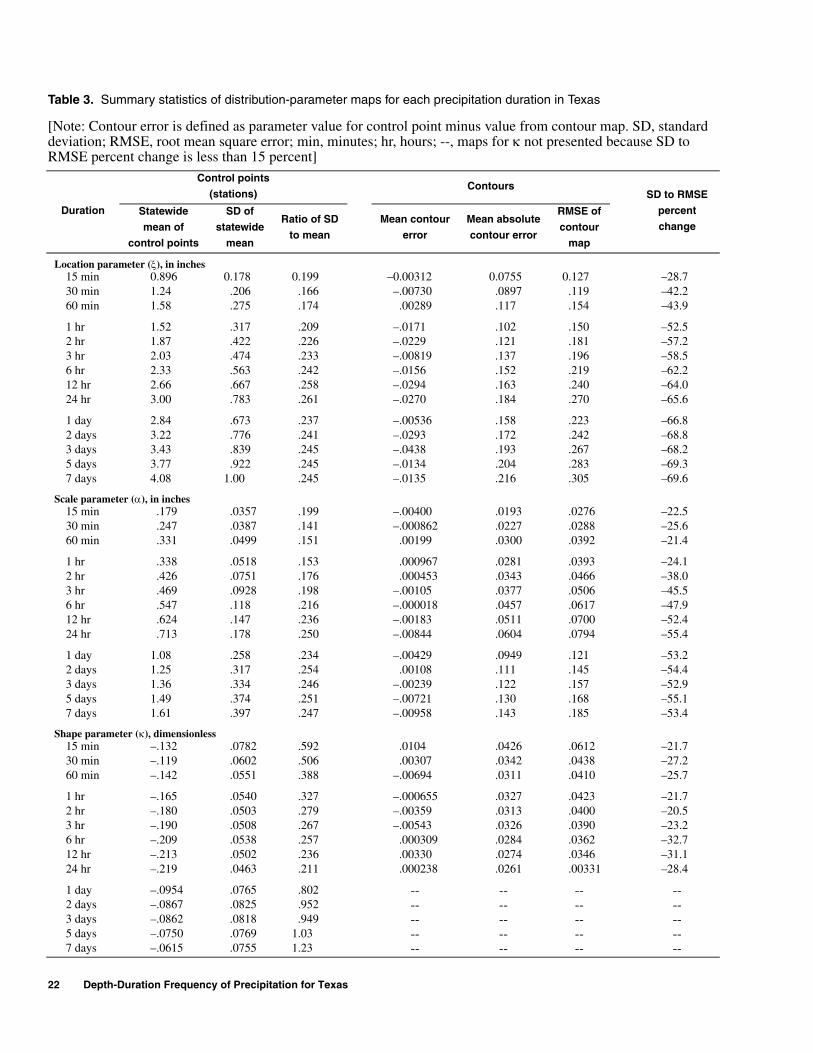
22 Depth-Duration Frequency of Precipitation for Texas
Table 3. Summary statistics of distribution-parameter maps for each precipitation duration in Texas
[Note: Contour error is defined as parameter value for control point minus value from contour map. SD, standard deviation; RMSE, root mean square error; min, minutes; hr, hours; --, maps for κ not presented because SD to RMSE percent change is less than 15 percent]
Duration
Control points
(stations)Contours
SD to RMSE
percent
changeStatewide
mean of
control points
SD of
statewide
mean
Ratio of SD
to mean
Mean contour
error
Mean absolute
contour error
RMSE of
contour
map
Location parameter (ξ), in inches15 min 0.896 0.178 0.199 –0.00312 0.0755 0.127 –28.730 min 1.24 .206 .166 –.00730 .0897 .119 –42.260 min 1.58 .275 .174 .00289 .117 .154 –43.9
1 hr 1.52 .317 .209 –.0171 .102 .150 –52.52 hr 1.87 .422 .226 –.0229 .121 .181 –57.23 hr 2.03 .474 .233 –.00819 .137 .196 –58.56 hr 2.33 .563 .242 –.0156 .152 .219 –62.212 hr 2.66 .667 .258 –.0294 .163 .240 –64.024 hr 3.00 .783 .261 –.0270 .184 .270 –65.6
1 day 2.84 .673 .237 –.00536 .158 .223 –66.82 days 3.22 .776 .241 –.0293 .172 .242 –68.83 days 3.43 .839 .245 –.0438 .193 .267 –68.25 days 3.77 .922 .245 –.0134 .204 .283 –69.37 days 4.08 1.00 .245 –.0135 .216 .305 –69.6
Scale parameter (α), in inches15 min .179 .0357 .199 –.00400 .0193 .0276 –22.530 min .247 .0387 .141 –.000862 .0227 .0288 –25.660 min .331 .0499 .151 .00199 .0300 .0392 –21.4
1 hr .338 .0518 .153 .000967 .0281 .0393 –24.12 hr .426 .0751 .176 .000453 .0343 .0466 –38.03 hr .469 .0928 .198 –.00105 .0377 .0506 –45.56 hr .547 .118 .216 –.000018 .0457 .0617 –47.912 hr .624 .147 .236 –.00183 .0511 .0700 –52.424 hr .713 .178 .250 –.00844 .0604 .0794 –55.4
1 day 1.08 .258 .234 –.00429 .0949 .121 –53.22 days 1.25 .317 .254 .00108 .111 .145 –54.43 days 1.36 .334 .246 –.00239 .122 .157 –52.95 days 1.49 .374 .251 –.00721 .130 .168 –55.17 days 1.61 .397 .247 –.00958 .143 .185 –53.4
Shape parameter (κ), dimensionless15 min –.132 .0782 .592 .0104 .0426 .0612 –21.730 min –.119 .0602 .506 .00307 .0342 .0438 –27.260 min –.142 .0551 .388 –.00694 .0311 .0410 –25.7
1 hr –.165 .0540 .327 –.000655 .0327 .0423 –21.72 hr –.180 .0503 .279 –.00359 .0313 .0400 –20.53 hr –.190 .0508 .267 –.00543 .0326 .0390 –23.26 hr –.209 .0538 .257 .000309 .0284 .0362 –32.712 hr –.213 .0502 .236 .00330 .0274 .0346 –31.124 hr –.219 .0463 .211 .000238 .0261 .00331 –28.4
1 day –.0954 .0765 .802 -- -- -- --2 days –.0867 .0825 .952 -- -- -- --3 days –.0862 .0818 .949 -- -- -- --5 days –.0750 .0769 1.03 -- -- -- --7 days –.0615 .0755 1.23 -- -- -- --
DEPTH-DURATION FREQUENCY OF PRECIPITATION FOR TEXAS 23
the 1- to 7-day κ. The shape (κ) parameter of the GEV distribution for durations of 1 to 7 days was not con-toured because an appreciable amount of the variability could not be explained by preliminary contours—RMSEs of preliminary contour maps for 1- to 7-day shape parameters were not appreciably smaller than statewide SDs.
General observations about the ξ parameters are:
1. The ξ parameter has a systematic upward trend with increasing duration from 15 minutes to 24 hours and from 1 to 7 days. The upward trend is less pronounced in West Texas where long-duration (multiple-day) storms are not as frequent as in southeast Texas where consider-ably longer duration rainfall occurs. The con-tour lines generally exhibit a north-to-south azimuth except in Central Texas and near the coast where the general direction parallels the coast. A rapid upward trend in ξ appears to exist where the southern coast (north to south) turns northeast (“coastal bend”). This trend might be due to a change in moisture flux across the coast—in general the moisture flux along the Texas coast trends to the northwest.
2. A clear tendency for the ξ to trend upward at a reduced rate exists northwest to southeast “down” the Colorado River valley; whereas the area immediately south of the Colorado River (southeast Edwards Plateau region) shows a “mounding” of ξ (fig. 23, for example). This mounding could be attributed to an orographic influence of the Balcones escarpment where it parallels the southeastern and southern bound-ary of the Edwards Plateau region.
3. Furthermore, ξ shows mounding in the area of the Guadalupe, Davis, and Chisos Mountains. This mounding is particularly pronounced for the 1- to 7-day durations due to the greater number of control points (fig. 23, for example). The cause of this mounding in the mountains is cer-tainly due to orographic influences of these mountain ranges.
4. Finally, the southernmost part of the State within the delta of the Rio Grande shows larger values of ξ than those in the area immediately to the north for durations of 30 minutes to 3 days (figs. 11–21).
The α parameters, in general, exhibit trends sim-ilar to those of the ξ parameters. The similarity of trends is not surprising because of the relation between and (eq. 29). However, less spatial detail or local-ized variations are seen in the contour lines of α. The α parameter for the 1- to 7-day durations appears to mound near the southeastern edge of the Edward Pla-teau region, which corresponds very closely to the loca-tion of the Balcones escarpment (fig. 34, for example).
Of the three parameters, physical interpretation of κ is the most difficult. As listed in table 3 and shown on the 15-minute to 24-hour κ maps, the magnitude of κ generally increases with duration, up to about the 24-hour duration, and then begins decreasing with increas-ing duration. (κ is calculated differently for 24 hours and less (eq. 12) than for 1 day and more (eqs. 17–18).) This upward and then downward trend with increasing duration is due to (bottom graph, fig. 9) increasing up to about the 1-day duration and then decreasing as duration increases beyond 1 day.
Examples of Depth-Duration Frequency Computation
Two examples of DDF computations illustrate the use of the maps. Suppose estimates of the 100-year, 6-hour depth and the 100-year, 2-day depth are needed for Amarillo, Tex. The ξ, α, and κ parameters for the 6-hour duration are estimated from figures 16, 30, and 44. The ξ and α parameters for the 2-day duration are estimated from figures 20 and 34; whereas, the κ parameter is esti-mated from table 3. The ξ, α, and κ estimates for the 6-hour duration are 1.68 in., 0.42 in., and –0.20, respec-tively. The values of ξ, α, and κ for the 2-day duration are 2.37 in., 0.925 in., and –0.0867, respectively.
For the 6-hour duration, the GLO distribution is used. The 100-year nonexceedance probability (F) is equal to 0.99. From equation 10,
in.
Likewise, the 25-year, 6-hour precipitation depth (F = 0.96) is 3.55 in., and the 500-year depth (F = 0.998) is 6.86 in. Often a depth duration is converted to a precip-itation intensity, which is measured in inches per hour (in/hr). The 100-year, 6-hour precipitation intensity for Amarillo therefore is 0.81 in/hr (4.84 in/6 hr).
λ′1λ′2
τ′3
X6 hour 0.99( ) 1.68 0.420.20–
-------------+=
1 1 0.99–( )0.99
------------------------0.20–
–
4.84=
24 Depth-Duration Frequency of Precipitation for Texas
For the 2-day duration, the GEV distribution is used. The nonexceedance probability (F) is equal to 0.99. From equation 15,
in.
When the depth is estimated as previously dis-cussed, potential errors exist that might positively or negatively bias the value of Xd(F). One potential error is the author’s interpretation associated with the kriging procedure near “outliers,” near areas with sparse data, or near the boundaries of the State. Another possible error is the interpolation error associated with obtaining the parameters from the contour maps—interpolated parameters for the same location could be slightly different. Interpolation in the far western part of the State, where several mountain ranges exist, is subject to greater error than elsewhere in the State because there are fewer control points, and the effects of rapid changes in altitude (orographic influence on precipita-tion characteristics) might not be reflected in the con-tour maps.
Examples illustrating the sensitivity of map interpolation—measured by percent change—of the GLO and GEV distributions from the above examples (F = 0.99) to the values of the three parameters are as follows:
For the GLO distribution, a 10-percent increase in ξ (1.85), in α (0.462), in κ (–0.22) yields a depth of 5.52 in., which is a 14-percent change; and a 10-percent decrease in ξ (1.51), in α (0.378), in κ (–0.18) yields a depth of 4.21 in., which is a negative 13-percent change. For the GEV distribution, a 10-percent increase in ξ (2.61), in α (1.02), in κ (–0.0954) yields a depth of 8.50 in., which is a 12-percent change; and a 10-percent decrease in ξ (2.13), in α (0.833), in κ (–0.0780) yields a depth of 6.74 in., which is a negative 11-percent change. Other examples of parameter sensitivity could be obtained.
The potential error of a DDF for a particular locality depends on the potential error in estimating the three parameters, on the magnitude of recurrence inter-val, and on the actual geographic site of the locality (for example, in the Chisos Mountains). However, for much of the State, a 10-percent difference in a parameter value obtained from the maps represents a very large geo-
graphic distance; thus, the examples of parameter sensi-tivity are considered extreme.
Precipitation Intensity-Duration Frequency Curve
To moderate the potential errors in calculating the DDF for a given location, the author suggests that a log-log graph showing the relation between precipita-tion intensity (in inches per hour) and duration be gen-erated, and a “best-fit” line hand plotted on the graph. The best-fit line or “precipitation intensity-duration frequency” (IDF) curve represents the final precipita-tion depth for the selected location. A reason to use a log-log intensity-duration graph, in addition to the linearizing effect, is that the percent differences in the intensities between durations become independent of the magnitude of the intensity. A representative IDF curve for El Paso is shown in figure 47 (at end of report). In addition to showing the precipitation intensity for each duration for El Paso, the figure shows the precipi-tation intensity duration for selected localities in Texas. The relatively smooth transition of the IDF curve from short to long durations, in which nearly independent data sources are used, is notable and encouraging. In other words, the parameter maps produce consistent precipitation depths.
A potential error involves large potential dis-crepancies between the two estimates at the 1-hour (60-minute and 1-hour estimates) and 1-day (24-hour and 1-day estimates) durations. These discrepancies might occur because of the differences in mean record length between the 15-minute stations and the hourly stations and between the hourly and the daily stations (fig. 3); the longer-duration data are more accurate, in general, than the shorter-duration data. Additionally, the distribution and density of the control points (stations) vary between the 15-minute and hourly stations and between the hourly and daily stations, resulting in potential errors associated with the contouring. Finally, at the 1-day duration, there is a change from the GLO to the GEV distribution, which can contribute to discrep-ancies between the 24-hour and the 1-day estimates. Because both estimates at the 1-hour or 1-day duration are considered valid, the generation of an IDF curve as shown in figure 47 helps resolve discrepancies.
A final potential problem in calculating DDF for a given location is that the DDF for one duration might be greater than the DDF for a greater duration. This problem could be attributed to the potential errors
X2 day 0.99( ) 2.37 0.9250.0867–
-------------------+=
1 0.99( )ln–[ ] 0.0867––{ } 7.60=
SUMMARY 25
previously identified. The generation of an IDF curve for each location resolves this problem as well.
Comparison to Previous Studies
Exact comparisons to previous studies [TP–40 (Hershfield, 1962) and HYDRO–35 (Frederick and oth-ers, 1977)] are not easy to document within the context of this report. However, a comparison between the depths for the 6-hour 100-year storm from TP–40 and the depths calculated using parameters obtained from the appropriate contour maps (figs. 16, 30, and 44) is shown in figure 48 (at end of report). The depths in figure 48 were not adjusted using a “best fit” IDF curve as previously described. According to the figure, the depths calculated using the methods in this report are similar (generally ±0.5 in.) to those in TP–40 except in the coastal and south-central Texas areas. The con-tours of the depths using the methods in this report show greater spatial detail than the depths available from TP–40. Along the coast, the depths from this report are about 15 percent greater than the depths from TP–40. In the south-central part of the State (especially near the Balcones escarpment), the depths from this report are about 40 percent greater than the depths from TP–40. The differences in south-central Texas are not surprising given the occurrence of large storms in this part of the State (Slade, 1986).
The IDF curve for Amarillo and Orange, Tex., derived from the methods of this report and the curves generated from TP–40 and HYDRO–35 are compared in figure 49 (at end of report). The similarity in shape of the curves from this report to the curves from the previous studies is notable. However, the precipitation-intensity values for Amarillo from this report are about 16 percent larger than those from the previous studies for durations less than or equal to about 3 hours; and the precipitation-intensity values for Orange from this report are about 10 percent larger than those from TP–40 for durations greater than or equal to about 3 hours.
Many other comparisons of IDF or DDF esti-mates from this report were made with estimates from the previous studies (not reported here); results similar to those shown in figures 48 and 49 were observed. IDF or DDF estimates or curves derived from this report are considered more accurate than estimates from previous studies because of (1) the greater number of stations and longer periods of record available for this study, (2) the use of more powerful statistics (L-moments), which
were not available at the time the previous studies were completed, and (3) the use of more flexible and appro-priate three-parameter distributions rather than the two-parameter Gumbel distribution used in previous studies.
SUMMARY
The estimation of precipitation depths for various durations and frequencies, referred to as depth-duration frequency (DDF), has many uses. A common use of DDF is for the design of structures that control and route localized runoff—such as parking lots, storm drains, and culverts. Another use of DDF is to drive river-flow models that incorporate precipitation characteristics. Accurate DDF estimates are important for cost-effective structural designs at stream crossings and for develop-ing reliable flood prediction models.
The durations investigated during a USGS study of DDF for Texas are 15, 30, and 60 minutes; 1, 2, 3, 6, 12, and 24 hours; and 1, 2, 3, 5, and 7 days. The frequen-cies in terms of recurrence interval range from 2 to 500 years. The basis of DDF is the time series of annual maxima of precipitation for each identified duration from 173 fifteen-minute, 274 hourly, and 865 daily National Weather Service precipitation stations with at least 10 years of data in Texas. About 3,030; 10,160; and 38,120 cumulative years of record are available for the 15-minute, hourly, and daily stations, respectively. The areal densities, in stations per 1,000 mi2, are 0.646, 1.02, and 3.23 for the 15-minute, hourly, and daily sta-tions, respectively.
L-moment statistics of the precipitation annual maxima were calculated for each duration and for each station using unbiased L-moment estimators. The statis-tics calculated were the mean, L-scale, L-coefficient of variation (L–CV), L-skew, and L-kurtosis. These statis-tics were calculated for each duration and for each sta-tion using unbiased L-moment estimators. The mean for each station and duration was corrected for the bias associated with fixed-interval recording of precipi-tation. L-skew, L-kurtosis, and L-moment ratio dia-grams were used to determine that the three-parameter generalized logistic (GLO) distribution is an appropri-ate probability distribution for modeling the frequency of annual maxima for durations of 15 minutes to 24 hours. The three-parameter generalized extreme-value (GEV) distribution was determined as appropriate for durations of 1 to 7 days.
Spatial averaging of L–CV and L-skew was used to (1) reduce the random component in their values

26 Depth-Duration Frequency of Precipitation for Texas
and (2) improve the accuracy of L–CV and L-skew estimates. A corrected L-scale subsequently was esti-mated using the corrected mean and the spatially aver-aged L–CV for each duration and for each station. Finally, the corrected mean, the corrected L–scale, and the averaged L-skew for each station and duration were transformed into the location, scale, and shape parame-ters for both the GLO or GEV distributions.
The location, scale, and shape parameters of the GLO and GEV distributions for each station and duration were contoured using an interpolation scheme based on the geostatistical method of kriging to produce 37 maps depicting the spatial variation and magnitude of each parameter. Contour maps of the shape parameter for the GEV distribution for durations of 1 to 7 days are not presented; the root mean square errors of prelimi-nary maps for 1- to 7-day shape parameters were not appreciably smaller than the statewide standard devia-tion. Therefore, a single statewide mean shape parame-ter was used for 1- to 7-day durations. The DDF for any location in Texas can be estimated using the appropriate maps and distribution function.
To reduce the effects of potential errors associated with the maps, precipitation intensity-duration frequency curves, known as IDF curves, were devel-oped on the basis of the relation between precipitation intensities (inches per hour) and duration. The IDF curves for selected localities in the State are presented. The relatively smooth transition of the IDF curve for the selected localities from short to long durations is notable and encouraging. In other words, the parameter maps produce consistent precipitation depths. IDF or DDF estimates or curves derived from this report are considered more accurate than estimates from previous studies because of (1) the greater number of stations and longer record available for this study, (2) the use of more powerful statistics (L-moments), which were not available at the time the other studies were completed, and (3) the use of more flexible and appropriate three-parameter distributions than the two-parameter Gumbel distribution used in previous studies.
SELECTED REFERENCES
Bomar, G.W., 1995, Texas weather: Austin, University of Texas Press, 275 p.
Carr, J.R., 1995, Numerical analysis for the geological sciences: Englewood Cliff, N.J., Prentice-Hall, 592 p.
Carr, J.T., Jr., 1967, The climate and physiography of Texas: Texas Water Development Board Report 53, 27 p.
Dalrymple, Tate, 1960, Flood-frequency analyses: U.S. Geological Survey Water-Supply Paper 1543–A, 80 p.
Davis, J.C., 1986, Statistics and data analysis in geology: New York, Wiley, 646 p.
Deutsch, C.V., and Journel, A.G., 1992, Geostatistical software library and user’s guide: New York, Oxford University Press, 340 p.
Fischer, R.A., 1929, Moments and product moments of sampling distributions: Journal of London Mathematical Society, 2(30), 199 p.
Frederick, R.H., Meyers, V.A., and Auciello, E.P., 1977, Five- to 60-minute precipitation frequency for the eastern and central United States: Washington, D.C., National Oceanic and Atmospheric Administration Technical Memorandum NWS HYDRO–35, 36 p.
Greenwood, J.A., Landwehr, J.M., Matalas, N.C., and Wallis, J.R., 1979, Probability weighted moments—Definition and relation to parameters of several distributions expressible in inverse form: Water Resources Research, v. 15, no. 5, p. 1,049–1,054.
Hershfield, D.M., 1962, Rainfall frequency atlas of the United States for durations from 30 minutes to 24 hours and return periods from 1 to 100 years: Washington, D.C., U.S. Weather Bureau Technical Paper 40, 61 p.
Hosking, J.R.M., 1986, The theory of probability weighted moments: Yorktown Heights, N.Y., IBM Research Division, T.J. Watson Research Center, Research Report RC–12210, 160 p.
______1990, L-moments—Analysis and estimation of distributions using linear combinations of order statis-tics: Journal Royal Statistical Society B, v. 52, no. 1, p. 105–124.
______1991a, Approximations for use in constructing L-moment ratio diagrams: Yorktown Heights, N.Y., IBM Research Division, T.J. Watson Research Center, Research Report RC–16635, 3 p.
______1991b, FORTRAN routines for use with the method of L-moments, Version 2: Yorktown Heights, N.Y., IBM Research Division, T.J. Watson Research Center, Research Report RC–17097, 117 p.
______1992, Moments or L moments? An example compar-ing two measures of distributional shape: The American Statistician, v. 46, no. 3, p. 186–189.
______1994, The four-parameter kappa distribution: IBM Journal of Research and Development, v. 38, no. 3, p. 251–258.
Hosking, J.R.M., and Wallis, J.R., 1993, Some statistics useful in regional frequency analysis: Water Resources Research, v. 29, no. 2, p. 271–281.
______1995, A comparison of unbiased and plotting-position estimators of L-moments: Water Resources Research, v. 31, no. 8, p. 2,019–2,025.
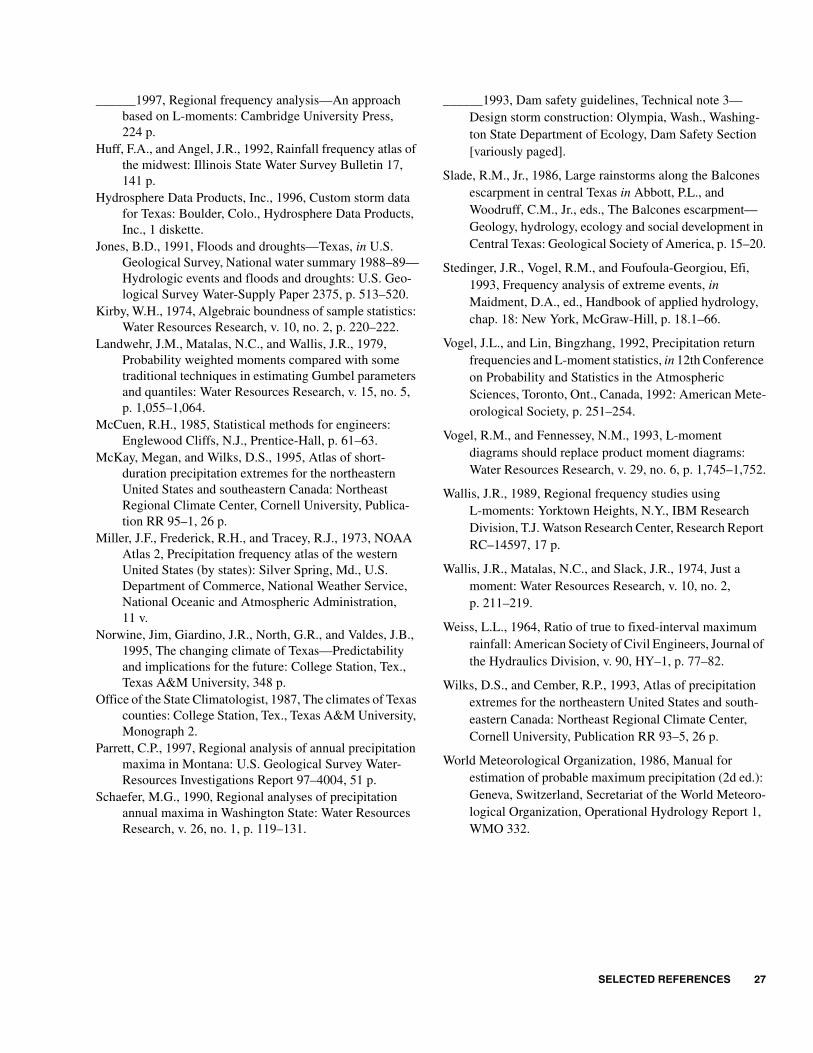
SELECTED REFERENCES 27
______1997, Regional frequency analysis—An approach based on L-moments: Cambridge University Press, 224 p.
Huff, F.A., and Angel, J.R., 1992, Rainfall frequency atlas of the midwest: Illinois State Water Survey Bulletin 17, 141 p.
Hydrosphere Data Products, Inc., 1996, Custom storm data for Texas: Boulder, Colo., Hydrosphere Data Products, Inc., 1 diskette.
Jones, B.D., 1991, Floods and droughts—Texas, in U.S. Geological Survey, National water summary 1988–89—Hydrologic events and floods and droughts: U.S. Geo-logical Survey Water-Supply Paper 2375, p. 513–520.
Kirby, W.H., 1974, Algebraic boundness of sample statistics: Water Resources Research, v. 10, no. 2, p. 220–222.
Landwehr, J.M., Matalas, N.C., and Wallis, J.R., 1979, Probability weighted moments compared with some traditional techniques in estimating Gumbel parameters and quantiles: Water Resources Research, v. 15, no. 5, p. 1,055–1,064.
McCuen, R.H., 1985, Statistical methods for engineers: Englewood Cliffs, N.J., Prentice-Hall, p. 61–63.
McKay, Megan, and Wilks, D.S., 1995, Atlas of short-duration precipitation extremes for the northeastern United States and southeastern Canada: Northeast Regional Climate Center, Cornell University, Publica-tion RR 95–1, 26 p.
Miller, J.F., Frederick, R.H., and Tracey, R.J., 1973, NOAA Atlas 2, Precipitation frequency atlas of the western United States (by states): Silver Spring, Md., U.S. Department of Commerce, National Weather Service, National Oceanic and Atmospheric Administration, 11 v.
Norwine, Jim, Giardino, J.R., North, G.R., and Valdes, J.B., 1995, The changing climate of Texas—Predictability and implications for the future: College Station, Tex., Texas A&M University, 348 p.
Office of the State Climatologist, 1987, The climates of Texas counties: College Station, Tex., Texas A&M University, Monograph 2.
Parrett, C.P., 1997, Regional analysis of annual precipitation maxima in Montana: U.S. Geological Survey Water-Resources Investigations Report 97–4004, 51 p.
Schaefer, M.G., 1990, Regional analyses of precipitation annual maxima in Washington State: Water Resources Research, v. 26, no. 1, p. 119–131.
______1993, Dam safety guidelines, Technical note 3—Design storm construction: Olympia, Wash., Washing-ton State Department of Ecology, Dam Safety Section [variously paged].
Slade, R.M., Jr., 1986, Large rainstorms along the Balcones escarpment in central Texas in Abbott, P.L., and Woodruff, C.M., Jr., eds., The Balcones escarpment—Geology, hydrology, ecology and social development in Central Texas: Geological Society of America, p. 15–20.
Stedinger, J.R., Vogel, R.M., and Foufoula-Georgiou, Efi, 1993, Frequency analysis of extreme events, in Maidment, D.A., ed., Handbook of applied hydrology, chap. 18: New York, McGraw-Hill, p. 18.1–66.
Vogel, J.L., and Lin, Bingzhang, 1992, Precipitation return frequencies and L-moment statistics, in 12th Conference on Probability and Statistics in the Atmospheric Sciences, Toronto, Ont., Canada, 1992: American Mete-orological Society, p. 251–254.
Vogel, R.M., and Fennessey, N.M., 1993, L-moment diagrams should replace product moment diagrams: Water Resources Research, v. 29, no. 6, p. 1,745–1,752.
Wallis, J.R., 1989, Regional frequency studies using L-moments: Yorktown Heights, N.Y., IBM Research Division, T.J. Watson Research Center, Research Report RC–14597, 17 p.
Wallis, J.R., Matalas, N.C., and Slack, J.R., 1974, Just a moment: Water Resources Research, v. 10, no. 2, p. 211–219.
Weiss, L.L., 1964, Ratio of true to fixed-interval maximum rainfall: American Society of Civil Engineers, Journal of the Hydraulics Division, v. 90, HY–1, p. 77–82.
Wilks, D.S., and Cember, R.P., 1993, Atlas of precipitation extremes for the northeastern United States and south-eastern Canada: Northeast Regional Climate Center, Cornell University, Publication RR 93–5, 26 p.
World Meteorological Organization, 1986, Manual for estimation of probable maximum precipitation (2d ed.): Geneva, Switzerland, Secretariat of the World Meteoro-logical Organization, Operational Hydrology Report 1, WMO 332.
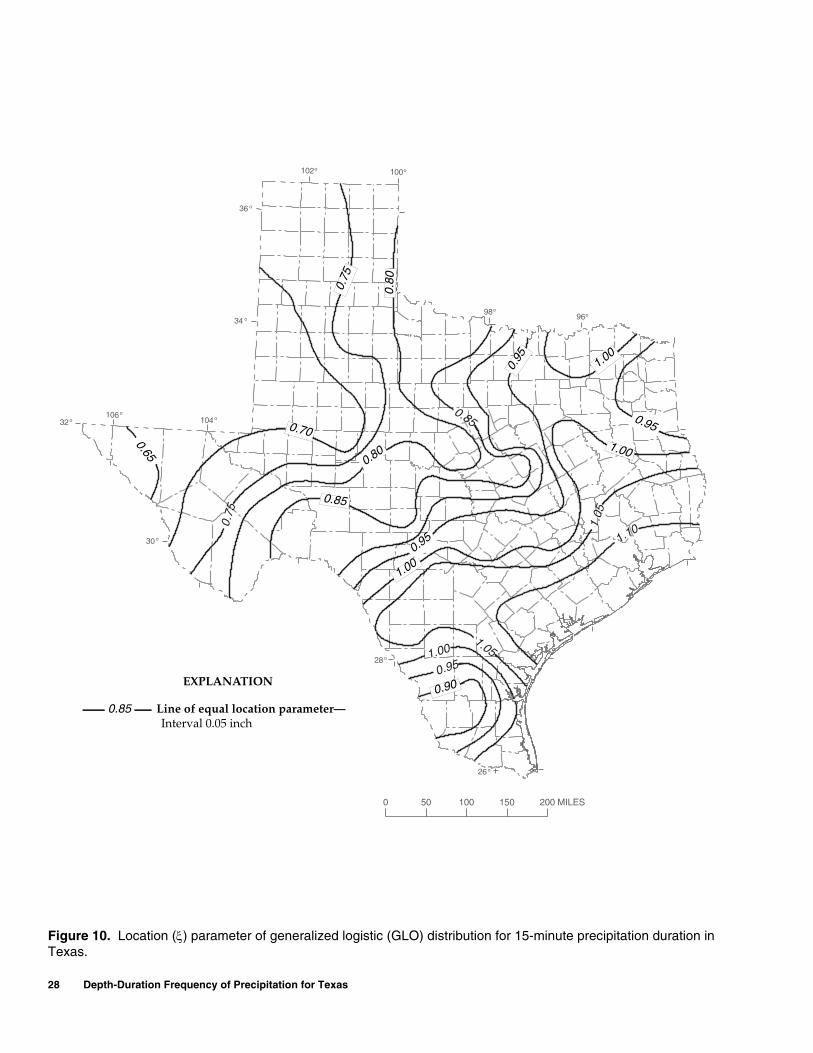
28 Depth-Duration Frequency of Precipitation for Texas
Figure 10100
104
o
o
o28
32o
36
o
96o98o
102o
o34
106 o
o30
o26
1.10
0.65
0.70
0.75
0.75
0.80
1.000.
95
0.95
1 .00
0.85
0.85
1.05
0 . 95
1.00
1.001.05
0.90
0.80
0.95
0 50 100 150 200 MILES
Line of equal location parameter—Interval 0.05 inch
EXPLANATION
0.85
0.70
0.85
1.00
0.90
0.95
1.00
1.00
0.80
0.75
0.80
0.65
0.95
0.95
Figure 10. Location (ξ) parameter of generalized logistic (GLO) distribution for 15-minute precipitation duration in Texas.
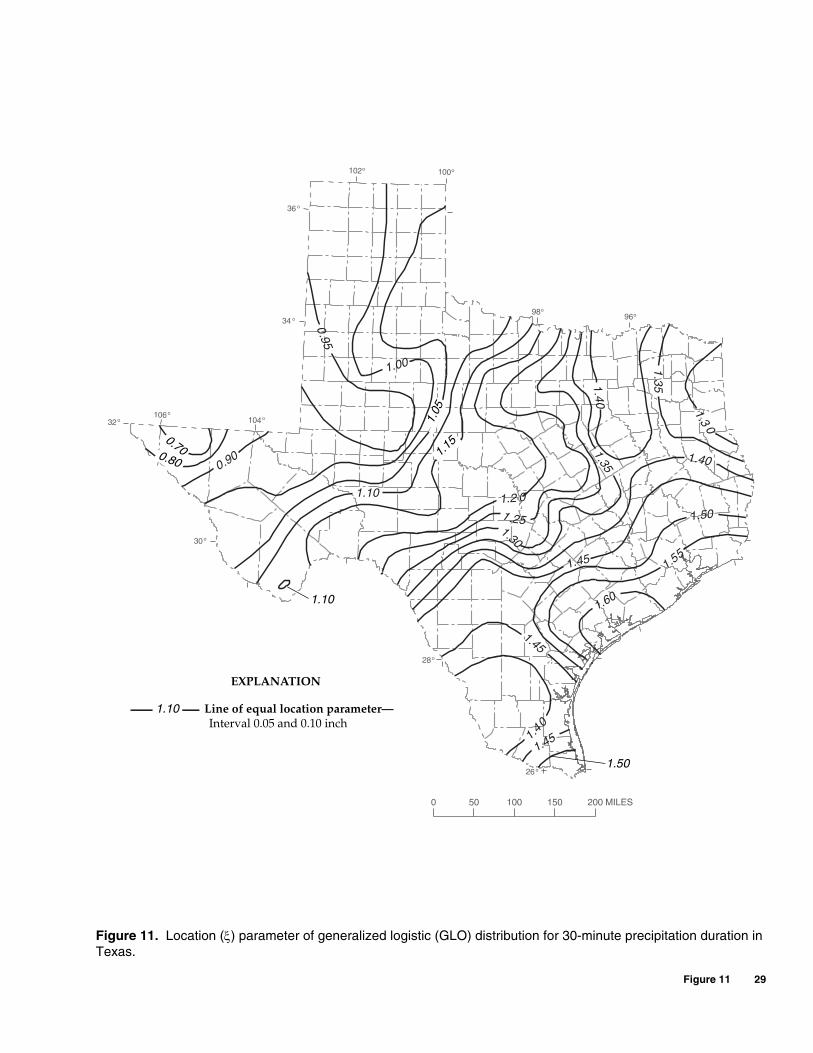
Figure 11 29
Figure 11100
104
o
o
o28
32o
36
o
96o98o
102o
o34
106 o
o30
o26
0.700 .80
1.40
1.60
1.40
1.45
1.45 1.55
1.50
0.90 1.40
1.2 0
1.35
1.05
1.10
1.15
1.30
1 .25
0.95
1.00
1.45
1.30
1.35
0 50 100 150 200 MILES
Line of equal location parameter—Interval 0.05 and 0.10 inch
EXPLANATION
1.10
1.10
1.50
0.70 0.80 1.1
5 1.
05
Figure 11. Location (ξ) parameter of generalized logistic (GLO) distribution for 30-minute precipitation duration in Texas.
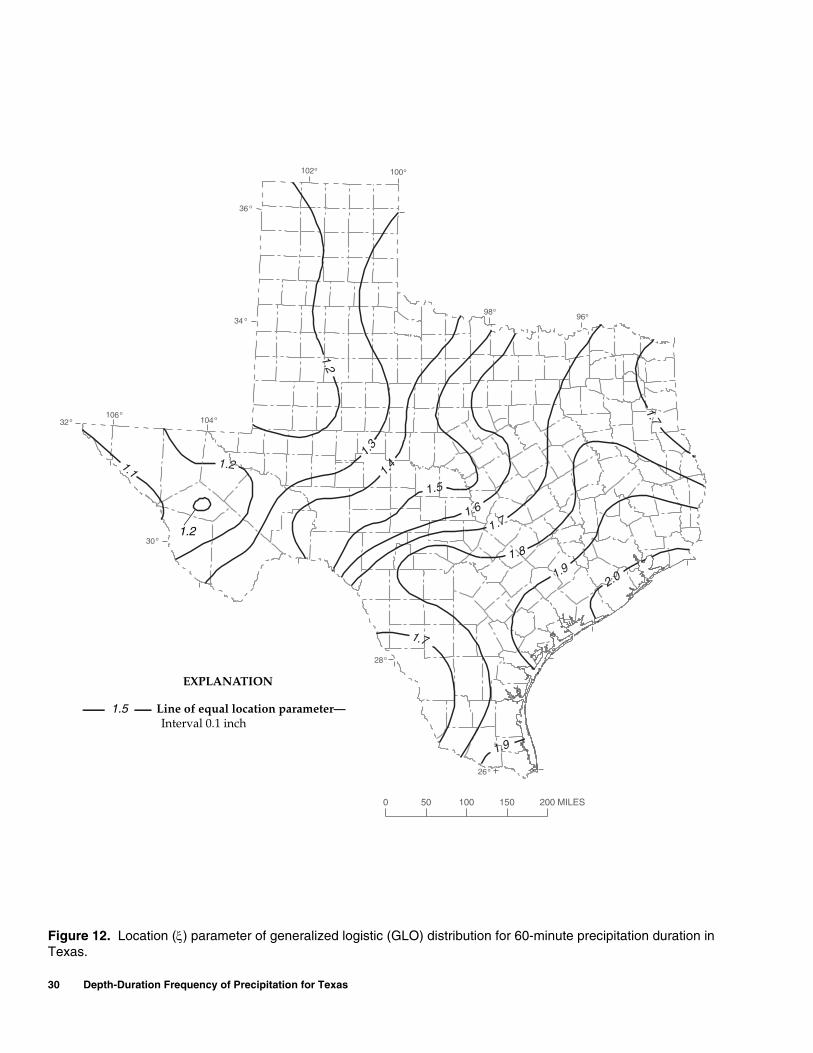
30 Depth-Duration Frequency of Precipitation for Texas
Figure 12100
104
o
o
o28
32o
36
o
96o98o
102o
o34
106 o
o30
o26
1.7
1.2
1.2
1.3
1.4
1.5
1.6
1 .7
1.8
1.92.0
1.9
1.7
1.1
0 50 100 150 200 MILES
Line of equal location parameter—Interval 0.1 inch
EXPLANATION
1.5
1.2
Figure 12. Location (ξ) parameter of generalized logistic (GLO) distribution for 60-minute precipitation duration in Texas.
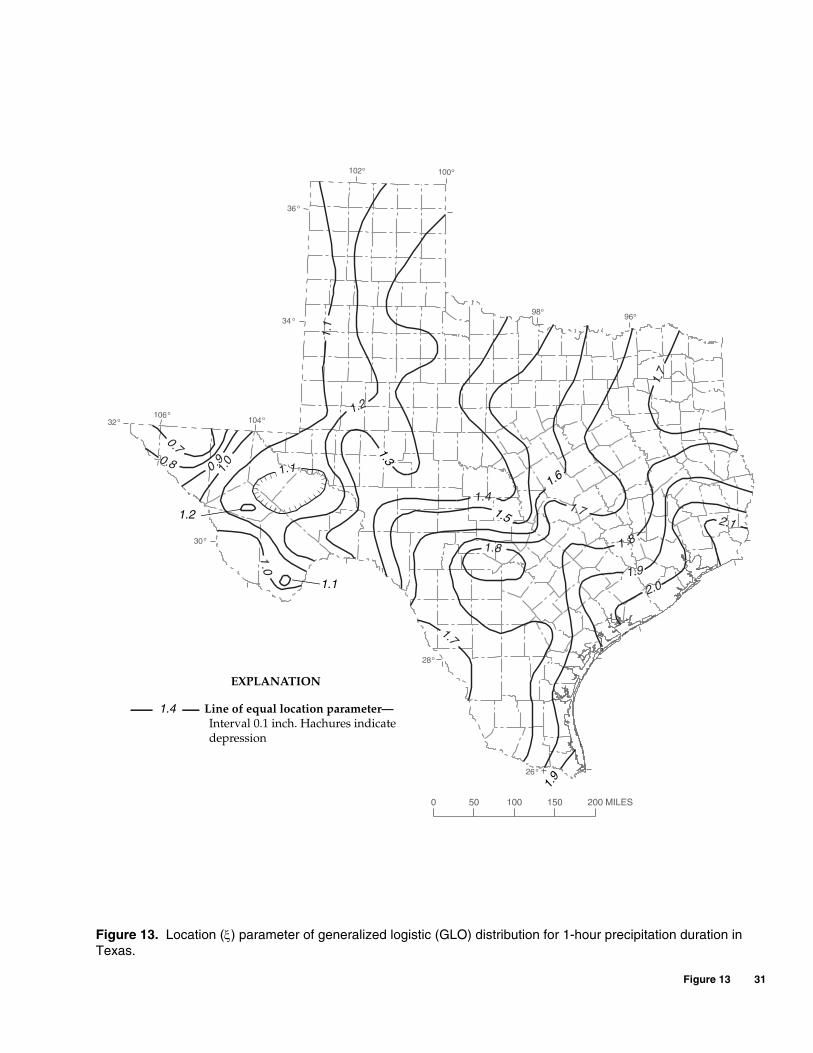
Figure 13 31
Figure 13100
104
o
o
o28
32o
36
o
96o98o
102o
o34
106 o
o30
o26
0.70.8 0 .91.
0
1.0
1.7
1.8
2.1
2.01.9
1 .8
1.71.4
1.5
1.7
1 .6
1.2
1.3
1.1
1.1
0 50 100 150 200 MILES
Line of equal location parameter—Interval 0.1 inch. Hachures indicate depression
EXPLANATION
1.4
1.2
1.1
1.9
1.3
1.6
1.5
Figure 13. Location (ξ) parameter of generalized logistic (GLO) distribution for 1-hour precipitation duration in Texas.
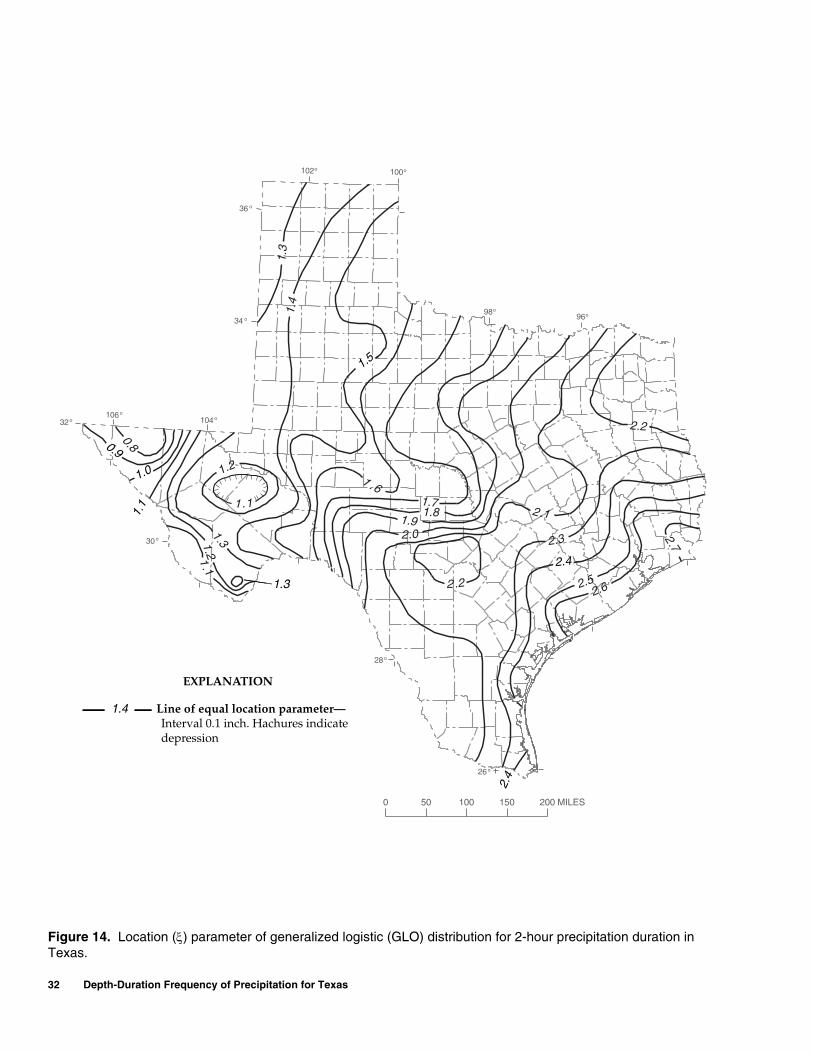
32 Depth-Duration Frequency of Precipitation for Texas
Figure 14100
104
o
o
o28
32o
36
o
96o98o
102o
o34
106 o
o30
o26
1.2
1.1
0.80.9
1.31.2
1.3
1.4
1.5
1 .61.71.8
1.92.0
2 .2
2.1
2.4
2.3
2.62.5
2.2
2.7
1 .1
0 50 100 150 200 MILES
Line of equal location parameter—Interval 0.1 inch. Hachures indicate depression
EXPLANATION
1.4
1.3
1.0
Line of equal location parameter—Interval 0.1 inch. Hachures indicate depression
EXPLANATION
1.4
1.3
2.4
1.1
1.5
0.9
2.4
Figure 14. Location (ξ) parameter of generalized logistic (GLO) distribution for 2-hour precipitation duration in Texas.
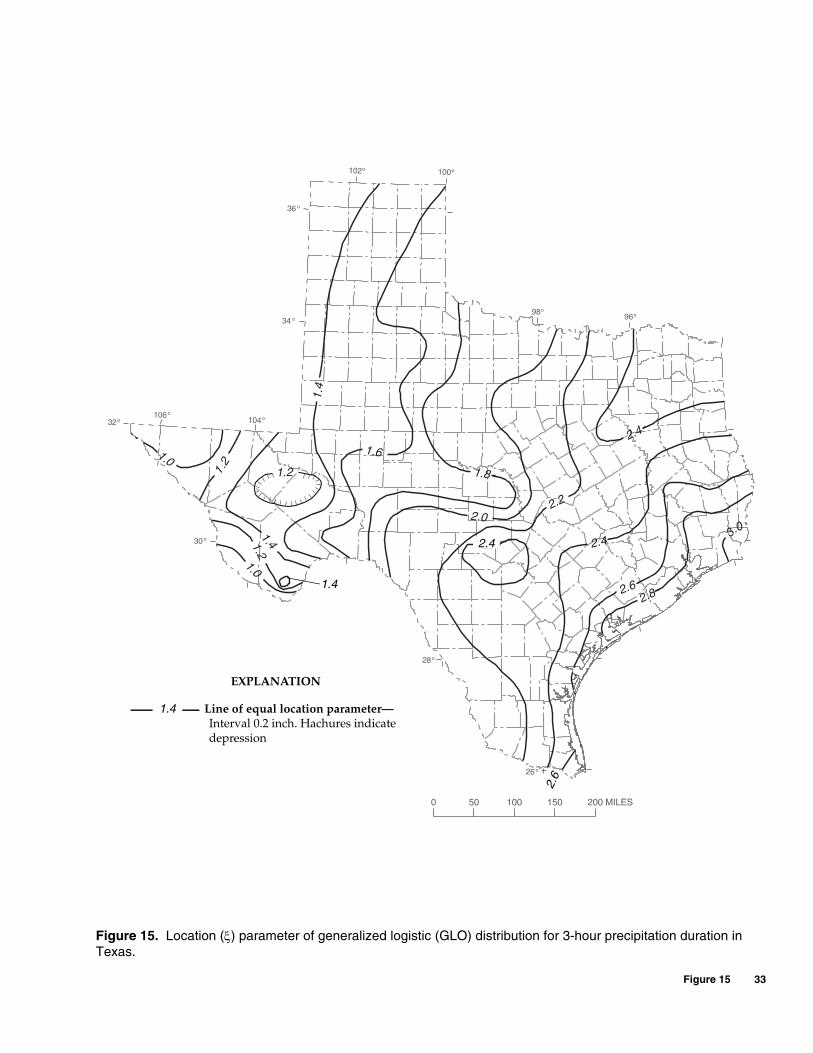
Figure 15 33
Figure 15100
104
o
o
o28
32o
36
o
96o98o
102o
o34
106 o
o30
o26
1.01.
2
1.21.0
1.4
1.4
1.6
1.8
2.02.2
2.4
2.4
2.4
2.8
3.0
2.6
1.2
0 50 100 150 200 MILES
Line of equal location parameter—Interval 0.2 inch. Hachures indicate depression
EXPLANATION
1.4
1.4
2.6
2.4
Figure 15. Location (ξ) parameter of generalized logistic (GLO) distribution for 3-hour precipitation duration in Texas.

34 Depth-Duration Frequency of Precipitation for Texas
Figure 16100
104
o
o
o28
32o
36
o
96o98o
102o
o34
106 o
o30
o26
1.4
1.2
1.41.2
1.0
2.5
1.0
3.63.4
1.6
1.8
2.0
2.22.4
2.6
2.8
2.8
3.43.23.0
2.8
1.4
0 50 100 150 200 MILES
Line of equal location parameter—Interval 0.2 inch. Hachures indicate depression
EXPLANATION
1.4
2.8
3.0
1.6
Amarillo
Figure 16. Location (ξ) parameter of generalized logistic (GLO) distribution for 6-hour precipitation duration in Texas.
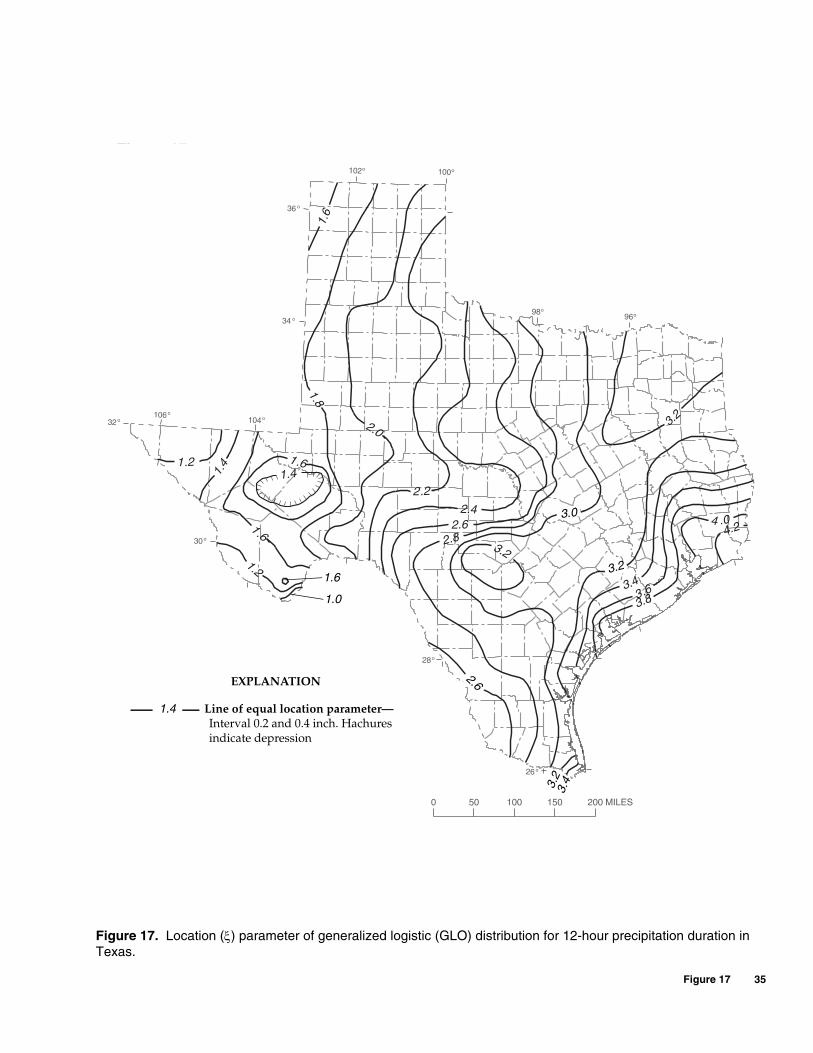
Figure 17 35
Figure 17100
104
o
o
o28
32o
36
o
96o98o
102o
o34
106 o
o30
o26
1.6
1.21.4
4 .04.2
1.2
3.2
2.6
1 .6
1.6
1.8
2.0
2.2
2.42.6
2.8
3.0
3.2
3 .2
3.43.63.8
1.4
0 50 100 150 200 MILES
Line of equal location parameter—Interval 0.2 and 0.4 inch. Hachures indicate depression
EXPLANATION
1.4
1.6
3.2
1.0
3.4
3.0
3.2
2.6
Figure 17. Location (ξ) parameter of generalized logistic (GLO) distribution for 12-hour precipitation duration in Texas.
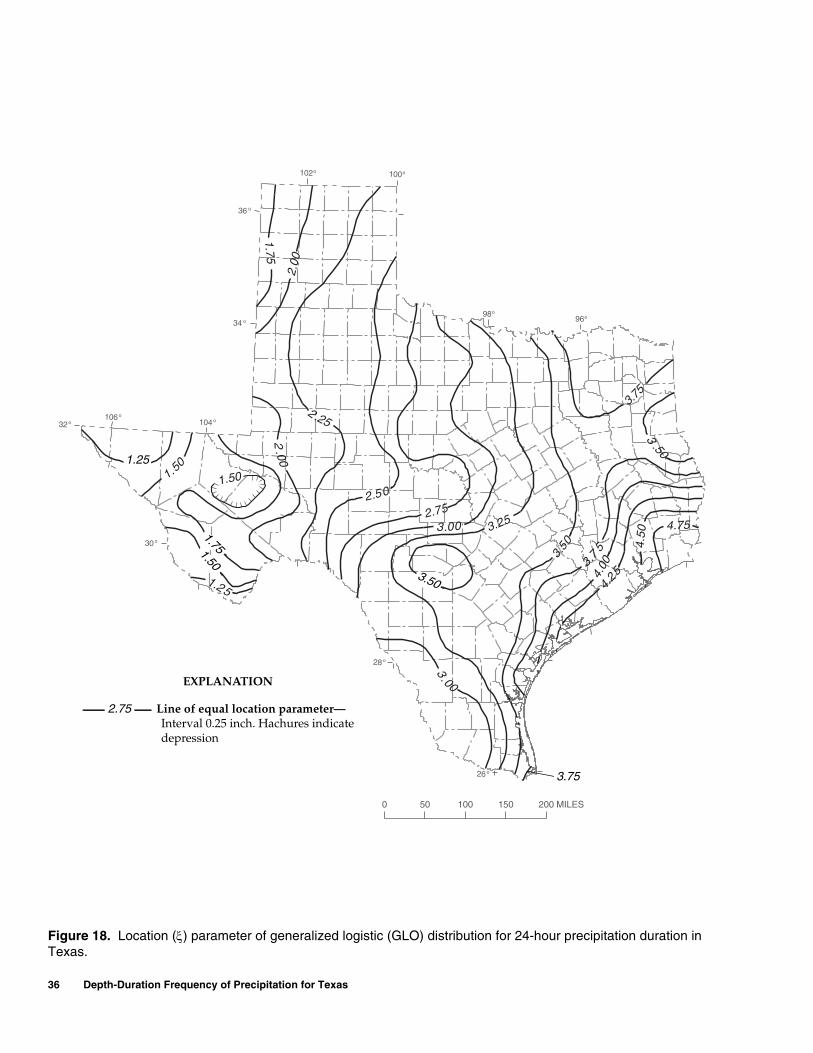
36 Depth-Duration Frequency of Precipitation for Texas
Figure 18100
104
o
o
o28
32o
36
o
96o98o
102o
o34
106 o
o30
o26
1.50
2.00
1.751.50
1.25
2.00
1.75
2 .25
2.50
3.002.75
3.25
3.50
3.75
3.50
3.75
4.00
4.25
4.50
4.75
3.50
3.00
1.50
0 50 100 150 200 MILES
Line of equal location parameter—Interval 0.25 inch. Hachures indicate depression
EXPLANATION
2.75
3.75
1.25
1.75 1.50
3.50
Figure 18. Location (ξ) parameter of generalized logistic (GLO) distribution for 24-hour precipitation duration in Texas.

Figure 19 37
Figure 19100
104
o
o
o28
32o
36
o
96o98o
102o
o34
106 o
o30
o26
1.20 1 .75
1.50
1.751.50
1.7 5
2.50
2.25 2.75
2 .753.00
3.00
3.25
3 .25
3.25
3.7 54 .254.0 0
4.50
3.25
2.00
2.00
3.50
1.25
1.75
1.25
2.25
0 50 100 150 200 MILES
Line of equal location parameter—Interval 0.25 and 0.30 inch. Hachures indicate depression
EXPLANATION
1.50
1.75
4.75
2.00
3.50
3.50
1.50
Figure 19. Location (ξ) parameter of generalized extreme-value (GEV) distribution for 1-day precipitation duration in Texas.
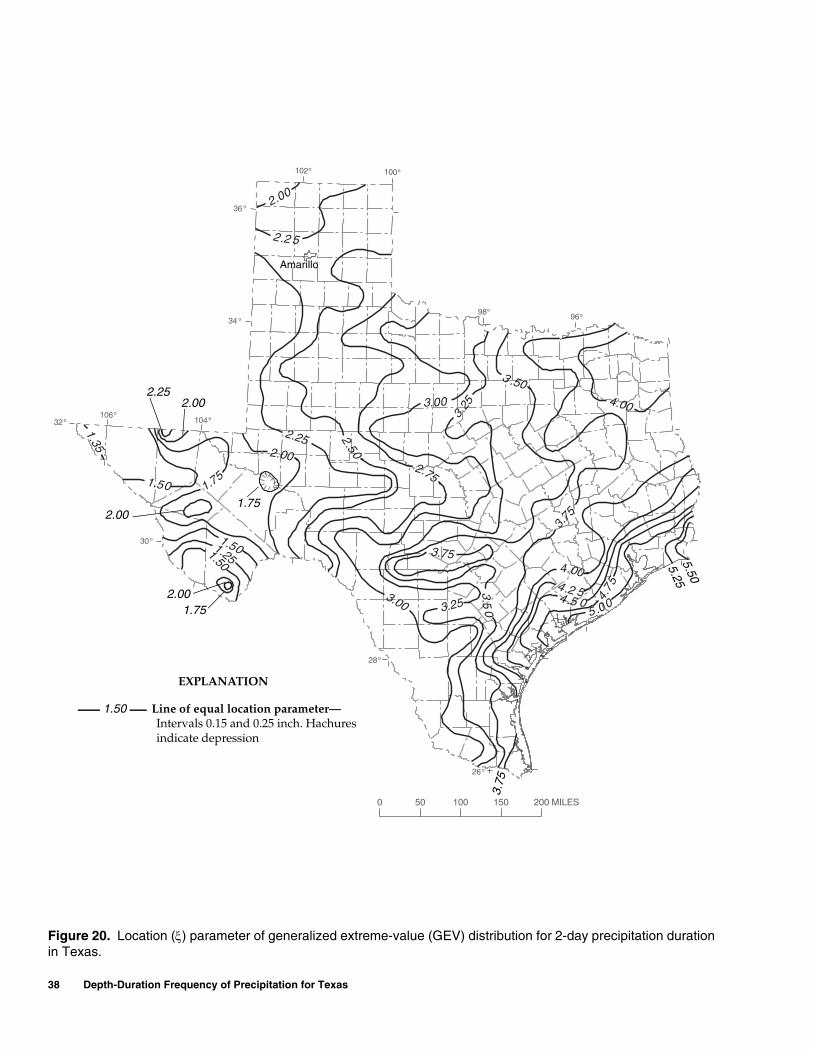
38 Depth-Duration Frequency of Precipitation for Texas
Figure 20100
104
o
o
o28
32o
36
o
96o98o
102o
o34
106 o
o30
o26
2.00
2.2 5
1.35
1.50
1.501.251.50
1.75
2.00
2.25 2.50
3.75
3 .50
3.50
3.25
3.25
3.00
3.75
3.00
2.75
4.00
4.004.2 5
5 .004.
754 .5 0
0 50 100 150 200 MILES
Line of equal location parameter—Intervals 0.15 and 0.25 inch. Hachures indicate depression
EXPLANATION
1.50
2.001.75
5.50
2.00
5.25
1.75
2.25
2.00
3.75
Amarillo
Figure 20. Location (ξ) parameter of generalized extreme-value (GEV) distribution for 2-day precipitation duration in Texas.
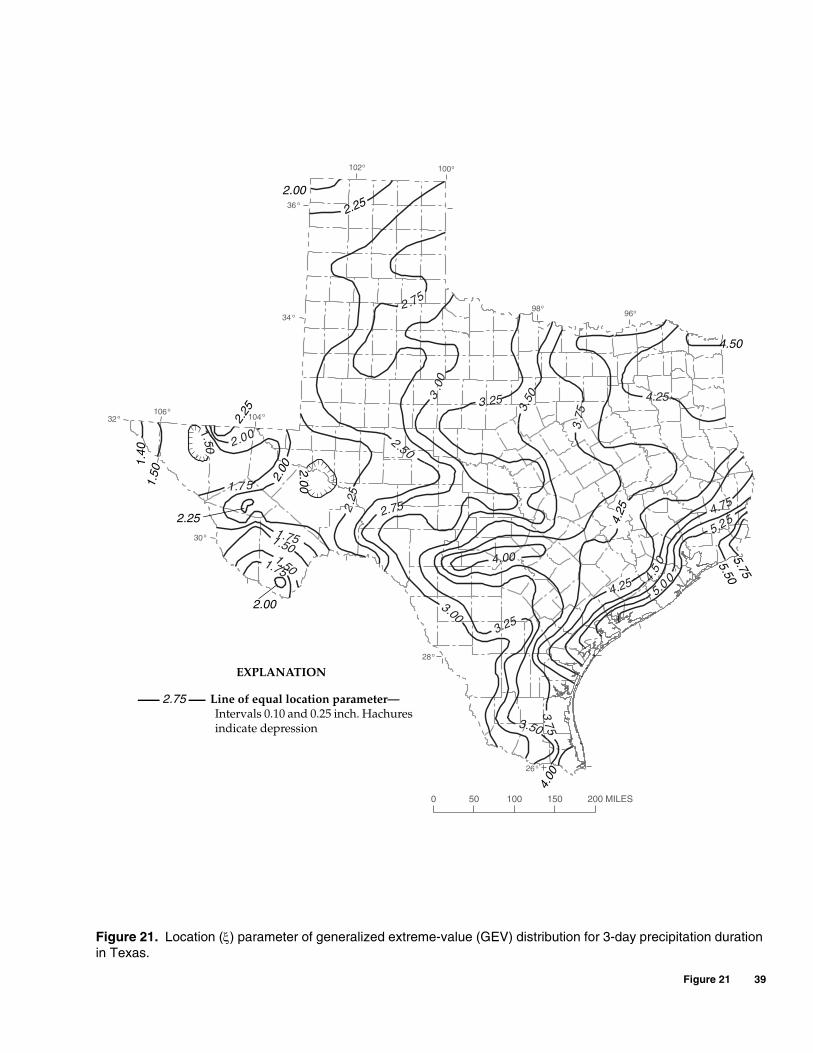
Figure 21 39
Figure 21100
104
o
o
o28
32o
36
o
96o98o
102o
o34
106 o
o30
o26
2.00
2.2
5
1.751.501.501.75
1.75
2.50
2.75
2 .75
3
.00
3.00
3.25
3.25
3.50
3.50
3.75
3.75
4.00
5.00
4.75
4.5
0
4.25
4.25
4.25
5.25
1.50
0 50 100 150 200 MILES
Line of equal location parameter—Intervals 0.10 and 0.25 inch. Hachures indicate depression
EXPLANATION
2.75
2.00
1.40
5.50
2.25
4.00
4.50
2.00
2.25
1.50
4.25
5.75
2.00
2.25
2.00
Figure 21. Location (ξ) parameter of generalized extreme-value (GEV) distribution for 3-day precipitation duration in Texas.
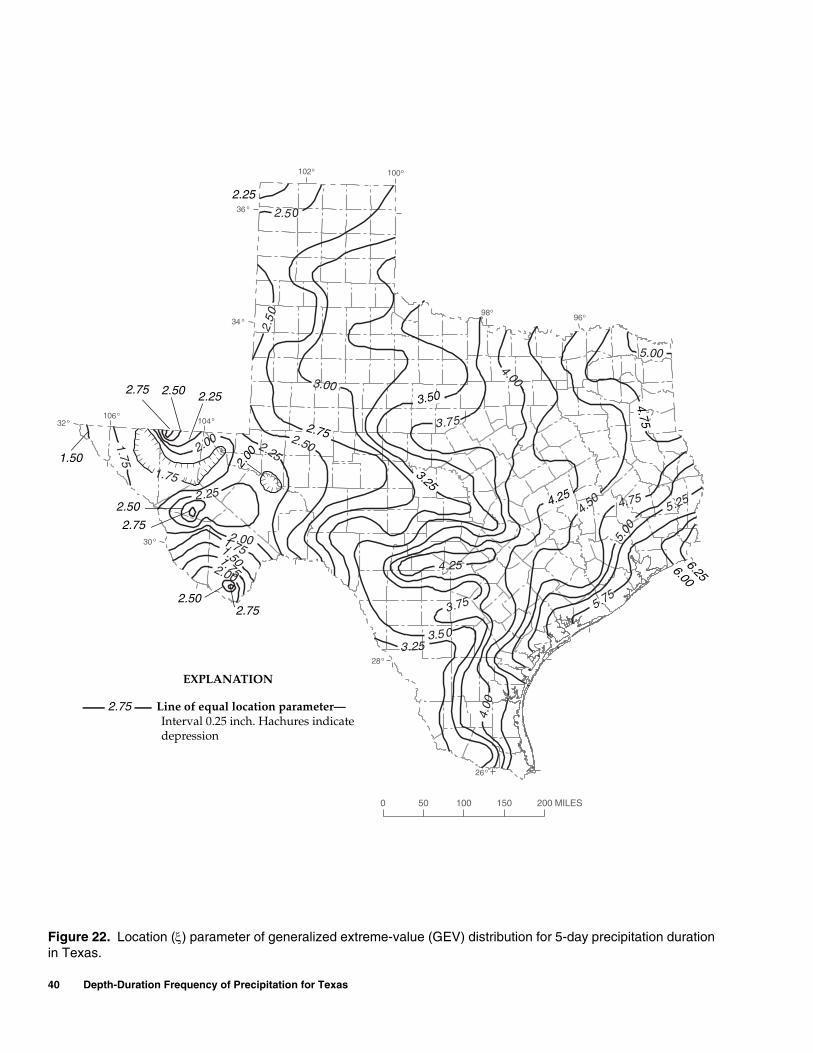
40 Depth-Duration Frequency of Precipitation for Texas
Figure 22100
104
o
o
o28
32o
36
o
96o98o
102o
o34
106 o
o30
o26
2.5 0
2.5
0
2.752.502.25
1.75
2.25
2.001.751.501.752.00
2.00
3.00
3.25
3.50
3.50
3.25
4.25
3.75
3.75
4.00
4.00
4.254.5
0
5.00
4.75
4.75
5.00
5.75
5.25
1.75
0 50 100 150 200 MILES
Line of equal location parameter—Interval 0.25 inch. Hachures indicate depression
EXPLANATION
2.75
2.50
6.25
1.50
6.00
2.75
2.25
2.50
2.50 2.25
2.75
2.75
2.00
2.75
3.50
3.25 4.25
4.75
Figure 22. Location (ξ) parameter of generalized extreme-value (GEV) distribution for 5-day precipitation duration in Texas.
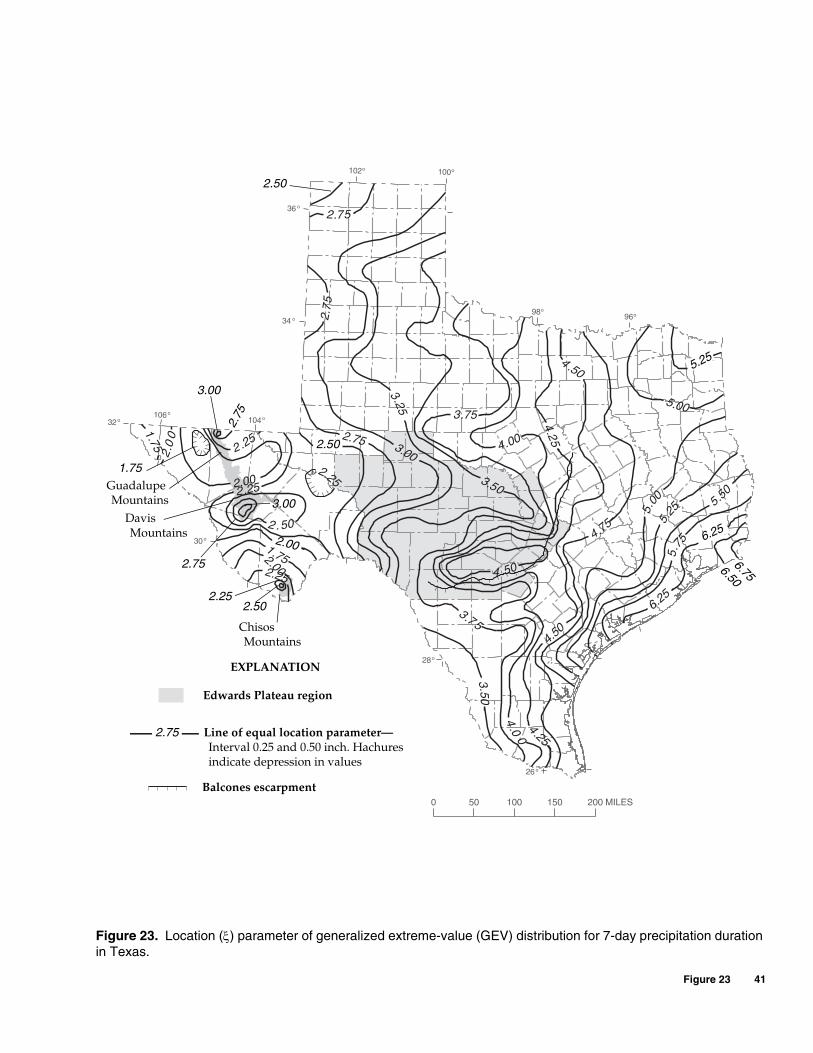
Figure 23 41
Figure 23100
104
o
o
o28
32o
36
o
96o98o
102o
o34
106 o
o30
o26
3.50
2.75
5.25
5.00
1.75
2.0
0
2 . 006.25
1.752.002.25
2.7
5
2.752.502.25
2.002.25
3.00
3.25
3.50
3.75
3.75
4 .50
4.00
4.0
0
4.25
4.25
4.50
4 .50
4.75
5.00
5.25
5.50
6.25
5.75
2 . 50
2.25
0 50 100 150 200 MILES
Line of equal location parameter—Interval 0.25 and 0.50 inch. Hachures indicate depression in values
EXPLANATION
2.75
2.25
6.75
1.75
6.50
3.00
2.50
2.75
2.75
3.00
2.50
Edwards Plateau region
Balcones escarpment
Guadalupe Mountains
Davis Mountains
Chisos Mountains
2.00
2.50
6.25
5.25
Figure 23. Location (ξ) parameter of generalized extreme-value (GEV) distribution for 7-day precipitation duration in Texas.
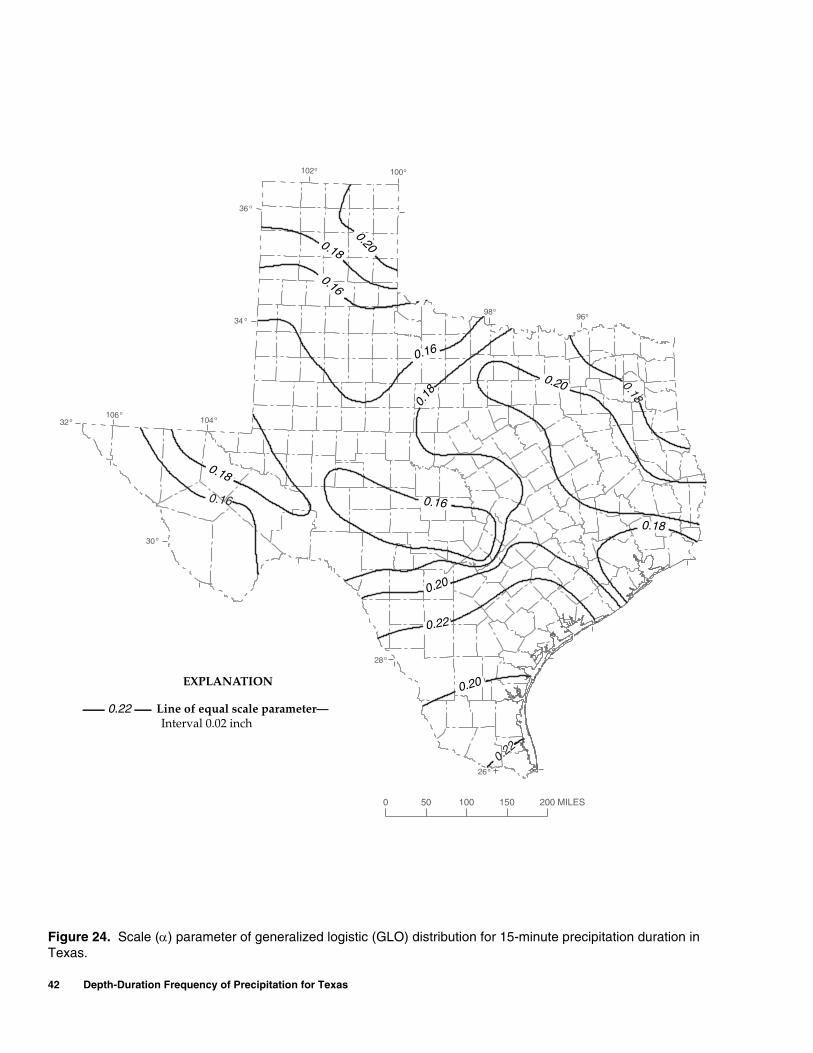
42 Depth-Duration Frequency of Precipitation for Texas
Figure 24100
104
o
o
o28
32o
36
o
96o98o
102o
o34
106 o
o30
o26
0.18
0.20
0.16
0.16
0.20 0.18
0.18
0.16
0.20
0.18
0.22
0.20
0.22
0.16
0 50 100 150 200 MILES
Line of equal scale parameter—Interval 0.02 inch
EXPLANATION
0.22
0.18
0.20 0.18
0.16
0.16
0.20
0.18
0.16
0.20
0.22
0.20
0.18
Figure 24. Scale (α) parameter of generalized logistic (GLO) distribution for 15-minute precipitation duration in Texas.
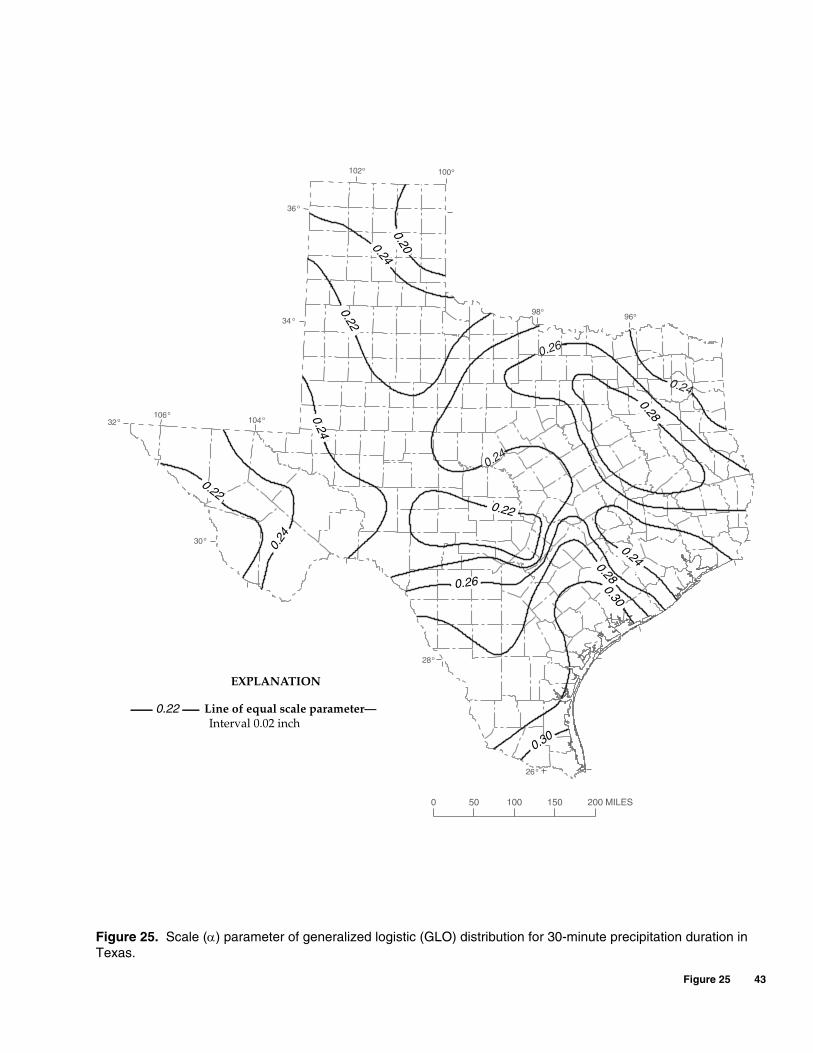
Figure 25 43
Figure 25100
104
o
o
o28
32o
36
o
96o98o
102o
o34
106 o
o30
o26
0.260.24
0.22
0.26
0.24
0.24
0.28
0.24
0.22
0.22
0.24
0.26
0.240.28
0.30
0.30
0 50 100 150 200 MILES
Line of equal scale parameter—Interval 0.02 inch
EXPLANATION
0.22
0.20 0.24
0.22
0.24 0.22
0.24
0.24 0.28 0.30
0.22
0.26
0.30
0.28
Figure 25. Scale (α) parameter of generalized logistic (GLO) distribution for 30-minute precipitation duration in Texas.
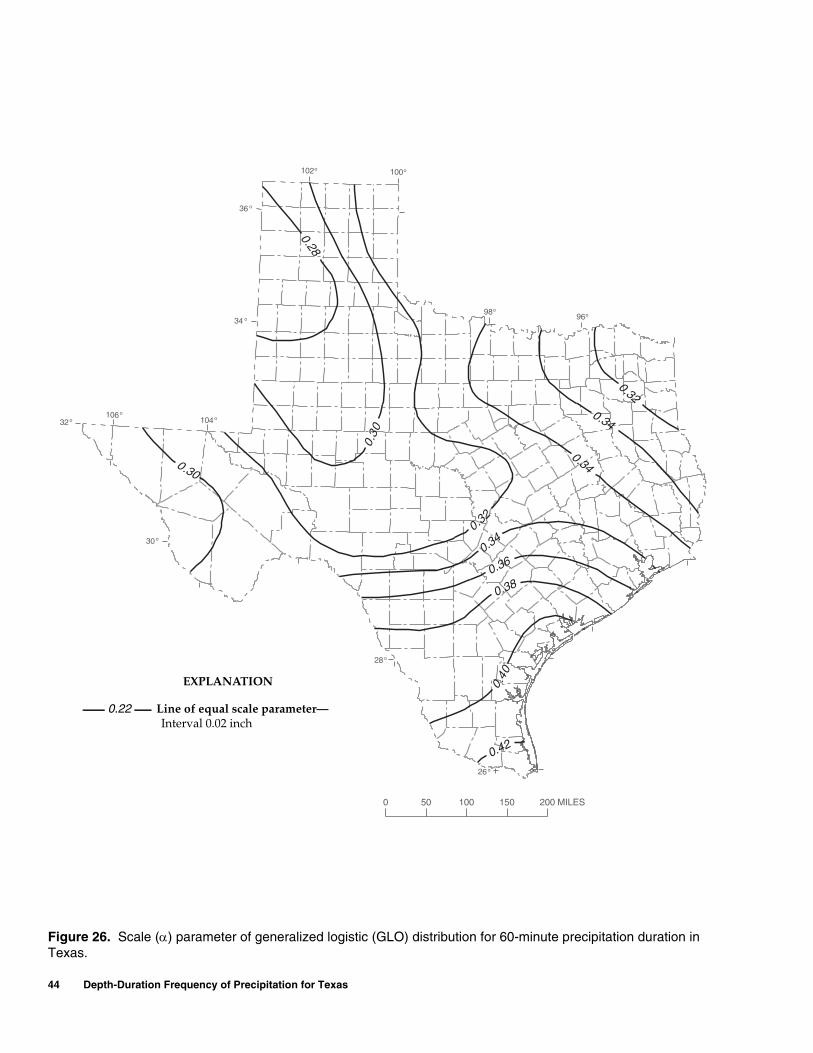
44 Depth-Duration Frequency of Precipitation for Texas
Figure 26100
104
o
o
o28
32o
36
o
96o98o
102o
o34
106 o
o30
o26
0.28
0.32
0.30
0.40
0.42
0.34
0.34
0.34
0.36
0.38
0.32
0.30
0 50 100 150 200 MILES
Line of equal scale parameter—Interval 0.02 inch
EXPLANATION
0.22
Figure 26. Scale (α) parameter of generalized logistic (GLO) distribution for 60-minute precipitation duration in Texas.
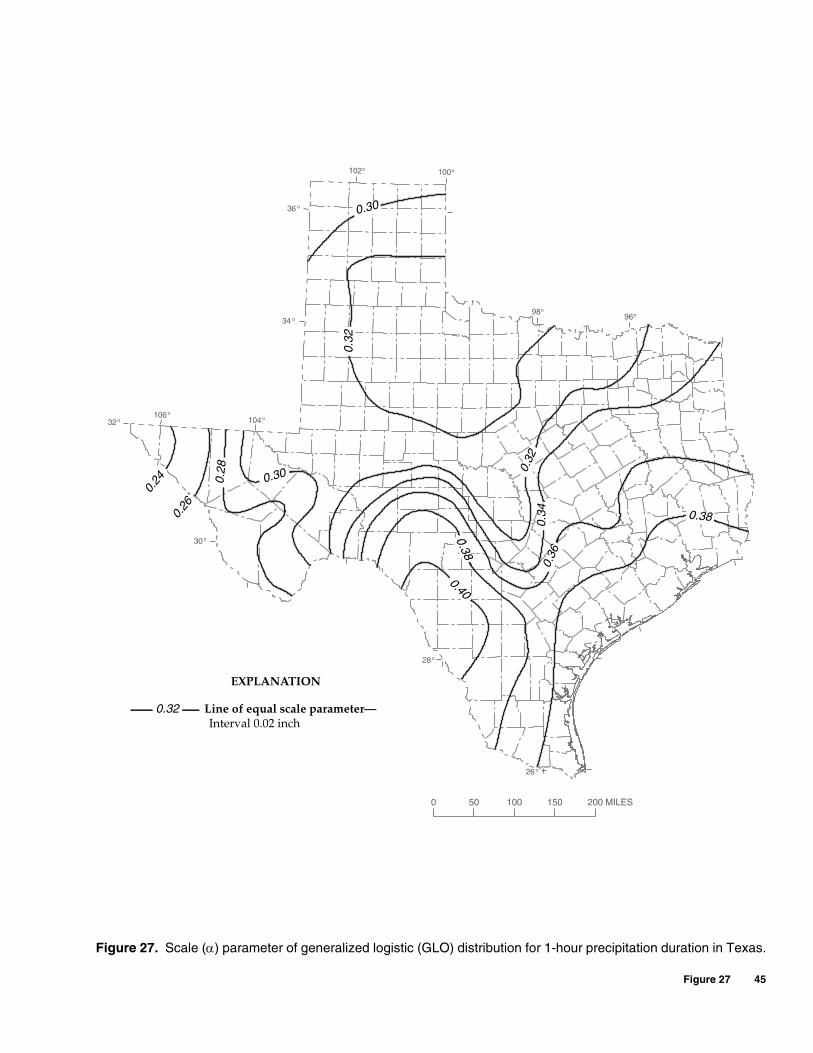
Figure 27 45
Figure 27100
104
o
o
o28
32o
36
o
96o98o
102o
o34
106 o
o30
o26
0.30
0.32
0.300.28 0.
320.
34
0.3
6
0.38
0.380.40
0 50 100 150 200 MILES
Line of equal scale parameter—Interval 0.02 inch
EXPLANATION
0.32
0.24
0.26
0.30 0.
28
0.30
0.40
0.38
0.32
0.
34
0.36
0.38
0.32
Figure 27. Scale (α) parameter of generalized logistic (GLO) distribution for 1-hour precipitation duration in Texas.
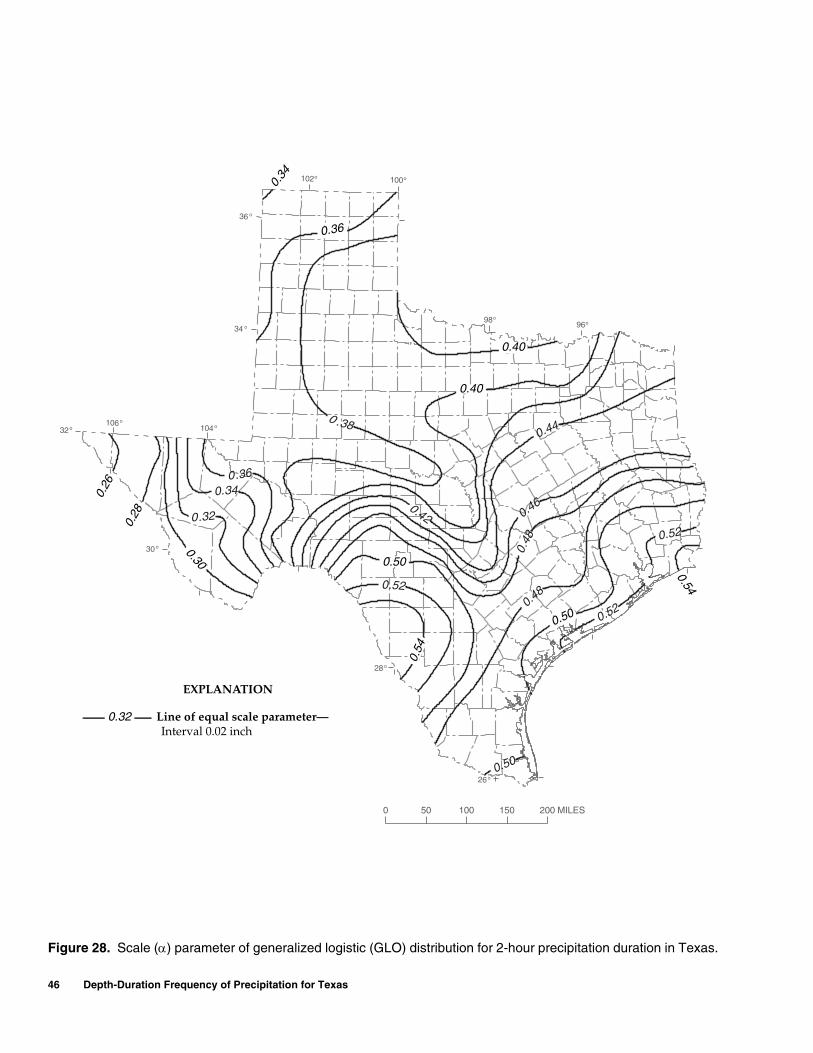
46 Depth-Duration Frequency of Precipitation for Texas
Figure 28100
104
o
o
o28
32o
36
o
96o98o
102o
o34
106 o
o30
o26
0.42
0 .38
0.40
0.36
0.34
0.32
0.30 0.50
0.5
4
0.52
0.50
0.44
0.40
0.46
0.48 0.52
0.520.50
0.48
0 50 100 150 200 MILES
Line of equal scale parameter—Interval 0.02 inch
EXPLANATION
0.32
0.34
0.54
0.26
0.28
0.36
0.40
0.40
0.30 0.50
0.54
0.50
Figure 28. Scale (α) parameter of generalized logistic (GLO) distribution for 2-hour precipitation duration in Texas.
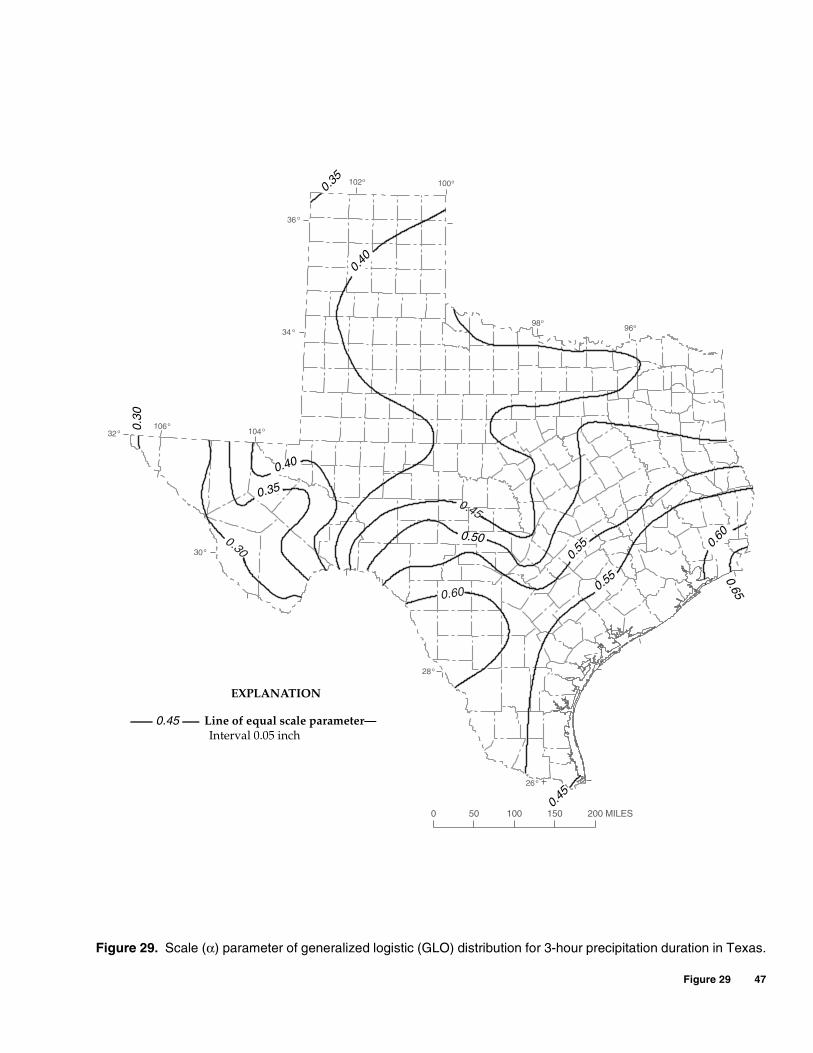
Figure 29 47
Depth-Duration Frequency of Precipitation for Texas
Figure 29
Figure 29. Scale (α) parameter of generalized logistic (GLO) distribution for 3-hour precipitation duration in Texas.
100
104
o
o
o28
32o
36
o
96o98o
102o
o34
106 o
o30
o26
0.40
0.40
0.35
0.30
0.45
0.50
0.55
0.55
0.60
0.60
0 50 100 150 200 MILES
0.35
0.65
Line of equal scale parameter—Interval 0.05 inch
EXPLANATION
0.45
0.45
0.30
0.40
0.40
0.35
0.50
0.55
0.55
0.60
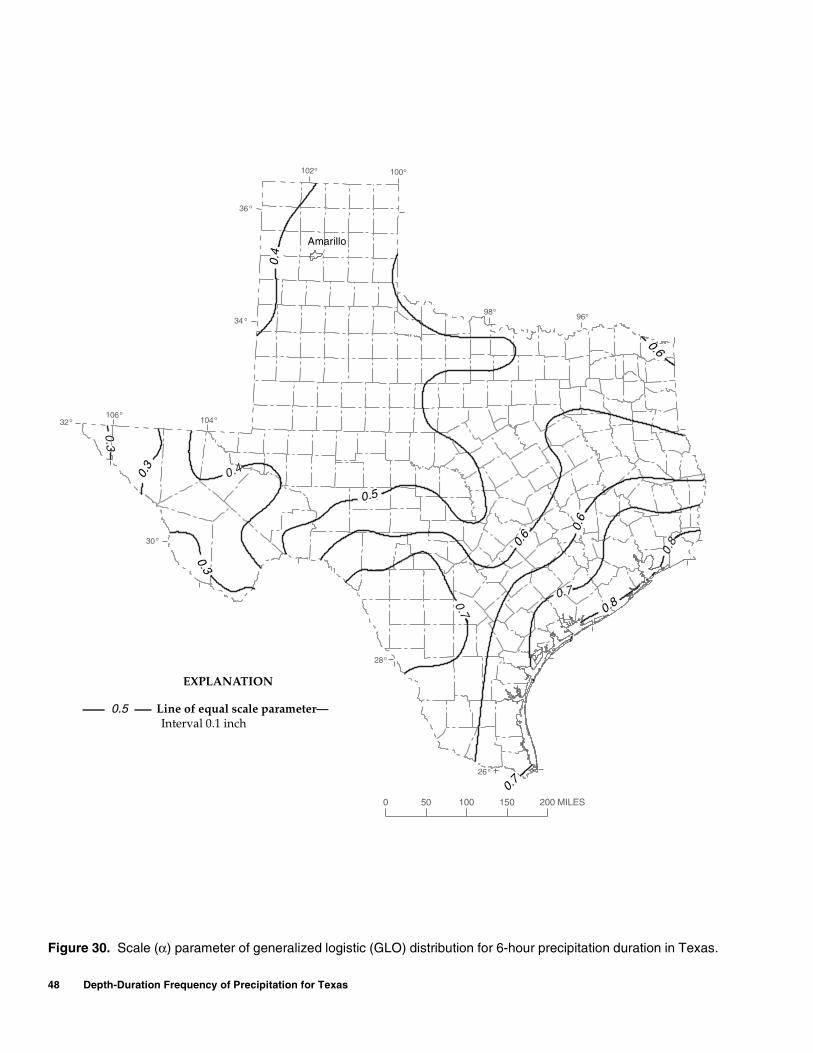
48 Depth-Duration Frequency of Precipitation for Texas
Figure 30100
104
o
o
o28
32o
36
o
96o98o
102o
o34
106 o
o30
o26
0.4
0.6
0.3
0.4
0.8
0.6
0. 3
0.7
0.5
0.7
0.6
0 50 100 150 200 MILES
Line of equal scale parameter—Interval 0.1 inch
EXPLANATION
0.5
Amarillo
0.7
0.3
0.6
0.6
0.6
0.4
0.5
0.3 0.8
Figure 30. Scale (α) parameter of generalized logistic (GLO) distribution for 6-hour precipitation duration in Texas.
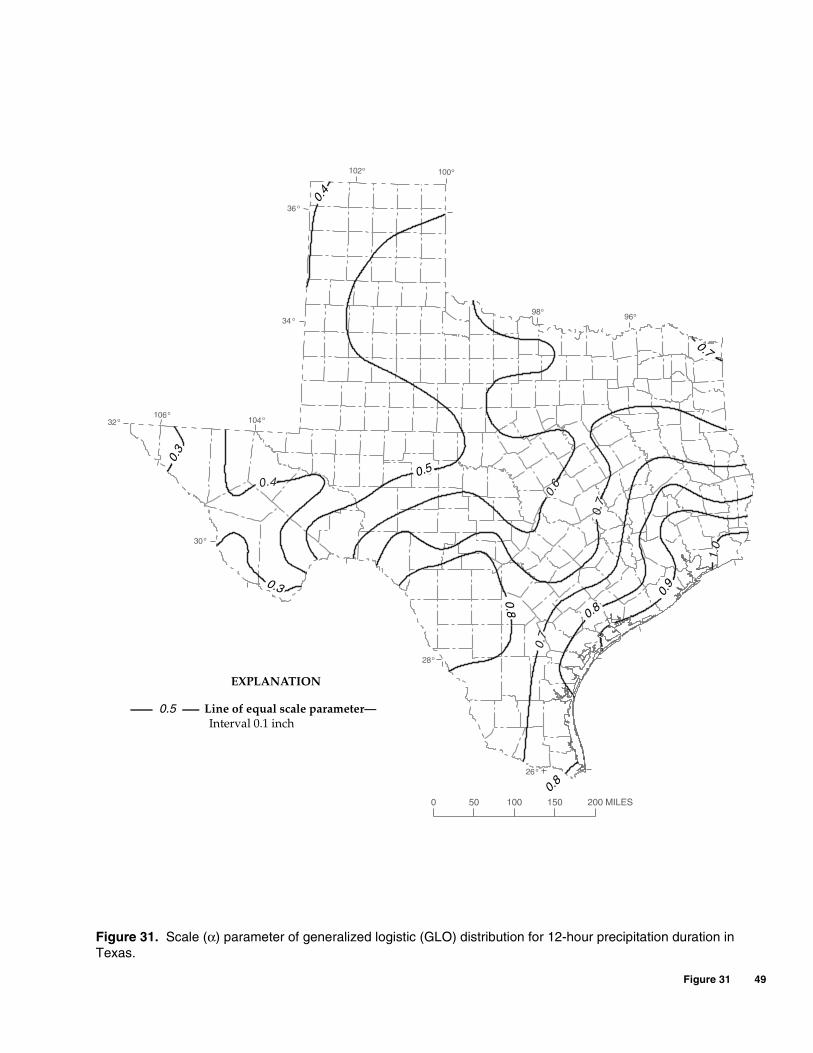
Figure 31 49
Figure 31100
104
o
o
o28
32o
36
o
96o98o
102o
o34
106 o
o30
o26
0 .7
0.4
0.6
1.0
0.7
0.8
0.7
0.5
0.8
0 .9
0 50 100 150 200 MILES
Line of equal scale parameter—Interval 0.1 inch
EXPLANATION
0.5
0.8
0.3
0.3
0.4
0.5
0.8 0.8 0.9
0.7
Figure 31. Scale (α) parameter of generalized logistic (GLO) distribution for 12-hour precipitation duration in Texas.
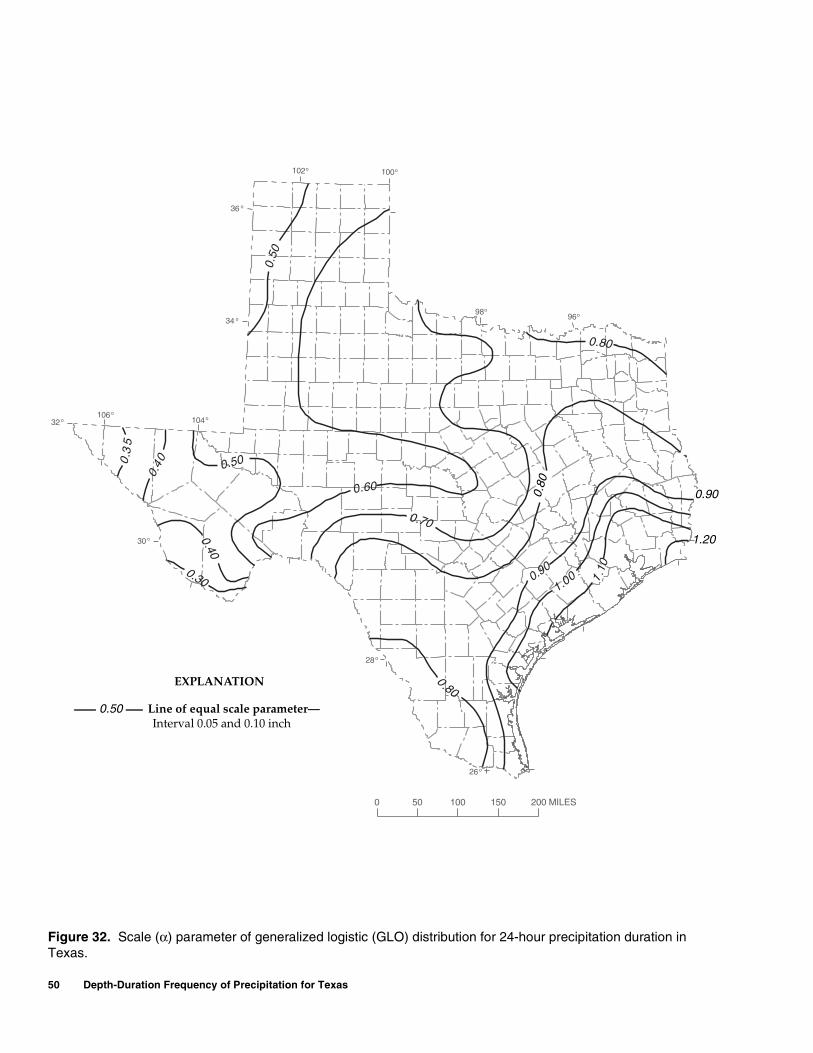
50 Depth-Duration Frequency of Precipitation for Texas
Figure 32100
104
o
o
o28
32o
36
o
96o98o
102o
o34
106 o
o30
o26
0.50
0.80
0.3
5
0.40
0.900.60
0.70
0.50
0.40
0.8
0
0.30 1
.10
1.00
0.80
0.90
0 50 100 150 200 MILES
Line of equal scale parameter—Interval 0.05 and 0.10 inch
EXPLANATION
0.50
1.200.
80
0.90
Figure 32. Scale (α) parameter of generalized logistic (GLO) distribution for 24-hour precipitation duration in Texas.
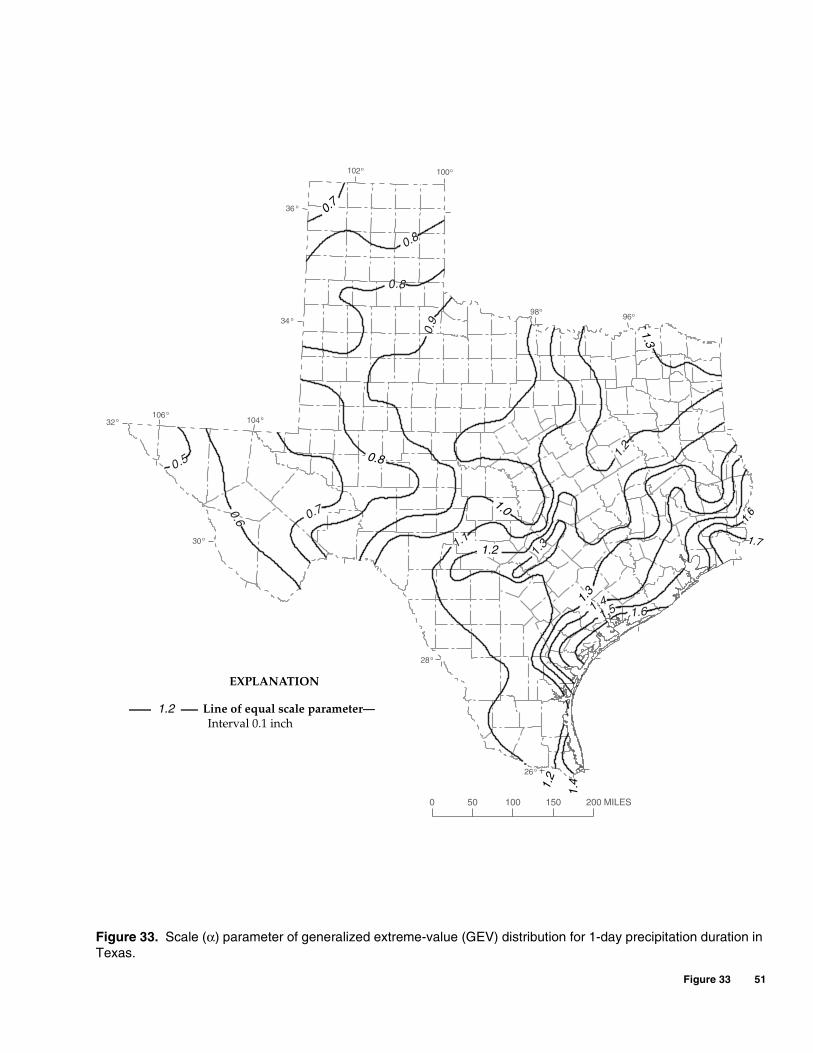
Figure 33 51
Figure 33100
104
o
o
o28
32o
36
o
96o98o
102o
o34
106 o
o30
o26
0 .7
0.8
0.8
0.9
0.5 0.8
1.00.7
1.31.2
0.6
1.1
1.61.51.41.3
1.2
0 50 100 150 200 MILES
Line of equal scale parameter—Interval 0.1 inch
EXPLANATION
1.2
1.6
1.71.
2
1.4
0.7
1.3
0.8
1.0
1.2
1.3
Figure 33. Scale (α) parameter of generalized extreme-value (GEV) distribution for 1-day precipitation duration in Texas.
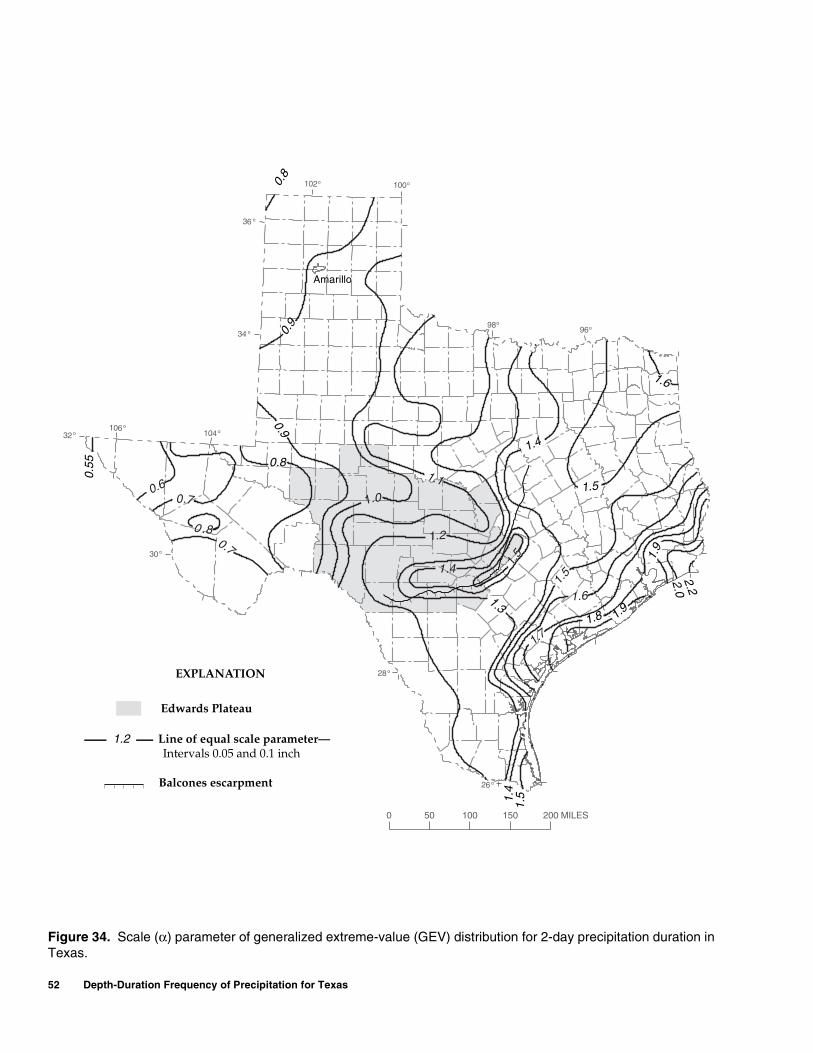
52 Depth-Duration Frequency of Precipitation for Texas
Figure 34
100
104
o
o
o28
32o
36
o
96o98o
102o
o34
106 o
o30
o26
0.60.7
0 .8
1.1
0.7
1.0
1.4
1.2
1.8
1.5
1.7
1.4 1.5
1 .5
1.3
1.6
0 50 100 150 200 MILES
Line of equal scale parameter—Intervals 0.05 and 0.1 inch
EXPLANATION
1.2
0.55
0.8
1.5
Balcones escarpment
Edwards Plateau
1.4
2.22.0
Amarillo
0.9
0.9
0.8
1.9
1.6
1.9
1.4
1.5
1.8 1.3
Figure 34. Scale (α) parameter of generalized extreme-value (GEV) distribution for 2-day precipitation duration in Texas.
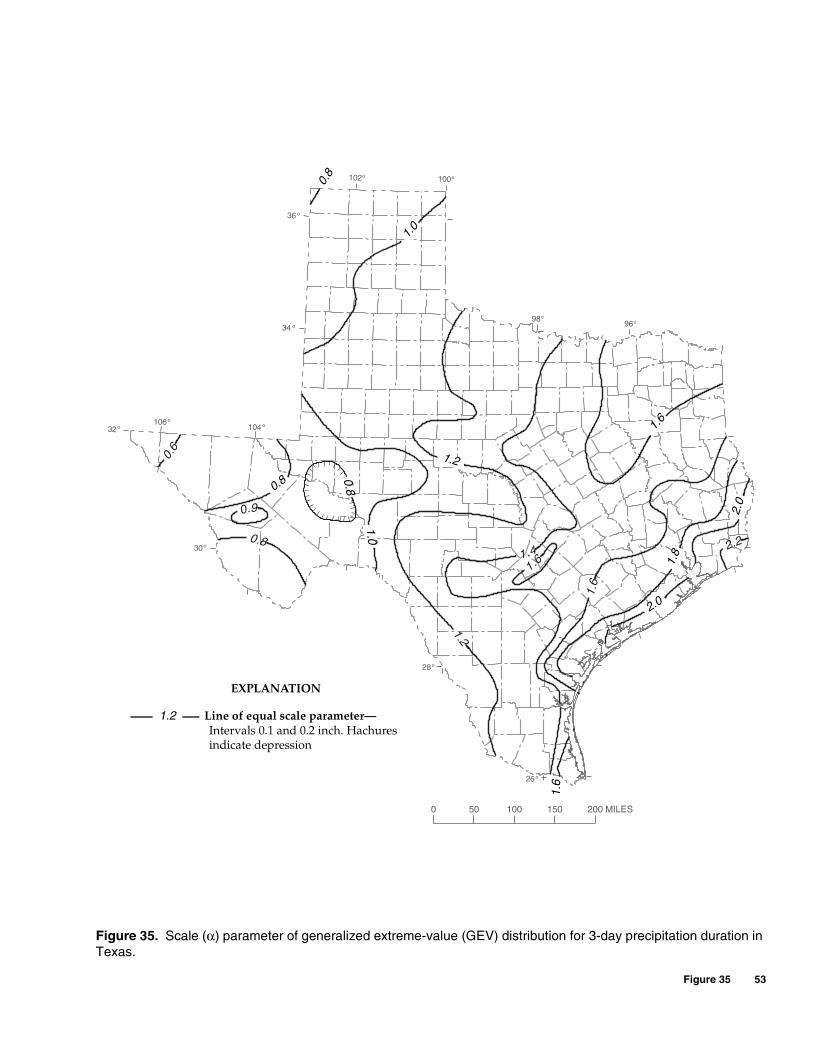
Figure 35 53
Figure 35100
104
o
o
o28
32o
36
o
96o98o
102o
o34
106 o
o30
o26
1.0
0.6
1.2
1.6
0.9
1.0
2.0
2.20.8
1.61.4
1.8
2.0
1.2
1.6
0.8
0 50 100 150 200 MILES
Line of equal scale parameter—Intervals 0.1 and 0.2 inch. Hachures indicate depression
EXPLANATION
1.2
0.8
1.6
0.8
1.0
1.2 0.8
1.0 1.
6
1.8
2.0
2.0
Figure 35. Scale (α) parameter of generalized extreme-value (GEV) distribution for 3-day precipitation duration in Texas.
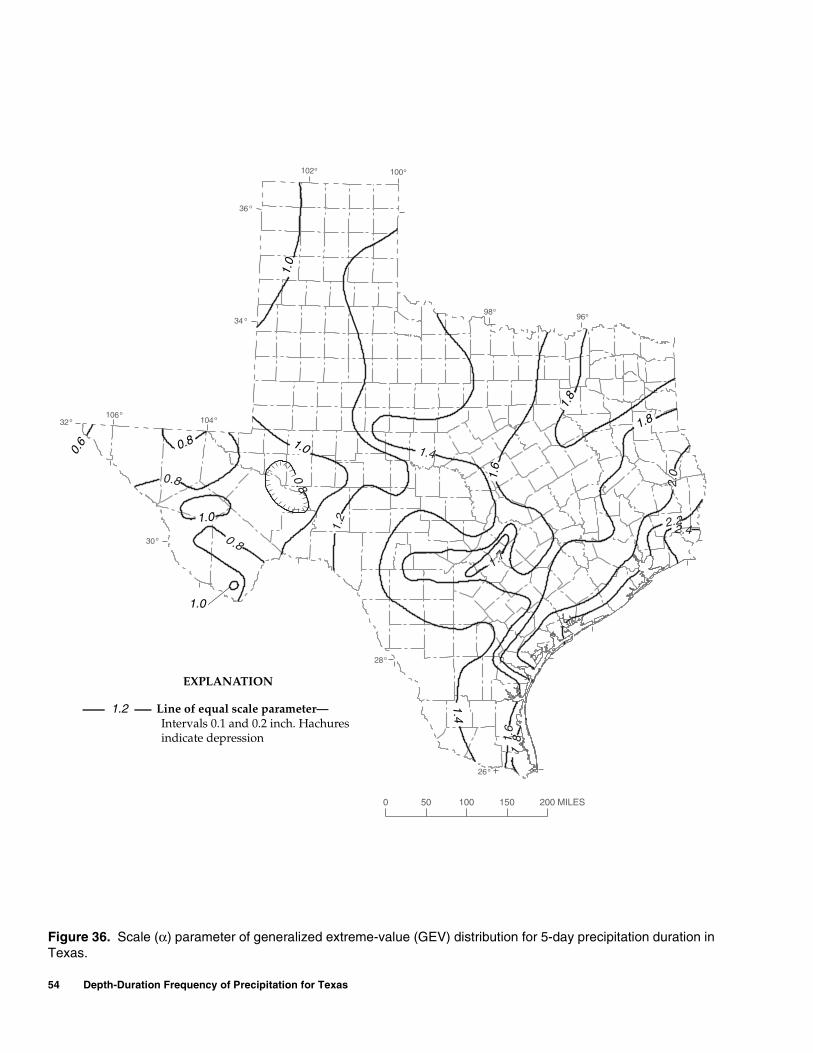
54 Depth-Duration Frequency of Precipitation for Texas
Figure 36100
104
o
o
o28
32o
36
o
96o98o
102o
o34
106 o
o30
o26
0.8
1.0
1.4
1.8
1.0
2.21.2
2.4
2.0
0 .8
1.4
1.6
1.8
1.8
1.7
0.8
0 50 100 150 200 MILES
Line of equal scale parameter—Intervals 0.1 and 0.2 inch. Hachures indicate depression
EXPLANATION
1.2
0.6
1.0
1.0
0.8
1.6
1.0
1.0
1.4
1.8
1.8
Figure 36. Scale (α) parameter of generalized extreme-value (GEV) distribution for 5-day precipitation duration in Texas.
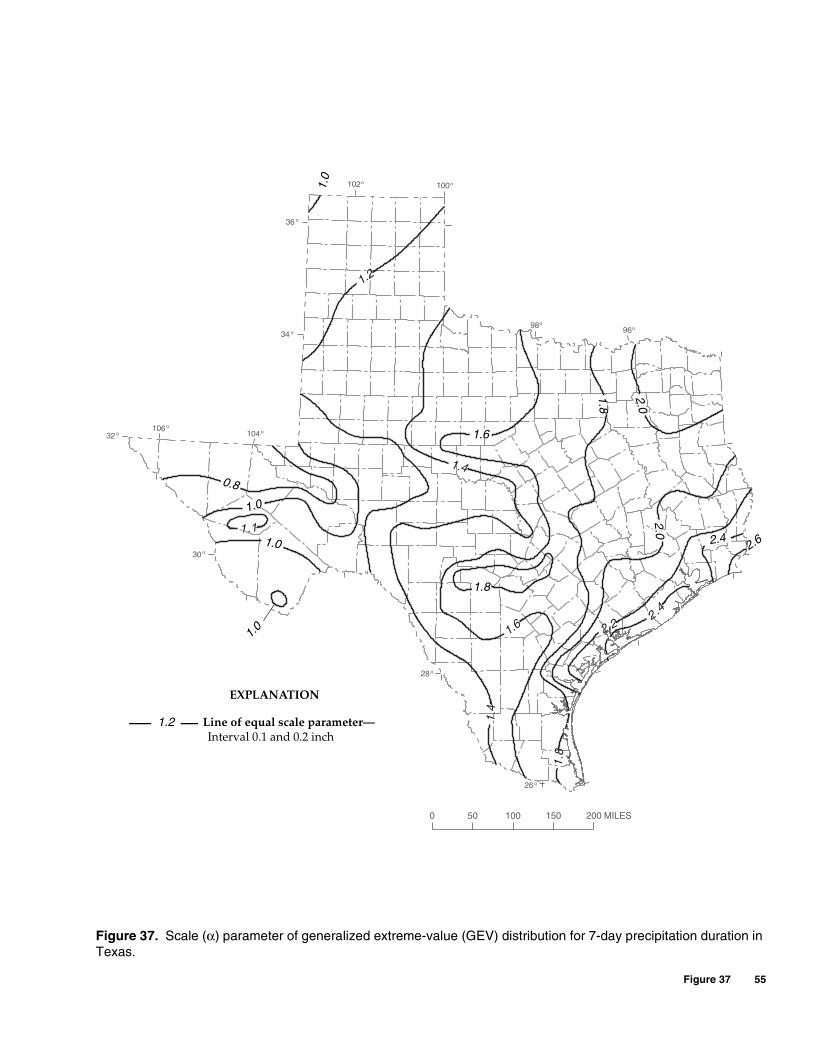
Figure 37 55
Figure 37
100
104
o
o
o28
32o
36
o
96o98o
102o
o34
106 o
o30
o26
1.2
0.8
1.4
1.1
1.0
1.0 2.4
2 .4
1.6 2.2
1.4
1.8
0 50 100 150 200 MILES
Line of equal scale parameter—Interval 0.1 and 0.2 inch
EXPLANATION
1.2
1.0
2.6
1.0
1.8
1.6
1.8
2.0 2.0
0.8
1.0
1.0 2.4
Figure 37. Scale (α) parameter of generalized extreme-value (GEV) distribution for 7-day precipitation duration in Texas.
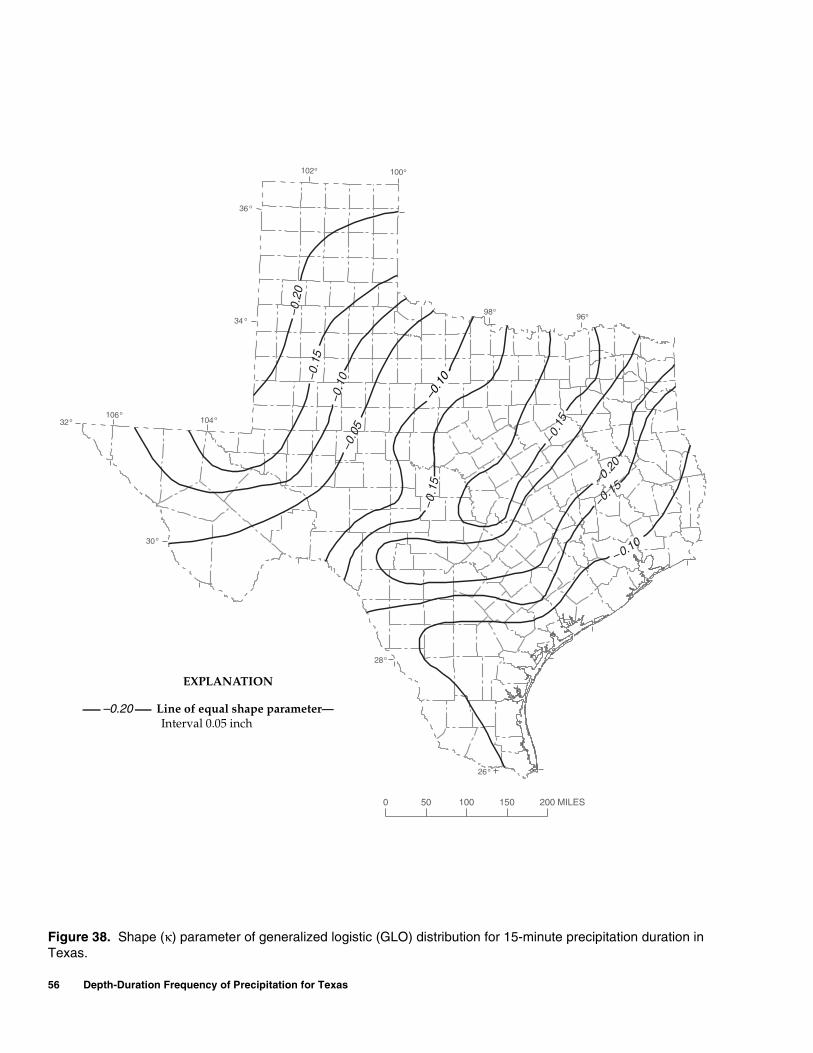
56 Depth-Duration Frequency of Precipitation for Texas
Figure 38100
104
o
o
o28
32o
36
o
96o98o
102o
o34
106 o
o30
o26
−0.2
0−0
.15
−0.1
0
−0.1
5
−0.0
5
−0.10
−0.15
−0.10
−0.20
−0.1
5
0 50 100 150 200 MILES
Line of equal shape parameter—Interval 0.05 inch
EXPLANATION
–0.20
–0.10
Figure 38. Shape (κ) parameter of generalized logistic (GLO) distribution for 15-minute precipitation duration in Texas.
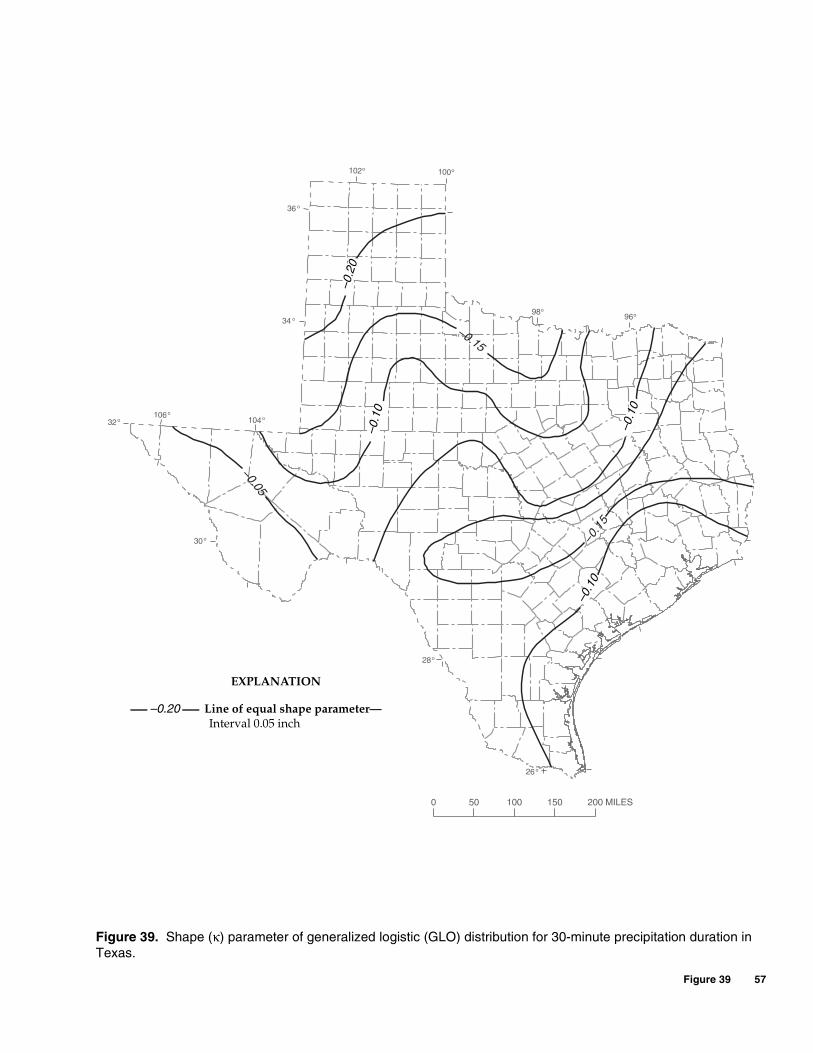
Figure 39 57
Figure 39100
104
o
o
o28
32o
36
o
96o98o
102o
o34
106 o
o30
o26
−0.2
0
−0.15
−0.1
0
−0.05
−0.1
0
−0.1
5
−0.1
0
0 50 100 150 200 MILES
Line of equal shape parameter—Interval 0.05 inch
EXPLANATION
–0.20
–0.2
0 –0
.10
–0.1
0
–0.1
0
Figure 39. Shape (κ) parameter of generalized logistic (GLO) distribution for 30-minute precipitation duration in Texas.
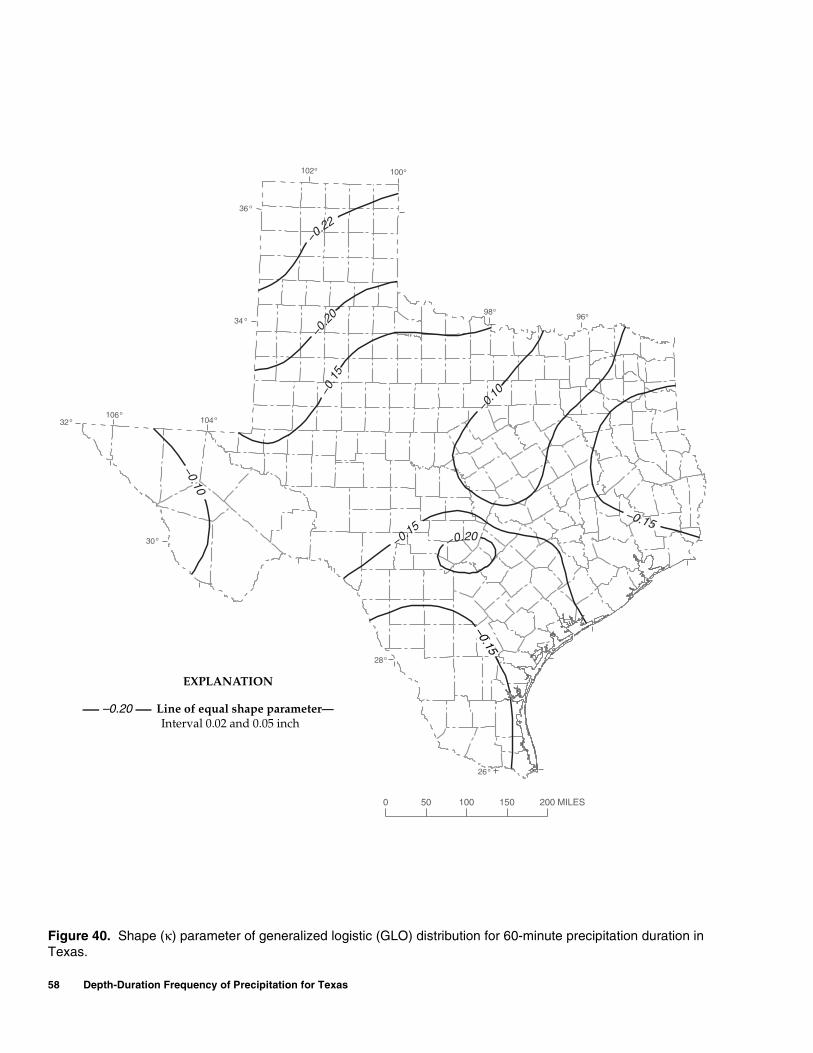
58 Depth-Duration Frequency of Precipitation for Texas
Figure 40100
104
o
o
o28
32o
36
o
96o98o
102o
o34
106 o
o30
o26
−0.22
−0.2
0−0
.15
−0.15
−0.10
−0.20−0.15
−0.15
−0.1
0
0 50 100 150 200 MILES
Line of equal shape parameter—Interval 0.02 and 0.05 inch
EXPLANATION
–0.20
–0.15
Figure 40. Shape (κ) parameter of generalized logistic (GLO) distribution for 60-minute precipitation duration in Texas.
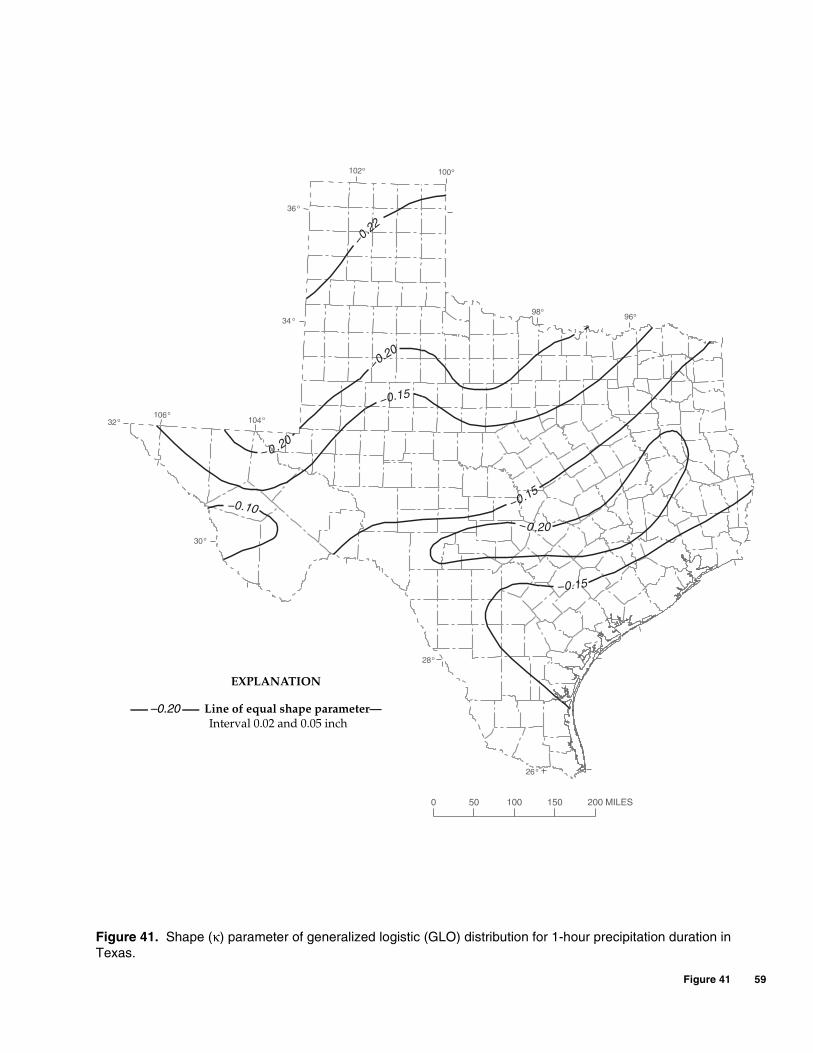
Figure 41 59
Figure 41100
104
o
o
o28
32o
36
o
96o98o
102o
o34
106 o
o30
o26
−0.22
−0 .20
−0.10
−0.15
−0.15
−0 .20
−0.15
−0.20
0 50 100 150 200 MILES
Line of equal shape parameter—Interval 0.02 and 0.05 inch
EXPLANATION
–0.20
Figure 41. Shape (κ) parameter of generalized logistic (GLO) distribution for 1-hour precipitation duration in Texas.
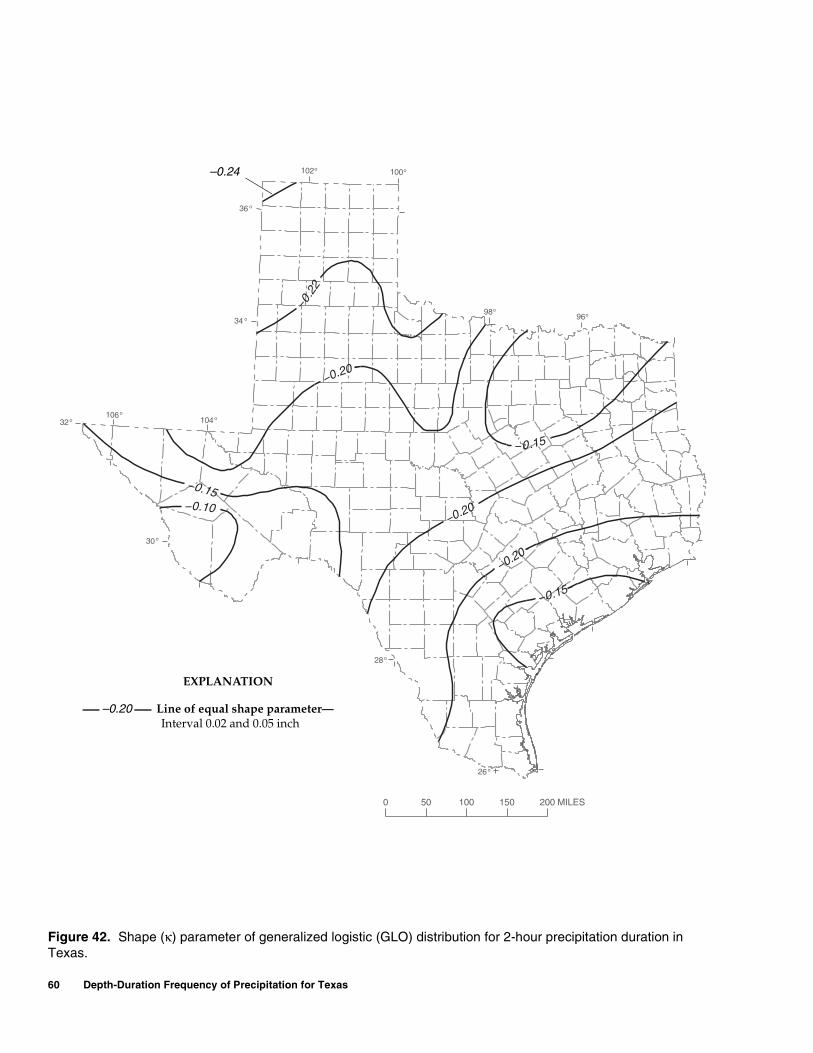
60 Depth-Duration Frequency of Precipitation for Texas
Figure 42100
104
o
o
o28
32o
36
o
96o98o
102o
o34
106 o
o30
o26
−0.22
−0.10
−0.15
−0.20
−0.20
−0.20
−0.15
−0.15
0 50 100 150 200 MILES
Line of equal shape parameter—Interval 0.02 and 0.05 inch
EXPLANATION
–0.20
–0.24
Figure 42. Shape (κ) parameter of generalized logistic (GLO) distribution for 2-hour precipitation duration in Texas.
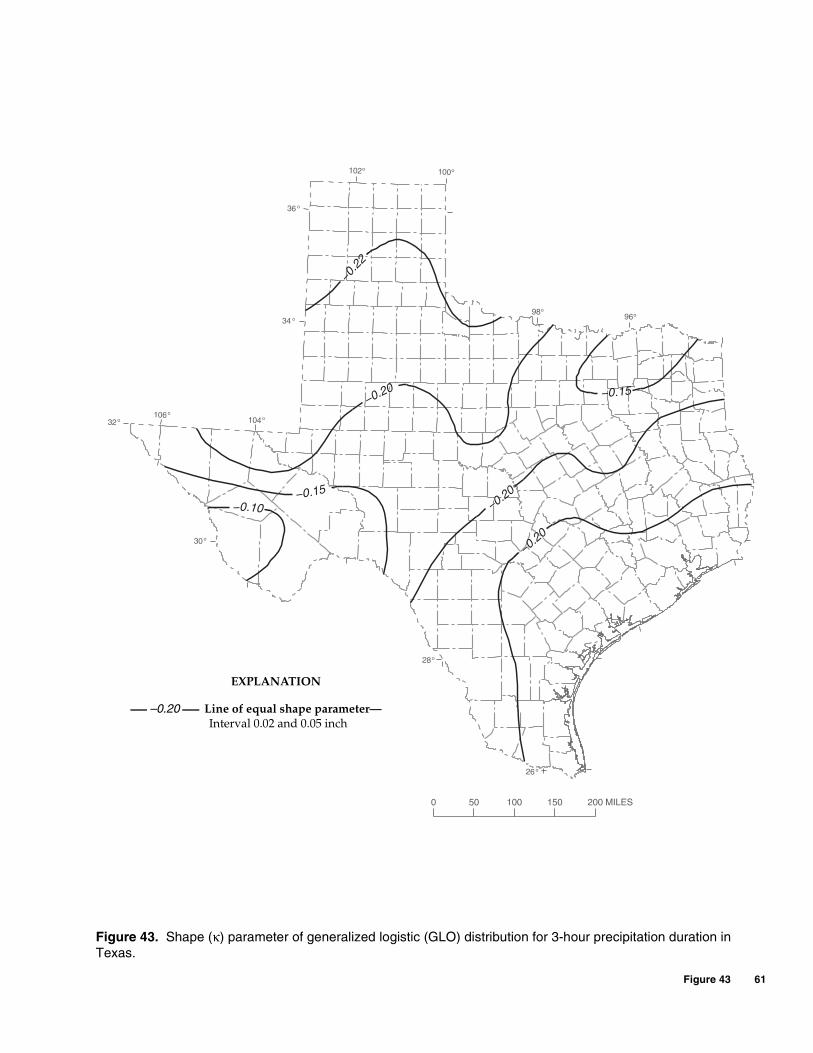
Figure 43 61
Figure 43100
104
o
o
o28
32o
36
o
96o98o
102o
o34
106 o
o30
o26
−0.22
−0.10−0.15
−0.20
−0.20
−0.20
−0.15
0 50 100 150 200 MILES
Line of equal shape parameter—Interval 0.02 and 0.05 inch
EXPLANATION
–0.20
Figure 43. Shape (κ) parameter of generalized logistic (GLO) distribution for 3-hour precipitation duration in Texas.
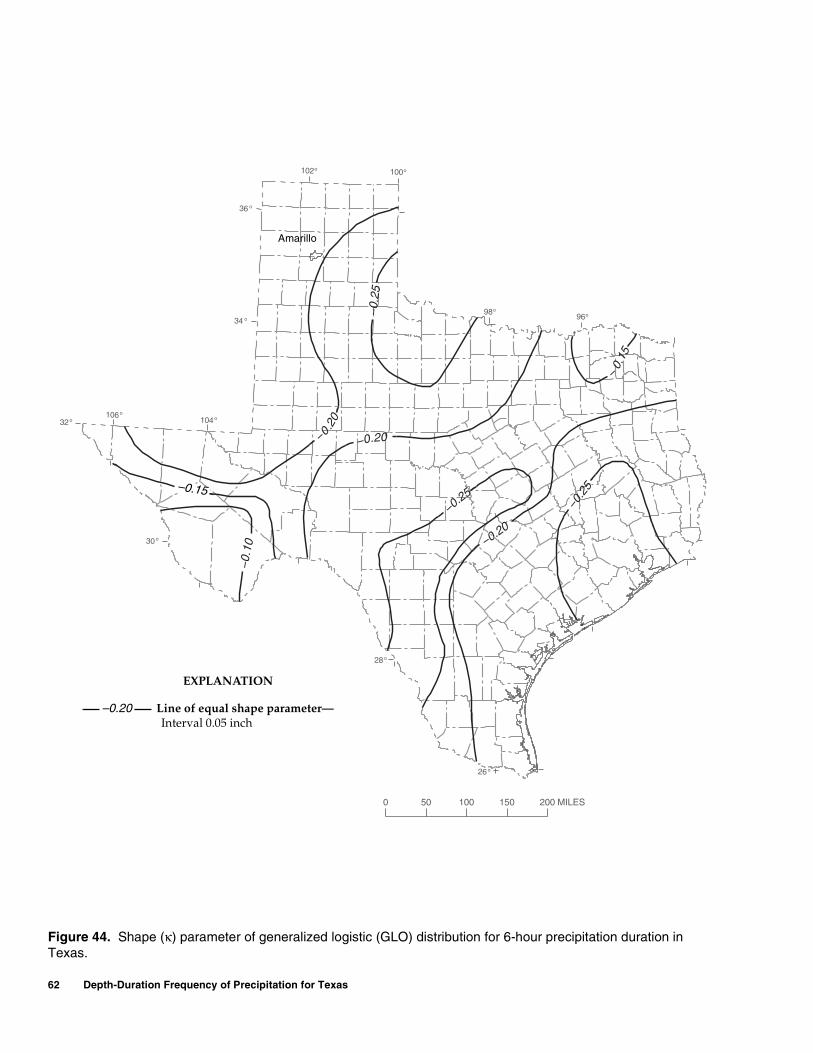
62 Depth-Duration Frequency of Precipitation for Texas
Figure 44100
104
o
o
o28
32o
36
o
96o98o
102o
o34
106 o
o30
o26
−0.20
−0.20
−0.25
−0.20
−0.25
−0.2
5−
0.15
−0.15
−0.1
0
0 50 100 150 200 MILES
Line of equal shape parameter—Interval 0.05 inch
EXPLANATION
–0.20
Amarillo
–0.15
Figure 44. Shape (κ) parameter of generalized logistic (GLO) distribution for 6-hour precipitation duration in Texas.
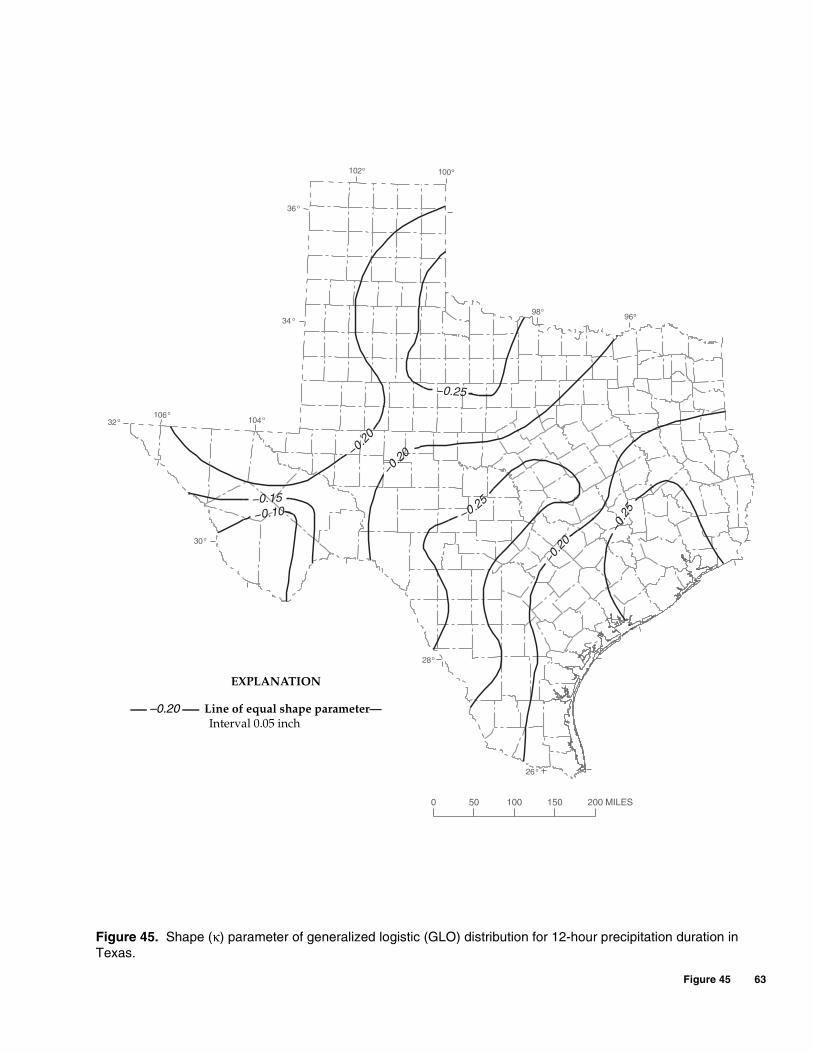
Figure 45 63
Figure 45100
104
o
o
o28
32o
36
o
96o98o
102o
o34
106 o
o30
o26
−0.25
−0.20
−0.20
−0.25
−0.2
0
−0.2
5−0.15−0.10
0 50 100 150 200 MILES
Line of equal shape parameter—Interval 0.05 inch
EXPLANATION
–0.20
Figure 45. Shape (κ) parameter of generalized logistic (GLO) distribution for 12-hour precipitation duration in Texas.
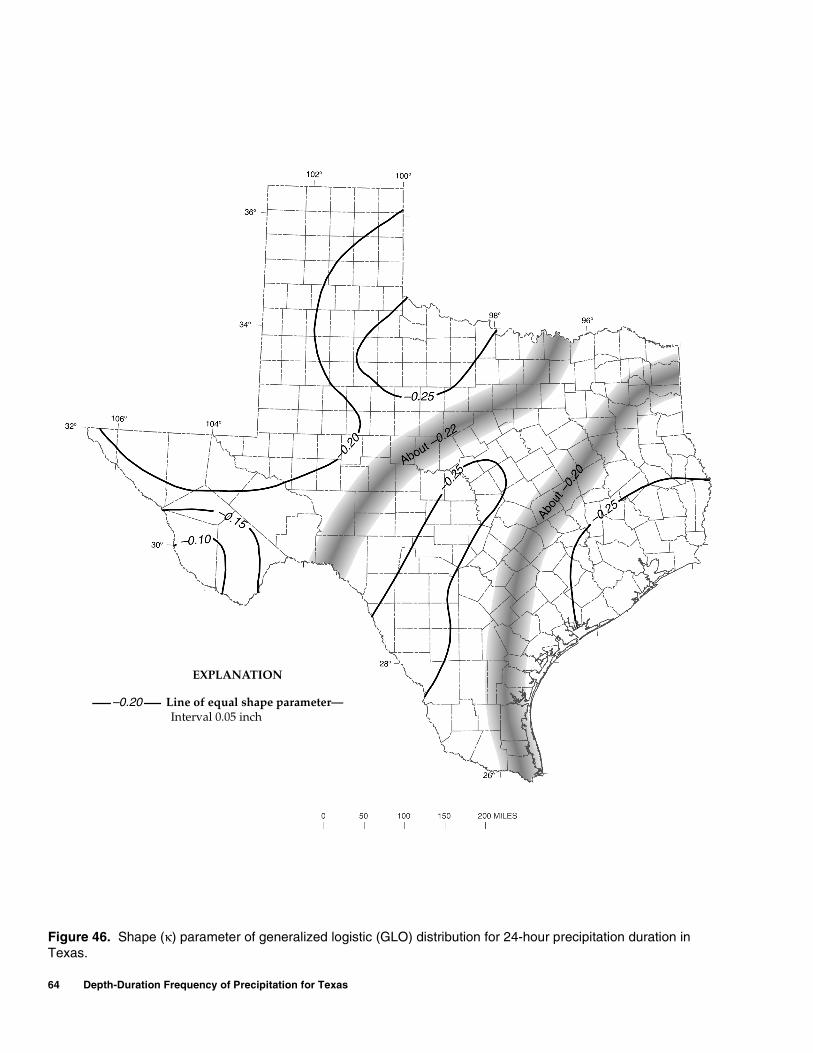
64 Depth-Duration Frequency of Precipitation for Texas
Figure 46
Line of equal shape parameter—Interval 0.05 inch
EXPLANATION
–0.20
Figure 46. Shape (κ) parameter of generalized logistic (GLO) distribution for 24-hour precipitation duration in Texas.
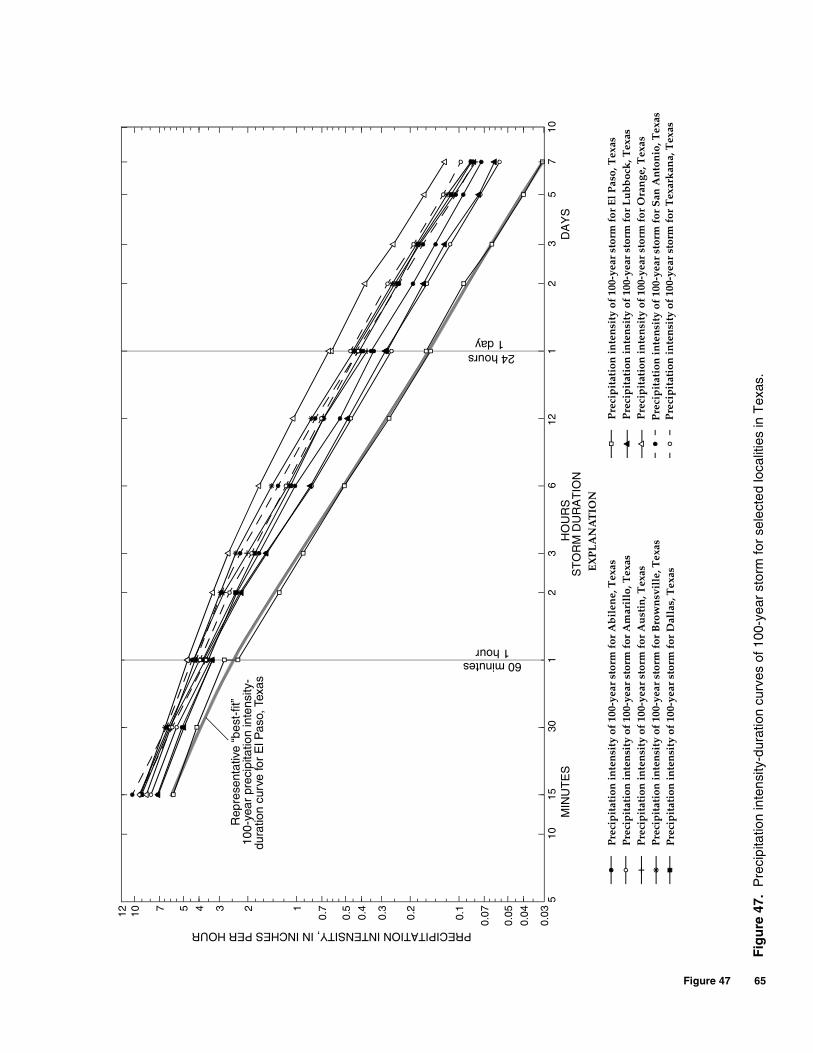
Figure 47 65
Fig
ure
47
Fig
ure
47.
Pre
cipi
tatio
n in
tens
ity-d
urat
ion
curv
es o
f 100
-yea
r st
orm
for
sele
cted
loca
litie
s in
Tex
as.
510
1015
302
36
121
23
57
ST
OR
M D
UR
AT
ION
0.0312
0.04
0.05
0.070.1
0.2
0.3
0.4
0.5
0.712345710
PRECIPITATION INTENSITY, IN INCHES PER HOUR
1M
INU
TE
SH
OU
RS
DA
YS
Rep
rese
ntat
ive
“bes
t-fit
”10
0-ye
ar p
reci
pita
tion
inte
nsity
-du
ratio
n cu
rve
for
El P
aso,
Tex
as
60 minutes1 hour
24 hours1 day
Pre
cip
itat
ion
inte
nsi
ty o
f 10
0-ye
ar s
torm
for
Ab
ilen
e, T
exas
Pre
cip
itat
ion
inte
nsi
ty o
f 10
0-ye
ar s
torm
for
Am
aril
lo, T
exas
Pre
cip
itat
ion
inte
nsi
ty o
f 10
0-ye
ar s
torm
for
Au
stin
, Tex
asP
reci
pit
atio
n in
ten
sity
of
100-
year
sto
rm f
or B
row
nsv
ille
, Tex
asP
reci
pit
atio
n in
ten
sity
of
100-
year
sto
rm f
or D
alla
s, T
exas
Pre
cip
itat
ion
inte
nsi
ty o
f 10
0-ye
ar s
torm
for
El P
aso,
Tex
asP
reci
pit
atio
n in
ten
sity
of
100-
year
sto
rm f
or L
ub
boc
k, T
exas
Pre
cip
itat
ion
inte
nsi
ty o
f 10
0-ye
ar s
torm
for
Ora
nge
, Tex
asP
reci
pit
atio
n in
ten
sity
of
100-
year
sto
rm f
or S
an A
nto
nio
, Tex
asP
reci
pit
atio
n in
ten
sity
of
100-
year
sto
rm f
or T
exar
kan
a, T
exas
EX
PL
AN
AT
ION
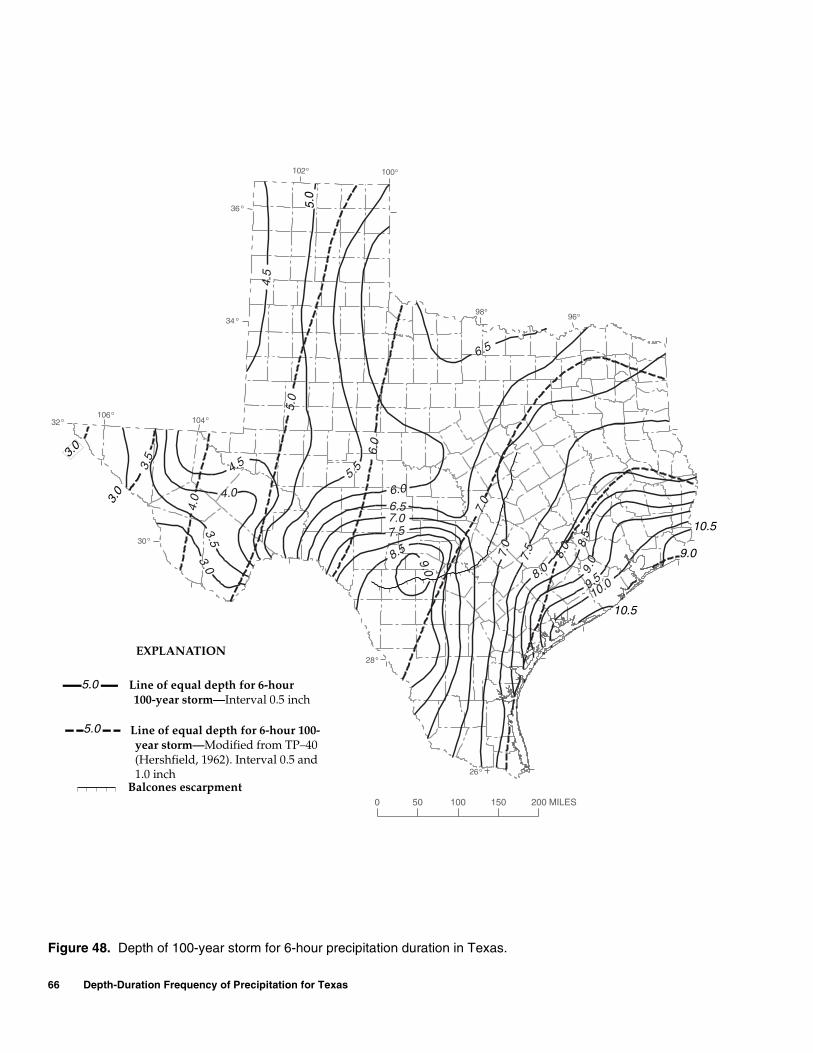
66 Depth-Duration Frequency of Precipitation for Texas
Figure 48100
104
o
o
o28
32o
36
o
96o98o
102o
o34
106 o
o30
o26
6.5
4.5
3 .03.5
4.0
4.5
9.0
8.57.57.06.56.0
5.5
10.09.59.
08.
58.0
7.57.0
3.5
5.0
6.0
7.0
8.0
4.0
0 50 100 150 200 MILES
3.0
10.5
10.5
9.0
Line of equal depth for 6-hour 100-year storm—Interval 0.5 inch
Line of equal depth for 6-hour 100-year storm—Modified from TP–40 (Hershfield, 1962). Interval 0.5 and 1.0 inch
5.0
5.0
EXPLANATION
Balcones escarpment
5.0
3.0
Figure 48. Depth of 100-year storm for 6-hour precipitation duration in Texas.
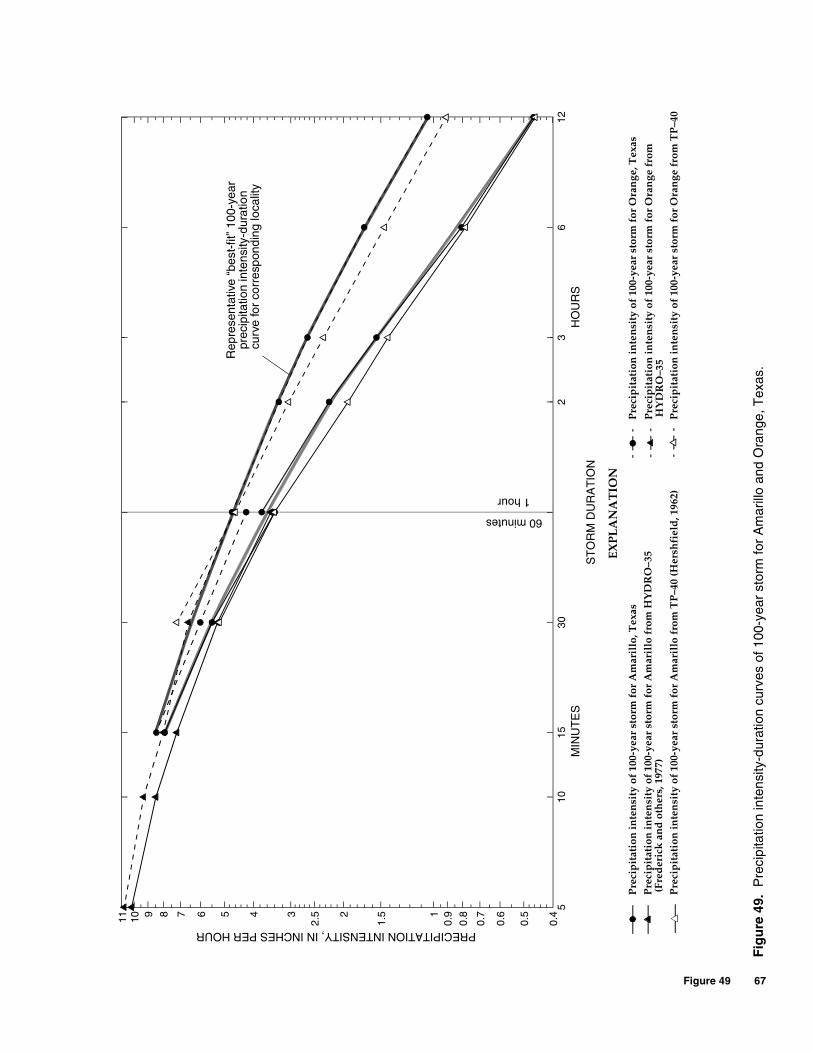
Figure 49 67
Fig
ure
49
Fig
ure
49.
Pre
cipi
tatio
n in
tens
ity-d
urat
ion
curv
es o
f 100
-yea
r st
orm
for
Am
arill
o an
d O
rang
e, T
exas
.
512
1015
302
36
ST
OR
M D
UR
AT
ION
0.411 0.5
0.6
0.7
0.8
0.91
1.52
2.5345678910
PRECIPITATION INTENSITY, IN INCHES PER HOUR
EX
PL
AN
AT
ION
60 minutes
1 hour
Rep
rese
ntat
ive
“bes
t-fit
” 10
0-ye
arpr
ecip
itatio
n in
tens
ity-d
urat
ion
curv
e fo
r co
rres
pond
ing
loca
lity
Pre
cip
itat
ion
inte
nsi
ty o
f 10
0-ye
ar s
torm
for
Am
aril
lo, T
exas
Pre
cip
itat
ion
inte
nsi
ty o
f 10
0-ye
ar s
torm
for
Am
aril
lo f
rom
HY
DR
O–3
5
Pre
cip
itat
ion
inte
nsi
ty o
f 10
0-ye
ar s
torm
for
Am
aril
lo f
rom
TP
–40
(Her
shfi
eld
, 196
2)
Pre
cip
itat
ion
inte
nsi
ty o
f 10
0-ye
ar s
torm
for
Ora
nge
, Tex
as
Pre
cip
itat
ion
inte
nsi
ty o
f 10
0-ye
ar s
torm
for
Ora
nge
fro
m
Pre
cip
itat
ion
inte
nsi
ty o
f 10
0-ye
ar s
torm
for
Ora
nge
fro
m T
P–4
0
MIN
UT
ES
HO
UR
S
(Fre
der
ick
an
d o
ther
s, 1
977)
HY
DR
O–3
5

APPENDICES 69
Footnote at end of table.
Depth-Duration Frequency of Precipitation for Texas
APPENDICES
APPENDICES
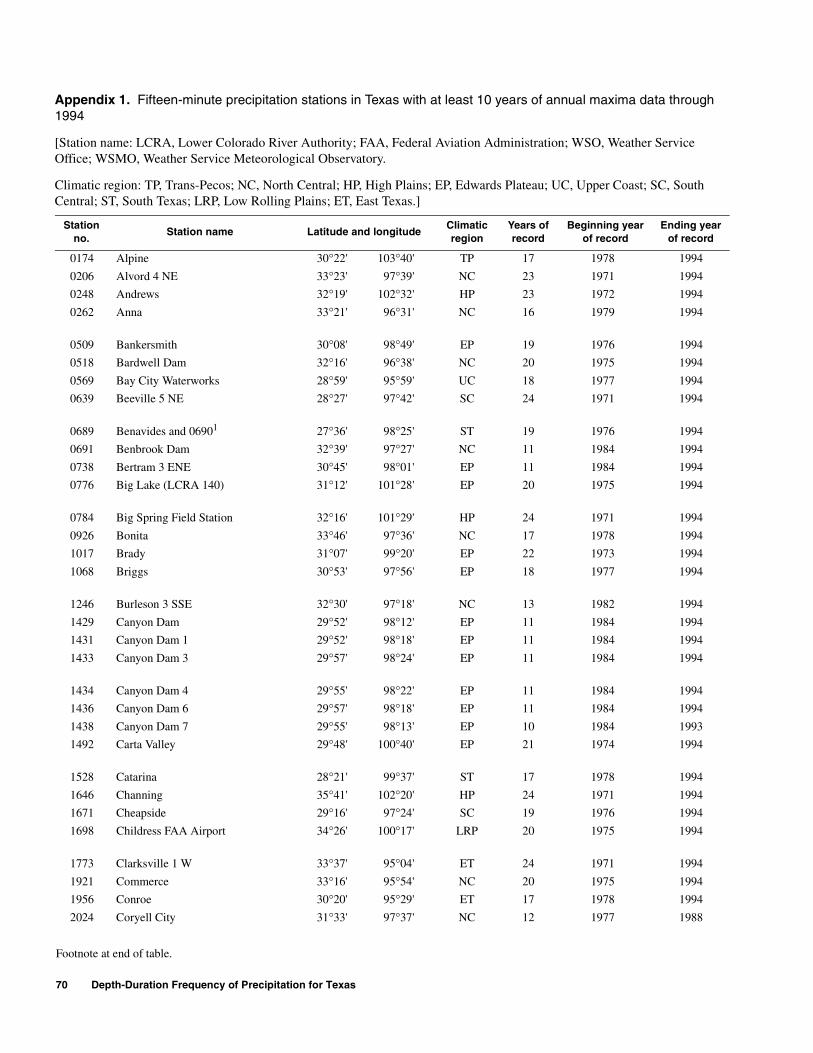
70 Depth-Duration Frequency of Precipitation for Texas
Footnote at end of table.
Appendix 1. Fifteen-minute precipitation stations in Texas with at least 10 years of annual maxima data through 1994—Continued
Stationno.
Station name Latitude and longitudeClimaticregion
Years ofrecord
Beginning yearof record
Ending yearof record
0174 Alpine 30°22' 103°40' TP 17 1978 1994
0206 Alvord 4 NE 33°23' 97°39' NC 23 1971 1994
0248 Andrews 32°19' 102°32' HP 23 1972 1994
0262 Anna 33°21' 96°31' NC 16 1979 1994
0509 Bankersmith 30°08' 98°49' EP 19 1976 1994
0518 Bardwell Dam 32°16' 96°38' NC 20 1975 1994
0569 Bay City Waterworks 28°59' 95°59' UC 18 1977 1994
0639 Beeville 5 NE 28°27' 97°42' SC 24 1971 1994
0689 Benavides and 06901 27°36' 98°25' ST 19 1976 1994
0691 Benbrook Dam 32°39' 97°27' NC 11 1984 1994
0738 Bertram 3 ENE 30°45' 98°01' EP 11 1984 1994
0776 Big Lake (LCRA 140) 31°12' 101°28' EP 20 1975 1994
0784 Big Spring Field Station 32°16' 101°29' HP 24 1971 1994
0926 Bonita 33°46' 97°36' NC 17 1978 1994
1017 Brady 31°07' 99°20' EP 22 1973 1994
1068 Briggs 30°53' 97°56' EP 18 1977 1994
1246 Burleson 3 SSE 32°30' 97°18' NC 13 1982 1994
1429 Canyon Dam 29°52' 98°12' EP 11 1984 1994
1431 Canyon Dam 1 29°52' 98°18' EP 11 1984 1994
1433 Canyon Dam 3 29°57' 98°24' EP 11 1984 1994
1434 Canyon Dam 4 29°55' 98°22' EP 11 1984 1994
1436 Canyon Dam 6 29°57' 98°18' EP 11 1984 1994
1438 Canyon Dam 7 29°55' 98°13' EP 10 1984 1993
1492 Carta Valley 29°48' 100°40' EP 21 1974 1994
1528 Catarina 28°21' 99°37' ST 17 1978 1994
1646 Channing 35°41' 102°20' HP 24 1971 1994
1671 Cheapside 29°16' 97°24' SC 19 1976 1994
1698 Childress FAA Airport 34°26' 100°17' LRP 20 1975 1994
1773 Clarksville 1 W 33°37' 95°04' ET 24 1971 1994
1921 Commerce 33°16' 95°54' NC 20 1975 1994
1956 Conroe 30°20' 95°29' ET 17 1978 1994
2024 Coryell City 31°33' 97°37' NC 12 1977 1988
Appendix 1. Fifteen-minute precipitation stations in Texas with at least 10 years of annual maxima data through 1994
[Station name: LCRA, Lower Colorado River Authority; FAA, Federal Aviation Administration; WSO, Weather Service Office; WSMO, Weather Service Meteorological Observatory.
Climatic region: TP, Trans-Pecos; NC, North Central; HP, High Plains; EP, Edwards Plateau; UC, Upper Coast; SC, South Central; ST, South Texas; LRP, Low Rolling Plains; ET, East Texas.]
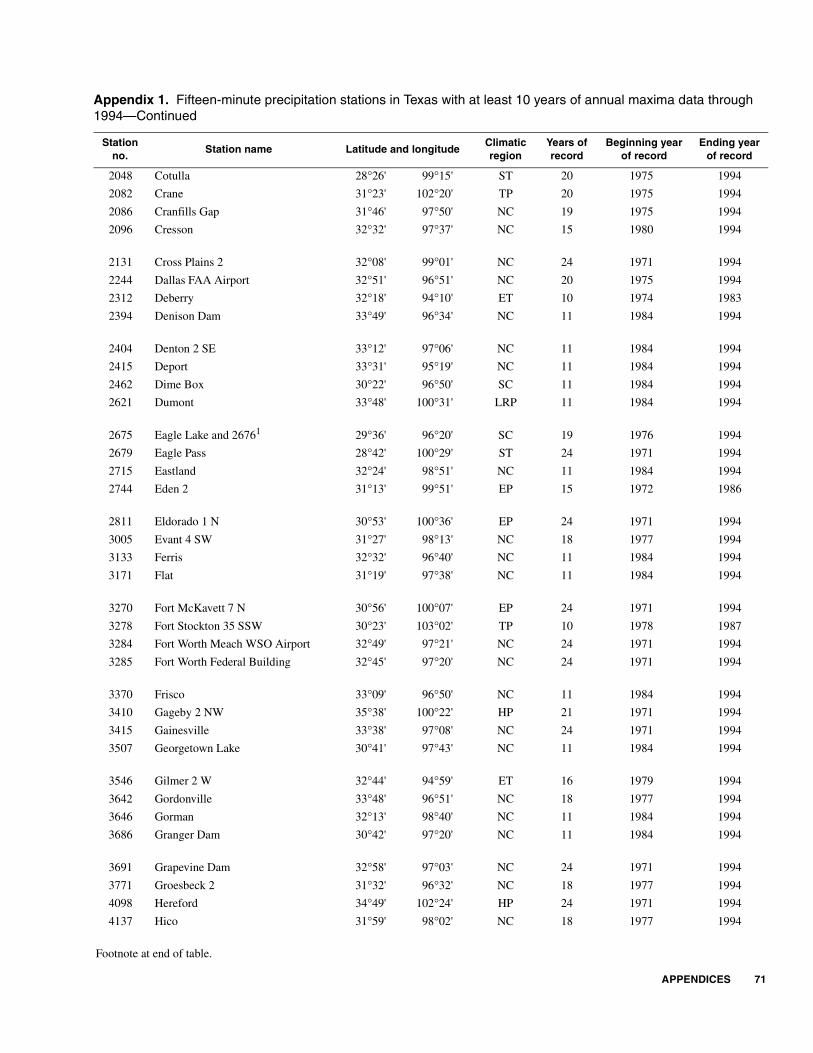
APPENDICES 71
Footnote at end of table.
2048 Cotulla 28°26' 99°15' ST 20 1975 1994
2082 Crane 31°23' 102°20' TP 20 1975 1994
2086 Cranfills Gap 31°46' 97°50' NC 19 1975 1994
2096 Cresson 32°32' 97°37' NC 15 1980 1994
2131 Cross Plains 2 32°08' 99°01' NC 24 1971 1994
2244 Dallas FAA Airport 32°51' 96°51' NC 20 1975 1994
2312 Deberry 32°18' 94°10' ET 10 1974 1983
2394 Denison Dam 33°49' 96°34' NC 11 1984 1994
2404 Denton 2 SE 33°12' 97°06' NC 11 1984 1994
2415 Deport 33°31' 95°19' NC 11 1984 1994
2462 Dime Box 30°22' 96°50' SC 11 1984 1994
2621 Dumont 33°48' 100°31' LRP 11 1984 1994
2675 Eagle Lake and 26761 29°36' 96°20' SC 19 1976 1994
2679 Eagle Pass 28°42' 100°29' ST 24 1971 1994
2715 Eastland 32°24' 98°51' NC 11 1984 1994
2744 Eden 2 31°13' 99°51' EP 15 1972 1986
2811 Eldorado 1 N 30°53' 100°36' EP 24 1971 1994
3005 Evant 4 SW 31°27' 98°13' NC 18 1977 1994
3133 Ferris 32°32' 96°40' NC 11 1984 1994
3171 Flat 31°19' 97°38' NC 11 1984 1994
3270 Fort McKavett 7 N 30°56' 100°07' EP 24 1971 1994
3278 Fort Stockton 35 SSW 30°23' 103°02' TP 10 1978 1987
3284 Fort Worth Meach WSO Airport 32°49' 97°21' NC 24 1971 1994
3285 Fort Worth Federal Building 32°45' 97°20' NC 24 1971 1994
3370 Frisco 33°09' 96°50' NC 11 1984 1994
3410 Gageby 2 NW 35°38' 100°22' HP 21 1971 1994
3415 Gainesville 33°38' 97°08' NC 24 1971 1994
3507 Georgetown Lake 30°41' 97°43' NC 11 1984 1994
3546 Gilmer 2 W 32°44' 94°59' ET 16 1979 1994
3642 Gordonville 33°48' 96°51' NC 18 1977 1994
3646 Gorman 32°13' 98°40' NC 11 1984 1994
3686 Granger Dam 30°42' 97°20' NC 11 1984 1994
3691 Grapevine Dam 32°58' 97°03' NC 24 1971 1994
3771 Groesbeck 2 31°32' 96°32' NC 18 1977 1994
4098 Hereford 34°49' 102°24' HP 24 1971 1994
4137 Hico 31°59' 98°02' NC 18 1977 1994
Appendix 1. Fifteen-minute precipitation stations in Texas with at least 10 years of annual maxima data through 1994—Continued
Stationno.
Station name Latitude and longitudeClimaticregion
Years ofrecord
Beginning yearof record
Ending yearof record
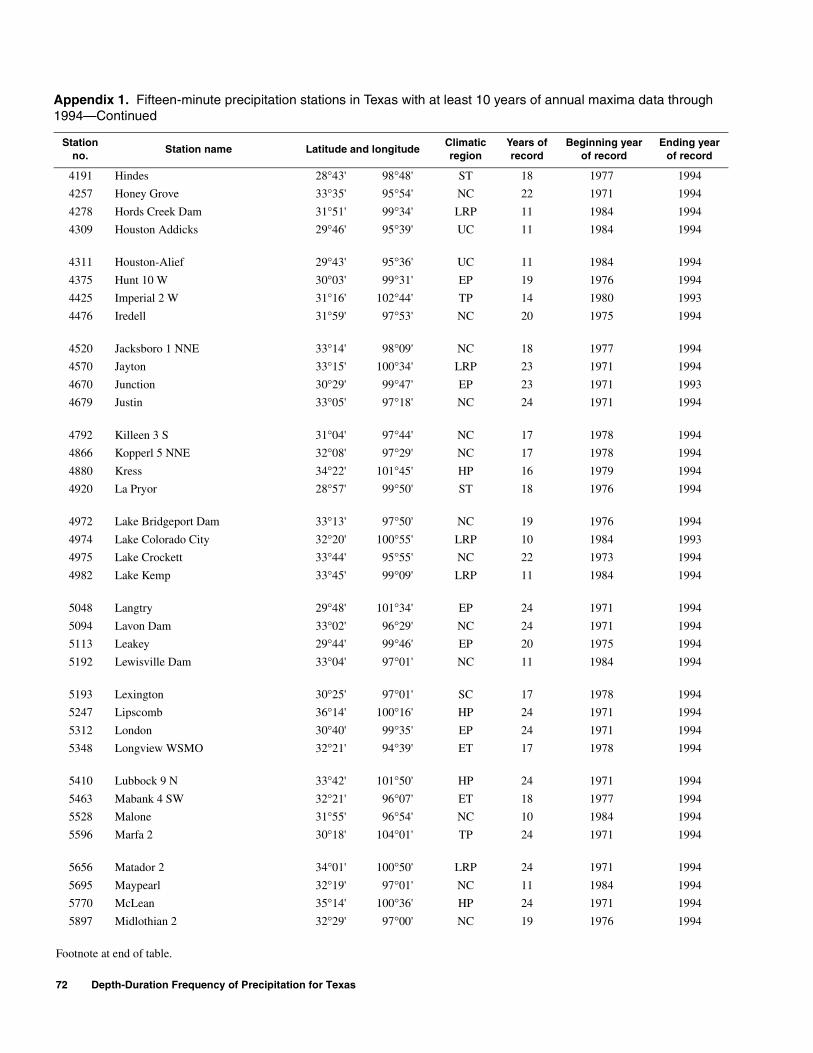
72 Depth-Duration Frequency of Precipitation for Texas
Footnote at end of table.
4191 Hindes 28°43' 98°48' ST 18 1977 1994
4257 Honey Grove 33°35' 95°54' NC 22 1971 1994
4278 Hords Creek Dam 31°51' 99°34' LRP 11 1984 1994
4309 Houston Addicks 29°46' 95°39' UC 11 1984 1994
4311 Houston-Alief 29°43' 95°36' UC 11 1984 1994
4375 Hunt 10 W 30°03' 99°31' EP 19 1976 1994
4425 Imperial 2 W 31°16' 102°44' TP 14 1980 1993
4476 Iredell 31°59' 97°53' NC 20 1975 1994
4520 Jacksboro 1 NNE 33°14' 98°09' NC 18 1977 1994
4570 Jayton 33°15' 100°34' LRP 23 1971 1994
4670 Junction 30°29' 99°47' EP 23 1971 1993
4679 Justin 33°05' 97°18' NC 24 1971 1994
4792 Killeen 3 S 31°04' 97°44' NC 17 1978 1994
4866 Kopperl 5 NNE 32°08' 97°29' NC 17 1978 1994
4880 Kress 34°22' 101°45' HP 16 1979 1994
4920 La Pryor 28°57' 99°50' ST 18 1976 1994
4972 Lake Bridgeport Dam 33°13' 97°50' NC 19 1976 1994
4974 Lake Colorado City 32°20' 100°55' LRP 10 1984 1993
4975 Lake Crockett 33°44' 95°55' NC 22 1973 1994
4982 Lake Kemp 33°45' 99°09' LRP 11 1984 1994
5048 Langtry 29°48' 101°34' EP 24 1971 1994
5094 Lavon Dam 33°02' 96°29' NC 24 1971 1994
5113 Leakey 29°44' 99°46' EP 20 1975 1994
5192 Lewisville Dam 33°04' 97°01' NC 11 1984 1994
5193 Lexington 30°25' 97°01' SC 17 1978 1994
5247 Lipscomb 36°14' 100°16' HP 24 1971 1994
5312 London 30°40' 99°35' EP 24 1971 1994
5348 Longview WSMO 32°21' 94°39' ET 17 1978 1994
5410 Lubbock 9 N 33°42' 101°50' HP 24 1971 1994
5463 Mabank 4 SW 32°21' 96°07' ET 18 1977 1994
5528 Malone 31°55' 96°54' NC 10 1984 1994
5596 Marfa 2 30°18' 104°01' TP 24 1971 1994
5656 Matador 2 34°01' 100°50' LRP 24 1971 1994
5695 Maypearl 32°19' 97°01' NC 11 1984 1994
5770 McLean 35°14' 100°36' HP 24 1971 1994
5897 Midlothian 2 32°29' 97°00' NC 19 1976 1994
Appendix 1. Fifteen-minute precipitation stations in Texas with at least 10 years of annual maxima data through 1994—Continued
Stationno.
Station name Latitude and longitudeClimaticregion
Years ofrecord
Beginning yearof record
Ending yearof record
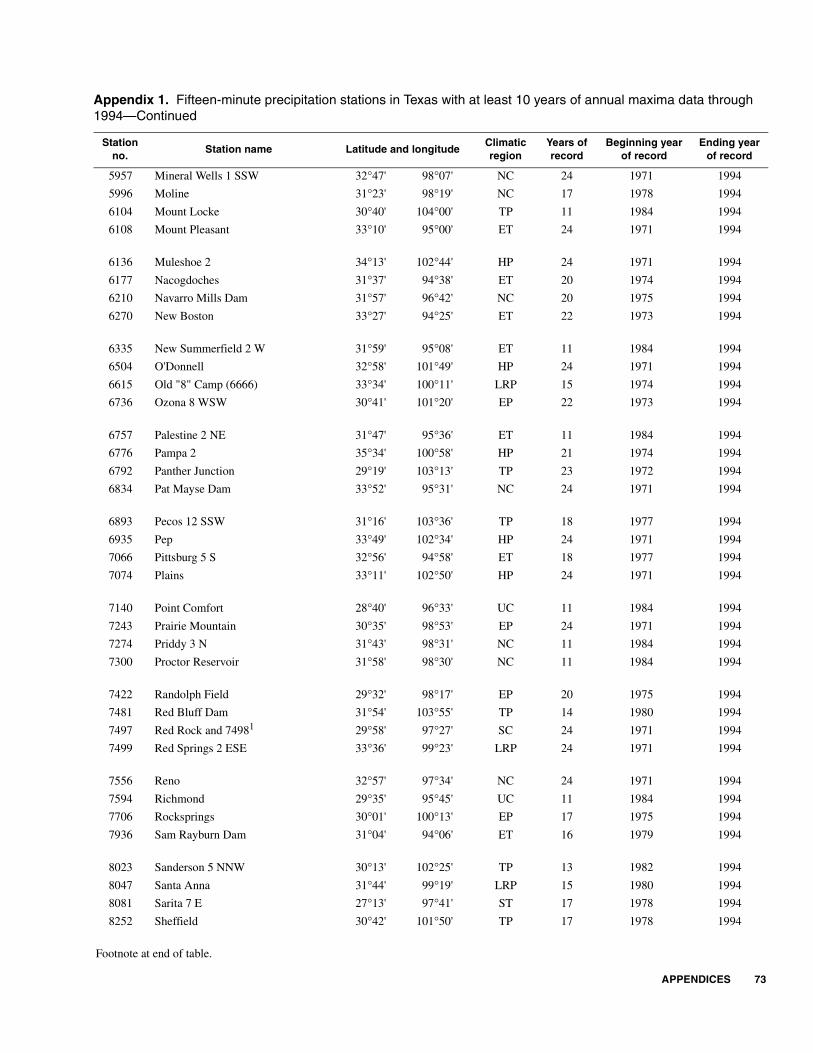
APPENDICES 73
Footnote at end of table.
5957 Mineral Wells 1 SSW 32°47' 98°07' NC 24 1971 1994
5996 Moline 31°23' 98°19' NC 17 1978 1994
6104 Mount Locke 30°40' 104°00' TP 11 1984 1994
6108 Mount Pleasant 33°10' 95°00' ET 24 1971 1994
6136 Muleshoe 2 34°13' 102°44' HP 24 1971 1994
6177 Nacogdoches 31°37' 94°38' ET 20 1974 1994
6210 Navarro Mills Dam 31°57' 96°42' NC 20 1975 1994
6270 New Boston 33°27' 94°25' ET 22 1973 1994
6335 New Summerfield 2 W 31°59' 95°08' ET 11 1984 1994
6504 O'Donnell 32°58' 101°49' HP 24 1971 1994
6615 Old "8" Camp (6666) 33°34' 100°11' LRP 15 1974 1994
6736 Ozona 8 WSW 30°41' 101°20' EP 22 1973 1994
6757 Palestine 2 NE 31°47' 95°36' ET 11 1984 1994
6776 Pampa 2 35°34' 100°58' HP 21 1974 1994
6792 Panther Junction 29°19' 103°13' TP 23 1972 1994
6834 Pat Mayse Dam 33°52' 95°31' NC 24 1971 1994
6893 Pecos 12 SSW 31°16' 103°36' TP 18 1977 1994
6935 Pep 33°49' 102°34' HP 24 1971 1994
7066 Pittsburg 5 S 32°56' 94°58' ET 18 1977 1994
7074 Plains 33°11' 102°50' HP 24 1971 1994
7140 Point Comfort 28°40' 96°33' UC 11 1984 1994
7243 Prairie Mountain 30°35' 98°53' EP 24 1971 1994
7274 Priddy 3 N 31°43' 98°31' NC 11 1984 1994
7300 Proctor Reservoir 31°58' 98°30' NC 11 1984 1994
7422 Randolph Field 29°32' 98°17' EP 20 1975 1994
7481 Red Bluff Dam 31°54' 103°55' TP 14 1980 1994
7497 Red Rock and 74981 29°58' 97°27' SC 24 1971 1994
7499 Red Springs 2 ESE 33°36' 99°23' LRP 24 1971 1994
7556 Reno 32°57' 97°34' NC 24 1971 1994
7594 Richmond 29°35' 95°45' UC 11 1984 1994
7706 Rocksprings 30°01' 100°13' EP 17 1975 1994
7936 Sam Rayburn Dam 31°04' 94°06' ET 16 1979 1994
8023 Sanderson 5 NNW 30°13' 102°25' TP 13 1982 1994
8047 Santa Anna 31°44' 99°19' LRP 15 1980 1994
8081 Sarita 7 E 27°13' 97°41' ST 17 1978 1994
8252 Sheffield 30°42' 101°50' TP 17 1978 1994
Appendix 1. Fifteen-minute precipitation stations in Texas with at least 10 years of annual maxima data through 1994—Continued
Stationno.
Station name Latitude and longitudeClimaticregion
Years ofrecord
Beginning yearof record
Ending yearof record
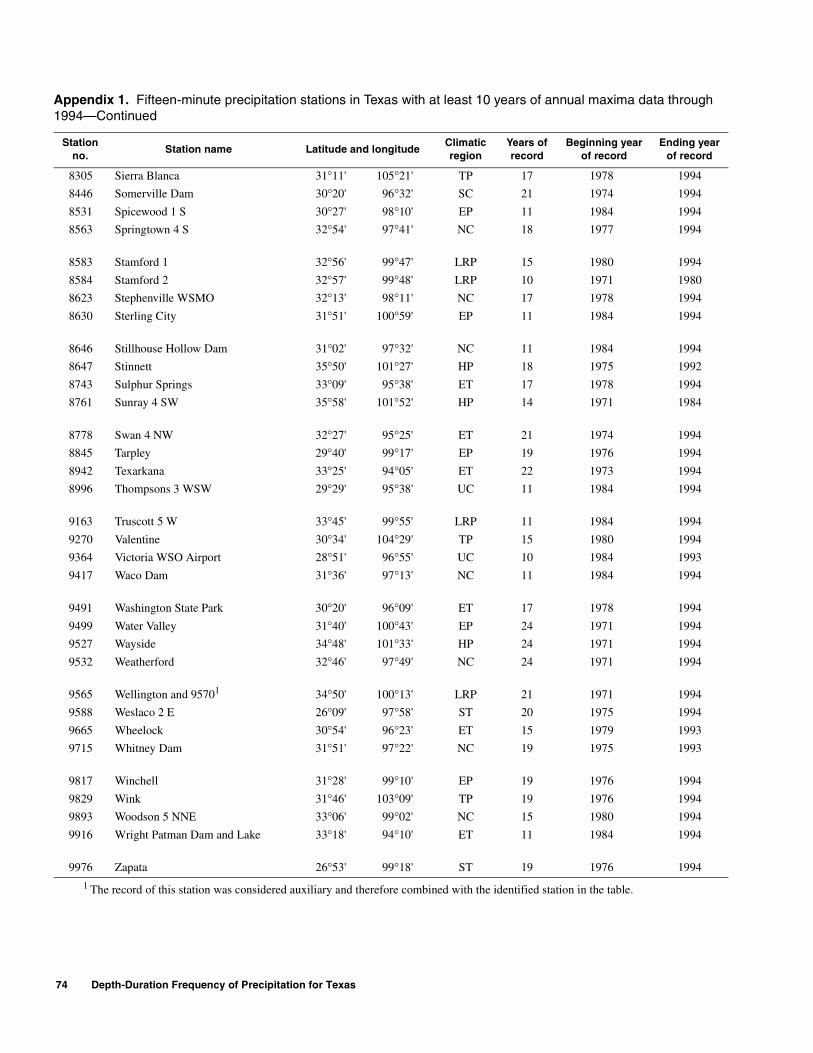
74 Depth-Duration Frequency of Precipitation for Texas
Footnote at end of table.
1 The record of this station was considered auxiliary and therefore combined with the identified station in the table.
8305 Sierra Blanca 31°11' 105°21' TP 17 1978 1994
8446 Somerville Dam 30°20' 96°32' SC 21 1974 1994
8531 Spicewood 1 S 30°27' 98°10' EP 11 1984 1994
8563 Springtown 4 S 32°54' 97°41' NC 18 1977 1994
8583 Stamford 1 32°56' 99°47' LRP 15 1980 1994
8584 Stamford 2 32°57' 99°48' LRP 10 1971 1980
8623 Stephenville WSMO 32°13' 98°11' NC 17 1978 1994
8630 Sterling City 31°51' 100°59' EP 11 1984 1994
8646 Stillhouse Hollow Dam 31°02' 97°32' NC 11 1984 1994
8647 Stinnett 35°50' 101°27' HP 18 1975 1992
8743 Sulphur Springs 33°09' 95°38' ET 17 1978 1994
8761 Sunray 4 SW 35°58' 101°52' HP 14 1971 1984
8778 Swan 4 NW 32°27' 95°25' ET 21 1974 1994
8845 Tarpley 29°40' 99°17' EP 19 1976 1994
8942 Texarkana 33°25' 94°05' ET 22 1973 1994
8996 Thompsons 3 WSW 29°29' 95°38' UC 11 1984 1994
9163 Truscott 5 W 33°45' 99°55' LRP 11 1984 1994
9270 Valentine 30°34' 104°29' TP 15 1980 1994
9364 Victoria WSO Airport 28°51' 96°55' UC 10 1984 1993
9417 Waco Dam 31°36' 97°13' NC 11 1984 1994
9491 Washington State Park 30°20' 96°09' ET 17 1978 1994
9499 Water Valley 31°40' 100°43' EP 24 1971 1994
9527 Wayside 34°48' 101°33' HP 24 1971 1994
9532 Weatherford 32°46' 97°49' NC 24 1971 1994
9565 Wellington and 95701 34°50' 100°13' LRP 21 1971 1994
9588 Weslaco 2 E 26°09' 97°58' ST 20 1975 1994
9665 Wheelock 30°54' 96°23' ET 15 1979 1993
9715 Whitney Dam 31°51' 97°22' NC 19 1975 1993
9817 Winchell 31°28' 99°10' EP 19 1976 1994
9829 Wink 31°46' 103°09' TP 19 1976 1994
9893 Woodson 5 NNE 33°06' 99°02' NC 15 1980 1994
9916 Wright Patman Dam and Lake 33°18' 94°10' ET 11 1984 1994
9976 Zapata 26°53' 99°18' ST 19 1976 1994
Appendix 1. Fifteen-minute precipitation stations in Texas with at least 10 years of annual maxima data through 1994—Continued
Stationno.
Station name Latitude and longitudeClimaticregion
Years ofrecord
Beginning yearof record
Ending yearof record
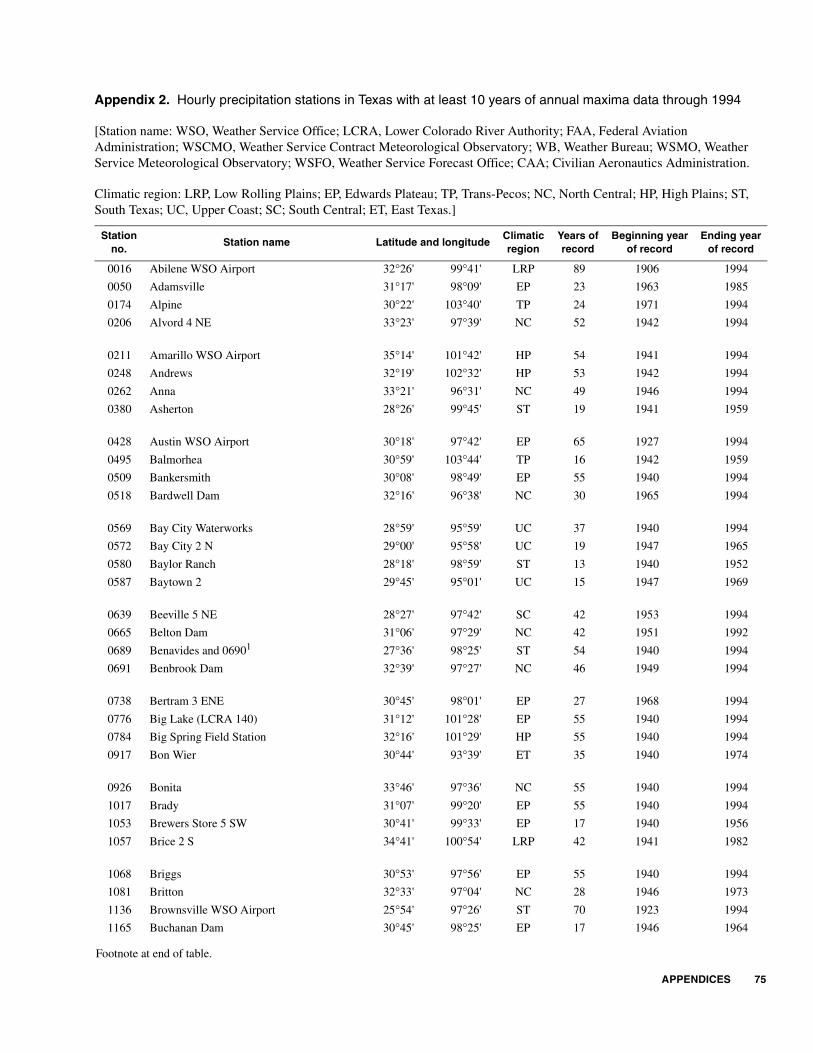
APPENDICES 75
Footnote at end of table.
Depth-Duration Frequency of Precipitation for Texas
APPENDICES
Appendix 2. Hourly precipitation stations in Texas with at least 10 years of annual maxima data through 1994—Continued
Stationno.
Station name Latitude and longitudeClimaticregion
Years ofrecord
Beginning yearof record
Ending yearof record
0016 Abilene WSO Airport 32°26' 99°41' LRP 89 1906 1994
0050 Adamsville 31°17' 98°09' EP 23 1963 1985
0174 Alpine 30°22' 103°40' TP 24 1971 1994
0206 Alvord 4 NE 33°23' 97°39' NC 52 1942 1994
0211 Amarillo WSO Airport 35°14' 101°42' HP 54 1941 1994
0248 Andrews 32°19' 102°32' HP 53 1942 1994
0262 Anna 33°21' 96°31' NC 49 1946 1994
0380 Asherton 28°26' 99°45' ST 19 1941 1959
0428 Austin WSO Airport 30°18' 97°42' EP 65 1927 1994
0495 Balmorhea 30°59' 103°44' TP 16 1942 1959
0509 Bankersmith 30°08' 98°49' EP 55 1940 1994
0518 Bardwell Dam 32°16' 96°38' NC 30 1965 1994
0569 Bay City Waterworks 28°59' 95°59' UC 37 1940 1994
0572 Bay City 2 N 29°00' 95°58' UC 19 1947 1965
0580 Baylor Ranch 28°18' 98°59' ST 13 1940 1952
0587 Baytown 2 29°45' 95°01' UC 15 1947 1969
0639 Beeville 5 NE 28°27' 97°42' SC 42 1953 1994
0665 Belton Dam 31°06' 97°29' NC 42 1951 1992
0689 Benavides and 06901 27°36' 98°25' ST 54 1940 1994
0691 Benbrook Dam 32°39' 97°27' NC 46 1949 1994
0738 Bertram 3 ENE 30°45' 98°01' EP 27 1968 1994
0776 Big Lake (LCRA 140) 31°12' 101°28' EP 55 1940 1994
0784 Big Spring Field Station 32°16' 101°29' HP 55 1940 1994
0917 Bon Wier 30°44' 93°39' ET 35 1940 1974
0926 Bonita 33°46' 97°36' NC 55 1940 1994
1017 Brady 31°07' 99°20' EP 55 1940 1994
1053 Brewers Store 5 SW 30°41' 99°33' EP 17 1940 1956
1057 Brice 2 S 34°41' 100°54' LRP 42 1941 1982
1068 Briggs 30°53' 97°56' EP 55 1940 1994
1081 Britton 32°33' 97°04' NC 28 1946 1973
1136 Brownsville WSO Airport 25°54' 97°26' ST 70 1923 1994
1165 Buchanan Dam 30°45' 98°25' EP 17 1946 1964
Appendix 2. Hourly precipitation stations in Texas with at least 10 years of annual maxima data through 1994
[Station name: WSO, Weather Service Office; LCRA, Lower Colorado River Authority; FAA, Federal Aviation Administration; WSCMO, Weather Service Contract Meteorological Observatory; WB, Weather Bureau; WSMO, Weather Service Meteorological Observatory; WSFO, Weather Service Forecast Office; CAA; Civilian Aeronautics Administration.
Climatic region: LRP, Low Rolling Plains; EP, Edwards Plateau; TP, Trans-Pecos; NC, North Central; HP, High Plains; ST, South Texas; UC, Upper Coast; SC; South Central; ET, East Texas.]
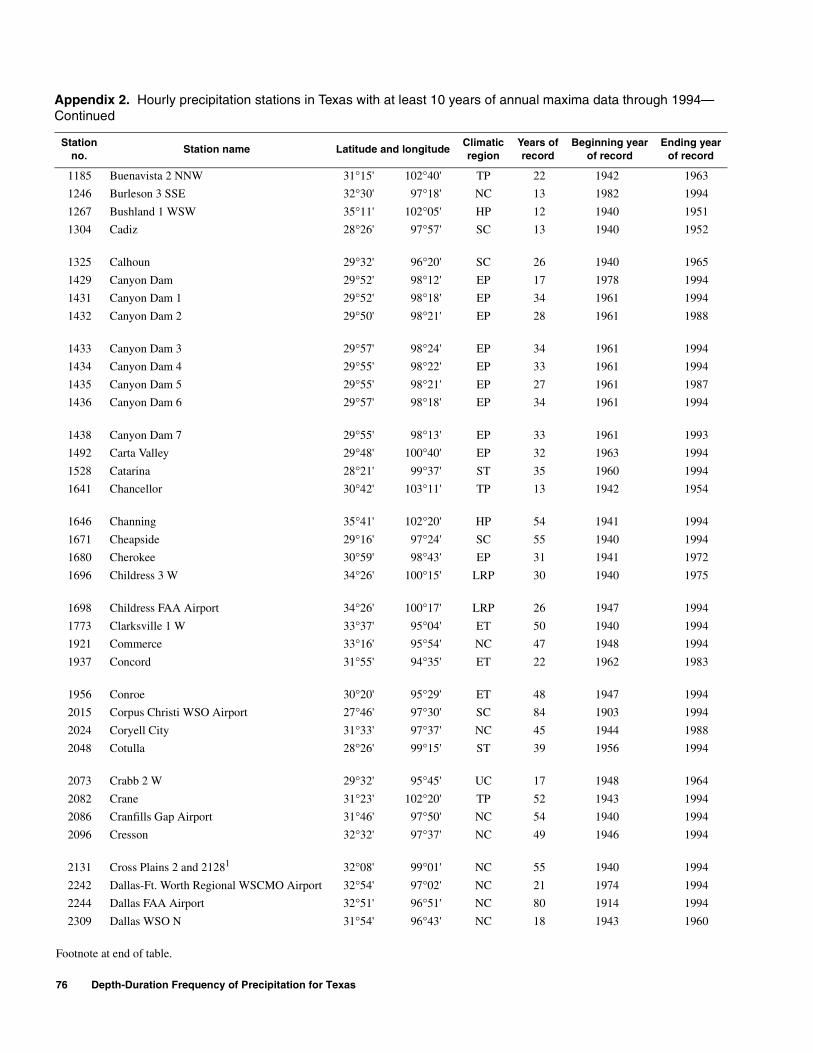
76 Depth-Duration Frequency of Precipitation for Texas
Footnote at end of table.
1185 Buenavista 2 NNW 31°15' 102°40' TP 22 1942 1963
1246 Burleson 3 SSE 32°30' 97°18' NC 13 1982 1994
1267 Bushland 1 WSW 35°11' 102°05' HP 12 1940 1951
1304 Cadiz 28°26' 97°57' SC 13 1940 1952
1325 Calhoun 29°32' 96°20' SC 26 1940 1965
1429 Canyon Dam 29°52' 98°12' EP 17 1978 1994
1431 Canyon Dam 1 29°52' 98°18' EP 34 1961 1994
1432 Canyon Dam 2 29°50' 98°21' EP 28 1961 1988
1433 Canyon Dam 3 29°57' 98°24' EP 34 1961 1994
1434 Canyon Dam 4 29°55' 98°22' EP 33 1961 1994
1435 Canyon Dam 5 29°55' 98°21' EP 27 1961 1987
1436 Canyon Dam 6 29°57' 98°18' EP 34 1961 1994
1438 Canyon Dam 7 29°55' 98°13' EP 33 1961 1993
1492 Carta Valley 29°48' 100°40' EP 32 1963 1994
1528 Catarina 28°21' 99°37' ST 35 1960 1994
1641 Chancellor 30°42' 103°11' TP 13 1942 1954
1646 Channing 35°41' 102°20' HP 54 1941 1994
1671 Cheapside 29°16' 97°24' SC 55 1940 1994
1680 Cherokee 30°59' 98°43' EP 31 1941 1972
1696 Childress 3 W 34°26' 100°15' LRP 30 1940 1975
1698 Childress FAA Airport 34°26' 100°17' LRP 26 1947 1994
1773 Clarksville 1 W 33°37' 95°04' ET 50 1940 1994
1921 Commerce 33°16' 95°54' NC 47 1948 1994
1937 Concord 31°55' 94°35' ET 22 1962 1983
1956 Conroe 30°20' 95°29' ET 48 1947 1994
2015 Corpus Christi WSO Airport 27°46' 97°30' SC 84 1903 1994
2024 Coryell City 31°33' 97°37' NC 45 1944 1988
2048 Cotulla 28°26' 99°15' ST 39 1956 1994
2073 Crabb 2 W 29°32' 95°45' UC 17 1948 1964
2082 Crane 31°23' 102°20' TP 52 1943 1994
2086 Cranfills Gap Airport 31°46' 97°50' NC 54 1940 1994
2096 Cresson 32°32' 97°37' NC 49 1946 1994
2131 Cross Plains 2 and 21281 32°08' 99°01' NC 55 1940 1994
2242 Dallas-Ft. Worth Regional WSCMO Airport 32°54' 97°02' NC 21 1974 1994
2244 Dallas FAA Airport 32°51' 96°51' NC 80 1914 1994
2309 Dallas WSO N 31°54' 96°43' NC 18 1943 1960
Appendix 2. Hourly precipitation stations in Texas with at least 10 years of annual maxima data through 1994—Continued
Stationno.
Station name Latitude and longitudeClimaticregion
Years ofrecord
Beginning yearof record
Ending yearof record
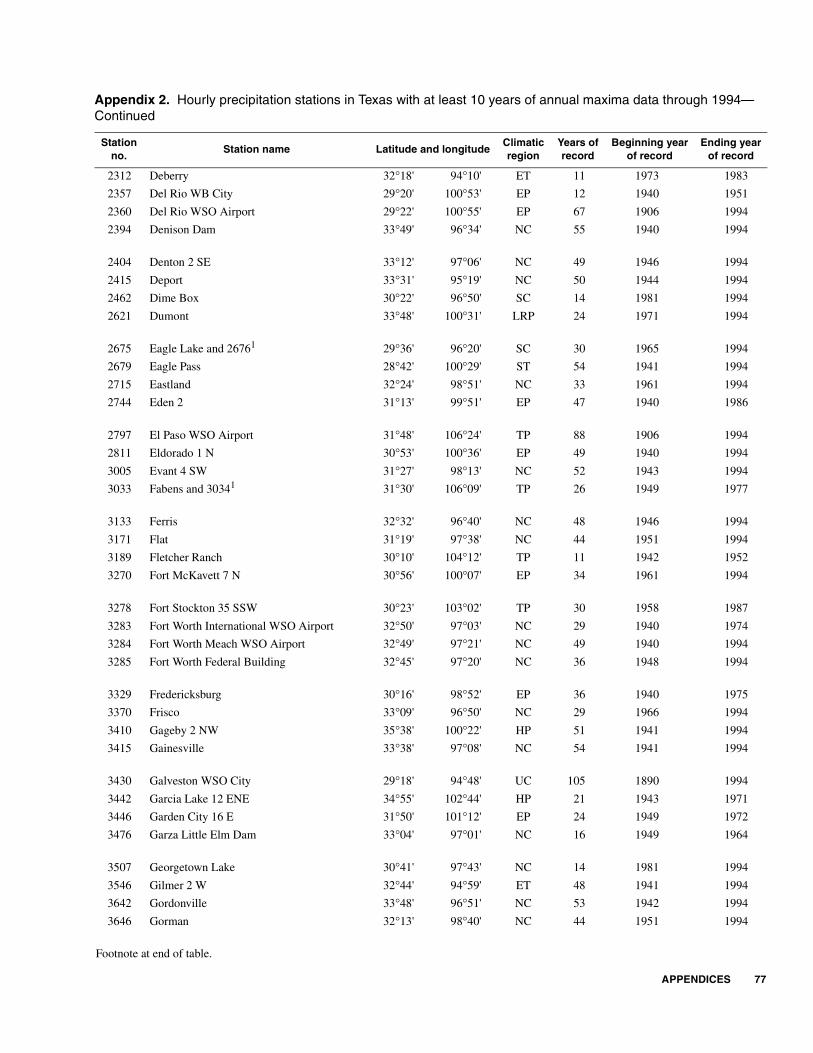
APPENDICES 77
Footnote at end of table.
2312 Deberry 32°18' 94°10' ET 11 1973 1983
2357 Del Rio WB City 29°20' 100°53' EP 12 1940 1951
2360 Del Rio WSO Airport 29°22' 100°55' EP 67 1906 1994
2394 Denison Dam 33°49' 96°34' NC 55 1940 1994
2404 Denton 2 SE 33°12' 97°06' NC 49 1946 1994
2415 Deport 33°31' 95°19' NC 50 1944 1994
2462 Dime Box 30°22' 96°50' SC 14 1981 1994
2621 Dumont 33°48' 100°31' LRP 24 1971 1994
2675 Eagle Lake and 26761 29°36' 96°20' SC 30 1965 1994
2679 Eagle Pass 28°42' 100°29' ST 54 1941 1994
2715 Eastland 32°24' 98°51' NC 33 1961 1994
2744 Eden 2 31°13' 99°51' EP 47 1940 1986
2797 El Paso WSO Airport 31°48' 106°24' TP 88 1906 1994
2811 Eldorado 1 N 30°53' 100°36' EP 49 1940 1994
3005 Evant 4 SW 31°27' 98°13' NC 52 1943 1994
3033 Fabens and 30341 31°30' 106°09' TP 26 1949 1977
3133 Ferris 32°32' 96°40' NC 48 1946 1994
3171 Flat 31°19' 97°38' NC 44 1951 1994
3189 Fletcher Ranch 30°10' 104°12' TP 11 1942 1952
3270 Fort McKavett 7 N 30°56' 100°07' EP 34 1961 1994
3278 Fort Stockton 35 SSW 30°23' 103°02' TP 30 1958 1987
3283 Fort Worth International WSO Airport 32°50' 97°03' NC 29 1940 1974
3284 Fort Worth Meach WSO Airport 32°49' 97°21' NC 49 1940 1994
3285 Fort Worth Federal Building 32°45' 97°20' NC 36 1948 1994
3329 Fredericksburg 30°16' 98°52' EP 36 1940 1975
3370 Frisco 33°09' 96°50' NC 29 1966 1994
3410 Gageby 2 NW 35°38' 100°22' HP 51 1941 1994
3415 Gainesville 33°38' 97°08' NC 54 1941 1994
3430 Galveston WSO City 29°18' 94°48' UC 105 1890 1994
3442 Garcia Lake 12 ENE 34°55' 102°44' HP 21 1943 1971
3446 Garden City 16 E 31°50' 101°12' EP 24 1949 1972
3476 Garza Little Elm Dam 33°04' 97°01' NC 16 1949 1964
3507 Georgetown Lake 30°41' 97°43' NC 14 1981 1994
3546 Gilmer 2 W 32°44' 94°59' ET 48 1941 1994
3642 Gordonville 33°48' 96°51' NC 53 1942 1994
3646 Gorman 32°13' 98°40' NC 44 1951 1994
Appendix 2. Hourly precipitation stations in Texas with at least 10 years of annual maxima data through 1994—Continued
Stationno.
Station name Latitude and longitudeClimaticregion
Years ofrecord
Beginning yearof record
Ending yearof record
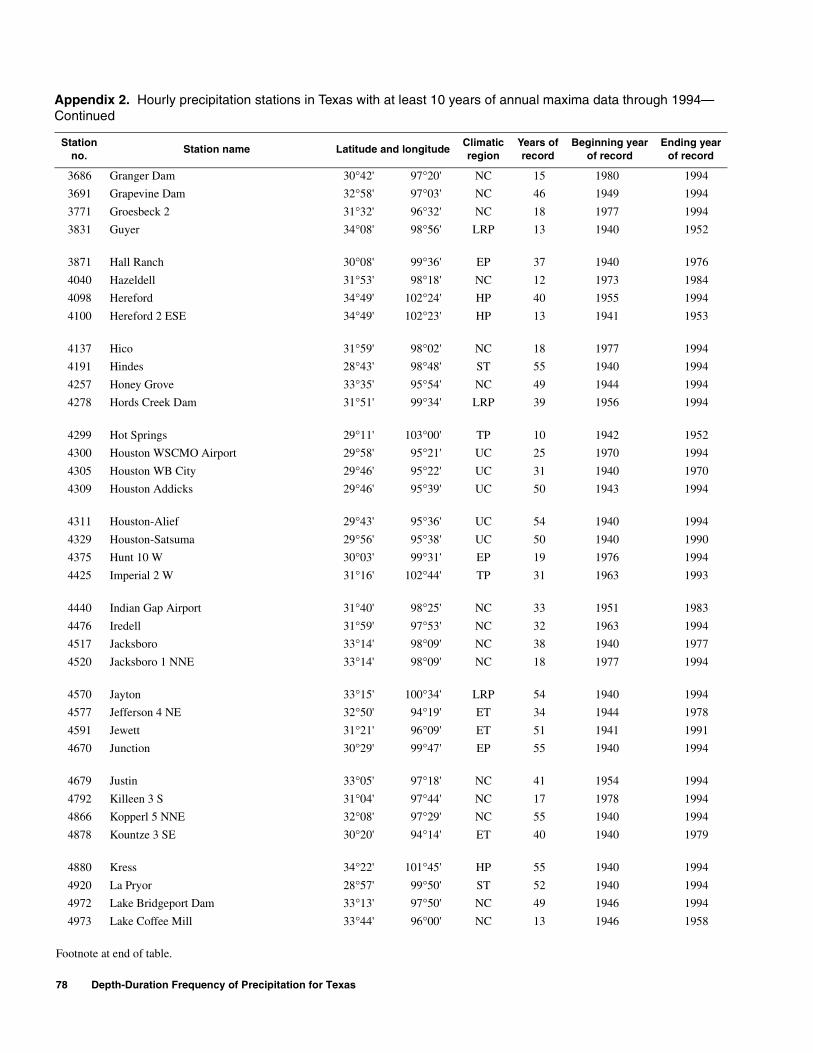
78 Depth-Duration Frequency of Precipitation for Texas
Footnote at end of table.
3686 Granger Dam 30°42' 97°20' NC 15 1980 1994
3691 Grapevine Dam 32°58' 97°03' NC 46 1949 1994
3771 Groesbeck 2 31°32' 96°32' NC 18 1977 1994
3831 Guyer 34°08' 98°56' LRP 13 1940 1952
3871 Hall Ranch 30°08' 99°36' EP 37 1940 1976
4040 Hazeldell 31°53' 98°18' NC 12 1973 1984
4098 Hereford 34°49' 102°24' HP 40 1955 1994
4100 Hereford 2 ESE 34°49' 102°23' HP 13 1941 1953
4137 Hico 31°59' 98°02' NC 18 1977 1994
4191 Hindes 28°43' 98°48' ST 55 1940 1994
4257 Honey Grove 33°35' 95°54' NC 49 1944 1994
4278 Hords Creek Dam 31°51' 99°34' LRP 39 1956 1994
4299 Hot Springs 29°11' 103°00' TP 10 1942 1952
4300 Houston WSCMO Airport 29°58' 95°21' UC 25 1970 1994
4305 Houston WB City 29°46' 95°22' UC 31 1940 1970
4309 Houston Addicks 29°46' 95°39' UC 50 1943 1994
4311 Houston-Alief 29°43' 95°36' UC 54 1940 1994
4329 Houston-Satsuma 29°56' 95°38' UC 50 1940 1990
4375 Hunt 10 W 30°03' 99°31' EP 19 1976 1994
4425 Imperial 2 W 31°16' 102°44' TP 31 1963 1993
4440 Indian Gap Airport 31°40' 98°25' NC 33 1951 1983
4476 Iredell 31°59' 97°53' NC 32 1963 1994
4517 Jacksboro 33°14' 98°09' NC 38 1940 1977
4520 Jacksboro 1 NNE 33°14' 98°09' NC 18 1977 1994
4570 Jayton 33°15' 100°34' LRP 54 1940 1994
4577 Jefferson 4 NE 32°50' 94°19' ET 34 1944 1978
4591 Jewett 31°21' 96°09' ET 51 1941 1991
4670 Junction 30°29' 99°47' EP 55 1940 1994
4679 Justin 33°05' 97°18' NC 41 1954 1994
4792 Killeen 3 S 31°04' 97°44' NC 17 1978 1994
4866 Kopperl 5 NNE 32°08' 97°29' NC 55 1940 1994
4878 Kountze 3 SE 30°20' 94°14' ET 40 1940 1979
4880 Kress 34°22' 101°45' HP 55 1940 1994
4920 La Pryor 28°57' 99°50' ST 52 1940 1994
4972 Lake Bridgeport Dam 33°13' 97°50' NC 49 1946 1994
4973 Lake Coffee Mill 33°44' 96°00' NC 13 1946 1958
Appendix 2. Hourly precipitation stations in Texas with at least 10 years of annual maxima data through 1994—Continued
Stationno.
Station name Latitude and longitudeClimaticregion
Years ofrecord
Beginning yearof record
Ending yearof record
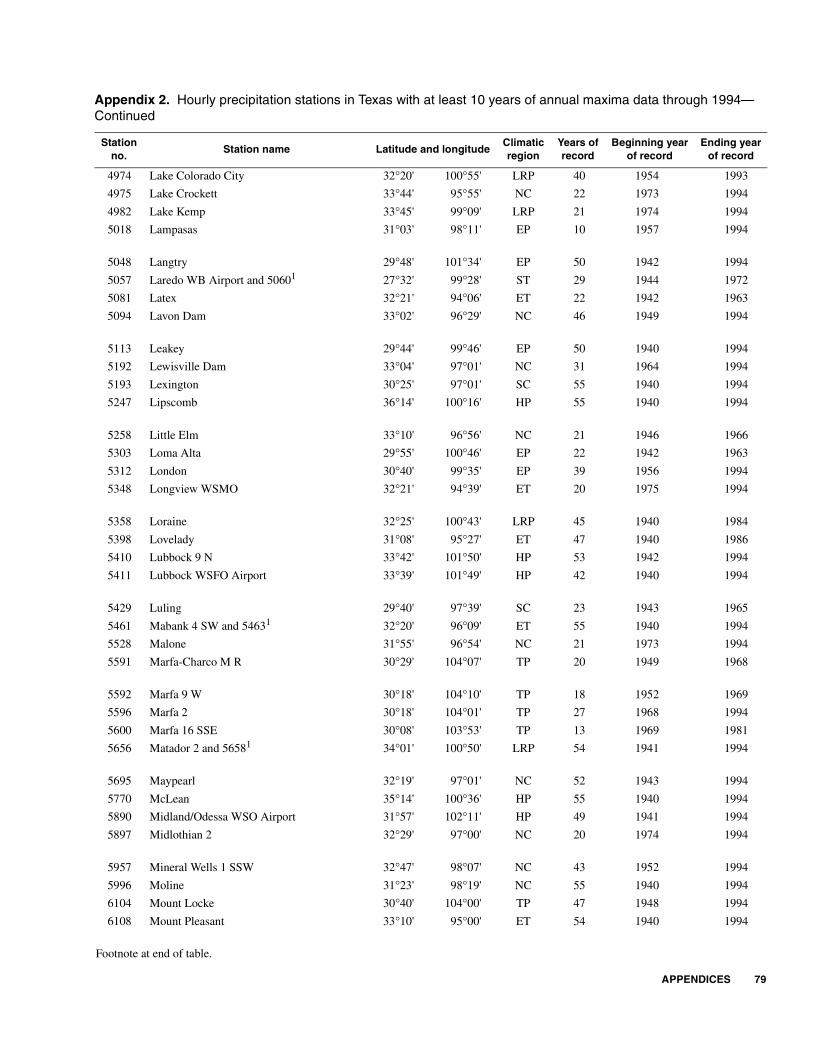
APPENDICES 79
Footnote at end of table.
4974 Lake Colorado City 32°20' 100°55' LRP 40 1954 1993
4975 Lake Crockett 33°44' 95°55' NC 22 1973 1994
4982 Lake Kemp 33°45' 99°09' LRP 21 1974 1994
5018 Lampasas 31°03' 98°11' EP 10 1957 1994
5048 Langtry 29°48' 101°34' EP 50 1942 1994
5057 Laredo WB Airport and 50601 27°32' 99°28' ST 29 1944 1972
5081 Latex 32°21' 94°06' ET 22 1942 1963
5094 Lavon Dam 33°02' 96°29' NC 46 1949 1994
5113 Leakey 29°44' 99°46' EP 50 1940 1994
5192 Lewisville Dam 33°04' 97°01' NC 31 1964 1994
5193 Lexington 30°25' 97°01' SC 55 1940 1994
5247 Lipscomb 36°14' 100°16' HP 55 1940 1994
5258 Little Elm 33°10' 96°56' NC 21 1946 1966
5303 Loma Alta 29°55' 100°46' EP 22 1942 1963
5312 London 30°40' 99°35' EP 39 1956 1994
5348 Longview WSMO 32°21' 94°39' ET 20 1975 1994
5358 Loraine 32°25' 100°43' LRP 45 1940 1984
5398 Lovelady 31°08' 95°27' ET 47 1940 1986
5410 Lubbock 9 N 33°42' 101°50' HP 53 1942 1994
5411 Lubbock WSFO Airport 33°39' 101°49' HP 42 1940 1994
5429 Luling 29°40' 97°39' SC 23 1943 1965
5461 Mabank 4 SW and 54631 32°20' 96°09' ET 55 1940 1994
5528 Malone 31°55' 96°54' NC 21 1973 1994
5591 Marfa-Charco M R 30°29' 104°07' TP 20 1949 1968
5592 Marfa 9 W 30°18' 104°10' TP 18 1952 1969
5596 Marfa 2 30°18' 104°01' TP 27 1968 1994
5600 Marfa 16 SSE 30°08' 103°53' TP 13 1969 1981
5656 Matador 2 and 56581 34°01' 100°50' LRP 54 1941 1994
5695 Maypearl 32°19' 97°01' NC 52 1943 1994
5770 McLean 35°14' 100°36' HP 55 1940 1994
5890 Midland/Odessa WSO Airport 31°57' 102°11' HP 49 1941 1994
5897 Midlothian 2 32°29' 97°00' NC 20 1974 1994
5957 Mineral Wells 1 SSW 32°47' 98°07' NC 43 1952 1994
5996 Moline 31°23' 98°19' NC 55 1940 1994
6104 Mount Locke 30°40' 104°00' TP 47 1948 1994
6108 Mount Pleasant 33°10' 95°00' ET 54 1940 1994
Appendix 2. Hourly precipitation stations in Texas with at least 10 years of annual maxima data through 1994—Continued
Stationno.
Station name Latitude and longitudeClimaticregion
Years ofrecord
Beginning yearof record
Ending yearof record
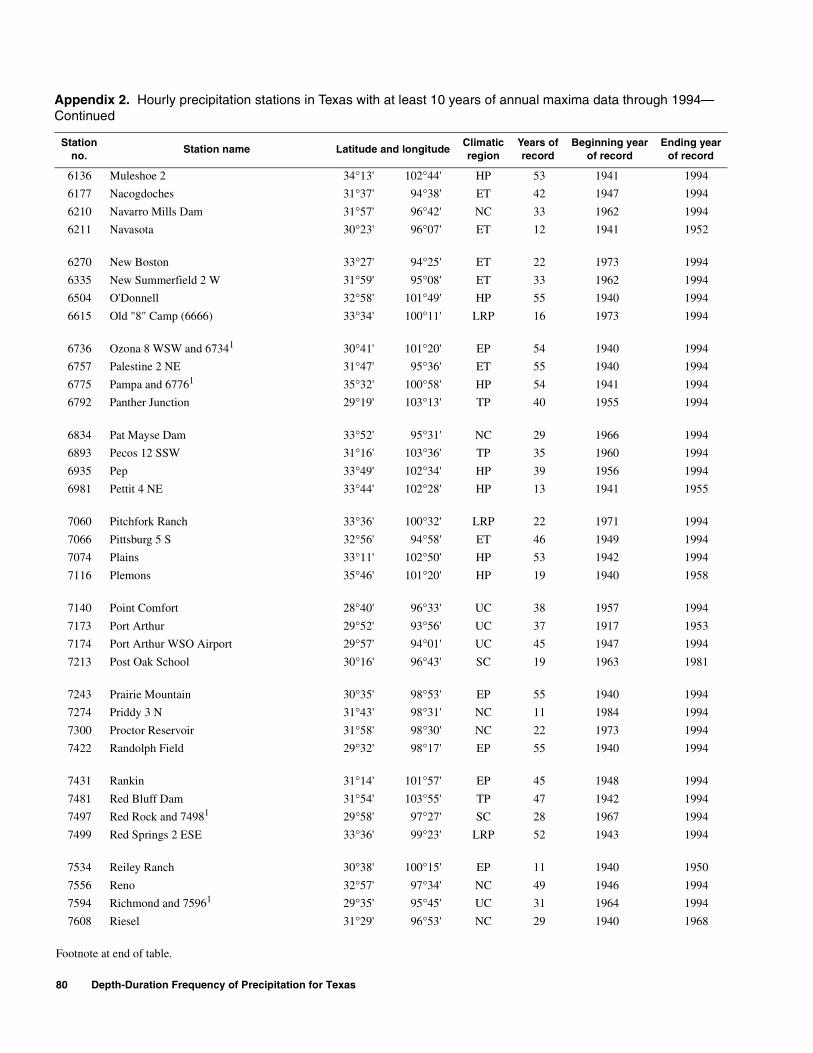
80 Depth-Duration Frequency of Precipitation for Texas
Footnote at end of table.
6136 Muleshoe 2 34°13' 102°44' HP 53 1941 1994
6177 Nacogdoches 31°37' 94°38' ET 42 1947 1994
6210 Navarro Mills Dam 31°57' 96°42' NC 33 1962 1994
6211 Navasota 30°23' 96°07' ET 12 1941 1952
6270 New Boston 33°27' 94°25' ET 22 1973 1994
6335 New Summerfield 2 W 31°59' 95°08' ET 33 1962 1994
6504 O'Donnell 32°58' 101°49' HP 55 1940 1994
6615 Old "8" Camp (6666) 33°34' 100°11' LRP 16 1973 1994
6736 Ozona 8 WSW and 67341 30°41' 101°20' EP 54 1940 1994
6757 Palestine 2 NE 31°47' 95°36' ET 55 1940 1994
6775 Pampa and 67761 35°32' 100°58' HP 54 1941 1994
6792 Panther Junction 29°19' 103°13' TP 40 1955 1994
6834 Pat Mayse Dam 33°52' 95°31' NC 29 1966 1994
6893 Pecos 12 SSW 31°16' 103°36' TP 35 1960 1994
6935 Pep 33°49' 102°34' HP 39 1956 1994
6981 Pettit 4 NE 33°44' 102°28' HP 13 1941 1955
7060 Pitchfork Ranch 33°36' 100°32' LRP 22 1971 1994
7066 Pittsburg 5 S 32°56' 94°58' ET 46 1949 1994
7074 Plains 33°11' 102°50' HP 53 1942 1994
7116 Plemons 35°46' 101°20' HP 19 1940 1958
7140 Point Comfort 28°40' 96°33' UC 38 1957 1994
7173 Port Arthur 29°52' 93°56' UC 37 1917 1953
7174 Port Arthur WSO Airport 29°57' 94°01' UC 45 1947 1994
7213 Post Oak School 30°16' 96°43' SC 19 1963 1981
7243 Prairie Mountain 30°35' 98°53' EP 55 1940 1994
7274 Priddy 3 N 31°43' 98°31' NC 11 1984 1994
7300 Proctor Reservoir 31°58' 98°30' NC 22 1973 1994
7422 Randolph Field 29°32' 98°17' EP 55 1940 1994
7431 Rankin 31°14' 101°57' EP 45 1948 1994
7481 Red Bluff Dam 31°54' 103°55' TP 47 1942 1994
7497 Red Rock and 74981 29°58' 97°27' SC 28 1967 1994
7499 Red Springs 2 ESE 33°36' 99°23' LRP 52 1943 1994
7534 Reiley Ranch 30°38' 100°15' EP 11 1940 1950
7556 Reno 32°57' 97°34' NC 49 1946 1994
7594 Richmond and 75961 29°35' 95°45' UC 31 1964 1994
7608 Riesel 31°29' 96°53' NC 29 1940 1968
Appendix 2. Hourly precipitation stations in Texas with at least 10 years of annual maxima data through 1994—Continued
Stationno.
Station name Latitude and longitudeClimaticregion
Years ofrecord
Beginning yearof record
Ending yearof record
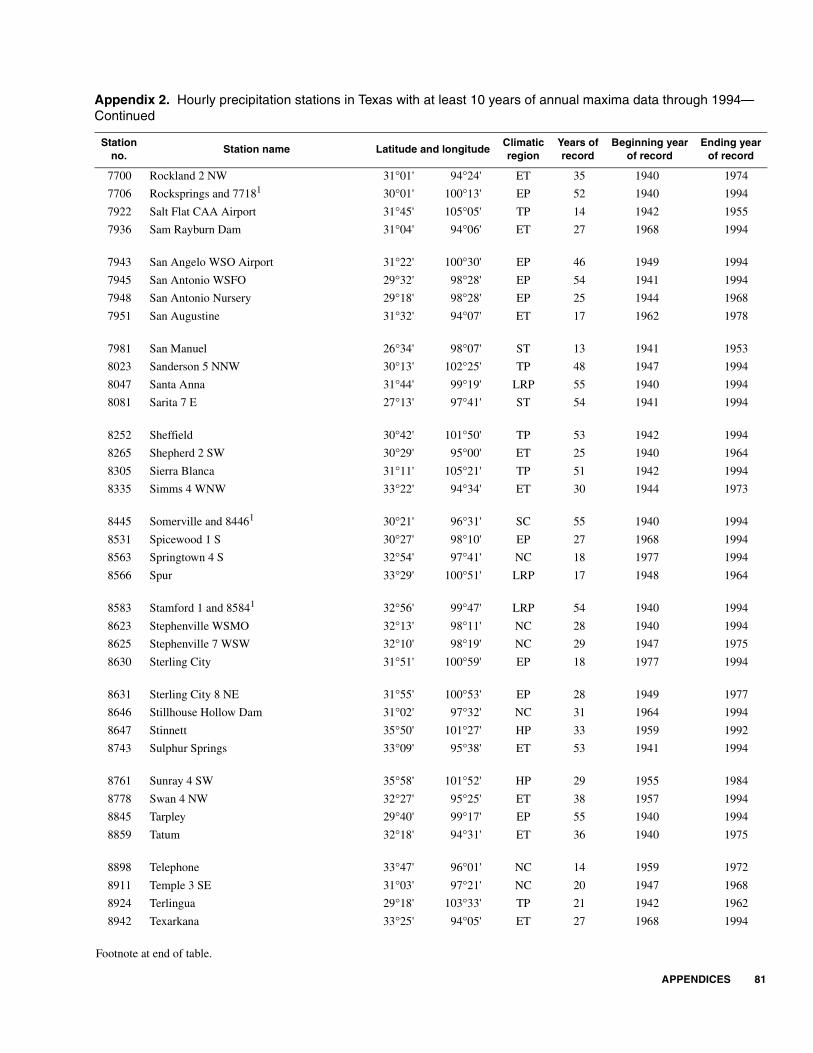
APPENDICES 81
Footnote at end of table.
7700 Rockland 2 NW 31°01' 94°24' ET 35 1940 1974
7706 Rocksprings and 77181 30°01' 100°13' EP 52 1940 1994
7922 Salt Flat CAA Airport 31°45' 105°05' TP 14 1942 1955
7936 Sam Rayburn Dam 31°04' 94°06' ET 27 1968 1994
7943 San Angelo WSO Airport 31°22' 100°30' EP 46 1949 1994
7945 San Antonio WSFO 29°32' 98°28' EP 54 1941 1994
7948 San Antonio Nursery 29°18' 98°28' EP 25 1944 1968
7951 San Augustine 31°32' 94°07' ET 17 1962 1978
7981 San Manuel 26°34' 98°07' ST 13 1941 1953
8023 Sanderson 5 NNW 30°13' 102°25' TP 48 1947 1994
8047 Santa Anna 31°44' 99°19' LRP 55 1940 1994
8081 Sarita 7 E 27°13' 97°41' ST 54 1941 1994
8252 Sheffield 30°42' 101°50' TP 53 1942 1994
8265 Shepherd 2 SW 30°29' 95°00' ET 25 1940 1964
8305 Sierra Blanca 31°11' 105°21' TP 51 1942 1994
8335 Simms 4 WNW 33°22' 94°34' ET 30 1944 1973
8445 Somerville and 84461 30°21' 96°31' SC 55 1940 1994
8531 Spicewood 1 S 30°27' 98°10' EP 27 1968 1994
8563 Springtown 4 S 32°54' 97°41' NC 18 1977 1994
8566 Spur 33°29' 100°51' LRP 17 1948 1964
8583 Stamford 1 and 85841 32°56' 99°47' LRP 54 1940 1994
8623 Stephenville WSMO 32°13' 98°11' NC 28 1940 1994
8625 Stephenville 7 WSW 32°10' 98°19' NC 29 1947 1975
8630 Sterling City 31°51' 100°59' EP 18 1977 1994
8631 Sterling City 8 NE 31°55' 100°53' EP 28 1949 1977
8646 Stillhouse Hollow Dam 31°02' 97°32' NC 31 1964 1994
8647 Stinnett 35°50' 101°27' HP 33 1959 1992
8743 Sulphur Springs 33°09' 95°38' ET 53 1941 1994
8761 Sunray 4 SW 35°58' 101°52' HP 29 1955 1984
8778 Swan 4 NW 32°27' 95°25' ET 38 1957 1994
8845 Tarpley 29°40' 99°17' EP 55 1940 1994
8859 Tatum 32°18' 94°31' ET 36 1940 1975
8898 Telephone 33°47' 96°01' NC 14 1959 1972
8911 Temple 3 SE 31°03' 97°21' NC 20 1947 1968
8924 Terlingua 29°18' 103°33' TP 21 1942 1962
8942 Texarkana 33°25' 94°05' ET 27 1968 1994
Appendix 2. Hourly precipitation stations in Texas with at least 10 years of annual maxima data through 1994—Continued
Stationno.
Station name Latitude and longitudeClimaticregion
Years ofrecord
Beginning yearof record
Ending yearof record
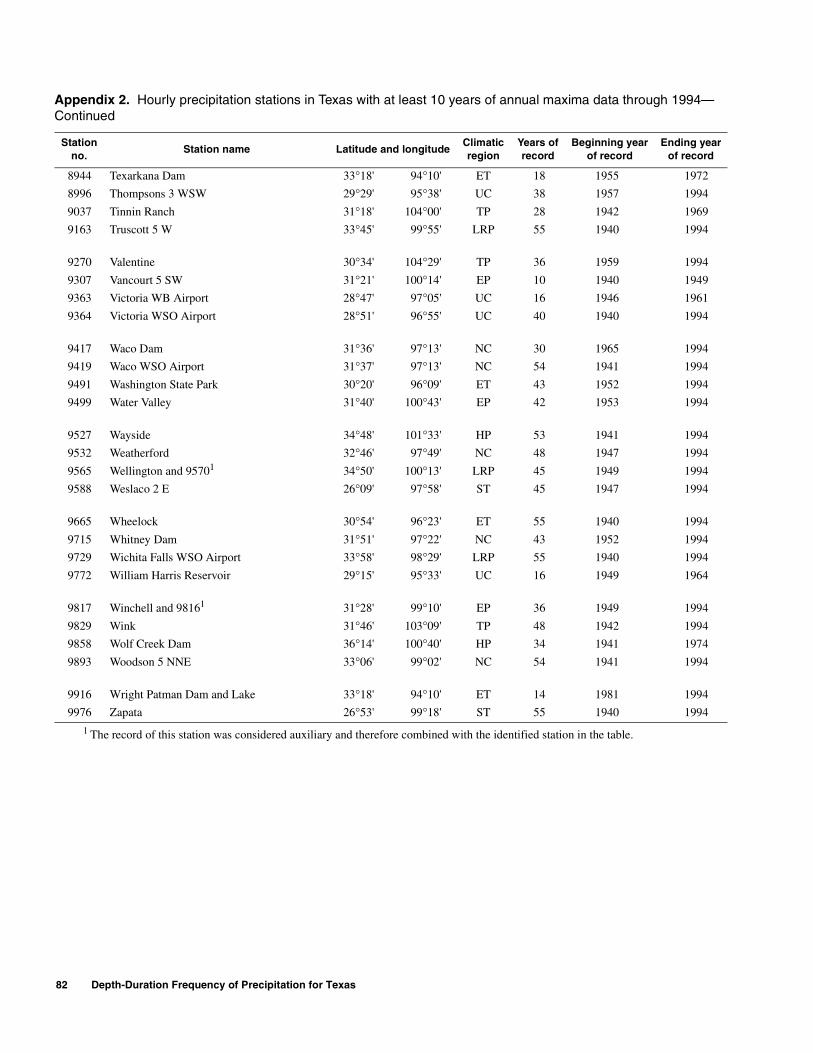
82 Depth-Duration Frequency of Precipitation for Texas
Footnote at end of table.
1 The record of this station was considered auxiliary and therefore combined with the identified station in the table.
8944 Texarkana Dam 33°18' 94°10' ET 18 1955 1972
8996 Thompsons 3 WSW 29°29' 95°38' UC 38 1957 1994
9037 Tinnin Ranch 31°18' 104°00' TP 28 1942 1969
9163 Truscott 5 W 33°45' 99°55' LRP 55 1940 1994
9270 Valentine 30°34' 104°29' TP 36 1959 1994
9307 Vancourt 5 SW 31°21' 100°14' EP 10 1940 1949
9363 Victoria WB Airport 28°47' 97°05' UC 16 1946 1961
9364 Victoria WSO Airport 28°51' 96°55' UC 40 1940 1994
9417 Waco Dam 31°36' 97°13' NC 30 1965 1994
9419 Waco WSO Airport 31°37' 97°13' NC 54 1941 1994
9491 Washington State Park 30°20' 96°09' ET 43 1952 1994
9499 Water Valley 31°40' 100°43' EP 42 1953 1994
9527 Wayside 34°48' 101°33' HP 53 1941 1994
9532 Weatherford 32°46' 97°49' NC 48 1947 1994
9565 Wellington and 95701 34°50' 100°13' LRP 45 1949 1994
9588 Weslaco 2 E 26°09' 97°58' ST 45 1947 1994
9665 Wheelock 30°54' 96°23' ET 55 1940 1994
9715 Whitney Dam 31°51' 97°22' NC 43 1952 1994
9729 Wichita Falls WSO Airport 33°58' 98°29' LRP 55 1940 1994
9772 William Harris Reservoir 29°15' 95°33' UC 16 1949 1964
9817 Winchell and 98161 31°28' 99°10' EP 36 1949 1994
9829 Wink 31°46' 103°09' TP 48 1942 1994
9858 Wolf Creek Dam 36°14' 100°40' HP 34 1941 1974
9893 Woodson 5 NNE 33°06' 99°02' NC 54 1941 1994
9916 Wright Patman Dam and Lake 33°18' 94°10' ET 14 1981 1994
9976 Zapata 26°53' 99°18' ST 55 1940 1994
Appendix 2. Hourly precipitation stations in Texas with at least 10 years of annual maxima data through 1994—Continued
Stationno.
Station name Latitude and longitudeClimaticregion
Years ofrecord
Beginning yearof record
Ending yearof record
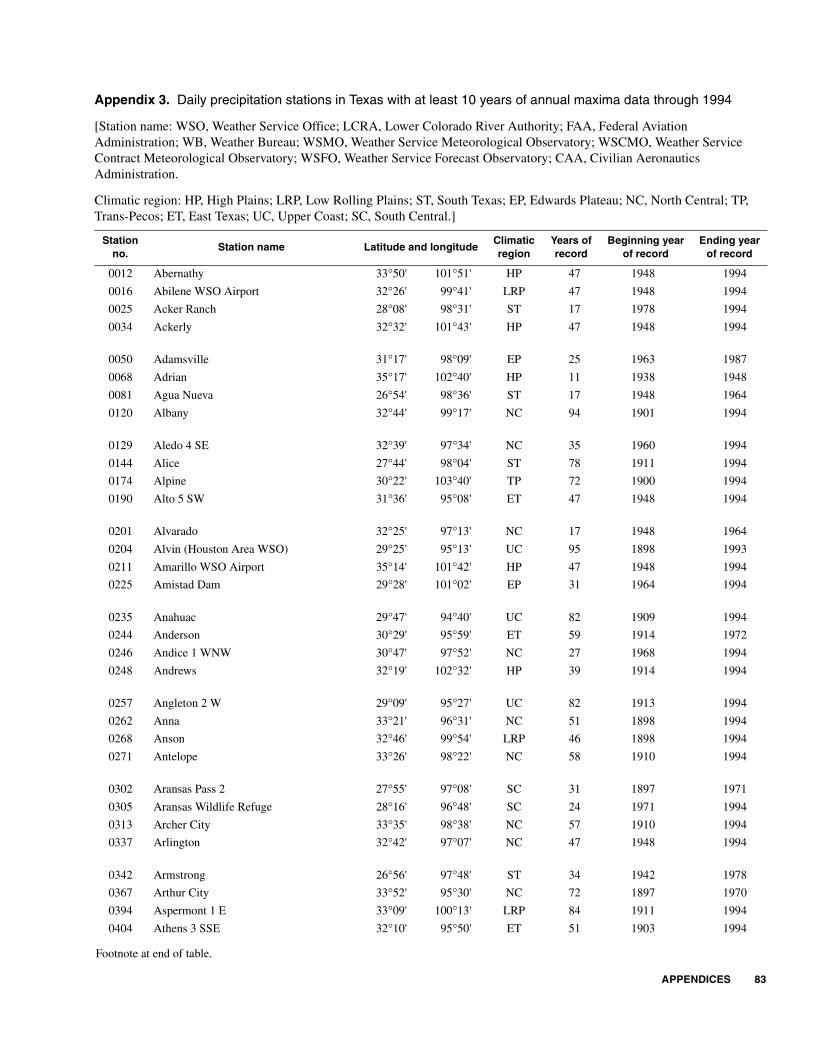
APPENDICES 83
Footnote at end of table.
Depth-Duration Frequency of Precipitation for Texas
APPENDICES
Appendix 3. Daily precipitation stations in Texas with at least 10 years of annual maxima data through 1994—Continued
Stationno.
Station name Latitude and longitudeClimaticregion
Years ofrecord
Beginning yearof record
Ending yearof record
0012 Abernathy 33°50' 101°51' HP 47 1948 1994
0016 Abilene WSO Airport 32°26' 99°41' LRP 47 1948 1994
0025 Acker Ranch 28°08' 98°31' ST 17 1978 1994
0034 Ackerly 32°32' 101°43' HP 47 1948 1994
0050 Adamsville 31°17' 98°09' EP 25 1963 1987
0068 Adrian 35°17' 102°40' HP 11 1938 1948
0081 Agua Nueva 26°54' 98°36' ST 17 1948 1964
0120 Albany 32°44' 99°17' NC 94 1901 1994
0129 Aledo 4 SE 32°39' 97°34' NC 35 1960 1994
0144 Alice 27°44' 98°04' ST 78 1911 1994
0174 Alpine 30°22' 103°40' TP 72 1900 1994
0190 Alto 5 SW 31°36' 95°08' ET 47 1948 1994
0201 Alvarado 32°25' 97°13' NC 17 1948 1964
0204 Alvin (Houston Area WSO) 29°25' 95°13' UC 95 1898 1993
0211 Amarillo WSO Airport 35°14' 101°42' HP 47 1948 1994
0225 Amistad Dam 29°28' 101°02' EP 31 1964 1994
0235 Anahuac 29°47' 94°40' UC 82 1909 1994
0244 Anderson 30°29' 95°59' ET 59 1914 1972
0246 Andice 1 WNW 30°47' 97°52' NC 27 1968 1994
0248 Andrews 32°19' 102°32' HP 39 1914 1994
0257 Angleton 2 W 29°09' 95°27' UC 82 1913 1994
0262 Anna 33°21' 96°31' NC 51 1898 1994
0268 Anson 32°46' 99°54' LRP 46 1898 1994
0271 Antelope 33°26' 98°22' NC 58 1910 1994
0302 Aransas Pass 2 27°55' 97°08' SC 31 1897 1971
0305 Aransas Wildlife Refuge 28°16' 96°48' SC 24 1971 1994
0313 Archer City 33°35' 98°38' NC 57 1910 1994
0337 Arlington 32°42' 97°07' NC 47 1948 1994
0342 Armstrong 26°56' 97°48' ST 34 1942 1978
0367 Arthur City 33°52' 95°30' NC 72 1897 1970
0394 Aspermont 1 E 33°09' 100°13' LRP 84 1911 1994
0404 Athens 3 SSE 32°10' 95°50' ET 51 1903 1994
Appendix 3. Daily precipitation stations in Texas with at least 10 years of annual maxima data through 1994
[Station name: WSO, Weather Service Office; LCRA, Lower Colorado River Authority; FAA, Federal Aviation Administration; WB, Weather Bureau; WSMO, Weather Service Meteorological Observatory; WSCMO, Weather Service Contract Meteorological Observatory; WSFO, Weather Service Forecast Observatory; CAA, Civilian Aeronautics Administration.
Climatic region: HP, High Plains; LRP, Low Rolling Plains; ST, South Texas; EP, Edwards Plateau; NC, North Central; TP, Trans-Pecos; ET, East Texas; UC, Upper Coast; SC, South Central.]

84 Depth-Duration Frequency of Precipitation for Texas
Footnote at end of table.
0408 Atlanta 33°07' 94°10' ET 51 1930 1994
0428 Austin WSO Airport 30°18' 97°42' EP 65 1930 1994
0430 Austin Dam 30°18' 97°47' EP 18 1948 1965
0432 Austin Montopolis Bridge 30°15' 97°41' EP 16 1948 1963
0436 Austwell 28°23' 96°51' SC 52 1897 1960
0437 Austwell Wildlife Refuge 28°16' 96°48' SC 31 1940 1970
0440 Avalon 32°12' 96°47' NC 31 1964 1994
0478 Baird 32°24' 99°24' NC 32 1948 1980
0482 Bakersfield 2 NW 30°55' 102°19' TP 47 1948 1994
0493 Ballinger 5 WSW 31°44' 100°03' LRP 96 1897 1994
0498 Balmorhea 30°59' 103°45' TP 72 1923 1994
0509 Bankersmith 30°08' 98°49' EP 15 1948 1994
0518 Bardwell Dam 32°16' 96°38' NC 30 1965 1994
0528 Barnhart 31°08' 101°10' EP 17 1948 1964
0538 Barstow 31°28' 103°24' TP 14 1906 1919
0558 Bateman Ranch 2 33°36' 100°13' LRP 14 1974 1988
0560 Batesville 28°57' 99°37' ST 30 1965 1994
0569 Bay City Waterworks 28°59' 95°59' UC 62 1909 1994
0586 Baytown 29°50' 95°00' UC 39 1946 1994
0611 Beaumont City 30°06' 94°06' UC 94 1901 1994
0613 Beaumont Research Center 30°04' 94°17' UC 34 1948 1994
0635 Bedias 30°47' 95°57' ET 37 1949 1985
0639 Beeville 5 NE 28°27' 97°42' SC 93 1901 1994
0655 Bellville 29°57' 96°16' SC 16 1978 1993
0665 Belton Dam 31°06' 97°29' NC 41 1951 1992
0689 Benavides and 06901 27°36' 98°25' ST 36 1948 1993
0691 Benbrook Dam 32°39' 97°27' NC 46 1949 1994
0704 Benjamin 4 SSE 33°32' 99°46' LRP 36 1940 1975
0708 Benjamin 15 W 33°35' 100°02' LRP 15 1980 1994
0738 Bertram 3 ENE 30°45' 98°01' EP 27 1968 1994
0776 Big Lake (LCRA 140) 31°12' 101°28' EP 36 1948 1994
0786 Big Spring 32°15' 101°27' HP 47 1948 1994
0787 Big Wells 1 W 28°35' 99°35' ST 75 1916 1990
0805 Bishop 27°35' 97°48' SC 26 1934 1959
0832 Blanco 30°06' 98°25' EP 97 1897 1994
0839 Blanket 31°49' 98°47' NC 18 1948 1965
Appendix 3. Daily precipitation stations in Texas with at least 10 years of annual maxima data through 1994—Continued
Stationno.
Station name Latitude and longitudeClimaticregion
Years ofrecord
Beginning yearof record
Ending yearof record
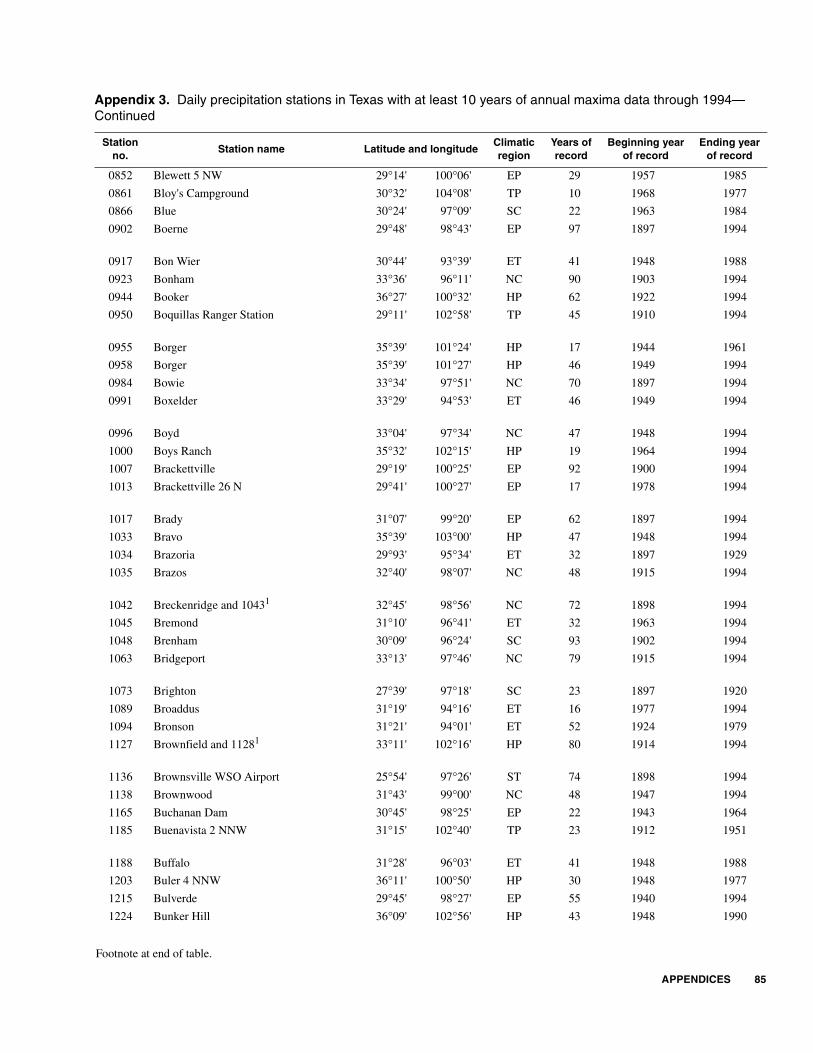
APPENDICES 85
Footnote at end of table.
0852 Blewett 5 NW 29°14' 100°06' EP 29 1957 1985
0861 Bloy's Campground 30°32' 104°08' TP 10 1968 1977
0866 Blue 30°24' 97°09' SC 22 1963 1984
0902 Boerne 29°48' 98°43' EP 97 1897 1994
0917 Bon Wier 30°44' 93°39' ET 41 1948 1988
0923 Bonham 33°36' 96°11' NC 90 1903 1994
0944 Booker 36°27' 100°32' HP 62 1922 1994
0950 Boquillas Ranger Station 29°11' 102°58' TP 45 1910 1994
0955 Borger 35°39' 101°24' HP 17 1944 1961
0958 Borger 35°39' 101°27' HP 46 1949 1994
0984 Bowie 33°34' 97°51' NC 70 1897 1994
0991 Boxelder 33°29' 94°53' ET 46 1949 1994
0996 Boyd 33°04' 97°34' NC 47 1948 1994
1000 Boys Ranch 35°32' 102°15' HP 19 1964 1994
1007 Brackettville 29°19' 100°25' EP 92 1900 1994
1013 Brackettville 26 N 29°41' 100°27' EP 17 1978 1994
1017 Brady 31°07' 99°20' EP 62 1897 1994
1033 Bravo 35°39' 103°00' HP 47 1948 1994
1034 Brazoria 29°93' 95°34' ET 32 1897 1929
1035 Brazos 32°40' 98°07' NC 48 1915 1994
1042 Breckenridge and 10431 32°45' 98°56' NC 72 1898 1994
1045 Bremond 31°10' 96°41' ET 32 1963 1994
1048 Brenham 30°09' 96°24' SC 93 1902 1994
1063 Bridgeport 33°13' 97°46' NC 79 1915 1994
1073 Brighton 27°39' 97°18' SC 23 1897 1920
1089 Broaddus 31°19' 94°16' ET 16 1977 1994
1094 Bronson 31°21' 94°01' ET 52 1924 1979
1127 Brownfield and 11281 33°11' 102°16' HP 80 1914 1994
1136 Brownsville WSO Airport 25°54' 97°26' ST 74 1898 1994
1138 Brownwood 31°43' 99°00' NC 48 1947 1994
1165 Buchanan Dam 30°45' 98°25' EP 22 1943 1964
1185 Buenavista 2 NNW 31°15' 102°40' TP 23 1912 1951
1188 Buffalo 31°28' 96°03' ET 41 1948 1988
1203 Buler 4 NNW 36°11' 100°50' HP 30 1948 1977
1215 Bulverde 29°45' 98°27' EP 55 1940 1994
1224 Bunker Hill 36°09' 102°56' HP 43 1948 1990
Appendix 3. Daily precipitation stations in Texas with at least 10 years of annual maxima data through 1994—Continued
Stationno.
Station name Latitude and longitudeClimaticregion
Years ofrecord
Beginning yearof record
Ending yearof record
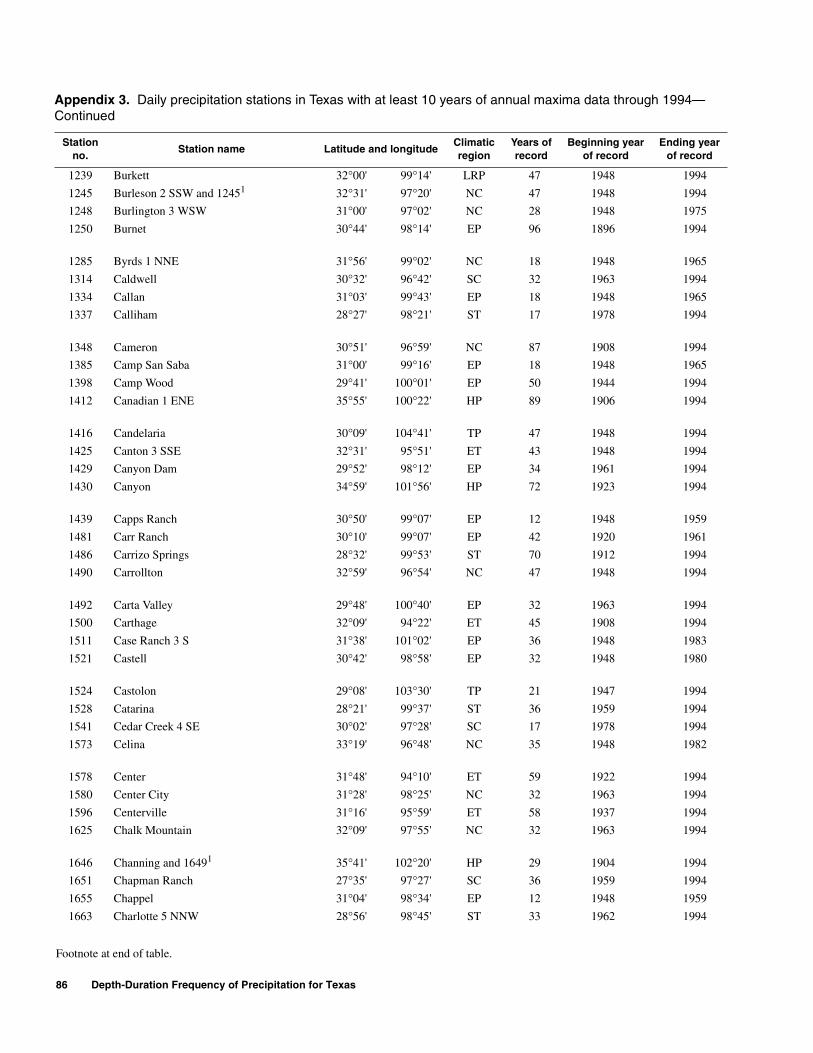
86 Depth-Duration Frequency of Precipitation for Texas
Footnote at end of table.
1239 Burkett 32°00' 99°14' LRP 47 1948 1994
1245 Burleson 2 SSW and 12451 32°31' 97°20' NC 47 1948 1994
1248 Burlington 3 WSW 31°00' 97°02' NC 28 1948 1975
1250 Burnet 30°44' 98°14' EP 96 1896 1994
1285 Byrds 1 NNE 31°56' 99°02' NC 18 1948 1965
1314 Caldwell 30°32' 96°42' SC 32 1963 1994
1334 Callan 31°03' 99°43' EP 18 1948 1965
1337 Calliham 28°27' 98°21' ST 17 1978 1994
1348 Cameron 30°51' 96°59' NC 87 1908 1994
1385 Camp San Saba 31°00' 99°16' EP 18 1948 1965
1398 Camp Wood 29°41' 100°01' EP 50 1944 1994
1412 Canadian 1 ENE 35°55' 100°22' HP 89 1906 1994
1416 Candelaria 30°09' 104°41' TP 47 1948 1994
1425 Canton 3 SSE 32°31' 95°51' ET 43 1948 1994
1429 Canyon Dam 29°52' 98°12' EP 34 1961 1994
1430 Canyon 34°59' 101°56' HP 72 1923 1994
1439 Capps Ranch 30°50' 99°07' EP 12 1948 1959
1481 Carr Ranch 30°10' 99°07' EP 42 1920 1961
1486 Carrizo Springs 28°32' 99°53' ST 70 1912 1994
1490 Carrollton 32°59' 96°54' NC 47 1948 1994
1492 Carta Valley 29°48' 100°40' EP 32 1963 1994
1500 Carthage 32°09' 94°22' ET 45 1908 1994
1511 Case Ranch 3 S 31°38' 101°02' EP 36 1948 1983
1521 Castell 30°42' 98°58' EP 32 1948 1980
1524 Castolon 29°08' 103°30' TP 21 1947 1994
1528 Catarina 28°21' 99°37' ST 36 1959 1994
1541 Cedar Creek 4 SE 30°02' 97°28' SC 17 1978 1994
1573 Celina 33°19' 96°48' NC 35 1948 1982
1578 Center 31°48' 94°10' ET 59 1922 1994
1580 Center City 31°28' 98°25' NC 32 1963 1994
1596 Centerville 31°16' 95°59' ET 58 1937 1994
1625 Chalk Mountain 32°09' 97°55' NC 32 1963 1994
1646 Channing and 16491 35°41' 102°20' HP 29 1904 1994
1651 Chapman Ranch 27°35' 97°27' SC 36 1959 1994
1655 Chappel 31°04' 98°34' EP 12 1948 1959
1663 Charlotte 5 NNW 28°56' 98°45' ST 33 1962 1994
Appendix 3. Daily precipitation stations in Texas with at least 10 years of annual maxima data through 1994—Continued
Stationno.
Station name Latitude and longitudeClimaticregion
Years ofrecord
Beginning yearof record
Ending yearof record
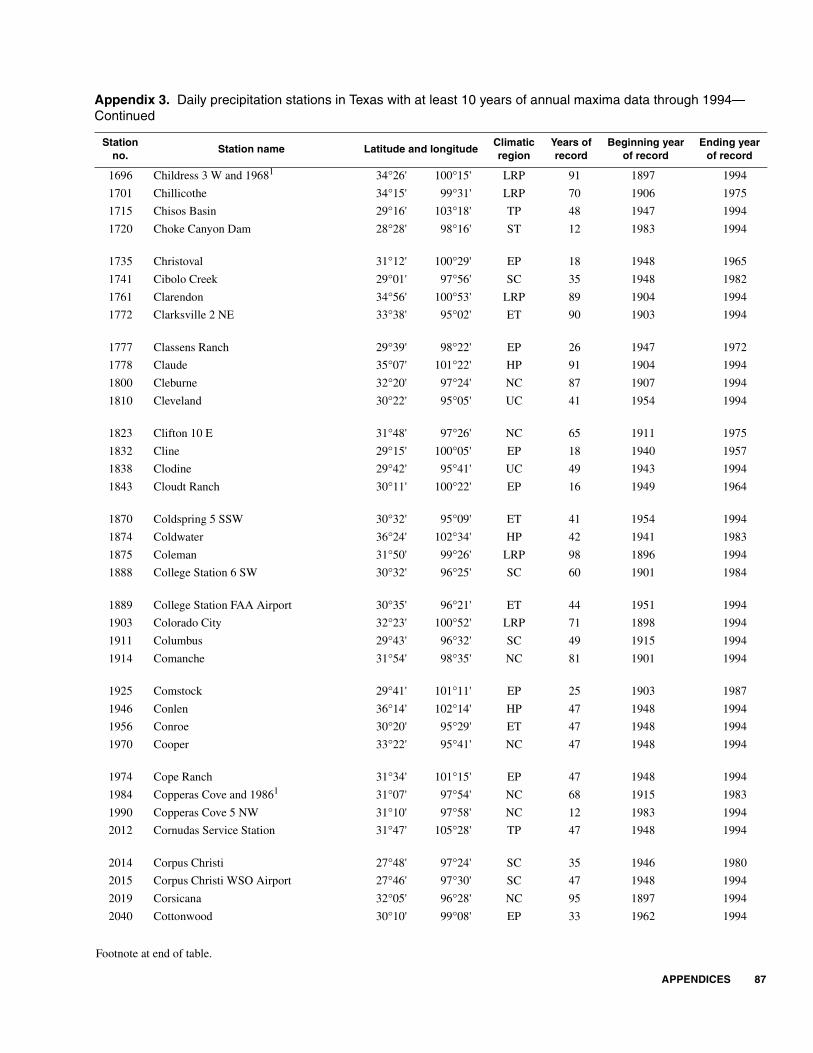
APPENDICES 87
Footnote at end of table.
1696 Childress 3 W and 19681 34°26' 100°15' LRP 91 1897 1994
1701 Chillicothe 34°15' 99°31' LRP 70 1906 1975
1715 Chisos Basin 29°16' 103°18' TP 48 1947 1994
1720 Choke Canyon Dam 28°28' 98°16' ST 12 1983 1994
1735 Christoval 31°12' 100°29' EP 18 1948 1965
1741 Cibolo Creek 29°01' 97°56' SC 35 1948 1982
1761 Clarendon 34°56' 100°53' LRP 89 1904 1994
1772 Clarksville 2 NE 33°38' 95°02' ET 90 1903 1994
1777 Classens Ranch 29°39' 98°22' EP 26 1947 1972
1778 Claude 35°07' 101°22' HP 91 1904 1994
1800 Cleburne 32°20' 97°24' NC 87 1907 1994
1810 Cleveland 30°22' 95°05' UC 41 1954 1994
1823 Clifton 10 E 31°48' 97°26' NC 65 1911 1975
1832 Cline 29°15' 100°05' EP 18 1940 1957
1838 Clodine 29°42' 95°41' UC 49 1943 1994
1843 Cloudt Ranch 30°11' 100°22' EP 16 1949 1964
1870 Coldspring 5 SSW 30°32' 95°09' ET 41 1954 1994
1874 Coldwater 36°24' 102°34' HP 42 1941 1983
1875 Coleman 31°50' 99°26' LRP 98 1896 1994
1888 College Station 6 SW 30°32' 96°25' SC 60 1901 1984
1889 College Station FAA Airport 30°35' 96°21' ET 44 1951 1994
1903 Colorado City 32°23' 100°52' LRP 71 1898 1994
1911 Columbus 29°43' 96°32' SC 49 1915 1994
1914 Comanche 31°54' 98°35' NC 81 1901 1994
1925 Comstock 29°41' 101°11' EP 25 1903 1987
1946 Conlen 36°14' 102°14' HP 47 1948 1994
1956 Conroe 30°20' 95°29' ET 47 1948 1994
1970 Cooper 33°22' 95°41' NC 47 1948 1994
1974 Cope Ranch 31°34' 101°15' EP 47 1948 1994
1984 Copperas Cove and 19861 31°07' 97°54' NC 68 1915 1983
1990 Copperas Cove 5 NW 31°10' 97°58' NC 12 1983 1994
2012 Cornudas Service Station 31°47' 105°28' TP 47 1948 1994
2014 Corpus Christi 27°48' 97°24' SC 35 1946 1980
2015 Corpus Christi WSO Airport 27°46' 97°30' SC 47 1948 1994
2019 Corsicana 32°05' 96°28' NC 95 1897 1994
2040 Cottonwood 30°10' 99°08' EP 33 1962 1994
Appendix 3. Daily precipitation stations in Texas with at least 10 years of annual maxima data through 1994—Continued
Stationno.
Station name Latitude and longitudeClimaticregion
Years ofrecord
Beginning yearof record
Ending yearof record
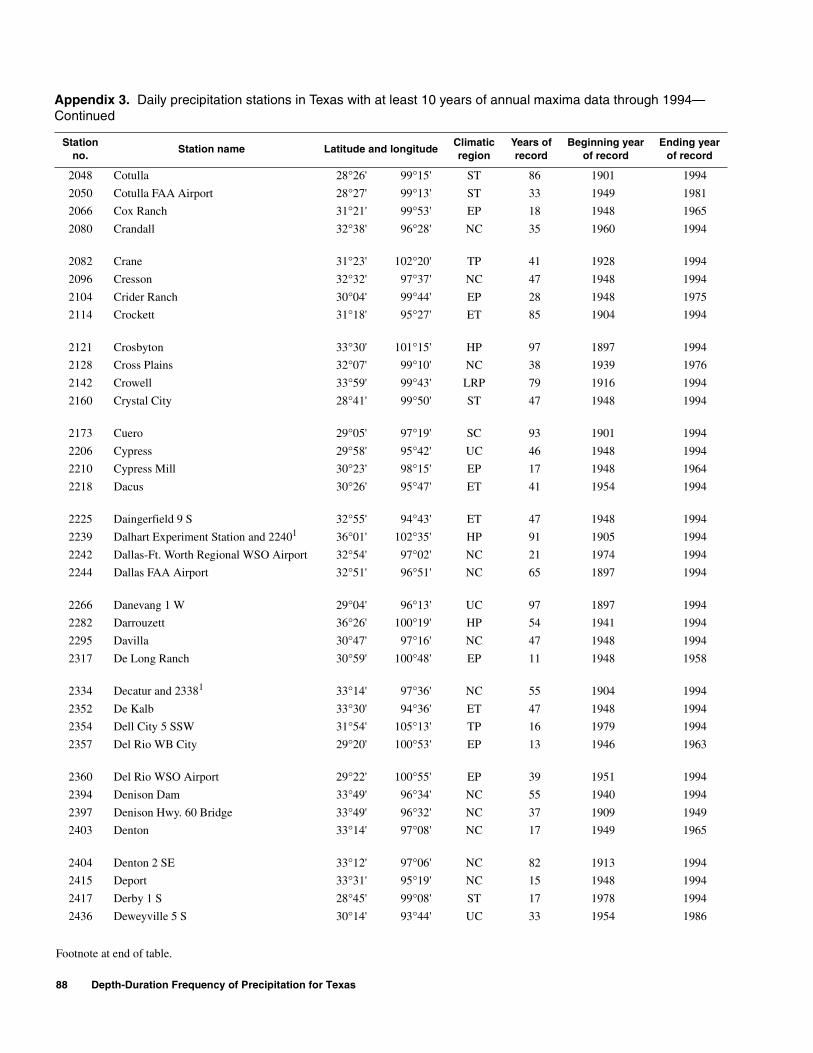
88 Depth-Duration Frequency of Precipitation for Texas
Footnote at end of table.
2048 Cotulla 28°26' 99°15' ST 86 1901 1994
2050 Cotulla FAA Airport 28°27' 99°13' ST 33 1949 1981
2066 Cox Ranch 31°21' 99°53' EP 18 1948 1965
2080 Crandall 32°38' 96°28' NC 35 1960 1994
2082 Crane 31°23' 102°20' TP 41 1928 1994
2096 Cresson 32°32' 97°37' NC 47 1948 1994
2104 Crider Ranch 30°04' 99°44' EP 28 1948 1975
2114 Crockett 31°18' 95°27' ET 85 1904 1994
2121 Crosbyton 33°30' 101°15' HP 97 1897 1994
2128 Cross Plains 32°07' 99°10' NC 38 1939 1976
2142 Crowell 33°59' 99°43' LRP 79 1916 1994
2160 Crystal City 28°41' 99°50' ST 47 1948 1994
2173 Cuero 29°05' 97°19' SC 93 1901 1994
2206 Cypress 29°58' 95°42' UC 46 1948 1994
2210 Cypress Mill 30°23' 98°15' EP 17 1948 1964
2218 Dacus 30°26' 95°47' ET 41 1954 1994
2225 Daingerfield 9 S 32°55' 94°43' ET 47 1948 1994
2239 Dalhart Experiment Station and 22401 36°01' 102°35' HP 91 1905 1994
2242 Dallas-Ft. Worth Regional WSO Airport 32°54' 97°02' NC 21 1974 1994
2244 Dallas FAA Airport 32°51' 96°51' NC 65 1897 1994
2266 Danevang 1 W 29°04' 96°13' UC 97 1897 1994
2282 Darrouzett 36°26' 100°19' HP 54 1941 1994
2295 Davilla 30°47' 97°16' NC 47 1948 1994
2317 De Long Ranch 30°59' 100°48' EP 11 1948 1958
2334 Decatur and 23381 33°14' 97°36' NC 55 1904 1994
2352 De Kalb 33°30' 94°36' ET 47 1948 1994
2354 Dell City 5 SSW 31°54' 105°13' TP 16 1979 1994
2357 Del Rio WB City 29°20' 100°53' EP 13 1946 1963
2360 Del Rio WSO Airport 29°22' 100°55' EP 39 1951 1994
2394 Denison Dam 33°49' 96°34' NC 55 1940 1994
2397 Denison Hwy. 60 Bridge 33°49' 96°32' NC 37 1909 1949
2403 Denton 33°14' 97°08' NC 17 1949 1965
2404 Denton 2 SE 33°12' 97°06' NC 82 1913 1994
2415 Deport 33°31' 95°19' NC 15 1948 1994
2417 Derby 1 S 28°45' 99°08' ST 17 1978 1994
2436 Deweyville 5 S 30°14' 93°44' UC 33 1954 1986
Appendix 3. Daily precipitation stations in Texas with at least 10 years of annual maxima data through 1994—Continued
Stationno.
Station name Latitude and longitudeClimaticregion
Years ofrecord
Beginning yearof record
Ending yearof record
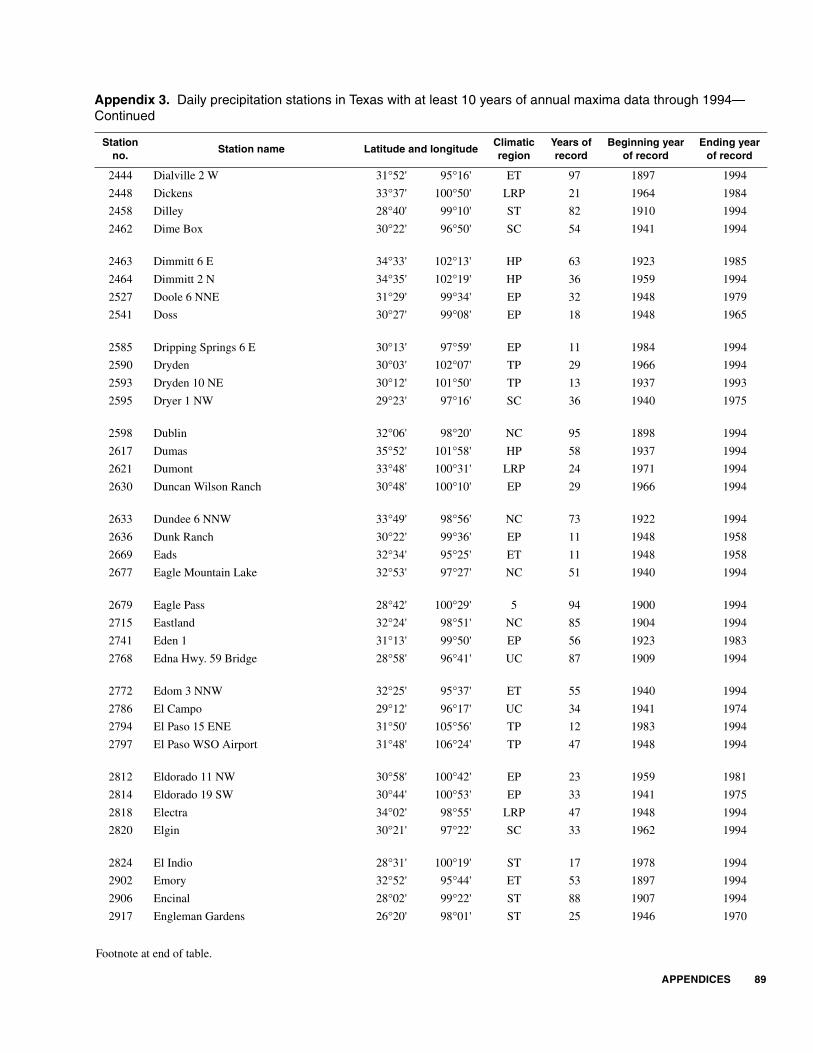
APPENDICES 89
Footnote at end of table.
2444 Dialville 2 W 31°52' 95°16' ET 97 1897 1994
2448 Dickens 33°37' 100°50' LRP 21 1964 1984
2458 Dilley 28°40' 99°10' ST 82 1910 1994
2462 Dime Box 30°22' 96°50' SC 54 1941 1994
2463 Dimmitt 6 E 34°33' 102°13' HP 63 1923 1985
2464 Dimmitt 2 N 34°35' 102°19' HP 36 1959 1994
2527 Doole 6 NNE 31°29' 99°34' EP 32 1948 1979
2541 Doss 30°27' 99°08' EP 18 1948 1965
2585 Dripping Springs 6 E 30°13' 97°59' EP 11 1984 1994
2590 Dryden 30°03' 102°07' TP 29 1966 1994
2593 Dryden 10 NE 30°12' 101°50' TP 13 1937 1993
2595 Dryer 1 NW 29°23' 97°16' SC 36 1940 1975
2598 Dublin 32°06' 98°20' NC 95 1898 1994
2617 Dumas 35°52' 101°58' HP 58 1937 1994
2621 Dumont 33°48' 100°31' LRP 24 1971 1994
2630 Duncan Wilson Ranch 30°48' 100°10' EP 29 1966 1994
2633 Dundee 6 NNW 33°49' 98°56' NC 73 1922 1994
2636 Dunk Ranch 30°22' 99°36' EP 11 1948 1958
2669 Eads 32°34' 95°25' ET 11 1948 1958
2677 Eagle Mountain Lake 32°53' 97°27' NC 51 1940 1994
2679 Eagle Pass 28°42' 100°29' 5 94 1900 1994
2715 Eastland 32°24' 98°51' NC 85 1904 1994
2741 Eden 1 31°13' 99°50' EP 56 1923 1983
2768 Edna Hwy. 59 Bridge 28°58' 96°41' UC 87 1909 1994
2772 Edom 3 NNW 32°25' 95°37' ET 55 1940 1994
2786 El Campo 29°12' 96°17' UC 34 1941 1974
2794 El Paso 15 ENE 31°50' 105°56' TP 12 1983 1994
2797 El Paso WSO Airport 31°48' 106°24' TP 47 1948 1994
2812 Eldorado 11 NW 30°58' 100°42' EP 23 1959 1981
2814 Eldorado 19 SW 30°44' 100°53' EP 33 1941 1975
2818 Electra 34°02' 98°55' LRP 47 1948 1994
2820 Elgin 30°21' 97°22' SC 33 1962 1994
2824 El Indio 28°31' 100°19' ST 17 1978 1994
2902 Emory 32°52' 95°44' ET 53 1897 1994
2906 Encinal 28°02' 99°22' ST 88 1907 1994
2917 Engleman Gardens 26°20' 98°01' ST 25 1946 1970
Appendix 3. Daily precipitation stations in Texas with at least 10 years of annual maxima data through 1994—Continued
Stationno.
Station name Latitude and longitudeClimaticregion
Years ofrecord
Beginning yearof record
Ending yearof record

90 Depth-Duration Frequency of Precipitation for Texas
Footnote at end of table.
2925 Ennis 32°20' 96°38' NC 49 1940 1991
3000 Evadale 30°20' 94°05' ET 42 1946 1994
3005 Evant 4 SW 31°27' 98°13' NC 41 1941 1994
3033 Fabens 31°30' 106°09' TP 30 1948 1977
3038 Fair Oaks Ranch 29°45' 98°38' EP 28 1946 1973
3047 Fairfield 4 E 31°44' 96°06' ET 53 1941 1994
3060 Falcon Dam 26°33' 99°08' ST 33 1962 1994
3063 Falfurrias 27°14' 98°08' ST 88 1907 1994
3065 Falls City 4 WSW 28°57' 98°04' SC 49 1946 1994
3080 Farmersville 33°11' 96°22' NC 48 1947 1994
3085 Farnsworth 3 NNW 36°22' 100°59' HP 18 1941 1958
3112 Fedor 30°19' 97°03' SC 32 1963 1994
3133 Ferris 32°32' 96°40' NC 53 1940 1994
3142 Fife 31°23' 99°22' EP 35 1941 1975
3156 Fischers Store 29°59' 98°16' EP 54 1941 1994
3183 Flatonia 29°40' 97°07' SC 87 1908 1994
3192 Flint 32°12' 95°21' ET 40 1910 1949
3196 Flomot 4 NE 34°16' 100°56' LRP 49 1946 1994
3199 Florence 3 SE 30°48' 97°46' NC 32 1963 1994
3201 Floresville 29°08' 98°10' SC 79 1916 1994
3214 Floydada 33°58' 101°20' HP 56 1911 1994
3215 Floydada 9 SE 33°52' 101°15' HP 48 1947 1994
3218 Flying V Ranch 31°05' 98°45' EP 12 1948 1959
3225 Follett 36°26' 100°08' HP 65 1930 1994
3247 Forestburg 5 S 33°28' 97°34' NC 57 1897 1994
3253 Forsan 32°06' 101°22' HP 46 1949 1994
3262 Fort Davis 30°36' 103°53' TP 83 1902 1994
3266 Fort Hancock 31°17' 105°51' TP 29 1966 1994
3267 Fort McIntosh 27°30' 99°31' ST 32 1900 1931
3277 Fort Stockton 1 30°53' 102°53' TP 51 1897 1948
3280 Fort Stockton 30°53' 102°52' TP 54 1940 1994
3283 Fort Worth International WSO Airport 32°50' 97°03' NC 27 1897 1973
3284 Fort Worth Meach WSO Airport 32°49' 97°21' NC 11 1946 1994
3286 Fort Worth Vickery Blvd. 32°44' 97°20' NC 19 1948 1994
3298 Four Notch Guard Station 30°39' 95°25' ET 25 1940 1964
3299 Fowlerton 2 NW 28°29' 98°52' ST 78 1913 1994
Appendix 3. Daily precipitation stations in Texas with at least 10 years of annual maxima data through 1994—Continued
Stationno.
Station name Latitude and longitudeClimaticregion
Years ofrecord
Beginning yearof record
Ending yearof record
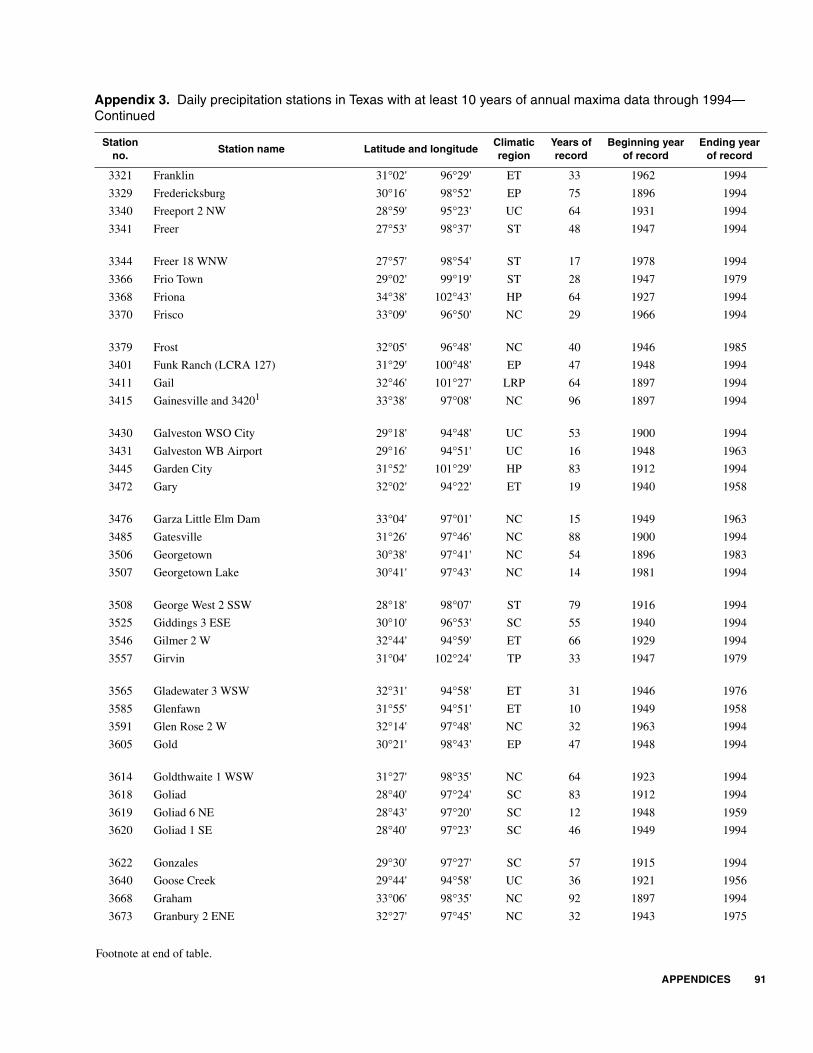
APPENDICES 91
Footnote at end of table.
3321 Franklin 31°02' 96°29' ET 33 1962 1994
3329 Fredericksburg 30°16' 98°52' EP 75 1896 1994
3340 Freeport 2 NW 28°59' 95°23' UC 64 1931 1994
3341 Freer 27°53' 98°37' ST 48 1947 1994
3344 Freer 18 WNW 27°57' 98°54' ST 17 1978 1994
3366 Frio Town 29°02' 99°19' ST 28 1947 1979
3368 Friona 34°38' 102°43' HP 64 1927 1994
3370 Frisco 33°09' 96°50' NC 29 1966 1994
3379 Frost 32°05' 96°48' NC 40 1946 1985
3401 Funk Ranch (LCRA 127) 31°29' 100°48' EP 47 1948 1994
3411 Gail 32°46' 101°27' LRP 64 1897 1994
3415 Gainesville and 34201 33°38' 97°08' NC 96 1897 1994
3430 Galveston WSO City 29°18' 94°48' UC 53 1900 1994
3431 Galveston WB Airport 29°16' 94°51' UC 16 1948 1963
3445 Garden City 31°52' 101°29' HP 83 1912 1994
3472 Gary 32°02' 94°22' ET 19 1940 1958
3476 Garza Little Elm Dam 33°04' 97°01' NC 15 1949 1963
3485 Gatesville 31°26' 97°46' NC 88 1900 1994
3506 Georgetown 30°38' 97°41' NC 54 1896 1983
3507 Georgetown Lake 30°41' 97°43' NC 14 1981 1994
3508 George West 2 SSW 28°18' 98°07' ST 79 1916 1994
3525 Giddings 3 ESE 30°10' 96°53' SC 55 1940 1994
3546 Gilmer 2 W 32°44' 94°59' ET 66 1929 1994
3557 Girvin 31°04' 102°24' TP 33 1947 1979
3565 Gladewater 3 WSW 32°31' 94°58' ET 31 1946 1976
3585 Glenfawn 31°55' 94°51' ET 10 1949 1958
3591 Glen Rose 2 W 32°14' 97°48' NC 32 1963 1994
3605 Gold 30°21' 98°43' EP 47 1948 1994
3614 Goldthwaite 1 WSW 31°27' 98°35' NC 64 1923 1994
3618 Goliad 28°40' 97°24' SC 83 1912 1994
3619 Goliad 6 NE 28°43' 97°20' SC 12 1948 1959
3620 Goliad 1 SE 28°40' 97°23' SC 46 1949 1994
3622 Gonzales 29°30' 97°27' SC 57 1915 1994
3640 Goose Creek 29°44' 94°58' UC 36 1921 1956
3668 Graham 33°06' 98°35' NC 92 1897 1994
3673 Granbury 2 ENE 32°27' 97°45' NC 32 1943 1975
Appendix 3. Daily precipitation stations in Texas with at least 10 years of annual maxima data through 1994—Continued
Stationno.
Station name Latitude and longitudeClimaticregion
Years ofrecord
Beginning yearof record
Ending yearof record
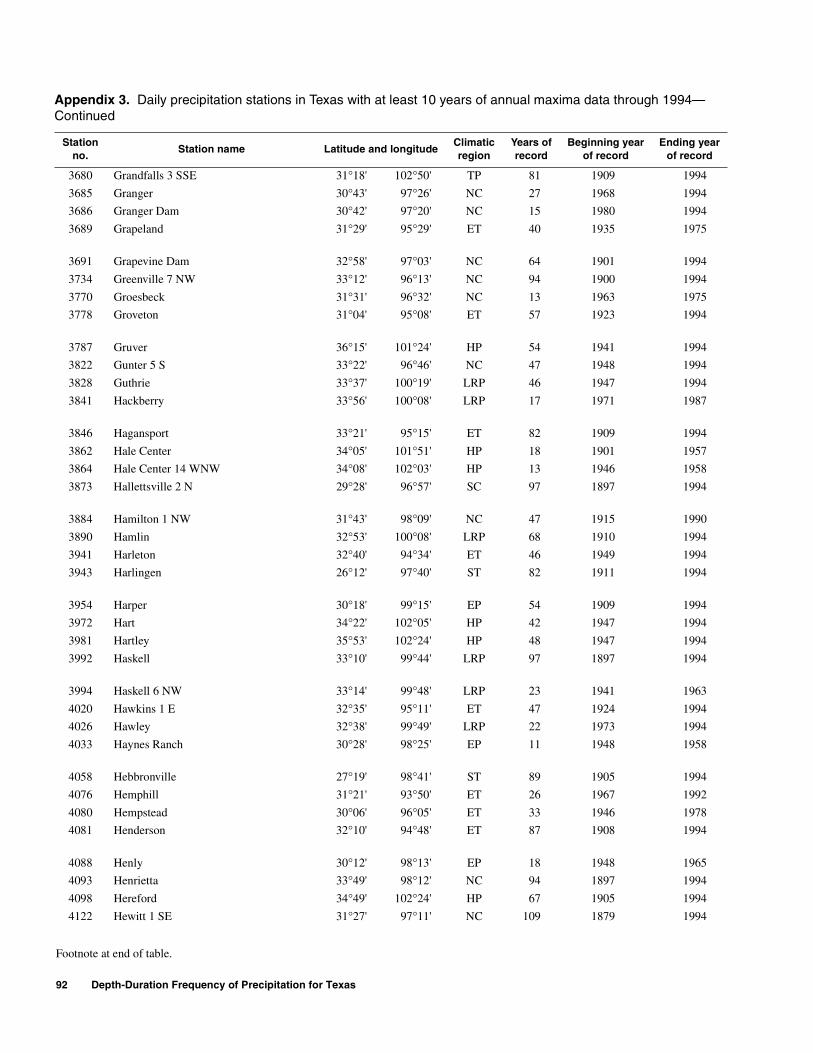
92 Depth-Duration Frequency of Precipitation for Texas
Footnote at end of table.
3680 Grandfalls 3 SSE 31°18' 102°50' TP 81 1909 1994
3685 Granger 30°43' 97°26' NC 27 1968 1994
3686 Granger Dam 30°42' 97°20' NC 15 1980 1994
3689 Grapeland 31°29' 95°29' ET 40 1935 1975
3691 Grapevine Dam 32°58' 97°03' NC 64 1901 1994
3734 Greenville 7 NW 33°12' 96°13' NC 94 1900 1994
3770 Groesbeck 31°31' 96°32' NC 13 1963 1975
3778 Groveton 31°04' 95°08' ET 57 1923 1994
3787 Gruver 36°15' 101°24' HP 54 1941 1994
3822 Gunter 5 S 33°22' 96°46' NC 47 1948 1994
3828 Guthrie 33°37' 100°19' LRP 46 1947 1994
3841 Hackberry 33°56' 100°08' LRP 17 1971 1987
3846 Hagansport 33°21' 95°15' ET 82 1909 1994
3862 Hale Center 34°05' 101°51' HP 18 1901 1957
3864 Hale Center 14 WNW 34°08' 102°03' HP 13 1946 1958
3873 Hallettsville 2 N 29°28' 96°57' SC 97 1897 1994
3884 Hamilton 1 NW 31°43' 98°09' NC 47 1915 1990
3890 Hamlin 32°53' 100°08' LRP 68 1910 1994
3941 Harleton 32°40' 94°34' ET 46 1949 1994
3943 Harlingen 26°12' 97°40' ST 82 1911 1994
3954 Harper 30°18' 99°15' EP 54 1909 1994
3972 Hart 34°22' 102°05' HP 42 1947 1994
3981 Hartley 35°53' 102°24' HP 48 1947 1994
3992 Haskell 33°10' 99°44' LRP 97 1897 1994
3994 Haskell 6 NW 33°14' 99°48' LRP 23 1941 1963
4020 Hawkins 1 E 32°35' 95°11' ET 47 1924 1994
4026 Hawley 32°38' 99°49' LRP 22 1973 1994
4033 Haynes Ranch 30°28' 98°25' EP 11 1948 1958
4058 Hebbronville 27°19' 98°41' ST 89 1905 1994
4076 Hemphill 31°21' 93°50' ET 26 1967 1992
4080 Hempstead 30°06' 96°05' ET 33 1946 1978
4081 Henderson 32°10' 94°48' ET 87 1908 1994
4088 Henly 30°12' 98°13' EP 18 1948 1965
4093 Henrietta 33°49' 98°12' NC 94 1897 1994
4098 Hereford 34°49' 102°24' HP 67 1905 1994
4122 Hewitt 1 SE 31°27' 97°11' NC 109 1879 1994
Appendix 3. Daily precipitation stations in Texas with at least 10 years of annual maxima data through 1994—Continued
Stationno.
Station name Latitude and longitudeClimaticregion
Years ofrecord
Beginning yearof record
Ending yearof record
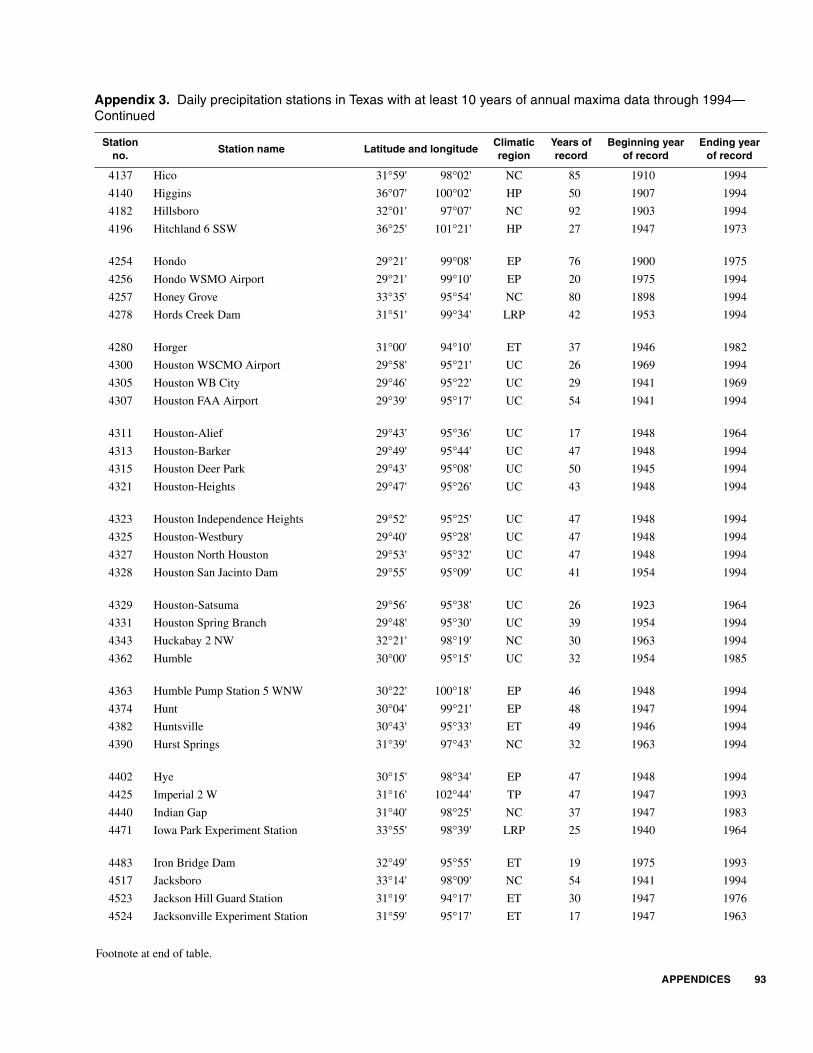
APPENDICES 93
Footnote at end of table.
4137 Hico 31°59' 98°02' NC 85 1910 1994
4140 Higgins 36°07' 100°02' HP 50 1907 1994
4182 Hillsboro 32°01' 97°07' NC 92 1903 1994
4196 Hitchland 6 SSW 36°25' 101°21' HP 27 1947 1973
4254 Hondo 29°21' 99°08' EP 76 1900 1975
4256 Hondo WSMO Airport 29°21' 99°10' EP 20 1975 1994
4257 Honey Grove 33°35' 95°54' NC 80 1898 1994
4278 Hords Creek Dam 31°51' 99°34' LRP 42 1953 1994
4280 Horger 31°00' 94°10' ET 37 1946 1982
4300 Houston WSCMO Airport 29°58' 95°21' UC 26 1969 1994
4305 Houston WB City 29°46' 95°22' UC 29 1941 1969
4307 Houston FAA Airport 29°39' 95°17' UC 54 1941 1994
4311 Houston-Alief 29°43' 95°36' UC 17 1948 1964
4313 Houston-Barker 29°49' 95°44' UC 47 1948 1994
4315 Houston Deer Park 29°43' 95°08' UC 50 1945 1994
4321 Houston-Heights 29°47' 95°26' UC 43 1948 1994
4323 Houston Independence Heights 29°52' 95°25' UC 47 1948 1994
4325 Houston-Westbury 29°40' 95°28' UC 47 1948 1994
4327 Houston North Houston 29°53' 95°32' UC 47 1948 1994
4328 Houston San Jacinto Dam 29°55' 95°09' UC 41 1954 1994
4329 Houston-Satsuma 29°56' 95°38' UC 26 1923 1964
4331 Houston Spring Branch 29°48' 95°30' UC 39 1954 1994
4343 Huckabay 2 NW 32°21' 98°19' NC 30 1963 1994
4362 Humble 30°00' 95°15' UC 32 1954 1985
4363 Humble Pump Station 5 WNW 30°22' 100°18' EP 46 1948 1994
4374 Hunt 30°04' 99°21' EP 48 1947 1994
4382 Huntsville 30°43' 95°33' ET 49 1946 1994
4390 Hurst Springs 31°39' 97°43' NC 32 1963 1994
4402 Hye 30°15' 98°34' EP 47 1948 1994
4425 Imperial 2 W 31°16' 102°44' TP 47 1947 1993
4440 Indian Gap 31°40' 98°25' NC 37 1947 1983
4471 Iowa Park Experiment Station 33°55' 98°39' LRP 25 1940 1964
4483 Iron Bridge Dam 32°49' 95°55' ET 19 1975 1993
4517 Jacksboro 33°14' 98°09' NC 54 1941 1994
4523 Jackson Hill Guard Station 31°19' 94°17' ET 30 1947 1976
4524 Jacksonville Experiment Station 31°59' 95°17' ET 17 1947 1963
Appendix 3. Daily precipitation stations in Texas with at least 10 years of annual maxima data through 1994—Continued
Stationno.
Station name Latitude and longitudeClimaticregion
Years ofrecord
Beginning yearof record
Ending yearof record
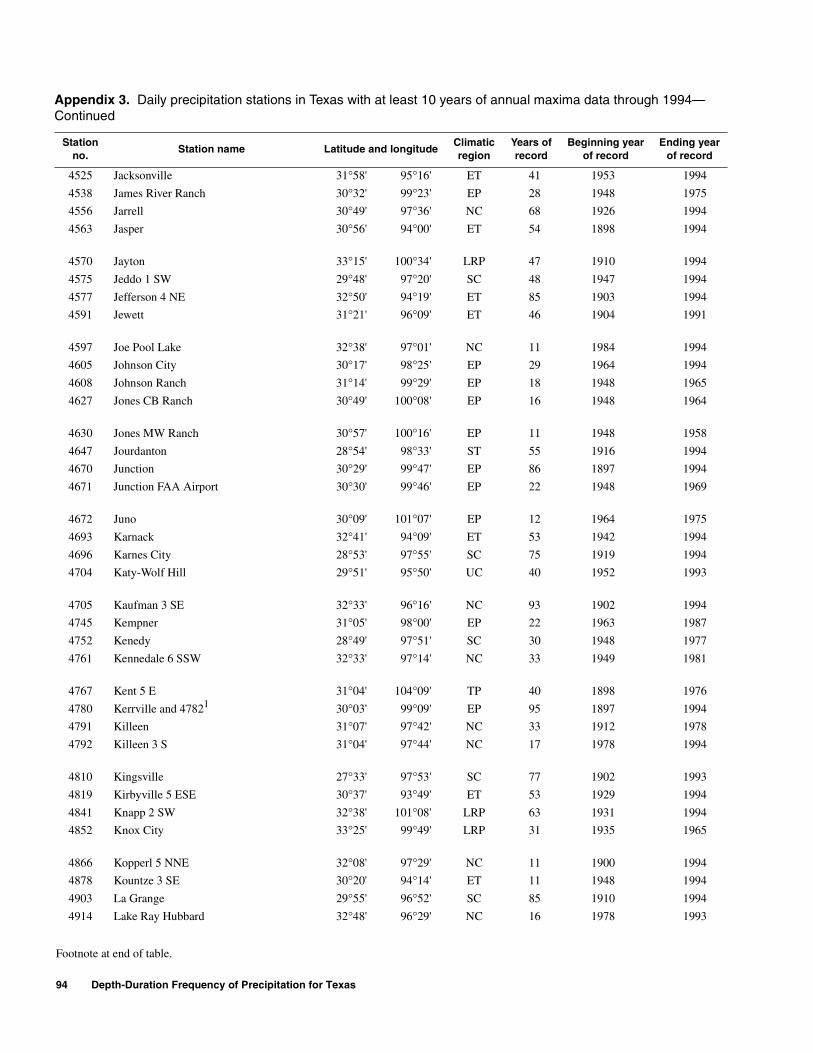
94 Depth-Duration Frequency of Precipitation for Texas
Footnote at end of table.
4525 Jacksonville 31°58' 95°16' ET 41 1953 1994
4538 James River Ranch 30°32' 99°23' EP 28 1948 1975
4556 Jarrell 30°49' 97°36' NC 68 1926 1994
4563 Jasper 30°56' 94°00' ET 54 1898 1994
4570 Jayton 33°15' 100°34' LRP 47 1910 1994
4575 Jeddo 1 SW 29°48' 97°20' SC 48 1947 1994
4577 Jefferson 4 NE 32°50' 94°19' ET 85 1903 1994
4591 Jewett 31°21' 96°09' ET 46 1904 1991
4597 Joe Pool Lake 32°38' 97°01' NC 11 1984 1994
4605 Johnson City 30°17' 98°25' EP 29 1964 1994
4608 Johnson Ranch 31°14' 99°29' EP 18 1948 1965
4627 Jones CB Ranch 30°49' 100°08' EP 16 1948 1964
4630 Jones MW Ranch 30°57' 100°16' EP 11 1948 1958
4647 Jourdanton 28°54' 98°33' ST 55 1916 1994
4670 Junction 30°29' 99°47' EP 86 1897 1994
4671 Junction FAA Airport 30°30' 99°46' EP 22 1948 1969
4672 Juno 30°09' 101°07' EP 12 1964 1975
4693 Karnack 32°41' 94°09' ET 53 1942 1994
4696 Karnes City 28°53' 97°55' SC 75 1919 1994
4704 Katy-Wolf Hill 29°51' 95°50' UC 40 1952 1993
4705 Kaufman 3 SE 32°33' 96°16' NC 93 1902 1994
4745 Kempner 31°05' 98°00' EP 22 1963 1987
4752 Kenedy 28°49' 97°51' SC 30 1948 1977
4761 Kennedale 6 SSW 32°33' 97°14' NC 33 1949 1981
4767 Kent 5 E 31°04' 104°09' TP 40 1898 1976
4780 Kerrville and 47821 30°03' 99°09' EP 95 1897 1994
4791 Killeen 31°07' 97°42' NC 33 1912 1978
4792 Killeen 3 S 31°04' 97°44' NC 17 1978 1994
4810 Kingsville 27°33' 97°53' SC 77 1902 1993
4819 Kirbyville 5 ESE 30°37' 93°49' ET 53 1929 1994
4841 Knapp 2 SW 32°38' 101°08' LRP 63 1931 1994
4852 Knox City 33°25' 99°49' LRP 31 1935 1965
4866 Kopperl 5 NNE 32°08' 97°29' NC 11 1900 1994
4878 Kountze 3 SE 30°20' 94°14' ET 11 1948 1994
4903 La Grange 29°55' 96°52' SC 85 1910 1994
4914 Lake Ray Hubbard 32°48' 96°29' NC 16 1978 1993
Appendix 3. Daily precipitation stations in Texas with at least 10 years of annual maxima data through 1994—Continued
Stationno.
Station name Latitude and longitudeClimaticregion
Years ofrecord
Beginning yearof record
Ending yearof record
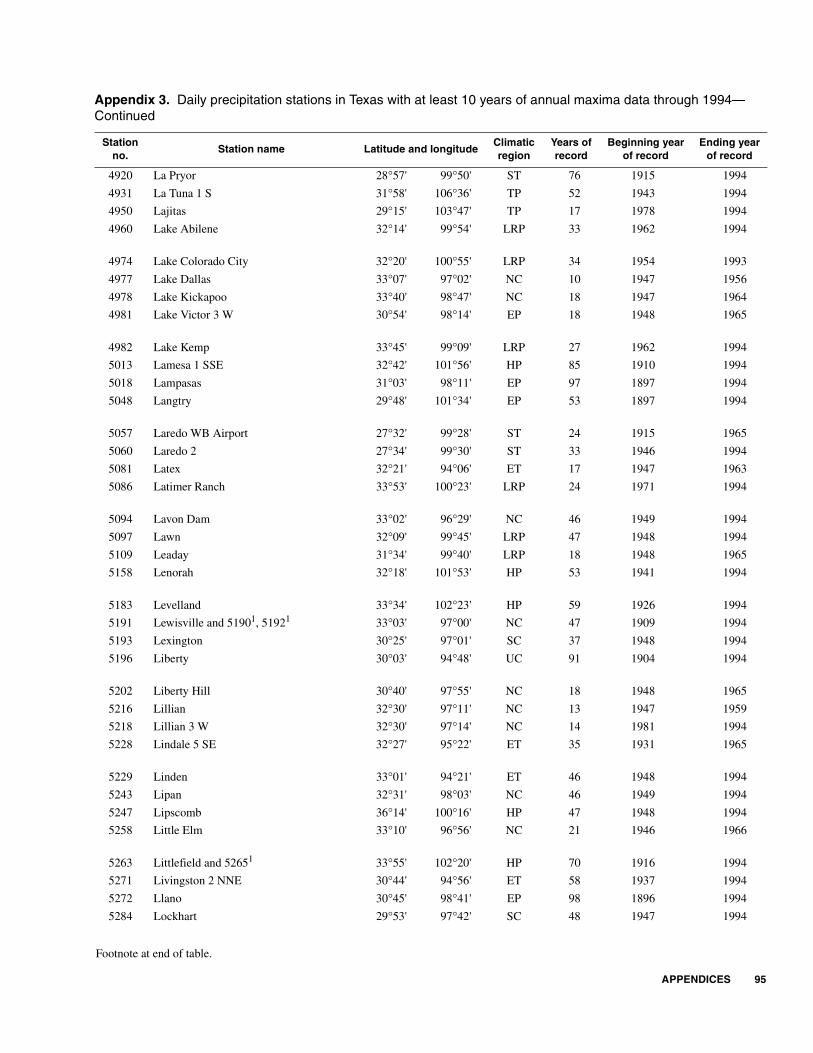
APPENDICES 95
Footnote at end of table.
4920 La Pryor 28°57' 99°50' ST 76 1915 1994
4931 La Tuna 1 S 31°58' 106°36' TP 52 1943 1994
4950 Lajitas 29°15' 103°47' TP 17 1978 1994
4960 Lake Abilene 32°14' 99°54' LRP 33 1962 1994
4974 Lake Colorado City 32°20' 100°55' LRP 34 1954 1993
4977 Lake Dallas 33°07' 97°02' NC 10 1947 1956
4978 Lake Kickapoo 33°40' 98°47' NC 18 1947 1964
4981 Lake Victor 3 W 30°54' 98°14' EP 18 1948 1965
4982 Lake Kemp 33°45' 99°09' LRP 27 1962 1994
5013 Lamesa 1 SSE 32°42' 101°56' HP 85 1910 1994
5018 Lampasas 31°03' 98°11' EP 97 1897 1994
5048 Langtry 29°48' 101°34' EP 53 1897 1994
5057 Laredo WB Airport 27°32' 99°28' ST 24 1915 1965
5060 Laredo 2 27°34' 99°30' ST 33 1946 1994
5081 Latex 32°21' 94°06' ET 17 1947 1963
5086 Latimer Ranch 33°53' 100°23' LRP 24 1971 1994
5094 Lavon Dam 33°02' 96°29' NC 46 1949 1994
5097 Lawn 32°09' 99°45' LRP 47 1948 1994
5109 Leaday 31°34' 99°40' LRP 18 1948 1965
5158 Lenorah 32°18' 101°53' HP 53 1941 1994
5183 Levelland 33°34' 102°23' HP 59 1926 1994
5191 Lewisville and 51901, 51921 33°03' 97°00' NC 47 1909 1994
5193 Lexington 30°25' 97°01' SC 37 1948 1994
5196 Liberty 30°03' 94°48' UC 91 1904 1994
5202 Liberty Hill 30°40' 97°55' NC 18 1948 1965
5216 Lillian 32°30' 97°11' NC 13 1947 1959
5218 Lillian 3 W 32°30' 97°14' NC 14 1981 1994
5228 Lindale 5 SE 32°27' 95°22' ET 35 1931 1965
5229 Linden 33°01' 94°21' ET 46 1948 1994
5243 Lipan 32°31' 98°03' NC 46 1949 1994
5247 Lipscomb 36°14' 100°16' HP 47 1948 1994
5258 Little Elm 33°10' 96°56' NC 21 1946 1966
5263 Littlefield and 52651 33°55' 102°20' HP 70 1916 1994
5271 Livingston 2 NNE 30°44' 94°56' ET 58 1937 1994
5272 Llano 30°45' 98°41' EP 98 1896 1994
5284 Lockhart 29°53' 97°42' SC 48 1947 1994
Appendix 3. Daily precipitation stations in Texas with at least 10 years of annual maxima data through 1994—Continued
Stationno.
Station name Latitude and longitudeClimaticregion
Years ofrecord
Beginning yearof record
Ending yearof record
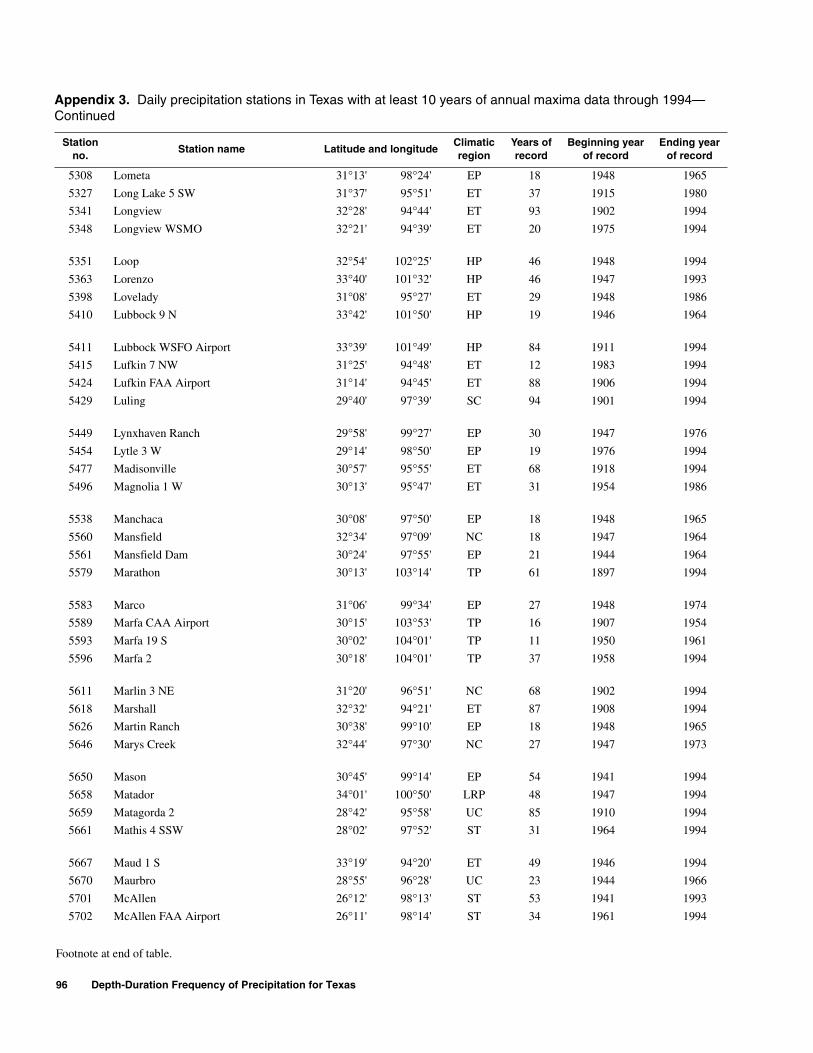
96 Depth-Duration Frequency of Precipitation for Texas
Footnote at end of table.
5308 Lometa 31°13' 98°24' EP 18 1948 1965
5327 Long Lake 5 SW 31°37' 95°51' ET 37 1915 1980
5341 Longview 32°28' 94°44' ET 93 1902 1994
5348 Longview WSMO 32°21' 94°39' ET 20 1975 1994
5351 Loop 32°54' 102°25' HP 46 1948 1994
5363 Lorenzo 33°40' 101°32' HP 46 1947 1993
5398 Lovelady 31°08' 95°27' ET 29 1948 1986
5410 Lubbock 9 N 33°42' 101°50' HP 19 1946 1964
5411 Lubbock WSFO Airport 33°39' 101°49' HP 84 1911 1994
5415 Lufkin 7 NW 31°25' 94°48' ET 12 1983 1994
5424 Lufkin FAA Airport 31°14' 94°45' ET 88 1906 1994
5429 Luling 29°40' 97°39' SC 94 1901 1994
5449 Lynxhaven Ranch 29°58' 99°27' EP 30 1947 1976
5454 Lytle 3 W 29°14' 98°50' EP 19 1976 1994
5477 Madisonville 30°57' 95°55' ET 68 1918 1994
5496 Magnolia 1 W 30°13' 95°47' ET 31 1954 1986
5538 Manchaca 30°08' 97°50' EP 18 1948 1965
5560 Mansfield 32°34' 97°09' NC 18 1947 1964
5561 Mansfield Dam 30°24' 97°55' EP 21 1944 1964
5579 Marathon 30°13' 103°14' TP 61 1897 1994
5583 Marco 31°06' 99°34' EP 27 1948 1974
5589 Marfa CAA Airport 30°15' 103°53' TP 16 1907 1954
5593 Marfa 19 S 30°02' 104°01' TP 11 1950 1961
5596 Marfa 2 30°18' 104°01' TP 37 1958 1994
5611 Marlin 3 NE 31°20' 96°51' NC 68 1902 1994
5618 Marshall 32°32' 94°21' ET 87 1908 1994
5626 Martin Ranch 30°38' 99°10' EP 18 1948 1965
5646 Marys Creek 32°44' 97°30' NC 27 1947 1973
5650 Mason 30°45' 99°14' EP 54 1941 1994
5658 Matador 34°01' 100°50' LRP 48 1947 1994
5659 Matagorda 2 28°42' 95°58' UC 85 1910 1994
5661 Mathis 4 SSW 28°02' 97°52' ST 31 1964 1994
5667 Maud 1 S 33°19' 94°20' ET 49 1946 1994
5670 Maurbro 28°55' 96°28' UC 23 1944 1966
5701 McAllen 26°12' 98°13' ST 53 1941 1993
5702 McAllen FAA Airport 26°11' 98°14' ST 34 1961 1994
Appendix 3. Daily precipitation stations in Texas with at least 10 years of annual maxima data through 1994—Continued
Stationno.
Station name Latitude and longitudeClimaticregion
Years ofrecord
Beginning yearof record
Ending yearof record
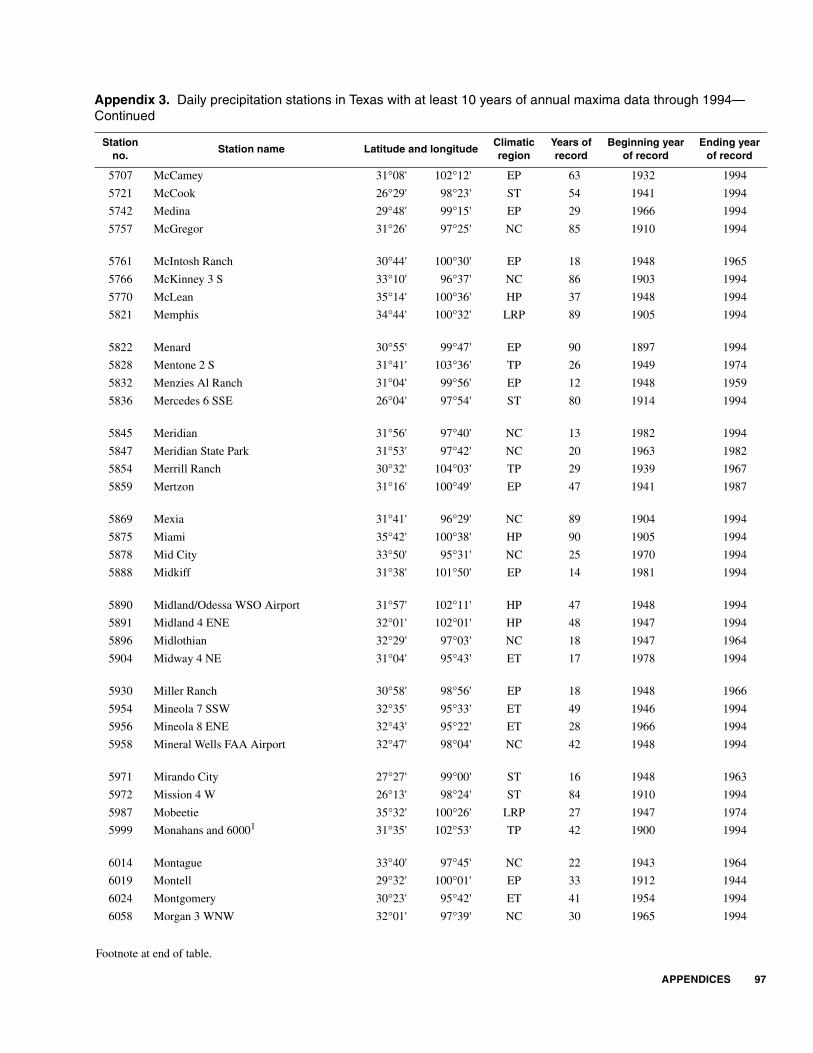
APPENDICES 97
Footnote at end of table.
5707 McCamey 31°08' 102°12' EP 63 1932 1994
5721 McCook 26°29' 98°23' ST 54 1941 1994
5742 Medina 29°48' 99°15' EP 29 1966 1994
5757 McGregor 31°26' 97°25' NC 85 1910 1994
5761 McIntosh Ranch 30°44' 100°30' EP 18 1948 1965
5766 McKinney 3 S 33°10' 96°37' NC 86 1903 1994
5770 McLean 35°14' 100°36' HP 37 1948 1994
5821 Memphis 34°44' 100°32' LRP 89 1905 1994
5822 Menard 30°55' 99°47' EP 90 1897 1994
5828 Mentone 2 S 31°41' 103°36' TP 26 1949 1974
5832 Menzies Al Ranch 31°04' 99°56' EP 12 1948 1959
5836 Mercedes 6 SSE 26°04' 97°54' ST 80 1914 1994
5845 Meridian 31°56' 97°40' NC 13 1982 1994
5847 Meridian State Park 31°53' 97°42' NC 20 1963 1982
5854 Merrill Ranch 30°32' 104°03' TP 29 1939 1967
5859 Mertzon 31°16' 100°49' EP 47 1941 1987
5869 Mexia 31°41' 96°29' NC 89 1904 1994
5875 Miami 35°42' 100°38' HP 90 1905 1994
5878 Mid City 33°50' 95°31' NC 25 1970 1994
5888 Midkiff 31°38' 101°50' EP 14 1981 1994
5890 Midland/Odessa WSO Airport 31°57' 102°11' HP 47 1948 1994
5891 Midland 4 ENE 32°01' 102°01' HP 48 1947 1994
5896 Midlothian 32°29' 97°03' NC 18 1947 1964
5904 Midway 4 NE 31°04' 95°43' ET 17 1978 1994
5930 Miller Ranch 30°58' 98°56' EP 18 1948 1966
5954 Mineola 7 SSW 32°35' 95°33' ET 49 1946 1994
5956 Mineola 8 ENE 32°43' 95°22' ET 28 1966 1994
5958 Mineral Wells FAA Airport 32°47' 98°04' NC 42 1948 1994
5971 Mirando City 27°27' 99°00' ST 16 1948 1963
5972 Mission 4 W 26°13' 98°24' ST 84 1910 1994
5987 Mobeetie 35°32' 100°26' LRP 27 1947 1974
5999 Monahans and 60001 31°35' 102°53' TP 42 1900 1994
6014 Montague 33°40' 97°45' NC 22 1943 1964
6019 Montell 29°32' 100°01' EP 33 1912 1944
6024 Montgomery 30°23' 95°42' ET 41 1954 1994
6058 Morgan 3 WNW 32°01' 97°39' NC 30 1965 1994
Appendix 3. Daily precipitation stations in Texas with at least 10 years of annual maxima data through 1994—Continued
Stationno.
Station name Latitude and longitudeClimaticregion
Years ofrecord
Beginning yearof record
Ending yearof record
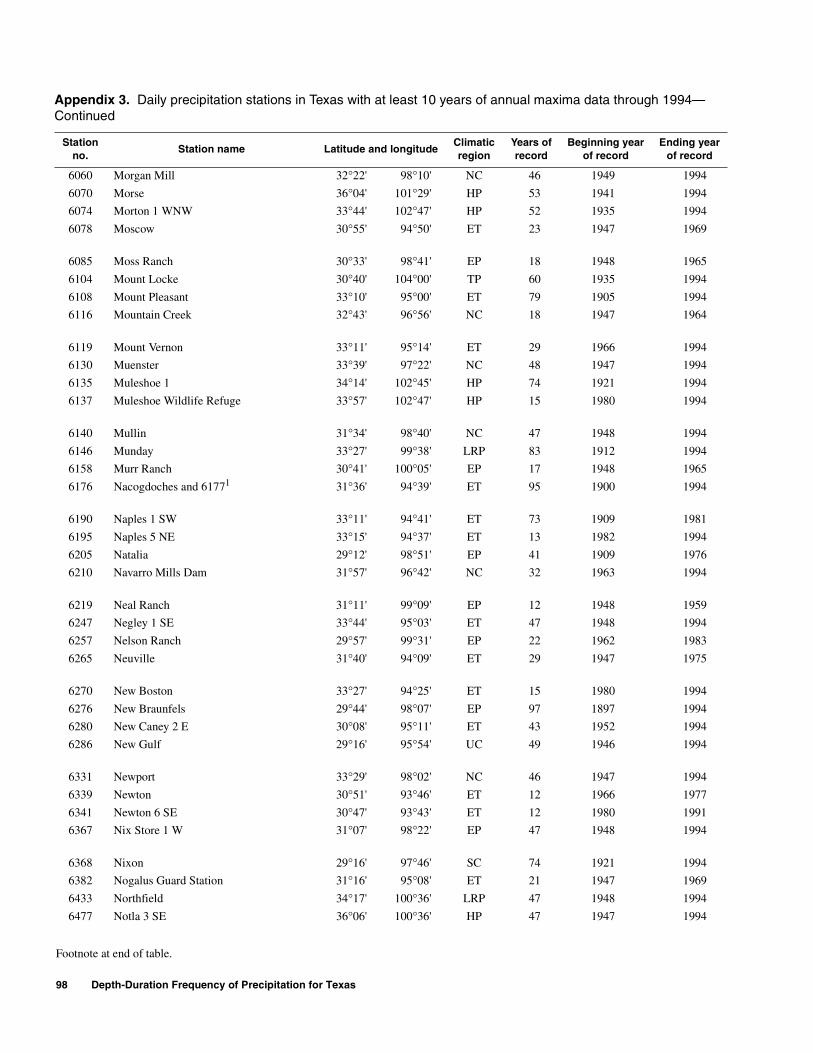
98 Depth-Duration Frequency of Precipitation for Texas
Footnote at end of table.
6060 Morgan Mill 32°22' 98°10' NC 46 1949 1994
6070 Morse 36°04' 101°29' HP 53 1941 1994
6074 Morton 1 WNW 33°44' 102°47' HP 52 1935 1994
6078 Moscow 30°55' 94°50' ET 23 1947 1969
6085 Moss Ranch 30°33' 98°41' EP 18 1948 1965
6104 Mount Locke 30°40' 104°00' TP 60 1935 1994
6108 Mount Pleasant 33°10' 95°00' ET 79 1905 1994
6116 Mountain Creek 32°43' 96°56' NC 18 1947 1964
6119 Mount Vernon 33°11' 95°14' ET 29 1966 1994
6130 Muenster 33°39' 97°22' NC 48 1947 1994
6135 Muleshoe 1 34°14' 102°45' HP 74 1921 1994
6137 Muleshoe Wildlife Refuge 33°57' 102°47' HP 15 1980 1994
6140 Mullin 31°34' 98°40' NC 47 1948 1994
6146 Munday 33°27' 99°38' LRP 83 1912 1994
6158 Murr Ranch 30°41' 100°05' EP 17 1948 1965
6176 Nacogdoches and 61771 31°36' 94°39' ET 95 1900 1994
6190 Naples 1 SW 33°11' 94°41' ET 73 1909 1981
6195 Naples 5 NE 33°15' 94°37' ET 13 1982 1994
6205 Natalia 29°12' 98°51' EP 41 1909 1976
6210 Navarro Mills Dam 31°57' 96°42' NC 32 1963 1994
6219 Neal Ranch 31°11' 99°09' EP 12 1948 1959
6247 Negley 1 SE 33°44' 95°03' ET 47 1948 1994
6257 Nelson Ranch 29°57' 99°31' EP 22 1962 1983
6265 Neuville 31°40' 94°09' ET 29 1947 1975
6270 New Boston 33°27' 94°25' ET 15 1980 1994
6276 New Braunfels 29°44' 98°07' EP 97 1897 1994
6280 New Caney 2 E 30°08' 95°11' ET 43 1952 1994
6286 New Gulf 29°16' 95°54' UC 49 1946 1994
6331 Newport 33°29' 98°02' NC 46 1947 1994
6339 Newton 30°51' 93°46' ET 12 1966 1977
6341 Newton 6 SE 30°47' 93°43' ET 12 1980 1991
6367 Nix Store 1 W 31°07' 98°22' EP 47 1948 1994
6368 Nixon 29°16' 97°46' SC 74 1921 1994
6382 Nogalus Guard Station 31°16' 95°08' ET 21 1947 1969
6433 Northfield 34°17' 100°36' LRP 47 1948 1994
6477 Notla 3 SE 36°06' 100°36' HP 47 1947 1994
Appendix 3. Daily precipitation stations in Texas with at least 10 years of annual maxima data through 1994—Continued
Stationno.
Station name Latitude and longitudeClimaticregion
Years ofrecord
Beginning yearof record
Ending yearof record

APPENDICES 99
Footnote at end of table.
6484 Novice 1 E 31°59' 99°37' LRP 26 1948 1973
6494 Nugent 1 ESE 32°41' 99°40' LRP 30 1943 1972
6495 Oak Creek Lake 32°03' 100°18' EP 33 1962 1994
6496 Oakwood 2 NNE 31°37' 95°51' ET 15 1980 1994
6499 O.C. Fisher Dam 31°28' 100°29' EP 20 1975 1994
6502 Odessa 31°53' 102°24' TP 45 1950 1994
6636 Olney 33°22' 98°46' NC 39 1956 1994
6641 Olney 5 NNW 33°26' 98°47' NC 54 1941 1994
6644 Olton 34°11' 102°08' HP 53 1928 1994
6664 Orange 4 NW 30°07' 93°47' UC 60 1905 1994
6722 Overton 32°16' 94°59' ET 45 1943 1987
6734 Ozona 2 SSW 30°41' 101°20' EP 47 1948 1994
6740 Paducah and 67431 34°01' 100°18' LRP 81 1913 1994
6742 Paducah 15 S 33°48' 100°17' LRP 24 1971 1994
6747 Paint Rock 31°30' 99°55' EP 77 1918 1994
6750 Palacios FAA Airport 28°43' 96°15' UC 52 1943 1994
6757 Palestine 2 NE 31°47' 95°36' ET 63 1930 1994
6766 Palo Pinto 32°46' 98°19' NC 46 1949 1994
6775 Pampa and 67761 35°32' 100°58' HP 71 1908 1994
6780 Pandale 2 NE 30°12' 101°33' EP 49 1909 1994
6781 Pandale 11 NE 30°16' 101°27' EP 13 1982 1994
6785 Panhandle 35°21' 101°23' HP 70 1911 1993
6790 Panter 32°20' 97°52' NC 17 1901 1917
6792 Panther Junction 29°19' 103°13' TP 40 1955 1994
6794 Paris 33°40' 95°34' NC 94 1896 1994
6879 Pearsall 28°53' 99°05' ST 90 1902 1994
6892 Pecos 31°25' 103°30' TP 66 1904 1994
6932 Penwell 31°44' 102°35' TP 40 1955 1994
6950 Perryton 5 NNE 36°28' 100°47' HP 84 1907 1994
6952 Perryton 21 S 36°06' 100°49' HP 17 1978 1994
6953 Perryton 11 WNW 36°27' 101°00' HP 48 1947 1994
6959 Persimmon Gap 29°40' 103°10' TP 16 1952 1994
6992 Pflugerville 30°26' 97°37' EP 18 1948 1965
7020 Pierce 1 E 29°14' 96°11' UC 91 1904 1994
7028 Pilot Point 33°23' 96°58' NC 47 1947 1994
7040 Pineland 31°15' 93°58' ET 18 1965 1994
Appendix 3. Daily precipitation stations in Texas with at least 10 years of annual maxima data through 1994—Continued
Stationno.
Station name Latitude and longitudeClimaticregion
Years ofrecord
Beginning yearof record
Ending yearof record
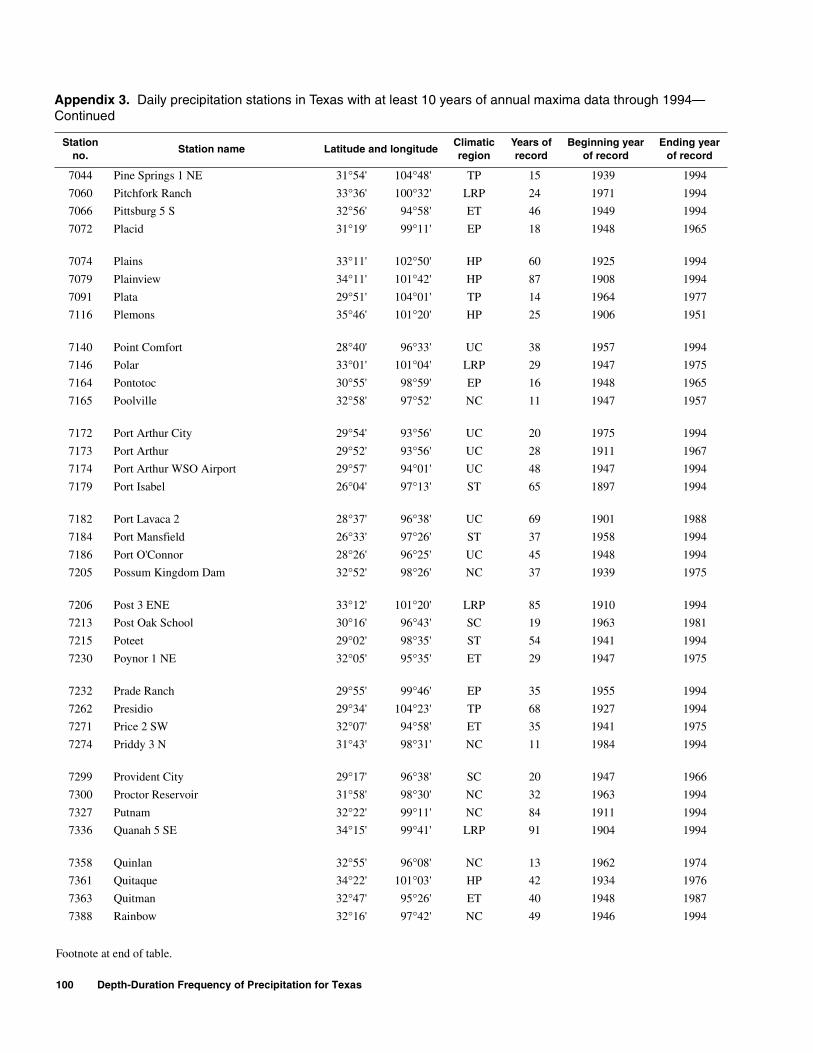
100 Depth-Duration Frequency of Precipitation for Texas
Footnote at end of table.
7044 Pine Springs 1 NE 31°54' 104°48' TP 15 1939 1994
7060 Pitchfork Ranch 33°36' 100°32' LRP 24 1971 1994
7066 Pittsburg 5 S 32°56' 94°58' ET 46 1949 1994
7072 Placid 31°19' 99°11' EP 18 1948 1965
7074 Plains 33°11' 102°50' HP 60 1925 1994
7079 Plainview 34°11' 101°42' HP 87 1908 1994
7091 Plata 29°51' 104°01' TP 14 1964 1977
7116 Plemons 35°46' 101°20' HP 25 1906 1951
7140 Point Comfort 28°40' 96°33' UC 38 1957 1994
7146 Polar 33°01' 101°04' LRP 29 1947 1975
7164 Pontotoc 30°55' 98°59' EP 16 1948 1965
7165 Poolville 32°58' 97°52' NC 11 1947 1957
7172 Port Arthur City 29°54' 93°56' UC 20 1975 1994
7173 Port Arthur 29°52' 93°56' UC 28 1911 1967
7174 Port Arthur WSO Airport 29°57' 94°01' UC 48 1947 1994
7179 Port Isabel 26°04' 97°13' ST 65 1897 1994
7182 Port Lavaca 2 28°37' 96°38' UC 69 1901 1988
7184 Port Mansfield 26°33' 97°26' ST 37 1958 1994
7186 Port O'Connor 28°26' 96°25' UC 45 1948 1994
7205 Possum Kingdom Dam 32°52' 98°26' NC 37 1939 1975
7206 Post 3 ENE 33°12' 101°20' LRP 85 1910 1994
7213 Post Oak School 30°16' 96°43' SC 19 1963 1981
7215 Poteet 29°02' 98°35' ST 54 1941 1994
7230 Poynor 1 NE 32°05' 95°35' ET 29 1947 1975
7232 Prade Ranch 29°55' 99°46' EP 35 1955 1994
7262 Presidio 29°34' 104°23' TP 68 1927 1994
7271 Price 2 SW 32°07' 94°58' ET 35 1941 1975
7274 Priddy 3 N 31°43' 98°31' NC 11 1984 1994
7299 Provident City 29°17' 96°38' SC 20 1947 1966
7300 Proctor Reservoir 31°58' 98°30' NC 32 1963 1994
7327 Putnam 32°22' 99°11' NC 84 1911 1994
7336 Quanah 5 SE 34°15' 99°41' LRP 91 1904 1994
7358 Quinlan 32°55' 96°08' NC 13 1962 1974
7361 Quitaque 34°22' 101°03' HP 42 1934 1976
7363 Quitman 32°47' 95°26' ET 40 1948 1987
7388 Rainbow 32°16' 97°42' NC 49 1946 1994
Appendix 3. Daily precipitation stations in Texas with at least 10 years of annual maxima data through 1994—Continued
Stationno.
Station name Latitude and longitudeClimaticregion
Years ofrecord
Beginning yearof record
Ending yearof record
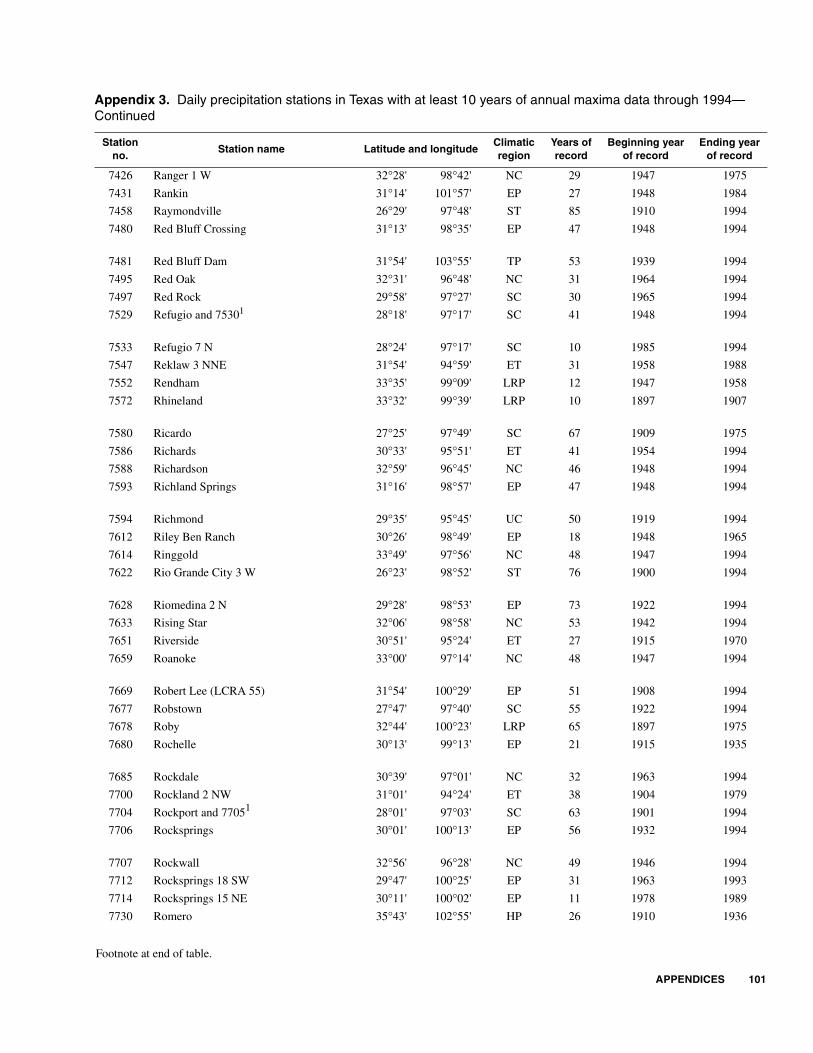
APPENDICES 101
Footnote at end of table.
7426 Ranger 1 W 32°28' 98°42' NC 29 1947 1975
7431 Rankin 31°14' 101°57' EP 27 1948 1984
7458 Raymondville 26°29' 97°48' ST 85 1910 1994
7480 Red Bluff Crossing 31°13' 98°35' EP 47 1948 1994
7481 Red Bluff Dam 31°54' 103°55' TP 53 1939 1994
7495 Red Oak 32°31' 96°48' NC 31 1964 1994
7497 Red Rock 29°58' 97°27' SC 30 1965 1994
7529 Refugio and 75301 28°18' 97°17' SC 41 1948 1994
7533 Refugio 7 N 28°24' 97°17' SC 10 1985 1994
7547 Reklaw 3 NNE 31°54' 94°59' ET 31 1958 1988
7552 Rendham 33°35' 99°09' LRP 12 1947 1958
7572 Rhineland 33°32' 99°39' LRP 10 1897 1907
7580 Ricardo 27°25' 97°49' SC 67 1909 1975
7586 Richards 30°33' 95°51' ET 41 1954 1994
7588 Richardson 32°59' 96°45' NC 46 1948 1994
7593 Richland Springs 31°16' 98°57' EP 47 1948 1994
7594 Richmond 29°35' 95°45' UC 50 1919 1994
7612 Riley Ben Ranch 30°26' 98°49' EP 18 1948 1965
7614 Ringgold 33°49' 97°56' NC 48 1947 1994
7622 Rio Grande City 3 W 26°23' 98°52' ST 76 1900 1994
7628 Riomedina 2 N 29°28' 98°53' EP 73 1922 1994
7633 Rising Star 32°06' 98°58' NC 53 1942 1994
7651 Riverside 30°51' 95°24' ET 27 1915 1970
7659 Roanoke 33°00' 97°14' NC 48 1947 1994
7669 Robert Lee (LCRA 55) 31°54' 100°29' EP 51 1908 1994
7677 Robstown 27°47' 97°40' SC 55 1922 1994
7678 Roby 32°44' 100°23' LRP 65 1897 1975
7680 Rochelle 30°13' 99°13' EP 21 1915 1935
7685 Rockdale 30°39' 97°01' NC 32 1963 1994
7700 Rockland 2 NW 31°01' 94°24' ET 38 1904 1979
7704 Rockport and 77051 28°01' 97°03' SC 63 1901 1994
7706 Rocksprings 30°01' 100°13' EP 56 1932 1994
7707 Rockwall 32°56' 96°28' NC 49 1946 1994
7712 Rocksprings 18 SW 29°47' 100°25' EP 31 1963 1993
7714 Rocksprings 15 NE 30°11' 100°02' EP 11 1978 1989
7730 Romero 35°43' 102°55' HP 26 1910 1936
Appendix 3. Daily precipitation stations in Texas with at least 10 years of annual maxima data through 1994—Continued
Stationno.
Station name Latitude and longitudeClimaticregion
Years ofrecord
Beginning yearof record
Ending yearof record
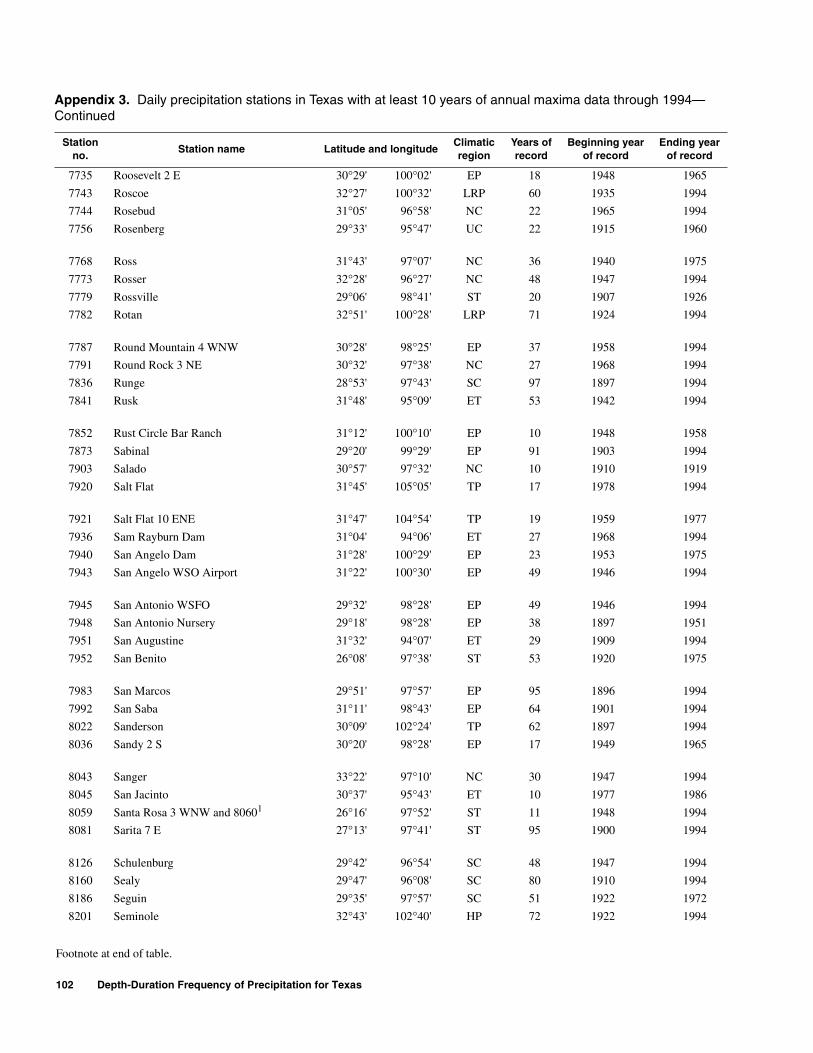
102 Depth-Duration Frequency of Precipitation for Texas
Footnote at end of table.
7735 Roosevelt 2 E 30°29' 100°02' EP 18 1948 1965
7743 Roscoe 32°27' 100°32' LRP 60 1935 1994
7744 Rosebud 31°05' 96°58' NC 22 1965 1994
7756 Rosenberg 29°33' 95°47' UC 22 1915 1960
7768 Ross 31°43' 97°07' NC 36 1940 1975
7773 Rosser 32°28' 96°27' NC 48 1947 1994
7779 Rossville 29°06' 98°41' ST 20 1907 1926
7782 Rotan 32°51' 100°28' LRP 71 1924 1994
7787 Round Mountain 4 WNW 30°28' 98°25' EP 37 1958 1994
7791 Round Rock 3 NE 30°32' 97°38' NC 27 1968 1994
7836 Runge 28°53' 97°43' SC 97 1897 1994
7841 Rusk 31°48' 95°09' ET 53 1942 1994
7852 Rust Circle Bar Ranch 31°12' 100°10' EP 10 1948 1958
7873 Sabinal 29°20' 99°29' EP 91 1903 1994
7903 Salado 30°57' 97°32' NC 10 1910 1919
7920 Salt Flat 31°45' 105°05' TP 17 1978 1994
7921 Salt Flat 10 ENE 31°47' 104°54' TP 19 1959 1977
7936 Sam Rayburn Dam 31°04' 94°06' ET 27 1968 1994
7940 San Angelo Dam 31°28' 100°29' EP 23 1953 1975
7943 San Angelo WSO Airport 31°22' 100°30' EP 49 1946 1994
7945 San Antonio WSFO 29°32' 98°28' EP 49 1946 1994
7948 San Antonio Nursery 29°18' 98°28' EP 38 1897 1951
7951 San Augustine 31°32' 94°07' ET 29 1909 1994
7952 San Benito 26°08' 97°38' ST 53 1920 1975
7983 San Marcos 29°51' 97°57' EP 95 1896 1994
7992 San Saba 31°11' 98°43' EP 64 1901 1994
8022 Sanderson 30°09' 102°24' TP 62 1897 1994
8036 Sandy 2 S 30°20' 98°28' EP 17 1949 1965
8043 Sanger 33°22' 97°10' NC 30 1947 1994
8045 San Jacinto 30°37' 95°43' ET 10 1977 1986
8059 Santa Rosa 3 WNW and 80601 26°16' 97°52' ST 11 1948 1994
8081 Sarita 7 E 27°13' 97°41' ST 95 1900 1994
8126 Schulenburg 29°42' 96°54' SC 48 1947 1994
8160 Sealy 29°47' 96°08' SC 80 1910 1994
8186 Seguin 29°35' 97°57' SC 51 1922 1972
8201 Seminole 32°43' 102°40' HP 72 1922 1994
Appendix 3. Daily precipitation stations in Texas with at least 10 years of annual maxima data through 1994—Continued
Stationno.
Station name Latitude and longitudeClimaticregion
Years ofrecord
Beginning yearof record
Ending yearof record

APPENDICES 103
Footnote at end of table.
8221 Seymour 33°36' 99°15' LRP 82 1905 1994
8235 Shamrock 35°12' 100°15' LRP 59 1929 1987
8236 Shamrock No. 2 35°13' 100°15' LRP 33 1962 1994
8252 Sheffield 30°42' 101°50' TP 39 1938 1994
8274 Sherman 33°38' 96°37' NC 95 1897 1994
8279 Sherwood 31°17' 100°48' EP 18 1948 1965
8305 Sierra Blanca 31°11' 105°21' TP 35 1948 1994
8323 Silverton 34°29' 101°19' HP 49 1946 1994
8326 Silver Valley 31°58' 99°34' LRP 22 1973 1994
8335 Simms 4 WNW 33°22' 94°34' ET 15 1948 1973
8354 Sinton 28°03' 97°30' SC 70 1921 1994
8373 Slaton 5 SE 33°22' 101°36' HP 46 1949 1994
8378 Slidell 33°21' 97°23' NC 48 1947 1994
8382 Sloan 31°09' 98°55' EP 41 1935 1975
8414 Smithsons Valley 29°49' 98°20' EP 10 1946 1955
8415 Smithville 30°01' 97°09' SC 77 1917 1994
8433 Snyder 32°43' 100°55' LRP 84 1911 1994
8435 Socorro 31°39' 106°17' TP 32 1918 1950
8445 Somerville 30°21' 96°31' SC 25 1908 1951
8446 Somerville Dam 30°20' 96°32' SC 31 1963 1994
8449 Sonora 30°34' 100°39' EP 61 1902 1994
8468 South Camp (6666) 33°30' 100°27' LRP 10 1971 1980
8519 Speaks 2 29°16' 96°42' SC 27 1967 1994
8523 Spearman 36°11' 101°11' HP 75 1920 1994
8531 Spicewood 1 S 30°27' 98°10' EP 27 1968 1994
8536 Spinks Ranch 30°46' 99°50' EP 17 1948 1964
8544 Spring Branch 29°52' 98°24' EP 39 1956 1994
8561 Springtown 32°58' 97°40' NC 22 1957 1978
8566 Spur 33°29' 100°51' LRP 62 1911 1994
8568 Spurger Dam B 30°48' 94°11' ET 18 1953 1970
8583 Stamford 1 32°56' 99°47' LRP 79 1911 1994
8623 Stephenville WSMO 32°13' 98°11' NC 60 1918 1994
8628 Sterley 34°12' 101°24' HP 14 1947 1960
8630 Sterling City 31°51' 100°59' EP 69 1926 1994
8631 Sterling City 8 NE 31°55' 100°53' EP 21 1949 1994
8632 Sterling City 9 NW 31°54' 101°08' EP 12 1949 1960
Appendix 3. Daily precipitation stations in Texas with at least 10 years of annual maxima data through 1994—Continued
Stationno.
Station name Latitude and longitudeClimaticregion
Years ofrecord
Beginning yearof record
Ending yearof record
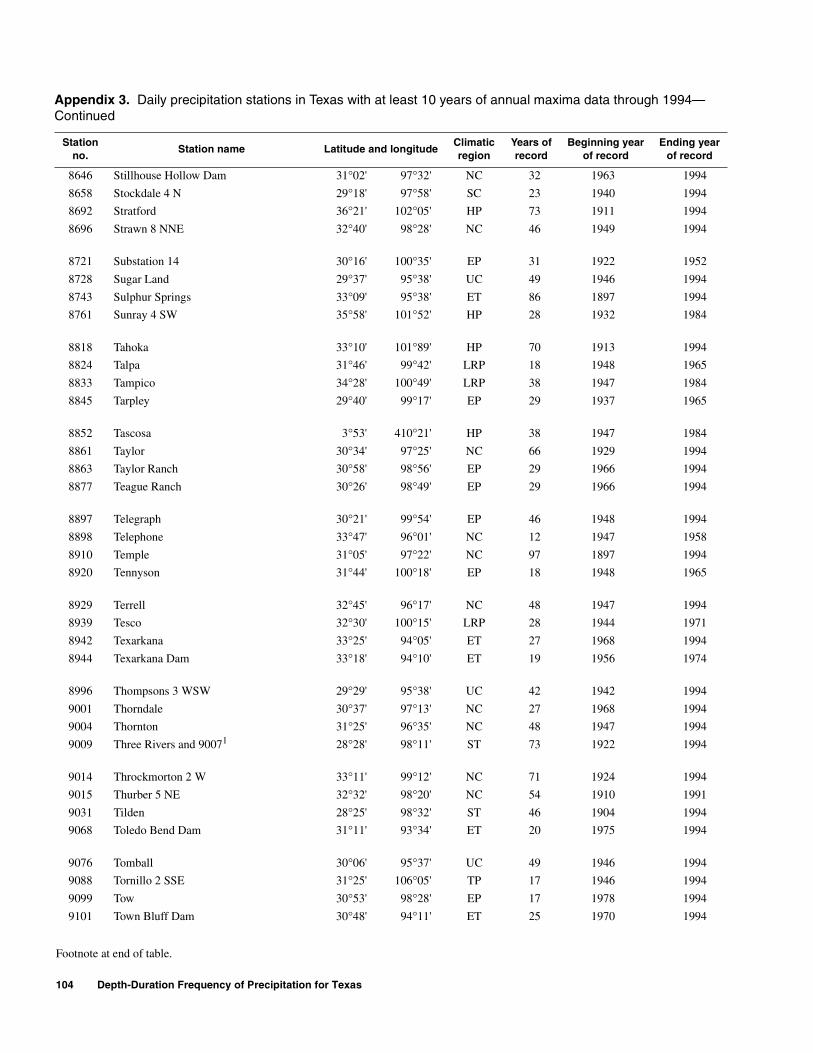
104 Depth-Duration Frequency of Precipitation for Texas
Footnote at end of table.
8646 Stillhouse Hollow Dam 31°02' 97°32' NC 32 1963 1994
8658 Stockdale 4 N 29°18' 97°58' SC 23 1940 1994
8692 Stratford 36°21' 102°05' HP 73 1911 1994
8696 Strawn 8 NNE 32°40' 98°28' NC 46 1949 1994
8721 Substation 14 30°16' 100°35' EP 31 1922 1952
8728 Sugar Land 29°37' 95°38' UC 49 1946 1994
8743 Sulphur Springs 33°09' 95°38' ET 86 1897 1994
8761 Sunray 4 SW 35°58' 101°52' HP 28 1932 1984
8818 Tahoka 33°10' 101°89' HP 70 1913 1994
8824 Talpa 31°46' 99°42' LRP 18 1948 1965
8833 Tampico 34°28' 100°49' LRP 38 1947 1984
8845 Tarpley 29°40' 99°17' EP 29 1937 1965
8852 Tascosa 3°53' 410°21' HP 38 1947 1984
8861 Taylor 30°34' 97°25' NC 66 1929 1994
8863 Taylor Ranch 30°58' 98°56' EP 29 1966 1994
8877 Teague Ranch 30°26' 98°49' EP 29 1966 1994
8897 Telegraph 30°21' 99°54' EP 46 1948 1994
8898 Telephone 33°47' 96°01' NC 12 1947 1958
8910 Temple 31°05' 97°22' NC 97 1897 1994
8920 Tennyson 31°44' 100°18' EP 18 1948 1965
8929 Terrell 32°45' 96°17' NC 48 1947 1994
8939 Tesco 32°30' 100°15' LRP 28 1944 1971
8942 Texarkana 33°25' 94°05' ET 27 1968 1994
8944 Texarkana Dam 33°18' 94°10' ET 19 1956 1974
8996 Thompsons 3 WSW 29°29' 95°38' UC 42 1942 1994
9001 Thorndale 30°37' 97°13' NC 27 1968 1994
9004 Thornton 31°25' 96°35' NC 48 1947 1994
9009 Three Rivers and 90071 28°28' 98°11' ST 73 1922 1994
9014 Throckmorton 2 W 33°11' 99°12' NC 71 1924 1994
9015 Thurber 5 NE 32°32' 98°20' NC 54 1910 1991
9031 Tilden 28°25' 98°32' ST 46 1904 1994
9068 Toledo Bend Dam 31°11' 93°34' ET 20 1975 1994
9076 Tomball 30°06' 95°37' UC 49 1946 1994
9088 Tornillo 2 SSE 31°25' 106°05' TP 17 1946 1994
9099 Tow 30°53' 98°28' EP 17 1978 1994
9101 Town Bluff Dam 30°48' 94°11' ET 25 1970 1994
Appendix 3. Daily precipitation stations in Texas with at least 10 years of annual maxima data through 1994—Continued
Stationno.
Station name Latitude and longitudeClimaticregion
Years ofrecord
Beginning yearof record
Ending yearof record
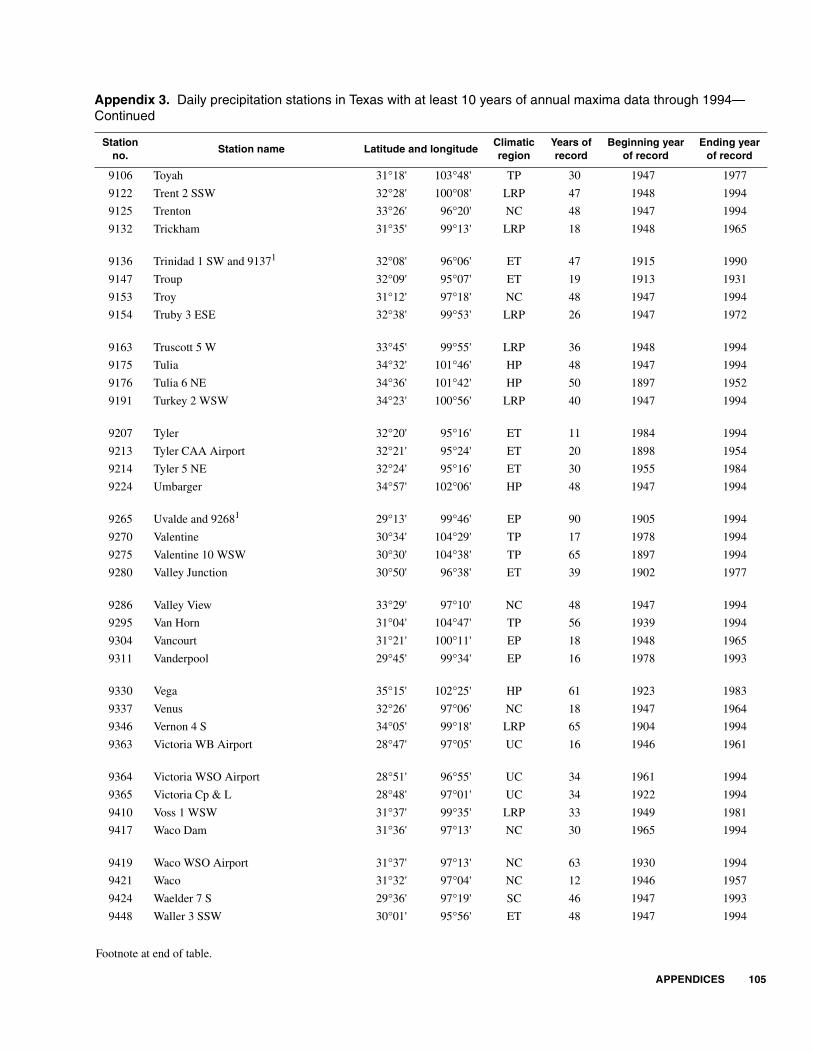
APPENDICES 105
Footnote at end of table.
9106 Toyah 31°18' 103°48' TP 30 1947 1977
9122 Trent 2 SSW 32°28' 100°08' LRP 47 1948 1994
9125 Trenton 33°26' 96°20' NC 48 1947 1994
9132 Trickham 31°35' 99°13' LRP 18 1948 1965
9136 Trinidad 1 SW and 91371 32°08' 96°06' ET 47 1915 1990
9147 Troup 32°09' 95°07' ET 19 1913 1931
9153 Troy 31°12' 97°18' NC 48 1947 1994
9154 Truby 3 ESE 32°38' 99°53' LRP 26 1947 1972
9163 Truscott 5 W 33°45' 99°55' LRP 36 1948 1994
9175 Tulia 34°32' 101°46' HP 48 1947 1994
9176 Tulia 6 NE 34°36' 101°42' HP 50 1897 1952
9191 Turkey 2 WSW 34°23' 100°56' LRP 40 1947 1994
9207 Tyler 32°20' 95°16' ET 11 1984 1994
9213 Tyler CAA Airport 32°21' 95°24' ET 20 1898 1954
9214 Tyler 5 NE 32°24' 95°16' ET 30 1955 1984
9224 Umbarger 34°57' 102°06' HP 48 1947 1994
9265 Uvalde and 92681 29°13' 99°46' EP 90 1905 1994
9270 Valentine 30°34' 104°29' TP 17 1978 1994
9275 Valentine 10 WSW 30°30' 104°38' TP 65 1897 1994
9280 Valley Junction 30°50' 96°38' ET 39 1902 1977
9286 Valley View 33°29' 97°10' NC 48 1947 1994
9295 Van Horn 31°04' 104°47' TP 56 1939 1994
9304 Vancourt 31°21' 100°11' EP 18 1948 1965
9311 Vanderpool 29°45' 99°34' EP 16 1978 1993
9330 Vega 35°15' 102°25' HP 61 1923 1983
9337 Venus 32°26' 97°06' NC 18 1947 1964
9346 Vernon 4 S 34°05' 99°18' LRP 65 1904 1994
9363 Victoria WB Airport 28°47' 97°05' UC 16 1946 1961
9364 Victoria WSO Airport 28°51' 96°55' UC 34 1961 1994
9365 Victoria Cp & L 28°48' 97°01' UC 34 1922 1994
9410 Voss 1 WSW 31°37' 99°35' LRP 33 1949 1981
9417 Waco Dam 31°36' 97°13' NC 30 1965 1994
9419 Waco WSO Airport 31°37' 97°13' NC 63 1930 1994
9421 Waco 31°32' 97°04' NC 12 1946 1957
9424 Waelder 7 S 29°36' 97°19' SC 46 1947 1993
9448 Waller 3 SSW 30°01' 95°56' ET 48 1947 1994
Appendix 3. Daily precipitation stations in Texas with at least 10 years of annual maxima data through 1994—Continued
Stationno.
Station name Latitude and longitudeClimaticregion
Years ofrecord
Beginning yearof record
Ending yearof record
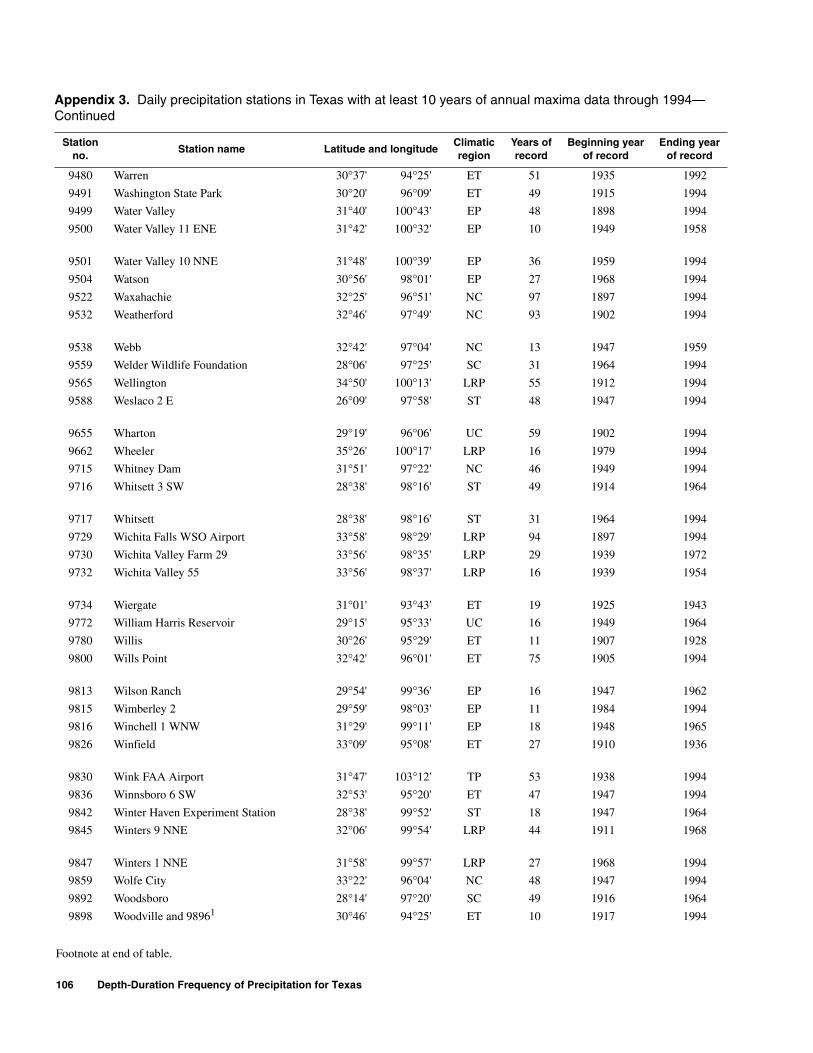
106 Depth-Duration Frequency of Precipitation for Texas
Footnote at end of table.
9480 Warren 30°37' 94°25' ET 51 1935 1992
9491 Washington State Park 30°20' 96°09' ET 49 1915 1994
9499 Water Valley 31°40' 100°43' EP 48 1898 1994
9500 Water Valley 11 ENE 31°42' 100°32' EP 10 1949 1958
9501 Water Valley 10 NNE 31°48' 100°39' EP 36 1959 1994
9504 Watson 30°56' 98°01' EP 27 1968 1994
9522 Waxahachie 32°25' 96°51' NC 97 1897 1994
9532 Weatherford 32°46' 97°49' NC 93 1902 1994
9538 Webb 32°42' 97°04' NC 13 1947 1959
9559 Welder Wildlife Foundation 28°06' 97°25' SC 31 1964 1994
9565 Wellington 34°50' 100°13' LRP 55 1912 1994
9588 Weslaco 2 E 26°09' 97°58' ST 48 1947 1994
9655 Wharton 29°19' 96°06' UC 59 1902 1994
9662 Wheeler 35°26' 100°17' LRP 16 1979 1994
9715 Whitney Dam 31°51' 97°22' NC 46 1949 1994
9716 Whitsett 3 SW 28°38' 98°16' ST 49 1914 1964
9717 Whitsett 28°38' 98°16' ST 31 1964 1994
9729 Wichita Falls WSO Airport 33°58' 98°29' LRP 94 1897 1994
9730 Wichita Valley Farm 29 33°56' 98°35' LRP 29 1939 1972
9732 Wichita Valley 55 33°56' 98°37' LRP 16 1939 1954
9734 Wiergate 31°01' 93°43' ET 19 1925 1943
9772 William Harris Reservoir 29°15' 95°33' UC 16 1949 1964
9780 Willis 30°26' 95°29' ET 11 1907 1928
9800 Wills Point 32°42' 96°01' ET 75 1905 1994
9813 Wilson Ranch 29°54' 99°36' EP 16 1947 1962
9815 Wimberley 2 29°59' 98°03' EP 11 1984 1994
9816 Winchell 1 WNW 31°29' 99°11' EP 18 1948 1965
9826 Winfield 33°09' 95°08' ET 27 1910 1936
9830 Wink FAA Airport 31°47' 103°12' TP 53 1938 1994
9836 Winnsboro 6 SW 32°53' 95°20' ET 47 1947 1994
9842 Winter Haven Experiment Station 28°38' 99°52' ST 18 1947 1964
9845 Winters 9 NNE 32°06' 99°54' LRP 44 1911 1968
9847 Winters 1 NNE 31°58' 99°57' LRP 27 1968 1994
9859 Wolfe City 33°22' 96°04' NC 48 1947 1994
9892 Woodsboro 28°14' 97°20' SC 49 1916 1964
9898 Woodville and 98961 30°46' 94°25' ET 10 1917 1994
Appendix 3. Daily precipitation stations in Texas with at least 10 years of annual maxima data through 1994—Continued
Stationno.
Station name Latitude and longitudeClimaticregion
Years ofrecord
Beginning yearof record
Ending yearof record
APPENDICES 107
Footnote at end of table.
1 The record of this station was considered auxiliary and therefore combined with the identified station in the table.
9916 Wright Patman Dam and Lake 33°18' 94°10' ET 21 1974 1994
9952 Yoakum 29°17' 97°08' SC 73 1917 1994
9953 Yorktown 28°59' 97°30' SC 48 1947 1994
9966 Ysleta 31°42' 106°19' TP 56 1939 1994
9976 Zapata 26°53' 99°18' ST 39 1909 1994
Appendix 3. Daily precipitation stations in Texas with at least 10 years of annual maxima data through 1994—Continued
Stationno.
Station name Latitude and longitudeClimaticregion
Years ofrecord
Beginning yearof record
Ending yearof record
Asquith— Depth-Duration Frequency of Precipitation for Texas —USGS WRIR 98–4044
District Chief U.S. Geological Survey 8011 Cameron, Rd.Austin, TX 78754–3898


