Depth Camera Based Customer Behaviour Analysis for...
77
Depth Camera Based Customer Behaviour Analysis for Retail Master’s Thesis University of Oulu Information Processing Science Faculty of Information Technology and Electrical Engineering Ville Huotari 19.10.2015
Transcript of Depth Camera Based Customer Behaviour Analysis for...
Depth Camera Based Customer Behaviour Analysis for Retail
Master’s Thesis
University of Oulu
Information Processing Science
Faculty of Information Technology and
Electrical Engineering
Ville Huotari
19.10.2015
2
Abstract
In 2000s traditional shop-based retailing has had to adapt to competition created by
internet-based e-commerce. As a distinction from traditional retail, e-commerce can
gather unprecedented amount of information about its customers and their behaviour.
To enable behaviour-based analysis in traditional retailing, the customers need to be
tracked reliably through the store. One such tracking technology is depth camera people
tracking system developed at VTT, Technical Research Centre of Finland Ltd.
This study aims to use the aforementioned people tracking system’s data to enable e-
commerce style behavioural analysis in physical retail locations. This study is done
following the design science research paradigm to construct a real-life artefact. The
artefact designed and implemented is based on accumulated knowledge from a
systematic literature review, application domain analysis and iterative software
engineering practices. Systematic literature review is used to understand what kind of
performance evaluation is done in retail. These metrics are then analysed in regards to
people tracking technologies to propose a conceptual framework for customer tracking
in retail. From this the artefact is designed, implemented and evaluated. Evaluation is
done by combination of requirement validation, field experiments and three distinct
real-life field studies.
Literature review found that retailing uses traditionally easily available performance
metrics such as sales and profit. It was also clear that movement data, apart from traffic
calculation, has been unavailable for retail and thus is not often used as quantifiable
performance metric.
As a result this study presents one novel way to use customer movement as a store
performance metric. The artefact constructed quantifies, visualises and analyses
customer tracking data with the provided depth camera system, which is a new approach
to people tracking domain. The evaluation with real-life cases concludes that the artefact
can indeed find and classify interesting behavioural patterns from customer tracking
data.
Keywords Brick-and-mortar retail, people tracking, depth sensors, behavioural analysis, flow
analysis, traffic calculation, point of interest analysis, dwell time, data visualisation.
Supervisors Jouni Markkula (University), Sari Järvinen (VTT) and Johannes Peltola (VTT).

3
Foreword
This research is a master's thesis done at university of Oulu, Faculty of Information
Technology and Electrical Engineering, in the Information Processing major. This
research is funded by grants from VTT (Technical Research Centre of Finland Ltd.) and
Vähittäiskaupan tutkimussäätiö (Retail Research Foundation of Finland).
I would like to thank VTT for this very interesting thesis topic. It was very challenging
and broad topic which meant a lot of work. I would also like to thank my supervisors
from VTT as well as university. My university supervisor Jouni Markkula has been a
driving force behind making my thesis work valid and exact. The involvement of all
parties has been exceptional.
Even though it has been, at times, a hard process, I am proud of the end product and the
work contained herein.
Oulu, 19.10.2015
4
Abbreviations
API Application Programming Interface
BI Business Intelligence
CSV Comma Separated Value
DSR Design Science Research
ICT Information and Communications Technology
IS Information System
JSON JavaScript Object Notation
KPI Key Performance Indicator
NoSQL Not only Structured Query Language
POI Point of Interest
POS Point of Sale
RFID Radio-frequency Identification
REST Representational State Transfer
SLR Systematic Literature Review
SQL Structured Query Language
5
Contents
Abstract ............................................................................................................................. 2
Foreword ........................................................................................................................... 3
Abbreviations .................................................................................................................... 4
Contents ............................................................................................................................ 5
1. Introduction ............................................................................................................... 7
2. Research problem and methods ................................................................................ 9
2.1 Research questions ............................................................................................. 9
2.2 Research methods ............................................................................................. 11
2.2.1 Theory building ......................................................................................... 12
2.2.2 System development ................................................................................. 14
2.2.3 Evaluation ................................................................................................. 15
3. Systematic literature review .................................................................................... 17
3.1 Initial stage and identification of studies .......................................................... 17
3.2 Selection of primary studies ............................................................................. 18
3.3 Primary study classification and analysis ......................................................... 20
3.3.1 KPI variable classification ........................................................................ 20
3.3.2 Financial and non-financial metric relations ............................................. 23
3.4 Results of the review ........................................................................................ 25
3.4.1 Answers to review questions ..................................................................... 25
4. Application domain analysis ................................................................................... 27
4.1 Customer-tracking technology ......................................................................... 27
4.2 State-of-the-art analysis of commercial systems .............................................. 29
4.3 People Tracker .................................................................................................. 31
4.4 Domain analysis model .................................................................................... 32
5. System design ......................................................................................................... 35
5.1 System requirements ........................................................................................ 35
5.2 System architecture .......................................................................................... 38
5.2.1 Data sequencing ........................................................................................ 40
6. Software implementation ........................................................................................ 42
6.1 Programming languages ................................................................................... 42
6.2 Prototype 1 – Data flow and offline analysis ................................................... 44
6.2.1 Pre-processing ........................................................................................... 44
6.2.2 Track object container ............................................................................... 45
6.2.3 Database .................................................................................................... 45
6
6.2.4 Data analysis ............................................................................................. 46
6.3 Prototype 2 – User interaction and real-time analysis ...................................... 47
6.3.1 Database .................................................................................................... 47
6.3.2 Data visualisation ...................................................................................... 48
6.3.3 Data analysis and track object ................................................................... 49
6.3.4 Interfaces ................................................................................................... 50
7. Evaluation ............................................................................................................... 53
7.1 Requirements evaluation .................................................................................. 53
7.2 Field experiment: data processing evaluation .................................................. 54
7.3 Field studies: analysis functionality evaluation ................................................ 55
7.3.1 Case 1: Promotional-shelf customer flow ................................................. 55
7.3.2 Case 2: Exhibition area dwell time and traffic .......................................... 57
7.3.3 Case 3: Trade show booth interest rate ..................................................... 60
7.4 Conclusion ........................................................................................................ 62
8. Discussion ............................................................................................................... 63
8.1 Limitations ........................................................................................................ 66
8.2 Implications ...................................................................................................... 67
9. Conclusion .............................................................................................................. 68
9.1 Future research ................................................................................................. 68
References ....................................................................................................................... 69
Appendix A: Search syntax for databases ....................................................................... 73
Appendix B: Primary studies .......................................................................................... 74
Appendix C: State-of-the-art company list ..................................................................... 76
7
1. Introduction
Traditional retail commerce is in a critical period of change. In the field of retail, new
business models keep replacing old ones. This turning point partly originates from the
advent of the internet. Traditional retailing has had to adapt to a new form of retailing:
online e-commerce. E-commerce has taken retailers by storm and affected them in ways
that have been hard to predict. To survive, many traditional retailers, also known as
brick-and-mortar retailers, have adapted to a new model in which they offer online
services in addition to physical ones. This has led to a distinction of three forms of
retailing: pure e-commerce, pure brick-and-mortar, and a combination of the two: click-
and-mortar. There have been success stories in each of the categories, but one constant
remains; progressive retailers that adapt to new trends, and business models, are doing
better than their non-progressive peers (Doms, Jarmin, & Klimek, 2004).
Investment in new information and communication technology (ICT) often yields
positive impacts for retail stores (Pilat, 2005). A study of growth in the US retail sector
over the 1990s showed the displacement of traditional retailers by sophisticated retailers
using new technologies and ICT (Doms et al., 2004). Even though e-commerce has not
fully substituted retailing, there have been some clear cases of e-commerce
overthrowing traditional retail. Netflix replaced its DVD-by-mail model for direct-to-
device TV and overthrew such staples in the DVD rental industry as Blockbuster.
Another example of e-commerce changing a whole industry is air travel; traditional
travel agencies have had to start offering internet-based sales on flights to keep up with
cheap flight search engines. It has become a case of adapt or die.
In the very competitive environment, returning customers are very important for both
brick-and-mortar and e-commerce. To identify customer loyalty, different businesses
have employed different tools. In e-commerce, the customers can easily be identified
using registration or browser tracking technologies. In brick-and-mortar shopping, the
most analogous thing to this tracking has been frequent shopper cards: they enable
retailers to see what products each individual customer purchases and at what price
points. In addition to customer identity, retention, and shopping habits, the behaviour of
customers within the store is interesting to all retailers. E-commerce websites have often
been built on models of traditional shops, with virtual representations of areas and
departments, aisles, shopping carts, and checkout lanes. E-commerce can track visits to
different “areas” of the shop and provide such information as: what routes the visitor
took, what products the visitor looked at, and whether the visitor abandoned any
products or shopping at some point. This movement data has opened new kinds of
customer behaviour analysis options for e-commerce. The resulting customer movement
data can be aggregated to enable such analysis as: ratio of visitors to paying customers
and time spent in different product categories. Customer location-based behaviour
analysis has been a superior aspect of e-commerce, and brick-and-mortar has not been
able to do this.
In recent years, new solutions for offering customer behaviour analysis for brick-and-
mortar retail have emerged based on new precise customer-tracking technologies.
Examples of these tracking technologies include RGB video and Wi-Fi signal analysis.
With the availability of customer movement data, some companies have set out to offer
8
new e-commerce style analysis for brick-and-mortar retail (Rodnitzky, n.d.;
ShopperTrak, n.d.). These systems are purposed to provide analysis results akin to e-
commerce customer behaviour analysis, but from physical locations. The possibilities of
new technologies are recognised, but they have not been embraced by retail stores. The
most used customer movement-related statistics are gathered by dated door counters:
counting visitor numbers to the brick-and-mortar shops. In essence, there has not been a
breakthrough product in deeper customer behaviour analysis for brick-and-mortar retail.
This can be attributed to many reasons, including: costs, reliability, and data usability of
these systems.
To try and address flaws stemming from different people-tracking technologies, a depth
camera-based solution has been developed by VTT, Technical Research Centre of
Finland Ltd. This system, called People Tracker, is used in many different research
activities to provide people location data. The main research goal of this study is to
construct a brick-and-mortar customer behaviour analysis system by employing the
location data provided by People Tracker. This study uses different sources of
knowledge for theory building: literature, analysis of people tracking technologies, and
domain analysis. In this study, a gap in the scientific retail performance literature is
addressed; while most literature finds customer movement-related performance metrics
meaningful, they are not quantified effectively. The quantification of customer location
data and the behavioural analysis of customers in brick-and-mortar retail are presented,
as well as definitions of some ambiguous terminology related to customer behaviour.
As a result of the accumulated knowledge, a high-level framework for customer
behaviour analysis software is proposed. This framework is then used as a basis for
design and implementation of a prototype system using People Tracker depth sensor
data. The resulting implementation is evaluated using real-world field experiments,
testing, and three real-life brick-and-mortar retail-related field studies.
9
2. Research problem and methods
The main goal of this study is to develop a customer behaviour analysis system for
retail. The behaviour analysis system will process and analyse data captured with People
Tracker. People Tracker is a depth camera-based people-tracking system that can track
large indoor areas. The People Tracker system can be composed of one or several sensor
nodes. In the context of this thesis, the People Tracker system is used as a black box
data system; detection data is used as the input data for analysis.
Due to the nature of the research, it is carried out as design science research (DSR), in
which a real-world actual instantiation of the system, called an artefact, is designed,
implemented, tested, and evaluated in an iterative manner (Hevner, March, & Ram,
2004). The main research problem of the study is: how to construct the artefact in such a
manner that it will fulfil the needs of retail business, as well as address the people
location analysis-related gaps found in the literature. To effectively reach this goal, each
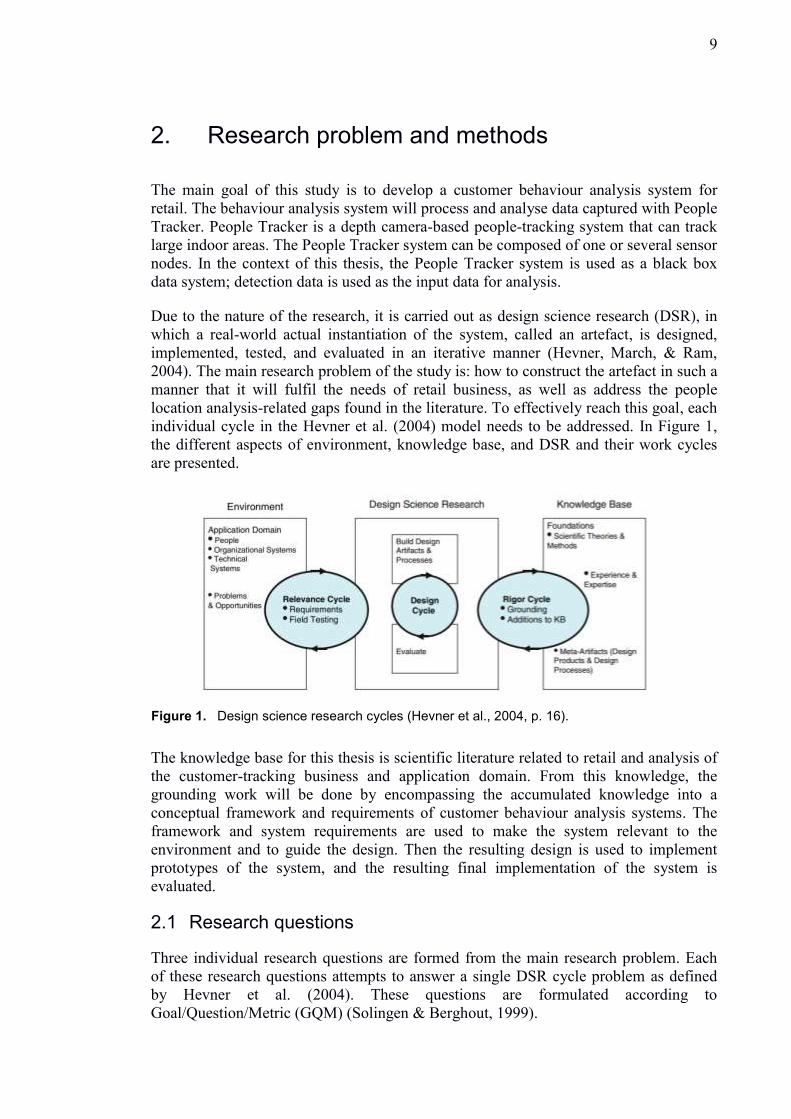
individual cycle in the Hevner et al. (2004) model needs to be addressed. In Figure 1,
the different aspects of environment, knowledge base, and DSR and their work cycles
are presented.
The knowledge base for this thesis is scientific literature related to retail and analysis of
the customer-tracking business and application domain. From this knowledge, the
grounding work will be done by encompassing the accumulated knowledge into a
conceptual framework and requirements of customer behaviour analysis systems. The
framework and system requirements are used to make the system relevant to the
environment and to guide the design. Then the resulting design is used to implement
prototypes of the system, and the resulting final implementation of the system is
evaluated.
2.1 Research questions
Three individual research questions are formed from the main research problem. Each
of these research questions attempts to answer a single DSR cycle problem as defined
by Hevner et al. (2004). These questions are formulated according to
Goal/Question/Metric (GQM) (Solingen & Berghout, 1999).
Figure 1. Design science research cycles (Hevner et al., 2004, p. 16).
10
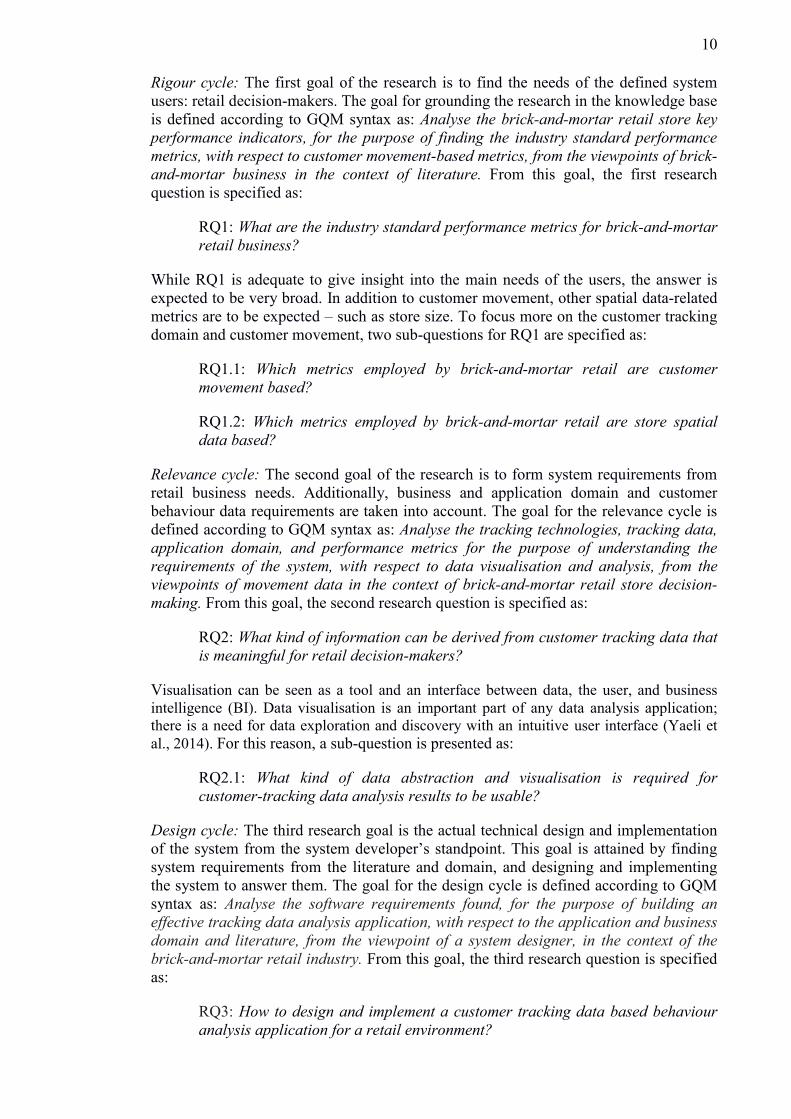
Rigour cycle: The first goal of the research is to find the needs of the defined system
users: retail decision-makers. The goal for grounding the research in the knowledge base
is defined according to GQM syntax as: Analyse the brick-and-mortar retail store key
performance indicators, for the purpose of finding the industry standard performance
metrics, with respect to customer movement-based metrics, from the viewpoints of brick-
and-mortar business in the context of literature. From this goal, the first research
question is specified as:
RQ1: What are the industry standard performance metrics for brick-and-mortar
retail business?
While RQ1 is adequate to give insight into the main needs of the users, the answer is
expected to be very broad. In addition to customer movement, other spatial data-related
metrics are to be expected – such as store size. To focus more on the customer tracking
domain and customer movement, two sub-questions for RQ1 are specified as:
RQ1.1: Which metrics employed by brick-and-mortar retail are customer
movement based?
RQ1.2: Which metrics employed by brick-and-mortar retail are store spatial
data based?
Relevance cycle: The second goal of the research is to form system requirements from
retail business needs. Additionally, business and application domain and customer
behaviour data requirements are taken into account. The goal for the relevance cycle is
defined according to GQM syntax as: Analyse the tracking technologies, tracking data,
application domain, and performance metrics for the purpose of understanding the
requirements of the system, with respect to data visualisation and analysis, from the
viewpoints of movement data in the context of brick-and-mortar retail store decision-
making. From this goal, the second research question is specified as:
RQ2: What kind of information can be derived from customer tracking data that
is meaningful for retail decision-makers?
Visualisation can be seen as a tool and an interface between data, the user, and business
intelligence (BI). Data visualisation is an important part of any data analysis application;
there is a need for data exploration and discovery with an intuitive user interface (Yaeli et
al., 2014). For this reason, a sub-question is presented as:
RQ2.1: What kind of data abstraction and visualisation is required for
customer-tracking data analysis results to be usable?
Design cycle: The third research goal is the actual technical design and implementation
of the system from the system developer’s standpoint. This goal is attained by finding
system requirements from the literature and domain, and designing and implementing
the system to answer them. The goal for the design cycle is defined according to GQM
syntax as: Analyse the software requirements found, for the purpose of building an
effective tracking data analysis application, with respect to the application and business
domain and literature, from the viewpoint of a system designer, in the context of the
brick-and-mortar retail industry. From this goal, the third research question is specified
as:
RQ3: How to design and implement a customer tracking data based behaviour
analysis application for a retail environment?
11
2.2 Research methods
Although the DSR approach is the foundation of this research, the research methods and
strategies for achieving each goal need to be selected. In this chapter, each selected
methods are presented in more detail. Methods are divided based on incremental system
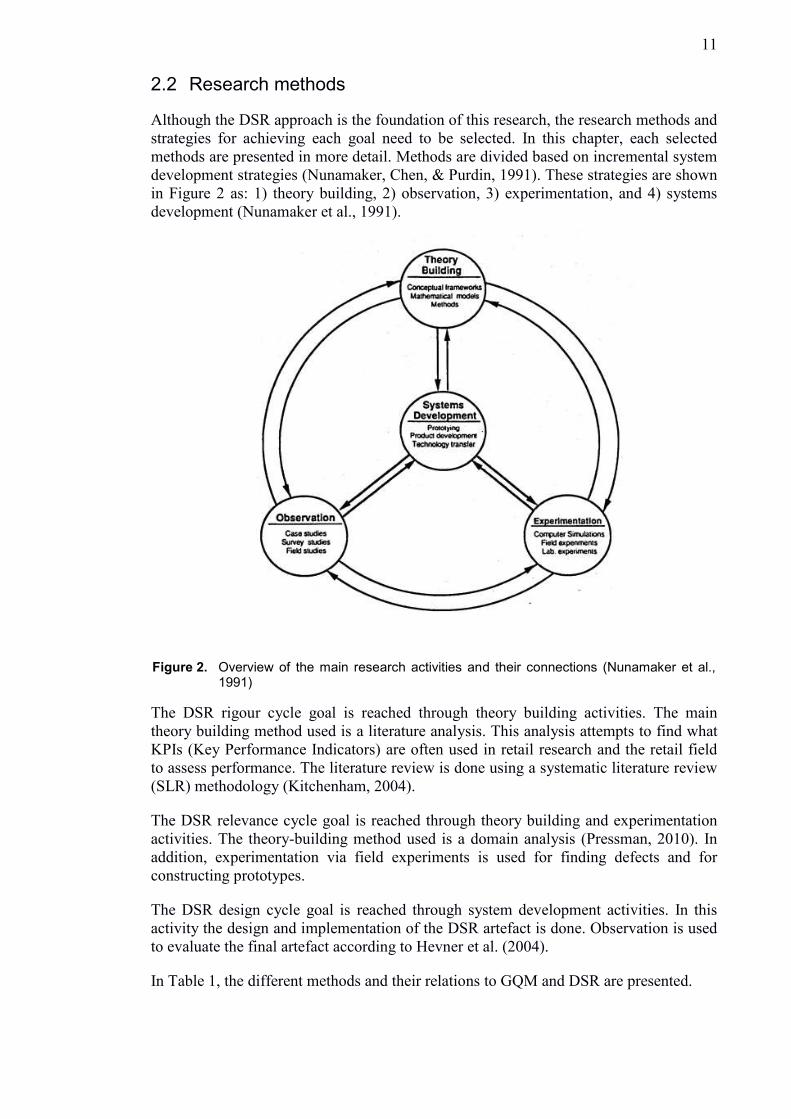
development strategies (Nunamaker, Chen, & Purdin, 1991). These strategies are shown
in Figure 2 as: 1) theory building, 2) observation, 3) experimentation, and 4) systems
development (Nunamaker et al., 1991).
The DSR rigour cycle goal is reached through theory building activities. The main
theory building method used is a literature analysis. This analysis attempts to find what
KPIs (Key Performance Indicators) are often used in retail research and the retail field
to assess performance. The literature review is done using a systematic literature review
(SLR) methodology (Kitchenham, 2004).
The DSR relevance cycle goal is reached through theory building and experimentation
activities. The theory-building method used is a domain analysis (Pressman, 2010). In
addition, experimentation via field experiments is used for finding defects and for
constructing prototypes.
The DSR design cycle goal is reached through system development activities. In this
activity the design and implementation of the DSR artefact is done. Observation is used
to evaluate the final artefact according to Hevner et al. (2004).
In Table 1, the different methods and their relations to GQM and DSR are presented.
Figure 2. Overview of the main research activities and their connections (Nunamaker et al., 1991)
12
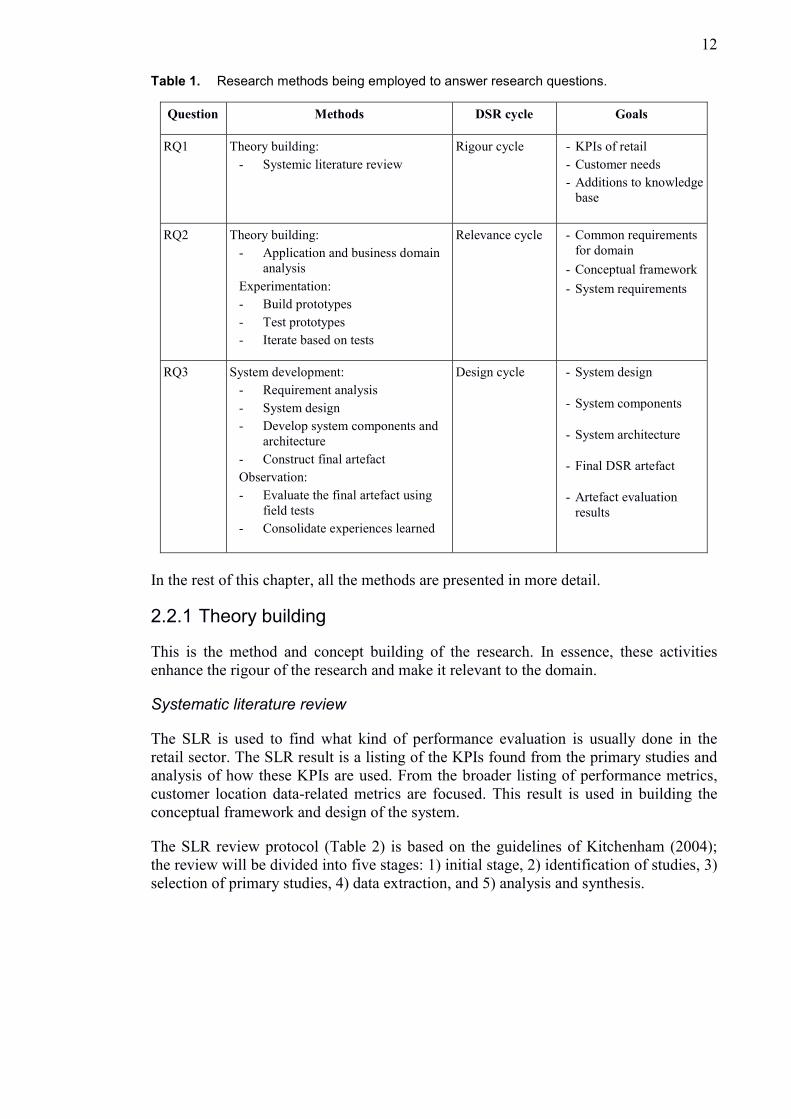
Table 1. Research methods being employed to answer research questions.
Question Methods
DSR cycle Goals
RQ1 Theory building:
- Systemic literature review
Rigour cycle - KPIs of retail
- Customer needs
- Additions to knowledge
base
RQ2 Theory building:
- Application and business domain
analysis
Experimentation:
- Build prototypes
- Test prototypes
- Iterate based on tests
Relevance cycle - Common requirements
for domain
- Conceptual framework
- System requirements
RQ3 System development:
- Requirement analysis
- System design
- Develop system components and
architecture
- Construct final artefact
Observation:
- Evaluate the final artefact using
field tests
- Consolidate experiences learned
Design cycle - System design
- System components
- System architecture
- Final DSR artefact
- Artefact evaluation
results
In the rest of this chapter, all the methods are presented in more detail.
2.2.1 Theory building
This is the method and concept building of the research. In essence, these activities
enhance the rigour of the research and make it relevant to the domain.
Systematic literature review
The SLR is used to find what kind of performance evaluation is usually done in the
retail sector. The SLR result is a listing of the KPIs found from the primary studies and
analysis of how these KPIs are used. From the broader listing of performance metrics,
customer location data-related metrics are focused. This result is used in building the
conceptual framework and design of the system.
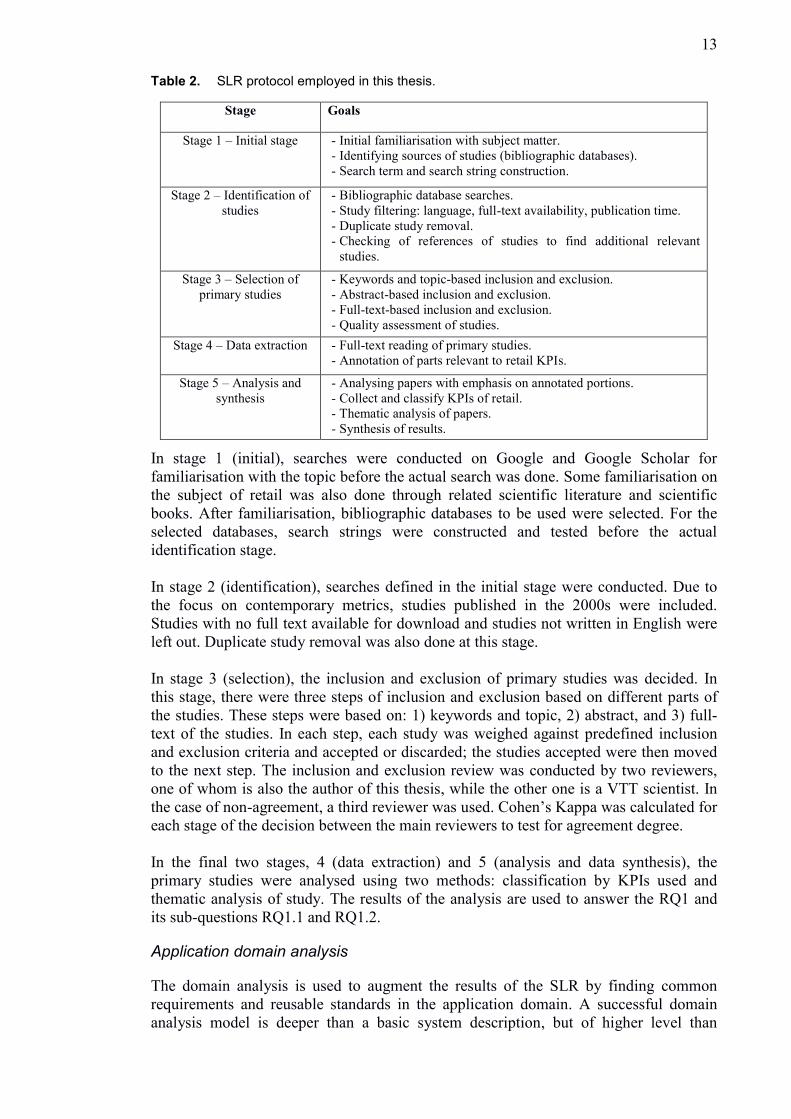
The SLR review protocol (Table 2) is based on the guidelines of Kitchenham (2004);
the review will be divided into five stages: 1) initial stage, 2) identification of studies, 3)
selection of primary studies, 4) data extraction, and 5) analysis and synthesis.
13
Table 2. SLR protocol employed in this thesis.
Stage Goals
Stage 1 – Initial stage - Initial familiarisation with subject matter.
- Identifying sources of studies (bibliographic databases).
- Search term and search string construction.
Stage 2 – Identification of
studies
- Bibliographic database searches.
- Study filtering: language, full-text availability, publication time.
- Duplicate study removal.
- Checking of references of studies to find additional relevant
studies.
Stage 3 – Selection of
primary studies
- Keywords and topic-based inclusion and exclusion.
- Abstract-based inclusion and exclusion.
- Full-text-based inclusion and exclusion.
- Quality assessment of studies.
Stage 4 – Data extraction - Full-text reading of primary studies.
- Annotation of parts relevant to retail KPIs.
Stage 5 – Analysis and
synthesis
- Analysing papers with emphasis on annotated portions.
- Collect and classify KPIs of retail.
- Thematic analysis of papers.
- Synthesis of results.
In stage 1 (initial), searches were conducted on Google and Google Scholar for
familiarisation with the topic before the actual search was done. Some familiarisation on
the subject of retail was also done through related scientific literature and scientific
books. After familiarisation, bibliographic databases to be used were selected. For the
selected databases, search strings were constructed and tested before the actual
identification stage.
In stage 2 (identification), searches defined in the initial stage were conducted. Due to
the focus on contemporary metrics, studies published in the 2000s were included.
Studies with no full text available for download and studies not written in English were
left out. Duplicate study removal was also done at this stage.
In stage 3 (selection), the inclusion and exclusion of primary studies was decided. In
this stage, there were three steps of inclusion and exclusion based on different parts of
the studies. These steps were based on: 1) keywords and topic, 2) abstract, and 3) full-
text of the studies. In each step, each study was weighed against predefined inclusion
and exclusion criteria and accepted or discarded; the studies accepted were then moved
to the next step. The inclusion and exclusion review was conducted by two reviewers,
one of whom is also the author of this thesis, while the other one is a VTT scientist. In
the case of non-agreement, a third reviewer was used. Cohen’s Kappa was calculated for
each stage of the decision between the main reviewers to test for agreement degree.
In the final two stages, 4 (data extraction) and 5 (analysis and data synthesis), the
primary studies were analysed using two methods: classification by KPIs used and
thematic analysis of study. The results of the analysis are used to answer the RQ1 and
its sub-questions RQ1.1 and RQ1.2.
Application domain analysis
The domain analysis is used to augment the results of the SLR by finding common
requirements and reusable standards in the application domain. A successful domain
analysis model is deeper than a basic system description, but of higher level than
14
software system design (Pressman, 2010). To bridge this gap, the analysis should find
answers to three questions: 1) what does the retail decision-maker want, 2) what is the
basis of the software design for that need, and 3) what requirements can be defined that
can be validated once the system is built (Pressman, 2010). In this thesis, the domain
analysis is presented as an analysis of: tracking technology, technical literature, state of
the art of other behavioural analysis systems, and expert knowledge.
Tracking technology: The strengths and weaknesses of each tracking technology are
explored for the use case of retail customer behavioural analysis. Technical literature is
used as a basis for arguing the strengths and weaknesses of the tracking technologies.
Technical literature: Due to the SLR’s close relation to customer tracking, technical
literature was found mainly from references of primary studies. Literature is considered
technical in this case if it focuses mainly on the tracking technology instead of on retail
performance metrics.
State of the art: State-of-the-art analysis found 13 companies providing different levels
of customer behaviour analysis for brick-and-mortar retail. The technologies used by the
companies are analysed and compared to the key performance indicators for retail.
State-of-the-art analysis reveals any possible gaps between these analysed systems and
the literature. From state-of-the-art the analysis functionality and the visualisation styles
for these type of systems is also found.
Expert knowledge: VTT has been working on the People Tracker system for a while,
and this thesis will be an addition to the many projects related to People Tracker. Expert
knowledge related to People Tracker and its output data is available from the developers
of the People Tracker system.
As a result, a domain analysis model is presented that incorporates common components
and common requirements of customer behavioural applications. In addition, a
conceptual framework for customer behavioural analysis is presented.
2.2.2 System development
This is the central activity of the research. In this activity, the system is constructed with
the help of theory, observation, and experimentation. The user needs, conceptual
framework, and common domain requirements are used as the starting point of system
design. They are used to produce the system architecture and used to define system
components and their inter-relationships.
System requirements
System requirements are derived from the theory built with the previous steps. Since
this study is not aiming for a commercial product, system performance-related
requirements do not have a big influence. System requirements are mainly functional,
with some of them being usability related. System requirements are divided into three
priorities, according to their effect on the system implementation process: critical,
moderate, and non-critical. The main distinction between these classes is: most critical
system requirements need to be met before moderate and non-critical ones can be
addressed.
15
System components and architecture
System architecture depicts how the components within the system are connected. This
architecture will be platform and programming language independent and will show
how data is modelled within the application. In addition, data sequencing will depict
how the data flows through the system. It is important to note that this system will reach
hundreds of thousands to millions of analysable data points. For this reason, the data
sequencing and analysis data modelling is a fairly important part of the design.
System implementation
From the different components and prototypes, the final artefact is then implemented.
For each component, implementation is presented in its own chapter with data states and
function relations mapped. The system will be implemented trying to utilise as many
contemporary system conventions as possible. As with system design activities, the
implementation will be done using prototypes based on the requirement priorities. Two
distinct prototypes are implemented: 1) data sequencing and an offline analysis testing
system, and 2) real-time data analysis and user interaction.
2.2.3 Evaluation
The research outcome has to be evaluated with metrics related to the nature of the goal
(Pressman, 2010; Solingen & Berghout, 1999). The evaluation done in this thesis is
directly related to each goal and based on: informed argumentation, testing, analysis,
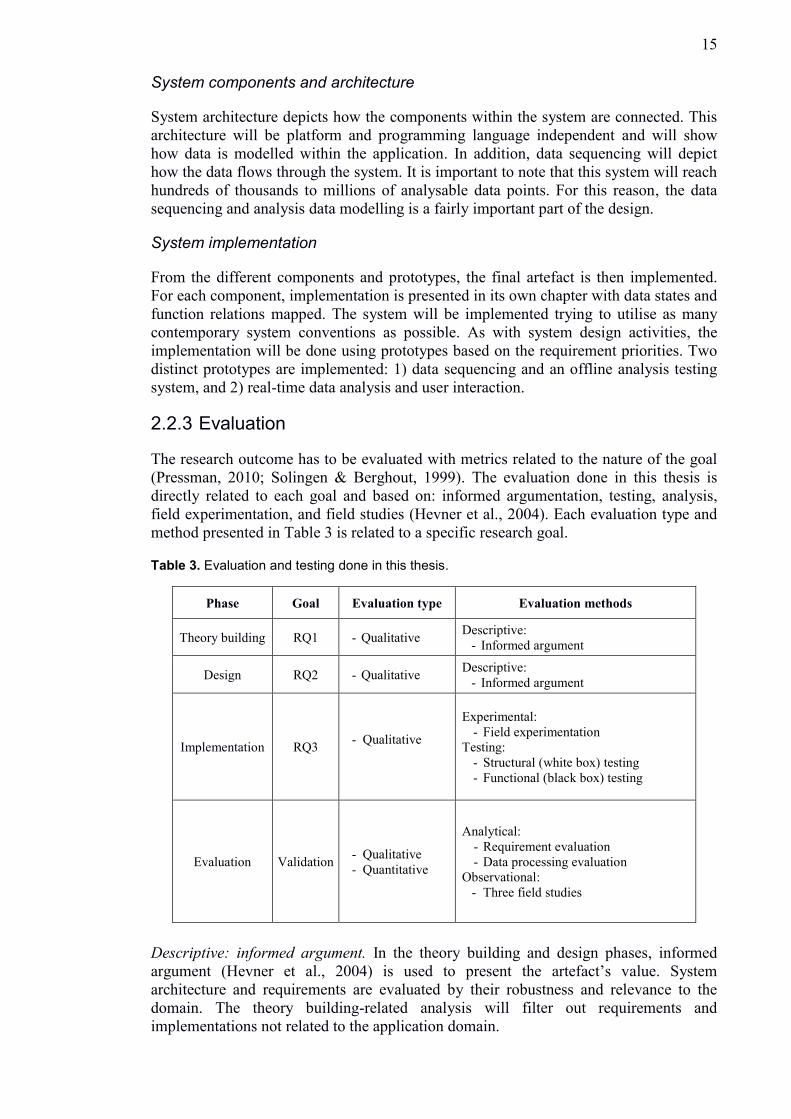
field experimentation, and field studies (Hevner et al., 2004). Each evaluation type and
method presented in Table 3 is related to a specific research goal.
Table 3. Evaluation and testing done in this thesis.
Phase Goal Evaluation type Evaluation methods
Theory building RQ1 - Qualitative Descriptive:
- Informed argument
Design RQ2 - Qualitative Descriptive:
- Informed argument
Implementation RQ3 - Qualitative
Experimental:
- Field experimentation
Testing:
- Structural (white box) testing
- Functional (black box) testing
Evaluation Validation - Qualitative
- Quantitative
Analytical:
- Requirement evaluation
- Data processing evaluation
Observational:
- Three field studies
Descriptive: informed argument. In the theory building and design phases, informed
argument (Hevner et al., 2004) is used to present the artefact’s value. System
architecture and requirements are evaluated by their robustness and relevance to the
domain. The theory building-related analysis will filter out requirements and
implementations not related to the application domain.
16
Experimental: field experimentation. In the implementation phase, experimentation is
mainly informal and closely tied with the development. Both the People Tracker data
output and behaviour analysis software data flow need to be tested and validated
thoroughly while developing the system – otherwise the analysis results cannot be seen
as actionable. These tests are done with simulations of real tracking situations in VTT
office and break rooms. Additionally, data from other real-life People Tracker field
experiments is available. This means that data from many sources can be used to
experiment with while developing the system. The experimentation results are to be
used to help both People Tracker system development and behaviour analysis system
development.
Testing: structural and functional. In the implementation phase, white and black box
testing is used as part of the implementation process. In essence the functionality of
prototypes is tested, as well as the performance. Iterations are made to the
implementation when needed.
Analytical: requirement. In the evaluation phase, each requirement is analysed and
classified into one of three categories: implemented, not implemented, and needs work.
Requirement evaluation is done qualitatively with quantities of classifications presented.
Analytical: data processing. Data processing is validated by testing track formation in
adverse conditions and then employing filters to remove false positive tracks. An
annotated ground truth of real visitor numbers is compared to the analysis results of the
system. This evaluation is in accordance with the evaluation principles of Pressman
(2010): evaluation is based on mathematical properties; evaluation represents positive or
negative system characteristics; and evaluation can be validated empirically.
Observational: field study. In the evaluation phase, a formal functional evaluation of the
behavioural analysis system is done based on three real-life field studies. Analysis
functionality is evaluated in three real situations in: a supermarket, a trade show, and a
large trade fair. In these three cases, each main analysis function is tested and the data is
provided to real-life users. The field studies are done in cooperation with a Finnish
marketing firm to ensure data usability for real-life users. This is in accordance with the
evaluation principles of Nunamaker and Chen (1990) and Hevner et al. (2004), who
argue that the framework and resulting artefact are best tested with use cases and field
studies to find the most relevant results and additions to the artefact.
17
3. Systematic literature review
In the world of brick-and-mortar retail, the performance of stores and chains is
calculated in many ways; the metrics are often called key performance indicators (KPI)
or performance metrics. Most of the KPIs used in the literature are financial metric
related, such as return on investment or return on sales, but there are a myriad of other
metrics available. These metrics are less used, but offer a different look into the
performance of retail. The purpose of this review is to find out the metrics used in the
industry, as well as the metrics that can benefit from customer behaviour analysis. For
this reason, the focus in this review is on metrics other than financial ones. However,
when doing a comprehensive literature review, the sales KPI cannot be discarded – this
would limit the initial pool of studies too greatly. In this context, it is important to find
the relevant metrics for the purpose of developing a system that meets the needs of
purposed customers, and to make sure that the architecture of the system is built on
those needs.
The review is divided into five stages: 1) initial stage, 2) identification of studies, 3)
selection of primary studies, 4) data extraction, and 5) analysis and synthesis.
3.1 Initial stage and identification of studies
These database restrictions were made with the help of Oulu University library; the
main databases for business and retail-related research were selected. Databases related
strictly to engineering, software engineering, and information systems were left out. In
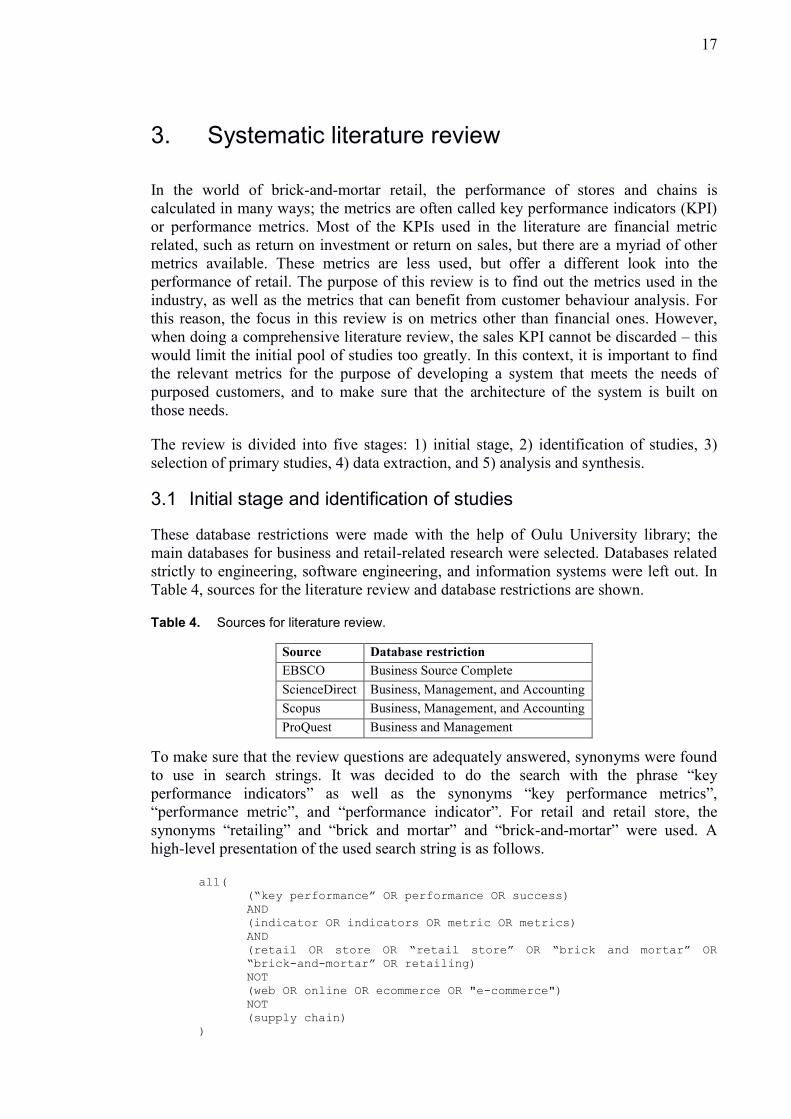
Table 4, sources for the literature review and database restrictions are shown.
Table 4. Sources for literature review.
Source Database restriction
EBSCO Business Source Complete
ScienceDirect Business, Management, and Accounting
Scopus Business, Management, and Accounting
ProQuest Business and Management
To make sure that the review questions are adequately answered, synonyms were found
to use in search strings. It was decided to do the search with the phrase “key
performance indicators” as well as the synonyms “key performance metrics”,
“performance metric”, and “performance indicator”. For retail and retail store, the
synonyms “retailing” and “brick and mortar” and “brick-and-mortar” were used. A
high-level presentation of the used search string is as follows.
all(
(“key performance” OR performance OR success)
AND
(indicator OR indicators OR metric OR metrics)
AND
(retail OR store OR “retail store” OR “brick and mortar” OR
“brick-and-mortar” OR retailing)
NOT
(web OR online OR ecommerce OR "e-commerce")
NOT
(supply chain)
)
18
The final search strings for each individual database can be found in Appendix A. Each
string differs from the others due to the search syntax of the databases being different.
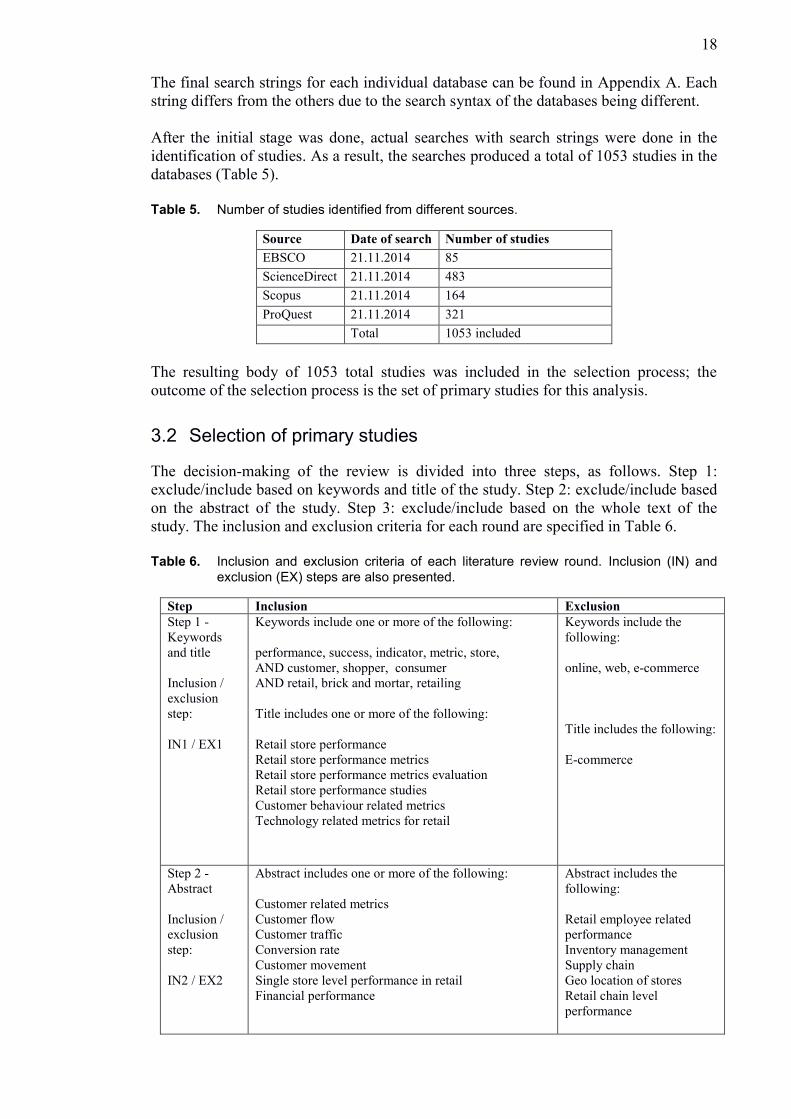
After the initial stage was done, actual searches with search strings were done in the
identification of studies. As a result, the searches produced a total of 1053 studies in the
databases (Table 5).
Table 5. Number of studies identified from different sources.
Source Date of search Number of studies
EBSCO 21.11.2014 85
ScienceDirect 21.11.2014 483
Scopus 21.11.2014 164
ProQuest 21.11.2014 321
Total 1053 included
The resulting body of 1053 total studies was included in the selection process; the
outcome of the selection process is the set of primary studies for this analysis.
3.2 Selection of primary studies
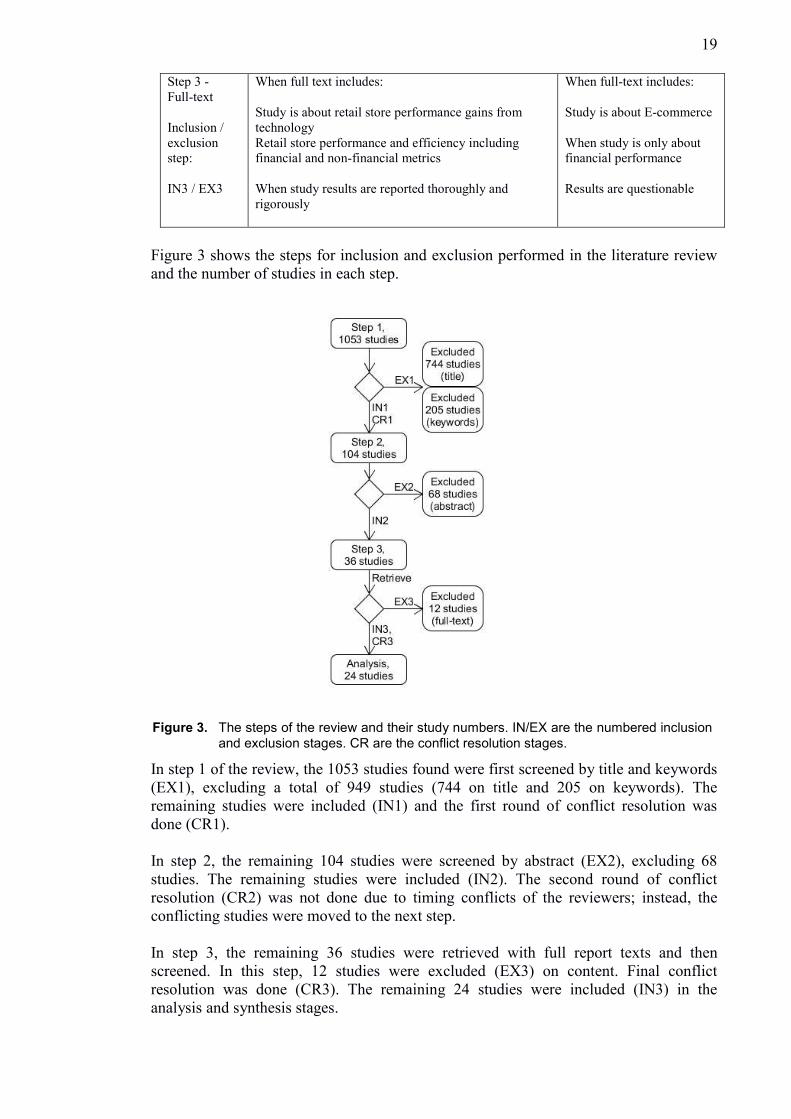
The decision-making of the review is divided into three steps, as follows. Step 1:
exclude/include based on keywords and title of the study. Step 2: exclude/include based
on the abstract of the study. Step 3: exclude/include based on the whole text of the
study. The inclusion and exclusion criteria for each round are specified in Table 6.
Table 6. Inclusion and exclusion criteria of each literature review round. Inclusion (IN) and
exclusion (EX) steps are also presented.
Step Inclusion Exclusion
Step 1 -
Keywords
and title
Inclusion /
exclusion
step:
IN1 / EX1
Keywords include one or more of the following:
performance, success, indicator, metric, store,
AND customer, shopper, consumer
AND retail, brick and mortar, retailing
Title includes one or more of the following:
Retail store performance
Retail store performance metrics
Retail store performance metrics evaluation
Retail store performance studies
Customer behaviour related metrics
Technology related metrics for retail
Keywords include the
following:
online, web, e-commerce
Title includes the following:
E-commerce
Step 2 -
Abstract
Inclusion /
exclusion
step:
IN2 / EX2
Abstract includes one or more of the following:
Customer related metrics
Customer flow
Customer traffic
Conversion rate
Customer movement
Single store level performance in retail
Financial performance
Abstract includes the
following:
Retail employee related
performance
Inventory management
Supply chain
Geo location of stores
Retail chain level
performance
19
Step 3 -
Full-text
Inclusion /
exclusion
step:
IN3 / EX3
When full text includes:
Study is about retail store performance gains from
technology
Retail store performance and efficiency including
financial and non-financial metrics
When study results are reported thoroughly and
rigorously
When full-text includes:
Study is about E-commerce
When study is only about
financial performance
Results are questionable
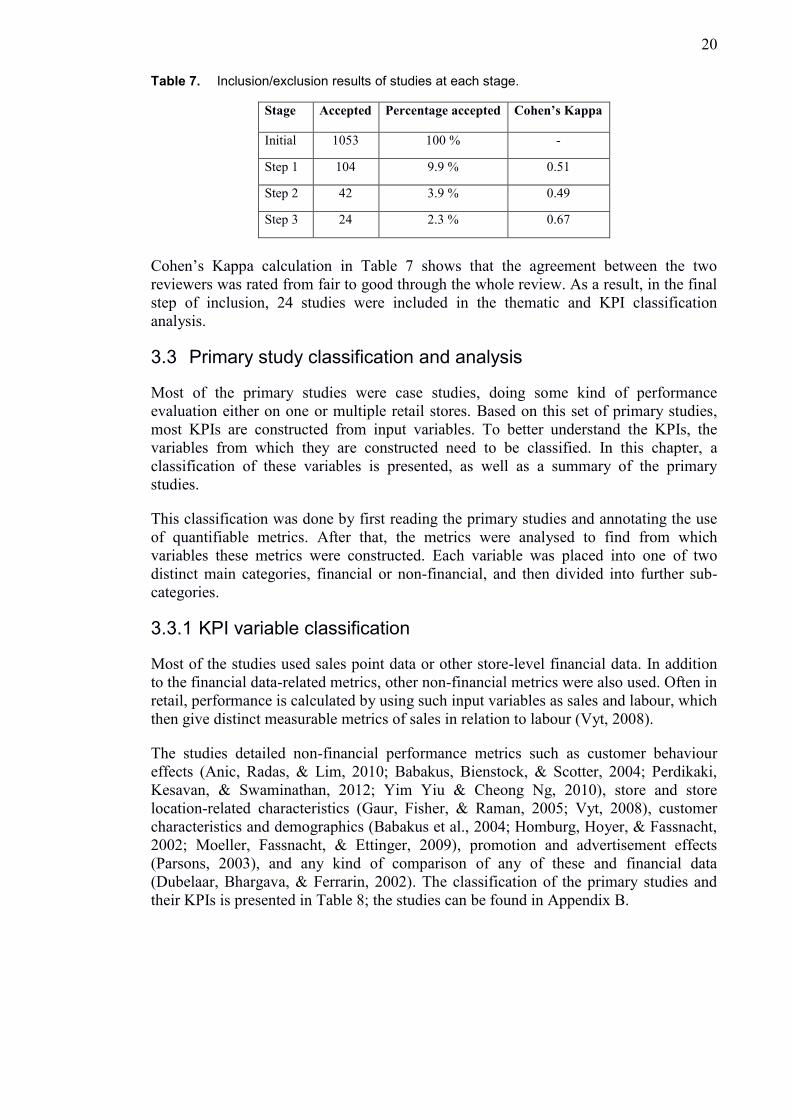
Figure 3 shows the steps for inclusion and exclusion performed in the literature review
and the number of studies in each step.
In step 1 of the review, the 1053 studies found were first screened by title and keywords
(EX1), excluding a total of 949 studies (744 on title and 205 on keywords). The
remaining studies were included (IN1) and the first round of conflict resolution was
done (CR1).
In step 2, the remaining 104 studies were screened by abstract (EX2), excluding 68
studies. The remaining studies were included (IN2). The second round of conflict
resolution (CR2) was not done due to timing conflicts of the reviewers; instead, the
conflicting studies were moved to the next step.
In step 3, the remaining 36 studies were retrieved with full report texts and then
screened. In this step, 12 studies were excluded (EX3) on content. Final conflict
resolution was done (CR3). The remaining 24 studies were included (IN3) in the
analysis and synthesis stages.
Figure 3. The steps of the review and their study numbers. IN/EX are the numbered inclusion
and exclusion stages. CR are the conflict resolution stages.
20
Table 7. Inclusion/exclusion results of studies at each stage.
Stage Accepted Percentage accepted Cohen’s Kappa
Initial 1053 100 % -
Step 1 104 9.9 % 0.51
Step 2 42 3.9 % 0.49
Step 3 24 2.3 % 0.67
Cohen’s Kappa calculation in Table 7 shows that the agreement between the two
reviewers was rated from fair to good through the whole review. As a result, in the final
step of inclusion, 24 studies were included in the thematic and KPI classification
analysis.
3.3 Primary study classification and analysis
Most of the primary studies were case studies, doing some kind of performance
evaluation either on one or multiple retail stores. Based on this set of primary studies,
most KPIs are constructed from input variables. To better understand the KPIs, the
variables from which they are constructed need to be classified. In this chapter, a
classification of these variables is presented, as well as a summary of the primary
studies.
This classification was done by first reading the primary studies and annotating the use
of quantifiable metrics. After that, the metrics were analysed to find from which
variables these metrics were constructed. Each variable was placed into one of two
distinct main categories, financial or non-financial, and then divided into further sub-
categories.
3.3.1 KPI variable classification
Most of the studies used sales point data or other store-level financial data. In addition
to the financial data-related metrics, other non-financial metrics were also used. Often in
retail, performance is calculated by using such input variables as sales and labour, which
then give distinct measurable metrics of sales in relation to labour (Vyt, 2008).
The studies detailed non-financial performance metrics such as customer behaviour
effects (Anic, Radas, & Lim, 2010; Babakus, Bienstock, & Scotter, 2004; Perdikaki,
Kesavan, & Swaminathan, 2012; Yim Yiu & Cheong Ng, 2010), store and store
location-related characteristics (Gaur, Fisher, & Raman, 2005; Vyt, 2008), customer
characteristics and demographics (Babakus et al., 2004; Homburg, Hoyer, & Fassnacht,
2002; Moeller, Fassnacht, & Ettinger, 2009), promotion and advertisement effects
(Parsons, 2003), and any kind of comparison of any of these and financial data
(Dubelaar, Bhargava, & Ferrarin, 2002). The classification of the primary studies and
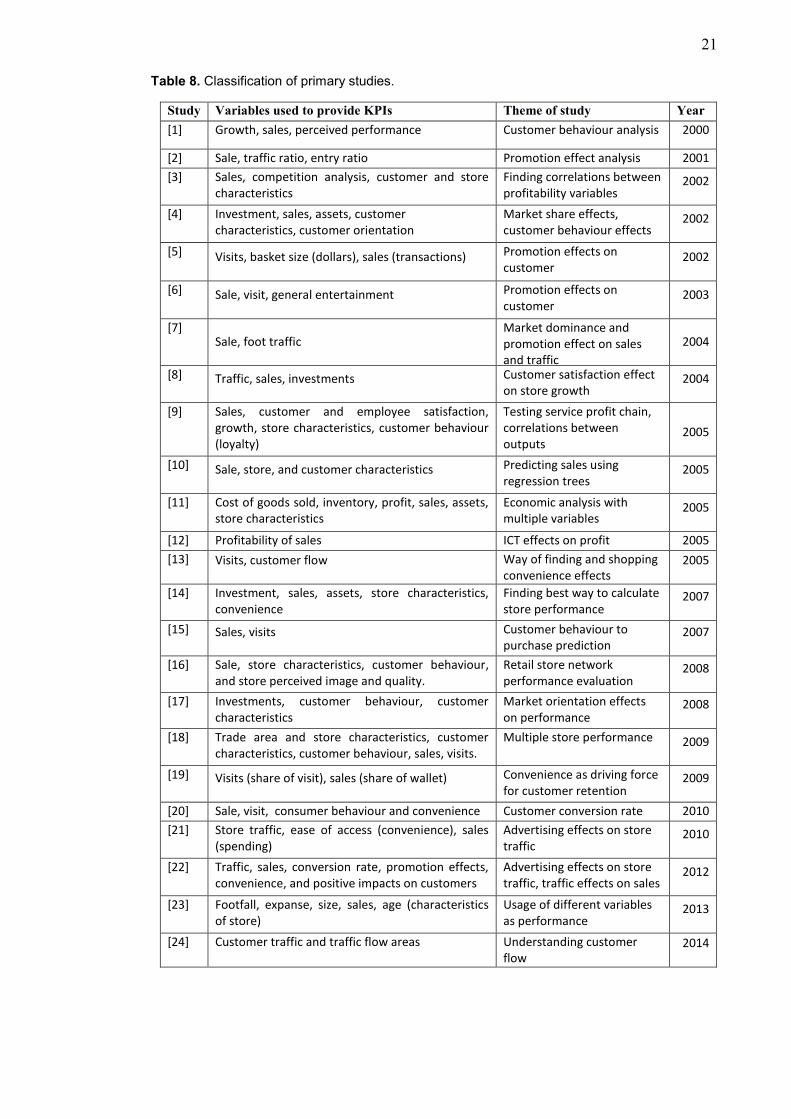
their KPIs is presented in Table 8; the studies can be found in Appendix B.
21
Table 8. Classification of primary studies.
Study Variables used to provide KPIs Theme of study Year
[1] Growth, sales, perceived performance Customer behaviour analysis 2000
[2] Sale, traffic ratio, entry ratio Promotion effect analysis 2001
[3] Sales, competition analysis, customer and store characteristics
Finding correlations between profitability variables
2002
[4] Investment, sales, assets, customer characteristics, customer orientation
Market share effects, customer behaviour effects
2002
[5] Visits, basket size (dollars), sales (transactions) Promotion effects on customer
2002
[6] Sale, visit, general entertainment Promotion effects on customer
2003
[7] Sale, foot traffic
Market dominance and promotion effect on sales and traffic
2004
[8] Traffic, sales, investments Customer satisfaction effect on store growth
2004
[9] Sales, customer and employee satisfaction, growth, store characteristics, customer behaviour (loyalty)
Testing service profit chain, correlations between outputs
2005
[10] Sale, store, and customer characteristics Predicting sales using regression trees
2005
[11] Cost of goods sold, inventory, profit, sales, assets, store characteristics
Economic analysis with multiple variables
2005
[12] Profitability of sales ICT effects on profit 2005
[13] Visits, customer flow Way of finding and shopping convenience effects
2005
[14] Investment, sales, assets, store characteristics, convenience
Finding best way to calculate store performance
2007
[15] Sales, visits Customer behaviour to purchase prediction
2007
[16] Sale, store characteristics, customer behaviour, and store perceived image and quality.
Retail store network performance evaluation
2008
[17] Investments, customer behaviour, customer characteristics
Market orientation effects on performance
2008
[18] Trade area and store characteristics, customer characteristics, customer behaviour, sales, visits.
Multiple store performance 2009
[19] Visits (share of visit), sales (share of wallet) Convenience as driving force for customer retention
2009
[20] Sale, visit, consumer behaviour and convenience Customer conversion rate 2010
[21] Store traffic, ease of access (convenience), sales (spending)
Advertising effects on store traffic
2010
[22] Traffic, sales, conversion rate, promotion effects, convenience, and positive impacts on customers
Advertising effects on store traffic, traffic effects on sales
2012
[23] Footfall, expanse, size, sales, age (characteristics of store)
Usage of different variables as performance
2013
[24] Customer traffic and traffic flow areas Understanding customer flow
2014
22
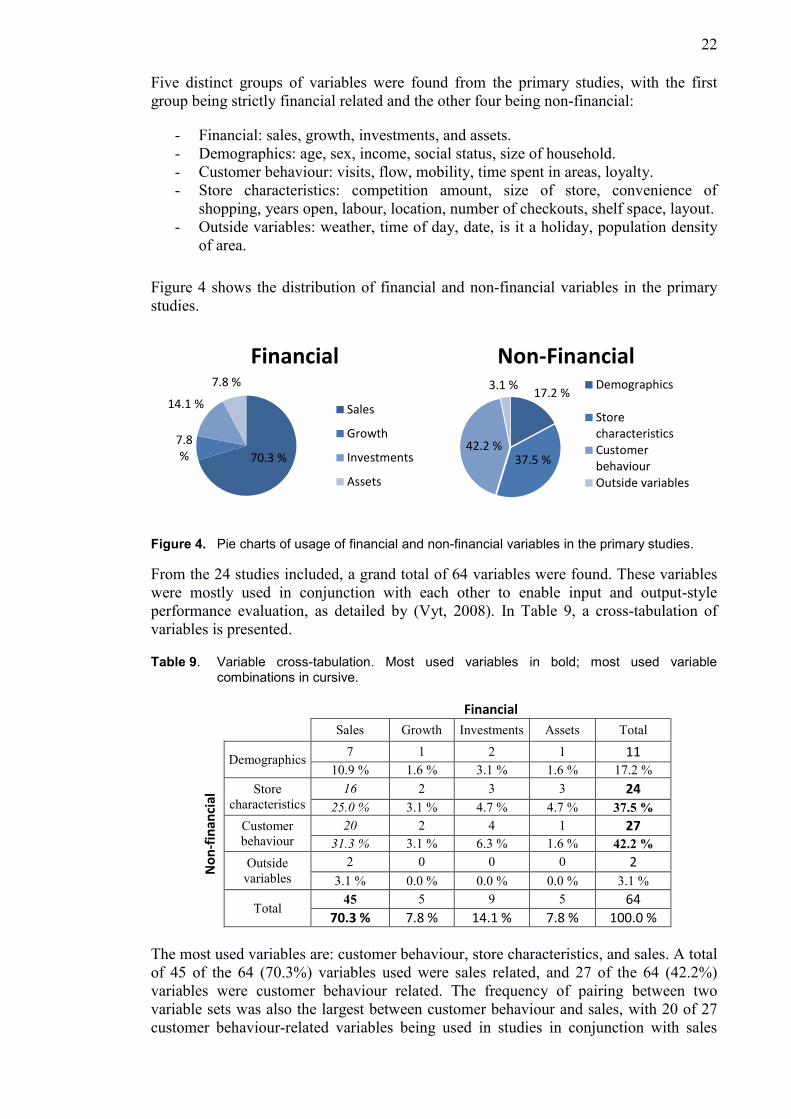
Five distinct groups of variables were found from the primary studies, with the first
group being strictly financial related and the other four being non-financial:
- Financial: sales, growth, investments, and assets.
- Demographics: age, sex, income, social status, size of household.
- Customer behaviour: visits, flow, mobility, time spent in areas, loyalty.
- Store characteristics: competition amount, size of store, convenience of
shopping, years open, labour, location, number of checkouts, shelf space, layout.
- Outside variables: weather, time of day, date, is it a holiday, population density
of area.
Figure 4 shows the distribution of financial and non-financial variables in the primary
studies.
Figure 4. Pie charts of usage of financial and non-financial variables in the primary studies.
From the 24 studies included, a grand total of 64 variables were found. These variables
were mostly used in conjunction with each other to enable input and output-style
performance evaluation, as detailed by (Vyt, 2008). In Table 9, a cross-tabulation of
variables is presented.
Table 9. Variable cross-tabulation. Most used variables in bold; most used variable combinations in cursive.
Financial
Sales Growth Investments Assets Total
No
n-f
inan
cial
Demographics 7 1 2 1 11
10.9 % 1.6 % 3.1 % 1.6 % 17.2 %
Store
characteristics
16 2 3 3 24 25.0 % 3.1 % 4.7 % 4.7 % 37.5 %
Customer
behaviour
20 2 4 1 27 31.3 % 3.1 % 6.3 % 1.6 % 42.2 %
Outside
variables
2 0 0 0 2
3.1 % 0.0 % 0.0 % 0.0 % 3.1 %
Total 45 5 9 5 64
70.3 % 7.8 % 14.1 % 7.8 % 100.0 %
The most used variables are: customer behaviour, store characteristics, and sales. A total
of 45 of the 64 (70.3%) variables used were sales related, and 27 of the 64 (42.2%)
variables were customer behaviour related. The frequency of pairing between two
variable sets was also the largest between customer behaviour and sales, with 20 of 27
customer behaviour-related variables being used in studies in conjunction with sales
70.3 %
7.8 %
14.1 %
7.8 %
Financial
Sales
Growth
Investments
Assets
17.2 %
37.5 % 42.2 %
3.1 %
Non-Financial Demographics
StorecharacteristicsCustomerbehaviourOutside variables
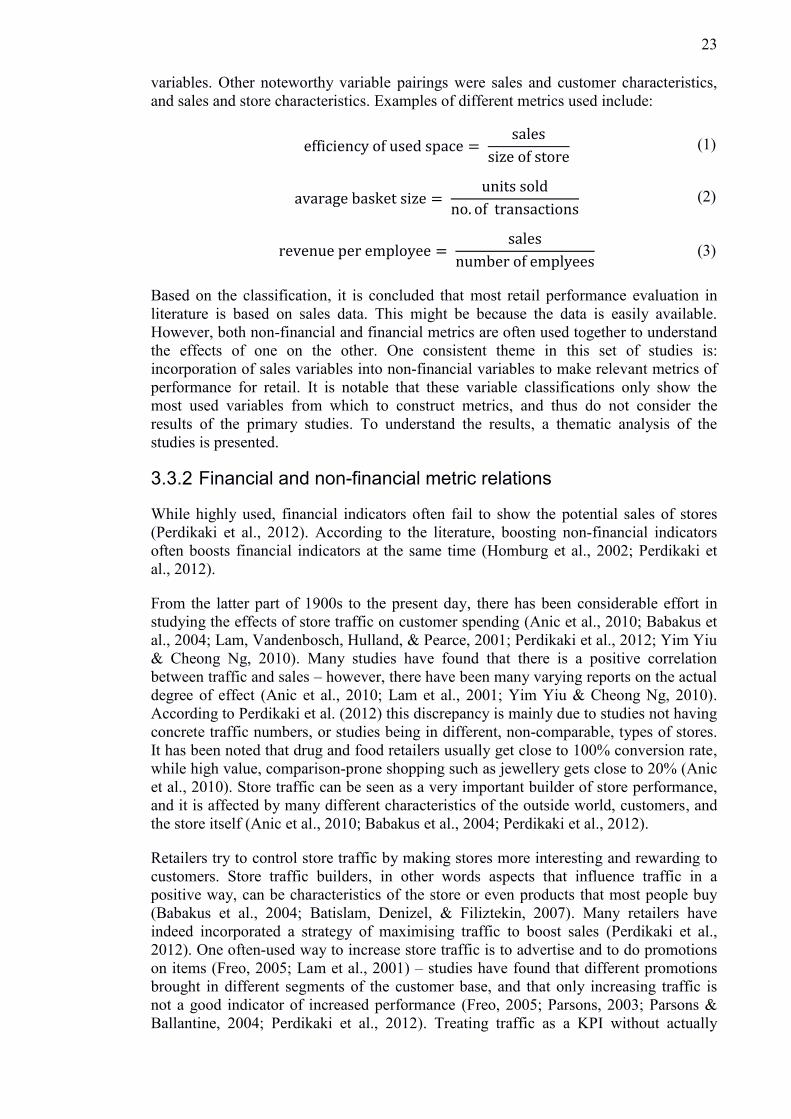
23
variables. Other noteworthy variable pairings were sales and customer characteristics,
and sales and store characteristics. Examples of different metrics used include:
efficiency of used space =
sales
size of store (1)
avarage basket size =
units sold
no. of transactions (2)
revenue per employee =
sales
number of emplyees (3)
Based on the classification, it is concluded that most retail performance evaluation in
literature is based on sales data. This might be because the data is easily available.
However, both non-financial and financial metrics are often used together to understand
the effects of one on the other. One consistent theme in this set of studies is:
incorporation of sales variables into non-financial variables to make relevant metrics of
performance for retail. It is notable that these variable classifications only show the
most used variables from which to construct metrics, and thus do not consider the
results of the primary studies. To understand the results, a thematic analysis of the
studies is presented.
3.3.2 Financial and non-financial metric relations
While highly used, financial indicators often fail to show the potential sales of stores
(Perdikaki et al., 2012). According to the literature, boosting non-financial indicators
often boosts financial indicators at the same time (Homburg et al., 2002; Perdikaki et
al., 2012).
From the latter part of 1900s to the present day, there has been considerable effort in
studying the effects of store traffic on customer spending (Anic et al., 2010; Babakus et
al., 2004; Lam, Vandenbosch, Hulland, & Pearce, 2001; Perdikaki et al., 2012; Yim Yiu
& Cheong Ng, 2010). Many studies have found that there is a positive correlation
between traffic and sales – however, there have been many varying reports on the actual
degree of effect (Anic et al., 2010; Lam et al., 2001; Yim Yiu & Cheong Ng, 2010).
According to Perdikaki et al. (2012) this discrepancy is mainly due to studies not having
concrete traffic numbers, or studies being in different, non-comparable, types of stores.
It has been noted that drug and food retailers usually get close to 100% conversion rate,
while high value, comparison-prone shopping such as jewellery gets close to 20% (Anic
et al., 2010). Store traffic can be seen as a very important builder of store performance,
and it is affected by many different characteristics of the outside world, customers, and
the store itself (Anic et al., 2010; Babakus et al., 2004; Perdikaki et al., 2012).
Retailers try to control store traffic by making stores more interesting and rewarding to
customers. Store traffic builders, in other words aspects that influence traffic in a
positive way, can be characteristics of the store or even products that most people buy
(Babakus et al., 2004; Batislam, Denizel, & Filiztekin, 2007). Many retailers have
indeed incorporated a strategy of maximising traffic to boost sales (Perdikaki et al.,
2012). One often-used way to increase store traffic is to advertise and to do promotions
on items (Freo, 2005; Lam et al., 2001) – studies have found that different promotions
brought in different segments of the customer base, and that only increasing traffic is
not a good indicator of increased performance (Freo, 2005; Parsons, 2003; Parsons &
Ballantine, 2004; Perdikaki et al., 2012). Treating traffic as a KPI without actually
24
analysing traffic changes is a common mistake in retail. Retailers should analyse traffic
with regards to mean traffic, intra-day traffic variability, and inter-day traffic variability.
Better results for traffic calculations can be found through the usage of new
technologies (Perdikaki et al., 2012). In this set of primary studies, technologies used for
traffic calculations were infra-red beam-based systems and video analysis systems – in
addition, RFID and Wi-Fi systems are mentioned as enabling traffic calculations.
After store traffic has been built up, the customers have to be retained, and shopping
convenience is the key to retaining customers, according to many studies. Convenience
encompasses many things related to the customer experience, such as ease of movement
and enjoyment. A good shopping experience can be created using many different
techniques (Chebat, Gélinas-Chebat, & Therrien, 2005). According to (Homburg et al.,
2002), a retail store’s market share can be linked to customer orientation, which in
broad terms means that the customers are kept happy. Also according to Moeller et al.
(2009) shopping convenience is the best single factor to drive competitiveness in retail.
Shopping convenience is the key to making the act of shopping in a store more
attractive and enjoyable for customers, making customer want to come back (Chebat et
al., 2005; Moeller et al., 2009). Since shopping convenience cannot be measured easily,
apart from through customer questionnaires, it is often tied to another term: customer
flow. Customer flow broadly means the routes the customers take and the way the
customer traffic orients through different areas of the store. Thus, visualising customer
flow can easily highlight areas of the shop with good and bad shopping convenience
(Song, Dong, Yang, Gu, & Fan, 2008). In essence, good customer flow means that
shopping is convenient and that in turn boosts customer retention (Moeller et al., 2009).
In turn, customer retention increases traffic, and with the help of sales-related activities
converts traffic into customers; this ratio of visits to customers is called the conversion
rate (Moeller et al., 2009).
According to many studies, the retail store type is the largest deciding factor in
conversion rate. For example, pharmacies and health-care shops have a very high
conversion rate of 98%, while electronics and other non-grocery shopping yielded
lower, around 60%, conversion rates (Yim Yiu & Cheong Ng, 2010). It might be
worthwhile for retailers to try to think in new ways: not only trying to increase traffic,
but trying to increase enjoyment of shopping and to increase average basket sizes of
customers (Rhee & Bell, 2002). Thus, maximising store traffic, making the customer
flow fluent, and factoring in convenience mean more customer spending (Anic et al.,
2010; Patel & Pande, 2013). Failure to convert visitors into customers indicates
problems in convenience and product-related aspects, such as assortment, store layout,
staff, and other store characteristics (Lam et al., 2001).
Businesses and research are finding that performance needs to be calculated with both
short and long-term goals – and that performance in retail is a very broad term. Many
researchers and business owners alike try to force performance into one figure, but are
mistaken when doing so. Broader measures of performance are needed in the
assessment of productivity. This means that many different variables need to be
measured to encompass the multi-faceted performance of retailing (Dubelaar et al.,
2002). There have been many studies that try to encompass all of the variables in one
study, but this also seems like the wrong approach – since there can be no one solution
that fits all cases (Gauri, Pauler, & Trivedi, 2009; Pritchard & Silvestro, 2005; Vyt,
2008). It has been noted in several studies that different stores, even within the same
chain, might need different tools to calculate performance (Sellers-Rubio & Mas-Ruiz,
2007). Correlation between two variables does not mean causation; the variables to be
benchmarked need to very carefully selected (Gauri et al., 2009; Sellers-Rubio & Mas-
25
Ruiz, 2007). The benchmarking is valid only for one specific process and one specific
store; and quotes from (Sellers-Rubio & Mas-Ruiz, 2007) stand: “no optional best
practices are visible” and “no one-size-fits-all-solution is available”.
Throughout the primary studies, a need for quantified customer behaviour was found.
However there seems to be no standard way to measure or analyse customer behaviour.
While variable-based classification did not find customer flow to be a KPI, the thematic
analysis found that important variables are often highly affected by customer flow. In
this thesis, customer flow is seen as an indicator of good spatial layout, shopping
convenience, and internal store traffic – all important performance factors but not strict
KPIs according to literature.
3.4 Results of the review
As a main conclusion, none of the metrics can be said to be better than the rest overall
for all use cases. But in general, the application of these different KPI techniques has
important implications in retailing. The most appropriate metric depends on the
characteristics of the store, its customer base, and the aim and scope of the KPI analysis.
For this reason, it is not worthwhile trying to find a one-size-fits-all approach, but to
find what drives retail performance and what the most important metrics for this
performance are. The most relevant financial metric in literature was clearly sales, and
the most used combinations of financial and non-financial metrics were sales compared
to customer behaviour and shop characteristics. The most relevant customer behaviour-
related effects in the literature were shopping convenience, customer retention, and
customer traffic. These effects are, however, related to other variables.
3.4.1 Answers to review questions
Research question 1 defined for this review was: What are the industry standard
performance metrics for brick-and-mortar retail business? Based on thematic analysis
and primary study classification, the main KPIs of brick-and-mortar business, in the
2000s, are: sales, gross profit, and growth.
Sales: the amount of sales in a specific time.
Gross Profit (or Gross Margin): sales (or income) compared to expenditure.
Growth: profit now compared to profit earlier, for example for different quarters.
The sub-questions to be addressed by this review are defined as research question 1.1
and research question 1.2.
Research question 1.1. Which metrics employed by brick-and-mortar retail are
customer movement based? While only one metric, traffic, is strictly customer
movement based, there are many KPIs that are affected by customer movement. Traffic
is included in this category since it is traditionally the only customer movement metric
employed by retail. As such, traffic is often used to calculate other indicators with the
help of financial and store characteristics. The most used indicators of this type are
average basket size and conversion rate.
Traffic: number of store visitors.
26
Average basket size: amount of money a single customer spends in the store (or
number of items bought per transaction).
Conversion rate: ratio of store traffic to paying customers, or to transactions.
In addition to these indicators, customer flow is closely related to customer movement.
Even though the effects of customer flow are largely reported in the literature, it is often
defined very ambiguously. In this thesis, as a synthesis from the literature, flow is
presented broadly as the representations of customer behaviour within the store. In more
detail, customer flow is defined as follows.
Customer flow: the routes the customers take and the movement decisions customers
make in the store.
Research question 1.2. Which metrics employed by brick-and-mortar retail are store
spatial data based? While most literature does not define store spatial variables as
meaningful, many variables and metrics are related to them. Examples of these metrics
are sales in relation to floor space and sales per employee.
Sales in relation to floor space: how much is sold in relation to the square metre size
of the store. This can indicate such things as how well the space is utilised or how much
profit is generated with regard to the cost of maintaining the space.
Sales per employee: amount of money a single customer spends in the store compared
to sales employee count. This is also often used to differentiate employee effectiveness.
In a similar way to the customer behaviour indicator, flow can be seen as an indicator of
spatial performance of the store. Flow can show such hidden shop spatial variables as
areas of the shop that are avoided by the customers.
However there seems to be a very large portion of customer behavioural variables left
unused in the retail performance metrics. Perhaps due to measurability issues, traffic
and customer flow are very ambiguously defined in the literature, and cannot be
considered as strict variable-related KPIs for retail. However, customer flow is closely
related to such outcomes as shopping convenience and customer retention, which have
been rated as very important in the literature.
All of these customer behaviour-related metrics are hard to quantify: they are based on
variables that are often not easily accessible. This is a stark contrast to the most used
KPIs, such as sales and profit, which are easily available from normal day-to-day
operations in retail.
On the other hand, there has been a noted correlation between these two sets of
variables; most of the customer behavioural variables were seen as boosters for financial
success. There is no consensus in the literature on how to gather customer behavioural
data: many studies noted good customer flow as the cause of thriving sales, but they
calculated traffic, and to some extent flow, using only door counters. However, in this
thesis, flow is intended to reveal such store characteristics as ease of use and
convenience of shopping, which are used by retailers to maximise profits. These
characteristics can be accessed by identifying spots with the most activity, spots with
the least activity, peak hours of customers, customer time spent in different spots, and
shopper interest in different areas of the shop. It is intended that these variables can be
accessible through the use of new technologies.
27
4. Application domain analysis
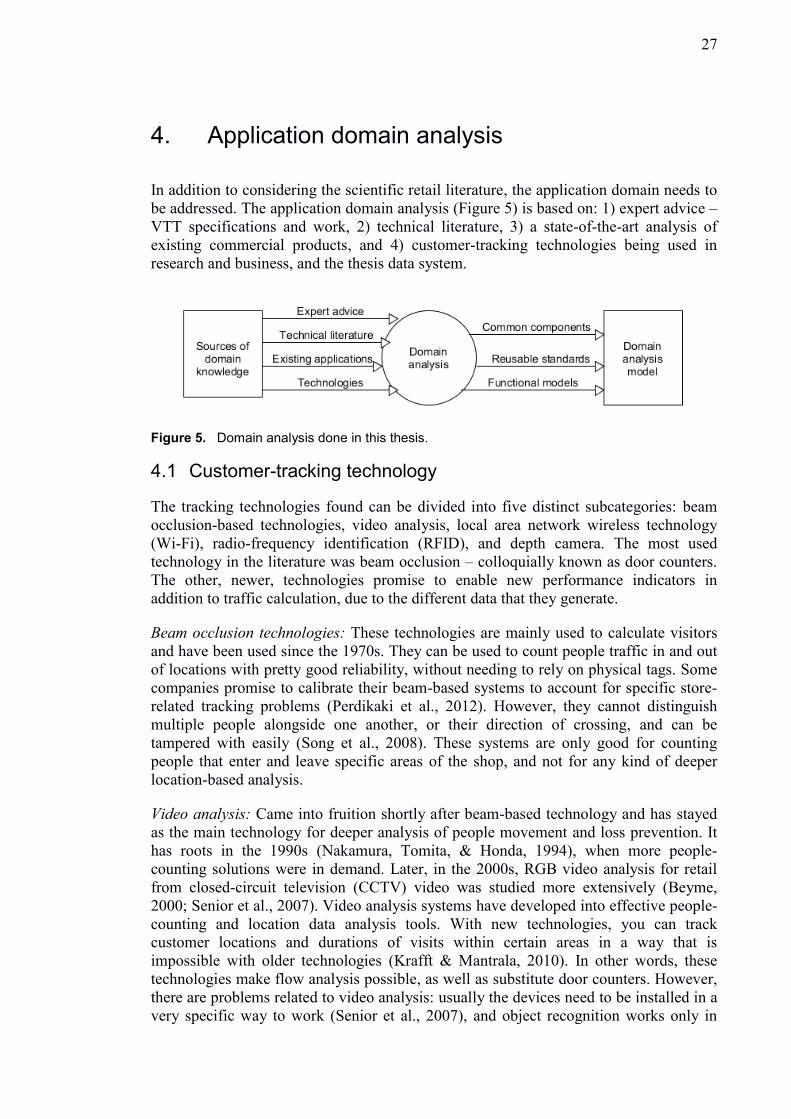
In addition to considering the scientific retail literature, the application domain needs to
be addressed. The application domain analysis (Figure 5) is based on: 1) expert advice –
VTT specifications and work, 2) technical literature, 3) a state-of-the-art analysis of
existing commercial products, and 4) customer-tracking technologies being used in
research and business, and the thesis data system.
4.1 Customer-tracking technology
The tracking technologies found can be divided into five distinct subcategories: beam
occlusion-based technologies, video analysis, local area network wireless technology
(Wi-Fi), radio-frequency identification (RFID), and depth camera. The most used
technology in the literature was beam occlusion – colloquially known as door counters.
The other, newer, technologies promise to enable new performance indicators in
addition to traffic calculation, due to the different data that they generate.
Beam occlusion technologies: These technologies are mainly used to calculate visitors
and have been used since the 1970s. They can be used to count people traffic in and out
of locations with pretty good reliability, without needing to rely on physical tags. Some
companies promise to calibrate their beam-based systems to account for specific store-
related tracking problems (Perdikaki et al., 2012). However, they cannot distinguish
multiple people alongside one another, or their direction of crossing, and can be
tampered with easily (Song et al., 2008). These systems are only good for counting
people that enter and leave specific areas of the shop, and not for any kind of deeper
location-based analysis.
Video analysis: Came into fruition shortly after beam-based technology and has stayed
as the main technology for deeper analysis of people movement and loss prevention. It
has roots in the 1990s (Nakamura, Tomita, & Honda, 1994), when more people-
counting solutions were in demand. Later, in the 2000s, RGB video analysis for retail
from closed-circuit television (CCTV) video was studied more extensively (Beyme,
2000; Senior et al., 2007). Video analysis systems have developed into effective people-
counting and location data analysis tools. With new technologies, you can track
customer locations and durations of visits within certain areas in a way that is
impossible with older technologies (Krafft & Mantrala, 2010). In other words, these
technologies make flow analysis possible, as well as substitute door counters. However,
there are problems related to video analysis: usually the devices need to be installed in a
very specific way to work (Senior et al., 2007), and object recognition works only in
Figure 5. Domain analysis done in this thesis.
28
good lighting conditions – in adverse lighting situations, the systems give far more false
positives (Jungong Han, Ling Shao, Dong Xu, & Shotton, 2013).
Wi-Fi signal analysis: This technology is hailed as the third generation of people-
counting systems. These systems have been used since the late 2000s, and they provide
similar data to video analysis systems. Wi-Fi-based technology enables customer flow
analysis in a similar manner to video analysis. Wi-Fi analysis offers one quality over
other technologies: it can identify returning users by their device addresses. This enables
such analysis as customer retention and demographics, which are impossible for other
technologies. This presents a new problem, however: when the identity of customers
can be deduced, anonymity and privacy concerns arise. Furthermore, Wi-Fi analysis
cannot account for visitors that have either Wi-Fi turned off on their devices or that do
not even own a device with Wi-Fi capabilities.
Depth camera: While under-utilised in the literature and domain at this time, depth
camera-related people-tracking systems can be viewed as very efficient, with both cost
and system efficiency. These systems are very new to the field of people tracking, only
having been used since the 2010s. The use of such sensors as Microsoft Kinect and
Asus Xtion in applications beyond entertainment is of great interest for many
researchers (Gonzalez-Jorge, Riveiro, Vazquez-Fernandez, Martínez-Sánchez, & Arias,
2013). Many studies have outlined the ease of object and human recognition with a
depth camera, when compared to video analysis (Gonzalez-Jorge et al., 2013; Jungong
Han et al., 2013). Gonzalez-Jorge et al. (2013) found that both video and depth sensors
are precise up to 2 metres within a 20 mm range. According to Jungong Han et al.
(2013), in stable light conditions a Kinect sensor gave 0% false positives and 96.7% true
positives through depth analysis, while video analysis gave 2.3% false positives and
only 45.3% true positives. According to Jungong et al. (2013), this is due to the
foreground and background object resolution being better with depth imaging. The
depth camera brings four qualities to the people-tracker domain: easily actionable data,
easy installation, better results in adverse situations than video analysis, and low system
costs. This can be seen as the new generation of people-tracking technologies; however,
there are not many systems that work based on these sensors.
RFID: Radio frequency identification tags need to be physically inserted into either
products or shopping equipment to be usable in customer tracking. For this reason,
RFID cannot easily follow all of the people in the store: it cannot detect those who do
not purchase tagged products or did not use tagged equipment (Al-Kassab, Thiesse, &
Buckel, 2013; Buckel & Thiesse, 2014). In essence, the basic traffic calculation is
unreliable with RFID tags, and the systems are often used for different means. RFID
systems can easily be used for inventory-related KPIs, but not very reliably for
customer-related ones – they cannot track all customer locations. In addition, it has been
noted that false positives and error readings with the installed RFID systems can be
high, and the cost of an all-encompassing RFID system is very high (Al-Kassab et al.,
2013).
Even with their caveats, the different systems all have their strengths for retail domain.
RFID is unsurpassed in automated inventory management. Beam systems are very easy
to install and to maintain. Video and Wi-Fi systems enable flow analysis in addition to
traffic calculation, with Wi-Fi systems having customer identification possibilities.
Depth cameras are not highly used, but promise to enable all of the same analysis as
video and Wi-Fi analysis with easier maintenance, better accuracy, and more precision,
as well as privacy.
29
It is notable that different technologies make different performance indicators usable for
retail. Beam occlusion and video analysis have been used for a long time and have
offered a well-established indicator of traffic. In addition to traffic, the data types of
video, Wi-Fi, and depth analysis enable more enveloping spatial metrics. The
possibilities of new technologies, however ambiguous in the literature, are realised
better in the commercial sector – there are many companies that offer these new
performance indicators by using the technologies outlined.
4.2 State-of-the-art analysis of commercial systems
This analysis is based on the fact that these tracking technologies have been used by
companies to offer commercial customer-tracking solutions. The state-of-the-art
analysis is done by the author of this thesis, and it is based on the competitor listing
provided by VTT.
From a total of 32 competitors, 13 were selected for analysis on the basis of readiness of
the service and robustness of the technology. It was found that the technologies used by
the companies are the same as in the technical literature. In this analysis, the physical
and virtual promotional material, websites, and demos (where applicable) were studied
to find what technologies the companies used and what performance metrics they
promised to provide and how they visualised the results. The list of reviewed
companies, their products, and general information can be found in Appendix C.
All 13 selected companies are offering solutions strictly related to visitor-tracking
solutions for brick-and-mortar retail stores. While all of the systems deliver what they
promise, most of them have some form of limitations. These limitations mirror those
found in the literature: technology often dictates what kind of analysis is possible.
Traffic calculation using beam-based technologies and video analysis has been used
commercially for a longer time than depth cameras, Wi-Fi analysis, and RFID tags (Al-
Kassab et al., 2013; Gonzalez-Jorge et al., 2013; Nakamura et al., 1994). Older traffic
calculation technologies represent most of the technologies used by these companies,
with 8 of the 13.
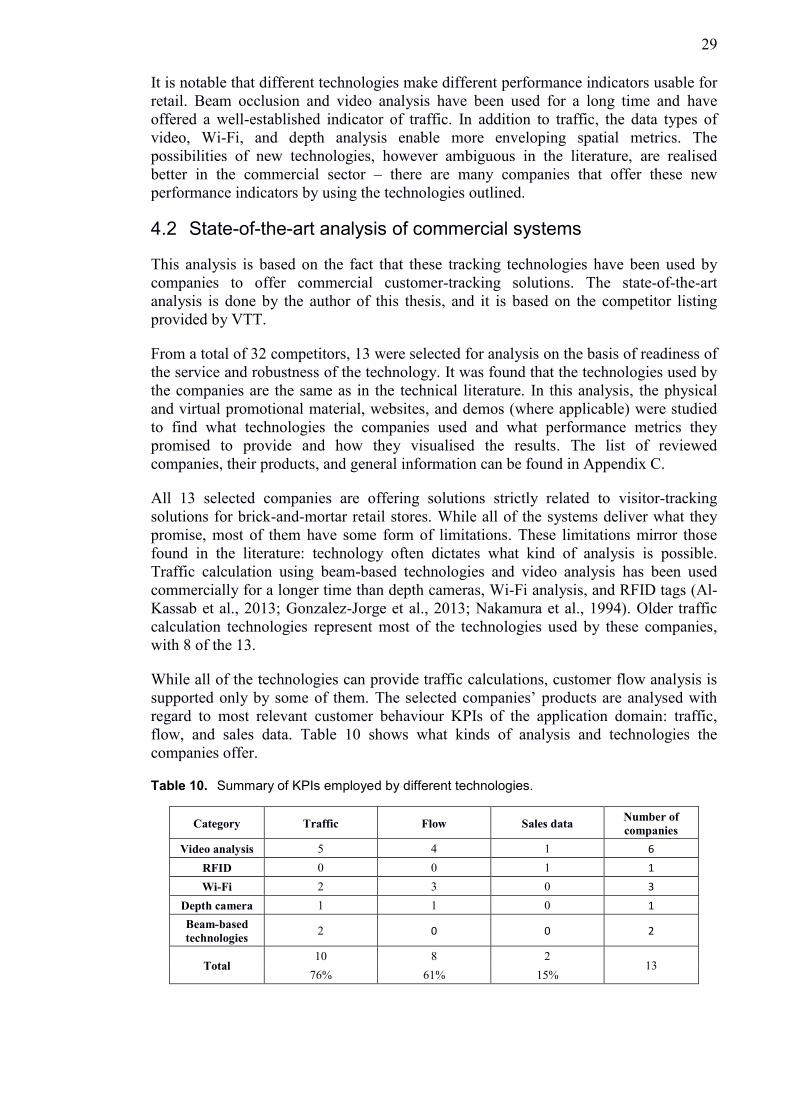
While all of the technologies can provide traffic calculations, customer flow analysis is
supported only by some of them. The selected companies’ products are analysed with
regard to most relevant customer behaviour KPIs of the application domain: traffic,
flow, and sales data. Table 10 shows what kinds of analysis and technologies the
companies offer.
Table 10. Summary of KPIs employed by different technologies.
Category Traffic Flow Sales data Number of
companies
Video analysis 5 4 1 6
RFID 0 0 1 1
Wi-Fi 2 3 0 3
Depth camera 1 1 0 1
Beam-based
technologies 2 0 0 2
Total 10 8 2
13 76% 61% 15%
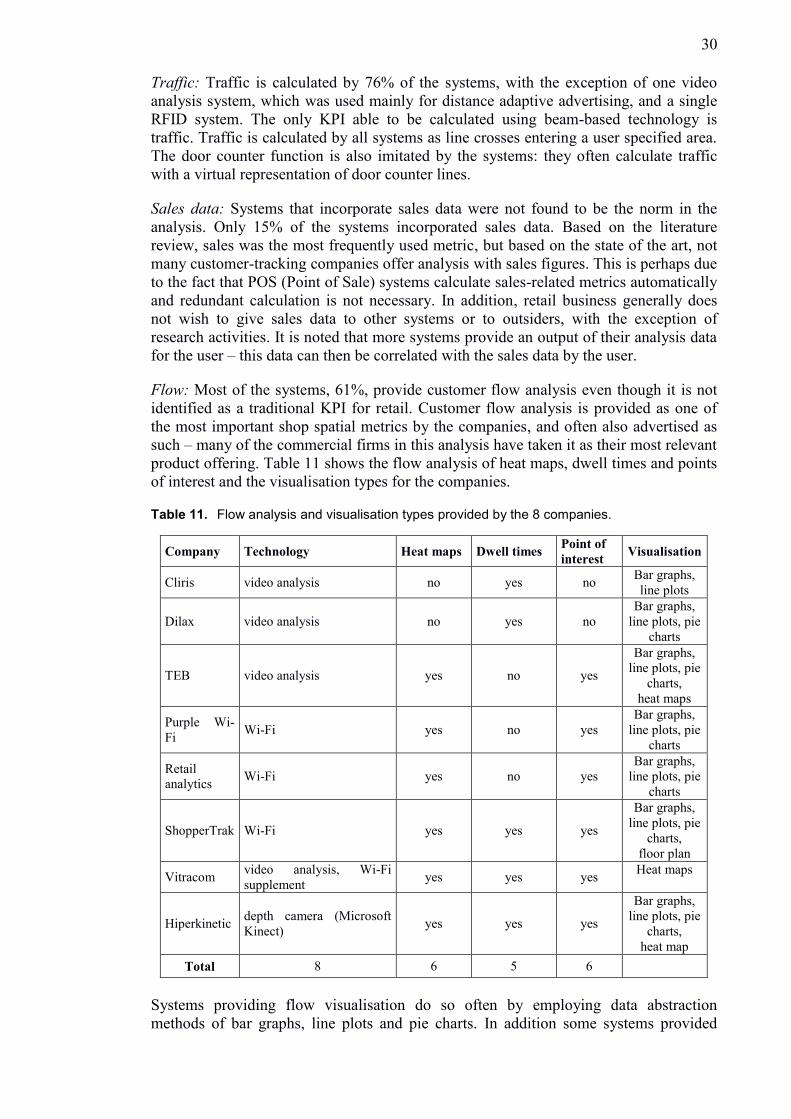
30
Traffic: Traffic is calculated by 76% of the systems, with the exception of one video
analysis system, which was used mainly for distance adaptive advertising, and a single
RFID system. The only KPI able to be calculated using beam-based technology is
traffic. Traffic is calculated by all systems as line crosses entering a user specified area.
The door counter function is also imitated by the systems: they often calculate traffic
with a virtual representation of door counter lines.
Sales data: Systems that incorporate sales data were not found to be the norm in the
analysis. Only 15% of the systems incorporated sales data. Based on the literature
review, sales was the most frequently used metric, but based on the state of the art, not
many customer-tracking companies offer analysis with sales figures. This is perhaps due
to the fact that POS (Point of Sale) systems calculate sales-related metrics automatically
and redundant calculation is not necessary. In addition, retail business generally does
not wish to give sales data to other systems or to outsiders, with the exception of
research activities. It is noted that more systems provide an output of their analysis data
for the user – this data can then be correlated with the sales data by the user.
Flow: Most of the systems, 61%, provide customer flow analysis even though it is not
identified as a traditional KPI for retail. Customer flow analysis is provided as one of
the most important shop spatial metrics by the companies, and often also advertised as
such – many of the commercial firms in this analysis have taken it as their most relevant
product offering. Table 11 shows the flow analysis of heat maps, dwell times and points
of interest and the visualisation types for the companies.
Table 11. Flow analysis and visualisation types provided by the 8 companies.
Company Technology Heat maps Dwell times Point of
interest Visualisation
Cliris video analysis no yes no Bar graphs,
line plots
Dilax video analysis no yes no
Bar graphs,
line plots, pie
charts
TEB video analysis yes no yes
Bar graphs,
line plots, pie
charts,
heat maps
Purple Wi-
Fi Wi-Fi yes no yes
Bar graphs,
line plots, pie
charts
Retail
analytics Wi-Fi yes no yes
Bar graphs,
line plots, pie
charts
ShopperTrak Wi-Fi yes yes yes
Bar graphs,
line plots, pie
charts,
floor plan
Vitracom video analysis, Wi-Fi
supplement yes yes yes
Heat maps
Hiperkinetic depth camera (Microsoft
Kinect) yes yes yes
Bar graphs,
line plots, pie
charts,
heat map
Total 8 6 5 6
Systems providing flow visualisation do so often by employing data abstraction
methods of bar graphs, line plots and pie charts. In addition some systems provided
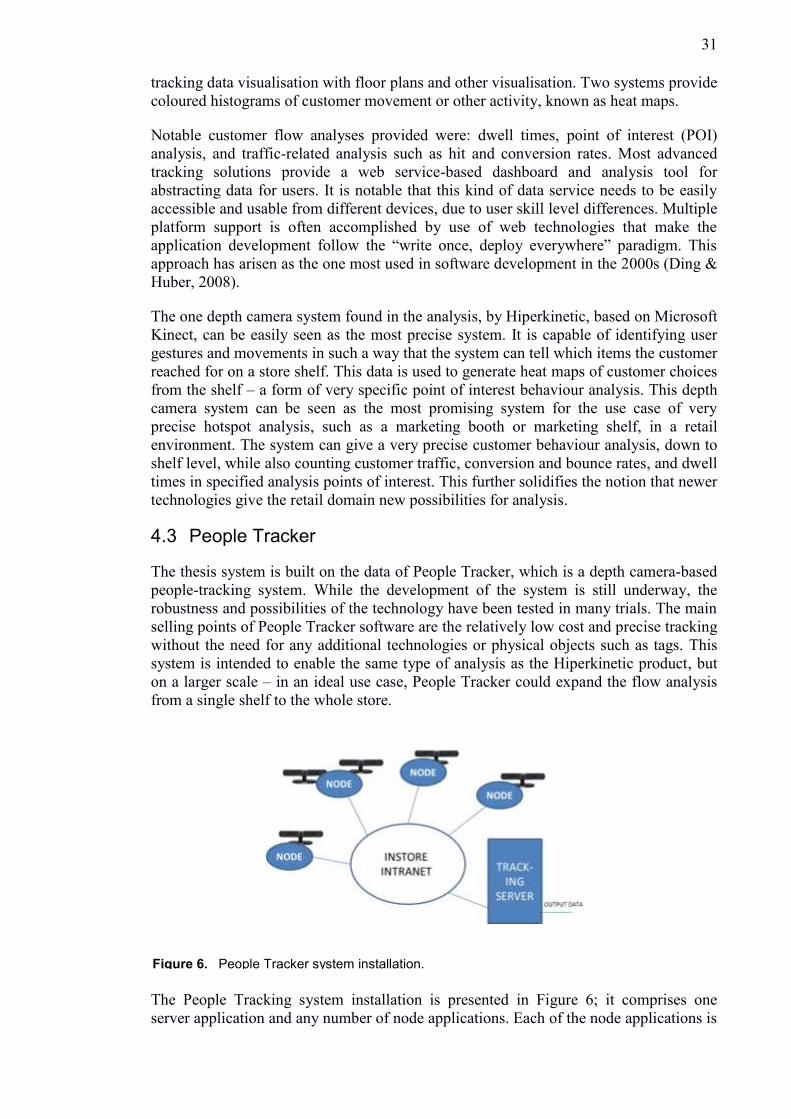
31
tracking data visualisation with floor plans and other visualisation. Two systems provide
coloured histograms of customer movement or other activity, known as heat maps.
Notable customer flow analyses provided were: dwell times, point of interest (POI)
analysis, and traffic-related analysis such as hit and conversion rates. Most advanced
tracking solutions provide a web service-based dashboard and analysis tool for
abstracting data for users. It is notable that this kind of data service needs to be easily
accessible and usable from different devices, due to user skill level differences. Multiple
platform support is often accomplished by use of web technologies that make the
application development follow the “write once, deploy everywhere” paradigm. This
approach has arisen as the one most used in software development in the 2000s (Ding &
Huber, 2008).
The one depth camera system found in the analysis, by Hiperkinetic, based on Microsoft
Kinect, can be easily seen as the most precise system. It is capable of identifying user
gestures and movements in such a way that the system can tell which items the customer
reached for on a store shelf. This data is used to generate heat maps of customer choices
from the shelf – a form of very specific point of interest behaviour analysis. This depth
camera system can be seen as the most promising system for the use case of very
precise hotspot analysis, such as a marketing booth or marketing shelf, in a retail
environment. The system can give a very precise customer behaviour analysis, down to
shelf level, while also counting customer traffic, conversion and bounce rates, and dwell
times in specified analysis points of interest. This further solidifies the notion that newer
technologies give the retail domain new possibilities for analysis.
4.3 People Tracker
The thesis system is built on the data of People Tracker, which is a depth camera-based
people-tracking system. While the development of the system is still underway, the
robustness and possibilities of the technology have been tested in many trials. The main
selling points of People Tracker software are the relatively low cost and precise tracking
without the need for any additional technologies or physical objects such as tags. This
system is intended to enable the same type of analysis as the Hiperkinetic product, but
on a larger scale – in an ideal use case, People Tracker could expand the flow analysis
from a single shelf to the whole store.
The People Tracking system installation is presented in Figure 6; it comprises one
server application and any number of node applications. Each of the node applications is
Figure 6. People Tracker system installation.
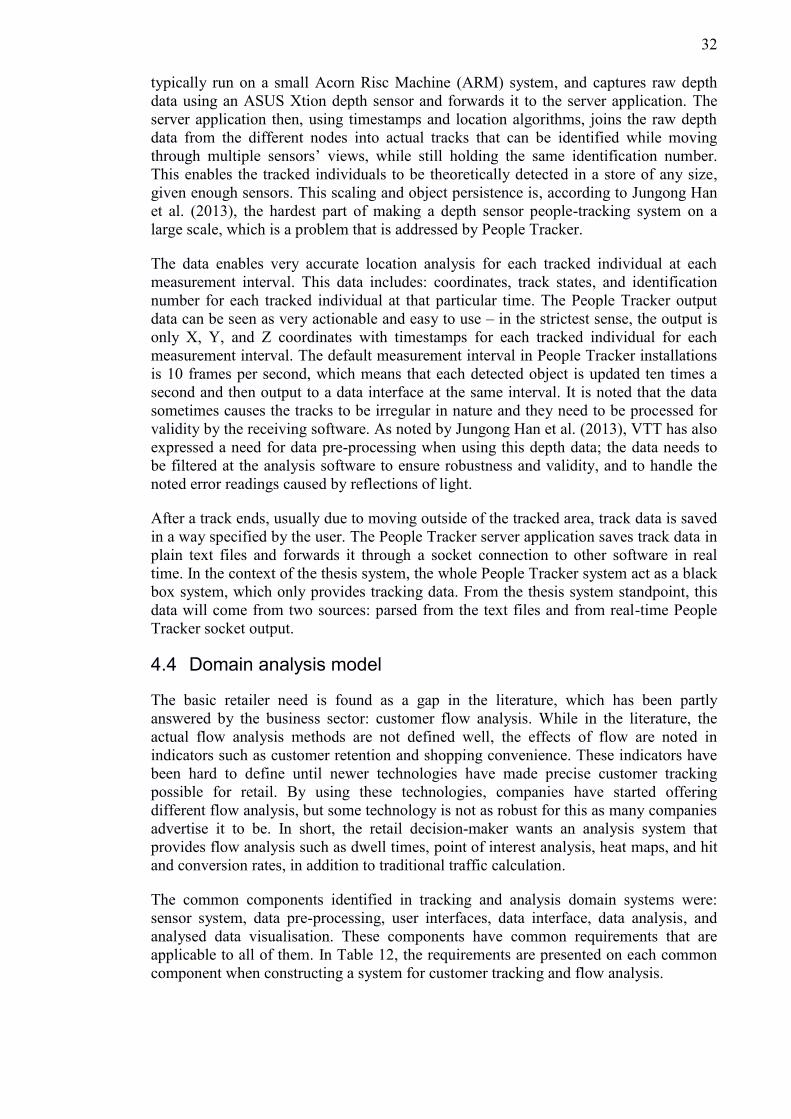
32
typically run on a small Acorn Risc Machine (ARM) system, and captures raw depth
data using an ASUS Xtion depth sensor and forwards it to the server application. The
server application then, using timestamps and location algorithms, joins the raw depth
data from the different nodes into actual tracks that can be identified while moving
through multiple sensors’ views, while still holding the same identification number.
This enables the tracked individuals to be theoretically detected in a store of any size,
given enough sensors. This scaling and object persistence is, according to Jungong Han
et al. (2013), the hardest part of making a depth sensor people-tracking system on a
large scale, which is a problem that is addressed by People Tracker.
The data enables very accurate location analysis for each tracked individual at each
measurement interval. This data includes: coordinates, track states, and identification
number for each tracked individual at that particular time. The People Tracker output
data can be seen as very actionable and easy to use – in the strictest sense, the output is
only X, Y, and Z coordinates with timestamps for each tracked individual for each
measurement interval. The default measurement interval in People Tracker installations
is 10 frames per second, which means that each detected object is updated ten times a
second and then output to a data interface at the same interval. It is noted that the data
sometimes causes the tracks to be irregular in nature and they need to be processed for
validity by the receiving software. As noted by Jungong Han et al. (2013), VTT has also
expressed a need for data pre-processing when using this depth data; the data needs to
be filtered at the analysis software to ensure robustness and validity, and to handle the
noted error readings caused by reflections of light.
After a track ends, usually due to moving outside of the tracked area, track data is saved
in a way specified by the user. The People Tracker server application saves track data in
plain text files and forwards it through a socket connection to other software in real
time. In the context of the thesis system, the whole People Tracker system act as a black
box system, which only provides tracking data. From the thesis system standpoint, this
data will come from two sources: parsed from the text files and from real-time People
Tracker socket output.
4.4 Domain analysis model
The basic retailer need is found as a gap in the literature, which has been partly
answered by the business sector: customer flow analysis. While in the literature, the
actual flow analysis methods are not defined well, the effects of flow are noted in
indicators such as customer retention and shopping convenience. These indicators have
been hard to define until newer technologies have made precise customer tracking
possible for retail. By using these technologies, companies have started offering
different flow analysis, but some technology is not as robust for this as many companies
advertise it to be. In short, the retail decision-maker wants an analysis system that
provides flow analysis such as dwell times, point of interest analysis, heat maps, and hit
and conversion rates, in addition to traditional traffic calculation.
The common components identified in tracking and analysis domain systems were:
sensor system, data pre-processing, user interfaces, data interface, data analysis, and
analysed data visualisation. These components have common requirements that are
applicable to all of them. In Table 12, the requirements are presented on each common
component when constructing a system for customer tracking and flow analysis.
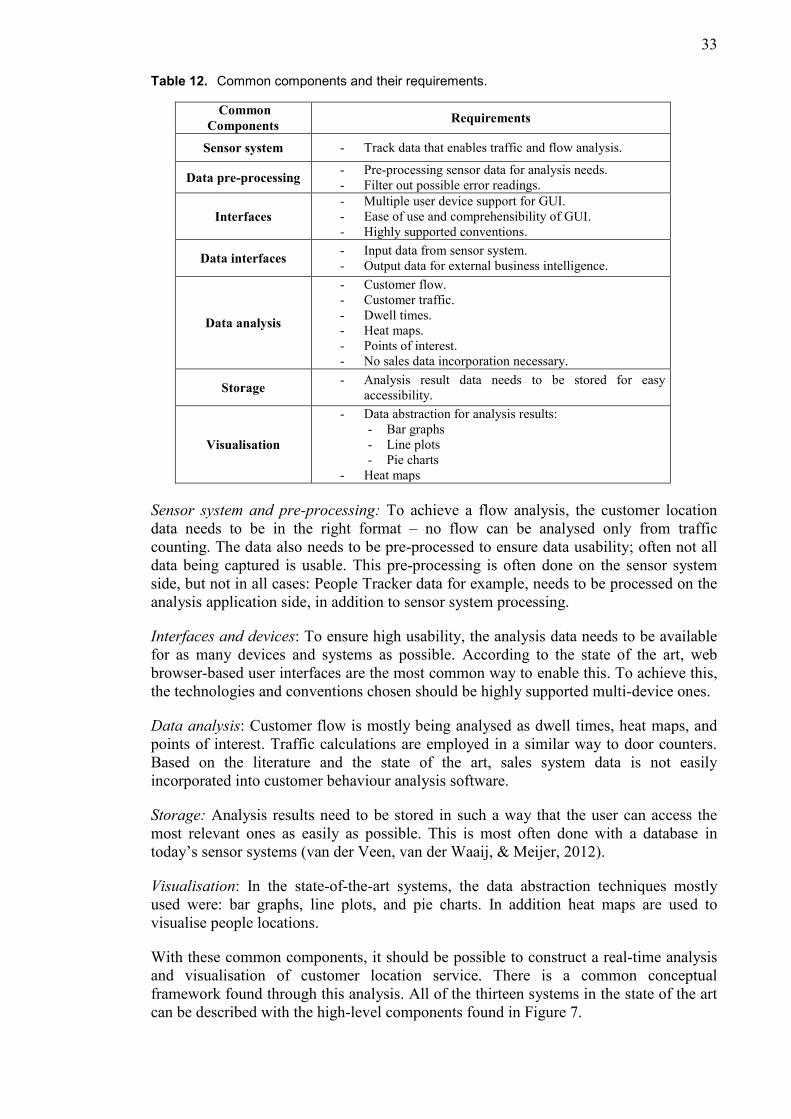
33
Table 12. Common components and their requirements.
Common
Components Requirements
Sensor system - Track data that enables traffic and flow analysis.
Data pre-processing - Pre-processing sensor data for analysis needs.
- Filter out possible error readings.
Interfaces
- Multiple user device support for GUI.
- Ease of use and comprehensibility of GUI.
- Highly supported conventions.
Data interfaces - Input data from sensor system.
- Output data for external business intelligence.
Data analysis
- Customer flow.
- Customer traffic.
- Dwell times.
- Heat maps.
- Points of interest.
- No sales data incorporation necessary.
Storage - Analysis result data needs to be stored for easy
accessibility.
Visualisation
- Data abstraction for analysis results:
- Bar graphs
- Line plots
- Pie charts
- Heat maps
Sensor system and pre-processing: To achieve a flow analysis, the customer location
data needs to be in the right format – no flow can be analysed only from traffic
counting. The data also needs to be pre-processed to ensure data usability; often not all
data being captured is usable. This pre-processing is often done on the sensor system
side, but not in all cases: People Tracker data for example, needs to be processed on the
analysis application side, in addition to sensor system processing.
Interfaces and devices: To ensure high usability, the analysis data needs to be available
for as many devices and systems as possible. According to the state of the art, web
browser-based user interfaces are the most common way to enable this. To achieve this,
the technologies and conventions chosen should be highly supported multi-device ones.
Data analysis: Customer flow is mostly being analysed as dwell times, heat maps, and
points of interest. Traffic calculations are employed in a similar way to door counters.
Based on the literature and the state of the art, sales system data is not easily
incorporated into customer behaviour analysis software.
Storage: Analysis results need to be stored in such a way that the user can access the
most relevant ones as easily as possible. This is most often done with a database in
today’s sensor systems (van der Veen, van der Waaij, & Meijer, 2012).
Visualisation: In the state-of-the-art systems, the data abstraction techniques mostly
used were: bar graphs, line plots, and pie charts. In addition heat maps are used to
visualise people locations.
With these common components, it should be possible to construct a real-time analysis
and visualisation of customer location service. There is a common conceptual
framework found through this analysis. All of the thirteen systems in the state of the art
can be described with the high-level components found in Figure 7.
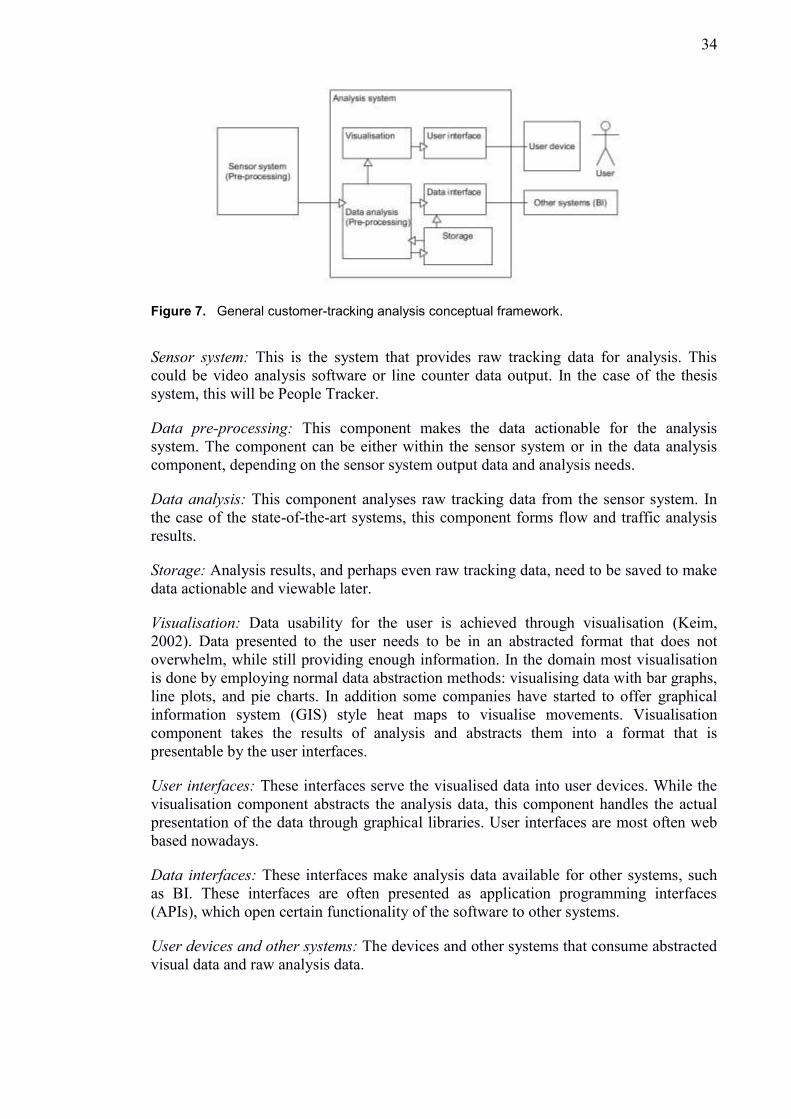
34
Sensor system: This is the system that provides raw tracking data for analysis. This
could be video analysis software or line counter data output. In the case of the thesis
system, this will be People Tracker.
Data pre-processing: This component makes the data actionable for the analysis
system. The component can be either within the sensor system or in the data analysis
component, depending on the sensor system output data and analysis needs.
Data analysis: This component analyses raw tracking data from the sensor system. In
the case of the state-of-the-art systems, this component forms flow and traffic analysis
results.
Storage: Analysis results, and perhaps even raw tracking data, need to be saved to make
data actionable and viewable later.
Visualisation: Data usability for the user is achieved through visualisation (Keim,
2002). Data presented to the user needs to be in an abstracted format that does not
overwhelm, while still providing enough information. In the domain most visualisation
is done by employing normal data abstraction methods: visualising data with bar graphs,
line plots, and pie charts. In addition some companies have started to offer graphical
information system (GIS) style heat maps to visualise movements. Visualisation
component takes the results of analysis and abstracts them into a format that is
presentable by the user interfaces.
User interfaces: These interfaces serve the visualised data into user devices. While the
visualisation component abstracts the analysis data, this component handles the actual
presentation of the data through graphical libraries. User interfaces are most often web
based nowadays.
Data interfaces: These interfaces make analysis data available for other systems, such
as BI. These interfaces are often presented as application programming interfaces
(APIs), which open certain functionality of the software to other systems.
User devices and other systems: The devices and other systems that consume abstracted
visual data and raw analysis data.
Figure 7. General customer-tracking analysis conceptual framework.
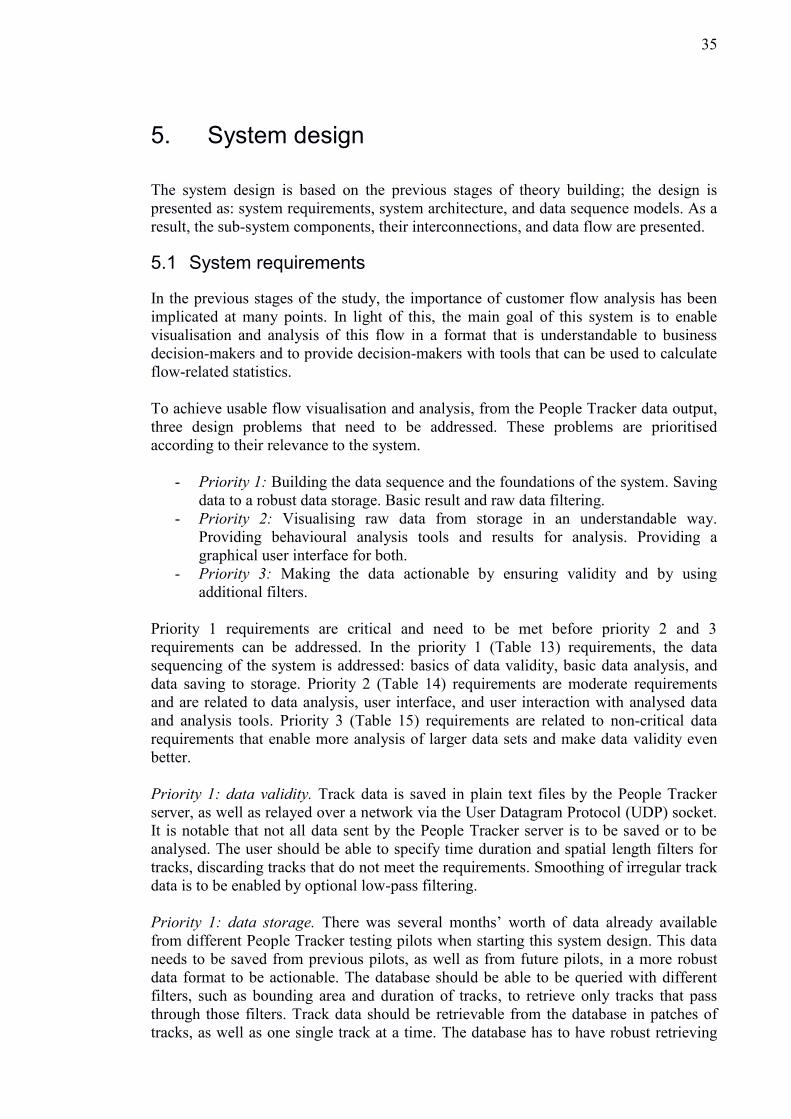
35
5. System design
The system design is based on the previous stages of theory building; the design is
presented as: system requirements, system architecture, and data sequence models. As a
result, the sub-system components, their interconnections, and data flow are presented.
5.1 System requirements
In the previous stages of the study, the importance of customer flow analysis has been
implicated at many points. In light of this, the main goal of this system is to enable
visualisation and analysis of this flow in a format that is understandable to business
decision-makers and to provide decision-makers with tools that can be used to calculate
flow-related statistics.
To achieve usable flow visualisation and analysis, from the People Tracker data output,
three design problems that need to be addressed. These problems are prioritised
according to their relevance to the system.
- Priority 1: Building the data sequence and the foundations of the system. Saving
data to a robust data storage. Basic result and raw data filtering.
- Priority 2: Visualising raw data from storage in an understandable way.
Providing behavioural analysis tools and results for analysis. Providing a
graphical user interface for both.
- Priority 3: Making the data actionable by ensuring validity and by using
additional filters.
Priority 1 requirements are critical and need to be met before priority 2 and 3
requirements can be addressed. In the priority 1 (Table 13) requirements, the data
sequencing of the system is addressed: basics of data validity, basic data analysis, and
data saving to storage. Priority 2 (Table 14) requirements are moderate requirements
and are related to data analysis, user interface, and user interaction with analysed data
and analysis tools. Priority 3 (Table 15) requirements are related to non-critical data
requirements that enable more analysis of larger data sets and make data validity even
better.
Priority 1: data validity. Track data is saved in plain text files by the People Tracker
server, as well as relayed over a network via the User Datagram Protocol (UDP) socket.
It is notable that not all data sent by the People Tracker server is to be saved or to be
analysed. The user should be able to specify time duration and spatial length filters for
tracks, discarding tracks that do not meet the requirements. Smoothing of irregular track
data is to be enabled by optional low-pass filtering.
Priority 1: data storage. There was several months’ worth of data already available
from different People Tracker testing pilots when starting this system design. This data
needs to be saved from previous pilots, as well as from future pilots, in a more robust
data format to be actionable. The database should be able to be queried with different
filters, such as bounding area and duration of tracks, to retrieve only tracks that pass
through those filters. Track data should be retrievable from the database in patches of
tracks, as well as one single track at a time. The database has to have robust retrieving
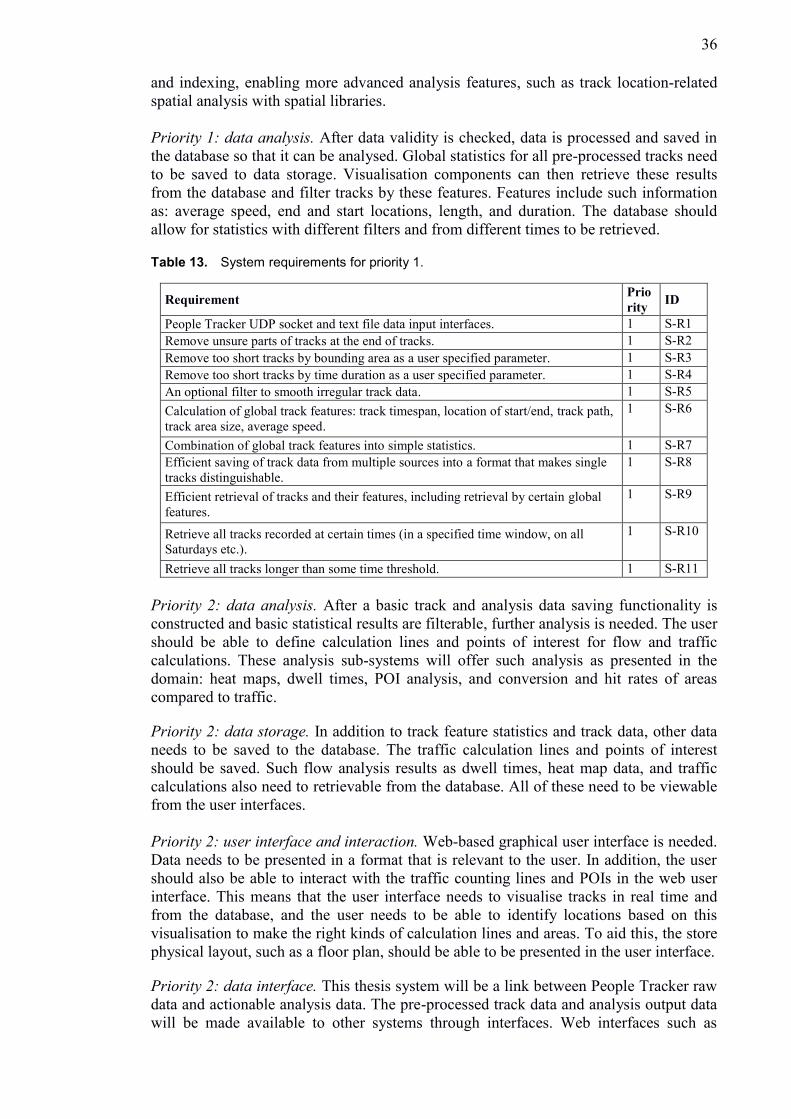
36
and indexing, enabling more advanced analysis features, such as track location-related
spatial analysis with spatial libraries.
Priority 1: data analysis. After data validity is checked, data is processed and saved in
the database so that it can be analysed. Global statistics for all pre-processed tracks need
to be saved to data storage. Visualisation components can then retrieve these results
from the database and filter tracks by these features. Features include such information
as: average speed, end and start locations, length, and duration. The database should
allow for statistics with different filters and from different times to be retrieved.
Table 13. System requirements for priority 1.
Requirement Prio
rity ID
People Tracker UDP socket and text file data input interfaces. 1 S-R1
Remove unsure parts of tracks at the end of tracks. 1 S-R2
Remove too short tracks by bounding area as a user specified parameter. 1 S-R3
Remove too short tracks by time duration as a user specified parameter. 1 S-R4
An optional filter to smooth irregular track data. 1 S-R5
Calculation of global track features: track timespan, location of start/end, track path,
track area size, average speed.
1 S-R6
Combination of global track features into simple statistics. 1 S-R7
Efficient saving of track data from multiple sources into a format that makes single
tracks distinguishable.
1 S-R8
Efficient retrieval of tracks and their features, including retrieval by certain global
features.
1 S-R9
Retrieve all tracks recorded at certain times (in a specified time window, on all
Saturdays etc.).
1 S-R10
Retrieve all tracks longer than some time threshold. 1 S-R11
Priority 2: data analysis. After a basic track and analysis data saving functionality is
constructed and basic statistical results are filterable, further analysis is needed. The user
should be able to define calculation lines and points of interest for flow and traffic
calculations. These analysis sub-systems will offer such analysis as presented in the
domain: heat maps, dwell times, POI analysis, and conversion and hit rates of areas
compared to traffic.
Priority 2: data storage. In addition to track feature statistics and track data, other data
needs to be saved to the database. The traffic calculation lines and points of interest
should be saved. Such flow analysis results as dwell times, heat map data, and traffic
calculations also need to retrievable from the database. All of these need to be viewable
from the user interfaces.
Priority 2: user interface and interaction. Web-based graphical user interface is needed.
Data needs to be presented in a format that is relevant to the user. In addition, the user
should also be able to interact with the traffic counting lines and POIs in the web user
interface. This means that the user interface needs to visualise tracks in real time and
from the database, and the user needs to be able to identify locations based on this
visualisation to make the right kinds of calculation lines and areas. To aid this, the store
physical layout, such as a floor plan, should be able to be presented in the user interface.
Priority 2: data interface. This thesis system will be a link between People Tracker raw
data and actionable analysis data. The pre-processed track data and analysis output data
will be made available to other systems through interfaces. Web interfaces such as
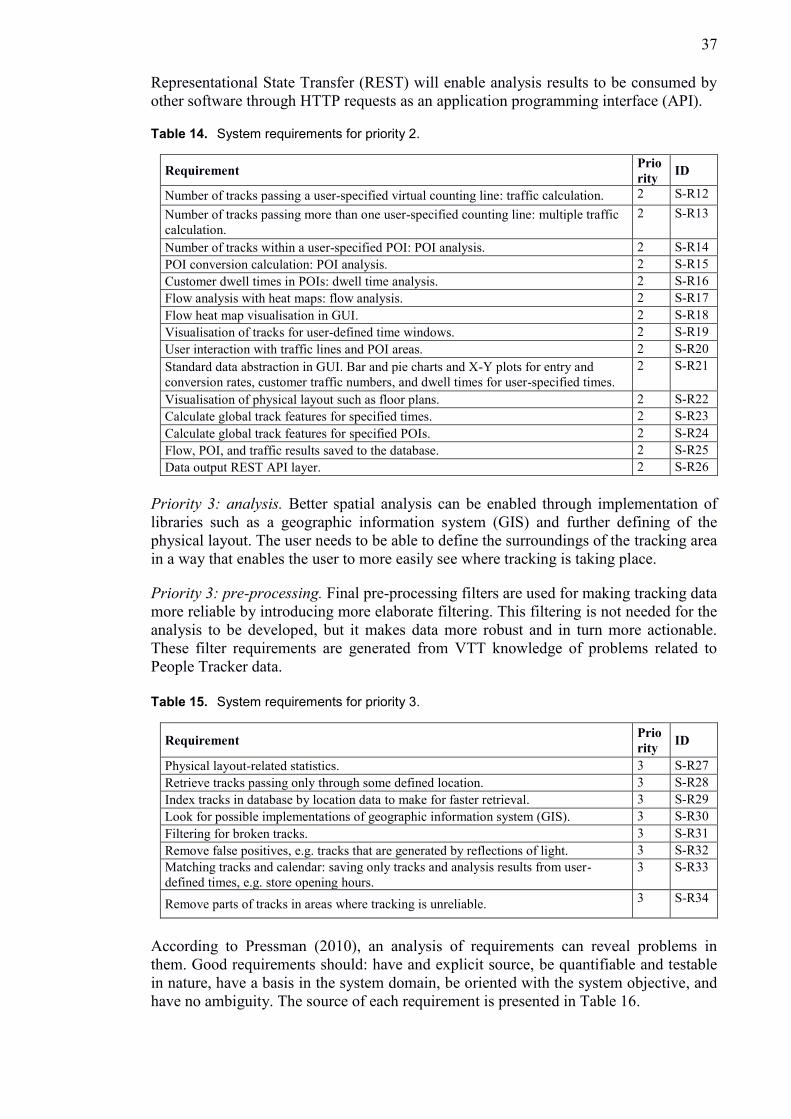
37
Representational State Transfer (REST) will enable analysis results to be consumed by
other software through HTTP requests as an application programming interface (API).
Table 14. System requirements for priority 2.
Requirement Prio
rity ID
Number of tracks passing a user-specified virtual counting line: traffic calculation. 2 S-R12
Number of tracks passing more than one user-specified counting line: multiple traffic
calculation.
2 S-R13
Number of tracks within a user-specified POI: POI analysis. 2 S-R14
POI conversion calculation: POI analysis. 2 S-R15
Customer dwell times in POIs: dwell time analysis. 2 S-R16
Flow analysis with heat maps: flow analysis. 2 S-R17
Flow heat map visualisation in GUI. 2 S-R18
Visualisation of tracks for user-defined time windows. 2 S-R19
User interaction with traffic lines and POI areas. 2 S-R20
Standard data abstraction in GUI. Bar and pie charts and X-Y plots for entry and
conversion rates, customer traffic numbers, and dwell times for user-specified times.
2 S-R21
Visualisation of physical layout such as floor plans. 2 S-R22
Calculate global track features for specified times. 2 S-R23
Calculate global track features for specified POIs. 2 S-R24
Flow, POI, and traffic results saved to the database. 2 S-R25
Data output REST API layer. 2 S-R26
Priority 3: analysis. Better spatial analysis can be enabled through implementation of
libraries such as a geographic information system (GIS) and further defining of the
physical layout. The user needs to be able to define the surroundings of the tracking area
in a way that enables the user to more easily see where tracking is taking place.
Priority 3: pre-processing. Final pre-processing filters are used for making tracking data
more reliable by introducing more elaborate filtering. This filtering is not needed for the
analysis to be developed, but it makes data more robust and in turn more actionable.
These filter requirements are generated from VTT knowledge of problems related to
People Tracker data.
Table 15. System requirements for priority 3.
Requirement Prio
rity ID
Physical layout-related statistics. 3 S-R27
Retrieve tracks passing only through some defined location. 3 S-R28
Index tracks in database by location data to make for faster retrieval. 3 S-R29
Look for possible implementations of geographic information system (GIS). 3 S-R30
Filtering for broken tracks. 3 S-R31
Remove false positives, e.g. tracks that are generated by reflections of light. 3 S-R32
Matching tracks and calendar: saving only tracks and analysis results from user-
defined times, e.g. store opening hours.
3 S-R33
Remove parts of tracks in areas where tracking is unreliable. 3 S-R34
According to Pressman (2010), an analysis of requirements can reveal problems in
them. Good requirements should: have and explicit source, be quantifiable and testable
in nature, have a basis in the system domain, be oriented with the system objective, and
have no ambiguity. The source of each requirement is presented in Table 16.
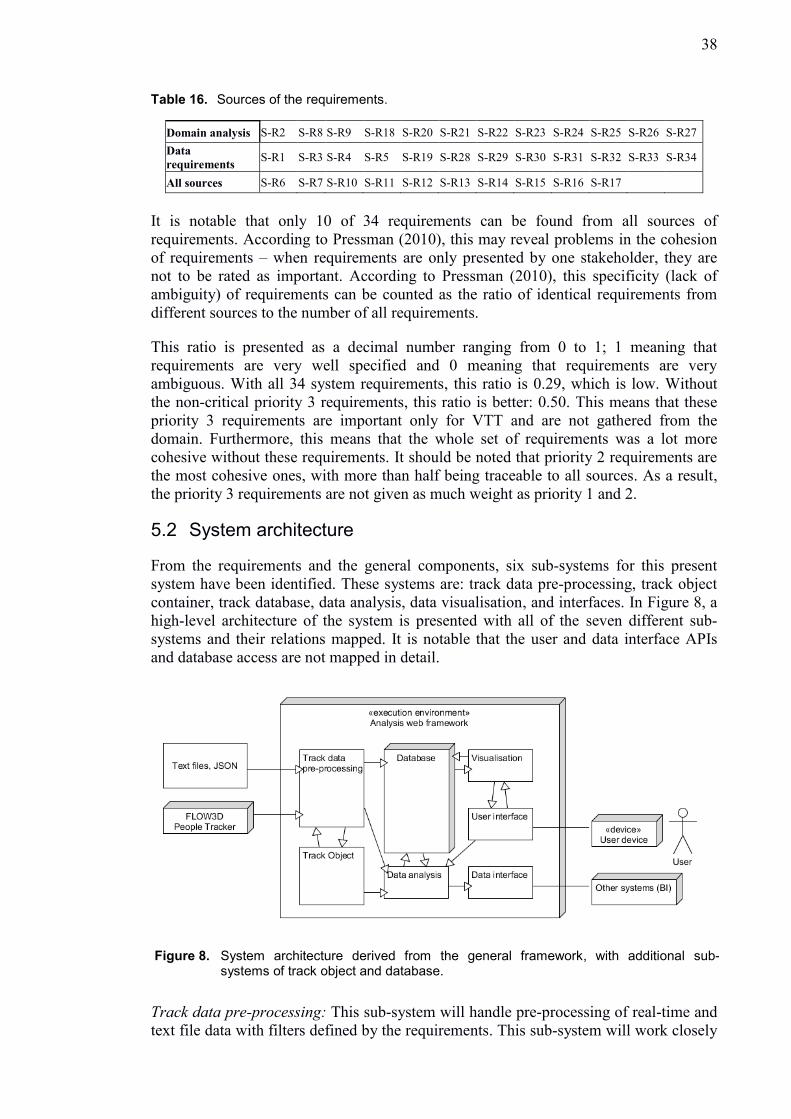
38
Table 16. Sources of the requirements.
Domain analysis S-R2 S-R8 S-R9 S-R18 S-R20 S-R21 S-R22 S-R23 S-R24 S-R25 S-R26 S-R27
Data
requirements S-R1 S-R3 S-R4 S-R5 S-R19 S-R28 S-R29 S-R30 S-R31 S-R32 S-R33 S-R34
All sources S-R6 S-R7 S-R10 S-R11 S-R12 S-R13 S-R14 S-R15 S-R16 S-R17
It is notable that only 10 of 34 requirements can be found from all sources of
requirements. According to Pressman (2010), this may reveal problems in the cohesion
of requirements – when requirements are only presented by one stakeholder, they are
not to be rated as important. According to Pressman (2010), this specificity (lack of
ambiguity) of requirements can be counted as the ratio of identical requirements from
different sources to the number of all requirements.
This ratio is presented as a decimal number ranging from 0 to 1; 1 meaning that
requirements are very well specified and 0 meaning that requirements are very
ambiguous. With all 34 system requirements, this ratio is 0.29, which is low. Without
the non-critical priority 3 requirements, this ratio is better: 0.50. This means that these
priority 3 requirements are important only for VTT and are not gathered from the
domain. Furthermore, this means that the whole set of requirements was a lot more
cohesive without these requirements. It should be noted that priority 2 requirements are
the most cohesive ones, with more than half being traceable to all sources. As a result,
the priority 3 requirements are not given as much weight as priority 1 and 2.
5.2 System architecture
From the requirements and the general components, six sub-systems for this present
system have been identified. These systems are: track data pre-processing, track object
container, track database, data analysis, data visualisation, and interfaces. In Figure 8, a
high-level architecture of the system is presented with all of the seven different sub-
systems and their relations mapped. It is notable that the user and data interface APIs
and database access are not mapped in detail.
Track data pre-processing: This sub-system will handle pre-processing of real-time and
text file data with filters defined by the requirements. This sub-system will work closely
Figure 8. System architecture derived from the general framework, with additional sub-systems of track object and database.
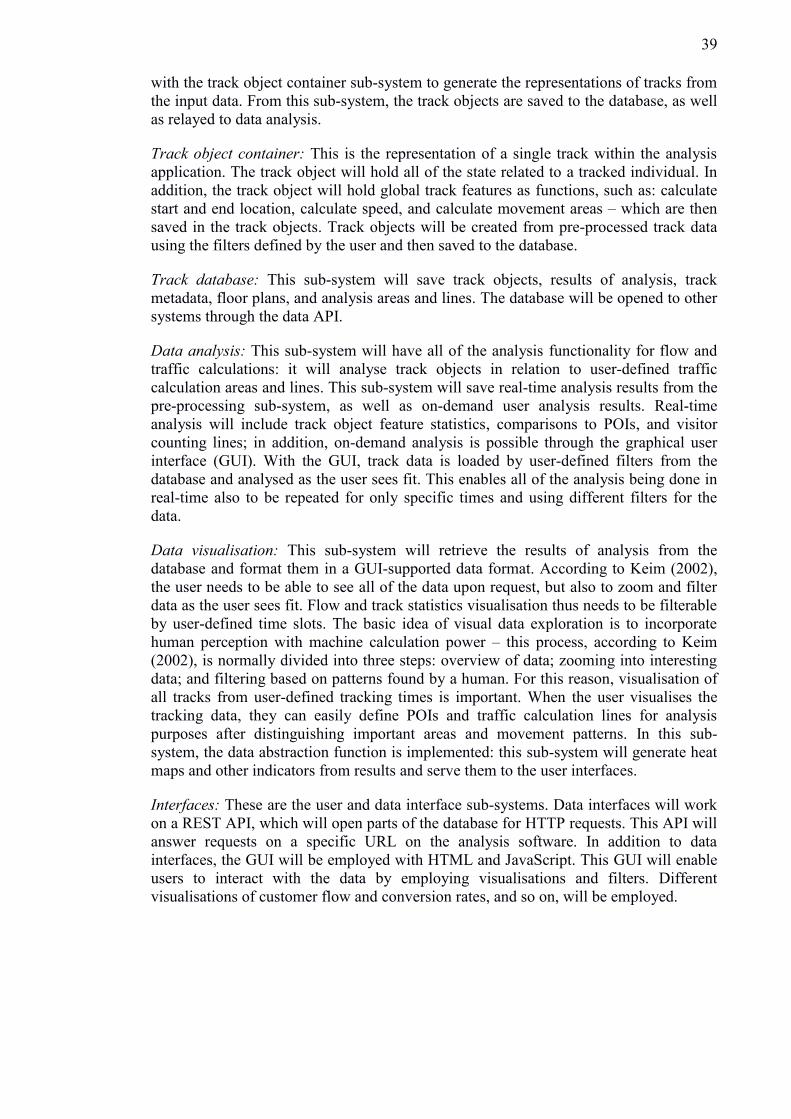
39
with the track object container sub-system to generate the representations of tracks from
the input data. From this sub-system, the track objects are saved to the database, as well
as relayed to data analysis.
Track object container: This is the representation of a single track within the analysis
application. The track object will hold all of the state related to a tracked individual. In
addition, the track object will hold global track features as functions, such as: calculate
start and end location, calculate speed, and calculate movement areas – which are then
saved in the track objects. Track objects will be created from pre-processed track data
using the filters defined by the user and then saved to the database.
Track database: This sub-system will save track objects, results of analysis, track
metadata, floor plans, and analysis areas and lines. The database will be opened to other
systems through the data API.
Data analysis: This sub-system will have all of the analysis functionality for flow and
traffic calculations: it will analyse track objects in relation to user-defined traffic
calculation areas and lines. This sub-system will save real-time analysis results from the
pre-processing sub-system, as well as on-demand user analysis results. Real-time
analysis will include track object feature statistics, comparisons to POIs, and visitor
counting lines; in addition, on-demand analysis is possible through the graphical user
interface (GUI). With the GUI, track data is loaded by user-defined filters from the
database and analysed as the user sees fit. This enables all of the analysis being done in
real-time also to be repeated for only specific times and using different filters for the
data.
Data visualisation: This sub-system will retrieve the results of analysis from the
database and format them in a GUI-supported data format. According to Keim (2002),
the user needs to be able to see all of the data upon request, but also to zoom and filter
data as the user sees fit. Flow and track statistics visualisation thus needs to be filterable
by user-defined time slots. The basic idea of visual data exploration is to incorporate
human perception with machine calculation power – this process, according to Keim
(2002), is normally divided into three steps: overview of data; zooming into interesting
data; and filtering based on patterns found by a human. For this reason, visualisation of
all tracks from user-defined tracking times is important. When the user visualises the
tracking data, they can easily define POIs and traffic calculation lines for analysis
purposes after distinguishing important areas and movement patterns. In this sub-
system, the data abstraction function is implemented: this sub-system will generate heat
maps and other indicators from results and serve them to the user interfaces.
Interfaces: These are the user and data interface sub-systems. Data interfaces will work
on a REST API, which will open parts of the database for HTTP requests. This API will
answer requests on a specific URL on the analysis software. In addition to data
interfaces, the GUI will be employed with HTML and JavaScript. This GUI will enable
users to interact with the data by employing visualisations and filters. Different
visualisations of customer flow and conversion rates, and so on, will be employed.
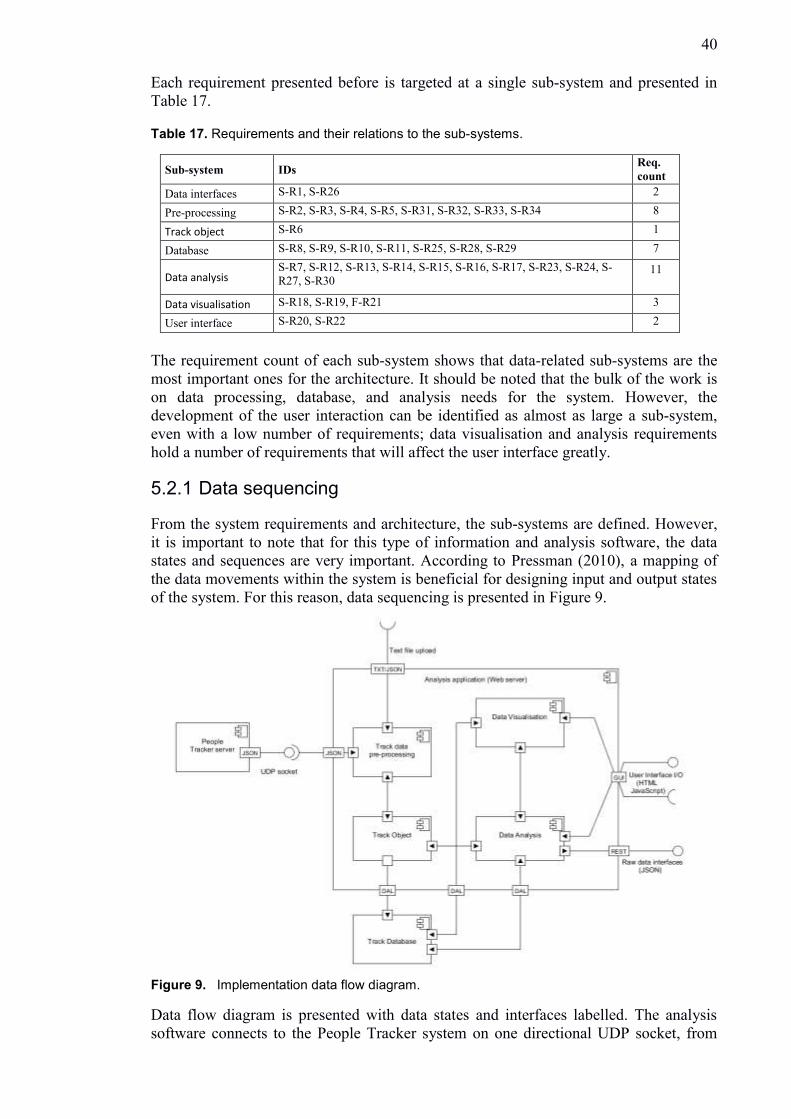
40
Each requirement presented before is targeted at a single sub-system and presented in
Table 17.
Table 17. Requirements and their relations to the sub-systems.
Sub-system IDs Req.
count
Data interfaces S-R1, S-R26 2
Pre-processing S-R2, S-R3, S-R4, S-R5, S-R31, S-R32, S-R33, S-R34 8
Track object S-R6 1
Database S-R8, S-R9, S-R10, S-R11, S-R25, S-R28, S-R29 7
Data analysis S-R7, S-R12, S-R13, S-R14, S-R15, S-R16, S-R17, S-R23, S-R24, S-
R27, S-R30 11
Data visualisation S-R18, S-R19, F-R21 3
User interface S-R20, S-R22 2
The requirement count of each sub-system shows that data-related sub-systems are the
most important ones for the architecture. It should be noted that the bulk of the work is
on data processing, database, and analysis needs for the system. However, the
development of the user interaction can be identified as almost as large a sub-system,
even with a low number of requirements; data visualisation and analysis requirements
hold a number of requirements that will affect the user interface greatly.
5.2.1 Data sequencing
From the system requirements and architecture, the sub-systems are defined. However,
it is important to note that for this type of information and analysis software, the data
states and sequences are very important. According to Pressman (2010), a mapping of
the data movements within the system is beneficial for designing input and output states
of the system. For this reason, data sequencing is presented in Figure 9.
Figure 9. Implementation data flow diagram.
Data flow diagram is presented with data states and interfaces labelled. The analysis
software connects to the People Tracker system on one directional UDP socket, from

41
which human and computer-readable JavaScript Object Notation (JSON) data is
received. This data is then pre-processed and saved as track objects through the DAL
(Database Abstraction Layer) into the database. The track database can also be used by
other software through the DAL, which can give out track data as JSON by answering
REST requests. The data analysis sub-system also accesses track data through DAL and
relays composed and analysed data for the data visualisation sub-system. The data
visualisation and data analysis sub-systems relay different analysis results to the GUI
for use by users. Since the data is to be used through a web browser interface, an
abstraction layer for the database is necessary; this layer maps REST API requests into
the database syntax without exposing the database.
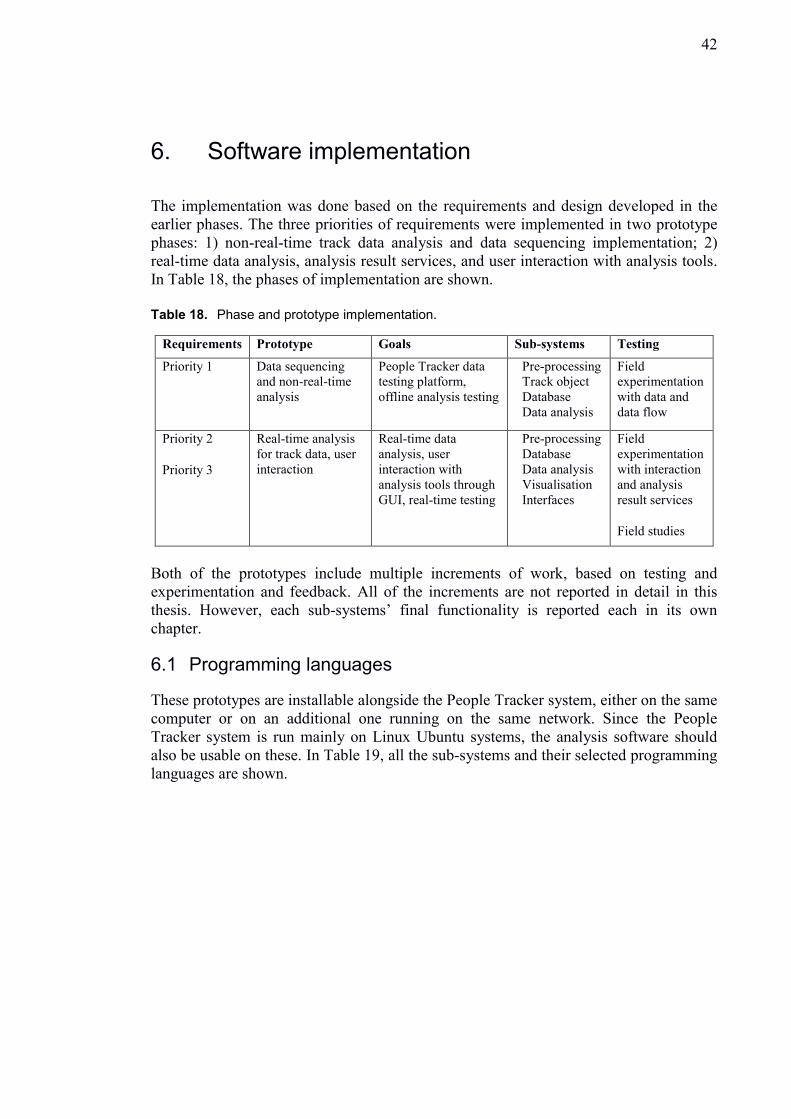
42
6. Software implementation
The implementation was done based on the requirements and design developed in the
earlier phases. The three priorities of requirements were implemented in two prototype
phases: 1) non-real-time track data analysis and data sequencing implementation; 2)
real-time data analysis, analysis result services, and user interaction with analysis tools.
In Table 18, the phases of implementation are shown.
Table 18. Phase and prototype implementation.
Requirements Prototype Goals Sub-systems Testing
Priority 1 Data sequencing
and non-real-time
analysis
People Tracker data
testing platform,
offline analysis testing
Pre-processing
Track object
Database
Data analysis
Field
experimentation
with data and
data flow
Priority 2
Priority 3
Real-time analysis
for track data, user
interaction
Real-time data
analysis, user
interaction with
analysis tools through
GUI, real-time testing
Pre-processing
Database
Data analysis
Visualisation
Interfaces
Field
experimentation
with interaction
and analysis
result services
Field studies
Both of the prototypes include multiple increments of work, based on testing and
experimentation and feedback. All of the increments are not reported in detail in this
thesis. However, each sub-systems’ final functionality is reported each in its own
chapter.
6.1 Programming languages
These prototypes are installable alongside the People Tracker system, either on the same
computer or on an additional one running on the same network. Since the People
Tracker system is run mainly on Linux Ubuntu systems, the analysis software should
also be usable on these. In Table 19, all the sub-systems and their selected programming
languages are shown.
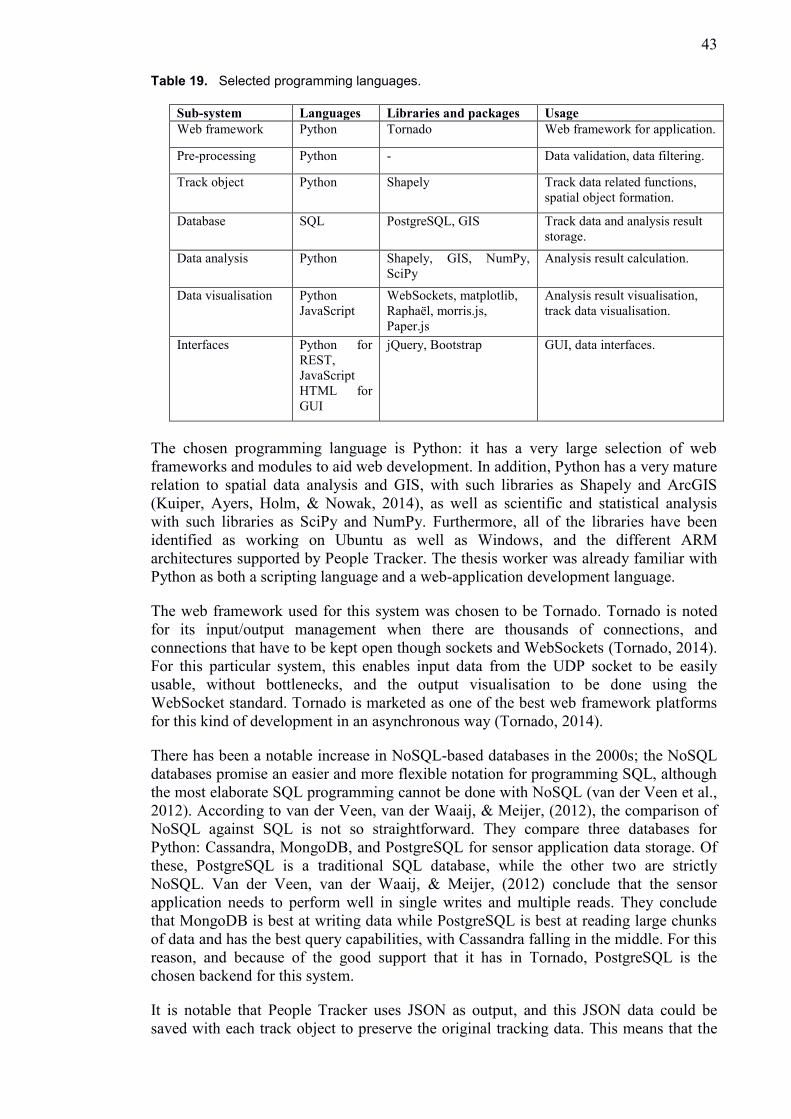
43
Table 19. Selected programming languages.
Sub-system Languages Libraries and packages Usage
Web framework Python Tornado Web framework for application.
Pre-processing Python - Data validation, data filtering.
Track object
Python Shapely Track data related functions,
spatial object formation.
Database SQL PostgreSQL, GIS Track data and analysis result
storage.
Data analysis Python Shapely, GIS, NumPy,
SciPy
Analysis result calculation.
Data visualisation Python
JavaScript
WebSockets, matplotlib,
Raphaël, morris.js,
Paper.js
Analysis result visualisation,
track data visualisation.
Interfaces Python for
REST,
JavaScript
HTML for
GUI
jQuery, Bootstrap GUI, data interfaces.
The chosen programming language is Python: it has a very large selection of web
frameworks and modules to aid web development. In addition, Python has a very mature
relation to spatial data analysis and GIS, with such libraries as Shapely and ArcGIS
(Kuiper, Ayers, Holm, & Nowak, 2014), as well as scientific and statistical analysis
with such libraries as SciPy and NumPy. Furthermore, all of the libraries have been
identified as working on Ubuntu as well as Windows, and the different ARM
architectures supported by People Tracker. The thesis worker was already familiar with
Python as both a scripting language and a web-application development language.
The web framework used for this system was chosen to be Tornado. Tornado is noted
for its input/output management when there are thousands of connections, and
connections that have to be kept open though sockets and WebSockets (Tornado, 2014).
For this particular system, this enables input data from the UDP socket to be easily
usable, without bottlenecks, and the output visualisation to be done using the
WebSocket standard. Tornado is marketed as one of the best web framework platforms
for this kind of development in an asynchronous way (Tornado, 2014).
There has been a notable increase in NoSQL-based databases in the 2000s; the NoSQL
databases promise an easier and more flexible notation for programming SQL, although
the most elaborate SQL programming cannot be done with NoSQL (van der Veen et al.,
2012). According to van der Veen, van der Waaij, & Meijer, (2012), the comparison of
NoSQL against SQL is not so straightforward. They compare three databases for
Python: Cassandra, MongoDB, and PostgreSQL for sensor application data storage. Of
these, PostgreSQL is a traditional SQL database, while the other two are strictly
NoSQL. Van der Veen, van der Waaij, & Meijer, (2012) conclude that the sensor
application needs to perform well in single writes and multiple reads. They conclude
that MongoDB is best at writing data while PostgreSQL is best at reading large chunks
of data and has the best query capabilities, with Cassandra falling in the middle. For this
reason, and because of the good support that it has in Tornado, PostgreSQL is the
chosen backend for this system.
It is notable that People Tracker uses JSON as output, and this JSON data could be
saved with each track object to preserve the original tracking data. This means that the
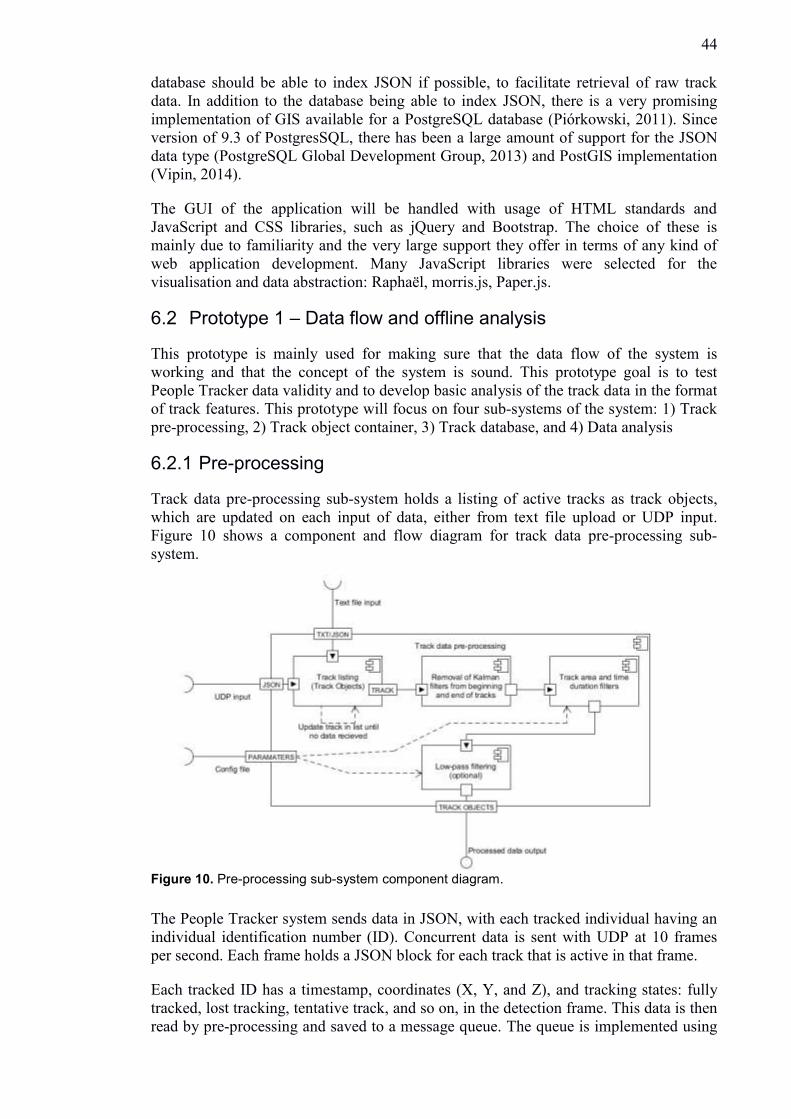
44
database should be able to index JSON if possible, to facilitate retrieval of raw track
data. In addition to the database being able to index JSON, there is a very promising
implementation of GIS available for a PostgreSQL database (Piórkowski, 2011). Since
version of 9.3 of PostgresSQL, there has been a large amount of support for the JSON
data type (PostgreSQL Global Development Group, 2013) and PostGIS implementation
(Vipin, 2014).
The GUI of the application will be handled with usage of HTML standards and
JavaScript and CSS libraries, such as jQuery and Bootstrap. The choice of these is
mainly due to familiarity and the very large support they offer in terms of any kind of
web application development. Many JavaScript libraries were selected for the
visualisation and data abstraction: Raphaël, morris.js, Paper.js.
6.2 Prototype 1 – Data flow and offline analysis
This prototype is mainly used for making sure that the data flow of the system is
working and that the concept of the system is sound. This prototype goal is to test
People Tracker data validity and to develop basic analysis of the track data in the format
of track features. This prototype will focus on four sub-systems of the system: 1) Track
pre-processing, 2) Track object container, 3) Track database, and 4) Data analysis
6.2.1 Pre-processing
Track data pre-processing sub-system holds a listing of active tracks as track objects,
which are updated on each input of data, either from text file upload or UDP input.
Figure 10 shows a component and flow diagram for track data pre-processing sub-
system.
The People Tracker system sends data in JSON, with each tracked individual having an
individual identification number (ID). Concurrent data is sent with UDP at 10 frames
per second. Each frame holds a JSON block for each track that is active in that frame.
Each tracked ID has a timestamp, coordinates (X, Y, and Z), and tracking states: fully
tracked, lost tracking, tentative track, and so on, in the detection frame. This data is then
read by pre-processing and saved to a message queue. The queue is implemented using
Figure 10. Pre-processing sub-system component diagram.
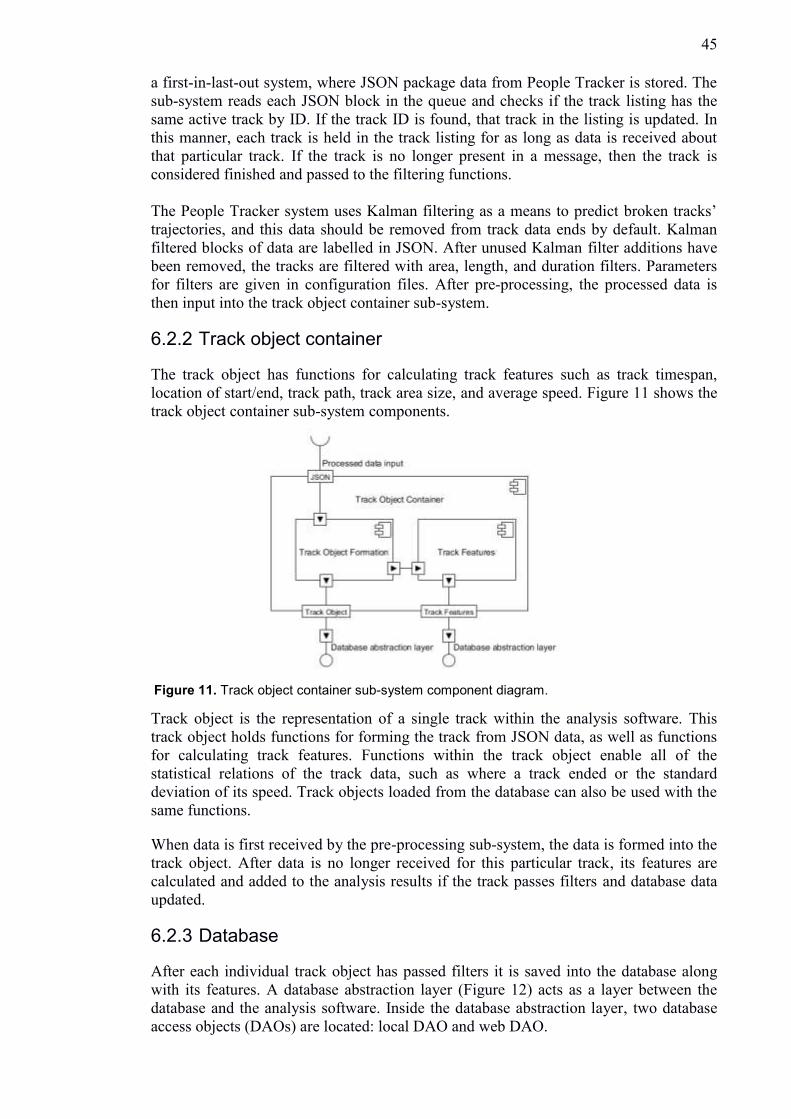
45
a first-in-last-out system, where JSON package data from People Tracker is stored. The
sub-system reads each JSON block in the queue and checks if the track listing has the
same active track by ID. If the track ID is found, that track in the listing is updated. In
this manner, each track is held in the track listing for as long as data is received about
that particular track. If the track is no longer present in a message, then the track is
considered finished and passed to the filtering functions.
The People Tracker system uses Kalman filtering as a means to predict broken tracks’
trajectories, and this data should be removed from track data ends by default. Kalman
filtered blocks of data are labelled in JSON. After unused Kalman filter additions have
been removed, the tracks are filtered with area, length, and duration filters. Parameters
for filters are given in configuration files. After pre-processing, the processed data is
then input into the track object container sub-system.
6.2.2 Track object container
The track object has functions for calculating track features such as track timespan,
location of start/end, track path, track area size, and average speed. Figure 11 shows the
track object container sub-system components.
Track object is the representation of a single track within the analysis software. This
track object holds functions for forming the track from JSON data, as well as functions
for calculating track features. Functions within the track object enable all of the
statistical relations of the track data, such as where a track ended or the standard
deviation of its speed. Track objects loaded from the database can also be used with the
same functions.
When data is first received by the pre-processing sub-system, the data is formed into the
track object. After data is no longer received for this particular track, its features are
calculated and added to the analysis results if the track passes filters and database data
updated.
6.2.3 Database
After each individual track object has passed filters it is saved into the database along
with its features. A database abstraction layer (Figure 12) acts as a layer between the
database and the analysis software. Inside the database abstraction layer, two database
access objects (DAOs) are located: local DAO and web DAO.
Figure 11. Track object container sub-system component diagram.
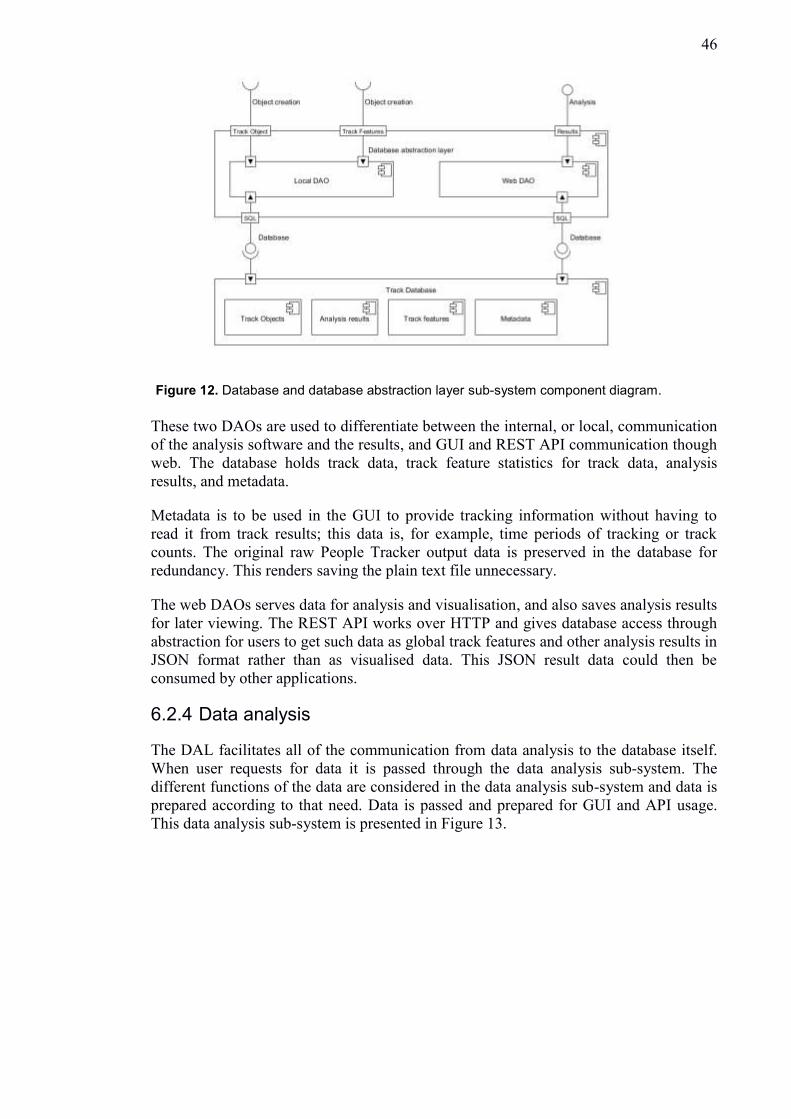
46
These two DAOs are used to differentiate between the internal, or local, communication
of the analysis software and the results, and GUI and REST API communication though
web. The database holds track data, track feature statistics for track data, analysis
results, and metadata.
Metadata is to be used in the GUI to provide tracking information without having to
read it from track results; this data is, for example, time periods of tracking or track
counts. The original raw People Tracker output data is preserved in the database for
redundancy. This renders saving the plain text file unnecessary.
The web DAOs serves data for analysis and visualisation, and also saves analysis results
for later viewing. The REST API works over HTTP and gives database access through
abstraction for users to get such data as global track features and other analysis results in
JSON format rather than as visualised data. This JSON result data could then be
consumed by other applications.
6.2.4 Data analysis
The DAL facilitates all of the communication from data analysis to the database itself.
When user requests for data it is passed through the data analysis sub-system. The
different functions of the data are considered in the data analysis sub-system and data is
prepared according to that need. Data is passed and prepared for GUI and API usage.
This data analysis sub-system is presented in Figure 13.
Figure 12. Database and database abstraction layer sub-system component diagram.
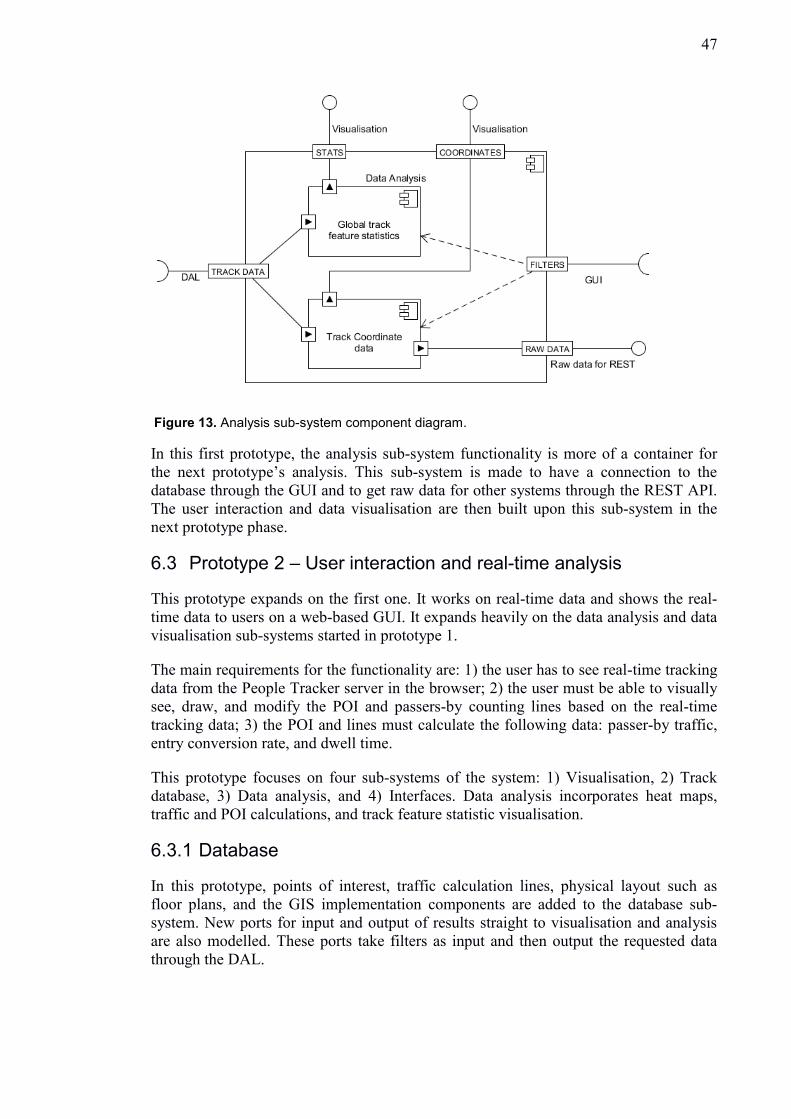
47
In this first prototype, the analysis sub-system functionality is more of a container for
the next prototype’s analysis. This sub-system is made to have a connection to the
database through the GUI and to get raw data for other systems through the REST API.
The user interaction and data visualisation are then built upon this sub-system in the
next prototype phase.
6.3 Prototype 2 – User interaction and real-time analysis
This prototype expands on the first one. It works on real-time data and shows the real-
time data to users on a web-based GUI. It expands heavily on the data analysis and data
visualisation sub-systems started in prototype 1.
The main requirements for the functionality are: 1) the user has to see real-time tracking
data from the People Tracker server in the browser; 2) the user must be able to visually
see, draw, and modify the POI and passers-by counting lines based on the real-time
tracking data; 3) the POI and lines must calculate the following data: passer-by traffic,
entry conversion rate, and dwell time.
This prototype focuses on four sub-systems of the system: 1) Visualisation, 2) Track
database, 3) Data analysis, and 4) Interfaces. Data analysis incorporates heat maps,
traffic and POI calculations, and track feature statistic visualisation.
6.3.1 Database
In this prototype, points of interest, traffic calculation lines, physical layout such as
floor plans, and the GIS implementation components are added to the database sub-
system. New ports for input and output of results straight to visualisation and analysis
are also modelled. These ports take filters as input and then output the requested data
through the DAL.
Figure 13. Analysis sub-system component diagram.
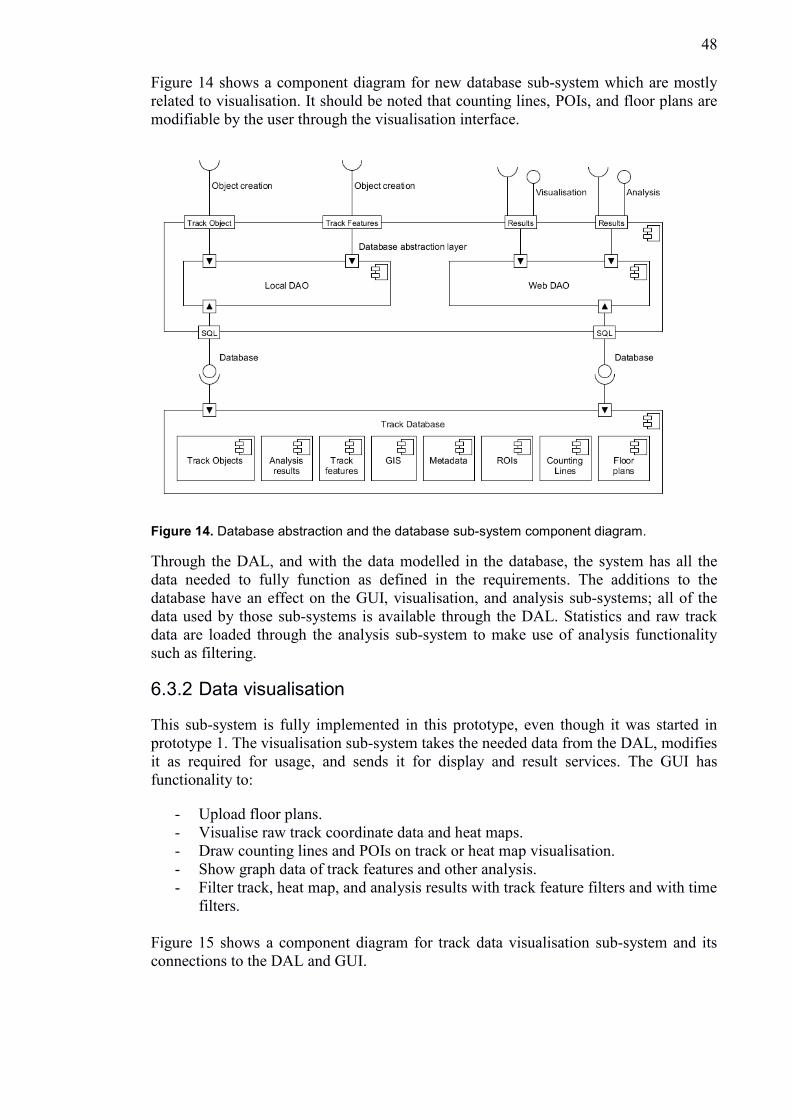
48
Figure 14 shows a component diagram for new database sub-system which are mostly
related to visualisation. It should be noted that counting lines, POIs, and floor plans are
modifiable by the user through the visualisation interface.
Figure 14. Database abstraction and the database sub-system component diagram.
Through the DAL, and with the data modelled in the database, the system has all the
data needed to fully function as defined in the requirements. The additions to the
database have an effect on the GUI, visualisation, and analysis sub-systems; all of the
data used by those sub-systems is available through the DAL. Statistics and raw track
data are loaded through the analysis sub-system to make use of analysis functionality
such as filtering.
6.3.2 Data visualisation
This sub-system is fully implemented in this prototype, even though it was started in
prototype 1. The visualisation sub-system takes the needed data from the DAL, modifies
it as required for usage, and sends it for display and result services. The GUI has
functionality to:
- Upload floor plans.
- Visualise raw track coordinate data and heat maps.
- Draw counting lines and POIs on track or heat map visualisation.
- Show graph data of track features and other analysis.
- Filter track, heat map, and analysis results with track feature filters and with time
filters.
Figure 15 shows a component diagram for track data visualisation sub-system and its
connections to the DAL and GUI.
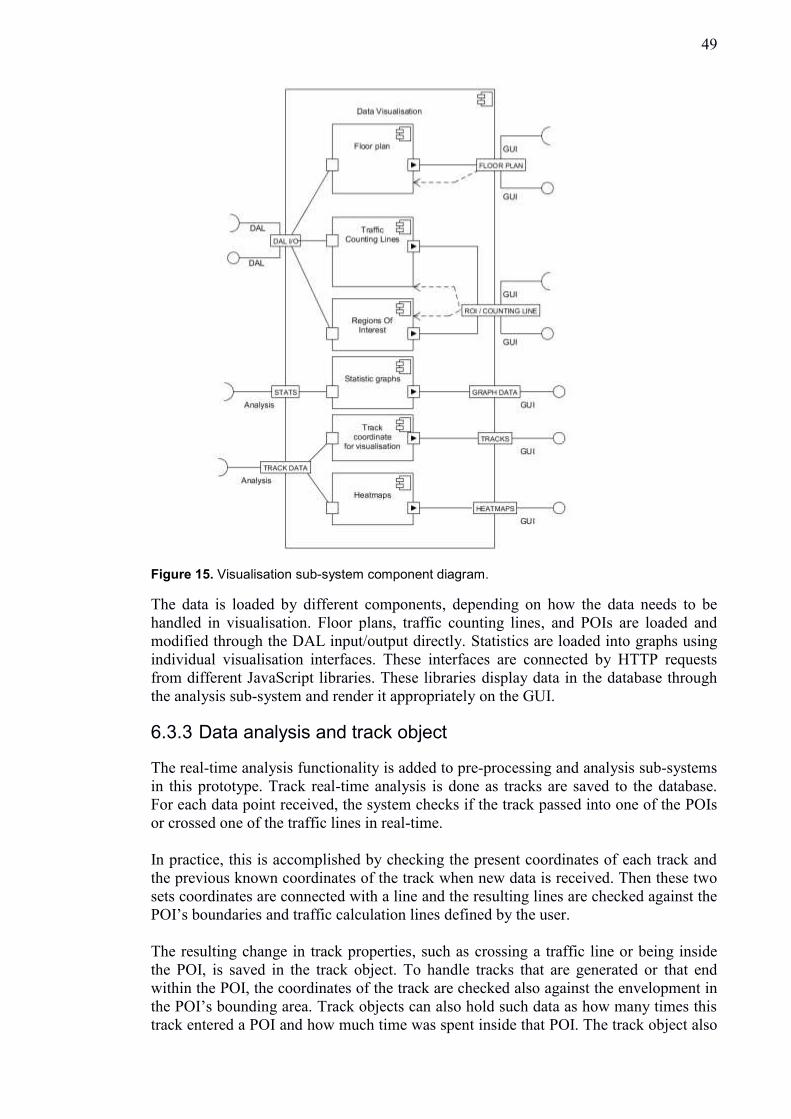
49
Figure 15. Visualisation sub-system component diagram.
The data is loaded by different components, depending on how the data needs to be
handled in visualisation. Floor plans, traffic counting lines, and POIs are loaded and
modified through the DAL input/output directly. Statistics are loaded into graphs using
individual visualisation interfaces. These interfaces are connected by HTTP requests
from different JavaScript libraries. These libraries display data in the database through
the analysis sub-system and render it appropriately on the GUI.
6.3.3 Data analysis and track object
The real-time analysis functionality is added to pre-processing and analysis sub-systems
in this prototype. Track real-time analysis is done as tracks are saved to the database.
For each data point received, the system checks if the track passed into one of the POIs
or crossed one of the traffic lines in real-time.
In practice, this is accomplished by checking the present coordinates of each track and
the previous known coordinates of the track when new data is received. Then these two
sets coordinates are connected with a line and the resulting lines are checked against the
POI’s boundaries and traffic calculation lines defined by the user.
The resulting change in track properties, such as crossing a traffic line or being inside
the POI, is saved in the track object. To handle tracks that are generated or that end
within the POI, the coordinates of the track are checked also against the envelopment in
the POI’s bounding area. Track objects can also hold such data as how many times this
track entered a POI and how much time was spent inside that POI. The track object also
50
has functions for logging POI entry timestamps. Spatial track feature calculations are
done with a Python Shapely and NumPy packages, which allow for easy spatial
calculations for each point of data in a track.
In this way, the track object has the information needed for all of the calculations. This
means that by changing the areas and lines offline, calculations can be done to see
different results. This prototype enables the key performance indicators found with
previous stages of literature and domain analysis. The way in which the conversion rate,
or in this the case hit-rate, traffic and dwell time, and other point of interest analysis, are
calculated is presented next.
The calculation of hit-rate is done from passers-by against the POI entry ratio. Let LCh
donate the hourly observed line crosses of traffic calculation lines, and let ERh donate
the hourly entry ratio to the user-specified POI. From these variables, hit-rates are
calculated by the system as follows:
Hourly hit-rate:
HRh = ERh
ERh + LCh (4)
Dwell time is calculated by the cumulative amount of time spent at a POI by each
tracked individual in seconds. The average time spent at a POI per track is displayed;
this is donated as a DTavg variable. Each track’s dwell time is to be calculated on its
own, but then added to the hourly DTh. From these variables, dwell time is calculated by
the system as follows:
Average hourly dwell time:
DTavg = DTh
ERh (5)
From the list of hourly hit-rates and average dwell times, the maximum and minimum
numbers are easily retrieved. At the same time, the time slot of the maximum and
minimum data is received and can be displayed.
Dwell times, hit-rates, and their respective peak and off-peak hours are presented as
percentages for hit-rates and seconds for dwell times. Passer-by traffic is calculated
simply as line crosses for each hour LCh and displayed as a bar graph.
6.3.4 Interfaces
The needed interfaces are a graphical user interface and the raw data REST interfaces.
These interfaces work through HTTP requests that map into the DAL through the
analysis application web service and return the needed data. In the case of a raw data
request, a JSON of the raw coordinate data from the tracks is returned. In the case of
analysis results, the analysis sub-system returns the results after modifying them
according to the usage needs.
GUI: The libraries used are related to statistic data visualisation and track coordinate
visualisation. Real-time track coordinate visualisation is depicted in Figure 16. This
figure is taken from the user’s computer browser, showing the real user interface of the
analysis system. It uses HTML5 standards such as the canvas element and WebSockets
to provide real-time visualisation of people tracking.
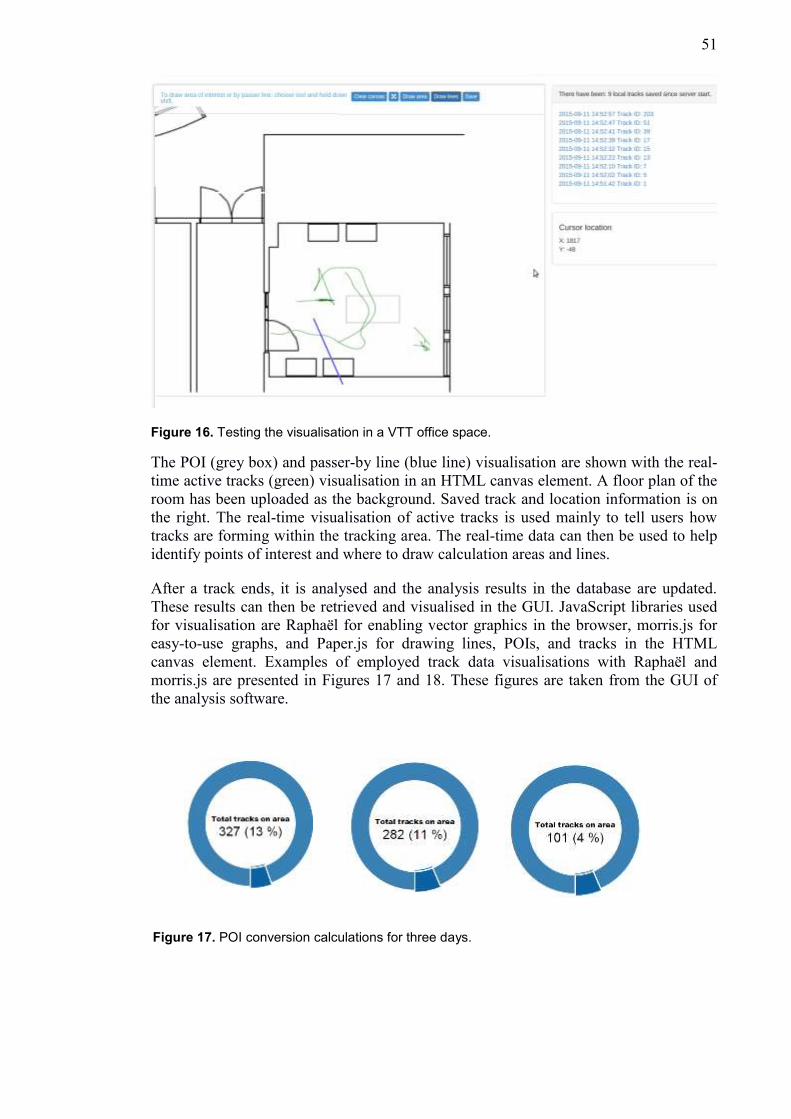
51
Figure 16. Testing the visualisation in a VTT office space.
The POI (grey box) and passer-by line (blue line) visualisation are shown with the real-
time active tracks (green) visualisation in an HTML canvas element. A floor plan of the
room has been uploaded as the background. Saved track and location information is on
the right. The real-time visualisation of active tracks is used mainly to tell users how
tracks are forming within the tracking area. The real-time data can then be used to help
identify points of interest and where to draw calculation areas and lines.
After a track ends, it is analysed and the analysis results in the database are updated.
These results can then be retrieved and visualised in the GUI. JavaScript libraries used
for visualisation are Raphaël for enabling vector graphics in the browser, morris.js for
easy-to-use graphs, and Paper.js for drawing lines, POIs, and tracks in the HTML
canvas element. Examples of employed track data visualisations with Raphaël and
morris.js are presented in Figures 17 and 18. These figures are taken from the GUI of
the analysis software.
Figure 17. POI conversion calculations for three days.
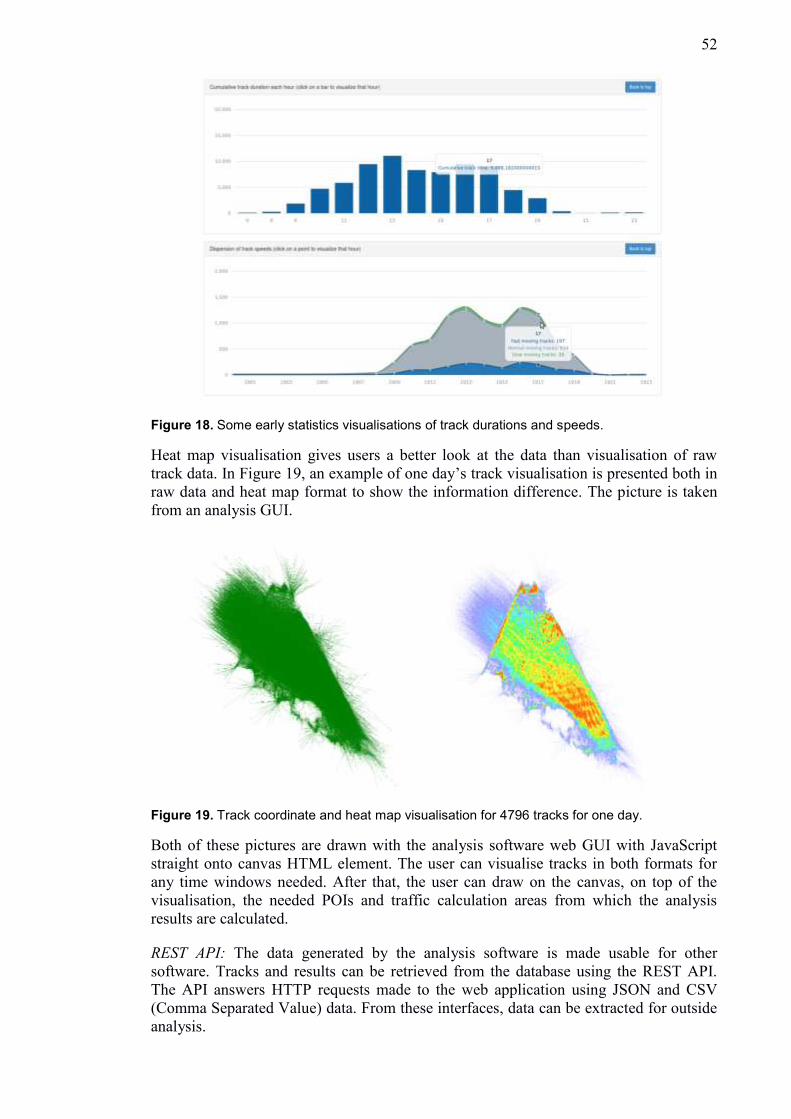
52
Figure 18. Some early statistics visualisations of track durations and speeds.
Heat map visualisation gives users a better look at the data than visualisation of raw
track data. In Figure 19, an example of one day’s track visualisation is presented both in
raw data and heat map format to show the information difference. The picture is taken
from an analysis GUI.
Figure 19. Track coordinate and heat map visualisation for 4796 tracks for one day.
Both of these pictures are drawn with the analysis software web GUI with JavaScript
straight onto canvas HTML element. The user can visualise tracks in both formats for
any time windows needed. After that, the user can draw on the canvas, on top of the
visualisation, the needed POIs and traffic calculation areas from which the analysis
results are calculated.
REST API: The data generated by the analysis software is made usable for other
software. Tracks and results can be retrieved from the database using the REST API.
The API answers HTTP requests made to the web application using JSON and CSV
(Comma Separated Value) data. From these interfaces, data can be extracted for outside
analysis.
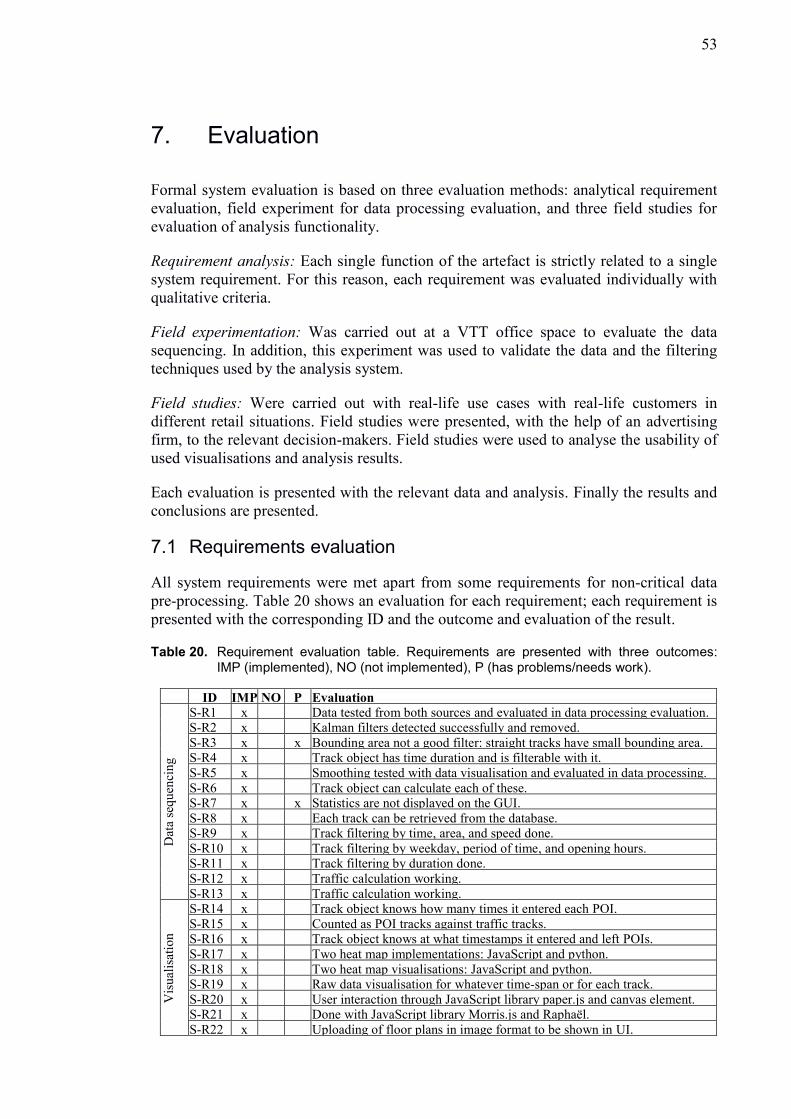
53
7. Evaluation
Formal system evaluation is based on three evaluation methods: analytical requirement
evaluation, field experiment for data processing evaluation, and three field studies for
evaluation of analysis functionality.
Requirement analysis: Each single function of the artefact is strictly related to a single
system requirement. For this reason, each requirement was evaluated individually with
qualitative criteria.
Field experimentation: Was carried out at a VTT office space to evaluate the data
sequencing. In addition, this experiment was used to validate the data and the filtering
techniques used by the analysis system.
Field studies: Were carried out with real-life use cases with real-life customers in
different retail situations. Field studies were presented, with the help of an advertising
firm, to the relevant decision-makers. Field studies were used to analyse the usability of
used visualisations and analysis results.
Each evaluation is presented with the relevant data and analysis. Finally the results and
conclusions are presented.
7.1 Requirements evaluation
All system requirements were met apart from some requirements for non-critical data
pre-processing. Table 20 shows an evaluation for each requirement; each requirement is
presented with the corresponding ID and the outcome and evaluation of the result.
Table 20. Requirement evaluation table. Requirements are presented with three outcomes: IMP (implemented), NO (not implemented), P (has problems/needs work).
ID IMP NO P Evaluation
Dat
a se
qu
enci
ng
S-R1 x Data tested from both sources and evaluated in data processing evaluation. S-R2 x Kalman filters detected successfully and removed.
S-R3 x x Bounding area not a good filter: straight tracks have small bounding area. S-R4 x Track object has time duration and is filterable with it.
S-R5 x Smoothing tested with data visualisation and evaluated in data processing.
S-R6 x Track object can calculate each of these. S-R7 x x Statistics are not displayed on the GUI.
S-R8 x Each track can be retrieved from the database. S-R9 x Track filtering by time, area, and speed done.
S-R10 x Track filtering by weekday, period of time, and opening hours. S-R11 x Track filtering by duration done.
S-R12 x Traffic calculation working.
S-R13 x Traffic calculation working.
Vis
ual
isat
ion
S-R14 x Track object knows how many times it entered each POI.
S-R15 x Counted as POI tracks against traffic tracks. S-R16 x Track object knows at what timestamps it entered and left POIs.
S-R17 x Two heat map implementations: JavaScript and python.
S-R18 x Two heat map visualisations: JavaScript and python. S-R19 x Raw data visualisation for whatever time-span or for each track.
S-R20 x User interaction through JavaScript library paper.js and canvas element. S-R21 x Done with JavaScript library Morris.js and Raphaël.
S-R22 x Uploading of floor plans in image format to be shown in UI.
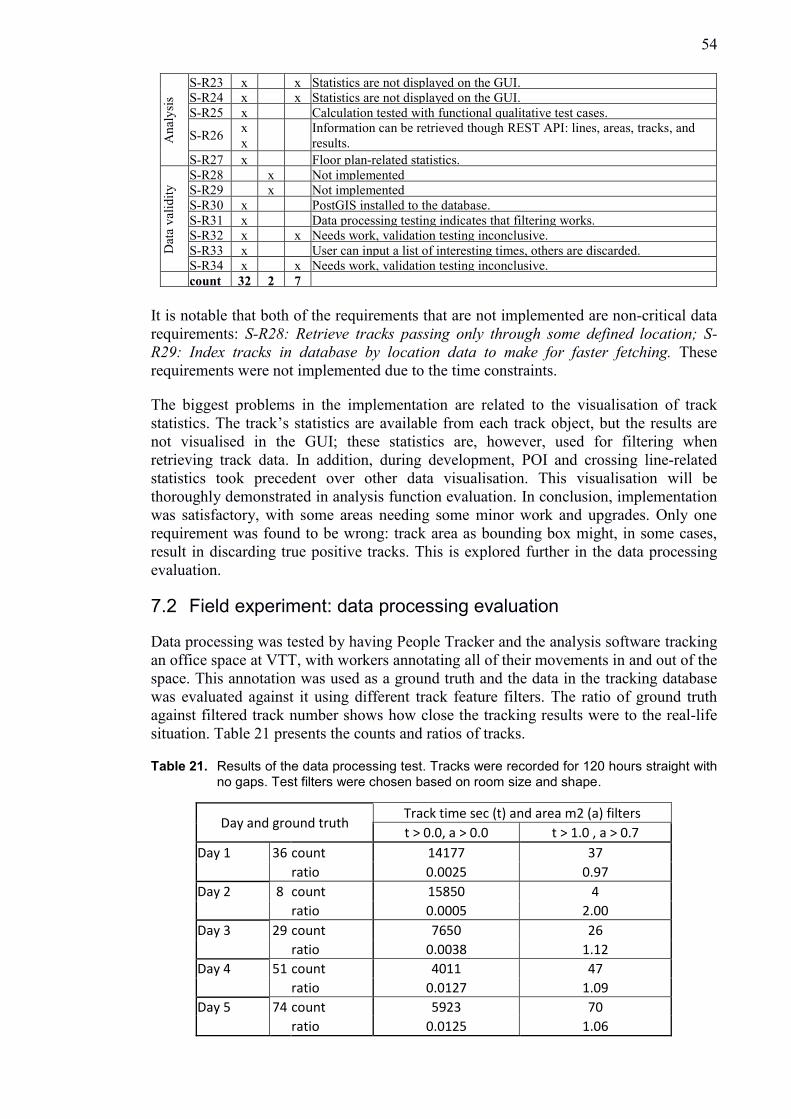
54
An
aly
sis
S-R23 x x Statistics are not displayed on the GUI. S-R24 x x Statistics are not displayed on the GUI.
S-R25 x
x
Calculation tested with functional qualitative test cases.
S-R26 x
x
Information can be retrieved though REST API: lines, areas, tracks, and
results.
S-R27 x
Floor plan-related statistics. D
ata
val
idit
y S-R28 x Not implemented
S-R29 x Not implemented
S-R30 x
x
PostGIS installed to the database.
S-R31 x Data processing testing indicates that filtering works. S-R32 x x Needs work, validation testing inconclusive.
S-R33 x User can input a list of interesting times, others are discarded. S-R34 x x Needs work, validation testing inconclusive.
count 32 2 7
It is notable that both of the requirements that are not implemented are non-critical data
requirements: S-R28: Retrieve tracks passing only through some defined location; S-
R29: Index tracks in database by location data to make for faster fetching. These
requirements were not implemented due to the time constraints.
The biggest problems in the implementation are related to the visualisation of track
statistics. The track’s statistics are available from each track object, but the results are
not visualised in the GUI; these statistics are, however, used for filtering when
retrieving track data. In addition, during development, POI and crossing line-related
statistics took precedent over other data visualisation. This visualisation will be
thoroughly demonstrated in analysis function evaluation. In conclusion, implementation
was satisfactory, with some areas needing some minor work and upgrades. Only one
requirement was found to be wrong: track area as bounding box might, in some cases,
result in discarding true positive tracks. This is explored further in the data processing
evaluation.
7.2 Field experiment: data processing evaluation
Data processing was tested by having People Tracker and the analysis software tracking
an office space at VTT, with workers annotating all of their movements in and out of the
space. This annotation was used as a ground truth and the data in the tracking database
was evaluated against it using different track feature filters. The ratio of ground truth
against filtered track number shows how close the tracking results were to the real-life
situation. Table 21 presents the counts and ratios of tracks.
Table 21. Results of the data processing test. Tracks were recorded for 120 hours straight with
no gaps. Test filters were chosen based on room size and shape.
Day and ground truth Track time sec (t) and area m2 (a) filters
t > 0.0, a > 0.0 t > 1.0 , a > 0.7
Day 1 36 count 14177 37
ratio 0.0025 0.97
Day 2 8 count 15850 4
ratio 0.0005 2.00
Day 3 29 count 7650 26
ratio 0.0038 1.12
Day 4 51 count 4011 47
ratio 0.0127 1.09
Day 5 74 count 5923 70
ratio 0.0125 1.06
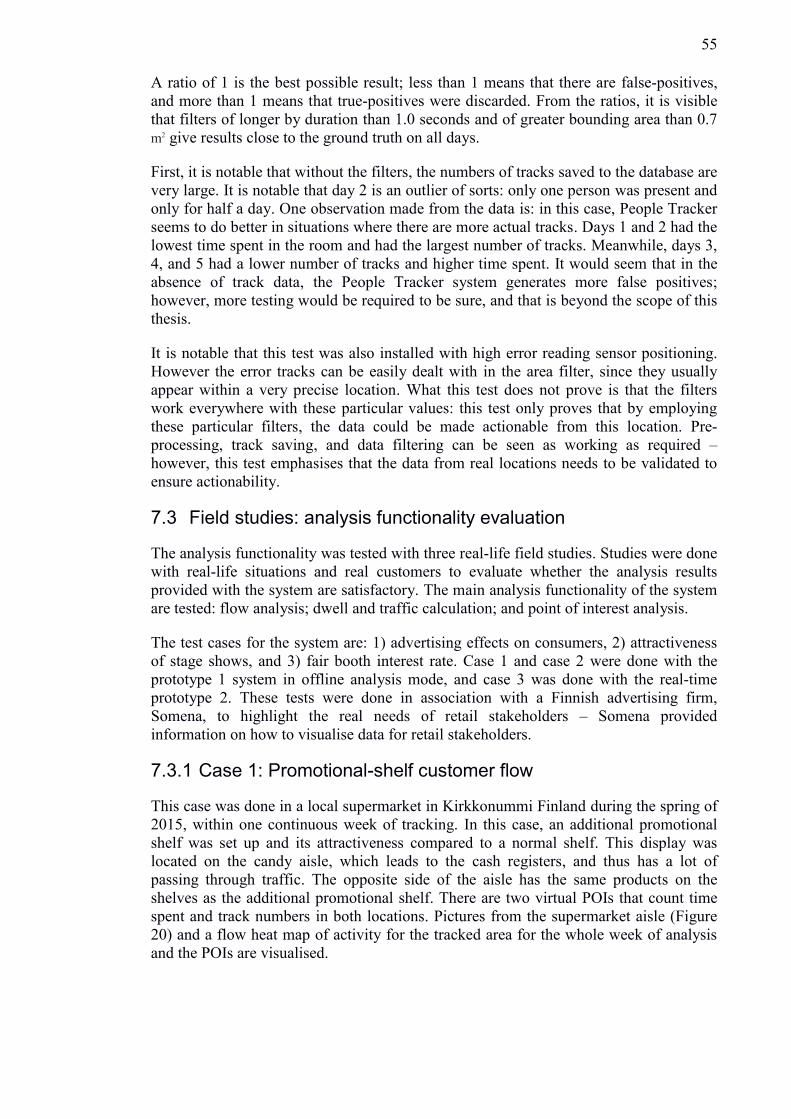
55
A ratio of 1 is the best possible result; less than 1 means that there are false-positives,
and more than 1 means that true-positives were discarded. From the ratios, it is visible
that filters of longer by duration than 1.0 seconds and of greater bounding area than 0.7
m2 give results close to the ground truth on all days.
First, it is notable that without the filters, the numbers of tracks saved to the database are
very large. It is notable that day 2 is an outlier of sorts: only one person was present and
only for half a day. One observation made from the data is: in this case, People Tracker
seems to do better in situations where there are more actual tracks. Days 1 and 2 had the
lowest time spent in the room and had the largest number of tracks. Meanwhile, days 3,
4, and 5 had a lower number of tracks and higher time spent. It would seem that in the
absence of track data, the People Tracker system generates more false positives;
however, more testing would be required to be sure, and that is beyond the scope of this
thesis.
It is notable that this test was also installed with high error reading sensor positioning.
However the error tracks can be easily dealt with in the area filter, since they usually
appear within a very precise location. What this test does not prove is that the filters
work everywhere with these particular values: this test only proves that by employing
these particular filters, the data could be made actionable from this location. Pre-
processing, track saving, and data filtering can be seen as working as required –
however, this test emphasises that the data from real locations needs to be validated to
ensure actionability.
7.3 Field studies: analysis functionality evaluation
The analysis functionality was tested with three real-life field studies. Studies were done
with real-life situations and real customers to evaluate whether the analysis results
provided with the system are satisfactory. The main analysis functionality of the system
are tested: flow analysis; dwell and traffic calculation; and point of interest analysis.
The test cases for the system are: 1) advertising effects on consumers, 2) attractiveness
of stage shows, and 3) fair booth interest rate. Case 1 and case 2 were done with the
prototype 1 system in offline analysis mode, and case 3 was done with the real-time
prototype 2. These tests were done in association with a Finnish advertising firm,
Somena, to highlight the real needs of retail stakeholders – Somena provided
information on how to visualise data for retail stakeholders.
7.3.1 Case 1: Promotional-shelf customer flow
This case was done in a local supermarket in Kirkkonummi Finland during the spring of
2015, within one continuous week of tracking. In this case, an additional promotional
shelf was set up and its attractiveness compared to a normal shelf. This display was
located on the candy aisle, which leads to the cash registers, and thus has a lot of
passing through traffic. The opposite side of the aisle has the same products on the
shelves as the additional promotional shelf. There are two virtual POIs that count time
spent and track numbers in both locations. Pictures from the supermarket aisle (Figure
20) and a flow heat map of activity for the tracked area for the whole week of analysis
and the POIs are visualised.
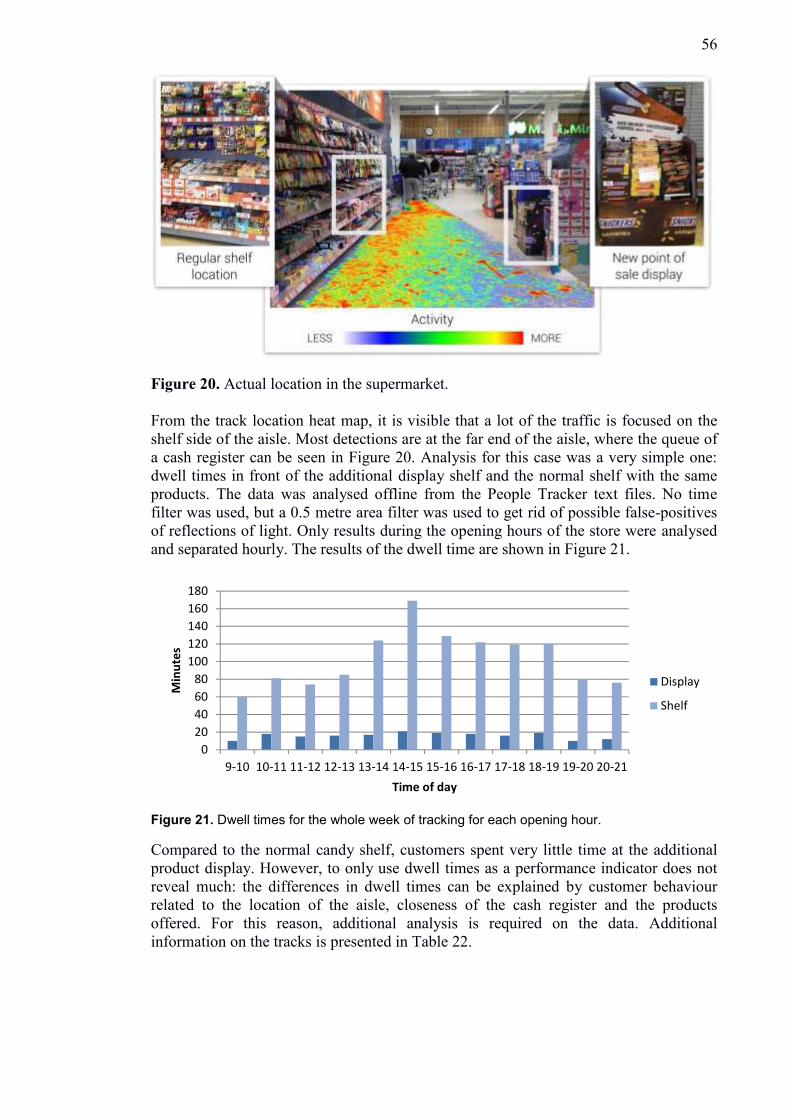
56
Figure 20. Actual location in the supermarket.
From the track location heat map, it is visible that a lot of the traffic is focused on the
shelf side of the aisle. Most detections are at the far end of the aisle, where the queue of
a cash register can be seen in Figure 20. Analysis for this case was a very simple one:
dwell times in front of the additional display shelf and the normal shelf with the same
products. The data was analysed offline from the People Tracker text files. No time
filter was used, but a 0.5 metre area filter was used to get rid of possible false-positives
of reflections of light. Only results during the opening hours of the store were analysed
and separated hourly. The results of the dwell time are shown in Figure 21.
Figure 21. Dwell times for the whole week of tracking for each opening hour.
Compared to the normal candy shelf, customers spent very little time at the additional
product display. However, to only use dwell times as a performance indicator does not
reveal much: the differences in dwell times can be explained by customer behaviour
related to the location of the aisle, closeness of the cash register and the products
offered. For this reason, additional analysis is required on the data. Additional
information on the tracks is presented in Table 22.
0
20
40
60
80
100
120
140
160
180
9-10 10-11 11-12 12-13 13-14 14-15 15-16 16-17 17-18 18-19 19-20 20-21
Min
utes
Time of day
Display
Shelf
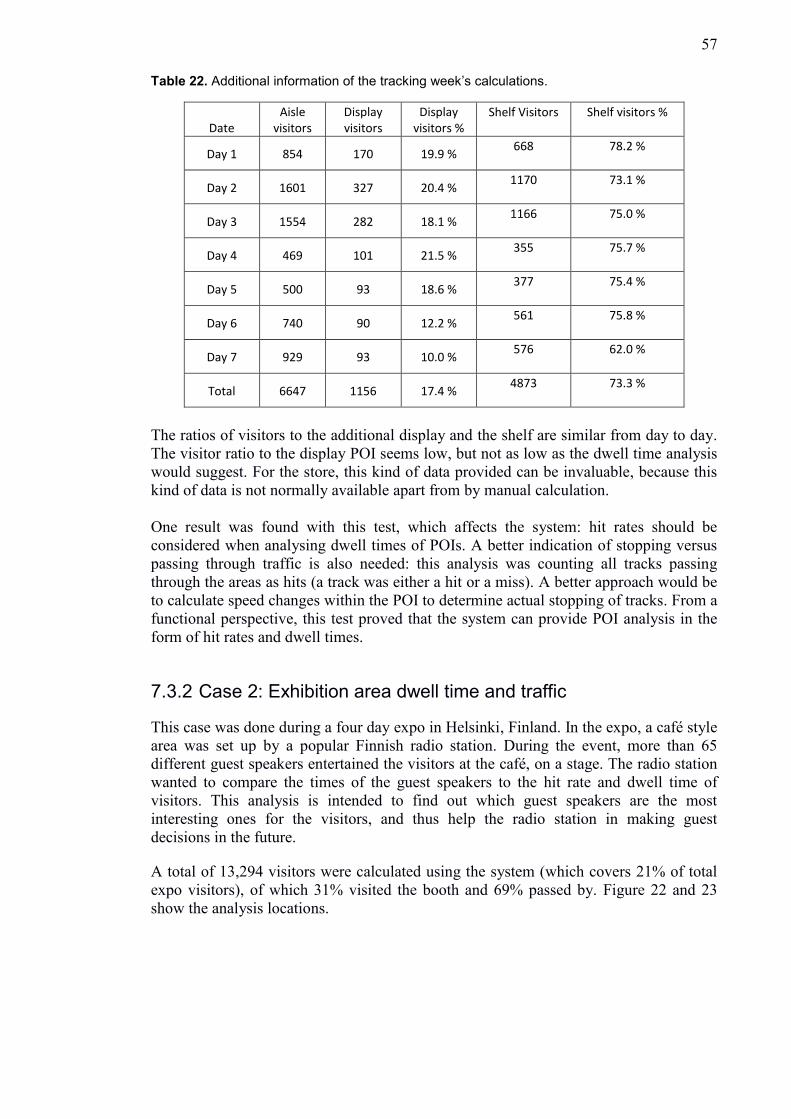
57
Table 22. Additional information of the tracking week’s calculations.
Date Aisle
visitors Display visitors
Display visitors %
Shelf Visitors Shelf visitors %
Day 1 854 170 19.9 % 668 78.2 %
Day 2 1601 327 20.4 % 1170 73.1 %
Day 3 1554 282 18.1 % 1166 75.0 %
Day 4 469 101 21.5 % 355 75.7 %
Day 5 500 93 18.6 % 377 75.4 %
Day 6 740 90 12.2 % 561 75.8 %
Day 7 929 93 10.0 % 576 62.0 %
Total 6647 1156 17.4 % 4873 73.3 %
The ratios of visitors to the additional display and the shelf are similar from day to day.
The visitor ratio to the display POI seems low, but not as low as the dwell time analysis
would suggest. For the store, this kind of data provided can be invaluable, because this
kind of data is not normally available apart from by manual calculation.
One result was found with this test, which affects the system: hit rates should be
considered when analysing dwell times of POIs. A better indication of stopping versus
passing through traffic is also needed: this analysis was counting all tracks passing
through the areas as hits (a track was either a hit or a miss). A better approach would be
to calculate speed changes within the POI to determine actual stopping of tracks. From a
functional perspective, this test proved that the system can provide POI analysis in the
form of hit rates and dwell times.
7.3.2 Case 2: Exhibition area dwell time and traffic
This case was done during a four day expo in Helsinki, Finland. In the expo, a café style
area was set up by a popular Finnish radio station. During the event, more than 65
different guest speakers entertained the visitors at the café, on a stage. The radio station
wanted to compare the times of the guest speakers to the hit rate and dwell time of
visitors. This analysis is intended to find out which guest speakers are the most
interesting ones for the visitors, and thus help the radio station in making guest
decisions in the future.
A total of 13,294 visitors were calculated using the system (which covers 21% of total
expo visitors), of which 31% visited the booth and 69% passed by. Figure 22 and 23
show the analysis locations.
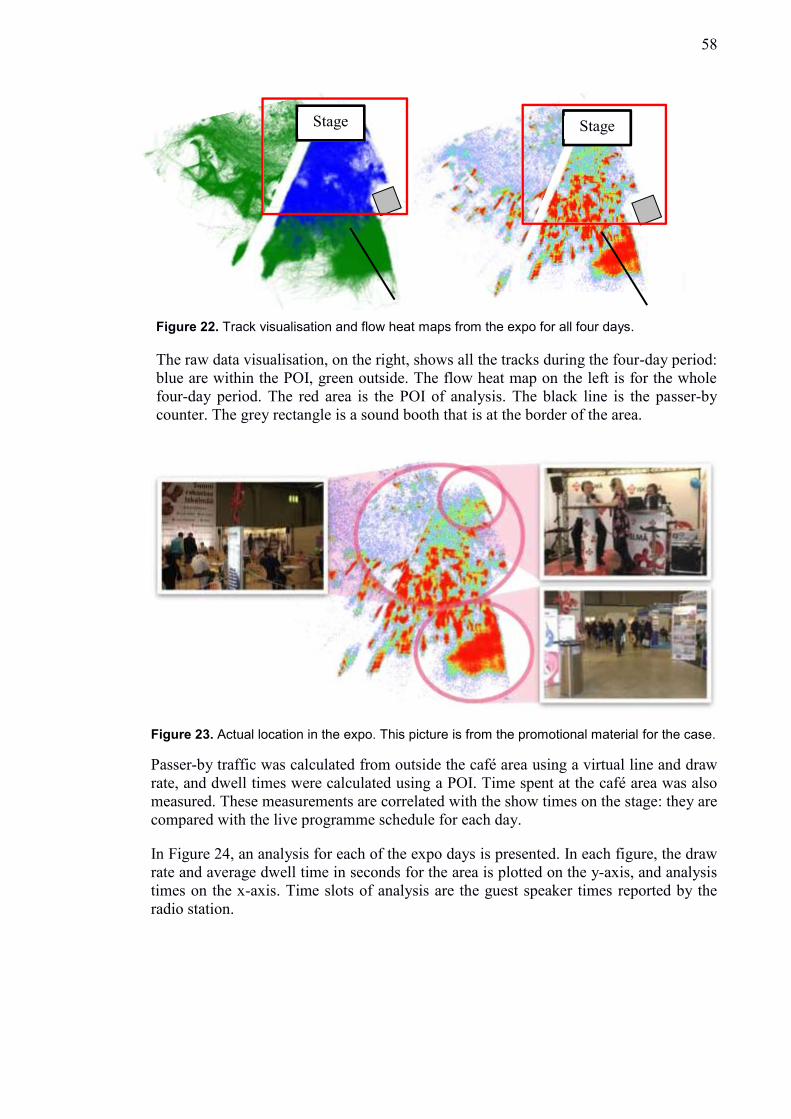
58
Stage Stage
Figure 23. Actual location in the expo. This picture is from the promotional material for the case.
Passer-by traffic was calculated from outside the café area using a virtual line and draw
rate, and dwell times were calculated using a POI. Time spent at the café area was also
measured. These measurements are correlated with the show times on the stage: they are
compared with the live programme schedule for each day.
In Figure 24, an analysis for each of the expo days is presented. In each figure, the draw
rate and average dwell time in seconds for the area is plotted on the y-axis, and analysis
times on the x-axis. Time slots of analysis are the guest speaker times reported by the
radio station.
Figure 22. Track visualisation and flow heat maps from the expo for all four days.
The raw data visualisation, on the right, shows all the tracks during the four-day period:
blue are within the POI, green outside. The flow heat map on the left is for the whole
four-day period. The red area is the POI of analysis. The black line is the passer-by
counter. The grey rectangle is a sound booth that is at the border of the area.
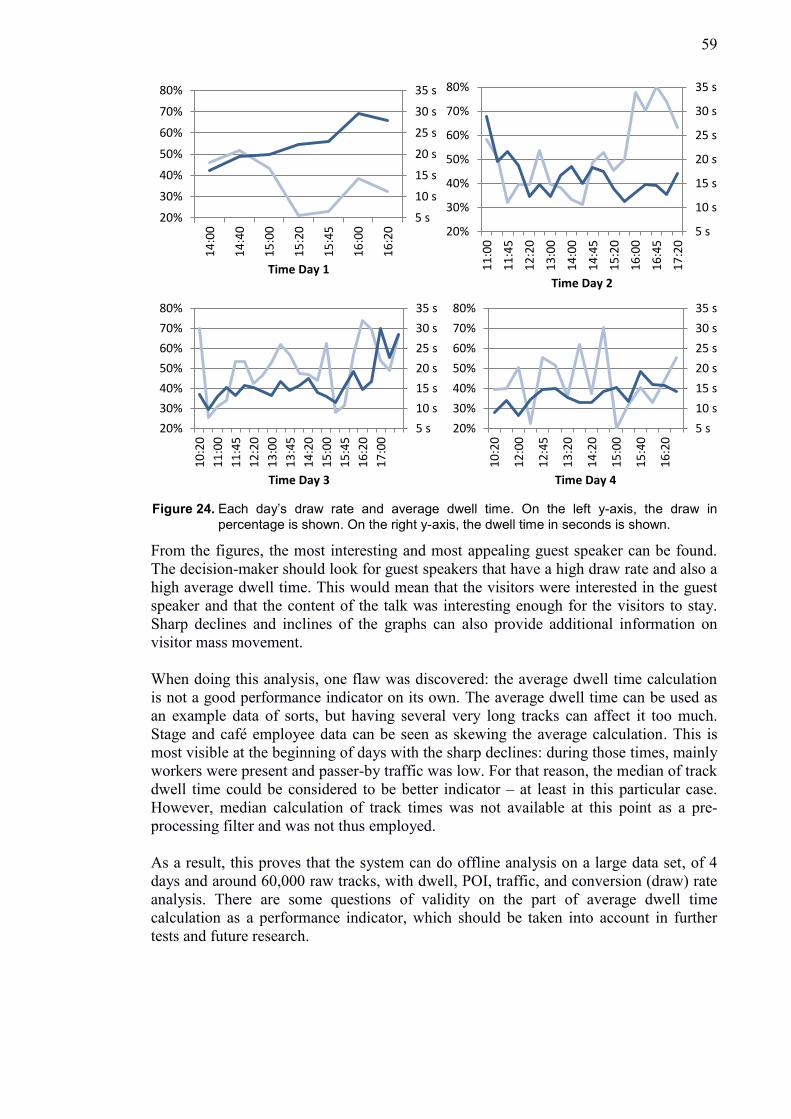
59
5 s
10 s
15 s
20 s
25 s
30 s
35 s
20%
30%
40%
50%
60%
70%
80%
10
:20
12
:00
12
:45
13
:20
14
:20
15
:00
15
:40
16
:20
Time Day 4
5 s
10 s
15 s
20 s
25 s
30 s
35 s
20%
30%
40%
50%
60%
70%
80%
10
:20
11
:00
11
:45
12
:20
13
:00
13
:45
14
:20
15
:00
15
:45
16
:20
17
:00
Time Day 3
Figure 24. Each day’s draw rate and average dwell time. On the left y-axis, the draw in
percentage is shown. On the right y-axis, the dwell time in seconds is shown.
5 s
10 s
15 s
20 s
25 s
30 s
35 s
20%
30%
40%
50%
60%
70%
80%
14
:00
14
:40
15
:00
15
:20
15
:45
16
:00
16
:20
Time Day 1
5 s
10 s
15 s
20 s
25 s
30 s
35 s
20%
30%
40%
50%
60%
70%
80%
11
:00
11
:45
12
:20
13
:00
14
:00
14
:45
15
:20
16
:00
16
:45
17
:20
Time Day 2
From the figures, the most interesting and most appealing guest speaker can be found.
The decision-maker should look for guest speakers that have a high draw rate and also a
high average dwell time. This would mean that the visitors were interested in the guest
speaker and that the content of the talk was interesting enough for the visitors to stay.
Sharp declines and inclines of the graphs can also provide additional information on
visitor mass movement.
When doing this analysis, one flaw was discovered: the average dwell time calculation
is not a good performance indicator on its own. The average dwell time can be used as
an example data of sorts, but having several very long tracks can affect it too much.
Stage and café employee data can be seen as skewing the average calculation. This is
most visible at the beginning of days with the sharp declines: during those times, mainly
workers were present and passer-by traffic was low. For that reason, the median of track
dwell time could be considered to be better indicator – at least in this particular case.
However, median calculation of track times was not available at this point as a pre-
processing filter and was not thus employed.
As a result, this proves that the system can do offline analysis on a large data set, of 4
days and around 60,000 raw tracks, with dwell, POI, traffic, and conversion (draw) rate
analysis. There are some questions of validity on the part of average dwell time
calculation as a performance indicator, which should be taken into account in further
tests and future research.
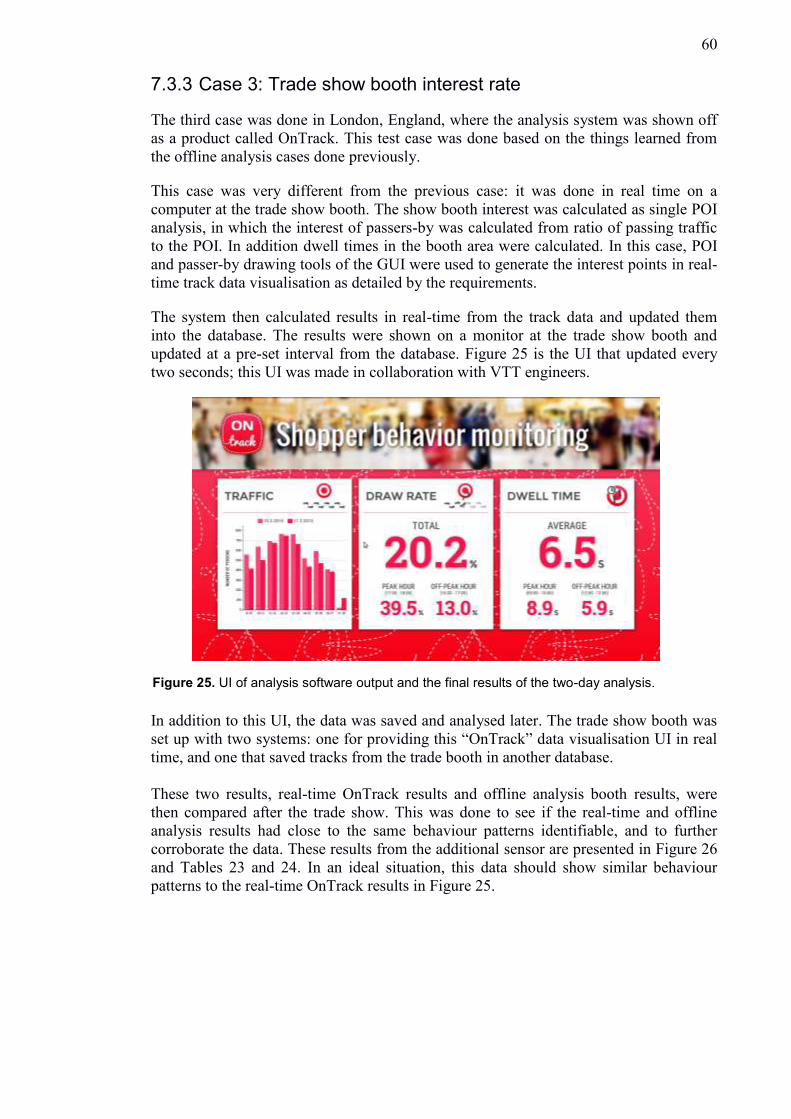
60
7.3.3 Case 3: Trade show booth interest rate
The third case was done in London, England, where the analysis system was shown off
as a product called OnTrack. This test case was done based on the things learned from
the offline analysis cases done previously.
This case was very different from the previous case: it was done in real time on a
computer at the trade show booth. The show booth interest was calculated as single POI
analysis, in which the interest of passers-by was calculated from ratio of passing traffic
to the POI. In addition dwell times in the booth area were calculated. In this case, POI
and passer-by drawing tools of the GUI were used to generate the interest points in real-
time track data visualisation as detailed by the requirements.
The system then calculated results in real-time from the track data and updated them
into the database. The results were shown on a monitor at the trade show booth and
updated at a pre-set interval from the database. Figure 25 is the UI that updated every
two seconds; this UI was made in collaboration with VTT engineers.
In addition to this UI, the data was saved and analysed later. The trade show booth was
set up with two systems: one for providing this “OnTrack” data visualisation UI in real
time, and one that saved tracks from the trade booth in another database.
These two results, real-time OnTrack results and offline analysis booth results, were
then compared after the trade show. This was done to see if the real-time and offline
analysis results had close to the same behaviour patterns identifiable, and to further
corroborate the data. These results from the additional sensor are presented in Figure 26
and Tables 23 and 24. In an ideal situation, this data should show similar behaviour
patterns to the real-time OnTrack results in Figure 25.
Figure 25. UI of analysis software output and the final results of the two-day analysis.
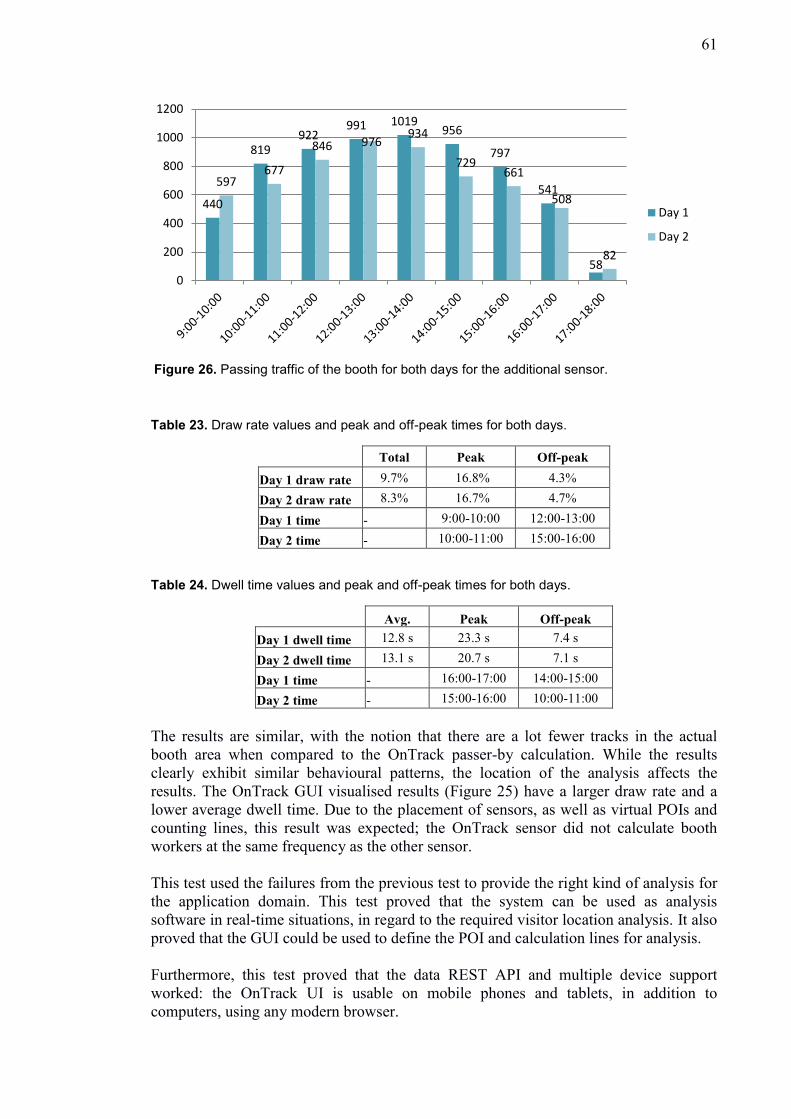
61
Table 23. Draw rate values and peak and off-peak times for both days.
Total Peak Off-peak
Day 1 draw rate 9.7% 16.8% 4.3%
Day 2 draw rate 8.3% 16.7% 4.7%
Day 1 time - 9:00-10:00 12:00-13:00
Day 2 time - 10:00-11:00 15:00-16:00
Table 24. Dwell time values and peak and off-peak times for both days.
Avg. Peak Off-peak
Day 1 dwell time 12.8 s 23.3 s 7.4 s
Day 2 dwell time 13.1 s 20.7 s 7.1 s
Day 1 time - 16:00-17:00 14:00-15:00
Day 2 time - 15:00-16:00 10:00-11:00
The results are similar, with the notion that there are a lot fewer tracks in the actual
booth area when compared to the OnTrack passer-by calculation. While the results
clearly exhibit similar behavioural patterns, the location of the analysis affects the
results. The OnTrack GUI visualised results (Figure 25) have a larger draw rate and a
lower average dwell time. Due to the placement of sensors, as well as virtual POIs and
counting lines, this result was expected; the OnTrack sensor did not calculate booth
workers at the same frequency as the other sensor.
This test used the failures from the previous test to provide the right kind of analysis for
the application domain. This test proved that the system can be used as analysis
software in real-time situations, in regard to the required visitor location analysis. It also
proved that the GUI could be used to define the POI and calculation lines for analysis.
Furthermore, this test proved that the data REST API and multiple device support
worked: the OnTrack UI is usable on mobile phones and tablets, in addition to
computers, using any modern browser.
440
819 922
991 1019 956
797
541
58
597 677
846 976 934
729 661
508
82
0
200
400
600
800
1000
1200
Day 1
Day 2
Figure 26. Passing traffic of the booth for both days for the additional sensor.
62
7.4 Conclusion
Based on the requirement, field experiment and field study evaluation done, we can
conclude that the system was built with satisfactory results.
Requirement evaluation showed that 32 of the 34 requirements were implemented, with
5 of them needing additional work or having functionality not behaving as anticipated.
Two additional requirements are also classified as problematic, bringing the total of
requiring additional work to 7. The two additional requirements were classified as such
due to the fact that testing was inconclusive. These two inconclusive requirements
processing related are: SR-32: Remove false positives, such as tracks that are generated
by reflections of light; and SR-34: Remove parts of tracks in areas where tracking is
unreliable.
Data processing testing showed problems in SR-32, SR-34, and SR-3. According to the
data processing test, it would seem that these requirements are met, but without actually
looking at the data more closely and repeating the tests, the results are inconclusive. The
accuracy of the data is rather good, with around a 15% fault rate. In this test, during
most days, true-positive tracks were discarded at a rate of 4%-15%. This is perhaps due
to the bounding box area filter (SR-3) discarding true-positive tracks that are very
straight, thus having a small bounding area. More testing with a different area filter, one
that perhaps also counts track length, is needed to be more conclusive.
Functional evaluation showed that all behavioural analysis functionality needed for
these use cases was adequate. However, field testing brought out a few places for
improvement and further emphasised some problems.
- Better indication of stopping on the POI is needed; having all POI tracks
calculated as relevant might not be good. Just having someone quickly visit a
POI does not usually denote their interest in the region.
- Dwell times should be calculated with median times in addition to mean times.
- Employee effect on data is not quantifiable. If employees could be removed
from the tracking data somehow, the behavioural analysis results would be more
actionable.
In conclusion, the requirements were met with satisfactory results and the analysis
functionality provided relevant figures to the retail decision-makers. In addition, the
data processing can be seen as working with the presented data, but results are too
specific to be generalizable. More testing is needed on data formation with a new
implementation of the area filter. Data analysis functionality, according to the
advertising firm, are good.
63
8. Discussion
This research aimed to answer two research questions for the purpose of finding an
answer to the main question: how to design and implement a customer location-based
behaviour analysis application for a retail environment? The study was done in three
phases: finding brick-and-mortar retail performance indicators; finding how these
indicators can be used or enhanced with customer-tracking data; and finding how to
implement a system that uses customer-tracking data to provide this analysis. In this
chapter, answers to these and all of the sub-questions will be presented.
Research question 1. What are the industry standard performance metrics for brick-and-mortar retail business?
This research question was answered by employing an extensive systematic literature
review of retail performance indicators. The review found that traditionally, most
performance evaluation is done based on readily available financial data. The
availability of financial variables, such as point of sale data, comes as a by-product of
normal retail day-to-day operations. In addition to availability, sales data is used
because sales success is the end goal of almost all retail activities. Other noteworthy
data used were customer behaviour-related data, such as traffic, and store characteristic
data, such as size and employee count. Some other data, such as customer
demographics, was also used but at a much lower rate.
While the performance variables used differ from study to study and case to case,
metrics were often calculated as ratios of one financial variable compared to some other
variable. Examples of such ratios include sales compared to customer visit numbers,
sales compared to floor space of the store, and sales compared to employee numbers.
These key performance indicators can present many aspects of retail performance that
are not traditionally considered with financial metrics. Since these metrics change from
store to store, establishing a common baseline or a benchmark usable in multiple
locations for these metrics is very hard. Thus, the metrics are traditionally used to find
changes within store performance – for example, a single store’s sales performance can
be found by comparing how store sales have changed quarterly.
Using other quantifiable metrics, such as customer traffic, as a benchmark is even more
troublesome. Retail performance evaluation is almost impossible to do in a way that
encompasses all of the variables affecting it. Even comparing stores within the same
chain might not work, due to all of the external factors affecting the performance. Thus
performance calculation for retail is very context related. For this reason, there seems to
be no silver bullet method of retail performance evaluation, and for this reason most
retail evaluation relies on the “easy way out”: financial metrics.
However according to the literature review the most used metrics are thus: profit,
financial growth, and sales.
64
Research question 1.1: Which metrics employed by brick-and-mortar retail are customer movement based?
The most important finding in the literature review was that normally customer
movement-based metrics are not used, but are known to affect performance. The
literature review found that retail performance is, in large part, affected by many
variables that are not easily quantifiable, such as customer retention rate and
advertisement effects. Customer retention is a goal in addition to a metric – if customers
are retained, more profit can be made. Customers often return to the shop for specific
products or deals, and thus can be affected by advertisements. Customer retention is
additionally affected by many of the hard-to-quantify variables. Studies indicate that
customer retention is affected by sales staff, store layout, ease of shopping, and changes
in the environment. The one constant among these metrics is that they are not by-
products of normal retail operations.
Often when a customer enters the store, no additional movement-based metrics can be
quantified, apart from traffic at the door using door counters. However, the literature
recognises the need for movement-related metrics within the store. These metrics
include such customer movement-based metrics as conversion rate, basket size, and
customer flow. Conversion rate is the ratio of sales to visitor numbers, which can be
easily obtained by door counters and the number of transactions at a POS. And basket
size is the number of transactions in relation to sales.
However, in the literature, other very ambiguously defined metrics are used, such as
customer flow. This study has, however, defined customer flow as the analysis of
customer-preferred areas and routes, which can also easily be used to find relevant
metrics for a retail location. In broad terms, customer flow means the normal routes and
movement decisions that customers make during their visit to the store. This
information brings out behavioural classifications of customers, as well as store spatial
space usage-related statistics. Some examples of these statistics can be points of interest
and hot and cold areas.
Undoubtedly, the most used movement-based metric in literature is visitor numbers,
meaning traffic, which is normally calculated using a door counter system.
Research question 1.2: Which metrics employed by brick-and-mortar retail are store spatial data based?
The most used other spatial data-related metrics are related to the characteristics of the
store. These characteristics can include such variables as sales floor space, the number
of POSs, the number of sales people, and the availability and location of other facilities
such as an ATM. These characteristics affect customer behaviour and thus the financial
metrics of the store.
In addition to customer behaviour, the flow of the customers can be seen as a tool to
find store spatial variables. This approach to flow can quantify store spatial performance
in addition to customer flow. Thus, it is intended that not many spatial or movement
metrics are used in general, but if movement could be quantified, they could be used.
65
Research question 2. What kind of information can be derived from customer-tracking data that is meaningful for retail decision-makers?
In this thesis, a domain analysis of customer behavioural analysis systems was
presented. It was found that some companies are offering customer traffic and flow
analysis as a product for retail. Many of these systems offered a contemporary web-
based UI to show relevant data to retail decision-makers. Analysed data was the same as
found in the literature review: customer traffic and customer flow-based data.
Additionally, dwell times and a point of interest conversion rate calculation were used
extensively.
Most systems do not incorporate sales data due to availability issues. However, many
systems did offer an output interface for business intelligence systems. In this way the
decision-makers at the stores do not have to then share sales data with companies
providing behavioural analysis. They can however output the data from the behaviour
analysis systems and then calculate KPIs as they see fit, using other business
intelligence tools.
The most used analysis results by these state-of-the-art companies were traffic,
conversion, sales in relation to spatial metrics, customer flow, points of interest, dwell
times at points of interest, and hit-rates at points of interest.
Research question 2.1: What kind of data abstraction and visualisation is required for customer-tracking data analysis results to be usable?
The systems found in the state-of-the-art analysis and domain analysis mostly used
contemporary methods to visualise behaviour data. The most used way was as a web-
application with a dashboard for the retail decision-maker.
The method of visualising data was often mainly based on normal data visualisation
techniques: bar graphs, line plots, pie charts, and tables. However, more advanced
visualisations were also used, such as heat maps for customer locations. These heat
maps can reveal the hot and cold areas of the stores in great detail.
As a result, it is proposed that data needs to be abstracted to a format that is
understandable to most people, such as bar graphs. In addition, this thesis proposes that
all raw tracking data should be viewable by the decision-maker upon request. This
would allow the decision-maker to make informed decisions on where they would like
to analyse the points of interest or customer traffic. This will enable the decision-makers
to use their knowledge to make informed decisions on the analysis and how to filter the
data.
Research question 3. How to design and implement a customer location-based behaviour analysis application for a retail environment?
There is a definite need in retail to quantify customer movements reliably. By
employing flow and point of interest analysis, shop spatial metrics and customer
behaviour can be quantified.
To design a system for the use of this business domain, it should be grounded in
methods that are found to be right for the domain. These methods should then be
applied to the system to try and design a relevant system. For this reason, the research
66
was done using a systematic literature review and a domain analysis. The result of this
is a high-level conceptual framework that is used as basis for system implementation.
Implementation was based on all the data presented in the previous answers.
Implementation was done in two separate prototypes, which, broadly speaking, can be
divided into: 1) making data actionable; and 2) analysing data in real time and making it
usable for the user.
It was found that data visualisation is a very important aspect of communicating results.
It is also proposed that humans should be a part of the data analysis, and as much data as
possible should be available to the users. Exploratory data analysis is achieved in this
system by using metadata on tracking and raw track data visualisation. With this
approach, the decision-maker can use the system as a tool for first finding interesting
patterns from the data, and then focusing on those patterns with the presented tools.
In addition, tools for enabling point of interest, dwell time, hit-rate, and flow analysis
are proposed. These tools have to work in close conjunction with the exploratory data
visualisation to enable powerful analysis. After using the tools, the decision-maker can
see the results and compare them with different ones using the GUI. In addition to the
GUI, the tracking data and the analysis results from the system are made available for
other systems via the use of an API.
Evaluation of the system showed that this approach to building a customer behavioural
analysis system is good. The presented field studies outlined that behavioural data
analysis is usable and that customers find it useful. Evaluation did, however, find some
room for improvement in the analysis functionality.
8.1 Limitations
The subject matter of this study is broad, and there were risks regarding the scope and
phases of the study. Possible caveats and limitations include:
- Close reliance on other systems.
- The customer not really incorporated into the process, although the system is
made with customers in mind.
- Skill level of worker with regard to the wanted outcome.
Phases of the work were planned to combat these three caveats. The reliance on People
Tracker was minimised through the use of VTT expert advice. The customer needs were
found from other sources than literature, as well. Reliance on worker skill level was
minimised through the use of programming conventions and research methodology.
In this research, the approach is unconventional because the customer is not
incorporated into the system-building process; however, the voice of the customer is
presented through the SLR. This can bring some validity concerns to the system
requirements. In addition, the systematic review has other limitations. Even though
efforts were made to find all relevant studies, it is not certain that this aim was achieved.
To combat this problem, the domain analysis was presented and the results of the
literature review were compared to the domain analysis technologies and systems.
This thesis system provides a lot of functionality, but it is far from being of commercial
product quality. The quality of the GUI and the usability of the system were not tested
and are sub-par when compared to commercial products. As such, usability was not
67
considered in the evaluation at all. As the evaluation found, some analysis functionality
was not up to par, either. It is, however, proposed that this is part of the DSR design
cycle; finding what works and what does not. The problem of having not defined some
analyses as accurately as possible led to them being identified as defects in the
evaluation stage.
The system was built with the knowledge that no financial data was available for this
present study. However, due to result of the literature review, sales cannot be wholly
excluded from the system point of view. It has been noted that sales-related KPIs cannot
be discarded from the system development stand point. For this reason, no attempt was
made to incorporate the sales data into the system. Tracking and result data is available
from the system as an output, to enable BI analysis.
8.2 Implications
The customer-tracking domain is a very new and upcoming research and business
domain, and thus there is not much research on the subject. To the best of our
knowledge, this study is the first one to compare retail metrics in the literature to those
actually used in the customer-tracking domain. According to the literature review, the
new opportunities in the tracking technologies are being tested, but no one has studied
the needs of the application domain in detail and compared them to the literature. It
would also seem that the literature is not in agreement about flow analysis and what it
means: in this context this study provides a possible definition of customer flow.
Each behaviour analysis case is different, and each retail decision-maker has different
needs. Behaviour analysis software thus needs to be easily expandable with new
functionality and new analysis settings. This was considered in designing the system to
be as easily expendable as possible. As an example, a large data set tool was written for
the thesis system using only about 50 lines of code. This was then used to analyse a set
of data with over 6 million tracks. This case was an ad-hoc analysis addition that
showed the same as the literature: this case had a very context-related analysis need, and
the analysis had to be custom made. The framework and system implemented in this
study supported this analysis easily.
In general, this research proposes a way to visualise location data in a way that is usable
by retail decision-makers. This enables them to easily define points of interest and other
calculation variables for the calculation of customer behaviour-related statistics. These
tools can then provide the decision-makers with data that is traditionally not easily or
not at all available. Evaluation of the artefact proved that this hard to quantify data is
analysed and visualised by the system.
68
9. Conclusion
The thesis system was to be used to gain understanding and insight into customer
behaviour patterns, and to understand such spatial layout-related statistics as: how much
time customers spend in different areas of the shop, and what the normal route choices
are that the customers make. In addition, the software was used as a substitution for
traditional people-counting solutions, such as counters that are situated in the doorways
of a shop.
The thesis succeeded in what it set out to do: constructing a contemporary e-commerce
style customer behaviour analysis for brick-and-mortar retail.
9.1 Future research
Evaluation of the system found that at least two analysis functions need reworking, and
one feature seems to be not good:
- Track data speed changes to detect stops and to find interest areas dynamically.
- Median track dwell times instead of mean times.
- Bounding area filter not good for track area detection.
Evaluation of the domain gave indications of additional analysis functionality. Other
proposed additional analysis functionality include:
- Store POS queue management.
- Classification of tracks with learning models to detect people who are hesitating
or lost.
- A way for the system to distinguish visitors from employees.
A lot of future research is enabled through this system and its implications. Possible
future iterations of a customer location analysis system could be built on this thesis
system: the chosen implementation allows for easy expandability.
69
References
Al-Kassab, J., Thiesse, F., & Buckel, T. (2013). RFID-Enabled Business Process
Intelligence in Retail Stores: A Case Report. Journal of Theoretical and Applied
Electronic Commerce Research, 8(2), 19–20. http://doi.org/10.4067/S0718-
18762013000200010
Anic, I.-D., Radas, S., & Lim, L. K. S. (2010). Relative effects of store traffic and
customer traffic flow on shopper spending. The International Review of Retail,
Distribution and Consumer Research, 20(2), 237–250.
Babakus, E., Bienstock, C. C., & Scotter, J. R. V. (2004). Linking Perceived Quality
and Customer Satisfaction to Store Traffic and Revenue Growth*. Decision
Sciences, 35(4), 713–737.
Batislam, E. P., Denizel, M., & Filiztekin, A. (2007). Empirical validation and
comparison of models for customer base analysis. International Journal of
Research in Marketing, 24(3), 201–209.
http://doi.org/10.1016/j.ijresmar.2006.12.005
Beyme, D. (2000). Person counting using stereo. In Human Motion, 2000. Proceedings.
Workshop on (pp. 127–133). IEEE.
Buckel, T., & Thiesse, F. (2014). Paving the Way to a Productive RFID System: A
Novel Action Research Based Study from Fashion Retail (pp. 4680–4689).
IEEE. http://doi.org/10.1109/HICSS.2014.573
Chebat, J.-C., Gélinas-Chebat, C., & Therrien, K. (2005). Lost in a mall, the effects of
gender, familiarity with the shopping mall and the shopping values on shoppers’
wayfinding processes. Journal of Business Research, 58(11), 1590–1598.
http://doi.org/10.1016/j.jbusres.2004.02.006
Ding, Y., & Huber, J. (2008). Designing multi-user multi-device systems: an
architecture for multi-browsing applications. In Proceedings of the 7th
International Conference on Mobile and Ubiquitous Multimedia (pp. 8–14).
ACM.
Doms, M. E., Jarmin, R. S., & Klimek, S. D. (2004). Information technology investment
and firm performance in US retail trade. Economics of Innovation and New
Technology, 13(7), 595–613.
Dubelaar, C., Bhargava, M., & Ferrarin, D. (2002). Measuring retail productivity: what
really matters? Journal of Business Research, 55(5), 417–426.
Tornado. (2014, July 14). Tornado Web Server — Tornado 4.2.1 documentation.
Retrieved August 3, 2015, from http://www.tornadoweb.org/en/stable/
70
Freo, M. (2005). The impact of sales promotions on store performance: a structural
vector autoregressive approach. Statistical Methods and Applications, 14(2),
271–281. http://doi.org/10.1007/s10260-005-0114-x
Gauri, D. K., Pauler, J. G., & Trivedi, M. (2009). Benchmarking performance in retail
chains: an integrated approach. Marketing Science, 28(3), 502–515.
Gaur, V., Fisher, M. L., & Raman, A. (2005). An econometric analysis of inventory
turnover performance in retail services. Management Science, 51(2), 181–194.
Gonzalez-Jorge, H., Riveiro, B., Vazquez-Fernandez, E., Martínez-Sánchez, J., & Arias,
P. (2013). Metrological evaluation of microsoft kinect and asus xtion sensors.
Measurement, 46(6), 1800–1806.
Hevner, A. R., March, S. T., & Ram, S. (2004). Design Science in Information System
Research. MIS Quarterly, 28(1), 75–105.
Homburg, C., Hoyer, W. D., & Fassnacht, M. (2002). Service orientation of a retailer’s
business strategy: Dimensions, antecedents, and performance outcomes. Journal
of Marketing, 66(4), 86–101.
Jungong Han, Ling Shao, Dong Xu, & Shotton, J. (2013). Enhanced Computer Vision
With Microsoft Kinect Sensor: A Review. IEEE Transactions on Cybernetics,
43(5), 1318–1334. http://doi.org/10.1109/TCYB.2013.2265378
Keim, D. (2002). Information visualization and visual data mining. Visualization and
Computer Graphics, IEEE Transactions on, 8(1), 1–8.
Krafft, M., & Mantrala, M. K. (Eds.). (2010). Retailing in the 21st century: current and
future trends (2nd ed). Heidelberg ; New York: Springer.
Kuiper, J. A., Ayers, A. J., Holm, M. E., & Nowak, M. J. (2014). Python Coding of
Geospatial Processing in Web-based Mapping Applications.
Lam, S. Y., Vandenbosch, M., Hulland, J., & Pearce, M. (2001). Evaluating Promotions
in Shopping Environments: Decomposing Sales Response into Attraction,
Conversion, and Spending Effects. Marketing Science, 20(2), pp. 194–215.
Moeller, S., Fassnacht, M., & Ettinger, A. (2009). Retaining Customers With Shopping
Convenience. Journal of Relationship Marketing, 8(4), 313–329.
http://doi.org/10.1080/15332660903344644
Nakamura, J., Tomita, Y., & Honda, S. (1994). Algorithm for counting the number of
persons using ir image processing. In Instrumentation and Measurement
Technology Conference, 1994. IMTC/94. Conference Proceedings. 10th
Anniversary. Advanced Technologies in I & M., 1994 IEEE (pp. 220–223).
IEEE.
Nunamaker, J. F., Chen, M., & Purdin, T. (1991). Systems Development in Information
Systems Research.
71
Parsons, A. G. (2003). Assessing the effectiveness of shopping mall promotions:
Customer analysis. International Journal of Retail & Distribution Management,
31(2/3), 74–79.
Parsons, A. G., & Ballantine, P. W. (2004). Market dominance, promotions, and
shopping mall group performance. International Journal of Retail &
Distribution Management, 32(10), 458–463.
Patel, G. N., & Pande, S. (2013). Measuring the performance of pharmacy stores using
discretionary and non-discretionary variables. OPSEARCH, 50(1), 25–41.
http://doi.org/10.1007/s12597-012-0095-0
Perdikaki, O., Kesavan, S., & Swaminathan, J. M. (2012). Effect of Traffic on Sales and
Conversion Rates of Retail Stores. Manufacturing & Service Operations
Management, 14(1), 145–162.
Pilat, D. (2005). Assessing the Productivity of the UK Retail Sector: Some Further
Reflections. The International Review of Retail, Distribution and Consumer
Research, 15(3), 291–296. http://doi.org/10.1080/09593960500119564
Piórkowski, A. (2011). Mysql spatial and postgis–implementations of spatial data
standards. Electronic Journal of Polish Agricultural Universities, 14(1), 1–8.
PostgreSQL Global Development Group. (2013, September 9). PostgreSQL:
Documentation: 9.3: Release 9.3. Retrieved August 3, 2015, from
http://www.postgresql.org/docs/9.3/static/release-9-3.html
Pressman, R. S. (2010). Software engineering: a practitioner’s approach (7th ed). New
York: McGraw-Hill Higher Education.
Pritchard, M., & Silvestro, R. (2005). Applying the service profit chain to analyse retail
performance: The case of the managerial strait-jacket? International Journal of
Service Industry Management, 16(4), 337–356.
Rhee, H., & Bell, D. R. (2002). The inter-store mobility of supermarket shoppers.
Journal of Retailing, 78(4), 225–237.
Rodnitzky, A. (n.d.). Best practices for Implementing in Store Analytics in Brick-and-
Mortar Retail [Whitepaper].
Sellers-Rubio, R., & Mas-Ruiz, F. (2007). Different Approaches to the Evaluation of
Performance in Retailing. The International Review of Retail, Distribution and
Consumer Research, 17(5), 503–522.
http://doi.org/10.1080/09593960701631953
Senior, A. W., Brown, L., Hampapur, A., Shu, C.-F., Zhai, Y., Feris, R. S., … Carlson,
C. (2007). Video analytics for retail.
ShopperTrak. (n.d.). 5 ways to Enhance the Shopping Experience Using Location-Based
Analytics [Whitepaper].
72
Song, J., Dong, Y.-F., Yang, X.-W., Gu, J.-H., & Fan, P.-P. (2008). Infrared passenger
flow collection system based on RBF neural net. In Machine Learning and
Cybernetics, 2008 International Conference on (Vol. 3, pp. 1277–1281). IEEE.
van der Veen, J. S., van der Waaij, B., & Meijer, R. J. (2012). Sensor Data Storage
Performance: SQL or NoSQL, Physical or Virtual (pp. 431–438). IEEE.
http://doi.org/10.1109/CLOUD.2012.18
van Solingen, R., & Berghout, E. (1999). The goal/question/metric method: a practical
guide for quality improvement of software development. London: The McGraw-
Hill Companies.
Vipin, R. (2014, November 1). How to: Install PostGIS 2 for PostgreSQL 9.3 on Ubuntu
[Guide]. Retrieved August 3, 2015, from http://technobytz.com/install-postgis-
postgresql-9-3-ubuntu.html
Vyt, D. (2008). Retail network performance evaluation: a DEA approach considering
retailers’ geomarketing. The International Review of Retail, Distribution and
Consumer Research, 18(2), 235–253.
http://doi.org/10.1080/09593960701868522
Yaeli, A., Bak, P., Feigenblat, G., Nadler, S., POItman, H., Saadoun, G., … Sandbank,
T. (2014). Understanding customer behavior using indoor location analysis and
visualization.
Yim Yiu, C., & Cheong Ng, H. (2010). Buyers-to-shoppers ratio of shopping malls: A
probit study in Hong Kong. Journal of Retailing and Consumer Services, 17(5),
349–354. http://doi.org/10.1016/j.jretconser.2010.03.016
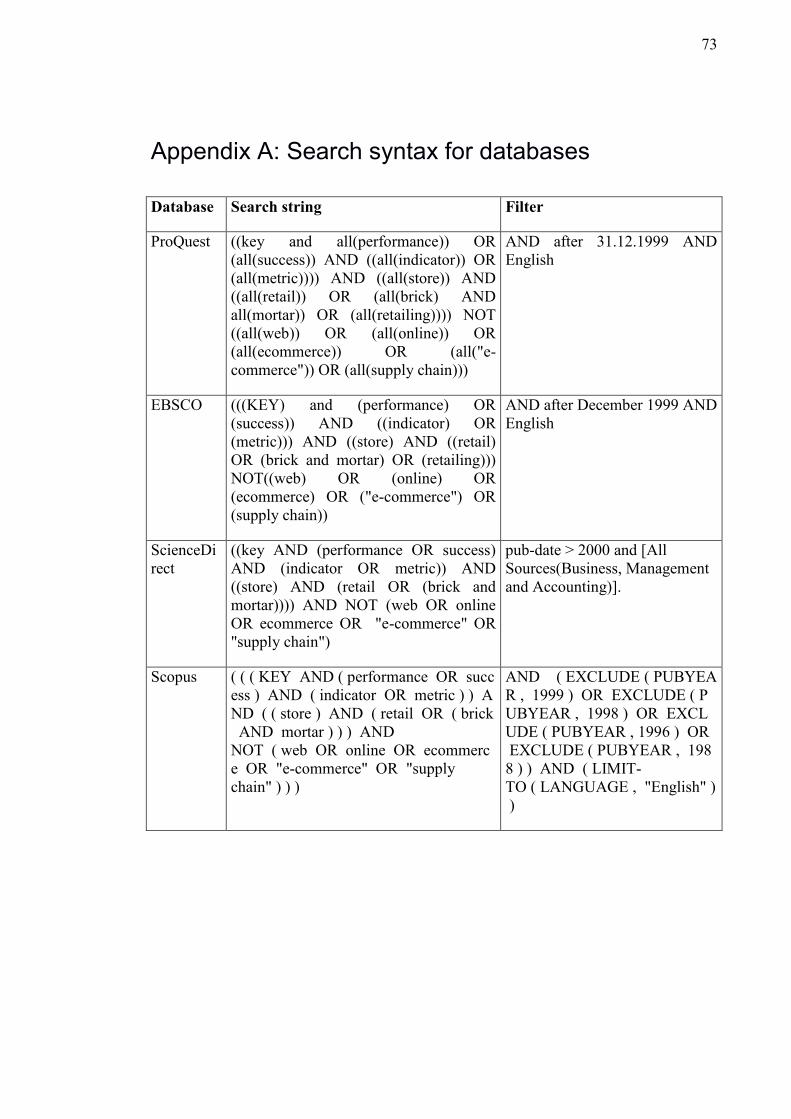
73
Appendix A: Search syntax for databases
Database Search string Filter
ProQuest ((key and all(performance)) OR
(all(success)) AND ((all(indicator)) OR
(all(metric)))) AND ((all(store)) AND
((all(retail)) OR (all(brick) AND
all(mortar)) OR (all(retailing)))) NOT
((all(web)) OR (all(online)) OR
(all(ecommerce)) OR (all("e-
commerce")) OR (all(supply chain)))
AND after 31.12.1999 AND
English
EBSCO (((KEY) and (performance) OR
(success)) AND ((indicator) OR
(metric))) AND ((store) AND ((retail)
OR (brick and mortar) OR (retailing)))
NOT((web) OR (online) OR
(ecommerce) OR ("e-commerce") OR
(supply chain))
AND after December 1999 AND
English
ScienceDi
rect
((key AND (performance OR success)
AND (indicator OR metric)) AND
((store) AND (retail OR (brick and
mortar)))) AND NOT (web OR online
OR ecommerce OR "e-commerce" OR
"supply chain")
pub-date > 2000 and [All
Sources(Business, Management
and Accounting)].
Scopus ( ( ( KEY AND ( performance OR succ
ess ) AND ( indicator OR metric ) ) A
ND ( ( store ) AND ( retail OR ( brick
AND mortar ) ) ) AND
NOT ( web OR online OR ecommerc
e OR "e-commerce" OR "supply
chain" ) ) )
AND ( EXCLUDE ( PUBYEA
R , 1999 ) OR EXCLUDE ( P
UBYEAR , 1998 ) OR EXCL
UDE ( PUBYEAR , 1996 ) OR
EXCLUDE ( PUBYEAR , 198
8 ) ) AND ( LIMIT-
TO ( LANGUAGE , "English" )
)
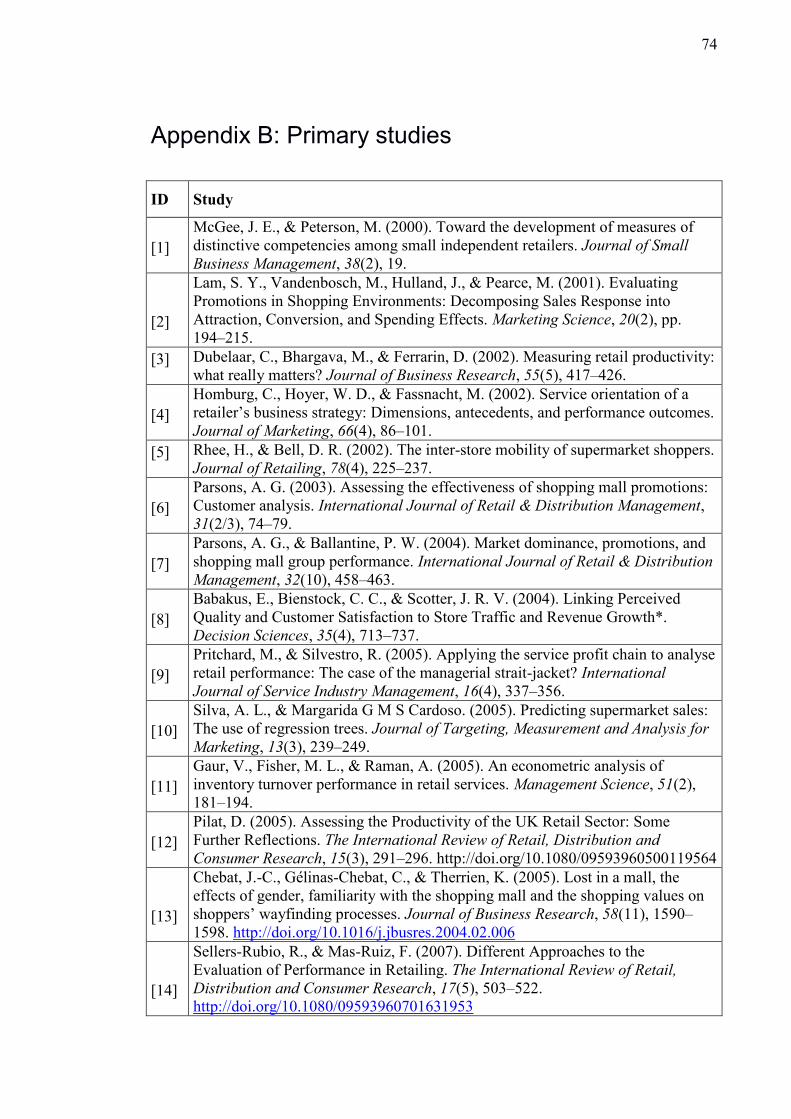
74
Appendix B: Primary studies
ID Study
[1]
McGee, J. E., & Peterson, M. (2000). Toward the development of measures of
distinctive competencies among small independent retailers. Journal of Small
Business Management, 38(2), 19.
[2]
Lam, S. Y., Vandenbosch, M., Hulland, J., & Pearce, M. (2001). Evaluating
Promotions in Shopping Environments: Decomposing Sales Response into
Attraction, Conversion, and Spending Effects. Marketing Science, 20(2), pp.
194–215.
[3] Dubelaar, C., Bhargava, M., & Ferrarin, D. (2002). Measuring retail productivity:
what really matters? Journal of Business Research, 55(5), 417–426.
[4]
Homburg, C., Hoyer, W. D., & Fassnacht, M. (2002). Service orientation of a
retailer’s business strategy: Dimensions, antecedents, and performance outcomes.
Journal of Marketing, 66(4), 86–101.
[5] Rhee, H., & Bell, D. R. (2002). The inter-store mobility of supermarket shoppers.
Journal of Retailing, 78(4), 225–237.
[6]
Parsons, A. G. (2003). Assessing the effectiveness of shopping mall promotions:
Customer analysis. International Journal of Retail & Distribution Management,
31(2/3), 74–79.
[7]
Parsons, A. G., & Ballantine, P. W. (2004). Market dominance, promotions, and
shopping mall group performance. International Journal of Retail & Distribution
Management, 32(10), 458–463.
[8]
Babakus, E., Bienstock, C. C., & Scotter, J. R. V. (2004). Linking Perceived
Quality and Customer Satisfaction to Store Traffic and Revenue Growth*.
Decision Sciences, 35(4), 713–737.
[9]
Pritchard, M., & Silvestro, R. (2005). Applying the service profit chain to analyse
retail performance: The case of the managerial strait-jacket? International
Journal of Service Industry Management, 16(4), 337–356.
[10]
Silva, A. L., & Margarida G M S Cardoso. (2005). Predicting supermarket sales:
The use of regression trees. Journal of Targeting, Measurement and Analysis for
Marketing, 13(3), 239–249.
[11]
Gaur, V., Fisher, M. L., & Raman, A. (2005). An econometric analysis of
inventory turnover performance in retail services. Management Science, 51(2),
181–194.
[12]
Pilat, D. (2005). Assessing the Productivity of the UK Retail Sector: Some
Further Reflections. The International Review of Retail, Distribution and
Consumer Research, 15(3), 291–296. http://doi.org/10.1080/09593960500119564
[13]
Chebat, J.-C., Gélinas-Chebat, C., & Therrien, K. (2005). Lost in a mall, the
effects of gender, familiarity with the shopping mall and the shopping values on
shoppers’ wayfinding processes. Journal of Business Research, 58(11), 1590–
1598. http://doi.org/10.1016/j.jbusres.2004.02.006
[14]
Sellers-Rubio, R., & Mas-Ruiz, F. (2007). Different Approaches to the
Evaluation of Performance in Retailing. The International Review of Retail,
Distribution and Consumer Research, 17(5), 503–522.
http://doi.org/10.1080/09593960701631953
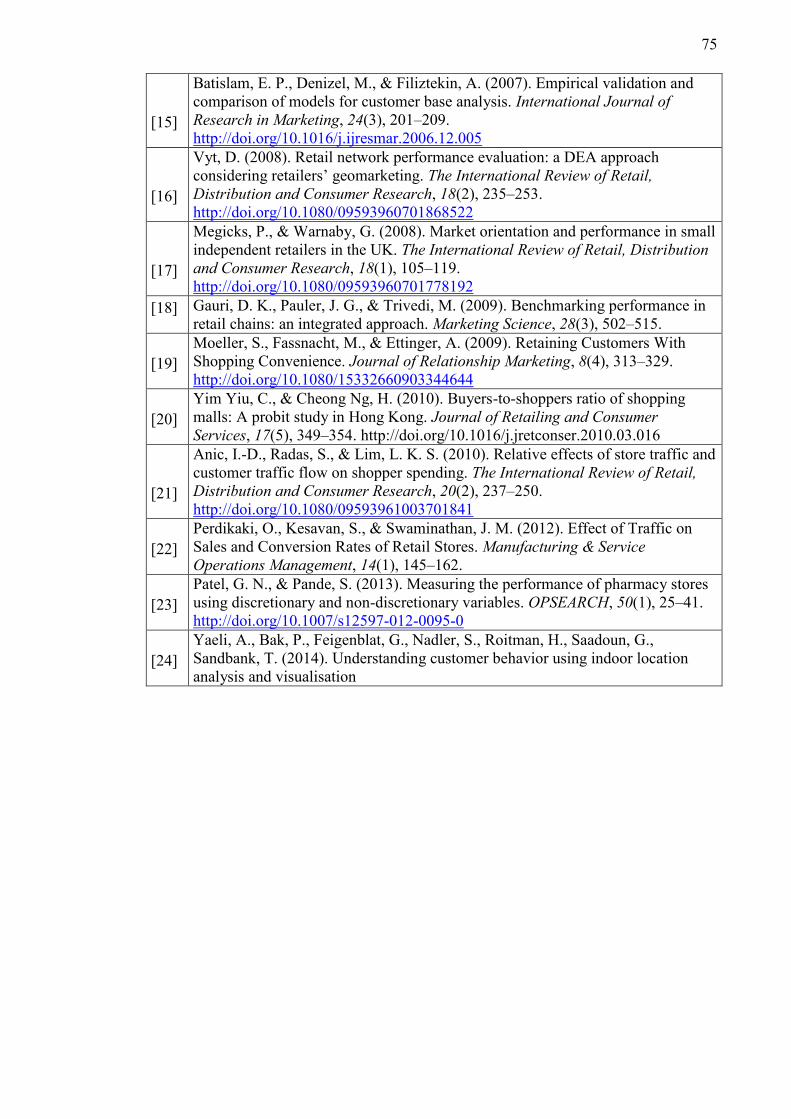
75
[15]
Batislam, E. P., Denizel, M., & Filiztekin, A. (2007). Empirical validation and
comparison of models for customer base analysis. International Journal of
Research in Marketing, 24(3), 201–209.
http://doi.org/10.1016/j.ijresmar.2006.12.005
[16]
Vyt, D. (2008). Retail network performance evaluation: a DEA approach
considering retailers’ geomarketing. The International Review of Retail,
Distribution and Consumer Research, 18(2), 235–253.
http://doi.org/10.1080/09593960701868522
[17]
Megicks, P., & Warnaby, G. (2008). Market orientation and performance in small
independent retailers in the UK. The International Review of Retail, Distribution
and Consumer Research, 18(1), 105–119.
http://doi.org/10.1080/09593960701778192
[18] Gauri, D. K., Pauler, J. G., & Trivedi, M. (2009). Benchmarking performance in
retail chains: an integrated approach. Marketing Science, 28(3), 502–515.
[19]
Moeller, S., Fassnacht, M., & Ettinger, A. (2009). Retaining Customers With
Shopping Convenience. Journal of Relationship Marketing, 8(4), 313–329.
http://doi.org/10.1080/15332660903344644
[20]
Yim Yiu, C., & Cheong Ng, H. (2010). Buyers-to-shoppers ratio of shopping
malls: A probit study in Hong Kong. Journal of Retailing and Consumer
Services, 17(5), 349–354. http://doi.org/10.1016/j.jretconser.2010.03.016
[21]
Anic, I.-D., Radas, S., & Lim, L. K. S. (2010). Relative effects of store traffic and
customer traffic flow on shopper spending. The International Review of Retail,
Distribution and Consumer Research, 20(2), 237–250.
http://doi.org/10.1080/09593961003701841
[22]
Perdikaki, O., Kesavan, S., & Swaminathan, J. M. (2012). Effect of Traffic on
Sales and Conversion Rates of Retail Stores. Manufacturing & Service
Operations Management, 14(1), 145–162.
[23]
Patel, G. N., & Pande, S. (2013). Measuring the performance of pharmacy stores
using discretionary and non-discretionary variables. OPSEARCH, 50(1), 25–41.
http://doi.org/10.1007/s12597-012-0095-0
[24]
Yaeli, A., Bak, P., Feigenblat, G., Nadler, S., Roitman, H., Saadoun, G.,
Sandbank, T. (2014). Understanding customer behavior using indoor location
analysis and visualisation
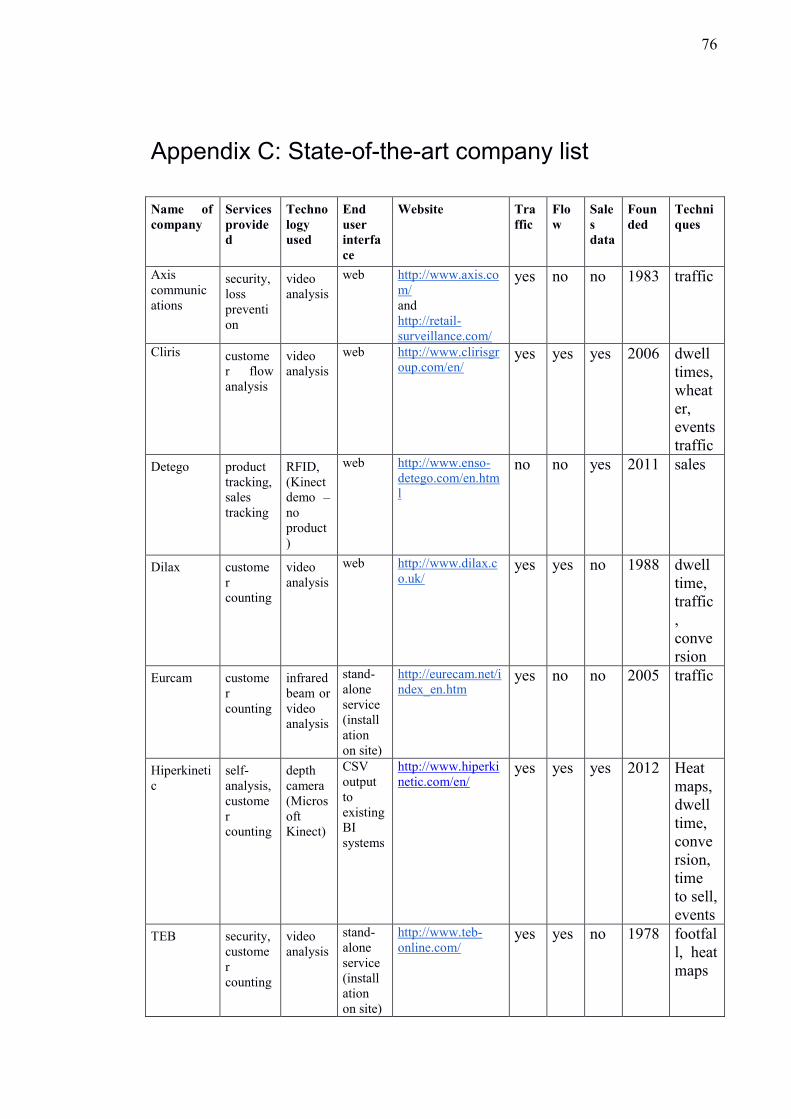
76
Appendix C: State-of-the-art company list
Name of
company
Services
provide
d
Techno
logy
used
End
user
interfa
ce
Website Tra
ffic
Flo
w
Sale
s
data
Foun
ded
Techni
ques
Axis
communic
ations
security,
loss
preventi
on
video
analysis
web http://www.axis.co
m/ and
http://retail-
surveillance.com/
yes no no 1983
traffic
Cliris custome
r flow
analysis
video
analysis
web http://www.clirisgr
oup.com/en/
yes yes yes 2006 dwell
times,
wheat
er,
events
traffic
Detego product
tracking,
sales
tracking
RFID,
(Kinect
demo –
no
product
)
web http://www.enso-
detego.com/en.htm
l
no no yes 2011
sales
Dilax custome
r
counting
video
analysis
web http://www.dilax.c
o.uk/
yes yes no 1988 dwell
time,
traffic
,
conve
rsion
Eurcam custome
r
counting
infrared
beam or
video
analysis
stand-
alone
service
(install
ation
on site)
http://eurecam.net/i
ndex_en.htm
yes no no 2005 traffic
Hiperkineti
c
self-
analysis,
custome
r
counting
depth
camera
(Micros
oft
Kinect)
CSV
output
to
existing
BI
systems
http://www.hiperki
netic.com/en/
yes yes yes 2012 Heat
maps,
dwell
time,
conve
rsion,
time
to sell,
events
TEB security,
custome
r
counting
video
analysis
stand-
alone
service
(install
ation
on site)
http://www.teb-
online.com/
yes yes no 1978 footfal
l, heat
maps
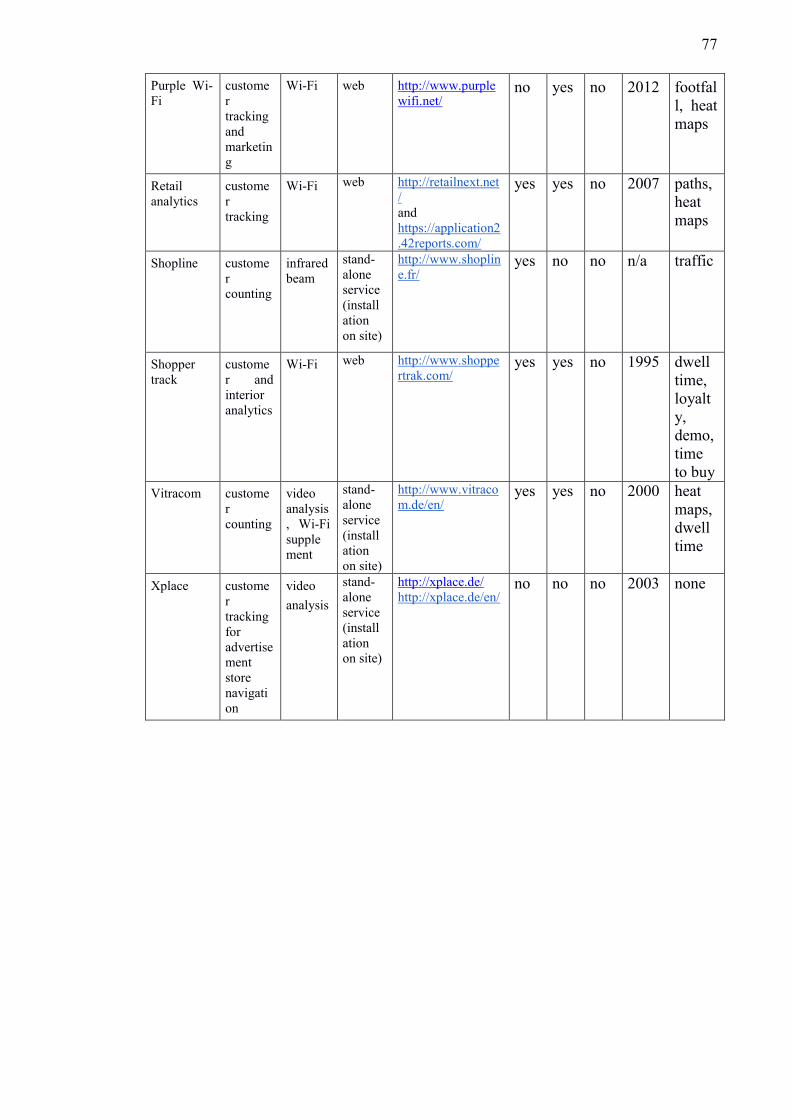
77
Purple Wi-
Fi
custome
r
tracking
and
marketin
g
Wi-Fi web http://www.purple
wifi.net/
no yes no 2012 footfal
l, heat
maps
Retail
analytics
custome
r
tracking
Wi-Fi web http://retailnext.net
/
and
https://application2
.42reports.com/
yes yes no 2007 paths,
heat
maps
Shopline
custome
r
counting
infrared
beam
stand-
alone
service
(install
ation
on site)
http://www.shoplin
e.fr/
yes no no n/a traffic
Shopper
track
custome
r and
interior
analytics
Wi-Fi web http://www.shoppe
rtrak.com/
yes yes no 1995 dwell
time,
loyalt
y,
demo,
time
to buy
Vitracom custome
r
counting
video
analysis
, Wi-Fi
supple
ment
stand-
alone
service
(install
ation
on site)
http://www.vitraco
m.de/en/
yes yes no 2000 heat
maps,
dwell
time
Xplace custome
r
tracking
for
advertise
ment
store
navigati
on
video
analysis
stand-
alone
service
(install
ation
on site)
http://xplace.de/
http://xplace.de/en/ no no no 2003 none