Deprivation and food access and balance in Saskatoon
14
Deprivation and food access and balance in Saskatoon, Saskatchewan J. Cushon, PhD (1); T. Creighton, MSc-GISc (1); T. Kershaw, MPH (1); J. Marko, MPH (1); T. Markham, BSHEc (2) This article has been peer reviewed. Abstract Introduction: We explored food access and balance in Saskatoon, Saskatchewan, Canada in relation to material and social deprivation. Methods: We mapped the location of all large supermarkets and fast food retailers in Saskatoon. Supermarket accessibility index scores and food balance scores were compared to material and social deprivation indexes to determine significant associations. Results: Our results indicate that the poorest access to supermarkets occurred in areas west of the South Saskatchewan River and also in suburban areas around the perimeter of the city. Areas west of the river are some of the most deprived areas in the city. Saskatoon’s mean food balance ratio of 2.3 indicates that access favours fast food. However, we did not find a clear pattern or clear socio-economic gradient for most measures. Conclusion: This study highlights the importance of contextual studies of food access. This study also highlighted a number of other issues that should be explored in the Saskatoon context such as individual-level food consumption patterns, mobility, temporal dimensions of food access and economic access as well as interventions that could improve food access in the city. Keywords: food access, health, deprivation, socio-economic status Introduction Access to healthy, nutritious food is associated with health outcomes at an ecological level. 1-4 As a result, there is increasing interest in exploring such access within specific geographic areas, and particularly whether disparities in access exist based on factors such as socio-economic status (SES). Food access and health Food access is typically measured in terms of spatial proximity to types of food outlets. 5 Large supermarkets tend to provide a greater variety of healthy foods at lower prices than do smaller grocery stores or convenience stores. 6-13 Studies show that, compared with those who live further away, residents who live close to supermarkets are more likely to eat larger quantities of fruit and vegetables and have overall healthier diets and lower levels of obesity. 6,14-19 On the other hand, fast food outlets tend to sell nutritionally deficient, processed foods that are high in calories and sodium. 20 Some studies have found that living close to fast food outlets is asso- ciated with lower quality diets, obesity and adverse health outcomes such as diabetes and heart disease. 6,16,21-24 However, other studies have not found an association between proximity to fast food outlets and dietary and health out- comes. 25-27 Food balance and health Food balance is the ratio of the proximity of supermarkets (and hence access to healthy foods) to that of fast food outlets (and access to unhealthy foods). Food balance has been found to correlate with health outcomes. 28,29 For example, a study in Edmonton, Alberta, found that food balance was significantly associated with obesity, and the more ‘‘imbalanced’’ an area, the more likely that a resident would be obese. 29 Food access and socio-economic status Diet socio-economic gradient, where groups at higher SES consume healthier diets than those living at lower SES, exist internationally as well as in Canada. 30 One of the explanations for the diet socio- economic gradient is access: residents of deprived areas have less access to healthy foods compared with residents of more affluent areas. 31 For low-income residents, access to a vehicle is sometimes limited, which compounds issues of food access. 13,24,32 A mixed methods study conducted in Saskatoon, Saskatchewan, found that the main issues that affected food-buying practices were owning a vehicle, income and convenience. 33 American studies have found that access to healthier foods is generally worse in Author references: 1. Public Health Observatory, Population and Public Health, Saskatoon Health Region, Saskatoon, Saskatchewan, Canada 2. Health Promotion Department, Population and Public Health, Saskatoon Health Region, Saskatoon, Saskatchewan, Canada Correspondence: Jennifer Cushon, Public Health Observatory, Population and Public Health, Saskatoon Health Region, 101-310 Idylwyld Dr. N., Saskatoon, SK S7L 0Z2; Tel.: 306-655-4634; Fax: 306-655-4498; Email: [email protected] Vol 33, No 3, June 2013 – Chronic Diseases and Injuries in Canada $ 146
Transcript of Deprivation and food access and balance in Saskatoon
Deprivation and food access and balance in Saskatoon,SaskatchewanJ. Cushon, PhD (1); T. Creighton, MSc-GISc (1); T. Kershaw, MPH (1); J. Marko, MPH (1); T. Markham, BSHEc (2)
This article has been peer reviewed.
Abstract
Introduction: We explored food access and balance in Saskatoon, Saskatchewan,
Canada in relation to material and social deprivation.
Methods: We mapped the location of all large supermarkets and fast food retailers in
Saskatoon. Supermarket accessibility index scores and food balance scores were
compared to material and social deprivation indexes to determine significant
associations.
Results: Our results indicate that the poorest access to supermarkets occurred in areas
west of the South Saskatchewan River and also in suburban areas around the perimeter
of the city. Areas west of the river are some of the most deprived areas in the city.
Saskatoon’s mean food balance ratio of 2.3 indicates that access favours fast food.
However, we did not find a clear pattern or clear socio-economic gradient for most
measures.
Conclusion: This study highlights the importance of contextual studies of food access.
This study also highlighted a number of other issues that should be explored in the
Saskatoon context such as individual-level food consumption patterns, mobility,
temporal dimensions of food access and economic access as well as interventions that
could improve food access in the city.
Keywords: food access, health, deprivation, socio-economic status
Introduction
Access to healthy, nutritious food is
associated with health outcomes at an
ecological level.1-4 As a result, there is
increasing interest in exploring such
access within specific geographic areas,
and particularly whether disparities in
access exist based on factors such as
socio-economic status (SES).
Food access and health
Food access is typically measured in terms
of spatial proximity to types of food
outlets.5 Large supermarkets tend to
provide a greater variety of healthy foods
at lower prices than do smaller grocery
stores or convenience stores.6-13 Studies
show that, compared with those who live
further away, residents who live close to
supermarkets are more likely to eat larger
quantities of fruit and vegetables and have
overall healthier diets and lower levels of
obesity.6,14-19
On the other hand, fast food outlets tend
to sell nutritionally deficient, processed
foods that are high in calories and
sodium.20 Some studies have found that
living close to fast food outlets is asso-
ciated with lower quality diets, obesity
and adverse health outcomes such as
diabetes and heart disease.6,16,21-24
However, other studies have not found
an association between proximity to fast
food outlets and dietary and health out-
comes.25-27
Food balance and health
Food balance is the ratio of the proximity
of supermarkets (and hence access to
healthy foods) to that of fast food outlets
(and access to unhealthy foods). Food
balance has been found to correlate with
health outcomes.28,29 For example, a
study in Edmonton, Alberta, found that
food balance was significantly associated
with obesity, and the more ‘‘imbalanced’’
an area, the more likely that a resident
would be obese.29
Food access and socio-economic status
Diet socio-economic gradient, where
groups at higher SES consume healthier
diets than those living at lower SES, exist
internationally as well as in Canada.30 One
of the explanations for the diet socio-
economic gradient is access: residents of
deprived areas have less access to healthy
foods compared with residents of more
affluent areas.31 For low-income residents,
access to a vehicle is sometimes limited,
which compounds issues of food
access.13,24,32 A mixed methods study
conducted in Saskatoon, Saskatchewan,
found that the main issues that affected
food-buying practices were owning a
vehicle, income and convenience.33
American studies have found that access
to healthier foods is generally worse in
Author references:
1. Public Health Observatory, Population and Public Health, Saskatoon Health Region, Saskatoon, Saskatchewan, Canada2. Health Promotion Department, Population and Public Health, Saskatoon Health Region, Saskatoon, Saskatchewan, Canada
Correspondence: Jennifer Cushon, Public Health Observatory, Population and Public Health, Saskatoon Health Region, 101-310 Idylwyld Dr. N., Saskatoon, SK S7L 0Z2; Tel.: 306-655-4634;Fax: 306-655-4498; Email: [email protected]
Vol 33, No 3, June 2013 – Chronic Diseases and Injuries in Canada $146

deprived areas.21,34 However, empirical
studies from other developed countries
have produced mixed results. Studies
carried out in Canada, Australia and
Scotland have been inconclusive, with
some even finding that low-income neigh-
borhoods had better access to healthy
foods compared with more affluent neigh-
borhoods.8,12,20,35
Food deserts
Food access research in the past decade has
increasingly focused on food deserts. Food
deserts are defined by the United States
Department of Agriculture as ‘‘a low-income
census tract where a substantial number or
share of residents has low access to a
supermarket or large grocery store.’’36
Whereas research from the United States
has found strong support for the existence
of food deserts, in Canada findings on food
deserts have been less conclusive.34 In fact,
a study from Montreal, Quebec, found very
few food deserts; conversely, low-income
residents had better access to supermarkets
than did other residents.7 Another study
determined that low-income residents in
Edmonton, Alberta, had better access to
supermarkets, on average;10 however, the
lowest-income residents were also 2.3 times
more likely to have a fast food restaurant
within a 5- to 10-minute walk compared
with those in more affluent neighbour-
hoods,37 findings similar to those from the
United States. 38-40 A study in London,
Ontario, showed that certain low-income
neighborhoods were food deserts, although
more affluent areas also had poor access to
supermarkets.41 This suggests that food
access research is required on a case-by-
case basis to inform local policy and
practice.31,34
In this study, we aim to address the
following research questions:
(1) How do food access and balance in
Saskatoon vary according to area-
level deprivation?
(2) Does food access and balance follow
a socio-economic gradient in
Saskatoon?
Methods
Food retailers and fast food outlets
We defined supermarkets as retail grocery
outlets that belong to major chains
FIGURE 1Material deprivation in Saskatoon, Saskatchewan
0 1 2 3 km0 1 2 3km
4
5 (Most deprived)
Not reported
LEGEND
1 (Least deprived)
2
3
Material deprivation quintile
Non-residentialneighborhoods
$147 Vol 33, No 3, June 2013 – Chronic Diseases and Injuries in Canada

because these tend to consistently offer a
greater variety of healthy products at more
affordable prices than do smaller and
independent supermarkets or other food
retailers (e.g. Walmart stores in Saskatoon
did not offer many food options at the time
of this study).7,42 To find the locations of
all the supermarkets in Saskatoon, repre-
senting access to healthy food (n=22), we
used several data sources from 2007 and
2008, including the phone book, company
websites and local information. Locations
were verified with a Global Position
System (GPS) unit, Google Earth and
address points from the City of
Saskatoon. All locations were geocoded
in a database.
We defined fast food outlets as those
restaurants where there are no wait staff
and patrons pay for their food before
receiving it and then themselves carry it
to a table or out of the outlet.43 We located
all fast food outlets, food courts in malls
and convenience stores that served hot
food (n=120) using data supplied by the
Safe Communities Department, Saskatoon
Health Region in August 2008. Locations
were then geocoded in the same fashion as
were supermarket locations.
Deprivation
We determined area-level deprivation
using the deprivation index developed by
the Institut national de sante publique du
Quebec (INSPQ).44 This index measures
deprivation at the level of dissemination
areas (DAs), the smallest areas for which
the Canada Census data are available.45
DAs are made up of 1 or more neighbour-
ing blocks that include approximately 400
to 700 residents. The deprivation index
includes 2 dimensions, social and mate-
rial. Social deprivation is composed of 3
variables: proportion of lone parents,
proportion of residents living alone and
marital status. Material deprivation is
measured using the following variables:
educational attainment, average income
and employment status. For this study, the
INSPQ provided us with Saskatoon DA
FIGURE 2Social deprivation in Saskatoon, Saskatchewan
0 1 2 3 km
4
5 (Most deprived)
Not reported
Non-residentialneighborhoods
LEGEND
1 (Least deprived)
2
3
Social deprivation quintile
Vol 33, No 3, June 2013 – Chronic Diseases and Injuries in Canada $148

scores according to both material and
social deprivation. The DA scores were
calculated based on the 2006 Canadian
Census. We assigned DAs to deprivation
quintiles, each of which represented
approximately 20% of Saskatoon’s popu-
lation. Figures 1 and 2 depict material and
social deprivation in Saskatoon. Note that
the South Saskatchewan River that runs
through Saskatoon demarcates the east
and west sides of the city.
Food access and balance
Based on the methodology used by
Apparicio et al.7 in Montreal, Quebec, we
used 3 measures to determine supermarket
access: proximity, diversity and variety.
These were all calculated at the block level.
We calculated proximity by measuring the
Euclidean (i.e. straight-line) distance
between the centroid (i.e. geographic cen-
tre) of each city block and each super-
market. Diversity was defined as the mean
number of supermarkets within 1 kilometre
(i.e. walking distance7) of the centroid of
each block. Variety was defined as the
mean distance from each block’s centroid to
the 3 nearest supermarkets from different
chains. Residents with a number of differ-
ent chains all within close proximity have
the greatest choice of brands and prices.7
We combined the proximity, diversity and
variety measures to create an accessibility
index for supermarkets, a novel approach
to measuring food accessibility. Proximity
scores were classified into tertiles based
on all of the scores at the block level. If a
block fell into the worst tertile for proxi-
mity, it was given a score of 1; otherwise,
it was given a score of 0. Variety scores
were also classified into tertiles, and the
blocks were scored in the same manner as
for proximity. For the diversity measure,
an additional score of 1 was added if a
block had no supermarkets within a kilo-
metre. The scores for each block were
added together to produce an index score,
with a maximum score of 3 indicating
blocks with the worst accessibility to
supermarkets.
Dividing the minimum distance to a
supermarket by the minimum distance to
a fast food outlet generated a food balance
score for each block. A food balance score
of 1 indicated that fast food outlets and
supermarkets were the same distance
from a block’s centroid. Areas with a food
FIGURE 3Proximity to nearest supermarket, Saskatoon, Saskatchewan
0 1 2 3 km
Non-residentialneighborhoods
LEGEND
Distance to nearest super-market (in metres)
36 - 499
500 - 999
1000 - 1499
1500 - 1999
2000 - 3733
$149 Vol 33, No 3, June 2013 – Chronic Diseases and Injuries in Canada

TABLE 1Descriptive statistics for food access and food balance by 2006 material deprivation quintile, Saskatoon, Saskatchewan
Quintile
1 (least deprived) 2 3 4 5 (most deprived)
Total population, n 39 353 39 418 39 536 39 528 39 144
Supermarket proximitya,mean (SD) distance, m
993 (530) 1086 (541) 1085 (607) 1097 (564) 1141 (559)
Population within 1000 m ofsupermarket, %
49 48 38 33 54
Supermarket diversityb, mean(SD)
0.97 (1.08) 0.69 (0.92) 0.90 (1.23) 0.85 (1.30) 0.65 (0.84)
Supermarket variety, mean(SD) distance, m
1580 (596) 1767 (606) 1625 (679) 1620 (590) 1647 (563)
Fast food proximitya, mean(SD) distance, m
737 (465) 802 (486) 762 (586) 680 (418) 642 (401)
Population within 1000 m offast food outlet, %
70 78 67 71 84
Food balance score, mean(SD)
2.0 (3.8) 1.8 (1.9) 2.1 (2.2) 2.3 (3.4) 2.8 (3.7)
Population with food balancescore >2, %
19 24 29 30 36
Abbreviation: SD, standard deviation.a Proximity is defined as the Euclidean (i.e. straight-line) distance between the centroid (geographic centre) of each city block and each supermarket.b Diversity is defined as the mean number of supermarkets within 1 kilometre of the centroid of each block.c Variety is defined as the mean distance from each block’s centroid to the 3 nearest supermarkets from different chains.
TABLE 2Descriptive statistics for food access and food balance by 2006 social deprivation quintile, Saskatoon, Saskatchewan
Quintile
1 (least deprived) 2 3 4 5 (most deprived)
Total population, n 39 572 39 690 39 612 39 366 38 739
Supermarket proximitya,mean (SD) distance, m
1346 (536) 1145 (629) 978 (486) 1065 (527) 972 (575)
Population within 1000 m ofsupermarket, %
24 37 48 54 59
Supermarket diversityb, mean(SD)
0.38 (0.69) 0.85 (1.22) 0.98 (1.17) 0.79 (1.02) 0.92 (1.13)
Supermarket variety, mean(SD) distance, m
1916 (570) 1714 (686) 1452 (515) 1655 (580) 1588 (617)
Fast food proximitya, mean(SD) distance, m
1072 (612) 781 (510) 641 (316) 628 (380) 604 (443)
Population within 1000 m offast food, %
57 69 75 86 83
Food balance score, mean(SD)
1.7 (1.2) 1.8 (1.3) 2.0 (2.9) 2.7 (3.9) 2.7 (4.1)
Population with food balancescore > 2, %
33 21 19 34 32
Abbreviation: SD, standard deviation.a Proximity is defined as the Euclidean (i.e. straight-line) distance between the centroid (geographic centre) of each city block and each supermarket.b Diversity is defined as the mean number of supermarkets within 1 kilometre of the centroid of each block.c Variety is defined as the mean distance from each block’s centroid to the 3 nearest supermarkets from different chains.
Vol 33, No 3, June 2013 – Chronic Diseases and Injuries in Canada $150

balance score of less than 1, because the
nearest supermarket was closer than the
nearest fast food outlet, were considered
more ‘‘balanced.’’23
Finally, because our data were not nor-
mally distributed, we explored the asso-
ciations between food access, food
balance, material deprivation and social
deprivation using Kruskal–Wallis non-
parametric tests. We used post-hoc
Mann–Whitney U tests with a Bonferroni
correction to determine the existence of
significant differences between depriva-
tion quintiles.
We also sought to determine areas of
concern in terms of food access and
balance. Areas of concern were defined
as deprived areas (i.e. areas that fell into
quintile 5 for either material or social
deprivation) with both poor accessibility
to supermarkets (a score of 3 on the
accessibility index) and a food balance
score in favour of fast food outlets (a food
balance score of 2 or more).
Results
Supermarkets
ProximityAlmost half (45%) of the population lived
within 1 kilometre of a supermarket. The
mean distance of all residential blocks to
the nearest supermarket was 1094 metres.
(See Figure 3; more detailed information
available on request.)
Proximity differed significantly according
to both material deprivation (see Table 1;
more information available on request)
and social deprivation (see Table 2; more
information available on request). For
example, for material deprivation, the
most deprived blocks (quintile 5) were
significantly further away from the nearest
supermarket than the least deprived
blocks (quintile 1). Proximity tended to
decrease as deprivation increased.
However, for social deprivation we found
that the least deprived blocks (quintile 1)
were significantly further from the nearest
supermarket than all other quintiles.
FIGURE 4Diversity of supermarkets, Saskatoon, Saskatchewan
0 1 2 3 km0 1 2 3 km
LEGEND
Number of supermarketswithin 1 km
0
1 - 2
3 - 5
Non-residentialneighborhoods
$151 Vol 33, No 3, June 2013 – Chronic Diseases and Injuries in Canada

Proximity tended to improve as depriva-
tion increased, although it was very
similar in both quintile 3 and quintile 5
blocks.
DiversityThe mean diversity number for Saskatoon
was 0.79, meaning that the average resident
did not have any supermarkets within a
walking distance of 1 kilometre (see
Figure 4; more information available on
request). Diversity was quite poor in many
areas of the city, particularly in the materi-
ally and socially deprived areas west of the
South Saskatchewan River and those
around the perimeter of the city where
deprivation was mixed (i.e. blocks in these
areas fell into quintiles 1 through 5).
We also found that diversity differed
significantly according to material depri-
vation (see Table 1; more information
available on request) and social depriva-
tion (see Table 2; more information avail-
able on request). Diversity tended to
worsen as material deprivation increased,
although quintile 2 blocks did not adhere
to this pattern and blocks in quintiles 2
and 5 were both significantly worse in
terms of supermarket diversity.
For social deprivation, the least deprived
blocks (quintile 1) were significantly
worse than all other quintiles.
VarietyThe mean distance to the nearest 3 super-
markets from different chains (Figure 5)
was 1657 metres. Similar to the proximity
and diversity measures, variety was parti-
cularly poor in the more deprived areas
west of the South Saskatchewan River and
in the suburban areas on the edges of the
city where deprivation was mixed.
Variety differed significantly according to
both material deprivation and social
deprivation. For material deprivation,
quintile 2 blocks were significantly further
from the nearest 3 supermarkets than
quintile 1 blocks (see Table 1). A clear
pattern for variety according to material
deprivation did not emerge.
When variety is considered according to
social deprivation, the least deprived
blocks (quintile 1) were significantly
FIGURE 5Variety of supermarkets, Saskatoon, Saskatchewan
0 1 2 3 km0 1 2 3 km
LEGEND
Average distance of 3 supermarkets from different chains (in metres)
264 - 999
1000 - 1499
1500 - 1999
2000 - 2499
2500 - 4120
Non-residentialneighborhoods
Vol 33, No 3, June 2013 – Chronic Diseases and Injuries in Canada $152

further from the nearest 3 supermarkets
than all other quintile blocks (see
Table 2). A clear pattern also did not exist
for variety and social deprivation.
Fast food
ProximityThree-quarters (74%) of the city’s popula-
tion lived within 1 kilometre of a fast food
outlet, and the mean distance to the
nearest one was 724 metres (see
Figure 6). Generally, blocks with the
furthest proximity to fast food outlets
were found on the perimeters of the city,
where the deprivation was mixed.
Proximity to the nearest fast food outlet
differed significantly by material depriva-
tion, with the most deprived blocks
(quintile 5) significantly closer to the
nearest fast food outlets than the least
deprived blocks (quintile 1). However,
proximity to the nearest fast food outlet
did not appear to follow a socio-economic
gradient (see Table 1).
For social deprivation, the least deprived
blocks (quintile 1) were significantly
further from the nearest fast food outlet
than all other quintile blocks (see
Table 2). Proximity to the nearest fast
food outlet tended to increase as social
deprivation increased.
Food balance
The mean food balance ratio in Saskatoon
was 2.3, meaning the average resident
lived more than twice as far from a
supermarket as from a fast food retailer
(see Figure 7). However, certain areas on
the west side that were more materially
and socially deprived had a food balance
ratio as high as 58.8.
Food balance differed significantly by
material deprivation, with some of the
most deprived blocks (quintiles 4 and
5) significantly more imbalanced than
the least deprived (quintiles 1 and 2)
(see Table 1). In general, food balance
worsened as material deprivation
increased.
Food balance also differed significantly by
social deprivation (see Table 2), with
blocks in quintiles 4 and 5 significantly
more imbalanced than those in quintile 1
FIGURE 6Proximity to fast food outlets, Saskatoon, Saskatchewan
0 1 2 3km0 1 2 3 km
LEGEND
Distance to nearest fastfood outlet (in metres)
10 - 499
500 - 999
1000 - 1499
1500 - 1999
2000 - 3496
Non-residentialneighborhoods
$153 Vol 33, No 3, June 2013 – Chronic Diseases and Injuries in Canada
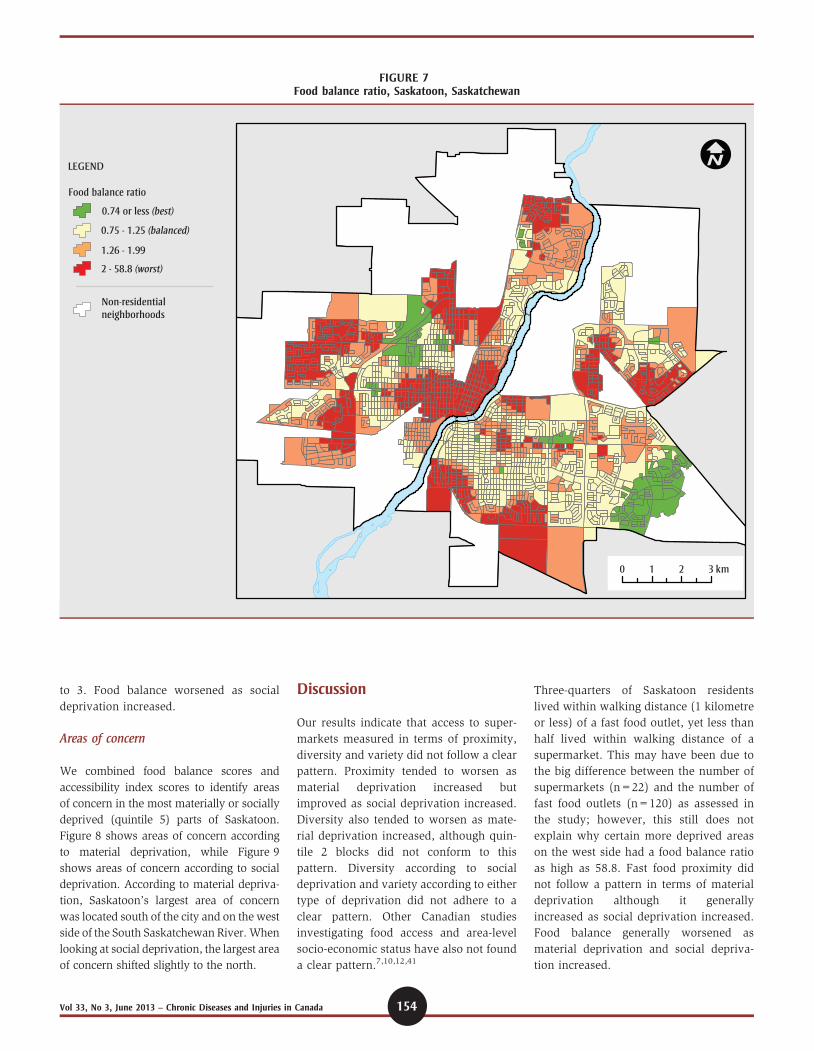
to 3. Food balance worsened as social
deprivation increased.
Areas of concern
We combined food balance scores and
accessibility index scores to identify areas
of concern in the most materially or socially
deprived (quintile 5) parts of Saskatoon.
Figure 8 shows areas of concern according
to material deprivation, while Figure 9
shows areas of concern according to social
deprivation. According to material depriva-
tion, Saskatoon’s largest area of concern
was located south of the city and on the west
side of the South Saskatchewan River. When
looking at social deprivation, the largest area
of concern shifted slightly to the north.
Discussion
Our results indicate that access to super-
markets measured in terms of proximity,
diversity and variety did not follow a clear
pattern. Proximity tended to worsen as
material deprivation increased but
improved as social deprivation increased.
Diversity also tended to worsen as mate-
rial deprivation increased, although quin-
tile 2 blocks did not conform to this
pattern. Diversity according to social
deprivation and variety according to either
type of deprivation did not adhere to a
clear pattern. Other Canadian studies
investigating food access and area-level
socio-economic status have also not found
a clear pattern.7,10,12,41
Three-quarters of Saskatoon residents
lived within walking distance (1 kilometre
or less) of a fast food outlet, yet less than
half lived within walking distance of a
supermarket. This may have been due to
the big difference between the number of
supermarkets (n=22) and the number of
fast food outlets (n=120) as assessed in
the study; however, this still does not
explain why certain more deprived areas
on the west side had a food balance ratio
as high as 58.8. Fast food proximity did
not follow a pattern in terms of material
deprivation although it generally
increased as social deprivation increased.
Food balance generally worsened as
material deprivation and social depriva-
tion increased.
FIGURE 7Food balance ratio, Saskatoon, Saskatchewan
0 1 2 3 km0 1 2 3 km
LEGEND
Food balance ratio
0.74 or less (best)
0.75 - 1.25 (balanced)
1.26 - 1.99
2 - 58.8 (worst)
Non-residentialneighborhoods
Vol 33, No 3, June 2013 – Chronic Diseases and Injuries in Canada $154

Areas of concern shifted according to
whether social deprivation or material
deprivation was considered. Previous stu-
dies have almost exclusively considered
the relationship between food access and
material deprivation. However, it is
entirely plausible that social deprivation
is a separate and distinct construct and
requires further study. Individual-level
studies should be pursued to determine
the precise pathways by which material
and social deprivation at an area level
affect food access and ultimately health
behaviours. In other words, how does
access and area-level deprivation affect
what type of food is purchased and
consumed? Health and place research
needs to begin to account more fully for
the mechanisms between place-based con-
structs and individual health behaviours
such as healthy food consumption.13,27
Our study is a unique contribution to the
literature in terms of methodology: the
majority of food access studies have used
only one measure of access,14,46,47 and
some have used more than one measure of
access,7,48 but very few have combined an
accessibility score and a food balance
score.23 Our food balance score was similar
to the Retail Food Environment Index used
in a study in Edmonton, Alberta, that
measured the number of fast food retailers
plus the number of convenience stores
divided by the number of grocery stores
and specialty food stores all within a given
radius.29 If we had used the Retail Food
Environment Index in the Saskatoon con-
text, it is likely that food imbalance scores
would have been even higher because
convenience stores far outnumber specialty
food stores in Saskatoon.
Another unique contribution of our study
was the use of a deprivation index that
covers both material and social dimensions.
As noted earlier, food access has been
primarily studied in relation to material
deprivation, and the implications of social
deprivation have been understudied. Since
the INSPQ deprivation index has been used
to assess health status and outcomes in
major metropolitan areas in Canada,49 our
methodology could be easily applied to other
Canadian cities to facilitate cross-jurisdic-
tional comparisons, if national cut-offs are
used (we used local cut-offs in this study).
FIGURE 8Materially deprived areas with poor supermarket accessibility and poor food balance, Saskatoon, Saskatchewan
0 1 2 3 km0 1 2 3 km
LEGEND
Food balance: blocks withscore of 2 or more
Blocks with lowestsupermarket accessibility
Blocks in both categories
Non-residentialneighborhoods
$155 Vol 33, No 3, June 2013 – Chronic Diseases and Injuries in Canada

Limitations
While our study used innovative
approaches to determine the associations
between food access and food balance and
deprivation, some limitations should be
noted. First, while we considered many
dimensions of access, our study did not
account for economic access, for example,
food prices being generally lower for
unhealthier foods.50 Future studies should
consider the interplay between access and
food prices and how these are associated
with both area-level deprivation and indi-
vidual-level consumption patterns.
Our study also did not account for
mobility. In other words, people do not
always access food in the areas where they
live.27 For instance, a recent study in
Detroit, United States, found that indivi-
duals’ activity spaces (i.e. the space where
individuals conduct day-to-day activities)
varied, often according to SES.51
Another limitation of our study was its
ecological nature. Access at the area level
does not guarantee that all individuals
within that area are using the same food
outlets or, more importantly, consuming
the same food. As already noted, future
studies should consider the interplay
between area-level measures such as food
access and individual-level measures such
as food consumption patterns and health
outcomes. Individual food consumption
patterns would also shed light on whether
individuals are selecting healthy options at
supermarkets or unhealthy options at fast
food outlets. This would be important to
study since some fast food outlets are
trying to market healthier options.
Our study did not account for trends over
time. Even though some of our data was
from different years (e.g. 2006–2008), this
study was cross-sectional. Similar studies
have also been almost entirely cross-
sectional, yet the relationship between
environment and health is inherently
temporal.52 Longitudinal studies should
be considered as a further innovation in
this area of research, with access mea-
sured and mapped over time.
Finally, future studies should expand the
inclusion criteria for food outlets. We did
FIGURE 9Socially deprived areas with poor supermarket accessibility and poor food balance, Saskatoon, Saskatchewan
0 1 2 3 km0 1 2 3 km
LEGEND
Food balance: blocks withscore of 2 or more
Blocks with lowestsupermarket accessibility
Non-residentialneighborhoods
Blocks in both categories
Vol 33, No 3, June 2013 – Chronic Diseases and Injuries in Canada $156

not include smaller and independent
supermarkets in this analysis because they
tend to be more expensive and stock less
of a variety than do larger supermarkets.
However, in certain areas they may be the
nearest source of healthy foods. In addi-
tion, even though we included conveni-
ence stores that sell hot food, all
convenience stores could be included in
future studies given results from other
studies. For example, an American study
found that the greater the number of
convenience stores in an area, the greater
the probability of higher body mass
indexes.53 Other studies have also
included restaurants other than fast food
outlets.6
Although there were limitations, this
study does suggest that policy and pro-
gram interventions are required to
improve food access in the city, particu-
larly in deprived areas west of the South
Saskatchewan River. One such interven-
tion that should address the areas of
concern found in this study is the Station
20 West community centre situated south-
west of the South Saskatchewan River.
The centre will include a not-for-profit
grocery store that stocks affordable,
healthy food. Other interventions that
could be considered include the following:
including quality food retail outlets as part
of the planning criteria for every new
neighborhood developed in the city;54
offering taxation incentives for the provi-
sion of food services in disadvantaged
areas;54 developing neighborhood pro-
duce markets;54 encouraging urban agri-
culture;55 and providing specialized
transportation services to supermarkets
or delivery programs from supermar-
kets.9,10 Evaluation of interventions is a
key area that requires further exploration;
although numerous interventions dealing
with food access and balance in Canada
have been proposed, there has been little
research on the implementation and effec-
tiveness of these interventions.29
Conclusion
Our study found that food access and
balance varied according to material and
social deprivation in Saskatoon. Some
food access measures seemed to follow a
socio-economic gradient (e.g. proximity to
supermarkets according to material depri-
vation; food balance worsened as material
and social deprivation increased).
However, other measures of access did
not follow a clear pattern. These results
highlight the importance of contextual
studies of food access since different
patterns have emerged between and
within countries and cities. This study
also highlighted a number of other issues
that should be explored in the Saskatoon
context, such as individual-level food
consumption patterns, mobility, temporal
dimensions of food access and economic
access.
References
1. Glanz K, Sallis JF, Saelens B, Frank LD.
Nutrition Environment Measures Survey in
stores (NEMS-S): development and evalua-
tion. Am J Prev Med. 2007;32(4):282-9.
2. Rundle A, Neckerman KM, Freeman L, et
al. Neighborhood food environment and
walkability predict obesity in New York
City. Environ Health Perspect.
2009;117(3):442-7.
3. Lovasi GS, Hutson MA, Guerra M,
Neckerman KM. Built environments and
obesity in disadvantaged populations.
Epidemiol Rev. 2009;31:7-20.
4. Giskes K, van Lenthe F, Avendano-Pabon
M, Brug J. A systematic review of environ-
mental factors and obesogenic dietary
intakes among adults: are we getting closer
to understanding obesogenic environ-
ments? Obes Rev. 2011;12:e95-106.
5. Charreire H, Casey R, Salze P, et al.
Measuring the food environment using
geographical information systems: a meth-
odological review. Public Health Nutr.
2010;13(11):1773-85.
6. Larson NI, Story MT, Nelson MC.
Neighbourhood environments: disparities
in access to health foods in the U.S. Am J
Prev Med. 2009;36(1):74-81.
7. Apparicio P, Cloutier MS, Shearmur R. The
case of Montreal’s missing food deserts:
evaluation of accessibility to food super-
markets. Int J Health Geogr. 2007;6:4.
8. Burns CM, Inglis AD. Measuring food
access in Melbourne: access to healthy
and fast foods by car, bus and foot in an
urban municipality in Melbourne. Health
Place. 2007;13:877-85.
9. Cassady D, Mohan V. Doing well by doing
good? A supermarket shuttle feasibility
study. J Nutr Educ Behav. 2004;36:67-70.
10. Smoyer-Tomic KE, Spence JC, Armhein C.
Food deserts in the prairies? Supermarket
accessibility and neighbourhood need in
Edmonton, Canada. Prof Geogr.
2006;58(3):307-26.
11. Chung C, Myers S. Do the poor pay more
for food? An analysis of grocery store
availability and food price disparities. J
Consum Aff. 1999;33(2):276-96.
12. Black JL, Carpiano RM, Fleming S, Lauster
N. Exploring the distribution of food stores
in British Columbia: associations with
neighbourhood socio-demographic factors
and urban form. Health Place. 2011;17:961-
70.
13. Walker RE, Keane CR, Burke JG. Disparities
and access to healthy food in the United
States: a review of food deserts literature.
Health Place. 2010;16:876-84.
14. Morland K, Wing S, Diez Roux A. The
contextual effect of the local food environ-
ment on residents’ diets: the atherosclerosis
risk in communities study. Am J Public
Health. 2002;92(11):1761-7.
15. Odoms-Young AM, Zenk S, Mason M.
Measuring food availability and access in
African-American communities: implica-
tions for intervention and policy. Am J
Prev Med. 2009:36(4 Suppl):S145-50.
16. Sallis JF, Glanz K. Physical activity and
food environments: solutions to the obesity
epidemic. Milbank Q. 2009;87(1):123-54.
17. Zenk SN, Lachance LL, Schulz AJ, Mentz G,
Kannan S, Ridella W. Neighborhood retail
food environment and fruit and vegetable
intake in a multiethnic urban population.
Am J Health Promot. 2009;23(4):255-64.
$157 Vol 33, No 3, June 2013 – Chronic Diseases and Injuries in Canada

18. Moore LV, Diez Roux AV, Nettleton JA,
Jacobs DR Jr. Associations of the local food
environment with diet quality—a compar-
ison of assessments based on surveys and
geographic information systems: the multi-
ethnic study of atherosclerosis. Am J
Epidemiol. 2008;167(8):917-24.
19. Diez Roux AV, Mair C. Neighborhoods and
health. Ann N Y Acad Sci. 2010;1186:125-
45.
20. Black J, Macinko J. Neighborhoods and
obesity. Nutrition Rev. 2008;66(1):2-20.
21. Davis B, Carpenter C. Proximity of fast-food
restaurants to schools and adolescent obe-
sity. Am J Public Health. 2009;99(3):505-
10.
22. Maddock J. The relationship between obe-
sity and the prevalence of fast food restau-
rants: state-level analysis. Am J Health
Promot. 2004;19(2):137-43.
23. Mari Gallagher Research and Consulting
Group. Good food: examining the impact of
food deserts on public health in Chicago.
Chicago (IL): Mari Gallagher Research and
Consulting Group; 2006.
24. Hemphill E, Raine K, Spence J, Smoyer-
Tomic KE. Exploring obesogenic food
environments in Edmonton, Canada: the
association between socioeconomic factors
and fast food outlets. Am J Health Promot.
2008;22(6):426-32.
25. Powell LM, Auld MC, Chaloupka FJ,
O’Malley PM, Johnston LD. Access to fast
food and food prices: relationship with fruit
and vegetable consumption and overweight
among adolescents. Adv Health Econ
Health Serv Res. 2006;17:23-48.
26. Sturm R, Datar A. Body mass index in
elementary school children, metropolitan
area food prices and food outlet density.
Public Health. 2005;119:1059-68.
27. Feng J, Glass TA, Curriero FC, Stewart WF,
Schwartz BS. The built environment and
obesity: a systematic review of the epide-
miologic evidence. Health Place.
2010;16:175-90.
28. Mari Gallagher Research & Consulting
Group. Examining the impact of food
deserts on public health in Detroit.
Chicago (IL): Mari Gallagher Research &
Consulting; 2007.
29. Spence JC, Cutumisu N, Edwards J, Raine
KD, Smoyer-Tomic K. Relation between
local food environments and obesity among
adults. BMC Public Health. 2009;9:192.
30. Power EM. Determinants of healthy eating
among low-income Canadians. Can J Public
Health. 2005;96:S37-42.
31. Smith DM, Cummins S, Taylor M, et al.
Neighbourhood food environment and area
deprivation: spatial accessibility to grocery
stores selling fresh fruit and vegetables in
urban and rural settings. Int J Epidemiol.
2010;39(1):277-84.
32. Winkler E, Turrell G, Patterson C. Does
living in a disadvantaged area mean fewer
opportunities to purchase fresh fruit and
vegetables in the area? Findings from the
Brisbane food study. Health Place.
2006;12:306-19.
33. Woods F. Access to food in Saskatoon’s
core neighborhood. Saskatoon (SK):
Community-University Institute for Social
Research; 2003.
34. Beaulac J, Kristjansson E, Cummins S. A
systematic review of food deserts, 1966-
2007. Prev Chronic Dis. 2009;6(3): 1-10.
35. Cummins S, Macintyre S. The location of
food stores in urban areas: a case study in
Glasgow. Brit Food J. 1999;101(7):545-53.
36. Economic Research Service. Overview:
food desert locator [Internet]. (ERS), U.S.
Department of Agriculture (USDA)
[updated 2012 Jul 6; cited 2012 Nov 5].
Available from: http://www.ers.usda.gov/
data-products/food-desert-locator.aspx
37. Smoyer-Tomic K, Spence J, Raine K, et al.
The association between neighborhood
socioeconomic status and exposure to
supermarkets and fast food outlets. Health
Place. 2008;14:740-54.
38. Block J, Scribner R, DeSalvo K. Fast food,
race/ethnicity, and income: a geographic
analysis. Am J Prev Med. 2004;27(3): 211-
7.
39. Pearce J, Blakely T, Witten K, Bartie P.
Neighborhood deprivation and access to
fast-food retailing: a national study. Am J
Prev Med. 2007;32(5):375-82.
40. Fleischhacker SE, Evenson KR, Rodriguez
DA, Ammerman AS. A systematic review of
fast food access studies. Obes Rev.
2011;12:e460-71.
41. Larsen K, Gilliland J. Mapping the evolu-
tion of ‘food deserts’ in a Canadian city:
supermarket accessibility in London,
Ontario, 1961-2005. Int J Health Geogr.
2008;7:16.
42. Kaufman P, Lutz S. Competing forces affect
food prices for low income households.
Food Rev. 1997;20(2);8-12.
43. Austin SB, Melly SJ, Sanchez BN, Patel A,
Buka S, Gortmaker SL. Clustering of fast-
food restaurants around schools: a novel
application of spatial statistics to the study
of food environments. Am J Public Health.
2005;95(9):1575-81.
44. Pampalon R, Hamel D, Gamache P,
Raymond G. A deprivation index for health
planning in Canada. Chronic Dis Can.
2009;29 (4):178-91.
45. Statistics Canada. Dissemination area refer-
ence maps, reference guide: Census year
2006. Ottawa (ON): Statistics Canada; 2007.
[Statistics Canada, Catalogue No.: 92-145-
GIE].
46. Cummins S, Macintyre S. The location of
food stores in urban areas: a case study of
Glasgow. Brit Food J. 1999;101(7):545-53.
47. Zenk SN, Schulz AJ, Israel BA, James SA,
Bao S, Wilson ML. Neighborhood racial
composition, neighborhood poverty, and
the spatial accessibility of supermarkets in
metropolitan Detroit. Am J Public Health.
2005;95(4):660-7.
48. Sharkey JR, Horel S, Han D, Huber JC.
Association between neighbourhood need
and spatial access to food stores and fast
food restaurants in neighborhoods of
Colonias. Int J Health Geogr. 2009;8(9):
S151-5.
49. Canadian Population Health Initiative.
Reducing gaps in health: socio-economic
status in urban Canada. Ottawa (ON): CIHI;
2008.
50. Drewnowski A, Darmon N. Food choices
and diet costs: an economic analysis. J
Nutr. 2005;135(4):900-4.
Vol 33, No 3, June 2013 – Chronic Diseases and Injuries in Canada $158

51. Zenk SN, Schulz AJ, Matthews, SA, et al.
Activity space environment and dietary and
physical activity behaviours: a pilot study.
Health Place. 2011;17:1150-61.
52. Cummins S, Macintyre S. Food environ-
ments and obesity—neighbourhood or
nation? Int J Epidemiol. 2006;34:100-4.
53. Powell LM, Auld MC, Chaloupka FJ,
O’Malley PM, Johnston LD. Associations
between access to food stores and adoles-
cent body mass index. Am J Prev Med.
2007;33(4 Suppl): S301-7.
54. Toronto Food Policy Council. Food retail
access and food security for Toronto’s low-
income citizens. Toronto (ON): Food Policy
Council; 1996. Discussion paper series
no.7. 32 p.
55. Desjardins E, Lubczynski J, Xuereb M.
Incorporating policies for a healthy food
system into land use planning: the case of
Waterloo Region, Canada. JAFSCD.
2011;2(1):127-40.
$159 Vol 33, No 3, June 2013 – Chronic Diseases and Injuries in Canada


![Saskatoon Retriever Club [HUNT TEST] CATALOGUE · Saskatoon Retriever Club [HUNT TEST] CATALOGUE To be held At Saskatoon Retriever Grounds located about 35 km (22 miles) SE of Saskatoon](https://static.fdocuments.net/doc/165x107/5af572557f8b9a95468f625d/saskatoon-retriever-club-hunt-test-catalogue-retriever-club-hunt-test-catalogue.jpg)