Deployment Analysis Under Public Scrutiny Colorado Springs FireDepartment Fire Department © 2002...
28
Deployment Deployment Analysis Under Analysis Under Public Scrutiny Public Scrutiny Colorado Springs Colorado Springs Fire Fire Department Department © 2002 City of Colorado Springs
-
Upload
tracey-barnett -
Category
Documents
-
view
217 -
download
1
Transcript of Deployment Analysis Under Public Scrutiny Colorado Springs FireDepartment Fire Department © 2002...

Deployment Analysis Deployment Analysis Under Under
Public ScrutinyPublic Scrutiny
Colorado Springs Colorado Springs
FireFire DepartmentDepartment
© 2002 City of Colorado Springs

Background
• Since 1960, Colorado Springs has increased 433% in population and 1027% in land area.
• Growth has created inequities in service.
• Today, 18 fire stations serve a developed area of 120 sq.mi. and 374,000 people.

Background continued
• CSFD has taken on additional missions over the years including BLS and ALS medical response, hazardous materials, and special rescue.
• Medical incidents make up 70% of the workload.

Status in 1997
• 17 engines and 4 trucks
• Older stations close together
• Newer stations far apart
• Budget constraints
• Poor truck coverage on north side
• Funding for additional truck company for 1997 denied

Public Controversy 1997-1999
• Proposal made to close an older fire station to fund a truck company in a growth area
• Political battle ensued with residents in area of proposed station
• Residents challenged accuracy of CSFD deployment analysis
• City contracted with TriData Corp. in 1998 to conduct study of CSFD

Outcomes
• Spring, 1998– City council approved funding for
new truck company.– City council approved funding for
a comprehensive study of the fire department.
– City council passed interim standards of coverage

Interim Standards of Coverage
• First unit response within 8-minutes for 90% of the emergency incidents.
• Effective fire fighting force response within 12-minutes for 90% of structure fires. (Force of 2 engines & 1 aerial ladder truck)
• These standards apply to each of the 9 Planning Evaluation Zones (PEZs) in the city

Planning Evaluation Zones
1 - Central Business Dist.
2 - Westside/Cedar Heights
3 - Northwest
4 - North Central
5 - Southeast
6 - Southwest
7 - North
8 - East Central
9 - East (of Powers)
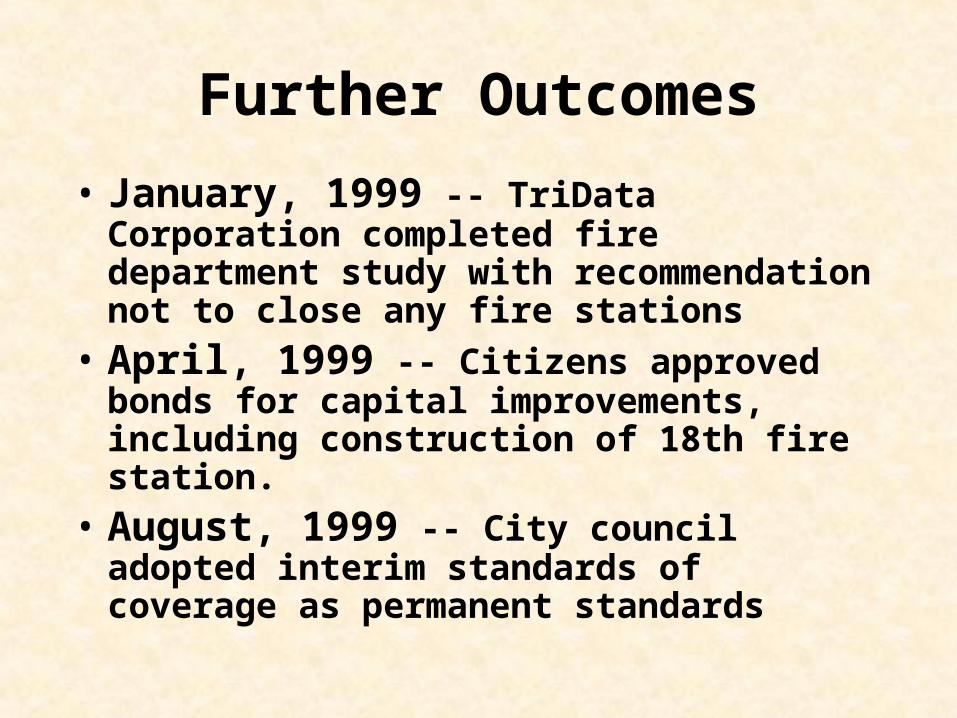
Further Outcomes
• January, 1999 -- TriData Corporation completed fire department study with recommendation not to close any fire stations
• April, 1999 -- Citizens approved bonds for capital improvements, including construction of 18th fire station.
• August, 1999 -- City council adopted interim standards of coverage as permanent standards

Fire Stations & Equipment
Standards of Coverage:• Establish the
appropriate number of stations
• Distribution of stations throughout community
• Establish levels and location of fire equipment

Limitations of Drive-Time Analysis
• Assumes units available for calls
• Does not include dispatch and turnout time
• Does not provide adequate estimate of travel time distribution, only typical travel time

CSFD Simulation System
HistoricalIncident Data
City GrowthProjections
WLTrace WLGen
ERES
WorkloadStreams
Simulation Results

Workload Streams
• Files containing emergency incidents– Date, time of alarm– Incident type– Location
• Representative of actual occurrences– Time of day of incidents– Mix of incidents (fires, medicals, etc.)– Location

Workload Analysis
Workload 1Workload 2Workload 3
…Workload N
Coverage
Coverage Estimates for Deployment
Point Estimates by PEZ & CityInterval Estimates by PEZ & CityCoverage MapsEquipment ResponsesEquipment Utilization

ERES
• Uses input workload stream for basic incident information
• Simulates CSFD operations (and AMR operations) on input workload
• Produces – coverage statistics by PEZ and city-wide– unit use statistics for CSFD (and AMR)– coverage maps based on FDZ

ERES Is Configurable
• Number and location of stations
• Equipment assigned to a station
• Hours of operations for special units
• Overhead (training, maintenance, administrative time) for each unit
• Dispatching policy for incidents

ERES Station Equipment Options

ERES Dispatching Options

ERES Products
• A variety of coverage statistics by PEZ and city-wide for CSFD alone or with AMR
• Responses for each unit
• % utilization of each unit by hour of day
• Coverage maps based on FDZ

ERES Coverage Display

Equipment Responses

Equipment Utilization

Coverage Display

Deployment Analysis
HistoricalCoverage
City Standards
Areas ofConcern
ProposedEnhancements
ERESSimulatedCoverage

Forecasting Method
City-Wide 8-Minute Coverage
8082
8486
889092
9496
98100
1997 1998 1999 2000 2001
Actual
Model

Projected 2010 Service Levels(with current 18 fire stations)
40
50
60
70
80
90
100C
en
tra
l
We
sts
ide
No
rth
we
st
N. C
en
tra
l
So
uth
ea
st
So
uth
we
st
No
rth
E. C
en
tra
l
Ea
st
8-MinuteStandard
12-MinuteStandard

Projected 2010 Service Levels(with 21 fire stations)
40
50
60
70
80
90
100C
en
tra
l
We
sts
ide
No
rth
we
st
N. C
en
tra
l
So
uth
ea
st
So
uth
we
st
No
rth
E. C
en
tra
l
Ea
st
8-MinuteStandard
12-MinuteStandard

Uses of the Model
• Projecting future needs based on growth and workload trends
• Projecting impact of new development
• Timing and location of new stations or units