Deploy With Confidence Minimize risks Improve business output Optimize resources.
22
-
Upload
denis-shepherd -
Category
Documents
-
view
219 -
download
0
Transcript of Deploy With Confidence Minimize risks Improve business output Optimize resources.

Deploy With Confidence
Minimize risks
Improve business output
Optimize resources

3 ©2002 Mercury Interactive Corporation www.mercuryinteractive.com
The Application Lifecycle
SYSTEM PERFORMANCE
O B J E C T I V E S
DEVELOP OPERATEDEPLOYTESTPLAN
IT GOVERNANCE
DEVELOPMENT
APPLICATION READINESS
BUSINESS AVAILABILITY

4 ©2002 Mercury Interactive Corporation www.mercuryinteractive.com
Deployment Complexity
DATABASEAPP SERVERWEB SERVERNETWORK
Sessions
Connection
DNS
Latency
Throughput
Virtual Machine
Customize Code
Indexes
SQL Call
SECURITY
Encryption
Firewall
LOAD BALANCER
Legacy
CRM
APPLICATION ERP
No system-wide perspectiveSignificant time pressure

5 ©2002 Mercury Interactive Corporation www.mercuryinteractive.com
of deployed applicationsare rolled back
Gartner
50%
Deployment Risks
40% of software projects fail to
meet business objectivesGiga
75% of new ERP/CRM rollouts use more
hardware to fix performance AMR

6 ©2002 Mercury Interactive Corporation www.mercuryinteractive.com
When to Optimize/Tune
Initial Rollout Projects
New Geographies
User Expansions
System Integrations
Shared Infrastructures
OS, App, System Updates

Optimization Methodology

8 ©2002 Mercury Interactive Corporation www.mercuryinteractive.com
Our Optimization Methodology
Phase-driven approach to Performance Optimization
Phase 4:Report
Phase 3:Optimize
Phase 2:Baseline
Phase 1:Plan & Organize
Fully Plan the projectOrganize the Team
Quantify the SystemPerformance
Iteratively Isolate andEliminate Performance
Bottlenecks
Assess the PerformanceImprovements
and Report

9 ©2002 Mercury Interactive Corporation www.mercuryinteractive.com
Determine Business Objectives
(Phase 1)
Business Objective System Metric Goal
Scale the system to additional users
Concurrent Users >5,000
Increase orders processed Transaction Rate >1000 TPS
Decrease User Wait time Response Time <10s
Decrease incomplete transactions
Error Rate <2%

10 ©2002 Mercury Interactive Corporation www.mercuryinteractive.com
Organize the Team (Phase 1)
• Most problems result from interactions between components
• Team structure streamlines analysis and diagnosis
Ap
plic
atio
n
Net
wo
rk
ProjectProjectManagerManager
DBA
Silo-centricCross Discipline Team
Sys Admin
NW Admin
AppArchitect
Dev QA
ProTuneSpecialist
Dat
a B
ase
Plan

11 ©2002 Mercury Interactive Corporation www.mercuryinteractive.com
Apply Controlled Load
ProTune
Baseline the System (Phase 2)
Application Tier
ApplicationServers
StreamingMedia Server
Infrastructure Tier
Firewall
Web Servers
Load Balancer
Firewall
Database Tier
DatabaseServers
Storage
Distributed System
Gather Metrics
Measure Performance …
~~~~~~
SelectBusiness Processes
12 ©2002 Mercury Interactive Corporation www.mercuryinteractive.com
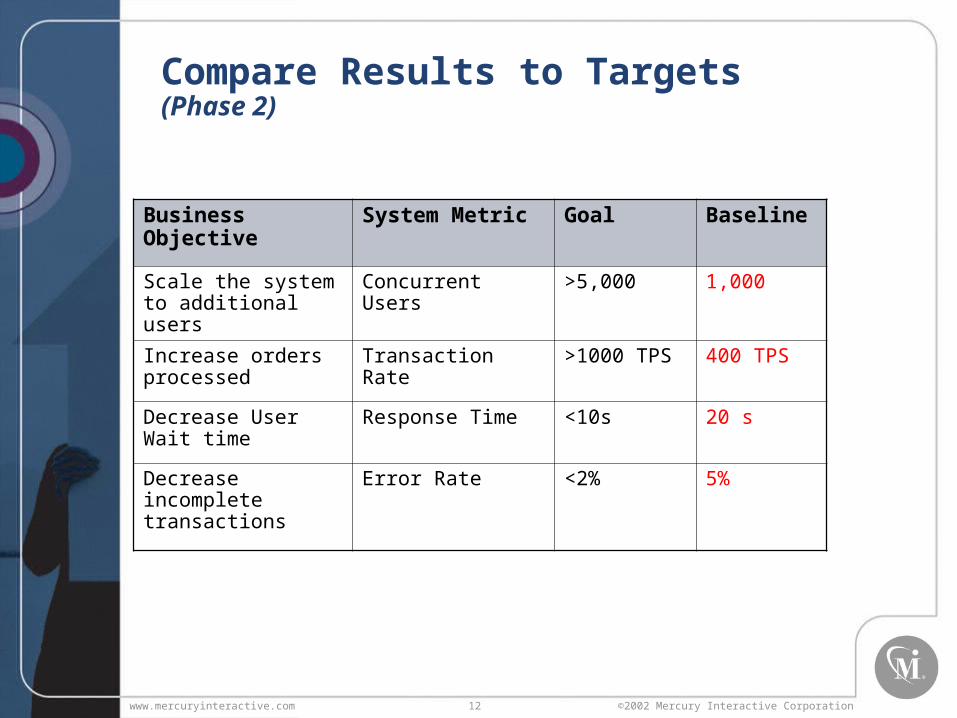
Compare Results to Targets (Phase 2)
Business Objective System Metric Goal Baseline
Scale the system to additional users
Concurrent Users >5,000 1,000
Increase orders processed
Transaction Rate >1000 TPS 400 TPS
Decrease User Wait time
Response Time <10s 20 s
Decrease incomplete transactions
Error Rate <2% 5%

13 ©2002 Mercury Interactive Corporation www.mercuryinteractive.com
Optimize the System tier by tier (Phase 3)
• Diagnose by logical tiers
• Employ component library tests for infrastructure tiers
• Create specific tests for application and database tiers
ProTune
Application Tier
ApplicationServers
StreamingMedia Server
Database Tier
DatabaseServers
Storage
Infrastructure Tier
Firewall
Web Servers
Load Balancer
Firewall
GatherMetrics
Measure Performance …

14 ©2002 Mercury Interactive Corporation www.mercuryinteractive.com
Iteratively Analyze each Tier (Phase 3)
Infrastructure Tier
ApplicationTier
DatabaseTier
~~~~~~
Develop TargetedLoad Tests
Firewall
Web Servers
Load Balancer
Firewall
ProTune
Controlled Load to Isolate Component
~~~~~~
Analyze Results andRecommend Changes
Validate Fix
Client ExpertImplement Fix
Move to next
Constraint
Optimize
15 ©2002 Mercury Interactive Corporation www.mercuryinteractive.com
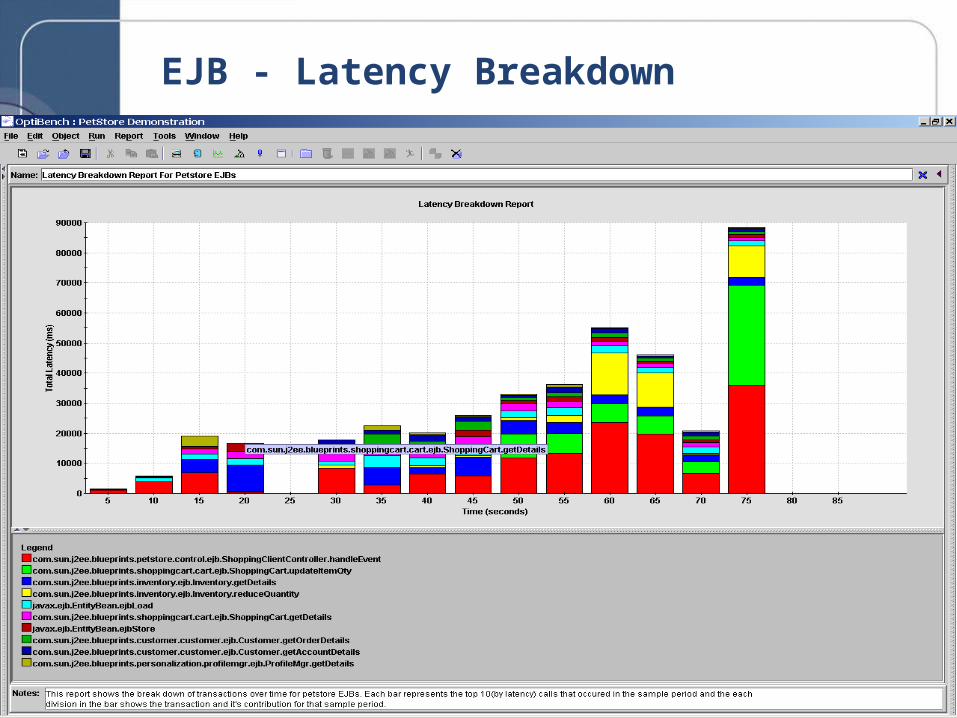
EJB - Latency Breakdown

16 ©2002 Mercury Interactive Corporation www.mercuryinteractive.com
EJB - Throughput Distribution

17 ©2002 Mercury Interactive Corporation www.mercuryinteractive.com
Re-run Baseline and Assess (Phase 4)
• Quantify improvements
• Deliver Executive and Detailed Reports
Business Objective System Metric Goal Baseline Final
Scale the system to additional users
Concurrent Users >5,000 1,000 5,000
Increase orders processed
Transaction Rate >1000 TPS 400 TPS 1,200 TPS
Decrease User Wait time
Response Time <10s 20 s 8s
Decrease incomplete transactions
Error Rate <2% 5% 1.5%

18 ©2002 Mercury Interactive Corporation www.mercuryinteractive.com
Introducing
ProTune
• Validate performance
• Optimize configuration
• Verify alignment with business objectives

19 ©2002 Mercury Interactive Corporation www.mercuryinteractive.com
Safe Deployment System™
(SDS)
Overload Protection
DB SERVERS
WEB SERVERS
APP SERVERSNETWORK SECURITY
Systematic Identification
Problem Isolation
Expert Recommendations
Automated Improvements and Validation
LOADBALANCER
Including

20 ©2002 Mercury Interactive Corporation www.mercuryinteractive.com
MONITOR MONITOR MONITOR
MONITOR MONITOR MONITORMONITOR
LO
AD
G
EN
ER
AT
OR
S
How It Works
CONSOLE
1. Mapped topology
2. Auto-Assigned monitoring
3. Business process emulation
4. System component validation
5. Problem detection
6. Recommended configuration
7. Automated checklist• Repeated validation• Audit trail

21 ©2002 Mercury Interactive Corporation www.mercuryinteractive.com
Our Experience and Track Record
• Over 3000 Optimization Engagements
• Average Results (performance improvements):
• ERP Systems – 100%
• CRM Systems – 150%
• Web andJ2EE – 400%
• Complex C/S – 200%

22 ©2002 Mercury Interactive Corporation www.mercuryinteractive.com
Electronic Ticketing System Improves Throughput by 10x…
The Case– E-ticket system required throughput of 400 tickets/hr
– Web-based application, Oracle database, SABRE system integration
The Findings– Infrastructure Configurations:
• Routers improperly configured, insufficient bandwidth, and insufficient file descriptors for Web Servers
– Application Code Defects• Isolated JAVA code null pointer exception
The Results– Increased system throughput by 10x from 270 to over
3000 transactions/hour
…and booked
over $1M per
day with no
down-time.